
The Flash Floods Risk in the Local Spatial Planning (Case Study: Lublin Upland, E Poland)


1
Institute of Socio-Economic Geography and Spatial Management, Maria Curie-Skłodowska University, Kraśnicka Av. 2d, 20-718 Lublin, Poland
2
Institute of Earth and Environmental Sciences, Maria Curie-Skłodowska University, Kraśnicka Av. 2d, 20-718 Lublin, Poland
*
Author to whom correspondence should be addressed.
Resources 2021, 10(2), 14; https://0-doi-org.brum.beds.ac.uk/10.3390/resources10020014
Submission received: 28 December 2020
/
Revised: 5 February 2021
/
Accepted: 8 February 2021
/
Published: 11 February 2021
(This article belongs to the Special Issue Analysis of Extreme Hydrometeorological Events)
Abstract
:Flash floods pose a significant threat to humans but the state of our knowledge on the occurrence and related risk of such phenomena is insufficient. At the same time, many climate change models predict that extreme rainfall events will occur more and more frequently. Identifying areas susceptible to flash floods is more complicated that in the case of floods occurring in the valley bottoms of large rivers. Flood risk maps in Poland have not been developed for small catchments. The study objective was to assess whether the threat related to flash floods is taken into account in the spatial planning system of municipalities. Studies were conducted in the Lublin Upland, E Poland (an area of about 7200 km2). A preliminary assessment of susceptibility of 369 catchments to flash floods was carried out in a GIS environment using multi criteria analysis. The susceptible catchments cover about 30% of the area. Existing planning documents, flood hazard and flood risk maps were analyzed for municipalities located in the catchments with highest susceptibility to this phenomenon. Our results show that flash flood risk is usually not recognized at the level of local governments even when it is significant. Local planning documents do not take into account the existence of this threat.
1. Introduction
Flash floods are among natural hazards to which more and more attention is devoted due to their social and economic impact [1,2,3,4,5,6]. The term is applied to a rapid rise in water level, characterized by short duration and high intensity of maximum flows posing a threat to people [7,8]. According to Ostrowski et al. (2012) [9], a flash flood is a flood with a high water-volume lasting for a short time and occurring after a sudden, intensive rainfall (usually a rainstorm). Initially, the term applied to phenomena related to floods resulting from the breaking of reservoir dams. Flash floods pose a significant threat to humans because they are triggered by torrential rainfall that can occur almost anywhere [1,10,11]. It is estimated that 40% of flood victims in Europe between 1950 and 2006 suffered because of flash floods [12]. At the same time, some climate change models predict that such extreme rainfall events will occur more and more frequently [13], hence the risk posed by flash floods is probably going to increase. Nonetheless, the problem requires further study [14,15].
In agricultural areas, intensive surface runoff after heavy rainfall causes strong gully erosion that leads to the destruction of crops and roads [16,17]. The accumulated material silts up fields, roads and farms. The flood wave rapidly forming in the valley bottoms is a threat to human health and life and causes considerable material losses. Such floods pose a significant problem to local governments as they usually have to deal with repairing the flood damage on their own [7]. Typical flash floods in Poland affect catchments covering less than 40 km2. They result from rainfall usually lasting up to two hours and having an intensity of 20–80 mm h−1. Phenomena of this type occur most often in July and May and June [18].
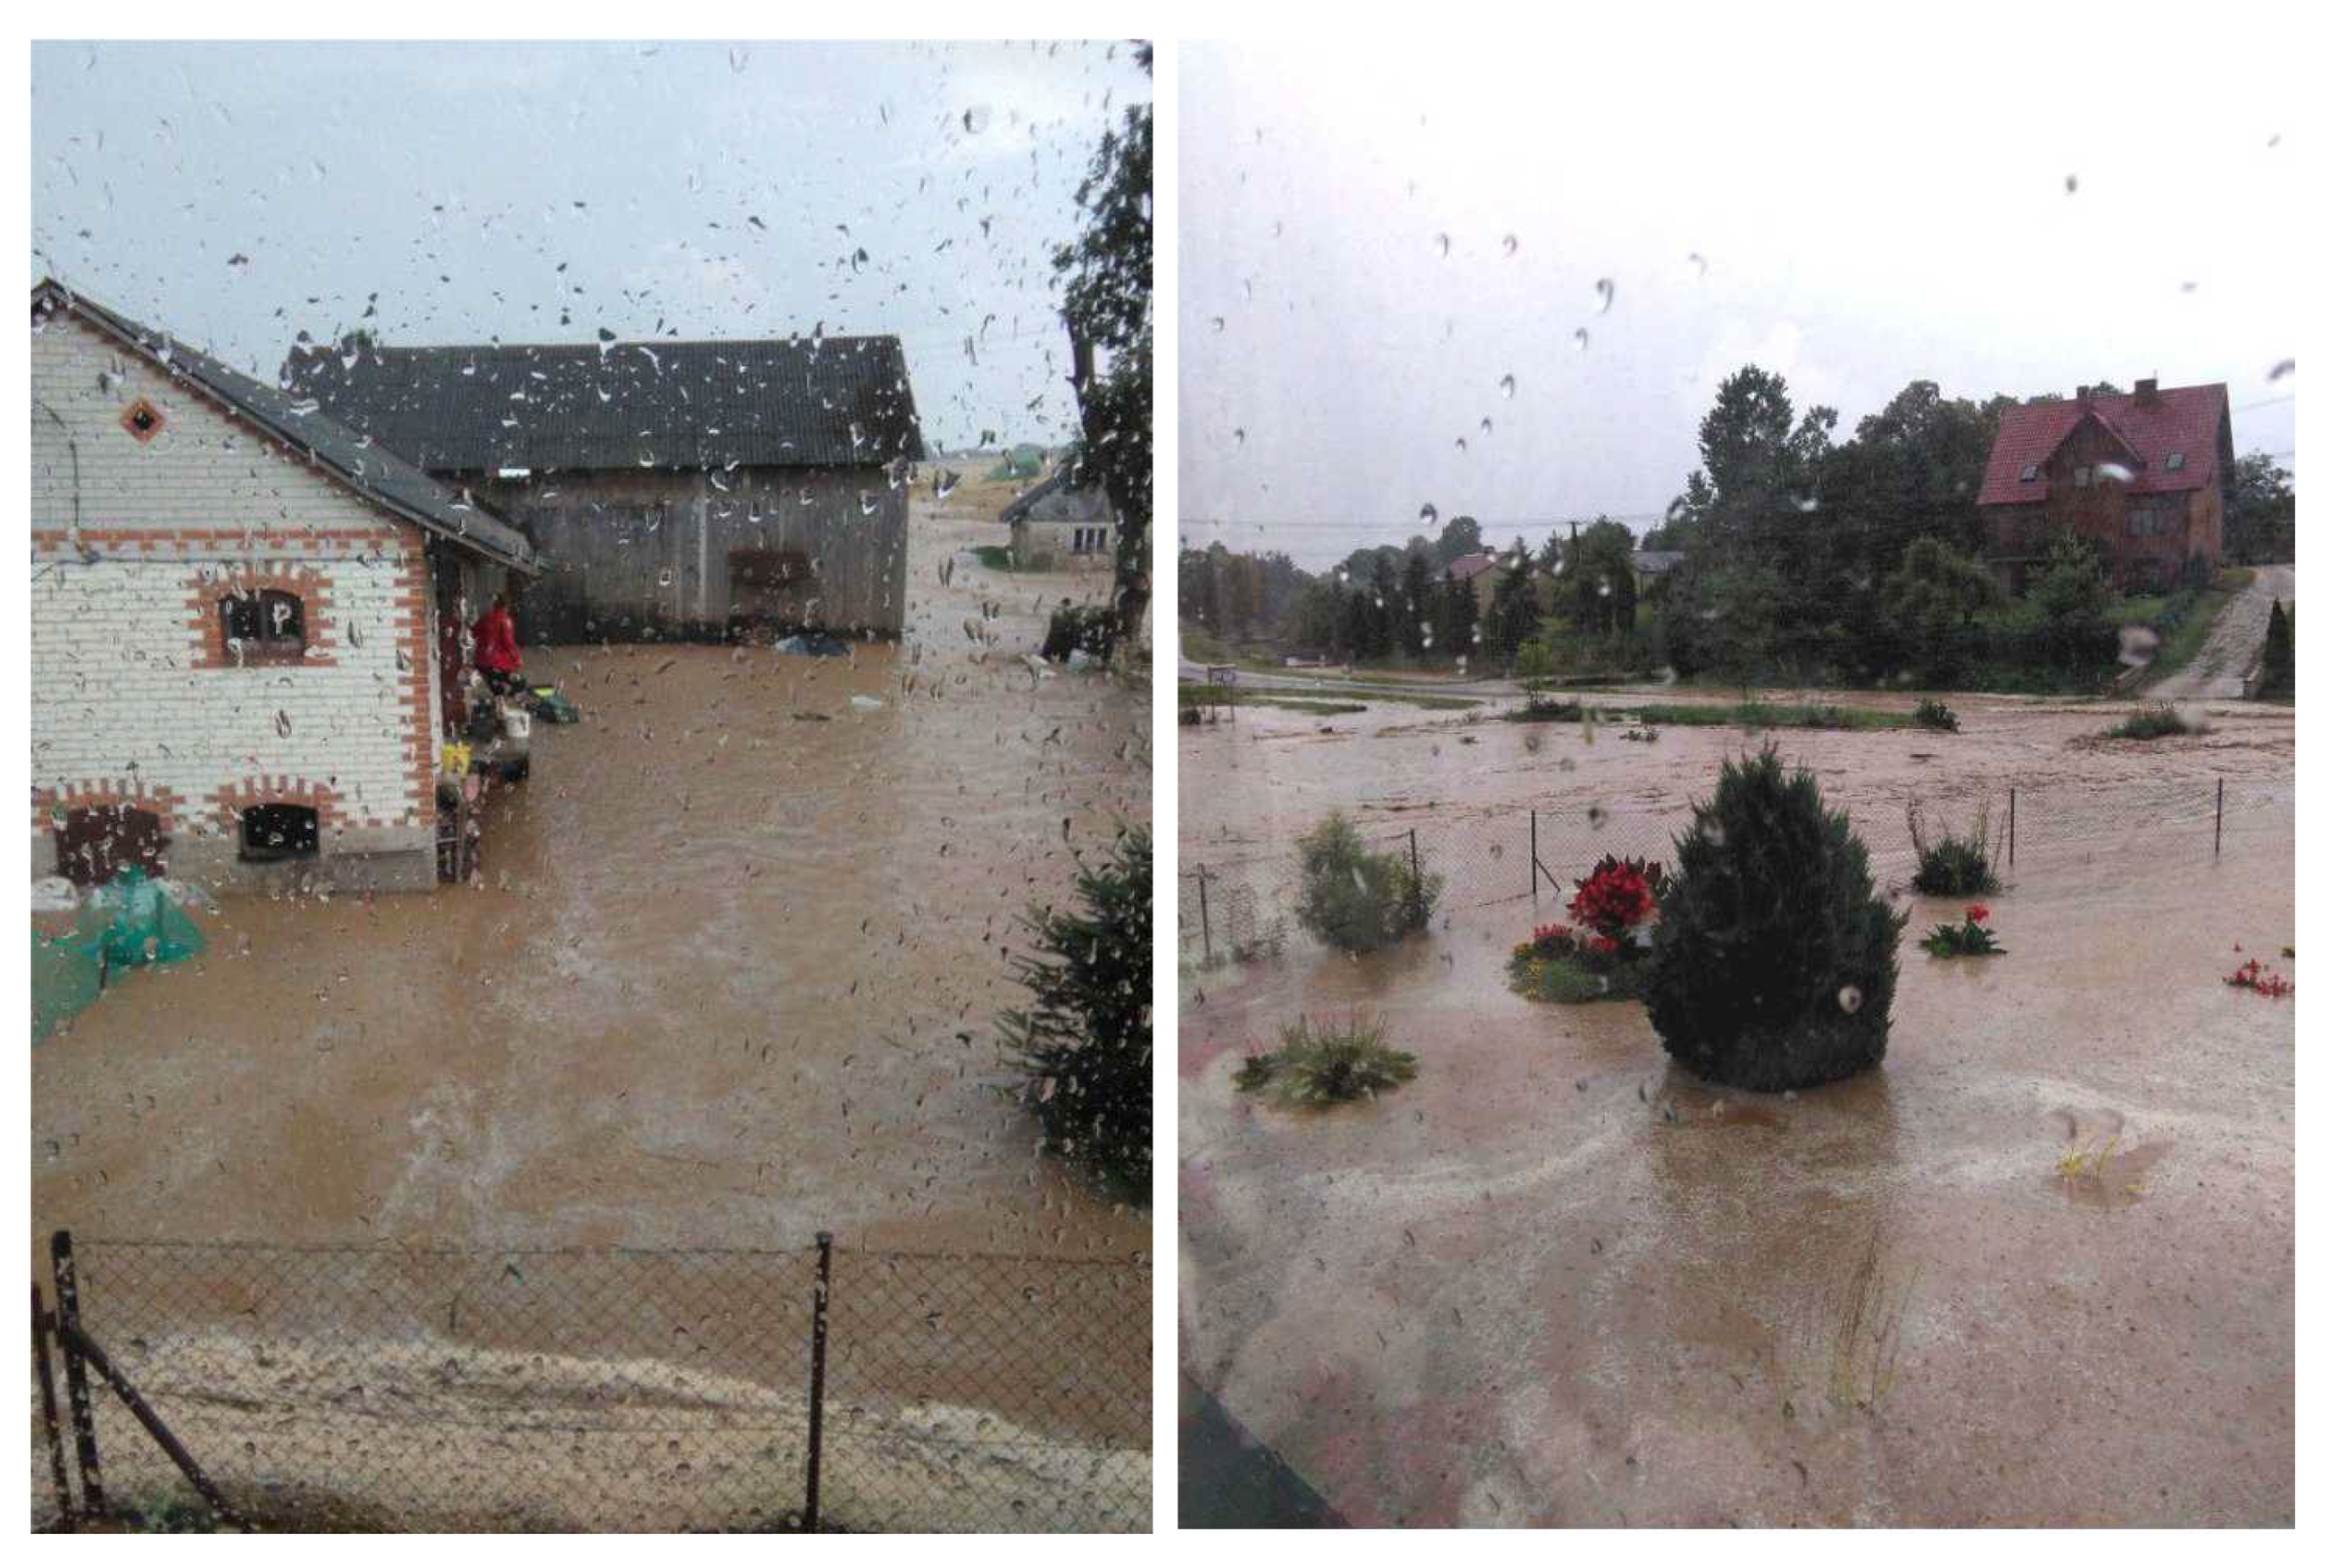
Local flash floods occur in Poland and in other parts of Europe mainly in upland and mountain areas. Their spatial distribution is determined by two factors—climate and topographic conditions [1,2,19]. High slope gradients, higher density of the river network and shallower soil cover quickly lead to the development of intensive surface runoff [7,20]. The state of our knowledge on the occurrence, determinants, and course of such phenomena is insufficient [21]. Flash floods can thus occur in unexpected and totally unprepared locations (Figure 1). Identifying areas vulnerable to flash floods is more complicated that in the case of floods occurring in the valley bottoms of large rivers. Rapid runoff and flooding can occur in areas practically devoid of permanent drainage and not covered by the network of standard meteorological and hydrological measurements.
Studies on flash floods in Poland focus mainly on mountain areas. Based on the analysis of selected characteristics of the natural environment of small catchments of the Foothills (Carpathian Mountains), Bryndal (2011) [22] identified areas susceptible to the occurrence of such phenomena. Ostrowski et al. (2012) [9] prepared a catalogue of flash floods in the years 1971–2010, assessed the dynamics, cyclic nature and frequency of these phenomena, and identified regions at particular risk of flooding. Several studies describe the hydrological and geomorphological effects of these phenomena [14,23,24,25].
The identification of catchments at risk of flash floods is most frequently carried out by analyzing a number of various criteria by means of GIS (geographic information systems) [26,27,28,29,30]. These studies encompass individual cities [31] or entire countries [30,32]. In the case of studies concerning small areas, detailed data and advanced models difficult to use for larger areas are often employed. Studies encompassing entire countries are usually based on data and maps in small scales. Particular attention is devoted to this threat in urban areas, especially those with numerous underground structures, such as the metro (subway) [33,34].
The appropriate use of spatial resources is one of the ways for humanity to adapt to the expected climate changes [35,36]. Assessing the inclusion of areas exposed to such hazards in the spatial planning process was an important aspect of the conducted research [7,37]. This is particularly important in the context of the present-day changes in land cover and development of the settlement network taking place. Spatial planning is regarded as one of the main instruments for managing adaptation to climate change and managing the effects of climate change in the spatial context [35,38,39], also with regard to limiting the negative effects of floods [40,41,42]. Flood risk management is a matter of cross-sector collaboration controlled, at different levels of territorial division of countries, by various institutions and state administration bodies [43]. The full coordination between government bodies and entities competent in risk management, i.e., protection of the population, spatial planning and sectoral programs (e.g., in the field of water management) is a systemic challenge not only in Poland. For the already developed areas in the valleys of smaller rivers, risk reduction can be achieved by educating the residents, preparing warning systems and effective crisis response plans and protective measures for individual buildings [44]. Another matter is the spatial chaos and crisis of spatial planning, which constitute a major obstacle to the sustainable development of the country [45].
The study objective was to assess to what extent the threat related to the potential risk of flash floods is taken into account in the spatial planning system of municipalities. The first step was the identification of catchments susceptible to flash floods in the agricultural area of the Lublin Upland (E Poland). Results of the assessment allow one to identify areas (catchments and municipalities) exposed to a potentially greater flash flood hazard if heavy rainfall occurs (higher hazard). Then, planning documents and existing flood maps were analyzed in terms of identifying the flash flood risk. For the valleys of large and medium rivers, flood hazard maps and flood risk maps are developed in Poland in accordance with the European Flood Directive. In the case of smaller valleys, however, areas at risk of flash floods were not prepared [7,16]. The results of studies on the inclusion of phenomena such as flash floods in the spatial planning system have not been published in Poland so far. This problem has not been more widely discussed in international literature either.
2. Materials and Methods
2.1. Study Area
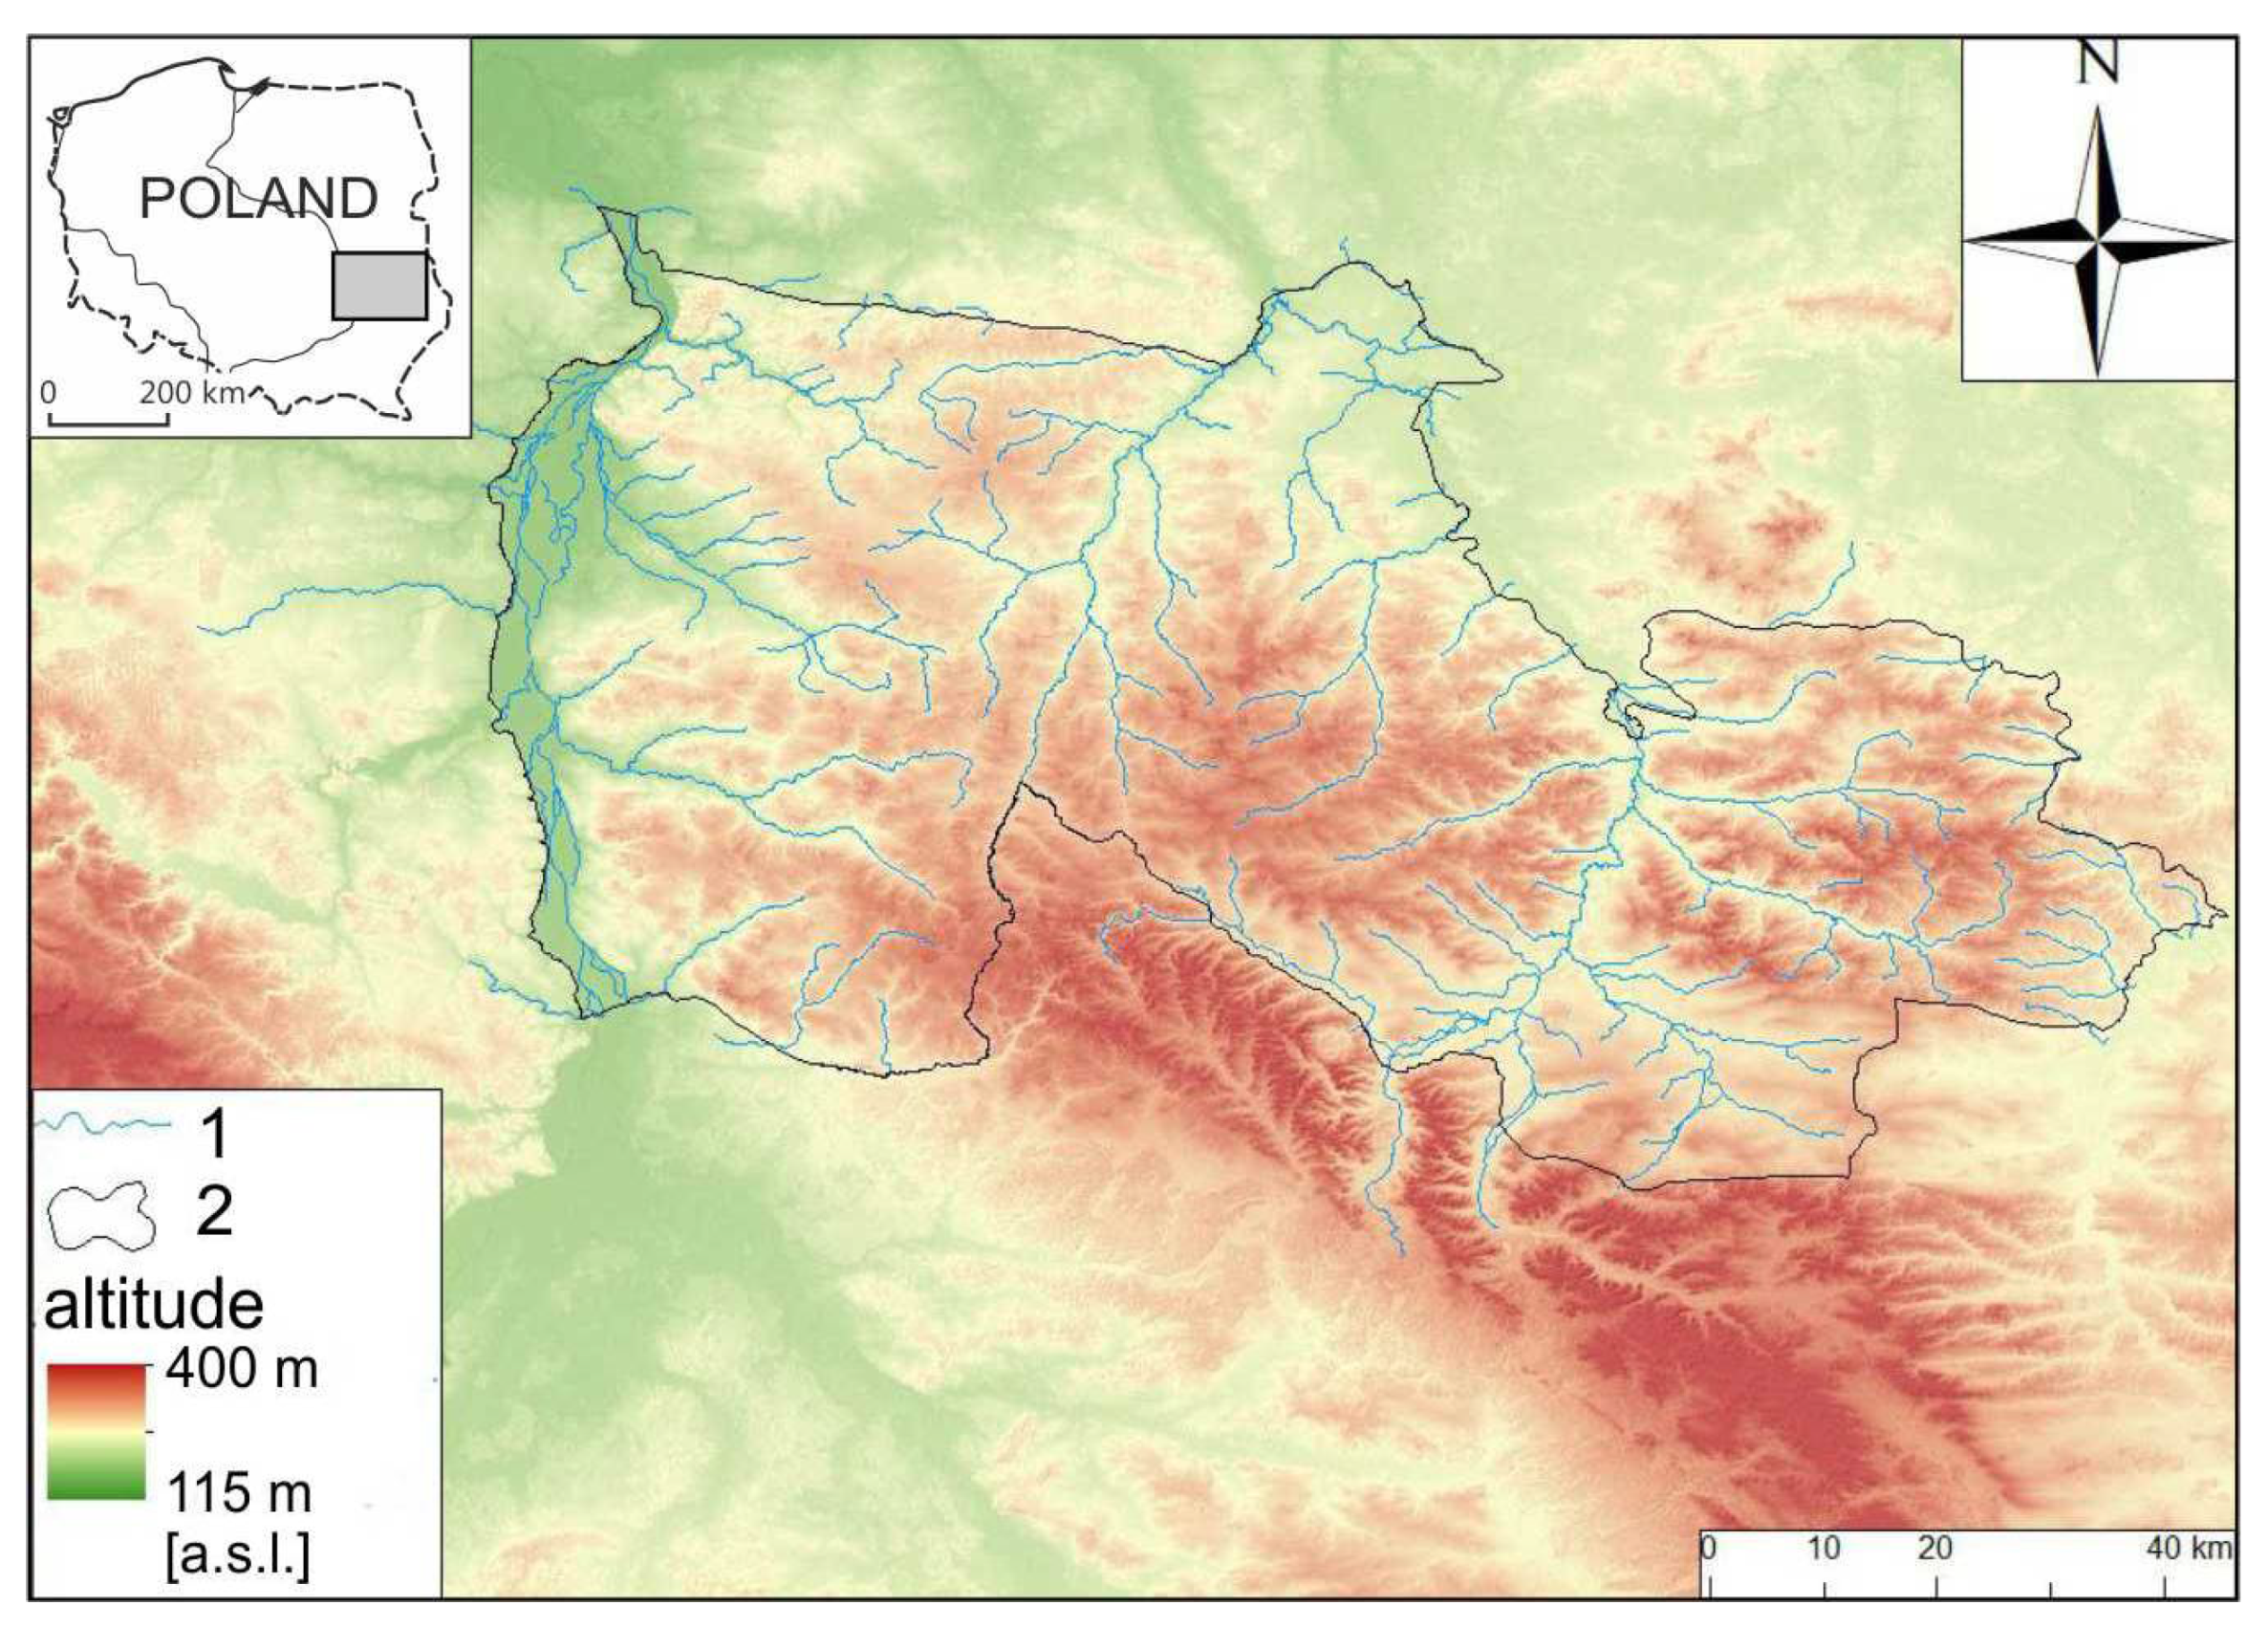
The Lublin Upland is located in the south-east of Poland (Figure 2). The region, covering 7200 km2, is divided into nine physical geographical regions In terms of the administrative division, the Lublin Upland is located in Lubelskie Province. The substrate of the Lublin Upland consists of lithologically varied Cretaceous and Paleogene carbonate rocks. They are overlain by tertiary limestone and various Pleistocene deposits: till, sand, gravel and periglacial loess. The Lublin Upland reaches the highest elevation in its central and eastern parts (up to 300 m a.s.l.), from where it descends to the north-east and north-west to an elevation of about 200 m a.s.l. The plate structure of the Cretaceous and Paleogene bedrock is reflected in land relief—vast, flat top plateaus are common in the area. The general outline of the area is influenced by the properties of Upper Cretaceous rocks that form area of the hilly type. The diverse land relief is reflected in the names of the mesoregions: Małopolska Vistula Gap, Nałęczów Plateau, Bełżyce Plateau, Chodel Basin, Urzędów Elevation, Świdnik Plateau, Giełczew Elevation, Grabowiec Elevation and Zamość Depression. Diversified landscapes may be found here: monotonous plateaus, hilly areas dissected by deep and narrow river valleys, residual hills, dense gully networks, escarpments, karst depressions and sandy planes with dunes.
The annual precipitation is about 550–600 mm, the mean annual air temperatures range from 7.0 to 7.6 °C and the mean specific runoff rate is about 4.0 dm3/s·km2. Precipitation in this region occurs most often in the summer season, frequently in the form of downpours and storms. The period of intensive precipitation lasts about 210 days, i.e., longer than in other regions of Poland [46].
The rivers of the Lublin Upland are small. The river network in the southern part of the Upland is sparse while it is a bit denser in the northern part. The main river flowing across the Lublin Upland is the Wieprz; it also drains the greatest amount of water, the mean flow at its estuary being about 17 m3/s. The Bystrzyca, the biggest tributary of the Wieprz, carries about 5 m3/s while the flow of other rivers in the region does not exceed 2 m3/s. Groundwaters occur in Cretaceous, Tertiary and Quaternary formations. The main aquifer is mainly in the Upper Cretaceous deposits [46]. Outside of river valleys, groundwaters occur deep (30–50 m and more) below the ground surface.
The Lublin Upland is a region where torrential rains, heavy rains or hail storms occur relatively frequently. The amount of rainfall reaches about 20–30 mm each time, and in some cases as much as 100 mm. The duration of such rainfall events can be short: from a few to several dozen minutes. These phenomena result in intensive surface runoff that leads to rapid rises in water levels. These phenomena occur locally, often affecting areas between ten to several dozen square kilometers, with 70% of the precipitation occurring in June and July. In the 1951–2000 period, between 10 and 20 rainfall events with a daily volume of more than 100 mm were recorded. The best-known events from that period included the heavy rains in Piaski Szlacheckie in 1956, in Dzierzkowice in 1969 and in Kazimierz Dolny in 1981 [14].
The Lublin Upland is a typically agricultural region where arable land usually covers 70–80% of the area of the individual counties. The population density, ranging from 70 to 90 persons per km2, is slightly lower than the national average for Poland. A characteristic feature of the region is the occurrence of numerous family farm holdings with an average area of about 5 ha. Despite such a high fragmentation of production, the Lublin Upland is an important area of agricultural production in Poland due to the presence of fertile soils (Cambisols and Luvisols) [47]. Recent years, however, have seen a decrease in the agriculturally used areas resulting from the socioeconomic changes occurring here [48].
2.2. Local Spatial Planning in Poland in Relation to Flood Risk Management
A flood is a natural disaster (Act of 18 April 2002 on a State of Natural Disaster) [49]. Minimizing flood risk, ensuring safety during its occurrence and removing the effects of flooding requires the cooperation of state and local government administration with various institutions. It is also necessary to ensure a coherent formal and legal system concerning flood control, water management, spatial planning and crisis management. At the local level, it is the municipality’s own responsibility to ensure “public order and safety of citizens as well as fire and flood protection, including the equipment and maintenance of a municipal flood protection warehouse” (article 7 § 1 (14) of the Act of 8 March 1999 on municipal government [50]. Pursuant to the Crisis Management Act of 26 April 2007 [51], the basic crisis management instrument of a planning character is the National Crisis Management Plan along with the provincial, county and municipal plans [52,53,54].
Spatial planning is a key instrument for the appropriate and rational design of spatial development. In Poland, the legal basis for this process is provided by the Act of 27 March 2003 on Spatial Planning and Development [55] that defines (article 1 § 1) “the scope and modes of procedure in land use designation for specific purposes and establishing the rules of land development, with spatial order and sustainable development regarded as the basis for these actions”.
The local level of spatial planning that encompasses a spatial development conditions and directions study for a municipality (“study”) and a local spatial development plan (“local plan”) is the most important from the point of view of flood hazard management. A study is an act of internal management and cannot be the basis for administrative decisions. Its preparation is obligatory for the entire area of a municipality (town). A local plan, on the other hand, is an act of local law and, with certain exceptions, it is not obligatory. It can be prepared for an entire municipality and an individual plot of land. The provisions of a local plan must conform to the provisions of the study. In the absence of a local plan to determine the development requirements, a decision on development conditions and land use is issued [56,57].
The Act on Spatial Planning and Development [53] indicates the minimum scope of problems included in planning studies. A study should take into account conditions resulting from, inter alia, “the threat to the safety of people and their property” and, in relation to water “flood control requirements” (art. 10 § 1 of the Act on Spatial Planning and Spatial Development). A study should specify, among others, “areas particularly exposed to flood risk” (art. 10 § 2). A local plan must specify (art. 15 § 2) “the boundaries and ways of developing [...] areas particularly exposed to flood risk” and “detailed area development conditions and use restrictions, including the prohibition of building development”.
In 2011 the provisions of the European Flood Directive were implemented (Directive 2007/60/EC of the European Parliament and of the Council) [58] in Polish law whereby spatial planning has been very strongly integrated into the process of reducing the negative effects of floods. The identification of the flood hazard is now formally regulated by the Water Law Act of 20 July 2017 [59], which makes Wody Polskie (State Water Management Company) and state and local government administration bodies responsible for flood control (protection) [60,61,62]. This protection is provided “while taking into account flood hazard maps, flood risk maps and flood risk management plans”. Flood risk management includes, “in particular, prevention, protection, preparedness and responding when flood occurs, dealing with the effects of floods, restoration and drawing conclusions in order to reduce the potential adverse effects of floods on human health, the environment, cultural heritage and economic activity.” (art. 163).
According to the European Flood Directive flood hazard maps (FHMs) and flood risk maps (FRMs) are drawn up for areas identified in the preliminary flood risk assessment. The purpose of preparing this preliminary flood risk assessment is to identify areas at risk of flooding, those with a significant flood risk or with a high probability of a high flood risk. The first assessment was carried out in the period 2010–2015 as part of an EU-funded project—the IT System for the Protection of the Country against Extreme Hazards (ISOK), which provides access to, among others, flood hazard maps and flood risk maps [63]. The final versions of flood hazard maps and flood risk maps were submitted to local government units in April 2015. Eventually, after protests of local governments (especially of cities), which often questioned the flood water extent presented on the maps and did not want to bear the high costs of changes in planning documents, optionality was introduced (art. 88f § 5, 6 of the Water Law Act of 2001, [64]). In 2016, a review and updating of the preliminary flood risk assessment was begun.
2.3. Methods
The assessment of the susceptibility of catchments to flash floods was divided into five steps: (a) identifying the characteristics of the catchment environment influencing this phenomenon; (b) collecting the necessary spatial data; (c) spatial analysis of the parameters; (d) quantifying the individual characteristics and (e) carrying out a synthetic assessment of susceptibility (Figure 3).
The fundamental part of the study consisted of the analysis of the existing planning documents for local government units located within the catchments with high susceptibility to flash floods. It was assessed whether this threat is recognized in these documents and reflected in spatial planning. It was also examined whether they are covered by the flood risk maps and flood hazard maps prepared as part of the implementation of the EU Flood Directive. Twelve studies (spatial development conditions and directions study for a municipality) and over 60 local plans (spatial development plans) or their changes were analyzed (Figure 3).
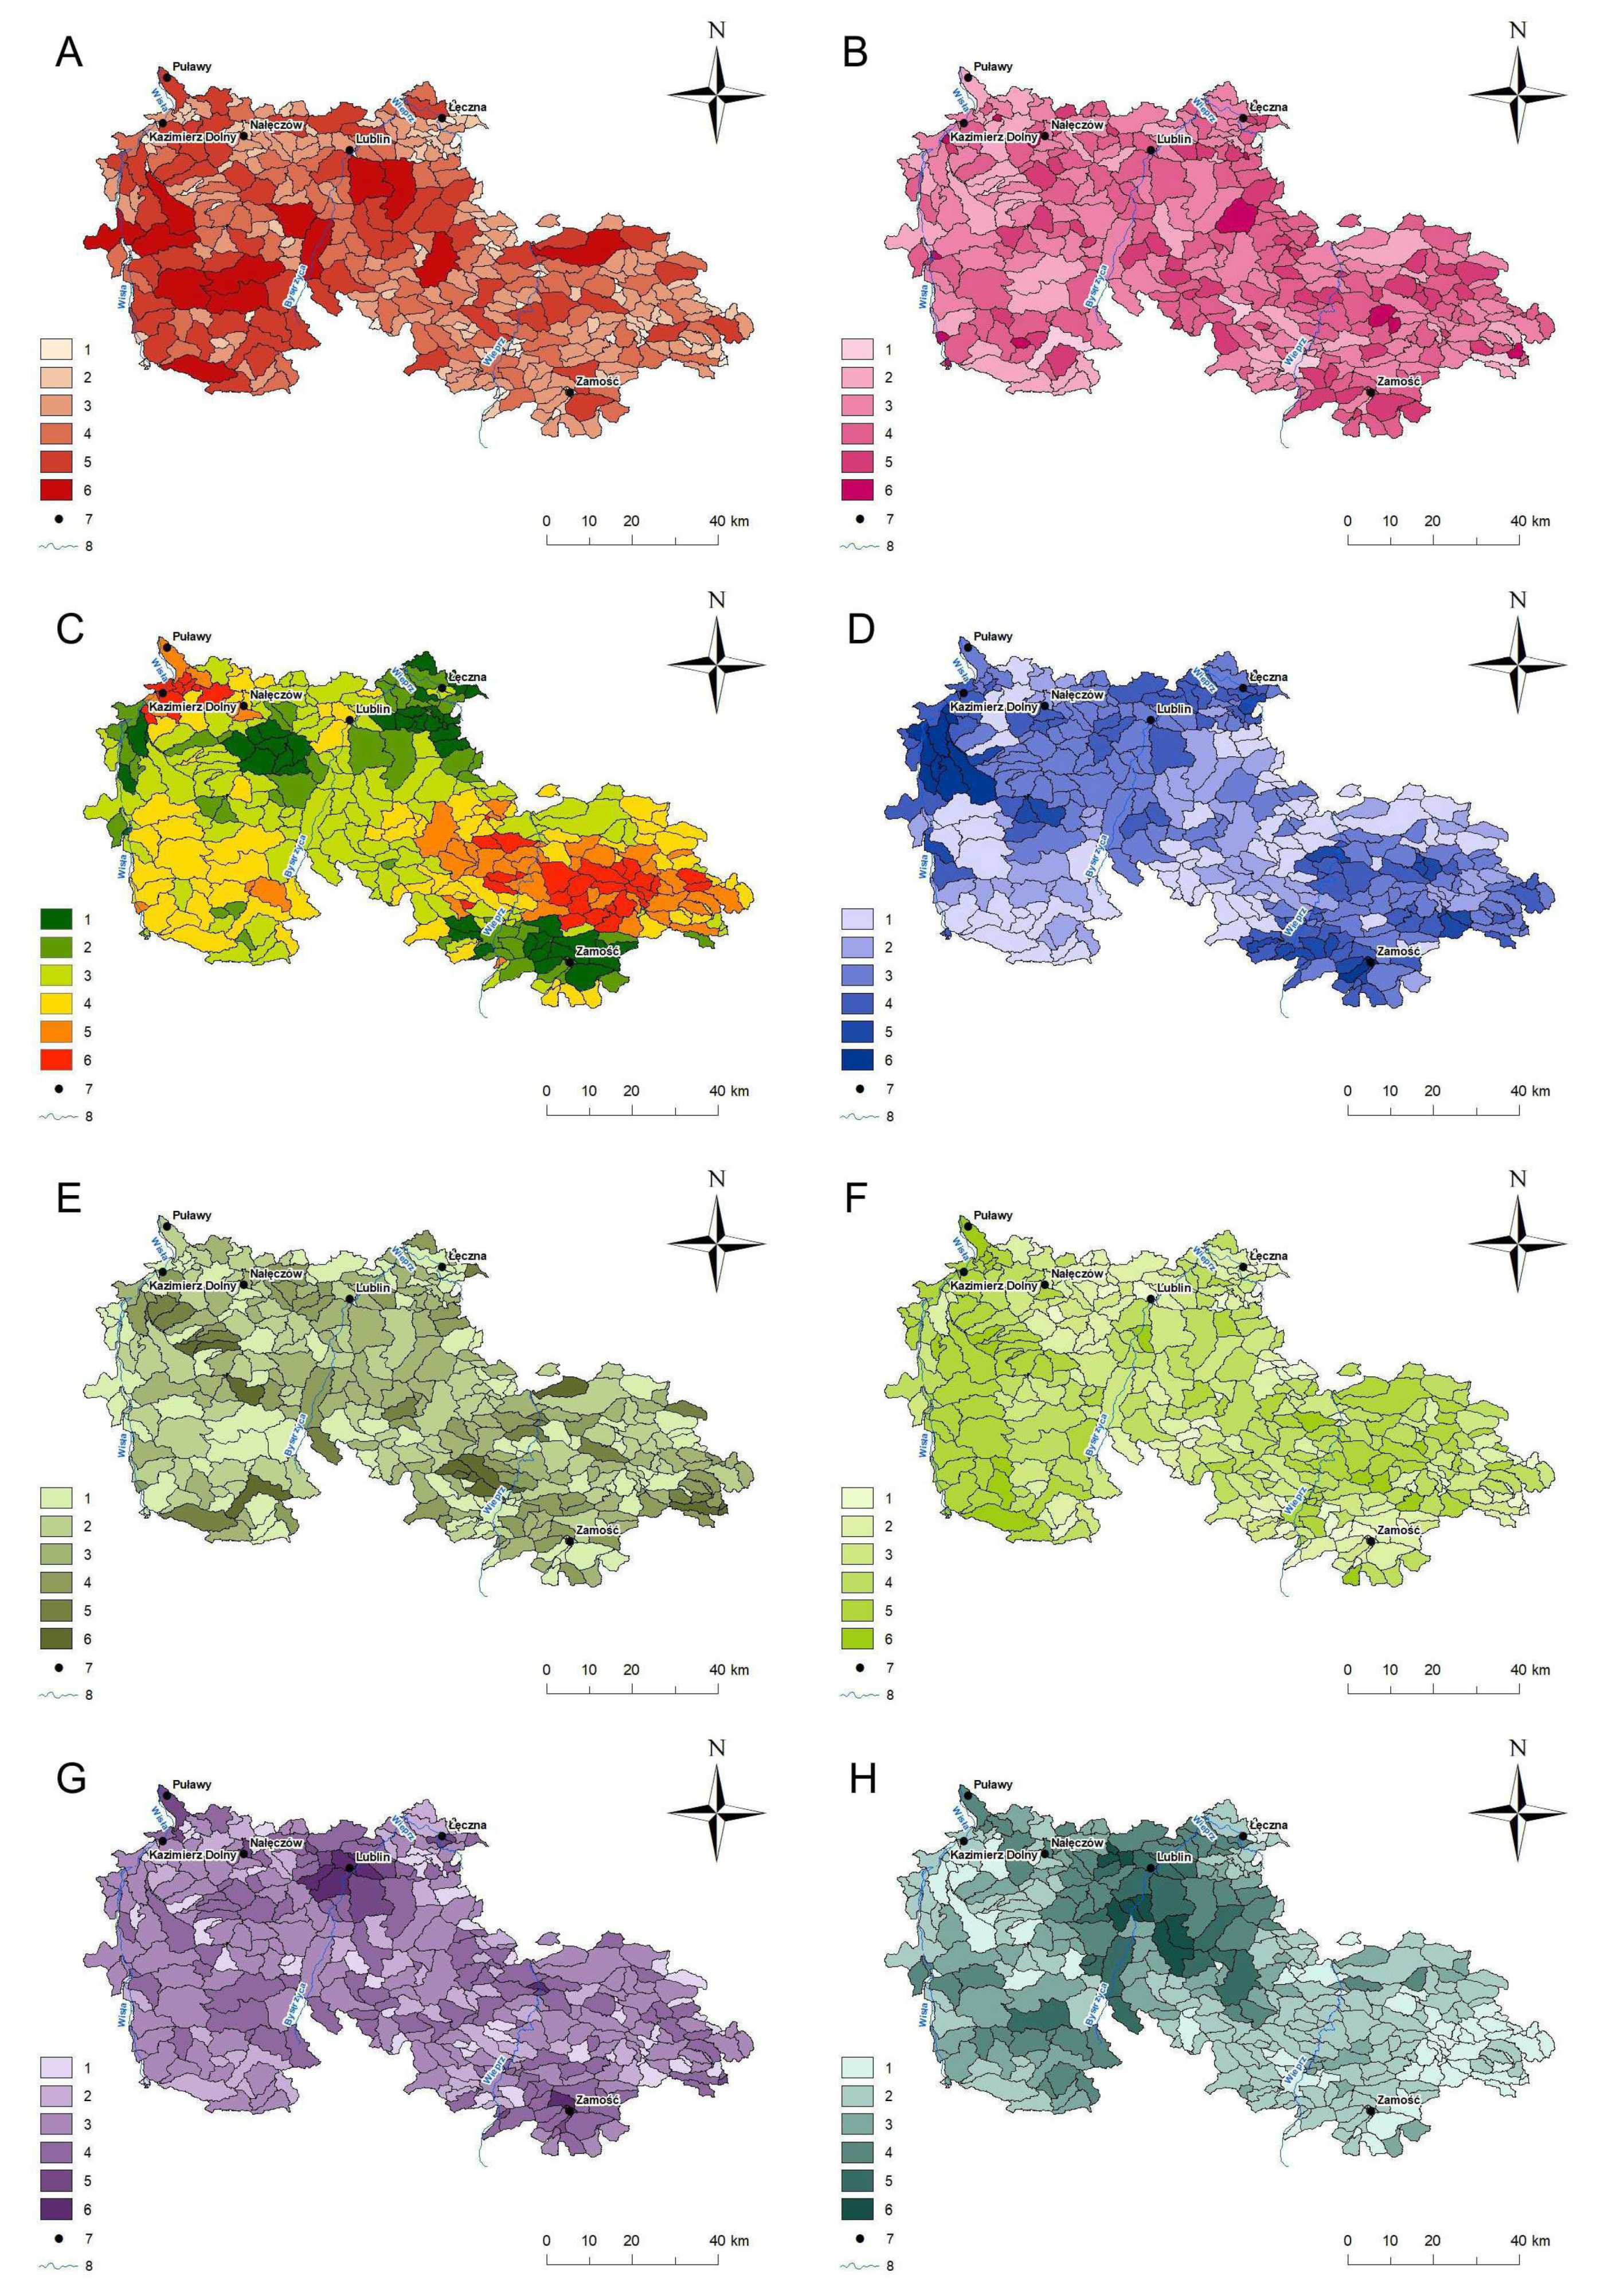
Based on the analysis of the available literature on the determinants of the catchments’ susceptibility to flash floods, it was found that, in the case of a study area of more than 7200 km2 (369 catchments), it would be advisable to use the following catchment characteristics: (A) catchment area; (B) circularity index; (C) mean catchment gradient; (D) density of the river network; (E) mean length of first-order watercourses; (F) forest cover; (G) built-up areas and (H) road density. A study prepared by Bryndal (2011) [20] for Carpathian catchments proved to be particularly valuable. In the study, he carried out a detailed analysis of catchment parameters influencing their susceptibility to rapid rises in water levels.
The catchment area is a significant parameter because flash floods usually occur in small catchments, covering from a dozen or so to 40 km2 [9,20]. Therefore, the following rule was adopted: the smaller the area of a catchment, the greater its susceptibility to the occurrence of flash floods. The shape of a catchment (expressed by the circularity index) is important from the perspective of the speed of water supply to the watercourses. The higher the value of the index—and the shape of a catchment closer to a circle—the smaller the risk. With a more circular shape, the supply of water to the primary valley is more spread over time. The higher the slope gradients, the faster the formation of runoff occurs [17]. The formation of a flood wave is also more likely when the density of a permanent drainage network is greater and the length of first-order watercourses is smaller. The agricultural use of an area results in a quick formation of surface runoff. Thus, the susceptibility of a catchment to flash floods decreases with increased forest cover. On the other hand, a greater proportion of built-up areas (smaller infiltration) and roads (accelerated runoff) increases the flash flood hazard [65].
Land relief analysis was based on a digital terrain model with a spatial resolution of 30 m (SRTM). Data were sourced from the USGS Earth Explorer website [66]. Fourteen scenes connected with each other were used to obtain coverage of the entire area of the Lublin Upland. Watercourses in the form of the vector layer were obtained from the website of the Head Office of Geodesy and Cartography (GUGiK) [67]. The study used a layer containing the boundaries of catchments with permanent drainage. It was obtained from the resources of the Faculty of Earth Sciences and Spatial Management, UMCS. The study also used land cover vector data prepared as part of the CORINE Land Cover 2018 project. They were obtained from the resources of the Copernicus Land Monitoring Service [68]. The study used data related to built-up areas and forests. The road network (all roads) in the vector Esri shapefile format was generated from the OpenStreetMap [69] using the QuickOSM plugin in QGIS 3.4.4 software. All the analyses were carried out in ArcMap version 10.2.1. They were primarily based on the creation of maps presenting the spatial variation of the individual parameters and the susceptibility assessment results.
Digital maps were prepared showing the diversity of parameters within the catchments under study. Then the susceptibility of catchments was quantified according to the selected assessment criteria. For each catchment, eight parameters were rated separately on a 6-point scale. Varied weights of criteria, proposed by authors, were used depending of their role in formation of flash floods (Table 1). Setting the weights we used the information available in the literature on the impact of individual factors on the intensity of flash floods [2,4,6,11]. For each parameter, separate maps were created showing the spatial variation of its values in the catchments according to the adopted assessment criteria (divided into five classes of partial susceptibility). The synthetic susceptibility of catchments was calculated based on the following formula:
FF: susceptibility to flash flood formation;
wi: weight of parameter;
xi: parameter;
n: number of parameters.
Based on the partial assessments, the total susceptibility index expressed with a numerical value with a theoretical variation of 0–48 was obtained. Four classes of susceptibility to the occurrence of flash floods were distinguished:
- Class I (from 25 to 30 points): insusceptible catchments;
- Class II (from 31 to 36 points): catchments with low susceptibility;
- Class III (from 37 to 42 points): susceptible catchments;
- Class IV (from 43 to 48 points): highly susceptible catchments.
To assess the impact of particular features (parameters) of the catchment on the final assessment results Pearson’s correlation coefficients between the synthetic, point assessment result and the catchment parameters was calculated.
The occurrence of the most vulnerable catchments within administrative units was analyzed. Existing planning documents were analyzed for municipalities located within the catchments with high susceptibility to flash floods (more than 50% of the area occupied by the catchments belonging to class III and IV). It was assessed whether this threat is recognized in them and reflected in spatial planning. Twelve studies (spatial development conditions and directions study for a municipality) and over 60 local plans (spatial development plans) or their changes were analyzed. We also analyzed flood hazard and flood risk maps prepared in accordance with the Flood Directive available at the ISOK website [63]. It was assessed whether they include catchments and municipalities located within them, for which high susceptibility to flash floods was found.
3. Results
Most of the 369 catchments in this study were rather small (Table 2). The area of more than 60% was less than 20 km2. The biggest proportion of the catchments (30%) covered an area of 10 to 20 km2. Most of the large catchments were located in the western and central part of the Lublin Upland, while the smallest catchments were located in the east and north of the region (Figure 4).
Most of the catchments (about 50%) had moderate gradients, from 2 to 3 degrees. Catchments with the highest slope gradients were primarily located in the eastern part of the Upland (Figure 4). Three concentrations of catchments with the lowest mean gradients were situated in the southernmost part of the region and in its central-northern part. Most of the catchments (44%) had a forest cover within the 10–20% and 20–40%, range. The most extensive forest cover occurred in areas in the western and eastern part of the Upland. The central part had the smallest forest cover (Figure 4). Most of the catchments (over 50% of all catchments under study) had a river network density of 0.2–0.5 km·km−2. The lowest value of this index occurred in catchments in the south-western and central part of the Upland. The highest density occurred in the north-western, south-eastern and central-northern part of the region. The circularity index of most of the catchments (60%) ranged from 0.4 to 0.6. There were no patterns in the spatial distribution of catchments with various values of this index; they were equally distributed across the entire region. The mean length of first-order watercourses in most of the catchments (30%) ranged from 2.5 to 5 km (Figure 4). Additionally, in this case, there are no distinct patterns in their spatial distribution; catchments with different values of this index form a mosaic-like pattern across the entire area of the Lublin Upland (Figure 4). Built-up areas accounted for 2–5% in 34% of the catchments and 5–20% in 29% of the catchments. Catchments where the road network ranges from 0.5 to 1.5 km·km−2 were predominant. The highest road density occurred in the central part of the Upland while the lowest density in the eastern part (Figure 4).
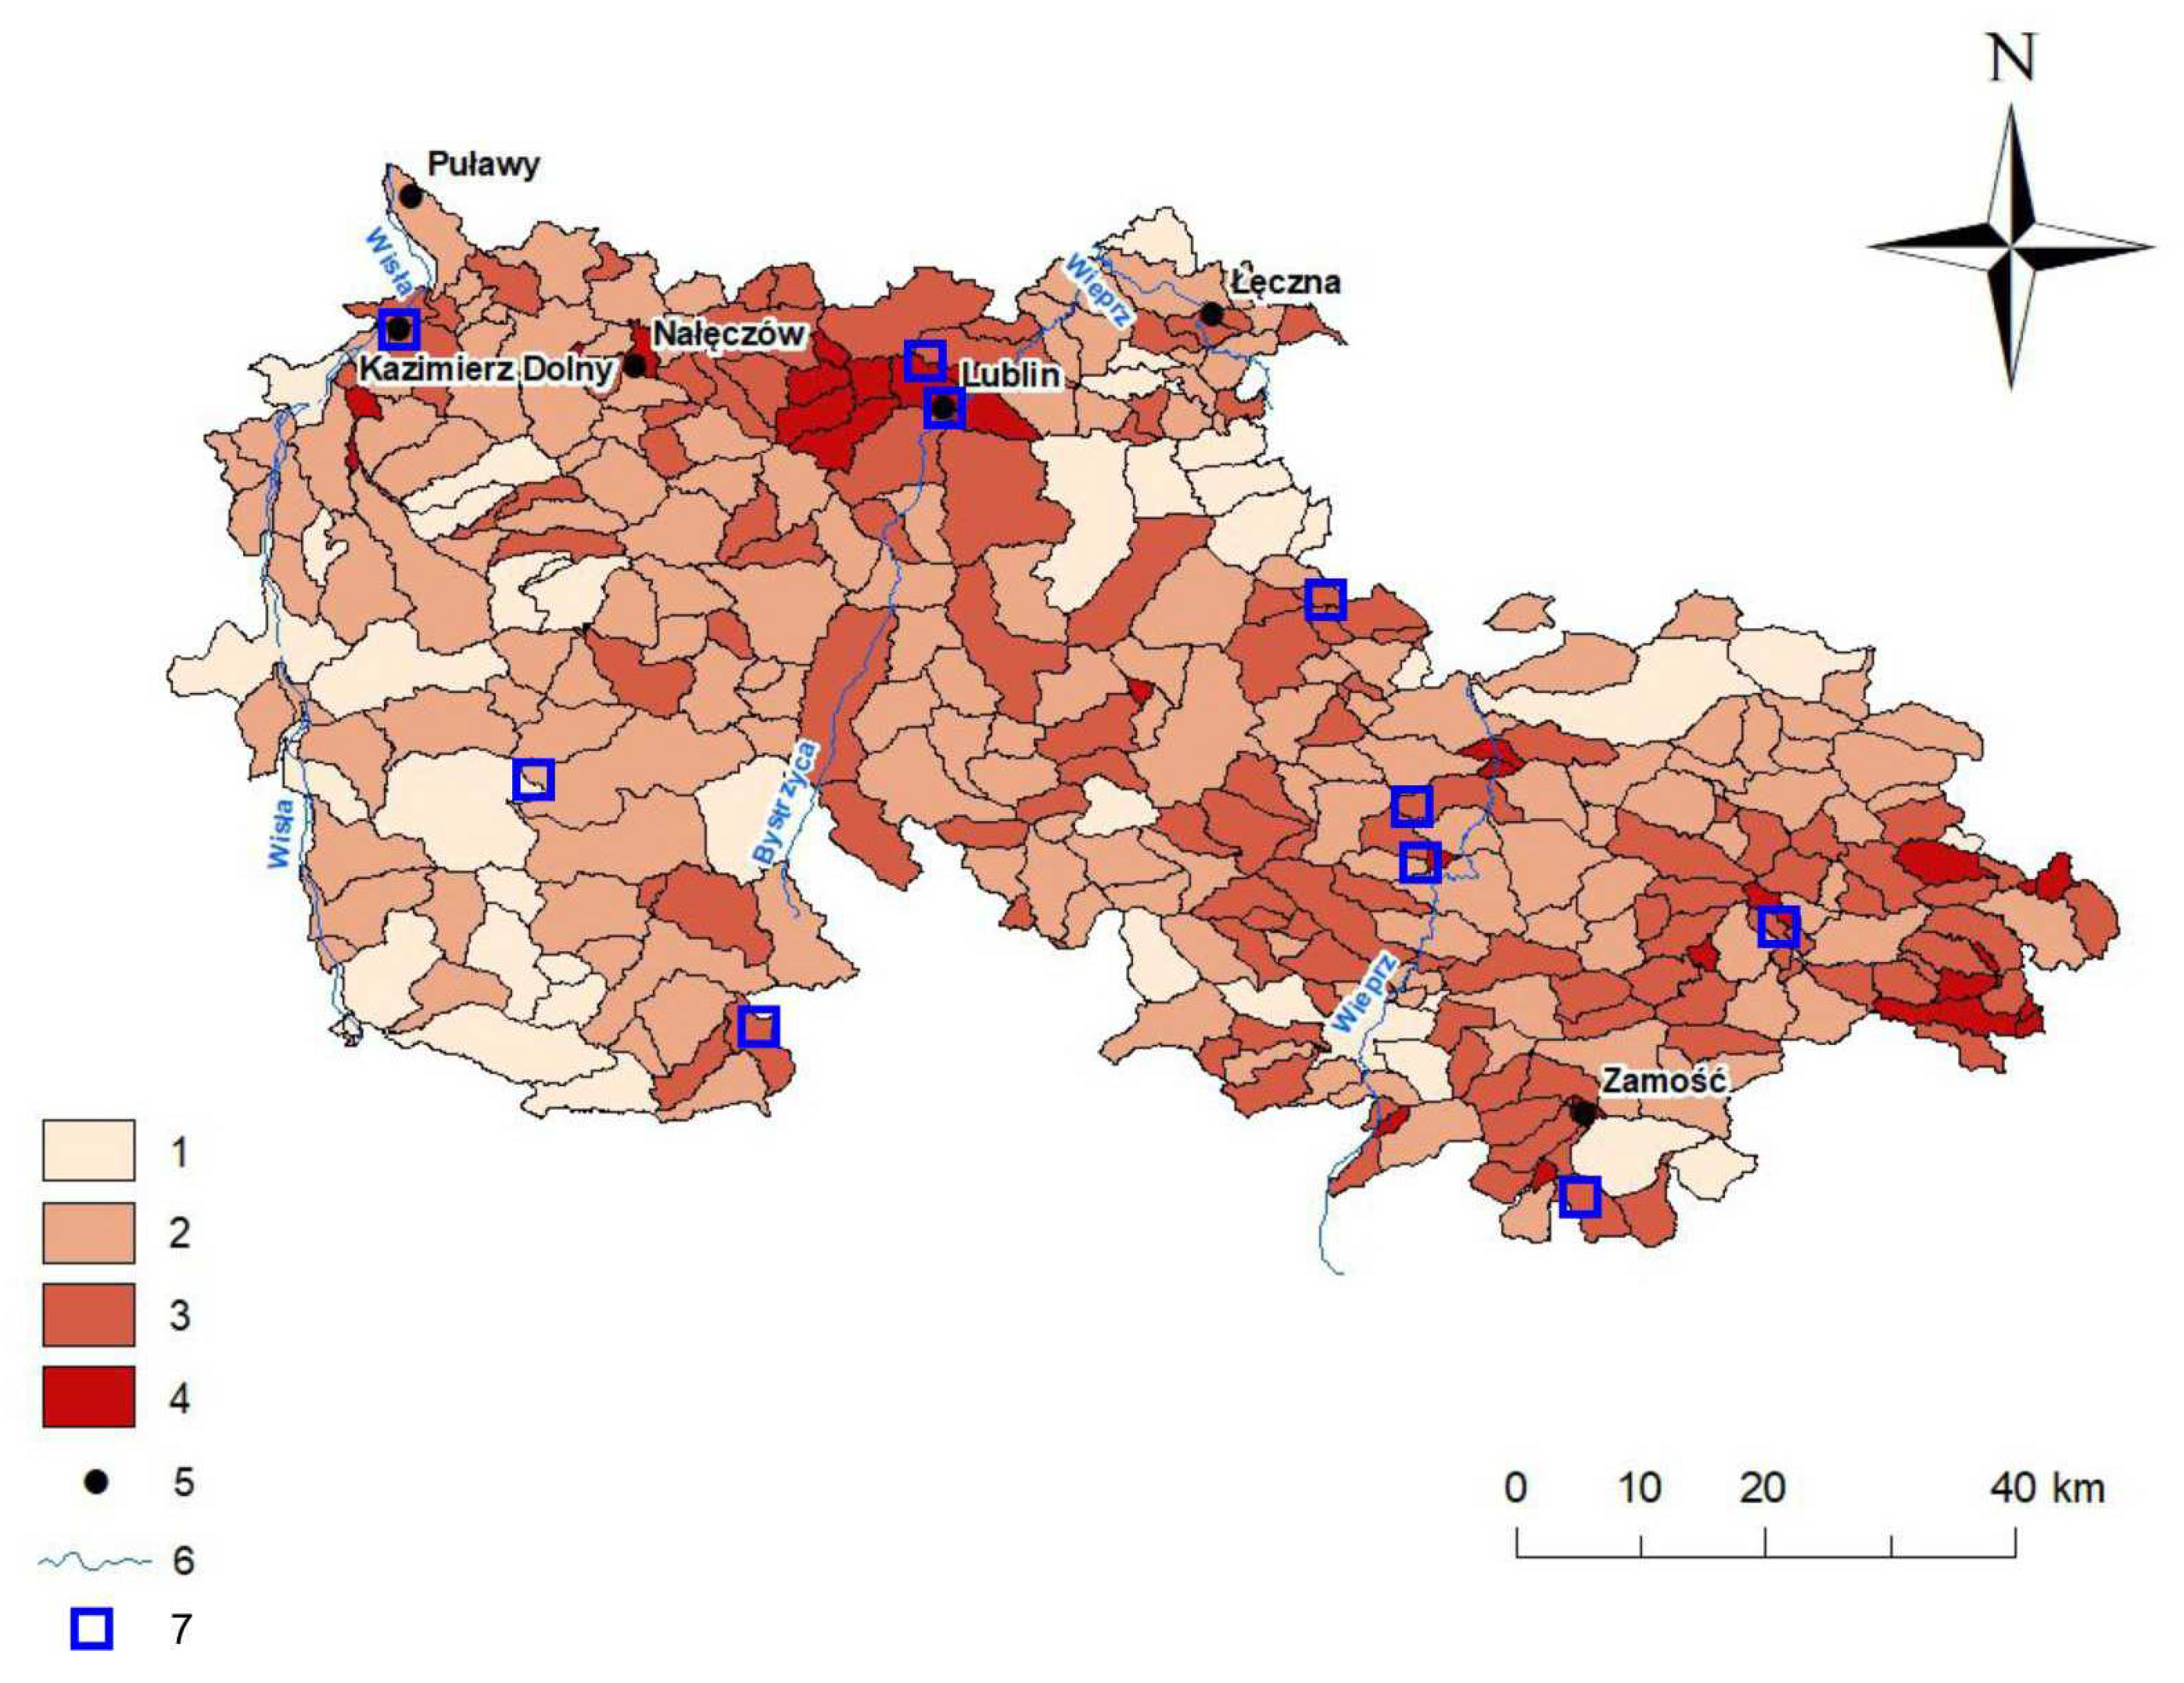
The mean score for all catchments in the Lublin Upland was 36, which was the upper limit of susceptibility class II (Table 3). About 30% of the area belonged to class III and IV. The most susceptible catchments were scattered across the entire area of the Upland. Their biggest concentrations were located near Lublin and in the east of the Upland. The least susceptible catchments predominated in the west and south-west part. Low susceptibility also occurred in the northern part (Figure 5).
Catchments belonging to Class I show a low level of susceptibility to the formation of flash floods. Most of the catchments in this class covered a large area (mean area of 28 km2) and had a large forest cover (24.7%). The lower mean gradient of the catchment area, 2.1, was a characteristic feature of these catchments. They also had a poorly developed river network, with a density of 0.2 km·km−2, while the length of first-order watercourses was 4.5 km. The mean road density was 1.47 km·km−2, while built-up areas accounted for 2.6% (mean) of the area of these catchments.
Catchments assigned to class II show a low susceptibility to rapid rises in water levels and runoffs. It is the most numerous class, comprising nearly half of the catchments. Catchments in this class typically covered a rather large area (mean area of 22.1 km2) and had a rather small forest cover (17.4%). The density of their river network as rather low, 0.26 km·km−2, while the mean length of first-order watercourses was 4 km. The road network density was 1.99 km·km−2 while built-up areas accounted for 3.9% of these catchments.
Catchments belonging to class III were susceptible to the formation of flash floods. Their area was considerably smaller than those in the previous classes: 15.2 km2 on average. The slope gradients (2.6° on average) were slightly higher than in class I and class II catchments. The proportion of forests in the land cover of these catchments was small (9.2%). The mean length of first-order watercourses, 2.4 km, was clearly shorter, while the proportion of built-up areas was greater, 7.1%. The density of the road network was similar to the value for class II catchments.
Class IV comprised catchments highly susceptible to flash floods and runoffs. Their area was small, 7.5 km2 on average. The mean slope gradient, ranging from 1.5 to 0.71, was the highest among all the classes. The proportion of forested areas was very small, 1.8% on average, but that of built-up areas was high, 23%. The density of the river network in these catchments was the highest, 0.6 km·km−2, while the mean length of first-order watercourses was the shortest, 1.9 km.
Table 4 contains correlation coefficients between the synthetic susceptibility (expressed in points) and the characteristics (parameters) of the studied catchments. Table 5 provides information on the basic features and existing planning documents for municipalities with a high degree of susceptibility to flash floods. Table 6 presents the results of the analyses of existing flood hazard and flood risk maps within the surveyed municipalities. It also presents information on the scope of flood hazard and flood risk identified in the planning documents.
4. Discussion
The studies conducted so far indicate that the Lublin Upland is an area where flash floods occur [9,14,16]. However, the frequency of these phenomena is not as high as in mountain areas. On the other hand, the degree of spatial development in the Upland was greater. The analysis of maps showing the susceptibility of catchments to flash floods and the locations where heavy rains occur indicates the existence of a real threat [14]. In the second half of the 20th century, heavy rains with a volume of more than 30–40 mm within 1–2 h were estimated to have a frequency of 1 event per 20–30 years in the Lublin Upland [14]. However, flash floods can occur in the same locations with a greater frequency, as it is the case in the catchment of the Sanna river or in the area of Lublin (Figure 6). The question of the spatial distribution of these phenomena requires further investigation because systematic research in this respect has not been conducted so far. Although the applied method of identifying catchments susceptible to flash floods is of a preliminary and de facto qualitative character, it can be useful in the spatial planning process. It allows one to identify the areas where the susceptibility is the highest. Major flash floods of the last 50 years occurred in the catchments of the IV class (Figure 5). The parameters analyzed had a varying impact on the susceptibility of catchments to flash floods. The high proportion of built-up areas, small share of forests and small catchment area had the greatest synthetic susceptibility of catchments to flash floods (Table 4).
In accordance with Polish law, a preliminary flood risk assessment was carried out for the Lublin Upland. Flood risk maps and flood hazard maps were drawn up for the areas at risk. They are available on the ISOK map portal [63]. The sheets of this map encompassed all the major rivers of the region and some of the smaller rivers. The analysis of flood hazard maps and catchments at risk of flash floods showed that these areas were not always reflected in the flood risk maps and flood hazard maps (Table 6). Particularly small catchments, located in the upper reaches of small watercourses, were not taken into account on flood hazard maps even if floods occurred there historically (Figure 5).
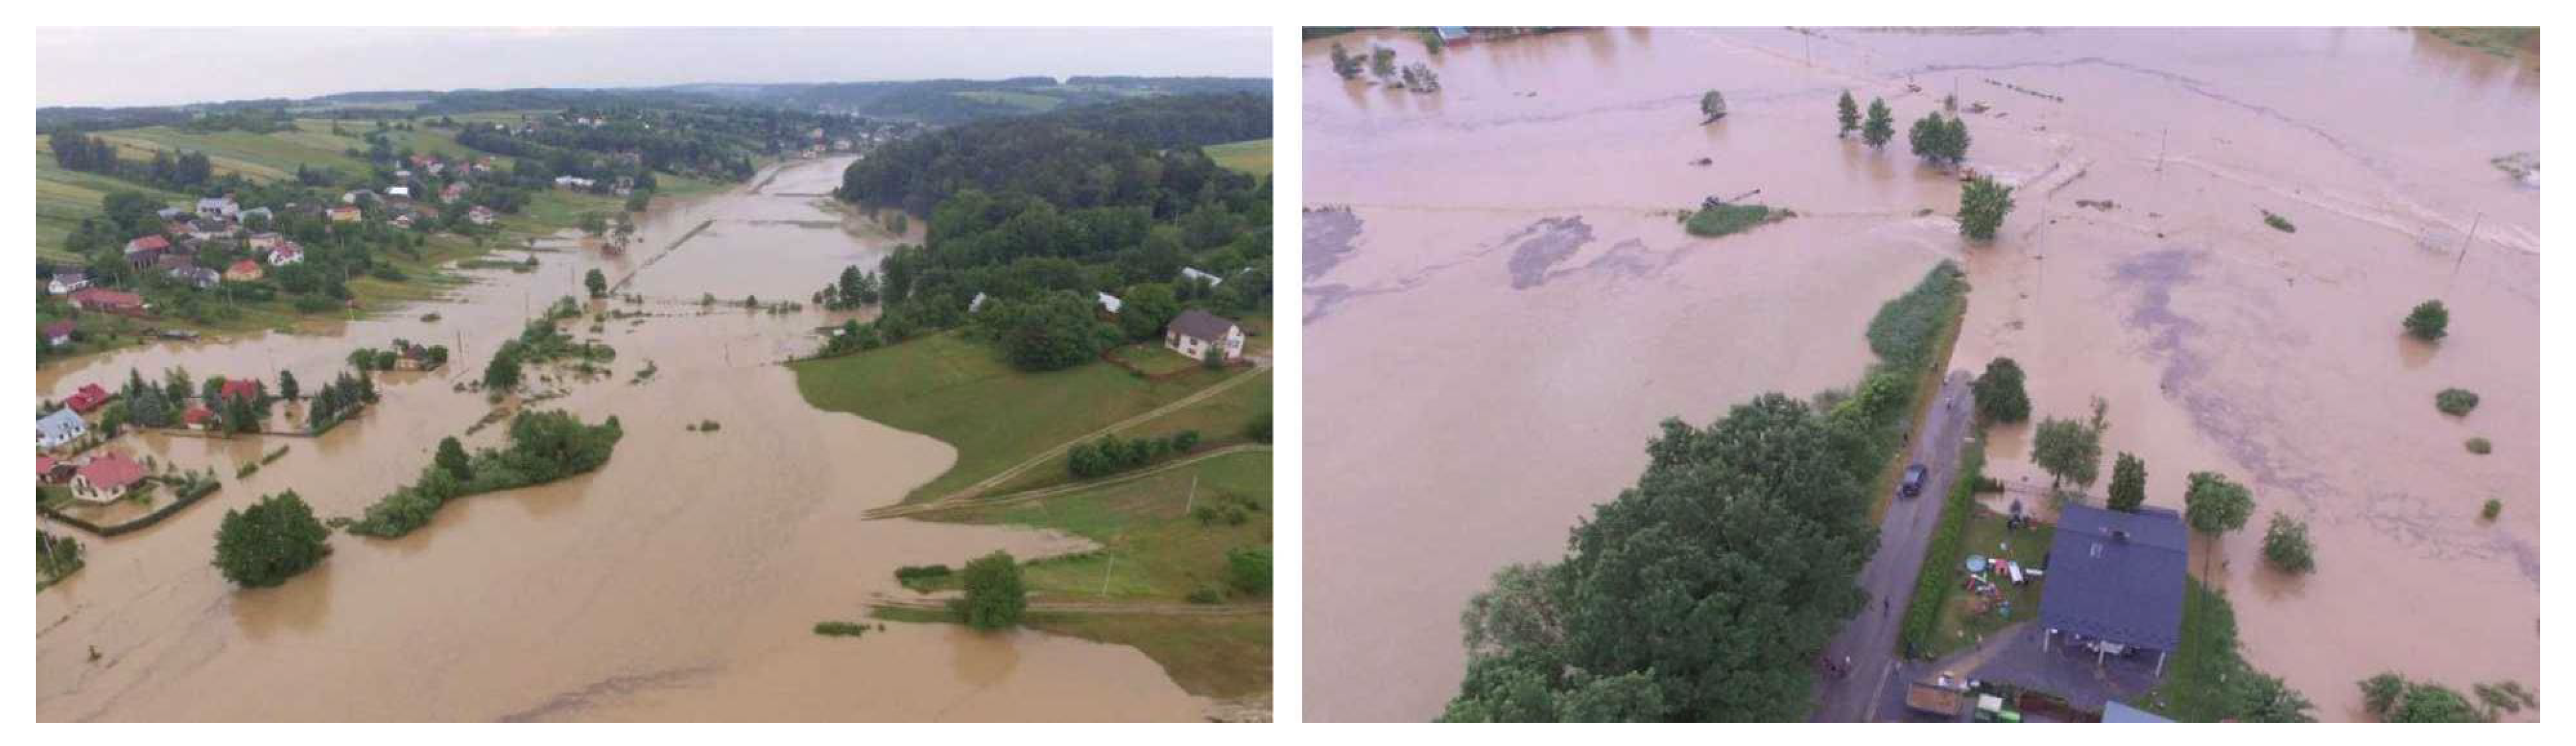
Flash floods are a separate problem, particularly in small catchments because their scale and intensity are difficult to predict. The prepared susceptibility assessment revealed catchments at risk of flash floods based on the adopted parameters. A high flash flood hazard in the Lublin Upland results from the specific land relief, high degree of deforestation and considerable share of arable land. Due to these characteristics, along with the prevailing land use pattern (fields perpendicular to the valley axis), water after heavy rainfall is quickly drained from the plateau top and slopes (also via gully systems with hard roads) to flat-bottomed valleys. Buildings, historically located usually along the edge of the valley bottom, are threatened with flooding. The situation within territorial units with a high share of built-up and urbanized areas is particularly difficult. In June 2019, a flood occurred successively in Pasieka, Wierzchowiska Drugie and Wierzchowiska Pierwsze—localities lying in the valley of the small Sanna river in Modliborzyce municipality. Houses and roads were flooded, part of the technical infrastructure was damaged. The valley was outside the scope of the prepared sheets of the flood hazard maps. However, the river had already flooded there before (Figure 6). A similar situation took place in Siedliska Drugie in Fajsławice municipality where, in 2016, a flash flood occurred in the part of the valley not included in the flood hazard maps.
Not all rural municipalities and towns of the Lublin Upland make full use of planning instruments to appropriately manage space, also in the context of flood hazards (Table 5). In the case of 13 units of territorial division with a high level of flash flood hazard (third- and fourth-degree hazard in over 50% of the area), a high percentage of the area is covered by local plans in only six of them. What is more, some of these plans were drawn up a long time ago and do not guarantee a comprehensive approach to flood hazard. In several municipalities, only a few percent of their area are included in the local plans. It is also quite alarming that local plans exist for only half of the territory of the region’s capital city Lublin. Detailed analysis of local plans shows to what extent the risk has been identified and how it has been taken into account in planning documents (Table 6).
The inclusion of 100-year water ranges (Q1%) in planning documents does not fully address the flash flood hazard because with rapid rises in water levels, the flows can even exceed the range of a 500-year water (Q0.2%). The criteria for the preliminary flood risk assessment are not fully effective with regard to small catchments with big elevation differences and agricultural land use. Only a few studied planning documents take into account the phenomenon of flash floods. Its spatial range is indicated only in the case of overlapping with the risk of “classic floods”. In the recently developed planning documents, the flood risk is determined on the basis of the FHM and FRM, which do not fully take into account the flash flood hazard. Planners do not know the criteria for separating flood extents, therefore FHM and FRM require a more complete flash flood risk. Even if they have information about the phenomenon (identify the areas of occurrence in the study), the basis for the findings in planning documents, in accordance with the law, are FHM and FRM. No flood hazard maps and flood risk maps have been prepared for many of such areas [7,33]. Such a situation also occurs in the Lublin Upland. Even if such maps exist, spatial development plans do not fully cover areas at risk of flash floods (Table 6). The decisions on development conditions and land management do not always address the hazard adequately.
In Lublin Upland the flood hazard ranges have been specified in the case of areas located in the catchments of larger rivers. However, areas located in the catchments of smaller watercourses are usually regarded as safer while in fact they are particularly exposed to the flood hazard in the case of heavy rains [7,33]. Flood hazard maps and flood risk maps are very important not only for planners, including urban planners, but also for the crisis management cycle: from the prevention phase, through the preparation and response phase, to the reconstruction phase. There is also an issue of connecting the identification of hazards based on natural criteria with the possibility for action at the level of administrative divisions. Spatial planning is the domain of the authorities of territorial units established by way of administrative decisions. The authorities responsible for water management operate within units having natural boundaries. This system needs to be integrated, and this remains a challenge not only in Poland. Flood risk reduction can be achieved through a proper spatial planning process, which is based on reliable information on flood hazards. This enables the designation of areas to be excluded from building development or the identification of technical restrictions and requirements for the location of buildings to be introduced.
A full coordination between spatial development policy and entities responsible for flood risk management is a challenge not only in Poland. The connection between the spatial planning system and flood risk management system needs to be strengthened. As a preliminary step, spatial planning should be aimed at reducing the risk and consequences of natural disasters [40,70]. Gralepois (2020) [38] points out that spatial planning has not been fully used in the prevention of floods and its importance was appreciated to a greater extent only with the implementation of the Flood Directive. However, as the examples of England and France show, the choice of planning instruments is not always satisfactory, particularly in the context of conflicts between the local tier in spatial planning and national legislation and risk management. In the Netherlands, on the other hand, flood prevention is better integrated into spatial planning, which is a result of greater awareness and better integration of flood management. However, Neuvel and Van Den Brink (2009) [71] indicated that in many cases, even if flood risk information exists, it is not always adequately used.
An important factor in mitigating the risk of flooding is to reduce the vulnerability to flooding, which means the degree to which people, their property and facilities are prepared for flooding, and the ability to repair damage and rebuild after flooding has occurred. Measures related to the reduction of vulnerability include preparing residents for the hazards, i.e., measures related to the protection of buildings at risk of flooding, implementation of flood warning systems and flood education, in the broad sense of the term, among the decision-makers and residents [72]. The episodic nature of flash floods means that residents are not aware of the risks and are not properly prepared for the occurrence of flash floods: they do not know how to properly secure their property or how evacuation is conducted [73]. Fortunately, flood warning systems are used to a greater degree, using devices to signal the danger of flooding when the water level in a watercourse or the amount of precipitation exceed a set limit [7,74,75]. Mobile telephony can also be used to quickly and directly inform people in vulnerable areas.
5. Conclusions
The amount of available data on the occurrence of flash floods in the Lublin Upland is not extensive. The catchments with high susceptibility covered about 30% of the studied area. Most severe flash floods in the second half of 20th century occurred in the catchments of the IV class. It seems, therefore, that the method can be used by local government units.
In Poland currently, areas at risk of flash floods are not fully taken into account in the spatial planning process. Few planning documents take into account the phenomenon of flash floods, and its spatial range is indicated only in the case of overlapping with the risk of “classic floods”. It is advisable to include in the legal system the requirement for preliminary and, in justified cases, detailed analyses of this hazard. Planners need spatial information and, therefore, there is a need to expand the areas for which flood hazard maps and flood risk maps are drawn up.
A serious problem in units of territorial division is the lack of local plans in which it would be possible to include appropriate guidelines for development and building in areas at particular risk of flooding because the procedure for preparing them ensures a better level of protection than it is the case with decisions on the site-location of public-purpose investment projects and decisions on development conditions. Additionally, the flood risk management system is undergoing constant legal and structural change, which does not allow its efficiency to be properly assessed.
A very important issue is the question of educating society about this type of phenomena. In addition to the existing recommendations in the legal system, it is necessary to make the inhabitants of areas at risk of flash floods aware of the possibility of such phenomena, even if they are not located in the valleys of large rivers.
Author Contributions
Conceptualization, W.Z., B.B.-Z. and D.G.; methodology, W.Z., D.G. and B.B.-Z.; investigation, D.G. and B.B.-Z.; writing—original draft preparation, W.Z. and B.B.-Z.; writing—review and editing, W.Z. and B.B.-Z.; visualization, W.Z. All authors have read and agreed to the published version of the manuscript.
Funding
This research received no external funding.
Institutional Review Board Statement
Not applicable.
Informed Consent Statement
Not applicable.
Data Availability Statement
All sources of the publicly available datasets are provide in the text as references.
Acknowledgments
The authors wish to thank the Editors and anonymous reviewers for their valuable comments and suggestions to improve the quality of this paper.
Conflicts of Interest
The authors declare no conflict of interest.
References
- Gaume, E.; Bain, V.; Bernardara, P.; Newinger, O.; Barbuc, M.; Bateman, A.; Blaškovičova, L.; Blöschl, G.; Borga, M.; Dumitrescu, A.; et al. A compilation of data on European flash floods. J. Hydrol. 2009, 367, 70–78. [Google Scholar] [CrossRef] [Green Version]
- Marchi, L.; Borga, M.; Preciso, E.; Gaume, E. Characterization of selected extreme flash floods in Europe and implications for flood risk management. J. Hydrol. 2010, 394, 118–133. [Google Scholar] [CrossRef]
- Borga, M.; Anagnostou, E.N.; Blöschl, G.; Creutin, J.D. Flash flood forecasting, warning and risk management: The HYDRATE project. Environ. Sci. Policy 2011, 14, 834–844. [Google Scholar] [CrossRef]
- Lumbroso, D.; Gaume, E. Reducing the uncertainty in indirect estimates of extreme flash flood discharges. J. Hydrol. 2012, 414–415, 16–30. [Google Scholar] [CrossRef] [Green Version]
- Gourley, J.J.; Hong, Y.; Flamig, Z.L.; Arthur, A.; Clark, R.; Calianno, M.; Ruin, I.; Ortel, T.; Wieczorek, M.E.; Kirstetter, P.-E.; et al. A unified flash flood database across the United States. Bull. Am. Meteorol. Soc. 2013, 94, 799–805. [Google Scholar] [CrossRef] [Green Version]
- Ma, M.; He, B.; Wan, J.; Jia, P.; Guo, X.; Gao, L.; Maguire, L.W.; Hong, Y. Characterizing the Flash Flooding Risks from 2011 to 2016 over China. Water 2018, 10, 704. [Google Scholar] [CrossRef] [Green Version]
- Bryndal, T. Powodzie błyskawiczne w małych zlewniach karpackich—Wybrane aspekty zarządzania ryzykiem powodziowym. Ann. Univ. Paedagog. Crac. Studia Geogr. 2014, 170, 69–80. [Google Scholar]
- Pociask-Karteczka, J.; Żychowski, J.; Bryndal, T. Zagrożenia związane z wodą—Powodzie błyskawiczne. Gospod. Wodna 2017, 2, 37–42. [Google Scholar]
- Ostrowski, J.; Czarnecka, H.; Glowacka, B.; Krupa-Marchlewska, J.; Zaniewska, M.; Sasim, M.; Moskwicki, T.; Dobrowolski, A. Nagłe powodzie lokalne (flash flood) w Polsce i skala ich zagrożeń. In Wpływ Zmian Klimatu na Środowisko, Gospodarkę i Społeczeństwo. Tom 3, Klęski Żywiołowe a Bezpieczeństwo Wewnętrzne Kraju; Lorenc, H., Ed.; Wydawnictwo IMGW-PIB: Warszawa, Poland, 2012; pp. 123–149. [Google Scholar]
- Parczewski, J. Warunki występowania gwałtownych wezbrań na małych ciekach. Wiadomości Służby Hydrol. Meteorol. 1960, 8, 1–159. [Google Scholar]
- Gaume, E.; Borga, M. Post-flood field investigations in upland catchments after major flash floods: Proposal of a methodology and illustrations. J. Flood Risk Manag. 2008, 1, 175–189. [Google Scholar] [CrossRef]
- Barredo, J.I. Major flood disasters in Europe: 1950–2005. Nat. Hazards 2007, 42, 125–148. [Google Scholar] [CrossRef]
- Christensen, J.H.; Christensen, O.B. Climate modelling: Severe summertime flooding in Europe. Nature 2003, 421, 805–806. [Google Scholar] [CrossRef]
- Anagnostopoulos, G.G.; Koutsoyiannis, D.; Christofides, A.; Efstratiadis, A.; Mamassis, N. A comparison of local and aggregated climate model outputs with observed data. Hydrol. Sci. J. 2010, 55, 1094–1110. [Google Scholar] [CrossRef]
- Kundzewicz, Z.W.; Stakhiv, E.Z. Are climate models “ready for prime time” in water resources management applications, or is more research needed? Hydrol. Sci. J. 2010, 55, 1085–1089. [Google Scholar] [CrossRef]
- Rodzik, J.; Janicki, G.; Zagórski, P.; Zgłobicki, W. Deszcze nawalne na Wyżynie Lubelskiej i ich wpływ na rzeźbę obszarów lessowych. Dok. Geogr. 1998, 11, 45–68. [Google Scholar]
- Rodzik, J.; Janicki, G. Local downpours and their erosion effects. Glob. Chang. 2003, 10, 49–66. [Google Scholar]
- Bryndal, T. Local flash floods in Central Europe: A case study of Poland. Nor. Geogr. Tidsskr. Nor. J. Geogr. 2015, 69, 288–298. [Google Scholar] [CrossRef]
- Mertz, R.; Blöschl, G. A process typology of regional floods. Water Resour. Res. 2003, 39, 1340. [Google Scholar]
- Weingartner, R.; Barben, M.; Spreafico, M. Floods in mountain areas—An overview based on examples from Switzerland. J. Hydrol. 2003, 282, 10–24. [Google Scholar] [CrossRef]
- Creutin, J.D.; Borga, M. Radar hydrology modifies the monitoring of flashflood hazard. Hydrol. Process. 2003, 17, 1453–1456. [Google Scholar] [CrossRef]
- Bryndal, T. Identyfikacja małych zlewni podatnych na formowanie gwałtownych wezbrań (na przykładzie Pogórza Dynowskiego, Strzyżowskiego i Przemyskiego. Przegląd Geogr. 2011, 83, 27–49. [Google Scholar] [CrossRef] [Green Version]
- Ziemnicki, S. Skutki deszczu nawalnego we wsi Piaski Szlacheckie pod Krasnymstawem. Gospod. Wodna 1956, 11, 476–480. [Google Scholar]
- Gil, E. Spływ wody i procesy geomorfologiczne w zlewniach fliszowych podczas gwałtownej ulewy w Szymbarku w dniu 7 czerwca 1985 roku. Dok. Geogr. 1998, 11, 85–107. [Google Scholar]
- Bryndal, T.; Cabaj, W.; Ciupa, T. Gwałtowne wezbrania małych cieków w Niecce Nidziańskiej. Przegląd Geogr. 2008, 80, 127–146. [Google Scholar]
- Abdelkareem, M. Targeting flash flood potential areas using remotely sensed data and GIS techniques. Nat. Hazards 2017, 85, 19–37. [Google Scholar] [CrossRef]
- Costache, R.; Zaharia, L. Flash-flood potential assessment and mapping by integrating the weights-of-evidence and frequency ratio statistical methods in GIS environment—Case study: Bâsca Chiojdului River catchment (Romania). J. Earth Syst. Sci. 2017, 126, 59. [Google Scholar] [CrossRef]
- Liu, C.; Li, Y. GIS-based dynamic modelling and analysis of flash floods considering land-use planning. Int. J. Geogr. Inf. Sci. 2017, 31, 481–498. [Google Scholar] [CrossRef]
- Costache, R.; Pham, Q.B.; Sharifi, E.; Linh, N.T.T.; Abba, S.; Vojtek, M.; Vojteková, J.; Nhi, P.T.T.; Khoi, D.N. Flash-Flood Susceptibility Assessment Using Multi-Criteria Decision Making and Machine Learning Supported by Remote Sensing and GIS Techniques. Remote Sens. 2020, 12, 106. [Google Scholar] [CrossRef] [Green Version]
- Pham, B.T.; Avand, M.; Janizadeh, S.; Phong, T.V.; Al-Ansari, N.; Ho, L.S.; Das, S.; Le, H.V.; Amini, A.; Bozchaloei, S.K.; et al. GIS Based Hybrid Computational Approaches for Flash Flood Susceptibility Assessment. Water 2020, 12, 683. [Google Scholar] [CrossRef] [Green Version]
- Elkhrachy, I. Flash Flood Hazard Mapping Using Satellite Images and GIS Tools: A case study of Najran City, Kingdom of Saudi Arabia (KSA). Egypt. J. Remote Sens. Space Sci. 2015, 18, 261–278. [Google Scholar] [CrossRef] [Green Version]
- Xiong, J.; Li, J.; Cheng, W.; Wang, W.; Guo, L. A GIS-Based Support Vector Machine Model for Flash Flood Vulnerability Assessment and Mapping in China. ISPRS Int. J. Geo Inf. 2019, 8, 297. [Google Scholar] [CrossRef] [Green Version]
- Lyu, H.-M.; Shen, S.-L.; Zhou, A.; Yang, J. Perspectives for flood risk assessment and management for mega-city metro system. Tunn. Undergr. Space Technol. 2019, 84, 31–44. [Google Scholar] [CrossRef]
- Lyu, H.-M.; Zhou, W.-H.; Shen, S.-L.; Zhou, A.-N. Inundation risk assessment of metro system using AHP and TFN-AHP in Shenzhen. Sustain. Cities Soc. 2020, 56, 202103. [Google Scholar] [CrossRef]
- Wilson, E. Adapting to Climate Change at the Local Level: The Spatial Planning Response. Local Environ. 2006, 11, 609–625. [Google Scholar] [CrossRef]
- Onur, A.Z.; Tezer, A. Ecosystem services based spatial planning decision making for adaptation to climate changes. Habitat Int. 2015, 47, 267–278. [Google Scholar] [CrossRef]
- Franczak, P.; Listwan-Franczak, K.; Działek, J.; Biernacki, W. Planowanie przestrzenne na obszarach zalewowych w zlewniach górskich różnego rzędu w dorzeczu górnej Wisły oraz górnej i środkowej Odry. Prace Studia Geogr. 2016, 61, 25–45. [Google Scholar]
- Rannow, S.; Loibl, W.; Greiving, S.; Gruehn, D.; Meyer, B.C. Potential impacts of climate change in Germany—Identifying regional priorities for adaptation activities in spatial planning. Landsc. Urban Plan. 2010, 98, 30. [Google Scholar] [CrossRef]
- Greiving, S.; Fleischhauer, M. National Climate Change Adaptation Strategies of European States from a Spatial Planning and Development Perspective. Eur. Plan. Stud. 2012, 20, 27–48. [Google Scholar] [CrossRef]
- Neuvel, J.M.M. Geographical Dimensions of Risk Management. In The Contribution of Spatial Planning and Geo-ICT to Risk Reduction; Thesis Wageningen University: Wageningen, The Netherlands, 2009. [Google Scholar]
- Ran, J.; Nedovic-Budic, Z. Integrating spatial planning and flood risk management: A new conceptual framework for the spatially integrated policy infrastructure. Comput. Environ. Urban Syst. 2016, 57, 68–79. [Google Scholar] [CrossRef] [Green Version]
- Gralepois, M. What Can We Learn from Planning Instruments in Flood Prevention? Comparative Illustration to Highlight the Challenges of Governance in Europe. Water 2020, 12, 1841. [Google Scholar] [CrossRef]
- Sapountzaki, K.; Wanczura, S.; Casertano, G.; Greiving, S.; Xanthopoulos, G.; Ferrara, F.F. Disconnected policies and actors and the missing role of spatial throughout the risk management cycle. Nat. Hazards 2011, 59, 1445–1474. [Google Scholar] [CrossRef]
- Biernacki, W.; Bokwa, A.; Dziadek, J.; Padło, T. Społeczności Lokalne Wobec Zagrożeń Przyrodniczych i Klęsk Żywiołowych; Wyd. UJ: Kraków, Poland, 2009. [Google Scholar]
- Śleszyński, P.; Kowalewski, A.; Markowski, T.; Kobus-Legutko, P.; Nowak, M. The Contemporary Economic Costs of Spatial Chaos: Evidence from Poland. Land 2020, 9, 214. [Google Scholar] [CrossRef]
- Uziak, S.; Turski, R. (Eds.) Środowisko Przyrodnicze Lubelszczyzny; Lubelskie Towarzystwo Naukowe: Lublin, Poland, 2009. [Google Scholar]
- Bański, J. Rozwój Obszarów Wiejskich; PWE: Warszawa, Poland, 2017. [Google Scholar]
- Zgłobicki, W.; Karczmarczuk, K.; Baran-Zgłobicka, B. Intensity and Driving Forces of Land Abandonment in Eastern Poland. Appl. Sci. 2020, 10, 3500. [Google Scholar]
- Ustawa z dnia 18 kwietnia 2002 r. o stanie klęski żywiołowej. Dziennik Ustaw 62/2002 poz. 558 (tekst jednolity Dz. U. 2017 poz. 1897). Issued by Prime Minister of Republic of Poland. 2002. Available online: http://isap.sejm.gov.pl/isap.nsf/DocDetails.xsp?id=wdu20020620558 (accessed on 20 December 2020).
- Ustawa z dnia 8 marca 1990 r. o samorządzie gminnym. Dziennik Ustaw 16/1999 poz. 95 (tekst jednolity Dz. U. 2020, poz. 713). Issued by Prime Minister of Republic of Poland. 1990. Available online: https://isap.sejm.gov.pl/isap.nsf/DocDetails.xsp?id=WDU19900160095 (accessed on 20 December 2020).
- Ustawa z dnia 26 kwietnia 2007 r. o zarządzaniu kryzysowym. Dziennik Ustaw 89/2007 poz. 590 (tekst jednolity Dz. U. 2020 poz. 1856). Issued by Prime Minister of Republic of Poland. 2007. Available online: https://isap.sejm.gov.pl/isap.nsf/DocDetails.xsp?id=WDU20070890590 (accessed on 20 December 2020).
- Poskrobko, B.; Poskrobko, T. Zarządzanie Środowiskiem w Polsce; PWE: Warszawa, Poland, 2012. [Google Scholar]
- Wróblewski, D. (Ed.) Zagadnienia Ogólne z Zakresu Zarządzania Ryzykiem i Zarządzania Kryzysowego; Analiza wybranych przepisów; Wyd. CNBOP-PIB: Józefów, Poland, 2014. [Google Scholar]
- Wróblewski, D. (Ed.) Zarządzanie Ryzykiem. Przegląd Wybranych Metodyk; Wyd. CNBOP-PIB: Józefów, Poland, 2018. [Google Scholar]
- Ustawa z dnia 27 Marca 2003 r. o Planowaniu i Zagospodarowaniu Przestrzennym; Dziennik Ustaw 84/2001 poz. (tekst jednolity Dz. U. 2020 poz. 293). Issued by Prime Minister of Republic of Poland. 2003. Available online: https://isap.sejm.gov.pl/isap.nsf/DocDetails.xsp?id=WDU20030800717 (accessed on 20 December 2020).
- Nowak, M.J. Decyzje o Warunkach Zabudowy i Zagospodarowania Terenu w Gospodarowaniu i Zarządzaniu Przestrzenią; CeDeWu: Warszawa, Poland, 2012. [Google Scholar]
- Nowak, M.J. Planowanie i Zagospodarowanie Przestrzenne: Komentarz Do Ustawy i Przepisów Powiązanych; Wydawnictwo C.H. Beck: Warszawa, Poland, 2019. [Google Scholar]
- Dyrektywa 2007/60/WE Parlamentu Europejskiego i Rady z dnia 23 października 2007 r. w sprawie oceny ryzyka powodziowego i zarządzania nim. Publisher: Dziennik Urzędowy Unii Europejskiej, L. 228 z 06.11.2007 r. Available online: https://eur-lex.europa.eu/legal-content/PL/TXT/PDF/?uri=OJ:L:2007:288:FULL&from=FI (accessed on 20 December 2020).
- Ustawa z dnia 17 lipca 2017 r. Prawo wodne. Dziennik Ustaw 2017 poz. 1566 (tekst jednolity Dz. U. 2020 poz. 310). Issued by Prime Minister of Republic of Poland. 2017. Available online: https://isap.sejm.gov.pl/isap.nsf/DocDetails.xsp?id=WDU20170001566 (accessed on 20 December 2020).
- Głosińska, E. Spatial planning in floodplains for implementation by the floods directive in Poland. Geogr. Pol. 2014, 87, 127–142. [Google Scholar] [CrossRef] [Green Version]
- Dutkowiak, I. Prawo Wodne w Procesie Inwestycyjnym; Presscom: Wrocław, Poland, 2018. [Google Scholar]
- Rakoczy, B. Prawo Wodne. Praktyczny Przewodnik; Wolters Kluwer: Warszawa, Poland, 2018. [Google Scholar]
- IT System for the Protection of the Country against Extreme Hazards. Available online: https://wody.isok.gov.pl/imap_kzgw/?gpmap=gpMZP (accessed on 20 December 2020).
- Ustawa z dnia 18 lipca 2001 r. Prawo wodne. Dziennik Ustaww 115/2001 poz. 1229 (Dz. 2015 poz. 2295, tekst jednolity 2017 poz. 1121). Issued by Prime Minister of the Republic of Poland. 2001. Available online: https://isap.sejm.gov.pl/isap.nsf/DocDetails.xsp?id=WDU20011151229 (accessed on 20 December 2020).
- Boardman, J.; Vandaele, K.; Evans, R.; Foster, I.D.L. Off-site impacts of soil erosion and runoff: Why connectivity is more important than erosion rates. Soil Use Manag. 2019, 35, 245–256. [Google Scholar] [CrossRef] [Green Version]
- USGS Earth Explorer. Available online: https://earthexplorer.usgs.gov/ (accessed on 20 December 2020).
- GUGiK. Available online: http://www.gugik.gov.pl/pzgik (accessed on 20 December 2020).
- Copernicus Land Monitoring Service. Available online: https://land.copernicus.eu/pan-european/corine-land-cover/clc2018 (accessed on 12 December 2020).
- OpenStreetMap. Available online: https://www.openstreetmap.org/ (accessed on 20 December 2020).
- Meng, M.; Dabrowski, M.; Stead, D. Enhancing Flood Resilience and Climate Adaptation: The State of the Art and New Directions for Spatial Planning. Sustainability 2020, 12, 7864. [Google Scholar] [CrossRef]
- Neuvel, J.M.M.; Van Den Brink, A. Flood risk management in Dutch local spatial planning practices. J. Environ. Plan. Manag. 2009, 52, 865–880. [Google Scholar] [CrossRef]
- Kron, W. Flood Risk = Hazard. Values. Vulnerability. Water Int. 2005, 30, 58–68. [Google Scholar] [CrossRef]
- Martins, B.; Nunes, A.; Lourenço, L.; Velez-Castro, F. Flash Flood Risk Perception by the Population of Mindelo, S. Vicente (Cape Verde). Water 2019, 11, 1895. [Google Scholar] [CrossRef] [Green Version]
- Konieczny, R.; Siudak, M.; Bogdańska-Warmuz, M.; Madej, P.; Walczykiewicz, T. Opracowanie systemu zapobiegania i sposoby ograniczenia skutków powodzi oraz zasad funkcjonowania systemu ostrzeżeń. In Wpływ Zmian Klimatu na Środowisko, Gospodarkę i Społeczeństwo. Tom 3, Klęski Żywiołowe a Bezpieczeństwo Wewnętrzne Kraju; Lorenc, W.H., Ed.; Wydawnictwo IMGW-PIB: Warszawa, Poland, 2012; pp. 281–303. [Google Scholar]
- Acosta-Coll, M.; Ballester-Merelo, F.; Martinez-Peiró, M.; De la Hoz-Franco, E. Real-Time Early Warning System Design for Pluvial Flash Floods—A Review. Sensors 2018, 18, 2255. [Google Scholar] [CrossRef] [Green Version]
Figure 1.
Effects of a flash flood in Fajsławice municipality (June 2016) (source http://www.krasnostawska.pl/siedliska-znowu-pod-woda/; accessed on 20 December 2020).
Figure 1.
Effects of a flash flood in Fajsławice municipality (June 2016) (source http://www.krasnostawska.pl/siedliska-znowu-pod-woda/; accessed on 20 December 2020).

Figure 2.
Location and topography of the Lublin Upland; 1—the main rivers, 2—boundary of the Lublin Upland.
Figure 2.
Location and topography of the Lublin Upland; 1—the main rivers, 2—boundary of the Lublin Upland.

Figure 3.
Scheme of research procedure.

Figure 4.
Assessment of susceptibility of catchments to the occurrence of flash floods. (A)—catchment area (km2), 1: <5, 2: 5–9, 3: 10–19, 4: 20–29, 5: 30–59, 6: >60; (B)—circularity index, 1: 0.3, 2: 0.3–0.39, 3: 0.4–0.49, 4: 0.5– 0.59, 5: 0.6–0.7, 6: >0.7; (C)—mean gradient in catchment (°), 1: <1.75, 2: 1.75 –1.9, 3: 2–2.4, 4: 2.5–2.9, 5: 3–3.5, 6: >3.5; (D)—density of river network (km·km−2), 1: <0.15, 2: 0.15–0.19, 3: 0.2–0.29, 4: 0.3–0.49, 5: 0.5–0.59, 6: >0.6; (E)—mean length of first-order watercourses (km), 1: >10, 2: 7.5–9.9, 3: 5.0–7.4, 4: 2.5–4.9, 5: 1–2.4, 6< 1; (F)—forest cover (%), 1: 0, 2: 0.1–5, 3: 5–9, 4: 10–19, 5: 20–39, 6: >40; (G)—built-up area (%),1: 0, 2: 0.1–1.9, 3: 2–4.9, 4: 5–19.9, 5: 20–40, 6: > 40 and (H)—road density (km·km−2), 1: <0.5 2: 0.5–1.4, 3: 1.5–2.9, 4: 3–4.9, 5: 5–10, 6>10; 7—main towns, 8—main rivers.

Figure 5.
Synthetic assessment of susceptibility of catchments in the Lublin Upland to the occurrence of flash floods. 1—Susceptibility class I, 2—Susceptibility class II, 3—Susceptibility class III, 4—Susceptibility class IV, 5—main towns, 6—main rivers, 7—major flash floods (1960–2020).
Figure 5.
Synthetic assessment of susceptibility of catchments in the Lublin Upland to the occurrence of flash floods. 1—Susceptibility class I, 2—Susceptibility class II, 3—Susceptibility class III, 4—Susceptibility class IV, 5—main towns, 6—main rivers, 7—major flash floods (1960–2020).

Figure 6.
Effects of a flash flood in the valley of the Sanna River in Modliborzyce municipality (June 2019) (source: https://modliborzyce.pl/2312-miesiąc-po-powodzi-cz-1.html, accessed on 20 December 2020).
Figure 6.
Effects of a flash flood in the valley of the Sanna River in Modliborzyce municipality (June 2019) (source: https://modliborzyce.pl/2312-miesiąc-po-powodzi-cz-1.html, accessed on 20 December 2020).


Table 1.
Criteria of susceptibility assessment of catchments to flash floods.
| Score | Catchment Area (km2) | Circularity Index | Mean Catchment Gradient | Density of River Network (km·km−2) | Mean Length of First-Order Watercourses (km) | Forest Cover (%) | Built-Up Area (%) | Density of Road Network (km·km−2) |
|---|---|---|---|---|---|---|---|---|
| 1 | >60 | >0.7 | <1.75° | <0.15 | >10 | >40 | <0.1 | <0.5 |
| 2 | 30–59 | 0.6–0.7 | 1.75–1.9° | 0.15–0.19 | 7.5–9.9 | 20–39 | 0.2–1.9 | 0.5–1.4 |
| 3 | 20–29 | 0.5–0.59 | 2–2.4° | 0.2–0.29 | 5.0–7.4 | 10–19 | 2–4.9 | 1.5–2.9 |
| 4 | 10–19 | 0.4–0.49 | 2.5–2.9° | 0.3–0.49 | 2.5–4.9 | 5–9 | 5–19.9 | 3–4.9 |
| 5 | 5–9 | 0.3–0.39 | 3–3.5° | 0.5–0.59 | 1–2.4 | 0.2–5 | 20–40 | 5–10 |
| 6 | <5 | <0.3 | >3.5° | >0.6 | < 1 | <0.2 | >40 | >10 |
| Weight | 1.5 | 0.8 | 2 | 0.8 | 1 | 2 | 0.8 | 1.5 |
Table 2.
The parameters of the studied catchments (369 in total).
| Parameter | Mean | Standard Deviation | Minimum | Maximum |
|---|---|---|---|---|
| Catchment area (km2) | 19.2 | 16.7 | 0.1 | 98.3 |
| Mean catchment gradient (o) | 2.53 | 0.74 | 1.27 | 5.88 |
| Forest cover (%) | 14.1 | 14.2 | 0.0 | 81.2 |
| Circularity index | 0.506 | 0.10 | 0.209 | 0.803 |
| Density of river network (km·km−2) | 0.28 | 0.16 | 0.1 | 0.89 |
| Mean length of first-order watercourses (km) | 3.13 | 2.33 | 0.8 | 17.4 |
| Built-up area (%) | 6.54 | 11.6 | 0 | 99.8 |
| Density of road network (km·km−2) | 1.86 | 6.11 | 0.1 | 16.5 |
Table 3.
Quantitative differences of catchments with different degrees of susceptibility.
| Class | Number of Catchments | Area (km2) | Proportion of Area (%) |
|---|---|---|---|
| I | 44 | 1250.82 | 17.3 |
| II | 165 | 3654.68 | 50.7 |
| III | 129 | 1972.14 | 27.3 |
| IV | 31 | 231.79 | 3.2 |
Table 4.
Correlation coefficients between catchment susceptibility and catchment parameters.
| Parameter | Correlation Coefficient |
|---|---|
| Catchment area | −0.382 |
| Mean catchment gradient | 0.218 |
| Forest cover | −0.459 |
| Built-up areas | 0.405 |
| Circularity index | −0.020 |
| Density of river network | 0.232 |
| Density of road network | 0.063 |
| Mean length of first-order watercourses | 0.276 |
Table 5.
Selected characteristics of municipalities with high flash flood risk (>50% of the area in class III and IV).
Table 5.
Selected characteristics of municipalities with high flash flood risk (>50% of the area in class III and IV).
| Municipalities | |||||||||||||
|---|---|---|---|---|---|---|---|---|---|---|---|---|---|
| Selected Features | Lublin | Zamość | Fajsławice | Głusk | Grabowiec | Jastków | Konopnica | Rudnik | Skierbieszów | Strzyżewice | Trzeszczany | Uchanie | Żółkiewka |
| City | Rural Municipality | ||||||||||||
| Area of the unit (km2) | 147 | 30 | 71 | 64 | 128 | 113 | 93 | 89 | 139 | 109 | 90 | 121 | 130 |
| Population density (persons/km2) | 2303 | 2103 | 65 | 174 | 31 | 124 | 149 | 34 | 37 | 74 | 46 | 38 | 42 |
| Forest cover (%) | 11.4 | 1.6 | 4.0 | 7.7 | 10.3 | 4.9 | 5.9 | 9.2 | 19.9 | 15.9 | 13.5 | 15.5 | 8.7 |
| Agricultural land (%) * | 36.8 | 47.1 | 92.3 | 85.9 | 86.8 | 88.5 | 88.8 | 88.1 | 76.1 | 81.2 | 83.1 | 81.4 | 88.7 |
| Arable land (%) * | 31.1 | 29.7 | 84.8 | 79.8 | 72.3 | 75.0 | 73.4 | 76.9 | 61.5 | 71.0 | 68.6 | 67.2 | 80.7 |
| Built-up and urbanized land (%) ** | 45.9 | 49.3 | 2.8 | 5.1 | 2.5 | 4.5 | 4.7 | 1.9 | 3.4 | 2.7 | 8.1 | 2.4 | 2.1 |
| Spatial Planning Documents | |||||||||||||
| Existing Spatial Development Plans | |||||||||||||
| Local plans (in total) (number) | 94 | 1 | 1 | 16 | 5 | 25 | 7 | 2 | 4 | 1 | 6 | 2 | 1 |
| Area covered by local plans (%) | 53.7 | 100 | 100 | 7.6 | 100 | 94.9 | 24.2 | 99.9 | 6.3 | 100 | 99.9 | 2.8 | 12.5 |
| Decisions on building conditions and land development issued in 2009–2018 | |||||||||||||
| On determining the location of a public purpose investment | 1759 | 0 | 0 | - | 0 | 60 | 0 | 0 | 38 | 0 | 0 | 33 | 15 |
| Concerning building conditions (in total) | 7588 | 0 | 0 | - | 0 | 53 | 3292 | 1 | 123 | 0 | 0 | 212 | 66 |
| Concerning multi-family housing | 651 | 0 | 0 | - | 0 | 0 | 2 | 0 | 0 | 0 | 0 | 13 | 0 |
| Concerning single-family housing | 3241 | 0 | 0 | - | 0 | 44 | 2085 | 1 | 70 | 0 | 0 | 97 | 22 |
| Concerning service buildings | 1584 | 0 | 0 | - | 0 | 2 | 107 | 0 | 1 | 0 | 0 | 14 | 1 |
| Concerning other buildings | 2112 | 0 | 0 | - | 0 | 7 | 1098 | 0 | 52 | 0 | 0 | 88 | 43 |
Source: own study based on the Local Data Bank of the Central Statistical Office of Poland (2019), * according to the 2010 Agricultural Census, ** data from 2014, “-” no data.
Table 6.
Provisions of planning documents vs. flood hazard in municipalities (>50% of the area in class III and IV).
Table 6.
Provisions of planning documents vs. flood hazard in municipalities (>50% of the area in class III and IV).
| Municipality | Area Occupied by the III and IV Susceptibility Class (%) | Flash Floods (FF) Risk (Results of the Study) Flood Hazard Flood Hazard Maps (FHM), Flood Risk Maps (FRM) | Planning Documents | |
|---|---|---|---|---|
| Lublin | 85.9 | Within the city limits there is a large share of FF risk areas, the highest degree of susceptibility (class IV) covers the catchments of river valleys. Most of the city within the FHM and FRM sheets, small areas are within the water range of Q1% and Q0.2% | The study (2019) delineates the main areas of flood occurrence in river valleys; recommendations for risk areas, the exclusion of buildings in local plans; indicates that flooding may occur locally as a result of torrential rain or thaw (in river valleys and dry valleys). | Local plans (2002, 2005) regulate the problems of flood risk to a small extent. Local plans (2014, 2016, 2018, 2019) indicate areas at risk of flooding with a water range of 1% and 0.2% and at risk of flooding in the event of a dam or flood embankment breakage. |
| Zamość | 58.2 | More than half of the city is located in an area of significant FF threat The area entirely within the FHM and FRM sheets, which include river valleys, individual buildings are within Q1% and Q0.2% of water range. | The study (2019) indicates the development of flood protection infrastructure in river valleys, increasing retention and excluding buildings; does not designate areas of particular flood risk. | The local plan (2006) for the entire city does not define the boundaries and ways of management and development of flood-prone areas. |
| Fajsławice | 85.1 | Most of the catchment area in the commune is susceptible (class III) to FF. A small fragment of the area is within the FHM and FRM, but apart from the flood risk of 1% and 0.2% | The study (2015) allows for the construction of hydrotechnical structures for water retention or flood protection. | Changes to the local plan (2006, 2014, 2018) do not define the range of flood-prone areas due to the lack of occurrence. |
| Głusk | 78.3 | Most of the catchment area in the municipality is susceptible (class III) to FF. River valleys partly within FHM and FRM. | The study (2018) indicates the risk of rainfall and snowmelt floods; defines the boundaries of flood risk areas; excludes from development areas at risk of flooding with water reach of 10%, 1% and 0.2%. | The local plan (1999) for the entire municipality does not indicate the risk of flooding. Changes to the plans (2005, 2006), covering fragments of river valleys, do not indicate a flood risk. |
| Grabowiec | 52.1 | More than half of the area is catchment areas susceptible to FF (mainly class III) Fragments of river valleys within the FHM and FRM sheets. | The study (2013) shows that there are no flood risk areas in the municipality. | The local plan (2002) and its changes (2009, 2015) do not define the issues related to flood risk. |
| Jastków | 91.5 | Most of the catchments are susceptible (class III) to FF, very susceptible (class IV) are in the S-E part. Partly river valleys within the FHM and FRM sheets, but outside the flood risk of 1% and 0.2%. | The study (2015) prohibits the location of new buildings in river valleys in flood risk areas; sets out the rules of development within plots bordering on riverbanks. | The local plan (2002) does not specify the flood risk. Changes to the local plan apply to small areas and do not include flood risk areas. |
| Konopnica | 67.4 | There is a large area of catchments susceptible (class III) and very susceptible (class IV) to FF. Small parts of the area within the FHM and FRM sheets, but outside the flood risk of 1% and 0.2%. | The study (2010) sets the water range of 1% (coincides with the boundaries of the river valley bottoms) and the general principles of management. | The local plan (2002) does not specify the flood risk. |
| Rudnik | 81.5 | Most of the catchments in the municipality are susceptible (III) to FF. Only N part located within FHM and FRM, but outside the flood hazard area 1% and 0.2%. | The study (2019) identifies the areas of flood risk and inundation related to ground and water conditions as well as snowmelt and torrential rainfall; | Local plan (2004) unavailable, its content has not been analyzed. The change of the plan (2010) indicates that there is no flood risk in the area covered by the plan. |
| Skierbieszów | 61.8 | A large proportion of catchments susceptible to FF (mainly class III). Area within the FHM and FRM sheets, buildings beyond the range of Q1% water, while at Q0.2% individual properties at risk of flooding. | Study (2002)—no information on flood risk; indicates the areas for the location of retention reservoirs. | The local plan (2006), in the area of direct flood risk, prohibits the location of buildings and construction of buildings. |
| Strzyżewice | 59.6 | There is a large share of FF susceptible catchments (only class III). Most of the area within the FHM and FRM sheets, individual properties within Q1% water and a few farms at Q0.2%. | The study (2010) indicates areas exposed to flooding—mainly river valleys, including areas within 1% of water reach; determines the location of buildings outside the flood hazard areas. | The local plan (2003) indicates the river valley bottoms as potential flood areas. The change of the plan (2011) designates the areas at risk of flooding with a water range of 1%. |
| Trzeszczany | 66.1 | The western part of the area—catchments in susceptibility class III and IV. | Study (1999)—document unavailable, not analyzed. | The local plan (2003) does not specify the risks associated with flooding. Amendments to the plan (2009, 2013, 2015) establish that there are no flood-prone areas. |
| Only the middle-eastern part within the boundaries of the FHM and FRM sheets, but outside the flood risk of 1% and 0.2%. | ||||
| Uchanie | 53.9 | Main river valley catchment areas endangered by FF (class III and IV). | The study (2017) shows that municipality is only exposed to spring snowmelt or rain flooding. | The local plan (2007) concerns the areas to be afforested, and the second (2017) the location of the pipeline, in both there is no reference to flood risk. |
| The western part within the FHM and FRM sheets, but outside the flood risk of 1% and 0.2%. | ||||
| Żółkiewka | 50.0 | Half of the area is covered by catchments susceptible to FF (class III). Most of the area within the FHM and FRM sheets, but outside the flood risk of 1% and 0.2%. | The study (2012) indicates a high water range area with a probability of 1% and 0.5%; determines the location of buildings outside the flood hazard areas. | The local plan (2006), in the area of direct flood risk, prohibits the location of buildings and construction of buildings. |
Source: own study based data available at https://wody.isok.gov.pl/imap_kzgw/?gpmap=gpFHM (accessed on 20 December 2020) and planning documents available on the websites of municipal offices (documents were analyzed with areas potentially at risk of flooding).
Publisher’s Note: MDPI stays neutral with regard to jurisdictional claims in published maps and institutional affiliations. |
© 2021 by the authors. Licensee MDPI, Basel, Switzerland. This article is an open access article distributed under the terms and conditions of the Creative Commons Attribution (CC BY) license (http://creativecommons.org/licenses/by/4.0/).
Share and Cite
MDPI and ACS Style
Baran-Zgłobicka, B.; Godziszewska, D.; Zgłobicki, W. The Flash Floods Risk in the Local Spatial Planning (Case Study: Lublin Upland, E Poland). Resources 2021, 10, 14. https://0-doi-org.brum.beds.ac.uk/10.3390/resources10020014
AMA Style
Baran-Zgłobicka B, Godziszewska D, Zgłobicki W. The Flash Floods Risk in the Local Spatial Planning (Case Study: Lublin Upland, E Poland). Resources. 2021; 10(2):14. https://0-doi-org.brum.beds.ac.uk/10.3390/resources10020014
Chicago/Turabian StyleBaran-Zgłobicka, Bogusława, Dominika Godziszewska, and Wojciech Zgłobicki. 2021. "The Flash Floods Risk in the Local Spatial Planning (Case Study: Lublin Upland, E Poland)" Resources 10, no. 2: 14. https://0-doi-org.brum.beds.ac.uk/10.3390/resources10020014
Note that from the first issue of 2016, this journal uses article numbers instead of page numbers. See further details here.