Article

Risk-Based Methodology for Determining Priority Directions for Improving Occupational Safety in the Mining Industry of the Arctic Zone

by
Semyon Gendler
and
Elizaveta Prokhorova
*
Department of Industrial Safety, Saint Petersburg Mining University, 2, 21st Line, 199106 St. Petersburg, Russia
*
Author to whom correspondence should be addressed.
Submission received: 18 December 2020 / Revised: 3 February 2021 / Accepted: 24 February 2021 / Published: 1 March 2021
(This article belongs to the Special Issue Resource Provision of the Sustainable Development under Global Shocks)

Abstract

:
Over the past 10 years, the mining industry of Russia has seen a greater than three-fold decrease in injury rates, thanks to the successful implementation of innovative labor safety technologies. Despite this, injury levels remain unacceptably high compared to the leading mining countries, which results in increased mining costs. For the mining areas of the Arctic Zone—unlike other regions located in areas with a more favorable climate—the injury rates are influenced not only by the underground labor conditions, but also by the adverse environmental factors. For the Russian Arctic zone, the overall injury risk is proposed to be calculated as the combined impact of occupational and background risk. In this article, we have performed correlation analysis of the overall injury risks in regions of the Arctic zone and regions with favorable climate conditions. Using the Kirov branch of “Apatit”, Joint-stock company (JSC) as an example, we have calculated the risks related specifically to occupational injury rates. We have constructed the relative injury risks and their changes over time and have developed a “basic injury rate matrix” that makes it possible to visualize the results of the comparative analysis of the injury rates on the company’s production sites and to determine priority avenues for improving the occupational safety and lowering the injury rates.

1. Introduction

Occupational safety remains a priority for a great number of countries. Successful solutions to issues of labor safety and measures aimed at reducing the occupational injury rates influence the production efficiency and the product’s cost effectiveness. Neglect or inattention towards labor safety can lead to not only technical and economic losses, but also to social ones [1].
Occupational safety issues are most relevant for the mining industry, in which the majority of production facilities are classified as hazardous. If we consider the occupational injury rate to be an indicator of occupational safety, calculated as the total number of injuries divided by the total number of workers, then the occupational risks for the mining industry would be 4–5 times higher than their average levels in other Russian industries.
Occupational injuries are even higher for the Arctic zone industries, where the miners are subject to polar stress syndrome and unfavorable environmental living conditions that result from the habitation zones being located next to the mining areas. Such conditions include low air temperatures, high precipitation, strong winds, polar nights, lack of ultraviolet radiation, comparatively high air and water pollution levels, and also excessive noise and vibration levels [2]. The polls of the Arctic zone inhabitants show interesting results. Two age groups of the Arctic zone inhabitants participated in the sociological survey, “youth”—whose age was between 25 and 44—as well as “the elderly”—those older than 60 years old. Regardless of age, during polar nights, 87% of the young people and 80% of the elderly reported feeling drowsy and depressed. Furthermore, 54% of the young people and 60% of the elderly participants reported high levels of stress, and 47% and 50% of them (respectively) reported feeling unwell. During the polar nights, 87% of young people and 80% of the elderly reportedly suffer from excessive agitation, which leads to insomnia. The low temperatures of the Arctic zone were difficult to tolerate for 60% of the young people and 80% of the elderly. Additionally, 20% of the young people and 50% of the elderly reportedly feel the changes in atmospheric pressure. Taken together, these negative environmental factors cause irreversible changes to people’s mental and physical conditions, which leads to increased injury risks compared to other regions of Russia.
These high injury risks inhibit exploration of the Arctic zone’s mineral deposits, which are strewn across an area of 3.1 million sq. km—18% of Russia’s total area [3].
As per the annex to the Decree of the President of Russian Federation No. 296 dated 2 May 2014, the land area of the Arctic zone includes: Murmansk region, Nenets Autonomous Area, Chukotka Autonomous District, Yamalo-Nenets Autonomous District, Komi Republic, Republic of Karelia, Sakha Republic (Yakutia), Krasnoyarsk Territory, Arkhangelsk Region, and the lands and islands located in the Arctic ocean as specified by the Decree of the Presidium of the Central Executive Committee of the USSR (dated 15 April 1926) “On declaring the lands and islands of the Arctic oceans the territories of the Union of Soviet Socialist Republics” and other USSR acts [4] (Figure 1).
The Arctic zone accounts for 90% of Russia’s nickel and cobalt production, 60% of copper, over 96% of platinum metals, and around 80% of natural gas and 60% of oil production (Figure 2). When it comes to reserves of hydrocarbons, the zone’s share becomes even larger. The Arctic shelf could be considered a strategic reserve for strengthening Russia’s resource security [4,5,6].
Efficient development of natural resources is impossible without proper labor safety standards having been implemented in mining enterprises, some of which incorporate multiple companies (i.e., vertically integrated companies).
Injury prevention and occupational disease and illness prevention have been the topic of many studies by Russian and foreign scientists [7,8,9,10]. Importantly, when it comes to risk assessment, Russian methodology involves the use of qualitative indices that characterize various risk types (personal risk, collective risk, economic risk, expected value of damages) [11].
In Finland, for instance, the Elmeri method of occupational safety assessment [12] has become widely used. This method allows for the determination of the likelihood of occurrence of conditions leading to injury or occupational diseases. It is based on observations on labor safety aspects, such as how orderly the workplaces are, how safe the machinery exploitation is, what personal protection equipment the workers use, how ergonomic the work processes are, and what the labor hygiene and sanitation practices are. All of these components are categorized into seven item groups: safety behavior, order and tidiness, machine safety, industrial hygiene, ergonomics, walkways, and first aid and fire safety. Each group is rated from “bad” to “good”. “Good” means the group meets the minimal legal requirements and is in line with positive safety practices of the company in question. The Elmeri index is calculated as a ratio of the “good” scores to the total number of item groups, and it ranges from 0 to 100. As such, a score of 60% indicates that a potential injury risk from non-compliance with the occupational safety standards equals 40%.
The Canadian Centre for Occupational Health and Safety (CCOHS) permits use of different methods for occupational safety assessment. The priority in each case is to select the most suitable method. The organization provides an approximate step-by-step guide for risk assessment [13,14]. Based on it, they have developed forms that make it possible to properly document procedures and decision-making processes. However, it must be noted that, despite the existence of a sizeable body of work (by both national and foreign scientists) related to the matter of occupational safety assessment, the issue of injury risk assessment with the subsequent selection of priority avenues for lowering the risk levels remains understudied.
The methods of risk assessment such as FMEA (Failure Mode and Effects Analysis), HAZOP (Hazard and operability studies), and FTA (Fault Tree Analysis) are used in the USA. The HAZOR method, for example, is a risk assessment procedure consisting of the process of detailing and identifying operational disturbances and malfunctions of the equipment as well as a process, a production unit or a system resulting in some undesirable consequences [15]. Similar risk assessment procedures are applied in countries such as Sweden and Norway [16].
A similar standard for determining the risk of occupational injuries was used in the research by Russian scientists [17]. These studies are based on correlation analysis of the assessment of occupational injury risks. However, they do not take the features of the Arctic zone of Russia into full consideration. The methodology proposed differs from the known ones as it considers the impact of the adverse environmental factors on the risk of injuries and also includes an additional indicator—the average risk of injuries for the period under consideration, allowing for a more complete description of the comparative dynamics of occupational injury risk rates.
The versatility of the proposed methodology for assessing the risk of occupational injuries and determining priority directions for its reduction makes it possible to extend this methodology for use in other mining enterprises located in different climates and characterized by various mining and engineering conditions.
However, it should be noted that despite a significant number of studies (by both domestic and foreign scientists) related to the issue of assessing labor safety for various industries, the problem of assessing the risk of injuries in the Arctic zone with the subsequent selection of priority areas for its reduction has not been fully studied.
The correlation analysis of published statistical data characterising occupational safety, both in the regions of the Arctic zone and in the specific company, as an example, the mining areas of the Kirov branch of “Apatit”, JSC is considered to be an advantage of the risk-based methodology proposed in the paper.
The fatal injury risk indicator has been used to conduct a comparative analysis of accidents in the industries of the countries located in areas with a climate similar to that of the Arctic zone of Russia (Figure 3) [18].
The data presented in the figure indicate that the highest fatal injury risk is evident for the Arctic zone of Russia, which stresses the importance of studying this issue, specifically for the Russian Federation.
However, the risk also remains high for other countries. As a result, the risk-based methodology for determining priority directions for reducing the occupational injury rate will be useful for other countries with a similar climate.
The present study owes its relevance to the existing need to decrease the occupational injury rates in the mining industry of Russia’s Arctic zone, which helps optimize investments in occupational safety.
The goal of the present study is to provide a risk-based approach for selecting priority directions for occupational injury risk prevention in the mining industry of the Arctic zone.
The practical significance of the study lies in the development of an occupational risk assessment methodology that takes into account the background risk levels in calculations of injury rates caused by labor conditions. The proposed methodology also determines the relative and absolute shifts in occupational injury risk levels. The “basic injury rate matrix”, built based on these parameters, allows for the visualisation of the correlation analysis of injury rates in vertically integrated companies and facilitates selection of priority avenues for lowering the injury rates and improving occupational safety.
We use the injury risk level—calculated as the ratio of the injury rate to the total region population number—as a primary indicator of labor safety.
To exemplify the use of the developed methodology, we use it to assess the situation at the mines of the Kirov branch of “Apatit”, JSC (located in Murmansk), which belongs to the Arctic zone as per the Decree of the President of Russian Federation No. 296 dated 2 May 2014 [19].

2. Materials and Methods

Methods for selecting priority avenues for lowering the injury rates at the facilities of the Arctic circle are an important basis for occupational safety. The development of mineral resources of the Arctic zone has been a priority for Russia and the global community. The human factor becomes one of the main factors of efficiency in the extreme environmental conditions of the Arctic. When it comes to Russia, the problem is exacerbated by the fact that the vast and resource-filled territory of the Arctic zone is only populated by slightly over 2 million people, which necessitates attracting rotational workers from other regions.
The adverse environmental conditions of the Arctic zone, paired with the difficult labor conditions for the miners (such as polar nights, excessive noise and vibration levels and other), lead to the injury risks being higher compared to regions with more favorable conditions. In order to reduce the injury risks, the occupational health and safety systems at mining facilities need to be constantly improved upon, and the first step of this process is the assessment of labor safety conditions [20,21,22].
The results of the occupational safety assessment allow for the selection of priority directions for reducing the occupational injuries (Figure 4).
The first step in the selection is to determine the risk structure (Figure 5). The overall risk—aside from its occupational component, which is determined by labor conditions—includes background risk, which is determined by the unfavorable ecological situation and the adverse environmental effects such as harsh climate conditions, high precipitation, low air temperatures, strong winds, polar nights, polar days, and lack of ultraviolet radiation.
To calculate the overall risk of injuries in the Arctic regions of Russia, we used official statistical data [23]. Figure 6 illustrates the calculation results.
In general, the injury rate in the Arctic zone displays a decade-long downward trend. The only outlier in this case is the Chukotka Autonomous District, where we see an increase of 22%.
Figure 6 shows that the linear correlation dependencies of injury rates on time are characterized by the correlation coefficient of over 0.75 and have individual regression coefficients that determine the trends in injury rates over the 10-year period. For each linear correlation dependence of the injury risk for the regions of the Arctic zone, the mean value (M) was calculated, which describes the central trend, and the standard error (SEM) indicating the accuracy of the average value calculation was computed.
Figure 7 shows the main causes of occupational accidents for the Arctic zone of Russia.
As shown in Figure 7, the highest risk of accidents relates to poor management, violations of labor procedures as well as employees’ misconduct and unsatisfactory maintenance of workplaces. The listed causes of accidents are organizational due to the insufficient professional training of employees, as well as their low motivation to follow the safety regulations at work.
At the core of the procedure for determining the risk structure lies the assumption that the overall injury risk is the result of the combined effects of two types of risk: the overall risk for the territories of the Arctic zone (RF.N.t.), which is calculated based on the average risk for Russia (RRF.av.), and the risk determined by the external factors, stemming from the territories themselves (REXT.C.).
In turn, the overall injury risk for the mining enterprises (RM.I.t.) is calculated based on the value of REXT.C. and the risk stemming from the individual company’s operations (RI.A.). Risk analysis of the occupational injury rates at the mining enterprises pre-supposes that the risk structure for them is identical to the one for the corresponding territory.
The equations linking these risks are based on the addition law of probability and can be written as follows [24,25]:
R F . N . t . = R RF . av . + R EXT . C . R RF . av . · R EXT . C .
R M . I . t . = = R EXT . C . + R IA . R EXT . C . · R IA .
Knowing the overall injury risks for a given territory (RF.N.t.), a given enterprise (RM.I.t.), and knowing the average risk for the Russian Federation (RRF.av.) makes it trivial to calculate the external risks for each territory (REXT.C.), as well as the injury risks (RIA.).
Equation (1) makes it possible to represent the background injury risks for the separate territories as follows:
R EXT . C . = ( R F . N . t . R RF . av . ) / ( 1 R RF . av . )
With the background risk value being known, the occupational risk for a particular enterprise ( R I . A . ) can be written as follows (Equation (4)):
R I . A . = ( R M . I . t . R EXT . C . ) / ( 1 R EXT . C . )
The R F . N . t . ,   R RF . av . ,   R M . I . t . ,   and   R I . A . risk values were determined based on the statistical data for each region for a given period, and then correlation and regression analysis was performed.

3. Results

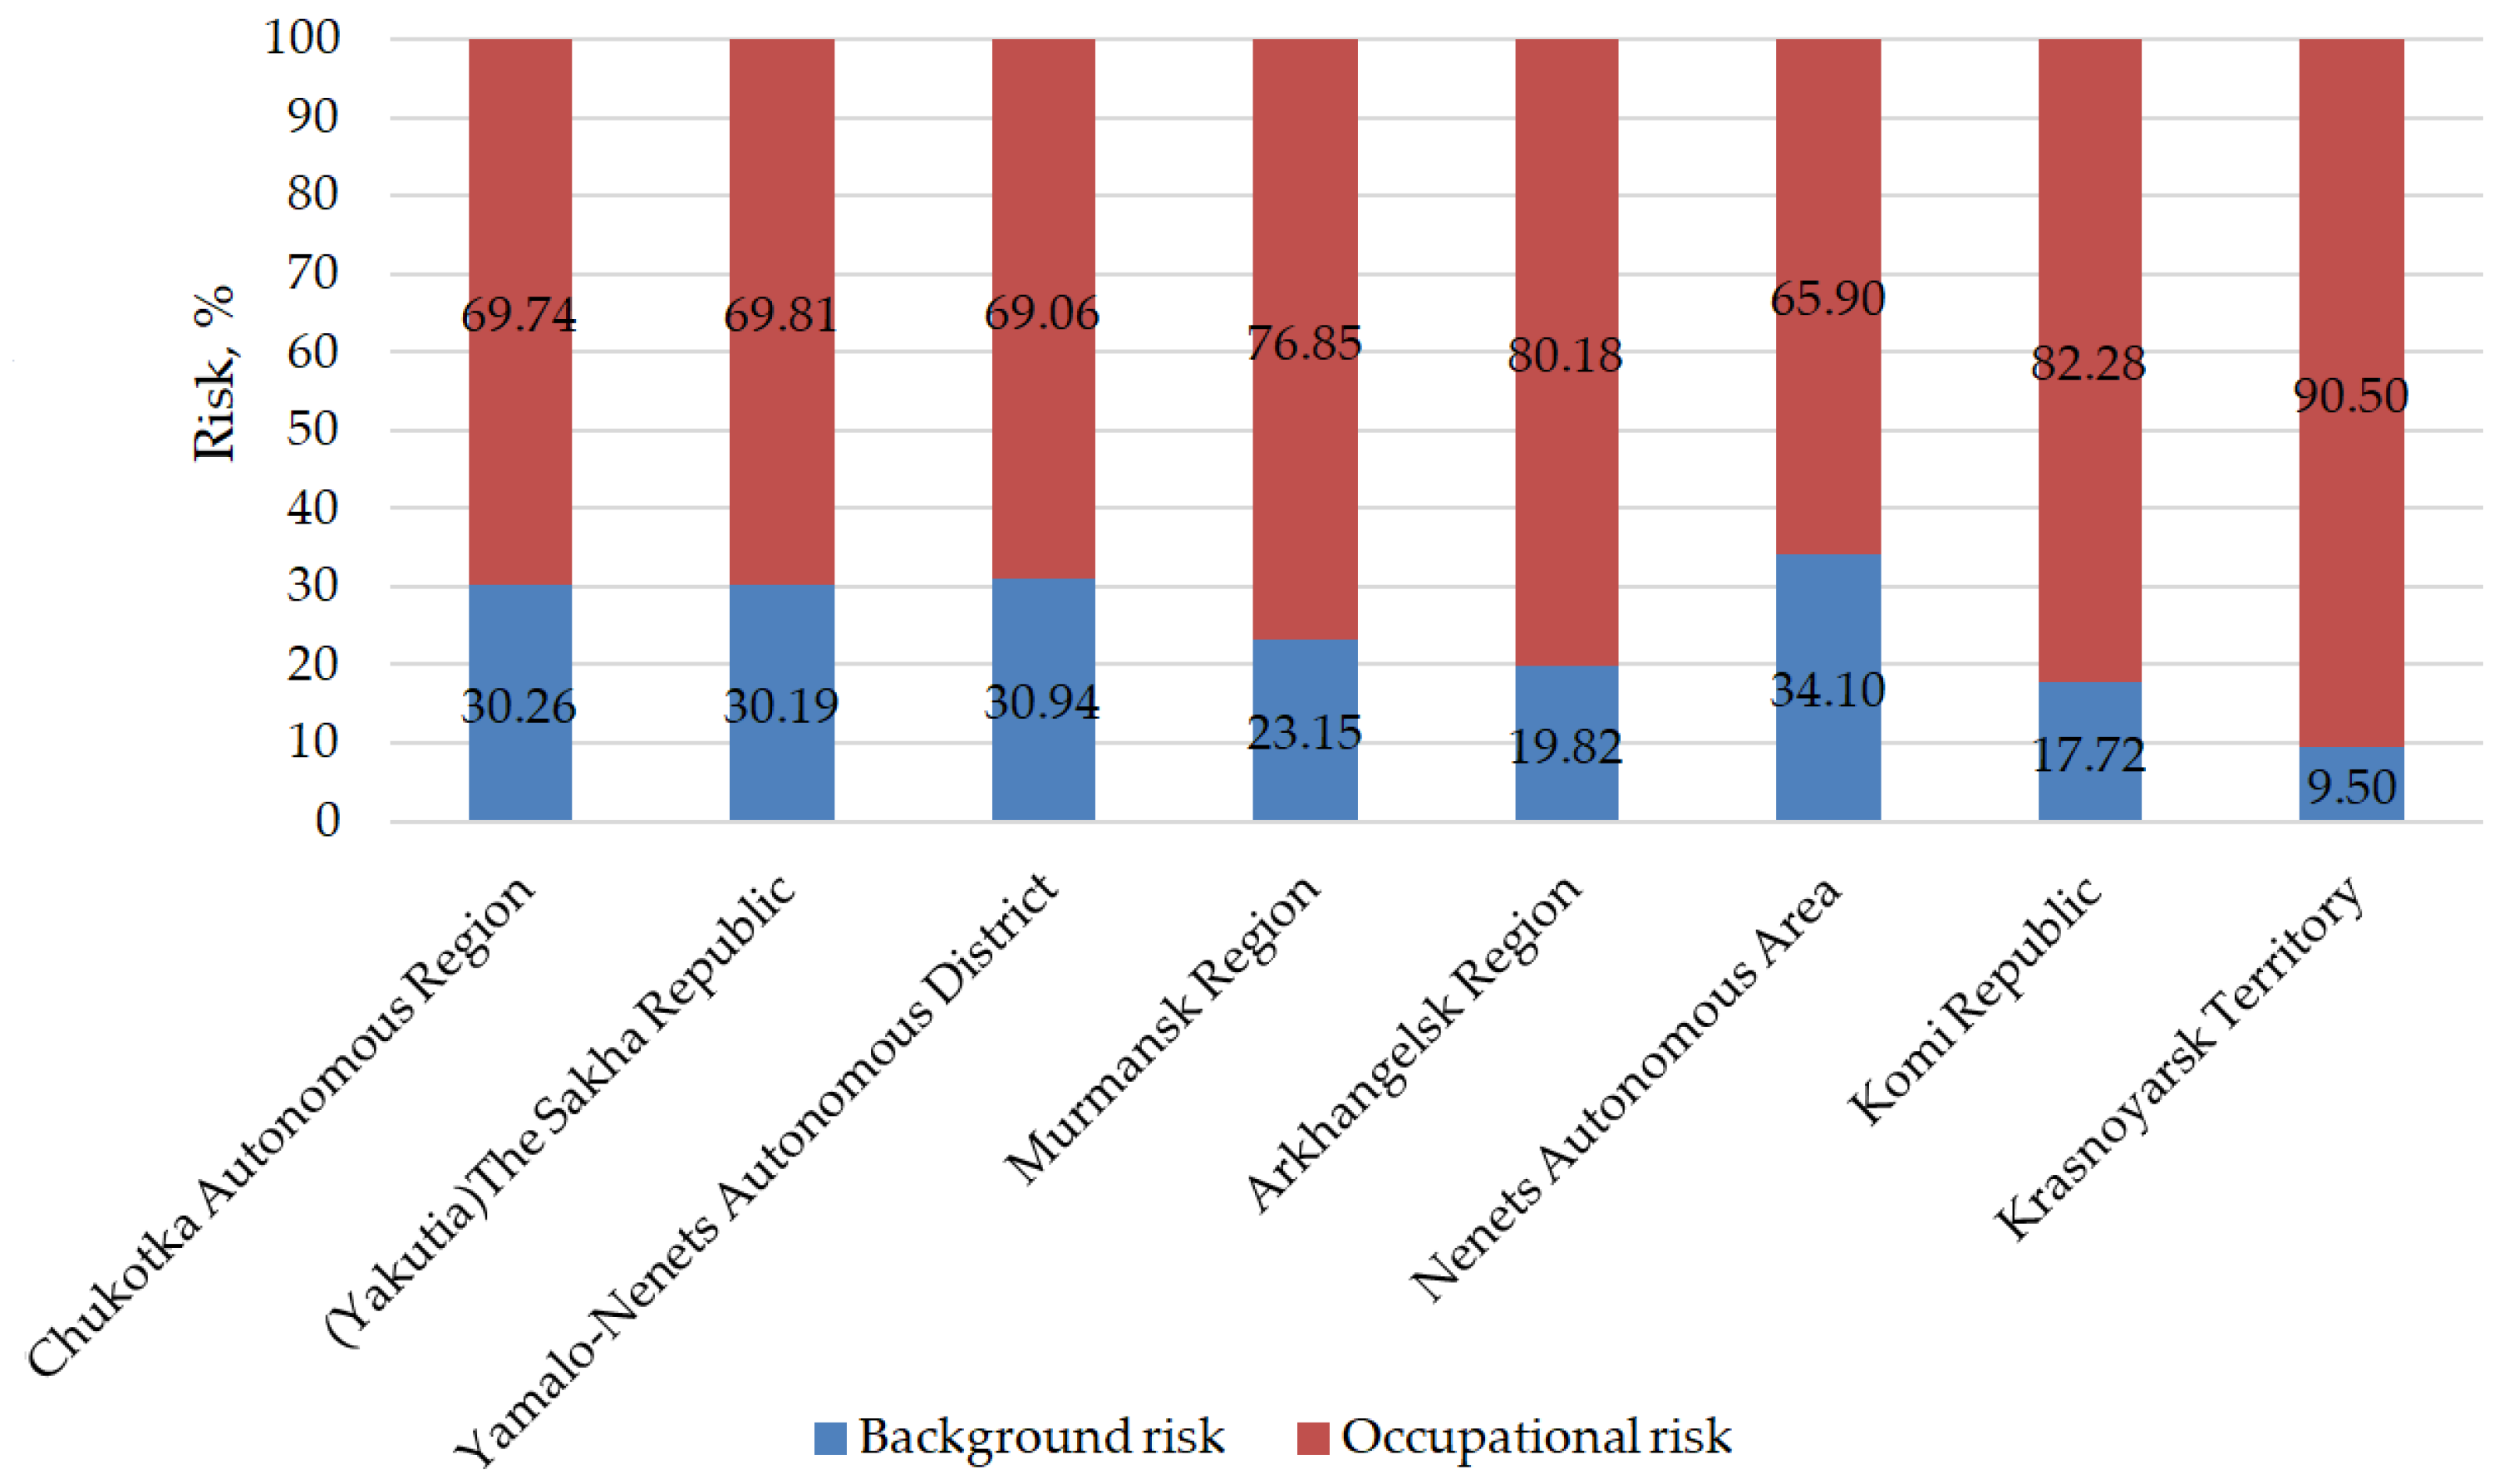
3.1. Results of Calculating the Occupational and Background Risks for the Arctic Zone

The results of the R F . N . t . , R RF . av .   R M . I . t . ,   and   R I . A . risk values were determined on the basis of statistical data for each region of the Arctic zone over the past 10 years, which were then subjected to correlation and regression analysis—see Table 1.
Table 1 provides the background risk values for each Arctic zone territory, calculated using Equation (3).
The data from Table 1 show that the background risk levels have remained practically the same in the past decade. It should be noted that the Krasnoyarsk Territory displays the lowest average background risk values, while the Nenets Autonomous Area has the highest ones.
Figure 8 illustrates the relationship between background risk and injury risk for each region, indicating that background risk has an impact on the magnitude of overall injury risk. The results indicate that the background risks can have significant impact on the overall injury rates. As such, the background risk accounts for 35% of the overall risk in the Nenets Autonomous Area and for over 30% in the Chukotka Autonomous Region and the Sakha Republic (Yakutia).
Thus, by determining the risk structure, we can elucidate the relations between its determining factors, and whether they are controllable or uncontrollable [26].
The controllable factors in this case are the factors linked to the enterprises’ operations, and the uncontrollable ones comprise the external conditions determined by the environment (such as air pollution), placement of workers’ habitations, length of the polar day and night, intensity of the UV radiation, location of the facilities, weather conditions, etc. The external conditions affect the mental and physical states of the workers.

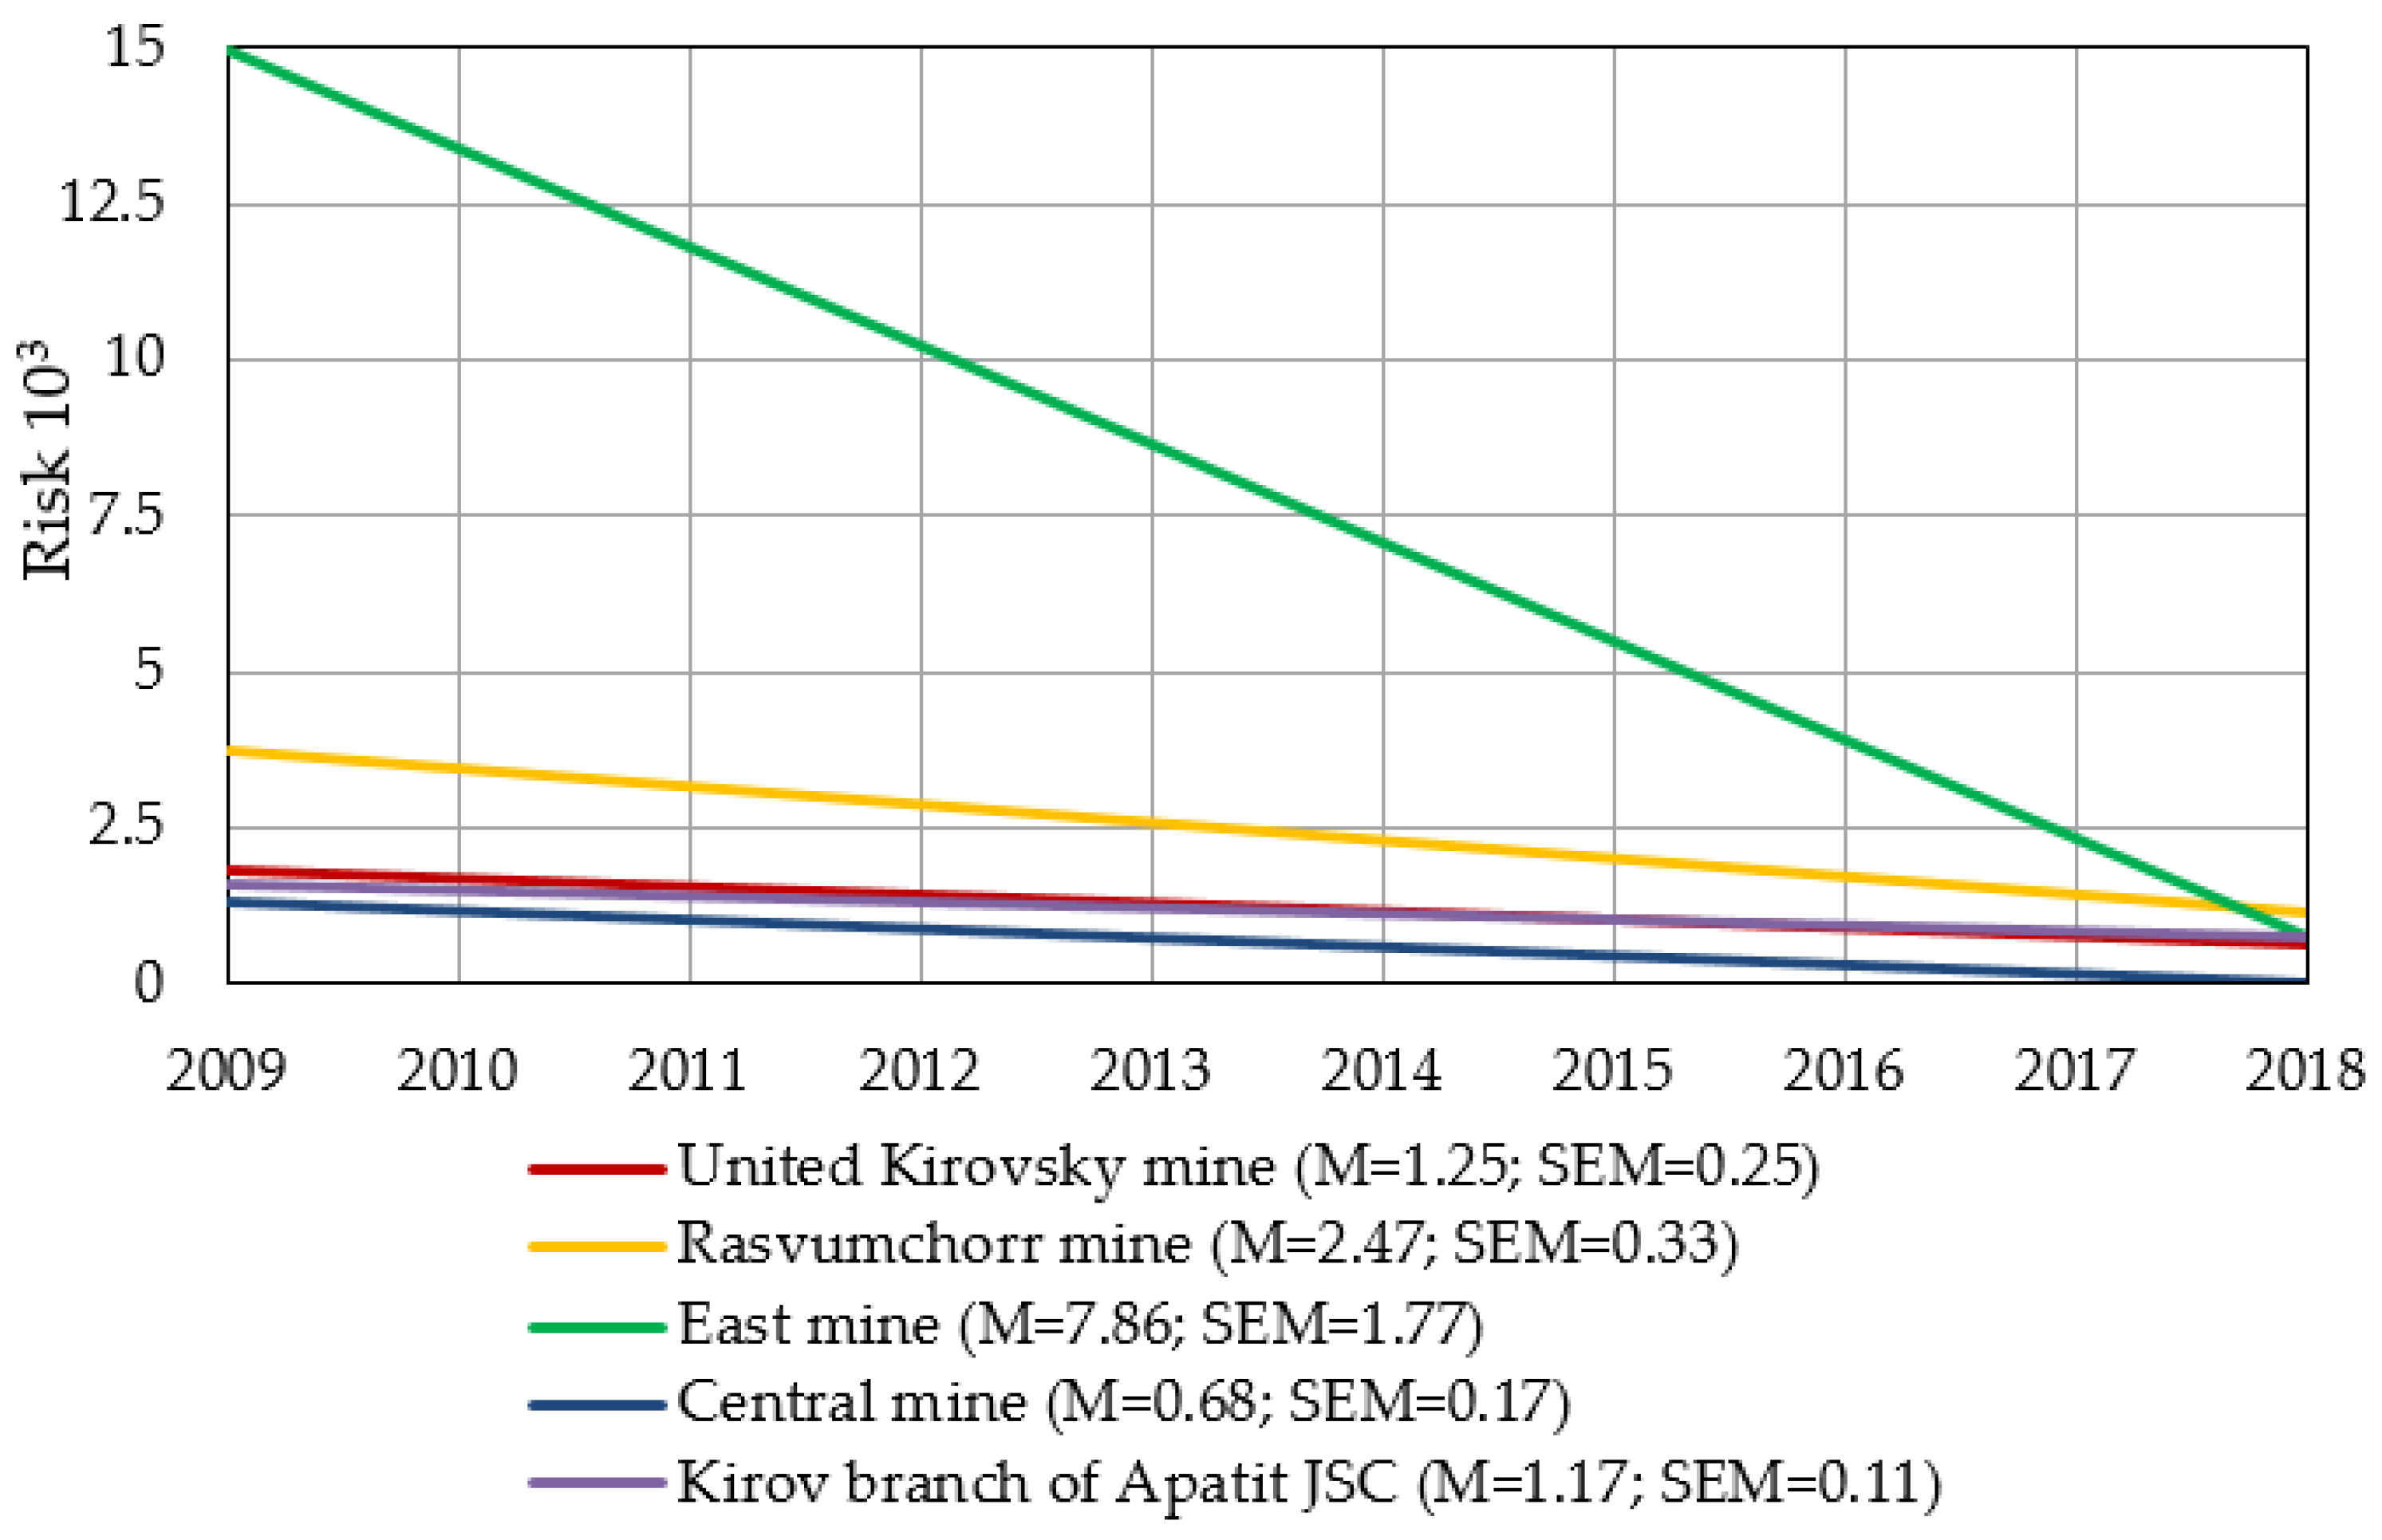
3.2. The Specifics of Determining the Priority Directions for Reducing Injury Rates at the Kirov Branch of “Apatit”, JSC

We use the vertically integrated Kirov branch of “Apatit” (based in Murmansk) as an example subject for our methodology. The company incorporates the following: the United Kirovsky mine, the Rasvumchorr mine, the East mine, and the Central mine. The original data used in the study were taken from the reports by the State Committee for Supervision of Industrial and Mining Practices (Rosgortekhnadzor), the internal reports by the Kirov branch of “Apatit”, and the reports collected by other authors [27]. The calculated occupational risk values are presented as linear functions in Figure 9.
Figure 9 illustrates that all the mines of the company have seen a decrease in injury rates over the 10-year period studied. The risk trend is described by a linear function with the correlation coefficient exceeding 0.7, with the confidence interval being 0.95.
At the East mine, the occupational injury rate of the first few years is largely different from the other mines’ and the company as a whole. However, by 2018, the injury rates have become comparable to other mines’. For each linear correlation dependence of the injury risk for the mines of the Kirov branch of Apatit, the mean value (M) and standard error (SEM) were calculated.
The occupational risk situation at the mines is characterized by the following two indicators: the average risk of injury ( R ¯ ) and the average rate of change ( V ¯ ) in the risk of injury. The average rate of change in the injury risks corresponds to the linear correlation’s regression coefficient, and the average injury risk represents the mean between the injury risks at the beginning and at the end of the period in question [28,29]. The relative changes in values ( Δ R ¯ ,   Δ V ¯ ) are calculated as the ratio of the average injury risk and the average injury risk of change at a specific mine to the company-wide values.
On the basis of the data on occupational injury rates at the Apatit company from 2008 to 2018, we have calculated the occupational injury risks for the four mines [30,31].
Table 2 shows the relative changes in occupational injury risks and the rate of changes in the injury risks ( Δ R ¯ and   Δ V ¯ ) respectively) for the four company mines.
The relative change in the injury risk rate and the relative injury risk value serve as the basis for the “basic injury rate matrix”, where the reciprocal of the relative change in the injury risk rate is shown on the X axis, and the relative value of risk, on the Y axis.
For the sake of clarity, the segments of the matrix that correspond to various occupational injury risks are colored differently: green means acceptable labor safety; yellow—satisfactory; red—unsatisfactory; dark red—critical.
The matrix allows for the results of comparative assessment of occupational injury risks at different company enterprises to be visualised and primary measures for their reduction to be determined [32,33,34].
Figure 10 shows the matrix of relative change in injury risk rates for the mines of the Kirov branch of the “Apatit” company. The results of the analysis and the calculated average values of the changes in injury risk rates over the decade make it possible to assess the occupational safety measures in their entirety.
Figure 11 shows the “Matrix of changes in occupational injury risk levels over a 10-year period at the mines of the Kirov branch of “Apatit”, JSC”.
As shown in Figure 11, over the last decade, labor safety conditions pertaining to the occupational injury risks at the Kirov mine were satisfactory; at the Rasvumchorr mine—unsatisfactory; at the East mine—critical; at the Central mine—between satisfactory and unsatisfactory.
The analysis provided allows for the assessment of labor safety conditions pertaining to occupational injury risks both over the last 10 years and during the current period of enterprise operation [35,36].
The assessment makes it possible to determine the priority avenues for reducing injury risk and improving occupational safety.
In conclusion, it should be noted that the article advocates the methodology of identifying the enterprise with higher occupational injury rate in comparison with others within the company as a whole based on the comparative analysis of the occupational injury rates at specific enterprises and companies including these enterprises. The proposed methodology allows companies to identify the priority directions for improving occupational safety, which will be targeted at specific enterprises.
For further research, it is useful to develop software to implement the proposed algorithm for identifying the priority areas for reducing occupational injury rates.

4. Discussion

The proposed methods for assessing the current state of injuries and determining priority areas for reducing occupational injuries, as well as the results obtained, are important for the prevention of injuries in the mining industry. Despite the wide spread of this topic among domestic and foreign scientists, the proposed study most fully describes the situation of industrial injuries in the Arctic zone of Russia, and also demonstrates the methodology for determining priority areas for reducing industrial injuries and improving labor safety using the Kirov branch of Apatit JSC as an example. Based on the studies, the overall injury risk is proposed to be calculated as the combined impact of two types of occupational risks: the occupational risk determined as an average risk for the Arctic zone and the risk caused by the adverse environmental factors. The background risk for the mining areas of the Arctic zone has been calculated for a period of 10 years and used to create the occupational risk-based structure for the mining industry in the Arctic zone of Russia. Despite the fact that the “background risk” has practically not changed during the period under consideration, this risk has an impact on the indicator of the overall injury risk. Thus, the determination of the occupational risk structure allows the relationship between controlled and uncontrolled factors that have an impact on the risk of injuries within the mining industry to be established. This is vital for the subsequent assessment of the impact of industrial factors on the occupational injury rate.
The main advantage of the methodology employed is in providing a comprehensive approach to the analysis of the risk of occupational injuries at mining enterprises located in the Arctic zone of Russia, taking into account the following for the first time
-
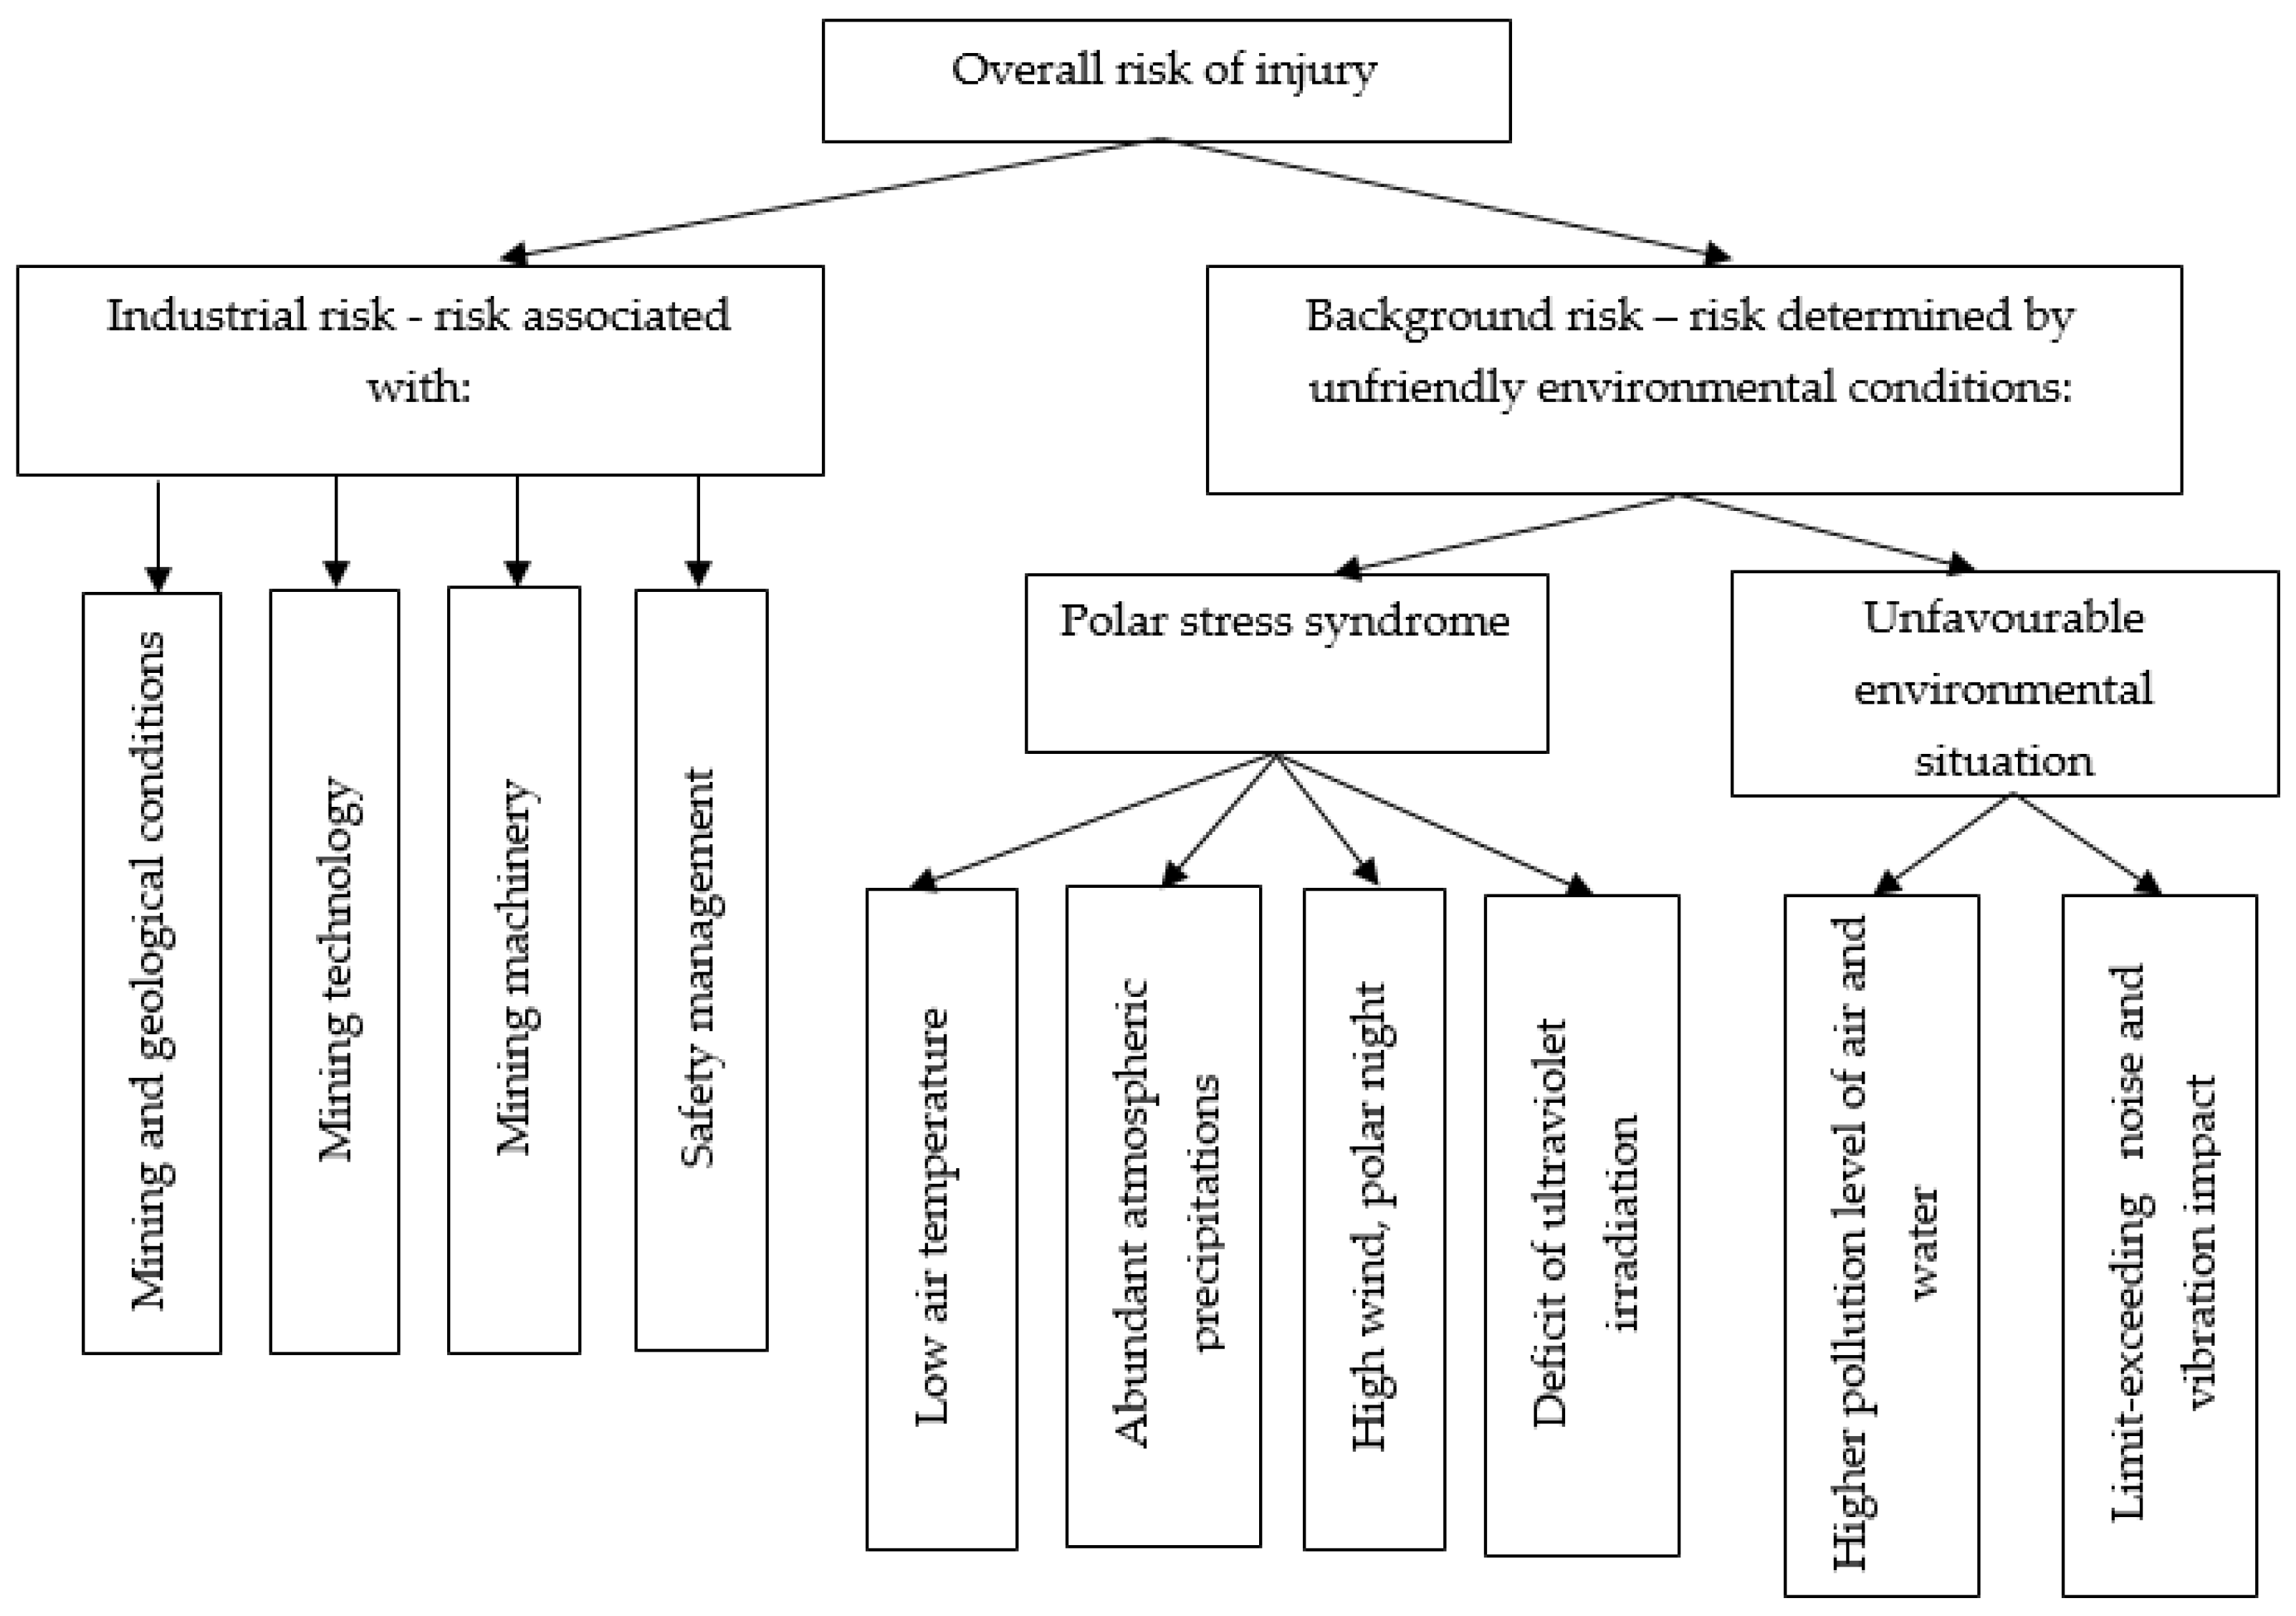
the risk structure consisting of the occupational risk related to underground labor conditions and a “background risk” determined by the influence of the environment;
-
comparative dynamics and average levels of injury risks for mining companies and enterprises within their structure during the period under review;
-
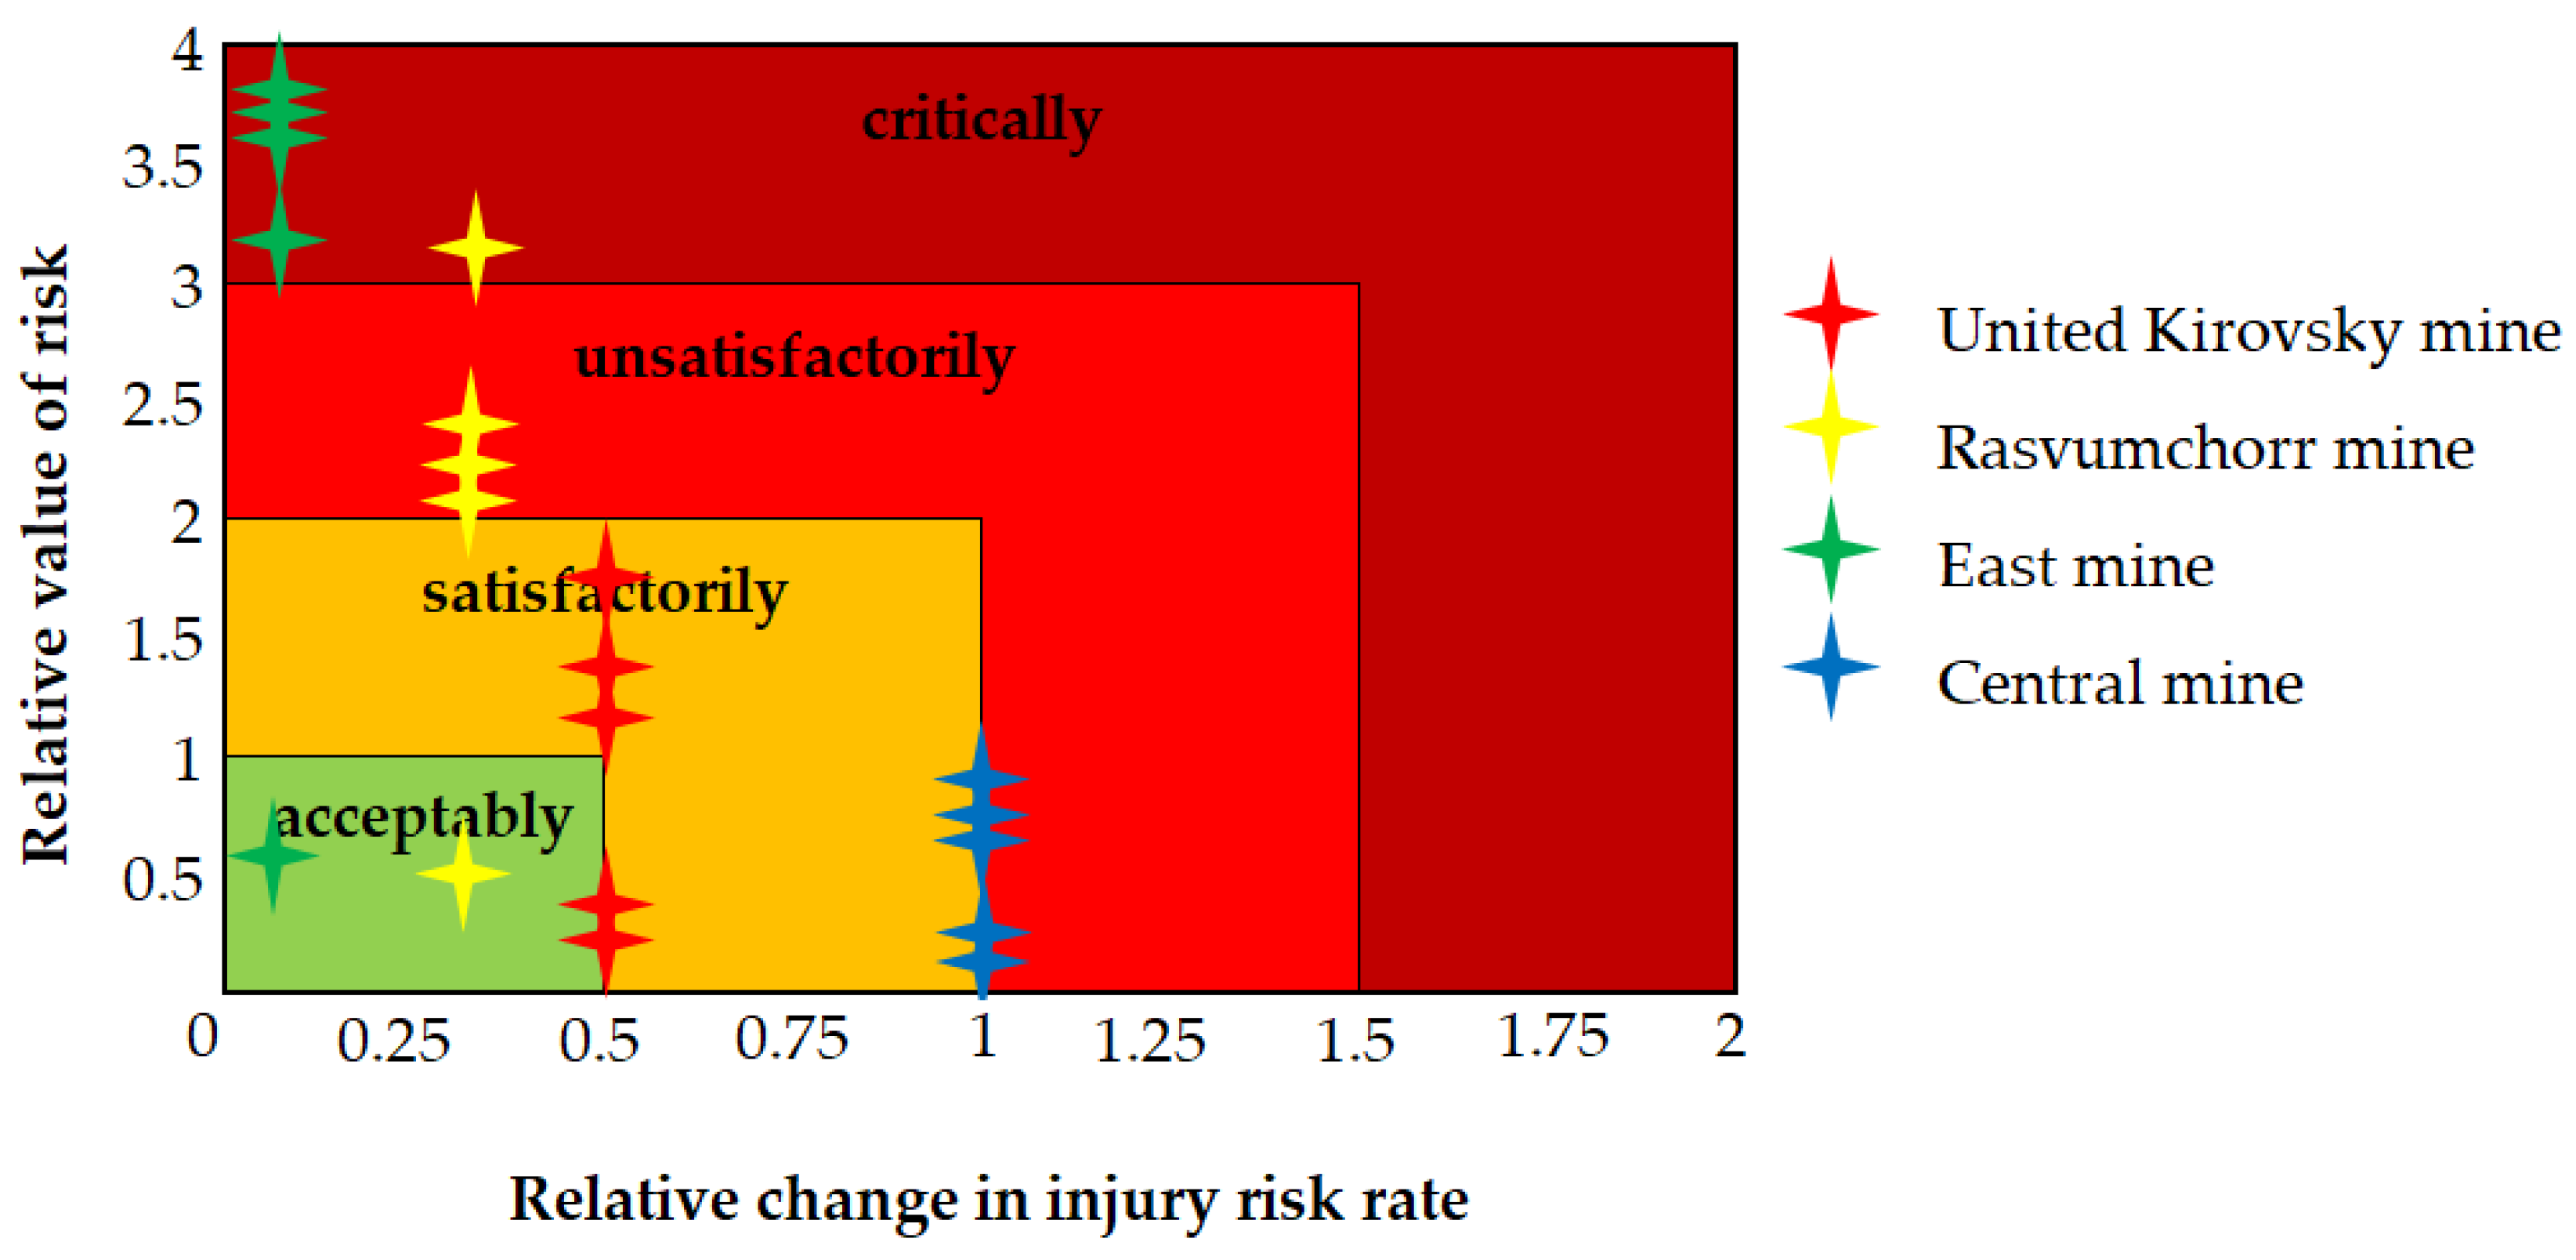
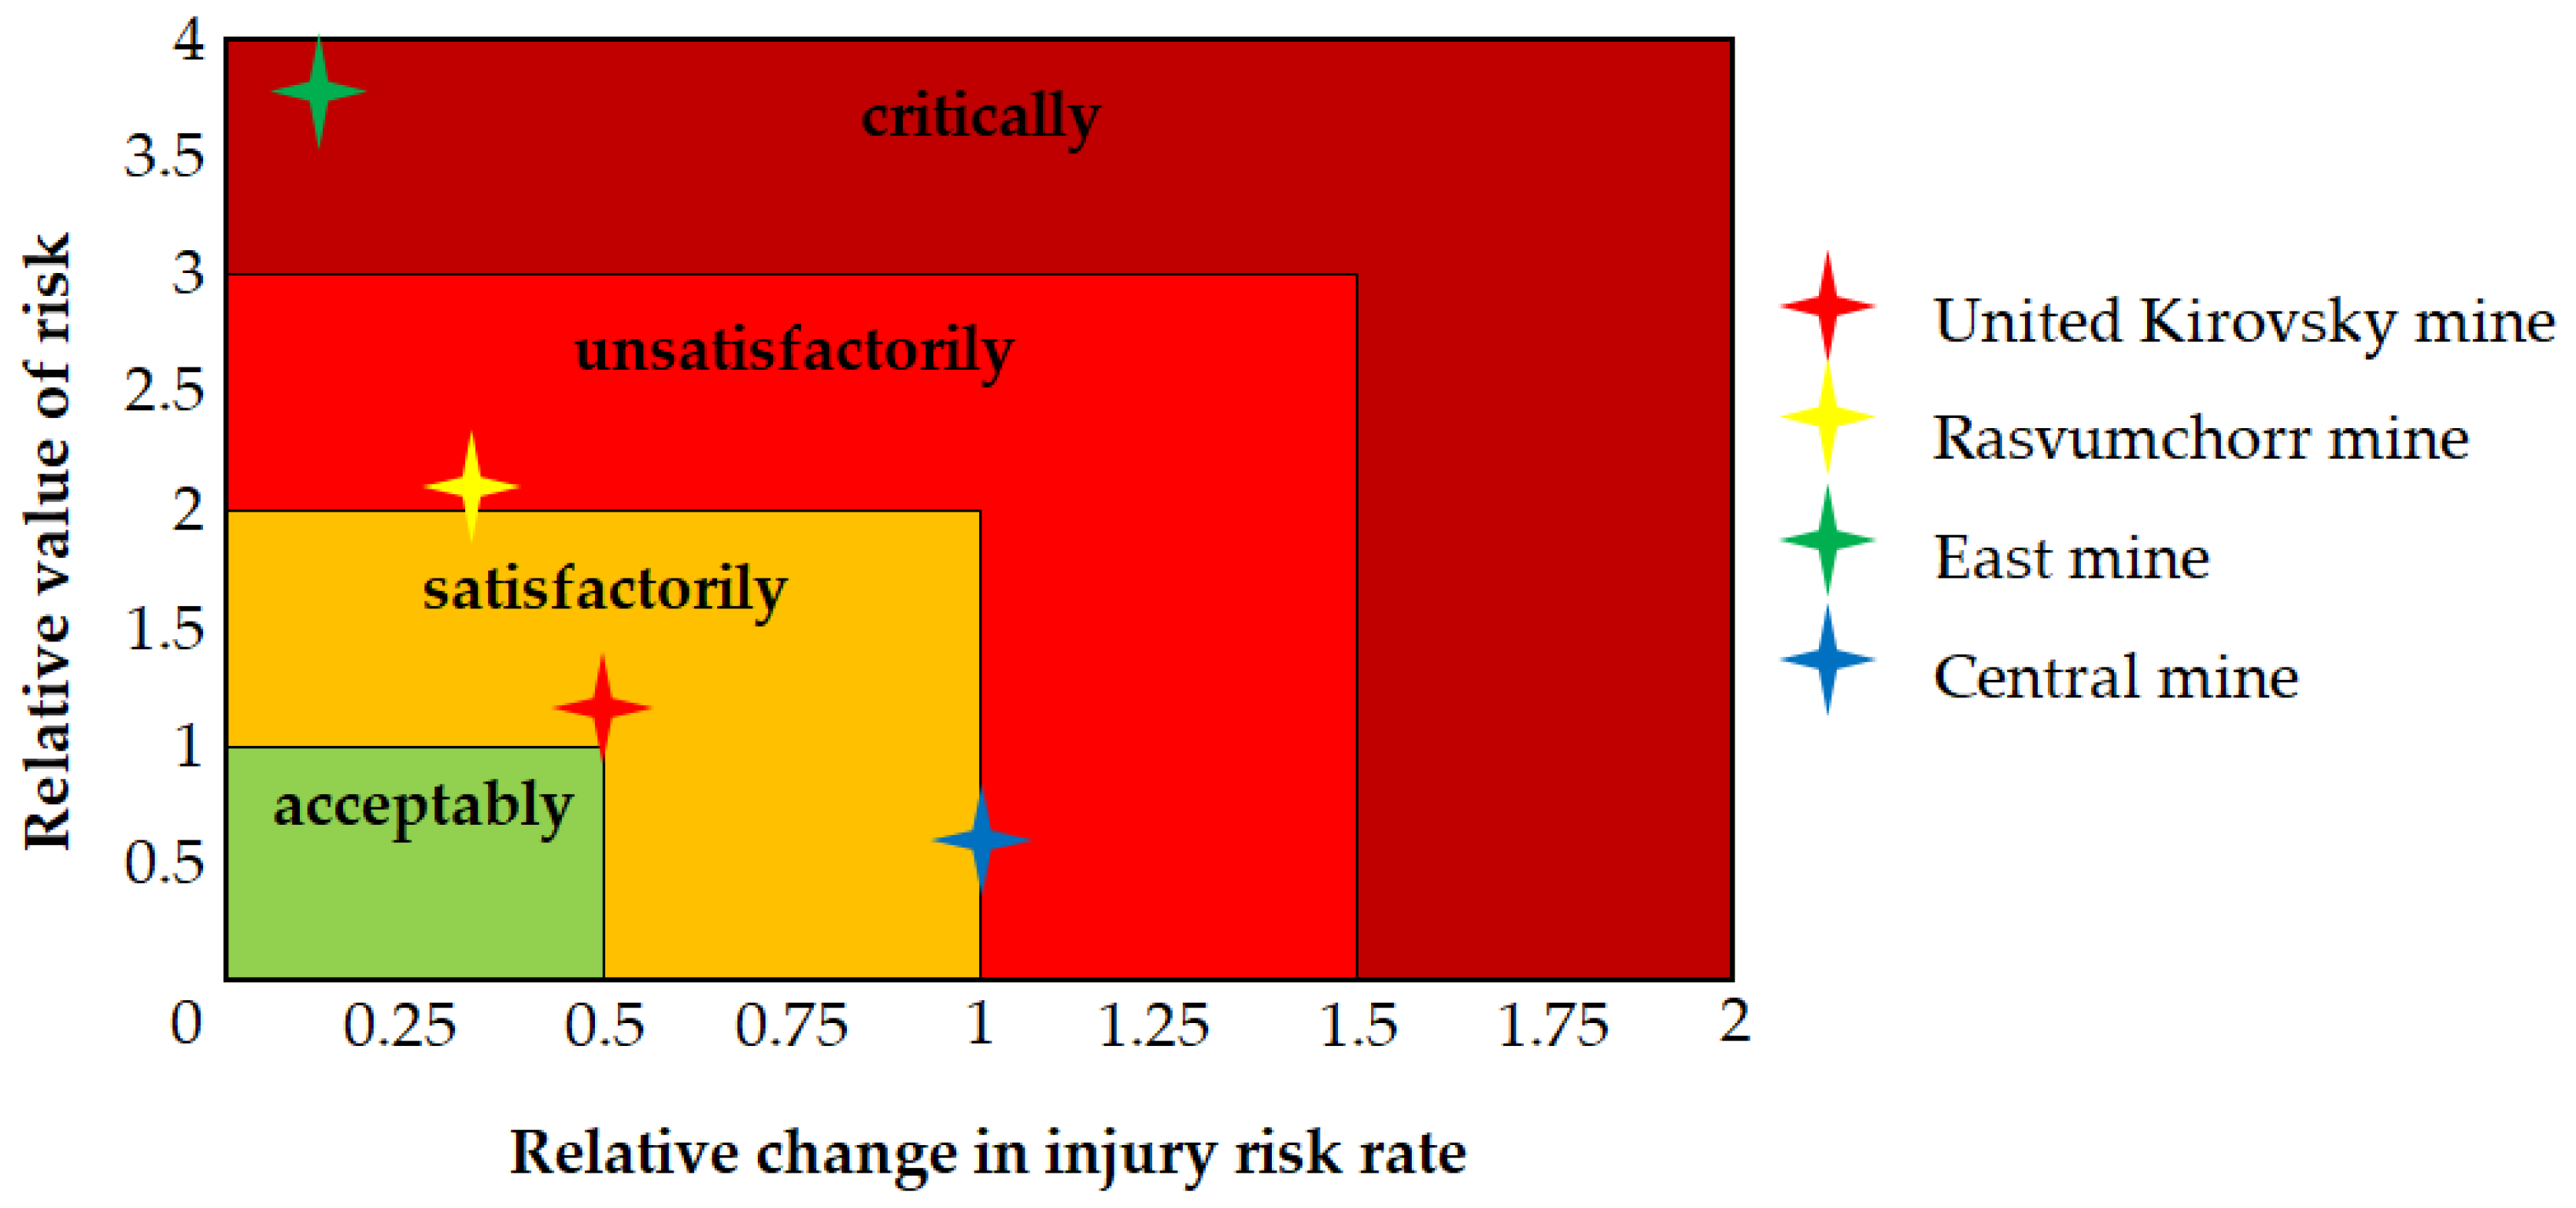
possibility of visualisation of the results obtained from the assessment of the occupational injury rates at enterprises within member companies, based on the analysis of risk matrices of occupational safety, which allows for priority directions of the targeted occupational safety and health measures to be determined.
Based on the results obtained, the following important conclusions should be noted:
  • Determining the priority avenues for reducing the occupational injury risks is one of the steps for optimizing financial investments strategies aimed at improving the occupational safety at the mines of the Arctic zone.
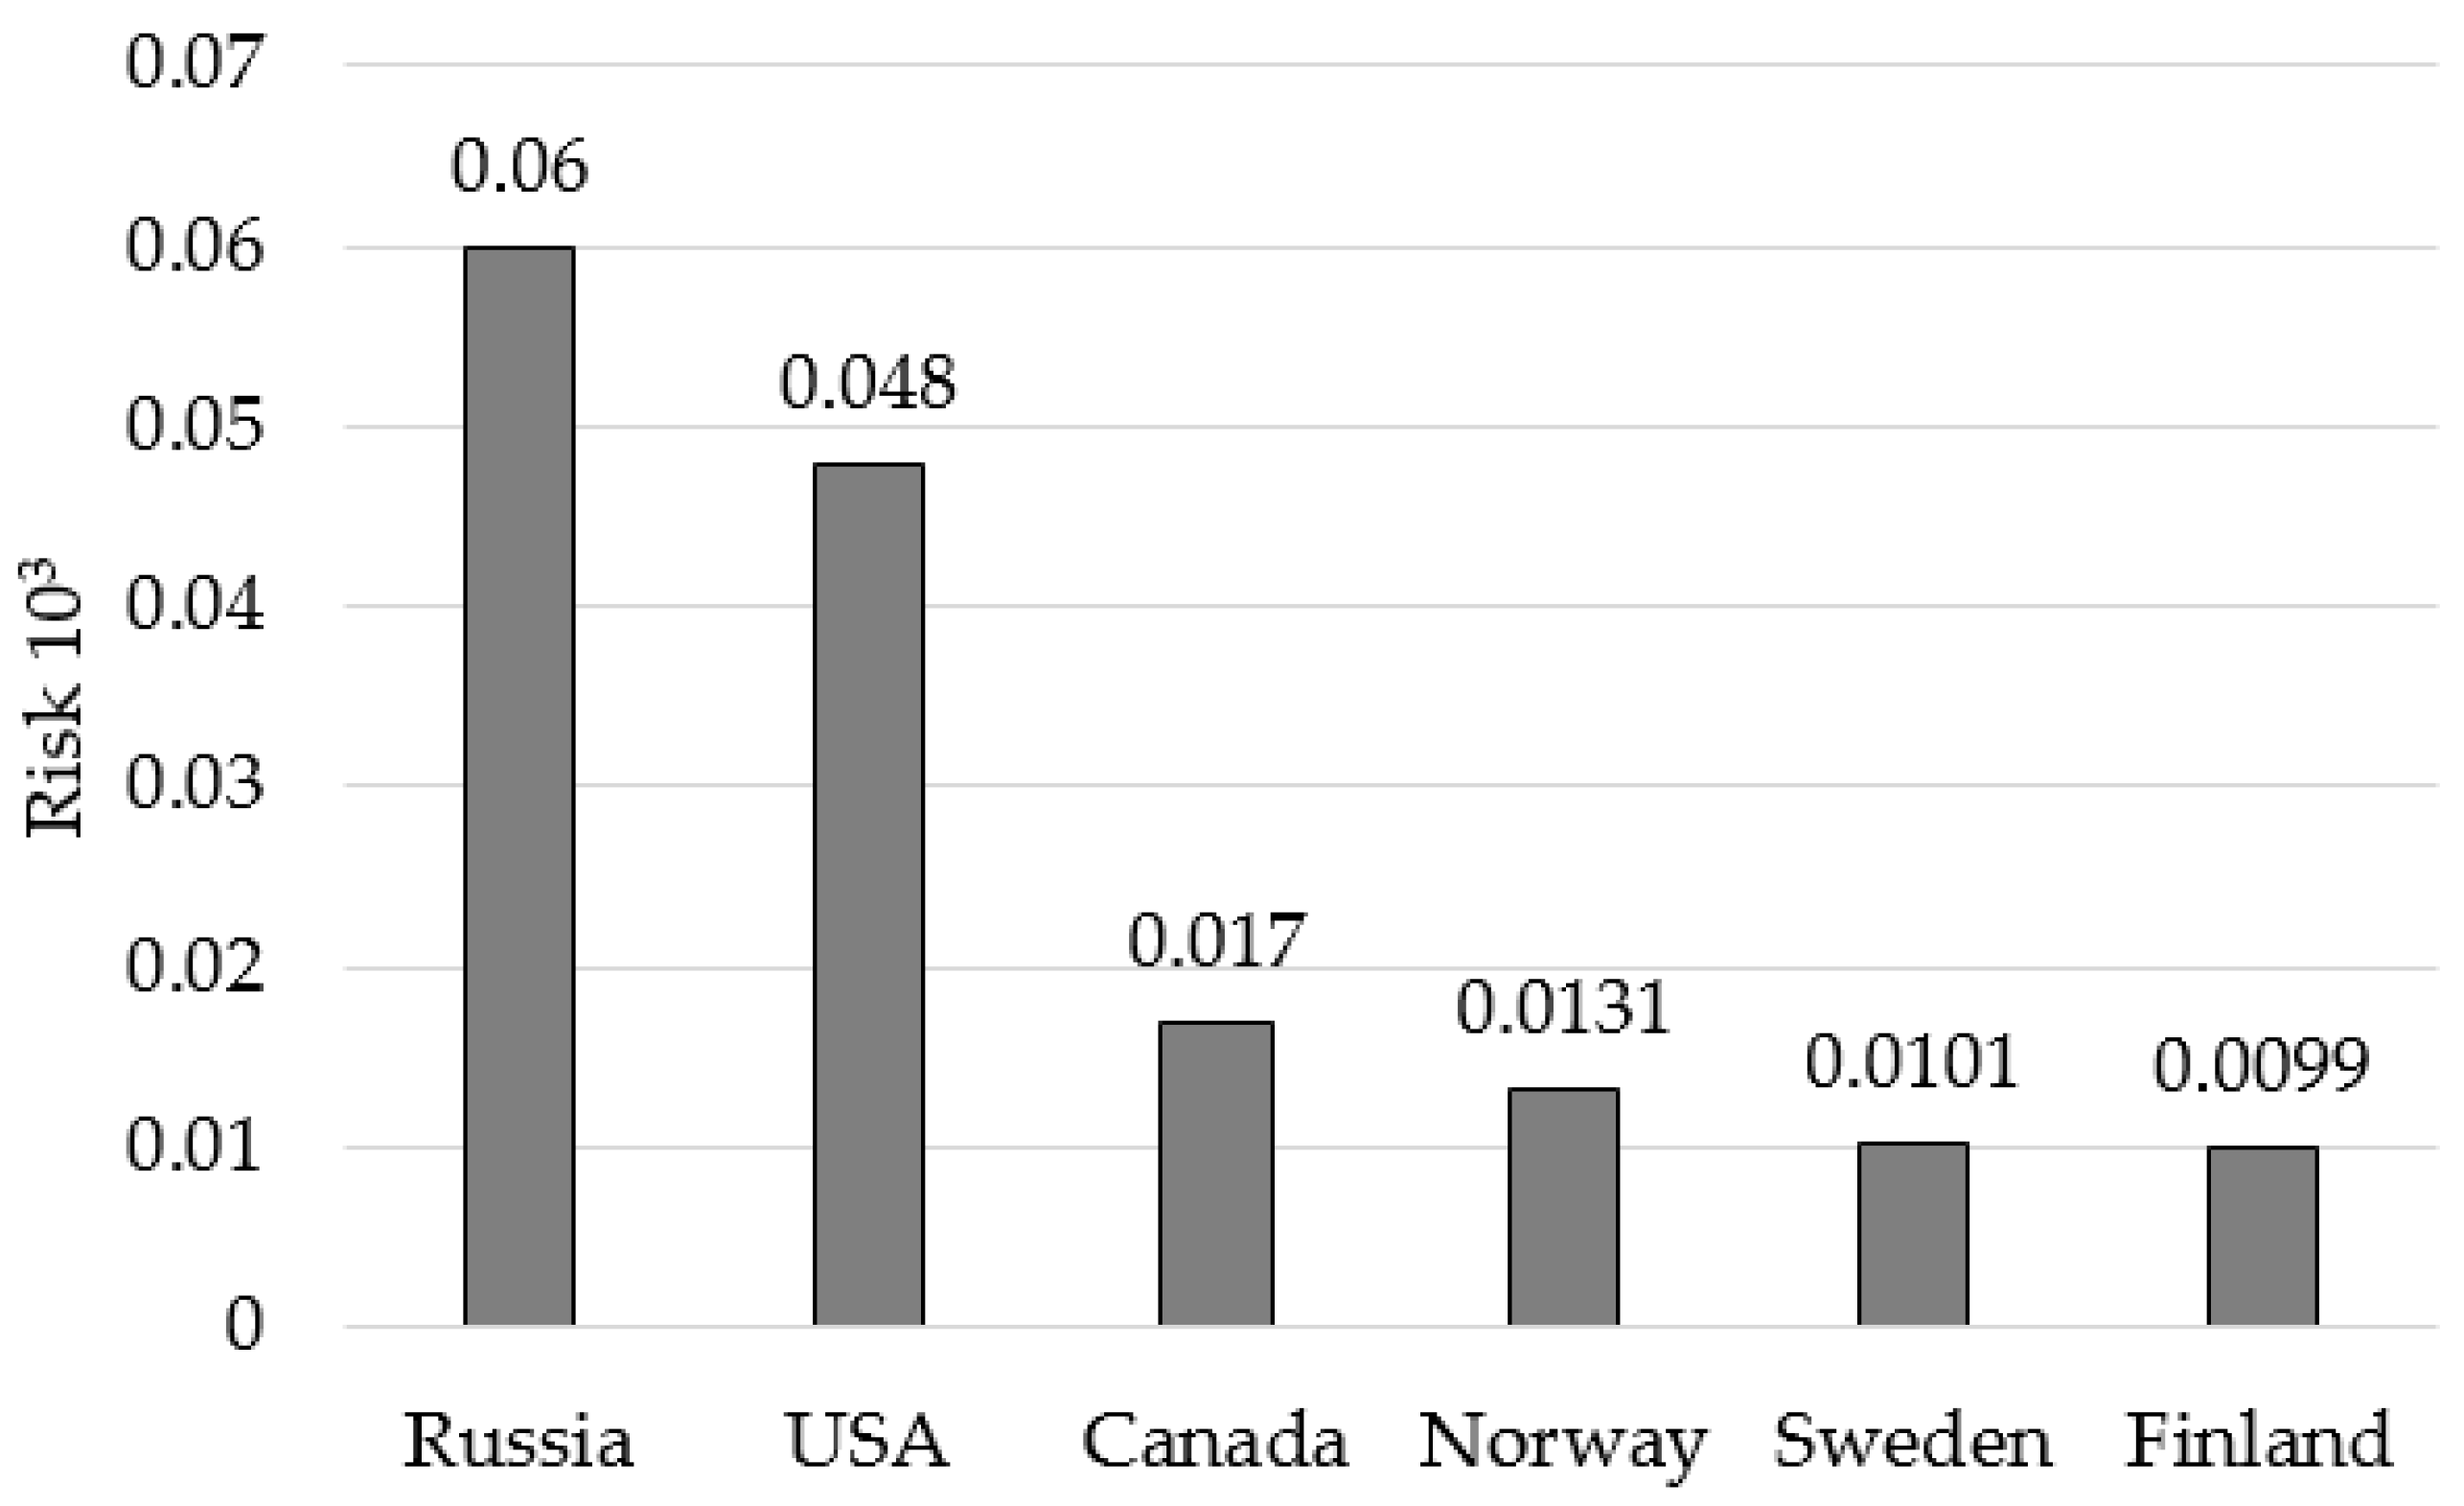
  • The overall occupational risk levels are impacted by the background risks, stemming from the influence of the polar stress syndrome and unfavorable environmental conditions.
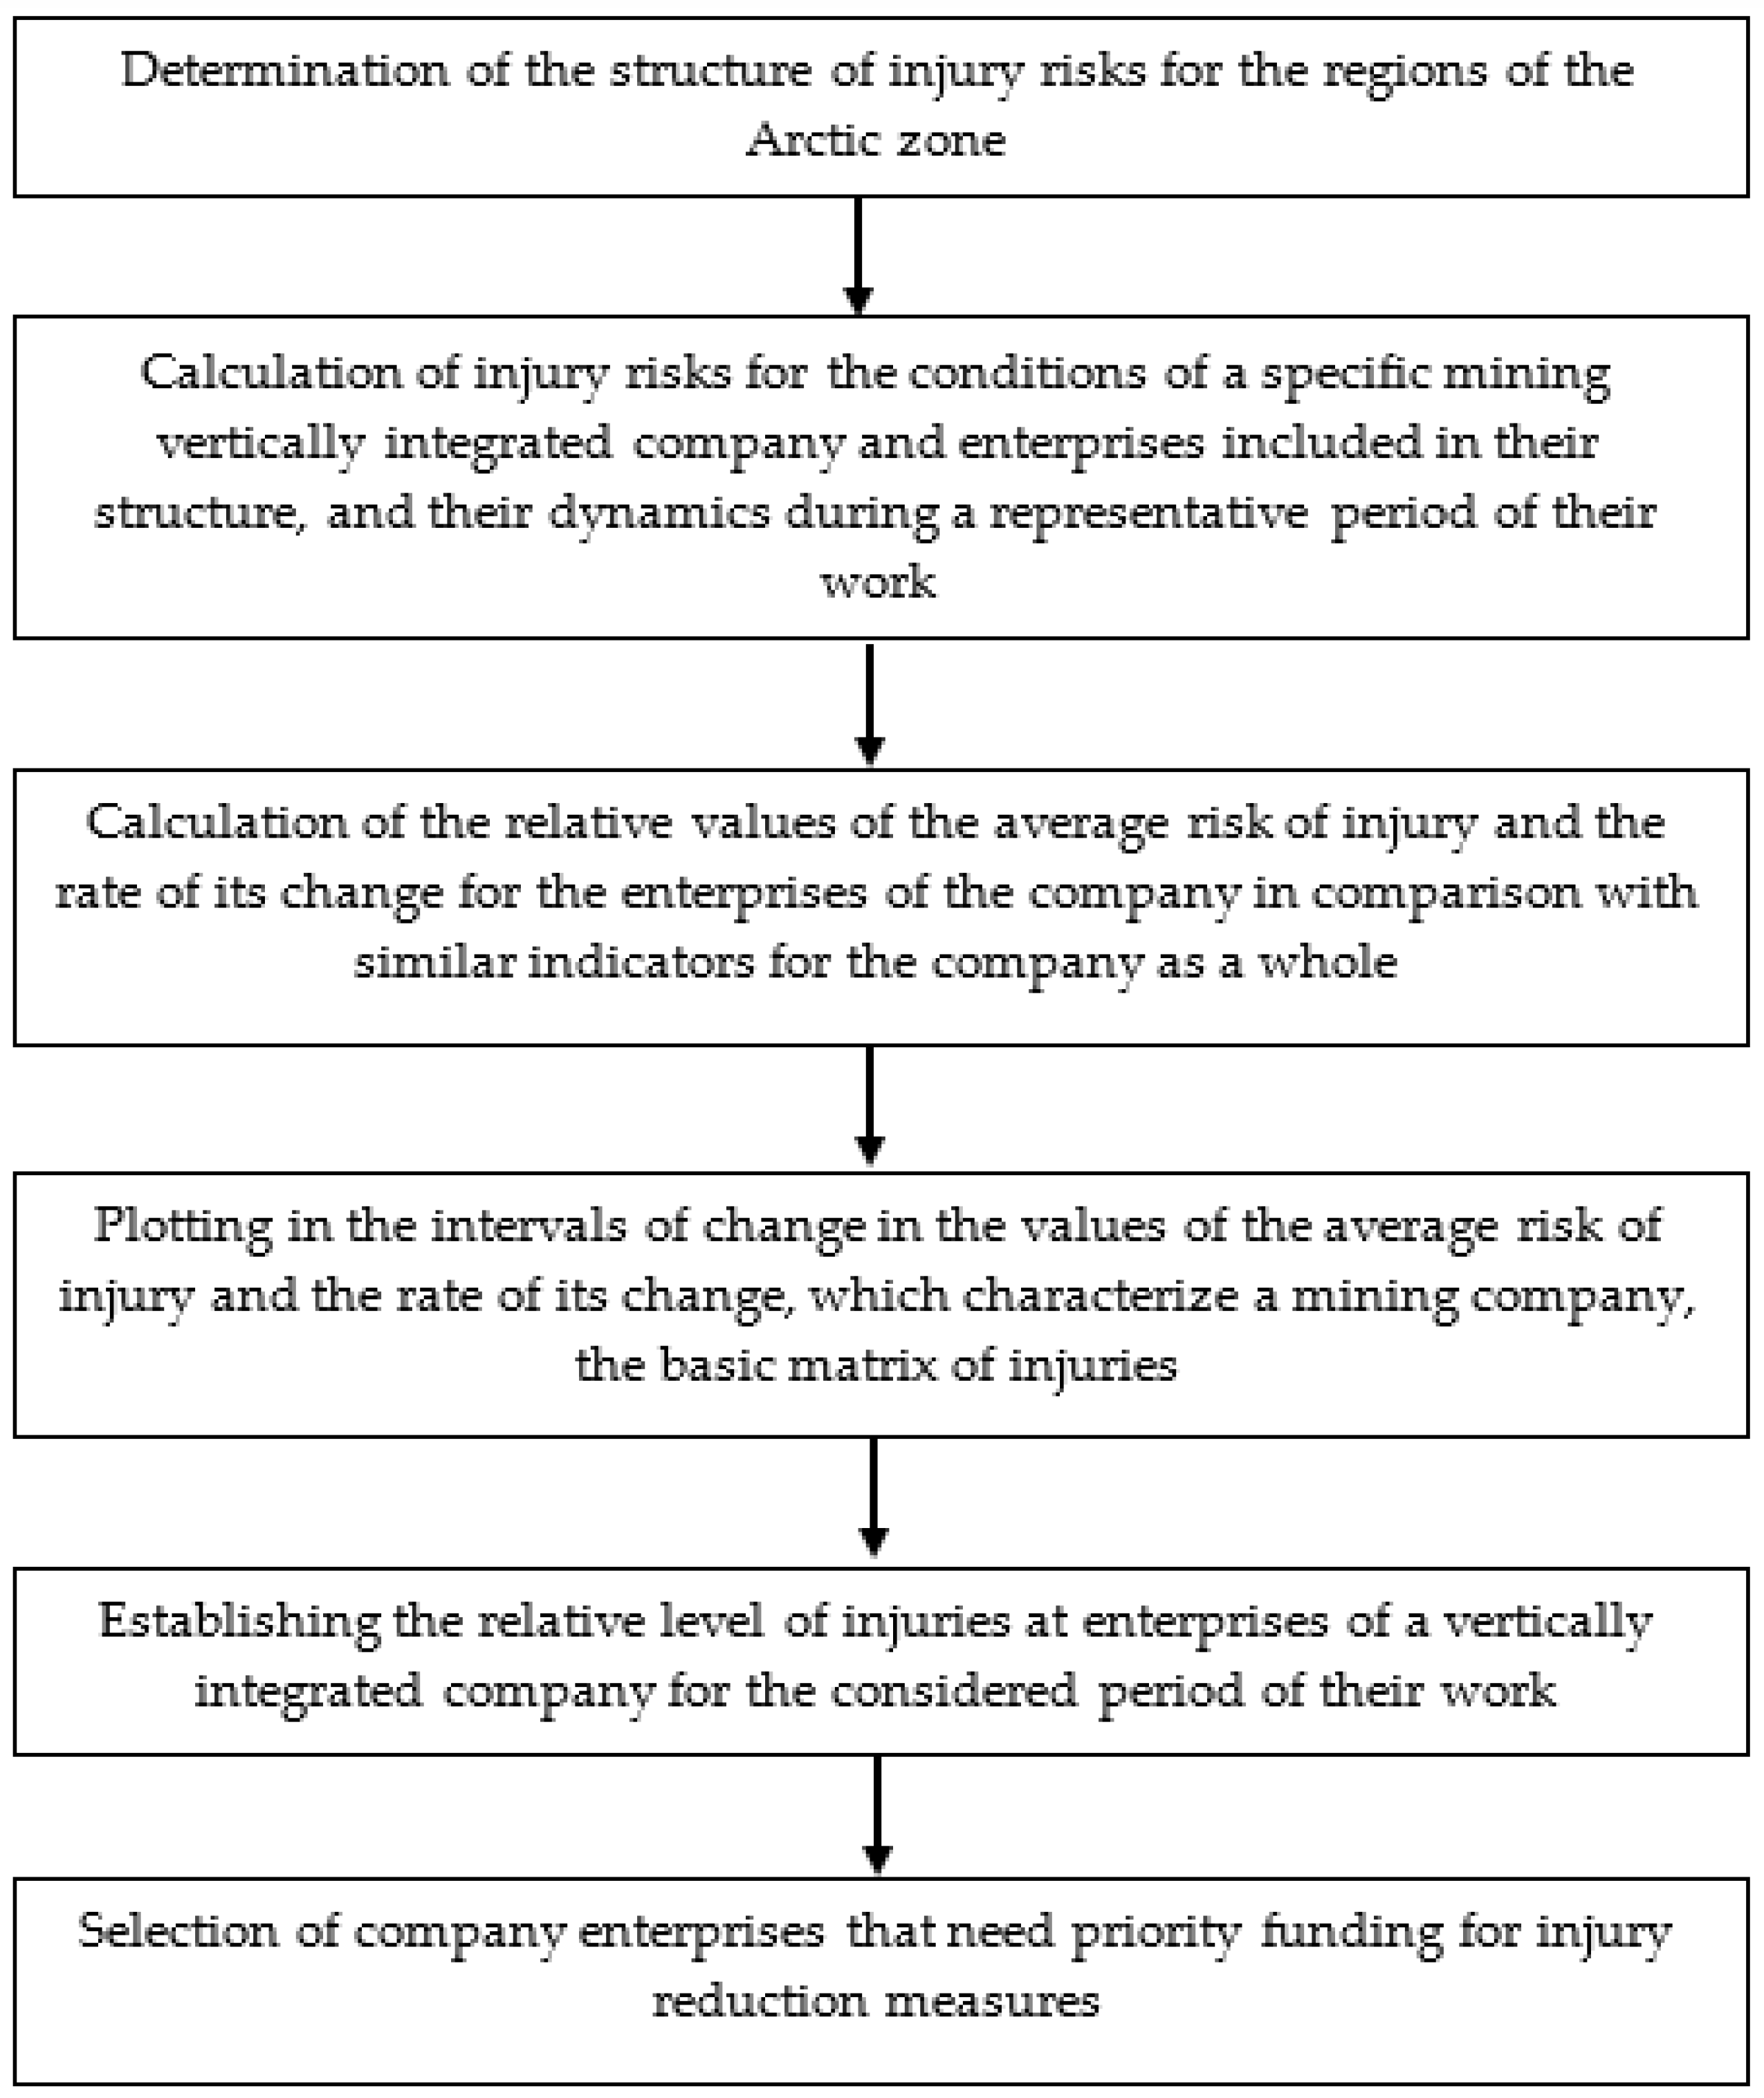
  • The ranking of vertically integrated companies by occupational injury rates should be done according to two criteria: the average injury risk level and its rate of change at every corporate division compared to the same indicators for the company as a whole.
  • “The matrix of injury risks”—with colored segments signifying acceptable, satisfactory, unsatisfactory, and critical injury rates—can be used to visualize the results of the comparative analysis of occupational injury rates and to determine the priority directions for labor safety improvement.

Author Contributions

S.G.–formulation of the study purpose and goals, elaboration of methodology for determining priority directions for the improvement of occupational safety as well as the development of the assessment and calculation methods for the effects of the background and occupational risks on labor safety. E.P.–assessment of influence of the background and occupational risks on the structure of overall injury rates, development of the matrix showing the relative changes in injury rates for mining areas of the Kirov branch of “Apatit”, JSC. All authors have read and agreed to the published version of the manuscript.

Funding

This research received no external funding.

Conflicts of Interest

The author declares no conflict of interest.

References

  1. Gridina, E.B.; Pasynkov, A.V.; Andreev, R.E. Comprehensive approach to managing the safety of miners in coal mines. In Innovation-Based Development of the Mineral Resources Sector: Challenges and Prospects-11th conference of the Russian-German Raw Materials, 7–8 November 2018; CRC Press: Boca Raton, FL, USA, 2018; pp. 85–94. [Google Scholar]
  2. Arsentiev, E.N. Efficiency and Human Health in the North; Kola Research and Development Center “VALEOS”: Murmansk, Russia, 1993; pp. 34–35. Available online: https://sharikov.jofo.me/1552261.html (accessed on 28 February 2021).
  3. Karnachev, I.P. Analysis of statistical indicators of occupational safety and health used in the study of the dynamics of industrial injuries. Vestn. MGTU 2011, 14, 751–757. [Google Scholar]
  4. Pavlenko, V.I. The Arctic zone of the Russian Federation in the system of ensuring the national interests of the country. Arct. Ecol. Econ. 2013, 4, 16–25. [Google Scholar]
  5. Litvinenko, V.S. Digital Economy as a Factor in the Technological Development of the Mineral Sector. Nat. Resour. Res. 2019, 28, 1–21. [Google Scholar] [CrossRef]
  6. Iakovleva, E.; Belova, M.; Soares, A. Specific features of mapping large discontinuous faults by the method of electromagnetic emission. Resources 2020, 9, 135. [Google Scholar] [CrossRef]
  7. Dal, N.N. Improving the occupational safety of personnel in coal mines in Vorkuta based on environmental, socio-economic and organizational factors: Avtoref. Dis. cand. tech. Sciences, Saint Petersburg State Mining University, SPb, 2011; 20p. Available online: https://dlib.rsl.ru/viewer/01005003932#?page=1 (accessed on 15 September 2020).
  8. Galkin, V.A.; Makarov, A.M.; Kravchuk, I.L. Safety production organization theory and methodology. Coal 2016, 4, 39–43. [Google Scholar] [CrossRef]
  9. Fainburg, G.Z.; Fedorets, A.G. Current issues of labor protection at the present stage. Saf. Labor Prot. 2018, 3, 1–22. [Google Scholar]
  10. Rudakov, M.L.; Kolvakh, K.A.; Derkach, I.V. Assessment of environmental and occupational safety in mining industry during underground coal mining. J. Environ. Manag. Tour. 2020, 11, 579–588. [Google Scholar] [CrossRef]
  11. Samarov, L.Y. Substantiation of the system of indicators for assessing industrial injuries in vertically integrated coal companies: Avtoref. Dis. cand. tech. Sciences, Saint Petersburg Mining University, SPb, 2017; 20p. Available online: https://spmi.ru/sites/default/files/imci_images/sciens/dissertacii/2017/2017-3/avtoreferat_samarov.pdf (accessed on 20 September 2020).
  12. Laitinen, H.; Rasa, P.-L.; Lankinen, T.; Lechtel, J.; Leskinen, T. Manual on Monitoring Working Conditions in the Workplace in Industry. The Elmery System; Institute of occupational health of Finland: Helsinki, Finland, 2000; pp. 3–5. [Google Scholar]
  13. Canadian Centre for Occupational Health and Safety. Available online: https://www.ccohs.ca/oshanswers/hsprograms/risk_assessment.html (accessed on 3 September 2020).
  14. Canadian Centre for Occupational Health and Safety. Available online: https://www.ccohs.ca/oshanswers/hsprograms/sample_risk.html (accessed on 3 September 2020).
  15. Head, G.L. Essentials of Risk Control; Insurance Institute of America: Malvern, PA, USA, 1989; Volumes 1 and 2. [Google Scholar]
  16. Siddiqui, N.A.; Nandan, A.; Sharma, M.; Srivastava, A. Risk Management Techniques HAZOP & HAZID Study. Int. J. OHSFE-Allied Sci. 2014, 1, 5–8. [Google Scholar]
  17. Gendler, S.G.; Grishina, A.M.; Samarov, L.Y. Assessment of the Labour Protection Condition in the Vertically Integrated coil Companies on the Basis of Risk-Based Approach to Analysis of Industrial Injuries; Saint Petersburg Mining University: Saint Petersburg, Russia, 2018; pp. 507–517. [Google Scholar]
  18. Eurostat Statistics Explained. Available online: https://ec.europa.eu/eurostat/statistics-explained/index.php/Accidents_at_work_statistics (accessed on 20 January 2021).
  19. Decree of the President of the Russian Federation No. 296 of 2 May 2014 on the land territories of the Arctic zone of the Russian Federation. Available online: http://kremlin.ru/acts/bank/38377 (accessed on 7 November 2020).
  20. Chernova, G.V.; Kudryavtsev, A.A. Risk Management; Prospect: Moscow, Russia, 2003; pp. 94–97. Available online: https://www.elibrary.ru/item.asp?id=19744981 (accessed on 28 February 2021).
  21. Iphar, M.; Cukurluoz, A.K. Fuzzy Risk Assessment for Mechanized Underground Coal Mines in Turkey. Int. J. Occup. Saf. Ergon. 2018, 3, 110–158. [Google Scholar] [CrossRef] [PubMed]
  22. Kabanov, E.I. Expert System for Complex Express-Assessment and Forecast of Accidents Risk and Professional Risks on Coal Mines. Min. Inf. Anal. Bull. 2019, 4, 78–86. [Google Scholar]
  23. Federal State Statistics Service of Russia. Available online: https://rosstat.gov.ru/working_conditions?print=1 (accessed on 15 September 2020).
  24. Radosavljevića, S.; Radosavljević, M. Risk assessment in mining industry: Apply management. Serb. J. Manag. 2009, 4, 91–104. [Google Scholar]
  25. Filimonov, V.A.; Gorina, L.N. Development of an occupational safety management system based on the process approach. J. Min. Inst. 2019, 235, 113–122. [Google Scholar] [CrossRef]
  26. Artemiev, V.B.; Lisovsky, V.V.; Tcinoshkin, G.M.; Kravchuk, I.L. SUEK Heading to “Zero Injury” Target. Coal 2018, 8, 71–73. [Google Scholar] [CrossRef]
  27. Gendler, S.G.; Rudakov, M.L.; Falova, E.S. Analysis of the risk structure of injuries and occupational diseases in the mining industry of the Far North of the Russian Federation. Nauk. Visnyk Natsionalnoho Hirnychoho Universytetu 2020, 3, 81–85. [Google Scholar] [CrossRef]
  28. Botin, J.A.; Guzman, R.R.; Smith, M.L. A methodological model to assist in the optimization and risk management of mining investment decisions. Dyna 2011, 78, 221–226. [Google Scholar]
  29. Abdrakhimova, I.R.; Zagrieva, G.D.; Mukhametshin, A.K.; Pashkevich, V.C. Development of a risk assessment methodology. Young Sci. Bull. USPTU 2016, 4, 139–146. [Google Scholar]
  30. Kretschmann, J.; Plien, M.; Nguyen, T.H.N.; Rudakov, M. Effective capacity building by empowerment teaching in the field of occupational safety and health management in mining. J. Min. Inst. 2020, 242, 248–256. [Google Scholar] [CrossRef]
  31. Bohus Leitner, A. General Model for Railway Systems Risk Assessment with the Use of Railway Accident Scenarios Analysis. Procedia Eng. 2017, 187, 150–159. [Google Scholar] [CrossRef]
  32. Krause, M. Hazards and occupational risk in hard coal mines—A critical analysis of legal requirements. Semant. Sch. 2017, 268, 5–6. [Google Scholar] [CrossRef]
  33. Tian, D.H.; Zhao, C.L.; Wang, B.; Zhou, M. Media-in method for assessing security risks in the oil and gas industry based on interval numbers and risk approaches. Artif. Intell. Eng. Appl. 2019, 85, 269–283. [Google Scholar] [CrossRef]
  34. Wang, W.; Jiang, X.; Xia, S.; Cao, Q. Incident tree model and incident tree analysis method for quantified risk assessment. An in-depth accident study in traffic operation. Saf. Sci. 2010, 48, 1248–1262. [Google Scholar] [CrossRef]
  35. Shi, X.; Wong, Y.D.; Li, M.Z.F.; Chai, C. Key risk indicators for accident assessment conditioned on pre-crash vehicle trajectory. Accid. Anal. Prev. 2018, 117, 346–356. [Google Scholar] [CrossRef] [PubMed]
  36. Cherepovitsyn, A.E.; Ilyinova, A.A.; Evseeva, O.O. Stakeholders management of carbon sequestration project in the state-business—Society system. J. Min. Inst. 2019, 240, 731–742. [Google Scholar] [CrossRef] [Green Version]
Figure 1. The Arctic zone of the Russian Federation. 1—Murmansk region; 2—Republic of Karelia; 3—Arkhangelsk region; 4—Nenets Autonomous Area; 5—Yamalo-Nenets Autonomous District; 6—Krasnoyarsk Territory; 7—Sakha Republic (Yakutia); 8—Chukotka Autonomous District; 9—Komi Republic (as part of Vorkuta City District).
Resources 10 00020 g001
Figure 2. Share of the Arctic zone’s mineral deposits in the total of Russia’s mineral reserves.
Resources 10 00020 g002
Figure 3. Fatal injury risk for different countries.
Resources 10 00020 g003
Figure 4. Algorithm for selecting priority avenues for reducing the injury rate.
Resources 10 00020 g004
Figure 5. Injury risk diagram for the Arctic region.
Resources 10 00020 g005
Figure 6. Overall injury risk for the Arctic zone.
Resources 10 00020 g006
Figure 7. Causes of accidents for the Arctic zone.
Resources 10 00020 g007
Figure 8. Share of the background risks and occupational risks in the overall injury risks.
Resources 10 00020 g008
Figure 9. Occupational injury rates at the mines of Apatit.
Resources 10 00020 g009
Figure 10. Matrix of the relative change in injury risk rates at the mines of the Kirov branch of “Apatit”, JSC.
Resources 10 00020 g010
Figure 11. Matrix of changes in occupational injury risk levels over a 10-year period at the mines of the Kirov branch of “Apatit”, JSC.
Resources 10 00020 g011
Table 1. Background risks of occupational injury for the Arctic zone ( 10 3 ).
Year2010201120122013201420152016201720182019
Place
Chukotka Autonomous Region0.0770.0220.1230.0210.3250.0680.2070.5140.3970.579
The Sakha Republic (Yakutia)0.0540.3150.2350.1350.0920.1800.1360.2390.3380.553
Yamalo-Nenets Autonomous District0.2320.2060.3240.3600.1390.0700.2890.2100.1990.321
Murmansk Region0.0330.0490.3060.1750.1880.2320.1100.0650.0250.226
Arkhangelsk Region0.0520.1670.2650.1410.1600.1230.0660.0120.0370.077
Nenets Autonomous Area0.2180.1830.4440.6350.3700.3090.1190.1810.0390.372
Arkhangelsk Region without JSC0.2410.4770.5240.2540.3280.2420.1770.0830.0880.123
Komi Republic0.0250.0560.1410.1090.1240.1200.2360.0810.0430.012
Krasnoyarsk Territory0.0570.1340.0440.0350.0000.0590.0500.0290.0130.004
Table 2. Values of the relative change in injury risks ( Δ R ¯ ) and the relative change in their rates ( Δ V ¯ ) and their reciprocals 1 / Δ V ¯ for the company mines.
Minename Δ R ¯ k i r Δ R ¯ r a s Δ R ¯ E s t Δ R ¯ C e n t Δ V ¯ K i r Δ V ¯ r a s Δ V ¯ e s t Δ V ¯ C e n t 1 Δ V ¯ K i r 1 Δ V ¯ R a s 1 Δ V ¯ E s t 1 Δ V ¯ C e n t
Year
20091.9983.41912.5740.812231610.50.330.061
20101.5322.7068.5471.196
201102.77612.7190.684
20121.2822.1375.9830.940
20131.5382.3079.0520.812
20141.5381.70910.2650.979
20151.2822.1376.2290.385
20160.9322.1370.4270
20170.0851.7091.2820
20180.5020.0850.0850
Publisher’s Note: MDPI stays neutral with regard to jurisdictional claims in published maps and institutional affiliations.

