
Is the Microfiltration Process Suitable as a Method of Removing Suspended Solids from Rainwater?


Department of Water and Wastewater Technology, Faculty of Civil and Environmental Engineering, Gdansk University of Technology, 11/12 Narutowicza Street, 80-233 Gdansk, Poland
*
Author to whom correspondence should be addressed.
Resources 2021, 10(3), 21; https://0-doi-org.brum.beds.ac.uk/10.3390/resources10030021
Submission received: 4 February 2021
/
Revised: 18 February 2021
/
Accepted: 23 February 2021
/
Published: 2 March 2021
Abstract
:Due to climate change and anthropogenic pressure, freshwater availability is declining in areas where it has not been noticeable so far. As a result, the demands for alternative sources of safe drinking water and effective methods of purification are growing. A solution worth considering is the treatment of rainwater by microfiltration. This study presents the results of selected analyses of rainwater runoff, collected from the roof surface of individual households equipped with the rainwater harvesting system. The method of rainwater management and research location (rural area) influenced the low content of suspended substances (TSS < 0.02 mg/L) and turbidity (< 4 NTU). Microfiltration allowed for the further removal of suspension particles with sizes larger than 0.45 μm and with efficiency greater than 60%. Granulometric analysis indicated that physical properties of suspended particles vary with the season and weather. During spring, particles with an average size of 500 μm predominated, while in autumn particles were much smaller (10 μm). However, Silt Density Index measurements confirmed that even a small amount of suspended solids can contribute to the fouling of membranes (SDI > 5). Therefore, rainwater cannot be purified by microfiltration without an appropriate pretreatment.
1. Introduction
Anthropopression, along with an unavoidable climate crisis, will appear in the near future as there will be a significant shortage of sweet water and more frequent extreme natural phenomena, such as floods or droughts. Mentioned phenomena are, among others, caused by improper rainwater management in the environment changed by humans. Rainwater should not be regarded as a source of risk, but rather as a valuable natural resource that should not be wasted. Rainwater and stormwater retention is said to be an important example of circular economy solutions [1]. It can be used for irrigation of agricultural fields [2], and in individual households, commercial, and public facilities as an alternative source of water [3,4,5,6,7] or as an element of landscape (i.e., rain gardens [8,9]). In individual households, the most popular are rainwater harvesting systems (RWHS) that enable the collection, pretreatment, storage, and subsequent use of rainwater. Such solutions are usually integrated with property drainage systems. Water is collected from roofs of buildings, balconies, and terraces, and less often from other hardened/sealed surfaces (driveways, parking spaces). Due to possible contamination, rainwater after initial mechanical pretreatment is used for purposes that do not require the highest quality water, such as flushing toilets, washing, or irrigation. In all of these applications, the use of raw rainwater does not pose a health threat to users. Nevertheless, significant depletion of freshwater resources or their pollution requires the use of rainwater for hygienic and consumption purposes as well. Such practices are commonly applied in tropical areas (e.g., Africa or Australia). Because of climate and anthropogenic changes, it may also become a necessity for other regions of the world, including Europe. Moreover, rainwater as an alternative source of water may be the only solution in cases where construction of a water supply network is unprofitable due to the transmission distance, whereas existing water sources (like individual groundwater intakes) are too polluted to exploit. Thus, a question arises whether rainwater is a safe source. What are the conditions and processes that must be used to prepare it as a drinking water?
In Poland, water intended for human consumption must fulfill high quality standards of the Drinking Water Directive [10], which was transposed into the regulation of the Ministry of Health [11]. For hygienic purposes, water must meet the same stringent parameters of quality. Potable water is usually produced in multi-stage purification processes, and the more complex, the higher the degree of water pollution. When the source is heavily contaminated, the cost of treating may outweigh the costs of abstracting water. Moreover, available resources of groundwater and surface waters are increasingly limited. Therefore, innovative solutions are investigated to ensure effective application for alternative water sources that are seemingly difficult to use. Depending on the location (and local environment pollution), rainwater can be of relatively good quality (sometimes much better than surface waters). It can be treated by filtration with activated carbon, wetland systems, UV radiation, or chlorination [12,13,14]. While nature-based solutions have a landscape-shaping function and are willingly used to reintroduce runoff to the environment, the physical and chemical methods are appropriate for the preparation of rainwater for consumption purposes. Among many processes, microfiltration is worth considering, as it does not generate harmful byproducts. Despite high operating costs of such systems, membrane techniques are said to be one of the most effective and versatile methods of water treatment [15,16]. In order to verify this assumption, studies were conducted to check the usefulness of membrane techniques in the treatment of rainwater. The extension and modification of a commonly available rainwater management system (rainwater rooftop harvesting system) with a highly efficient cleaning system based on a membrane module was considered, so that rainwater can become a source of water used economically in a wider range. The studies referred to the results of microfiltration on filters with a pore size of 0.45 μm, and particles of this size were intended to be removed. The suitability of the use of membrane techniques in the treatment of rainwater was tested with the SDI measurement system (SDI: Silt Density Index or micro-suspension contamination index). Conventional parameters, such as turbidity and total suspended solids relating to substances undissolved in water, were also measured, because the presence of suspensions in water has a direct impact on the applicability of membranes due to the phenomenon of fouling, i.e., blocking membranes [17,18]. Additionally, particle size measurements with the laser granulometer were carried out, which were an important element of the characteristics of undissolved substances present in the tested rainwater. The main objective of the research was to demonstrate whether rainwater can be treated by microfiltration to achieve a purity level intended for human consumption.
2. Materials and Methods
2.1. Analyzed Object and Samples Collection
Field research was conducted in the village of Bogaczewo, located in the western part of the Warmian-Masurian Voivodeship, in Poland. The considered object is situated in a small tourist settlement near Narie lake, surrounded by farmlands and forests. The building is an individual settlement unit (summer house) equipped with a rainwater collection system. Rainwater is used to flush the toilet and as an additional water source for household purposes (watering the garden, cleaning works, etc.). Rainwater is collected only from the roof surface. The rainwater harvesting system is a type of direct (pressure) system, the basic elements of which are an underground water storage tank and drain well. It serves as a reservoir of water, where initial treatment takes place during transport (mechanical pretreatment with filters on gutters or transporting pipes and basket filter) and retention in the tank. By introducing an additional stage (with microfiltration) in the treatment system, it was planned that rainwater could also become a source of drinking water.
Studies were carried out for a period of four years (from May 2014 to December 2017). Rainwater samples were collected from the storage tank after sedimentation, at a frequency of not less than once a month. As a reference, rainwater was occasionally taken during rainfall directly from the roof. Then, water was collected in a plastic tank with a capacity of 20 L, without subsequent storage. From December to February/March, samples were obtained from the snow melt, from the research area not exposed to secondary pollution (tree needles, dust). Snow samples were collected at a distance from the building, from an area not planted with trees.
Physico-chemical analyses (turbidity measurement and total suspended solid determination) were performed in unfixed samples, immediately after sampling or after no more than 12 h of storage at 5 °C. Granulometric measurements and SDI tests were carried out in the last year of the research (in 2017). The samples for measurements (SDI coefficient, particle size measurement with laser granulometer) were stored for no longer than 78 h at 5 °C (also without fixation).
2.2. Methods
2.2.1. Total Suspended Solids Determination
Samples of raw rainwater runoff were subjected to the total suspended solid determination. Determination consisted of filtering an appropriate volume of the sample through the mixed cellulose ester membrane filters. Due to small amounts of suspension in the tested samples, the standard methodology of TSS determination was modified. Instead of filters with a pore size of 1.5 μm, filters with a pore size of 0.45 μm were applied. Then, filters were dried at 105 °C to a constant weight and after cooling were down-weighted.
2.2.2. Turbidity Measurements
The standard turbidity measurement method was used in the rainwater tests (PN-EN ISO 7027-1:2016-09 [19]). Measurement was carried out with a turbidimeter. The method is characterized by a higher sensitivity in the case of turbidity caused by colloidal particles, and is preferred especially in the lower measuring range. Turbidity was measured in two types of samples: unfiltered rainwater (RAW) and rainwater subjected to microfiltration (MF). Membrane filtration was performed using a conventional vacuum filtration system, consisting of a pump generating a negative pressure of 0.02 MPa and a microfiltration set. The transmembrane pressure was thus about 0.08 MPa. For filtration of the samples, membranes made of glass fiber with a diameter of 47 mm and a pore size of 0.45 μm were used.
On the basis of the obtained turbidity measurements, the percentage degree of reduction of turbidity by the microfiltration process was also calculated.
2.2.3. Particle Size Analysis
Measurements of suspended solid particle sizes present in the rainwater runoff and snowmelt were carried out with the laser diffraction particle size analyzer Mastersizer Hydro 2000MU (Malvern Panalytical Ltd., Malvern, UK) with the measuring range of 0.02–2000 μm. The measurement is based on the laser diffraction phenomenon (LALLS–low angle laser light scattering [20]), whereas results are presented as the particle size distribution. This mathematical function demonstrates the volume percent of particles with an equivalent diameter in relation to the total volume of all particles in the sample. Particle sizes are therefore obtained as an indirect result of volume calculation. The analyzer determines the characteristic values: d10, d50 (average dimension), and d90 diameters, which are accordingly defined as 10, 50, and 90% of the total volume of all measured particles, respectively [21]. Additionally, it also provides information about obscuration (also known as optical concentration), a ratio of light passing through the sample that is scattered or absorbed by molecules dispersed in the solution [22]. Obtained data were processed using Mastersizer 2000 V5.60 software that also enables the customization of the measurement settings, such as stirring speed or sensitivity.
2.2.4. Silt Density Index Test
Determination of the SDI test was performed according to the standard procedure for measuring the index, defined by ASTM International (ASTM standard test method D4189 [23]). The susceptibility of the membranes to fouling was measured as a decrease in volumetric flow rate during the 15 min filtration process through a filter membrane with a pore size of 0.45 μm, at a constant pressure of 207 kPa. The decrease in the volumetric flow rate resulted directly from blocking the pores of the membrane with the suspension present in the sample. Then, the SDI value was calculated according to the following formula:
where
SDI = ((1 − t0/t15)/15)∙100
t0—filtration time of 0.5 L of water through the membrane at the beginning of the test, and
t15—filtration time of 0.5 L of water through the membrane after 15 min of continuous operation of the system.
The value of the micro-suspension index calculated according to the equation should be lower than that required for the membranes (usually <3 or <5). Thus, it was possible to determine whether the membrane used in the tests would fulfill its role in the treatment of rainwater.
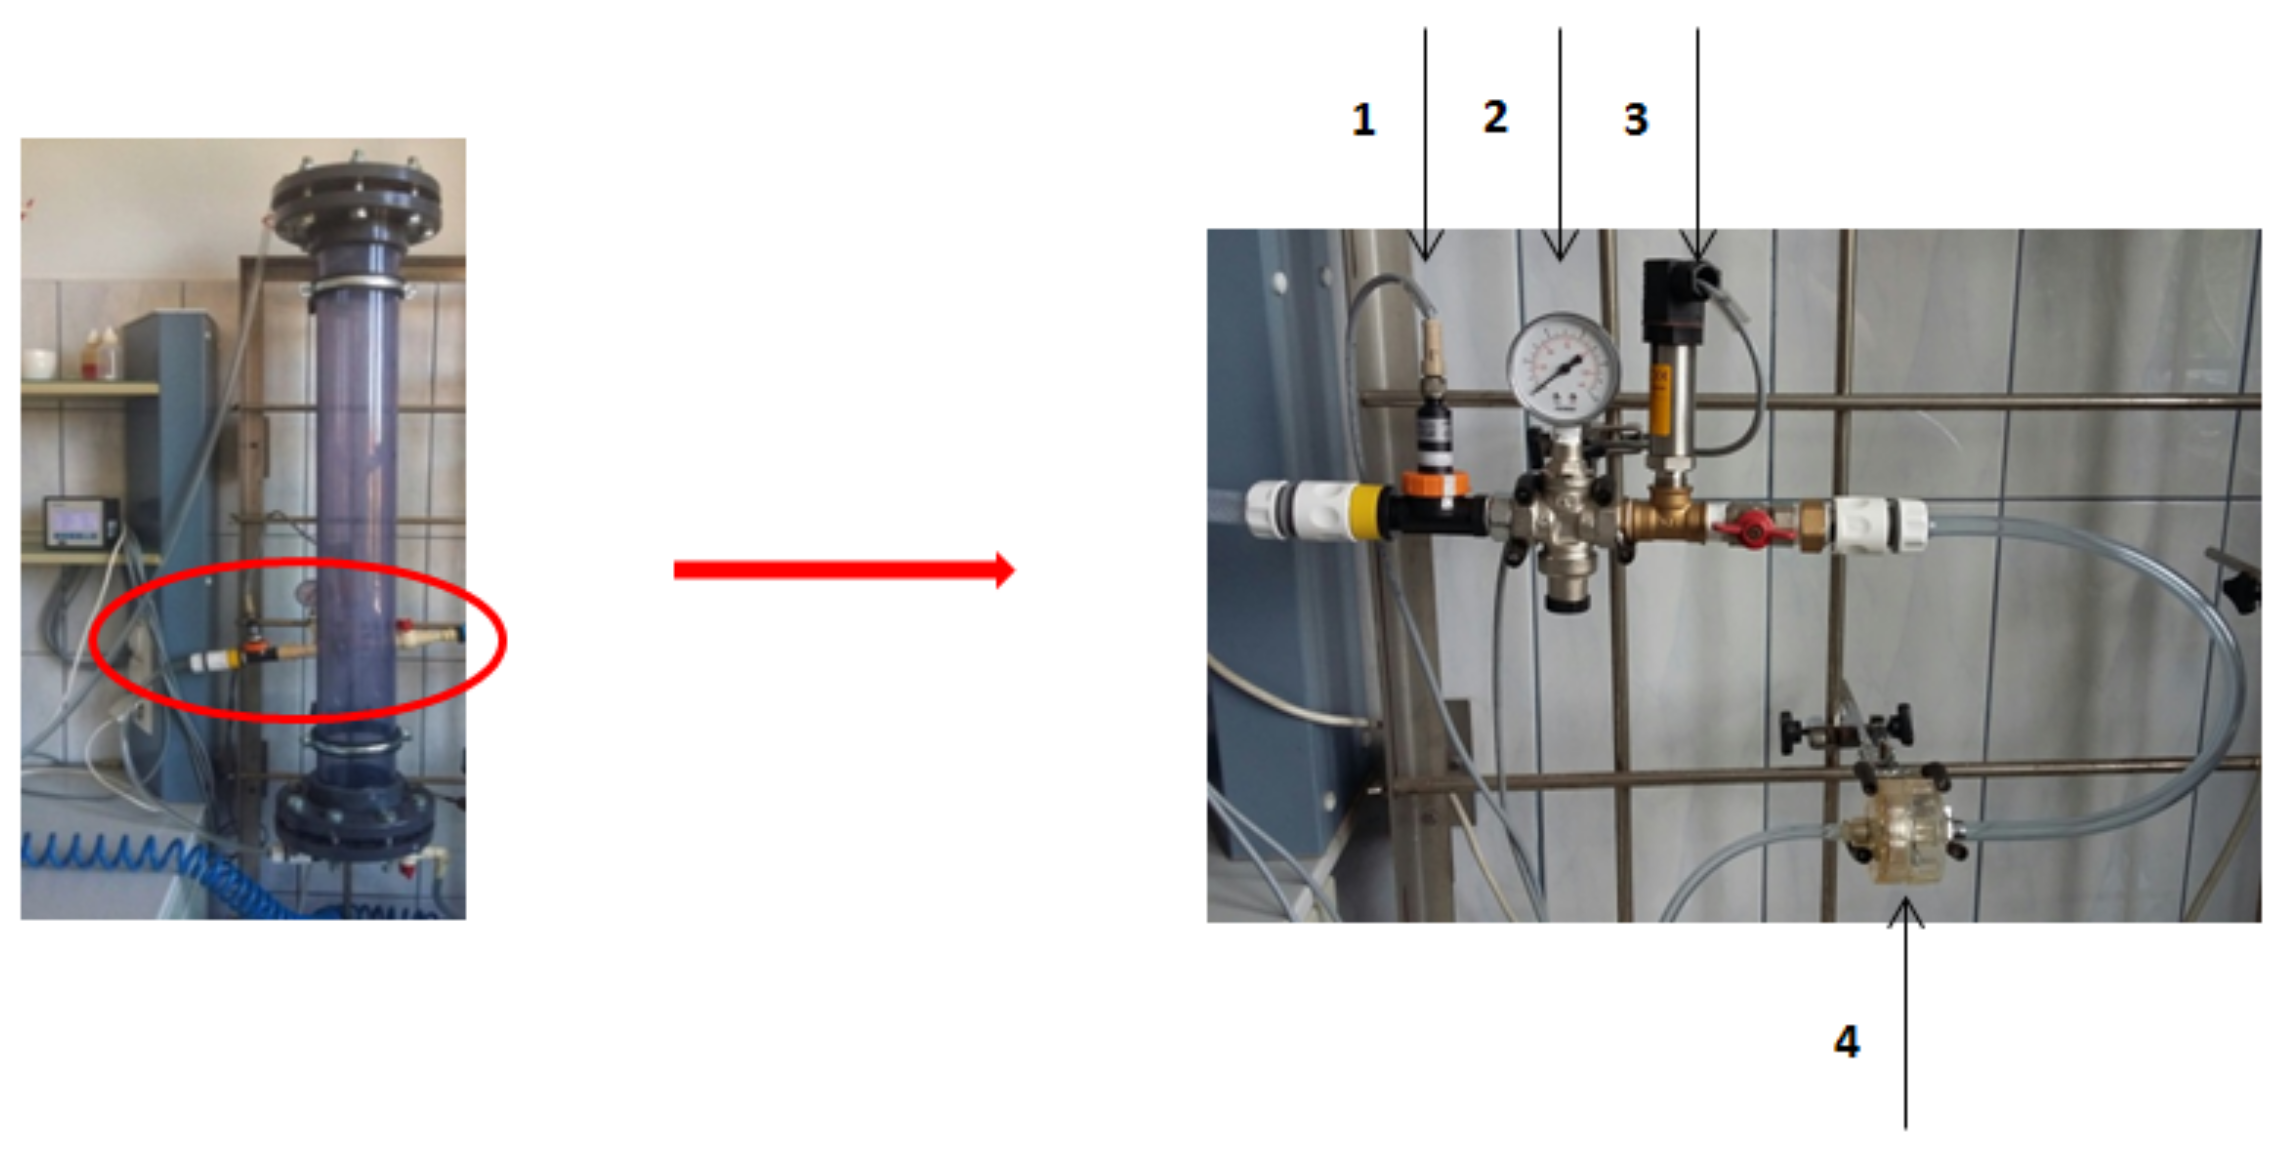
For purposes of the research, a test bench to measure the SDI of rainwater was created, as shown in Figure 1. The laboratory test bench consisted of a column made of acrylic glass with an estimated volume of 15 L, compressor, vacuum pump, membrane module (filter holder), pressure-reducing valve with a manometer, pressure transducer, and flowmeter, where the last two elements were connected to a digital recorder. In the research, the FP050/0 filter cell (Whatman) made of polysulfone was used, with a filter surface area of 12.5 cm2 [24].
3. Results
3.1. Total Suspended Solid Concentrations
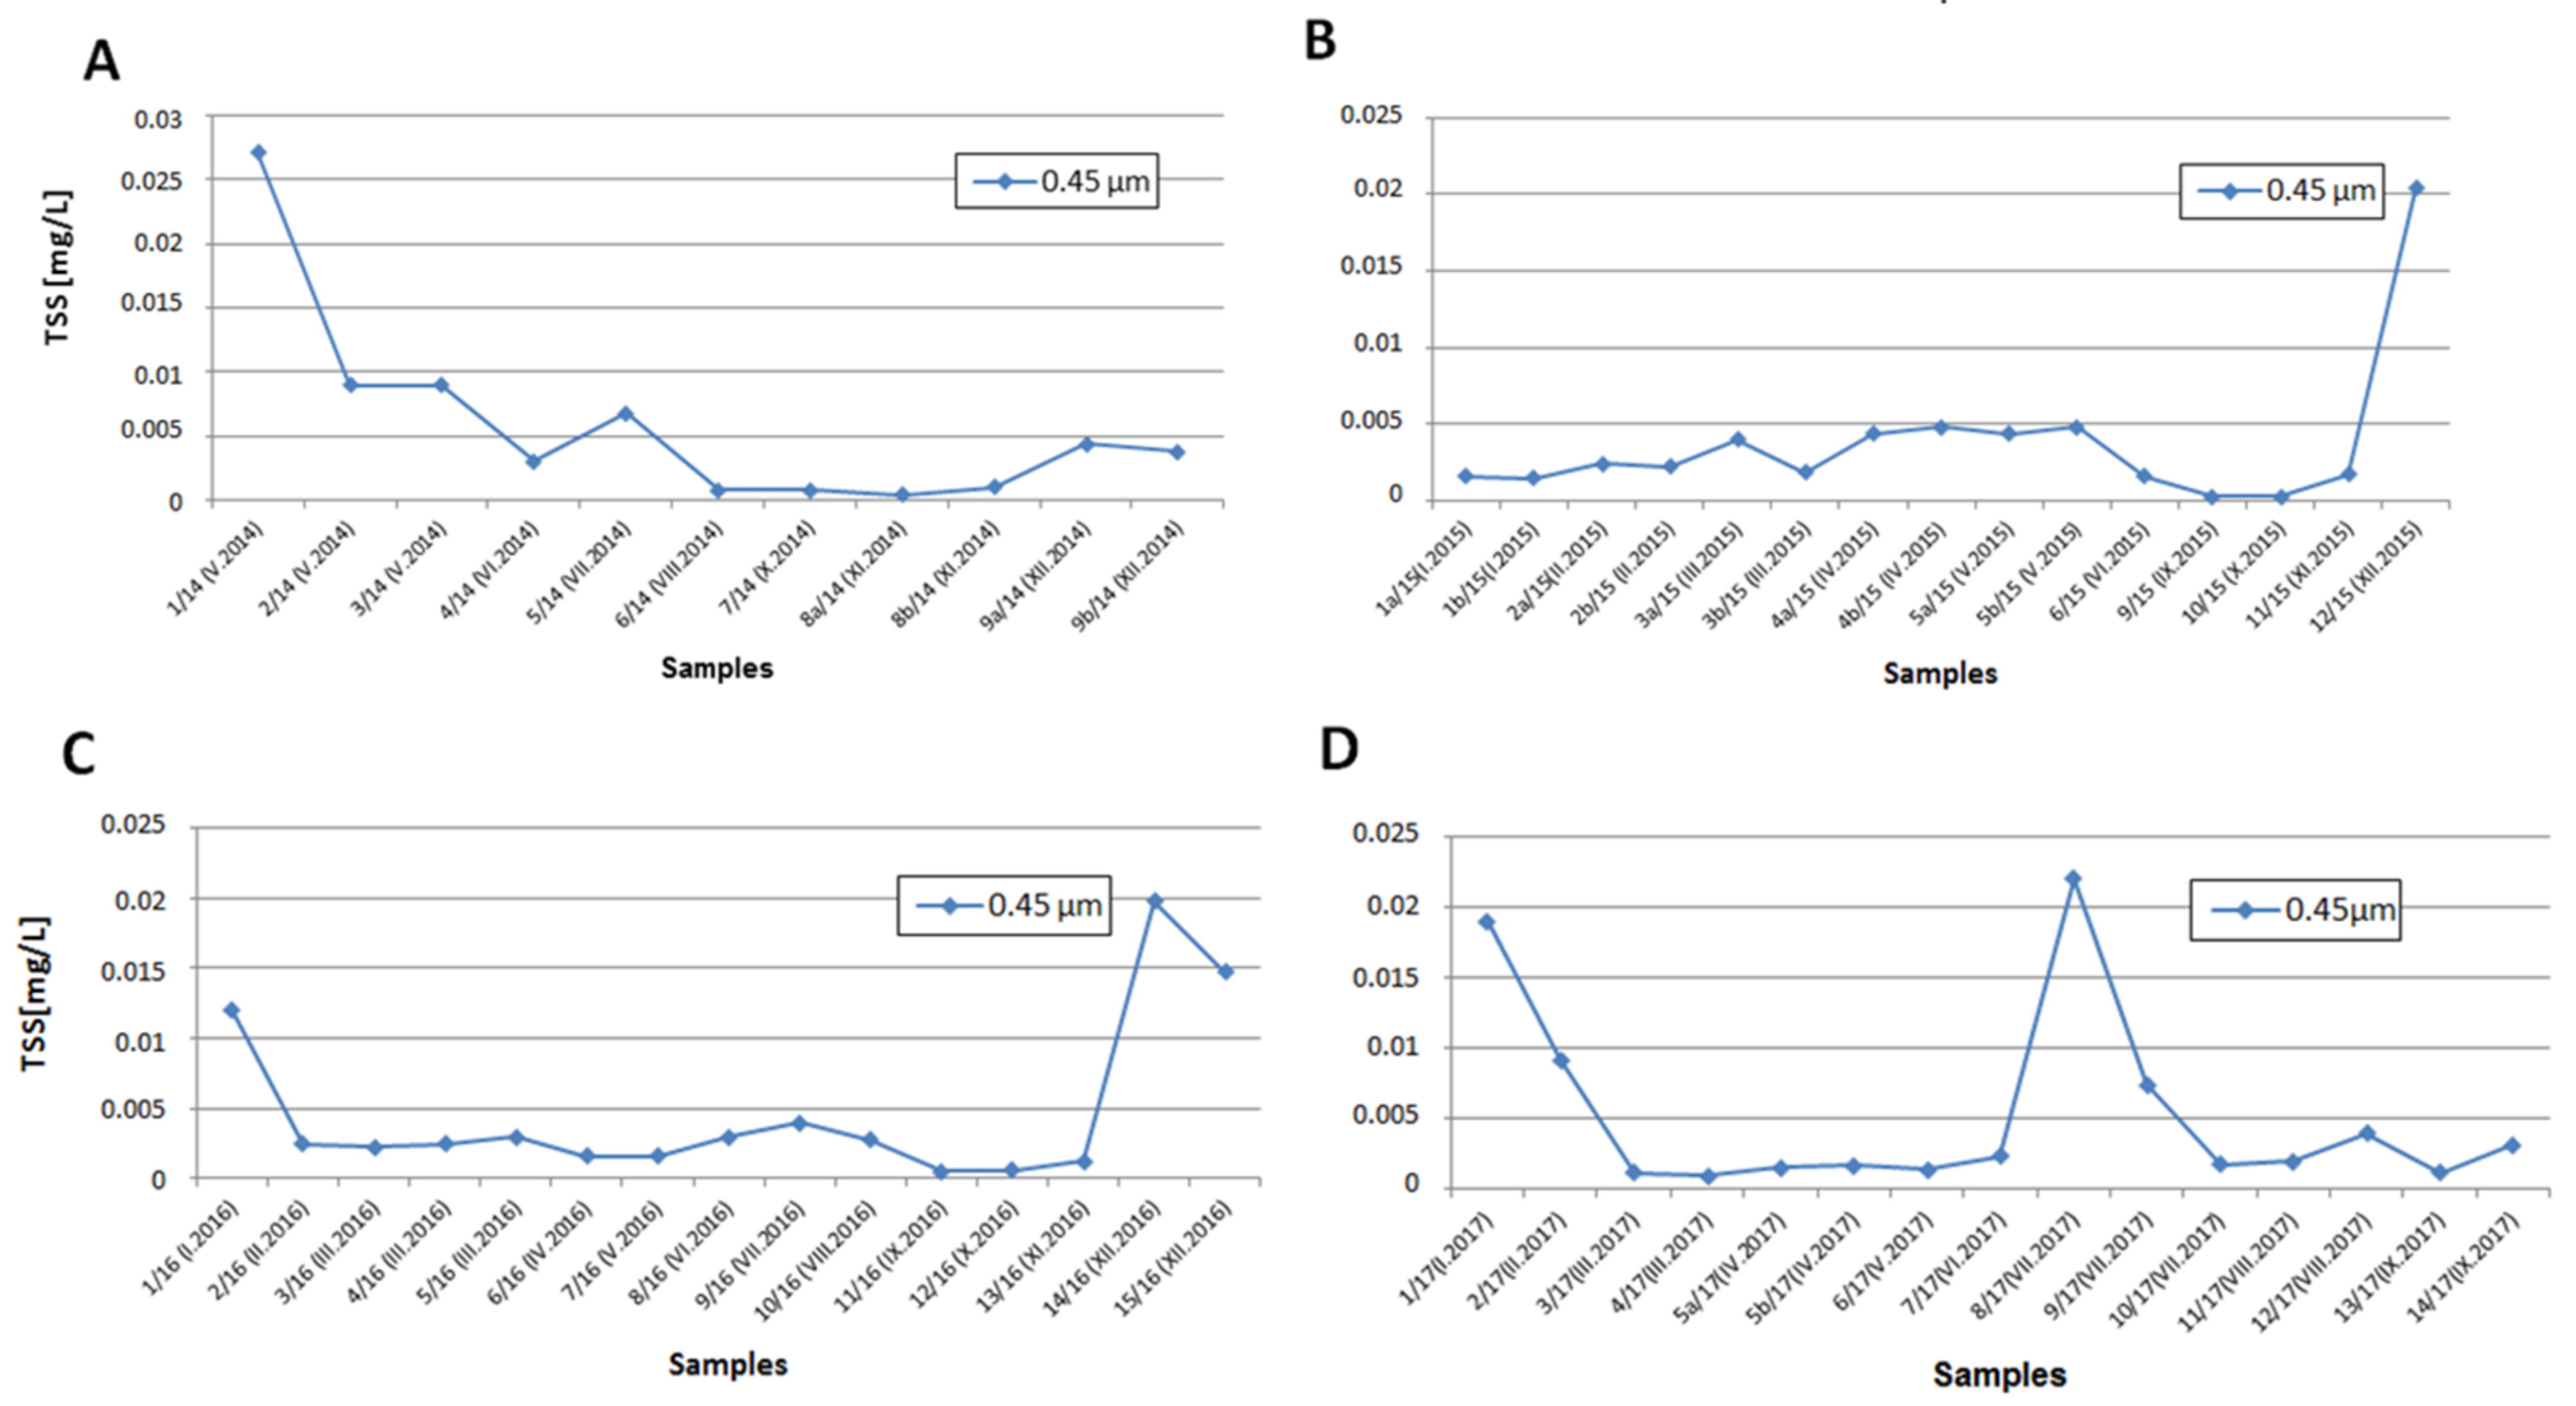
The concentration of total suspended solids in all samples of runoff obtained from Bogaczewo was relatively low, not higher than 0.027 mg/L. Such a result was noticed during the test in May 2014. Some increases in concentration were observed during the winter season for snowmelt (from December to February, in the range of 0.02 to 0.022 mg/L), as well as in the spring and autumn, when plant matter (pollen, leaves) appeared in the runoff. The general trend was values close to 0.005 mg/L.
The highest values of the suspension concentration were noticed in May 2014 (0.027 mg/L; Figure 2A–sample 1), November 2015 (0.021 mg/L; Figure 2B–sample 12), December 2016 (0.02 mg/L–snowmelt; Figure 2C-sample 14), and January and July 2017 (Figure 2D; accordingly: 0.019 mg/L–sample 1 and 0.022 mg/L–sample 8). However, in those cases, runoff samples were collected not from the retention tank, but directly from the roof (after sedimentation), and then TSS concentration was determined. Additionally, results from May 2014 (Figure 2A–samples 1–3) were part of the experiment that included rain phases (first 10, 20, and 30 min of rainfall) and changes in the runoff pollution degree with time. The suspension concentration for subsequent phases of rain were as follows: 0.027 mg/L (phase 1), 0.0089 mg/L (phase 2), and 0.0089 mg/L (phase 3), which indicates that the first flush of rainfall is the most polluted and decreases and stabilizes over time.
3.2. Turbidity Changes
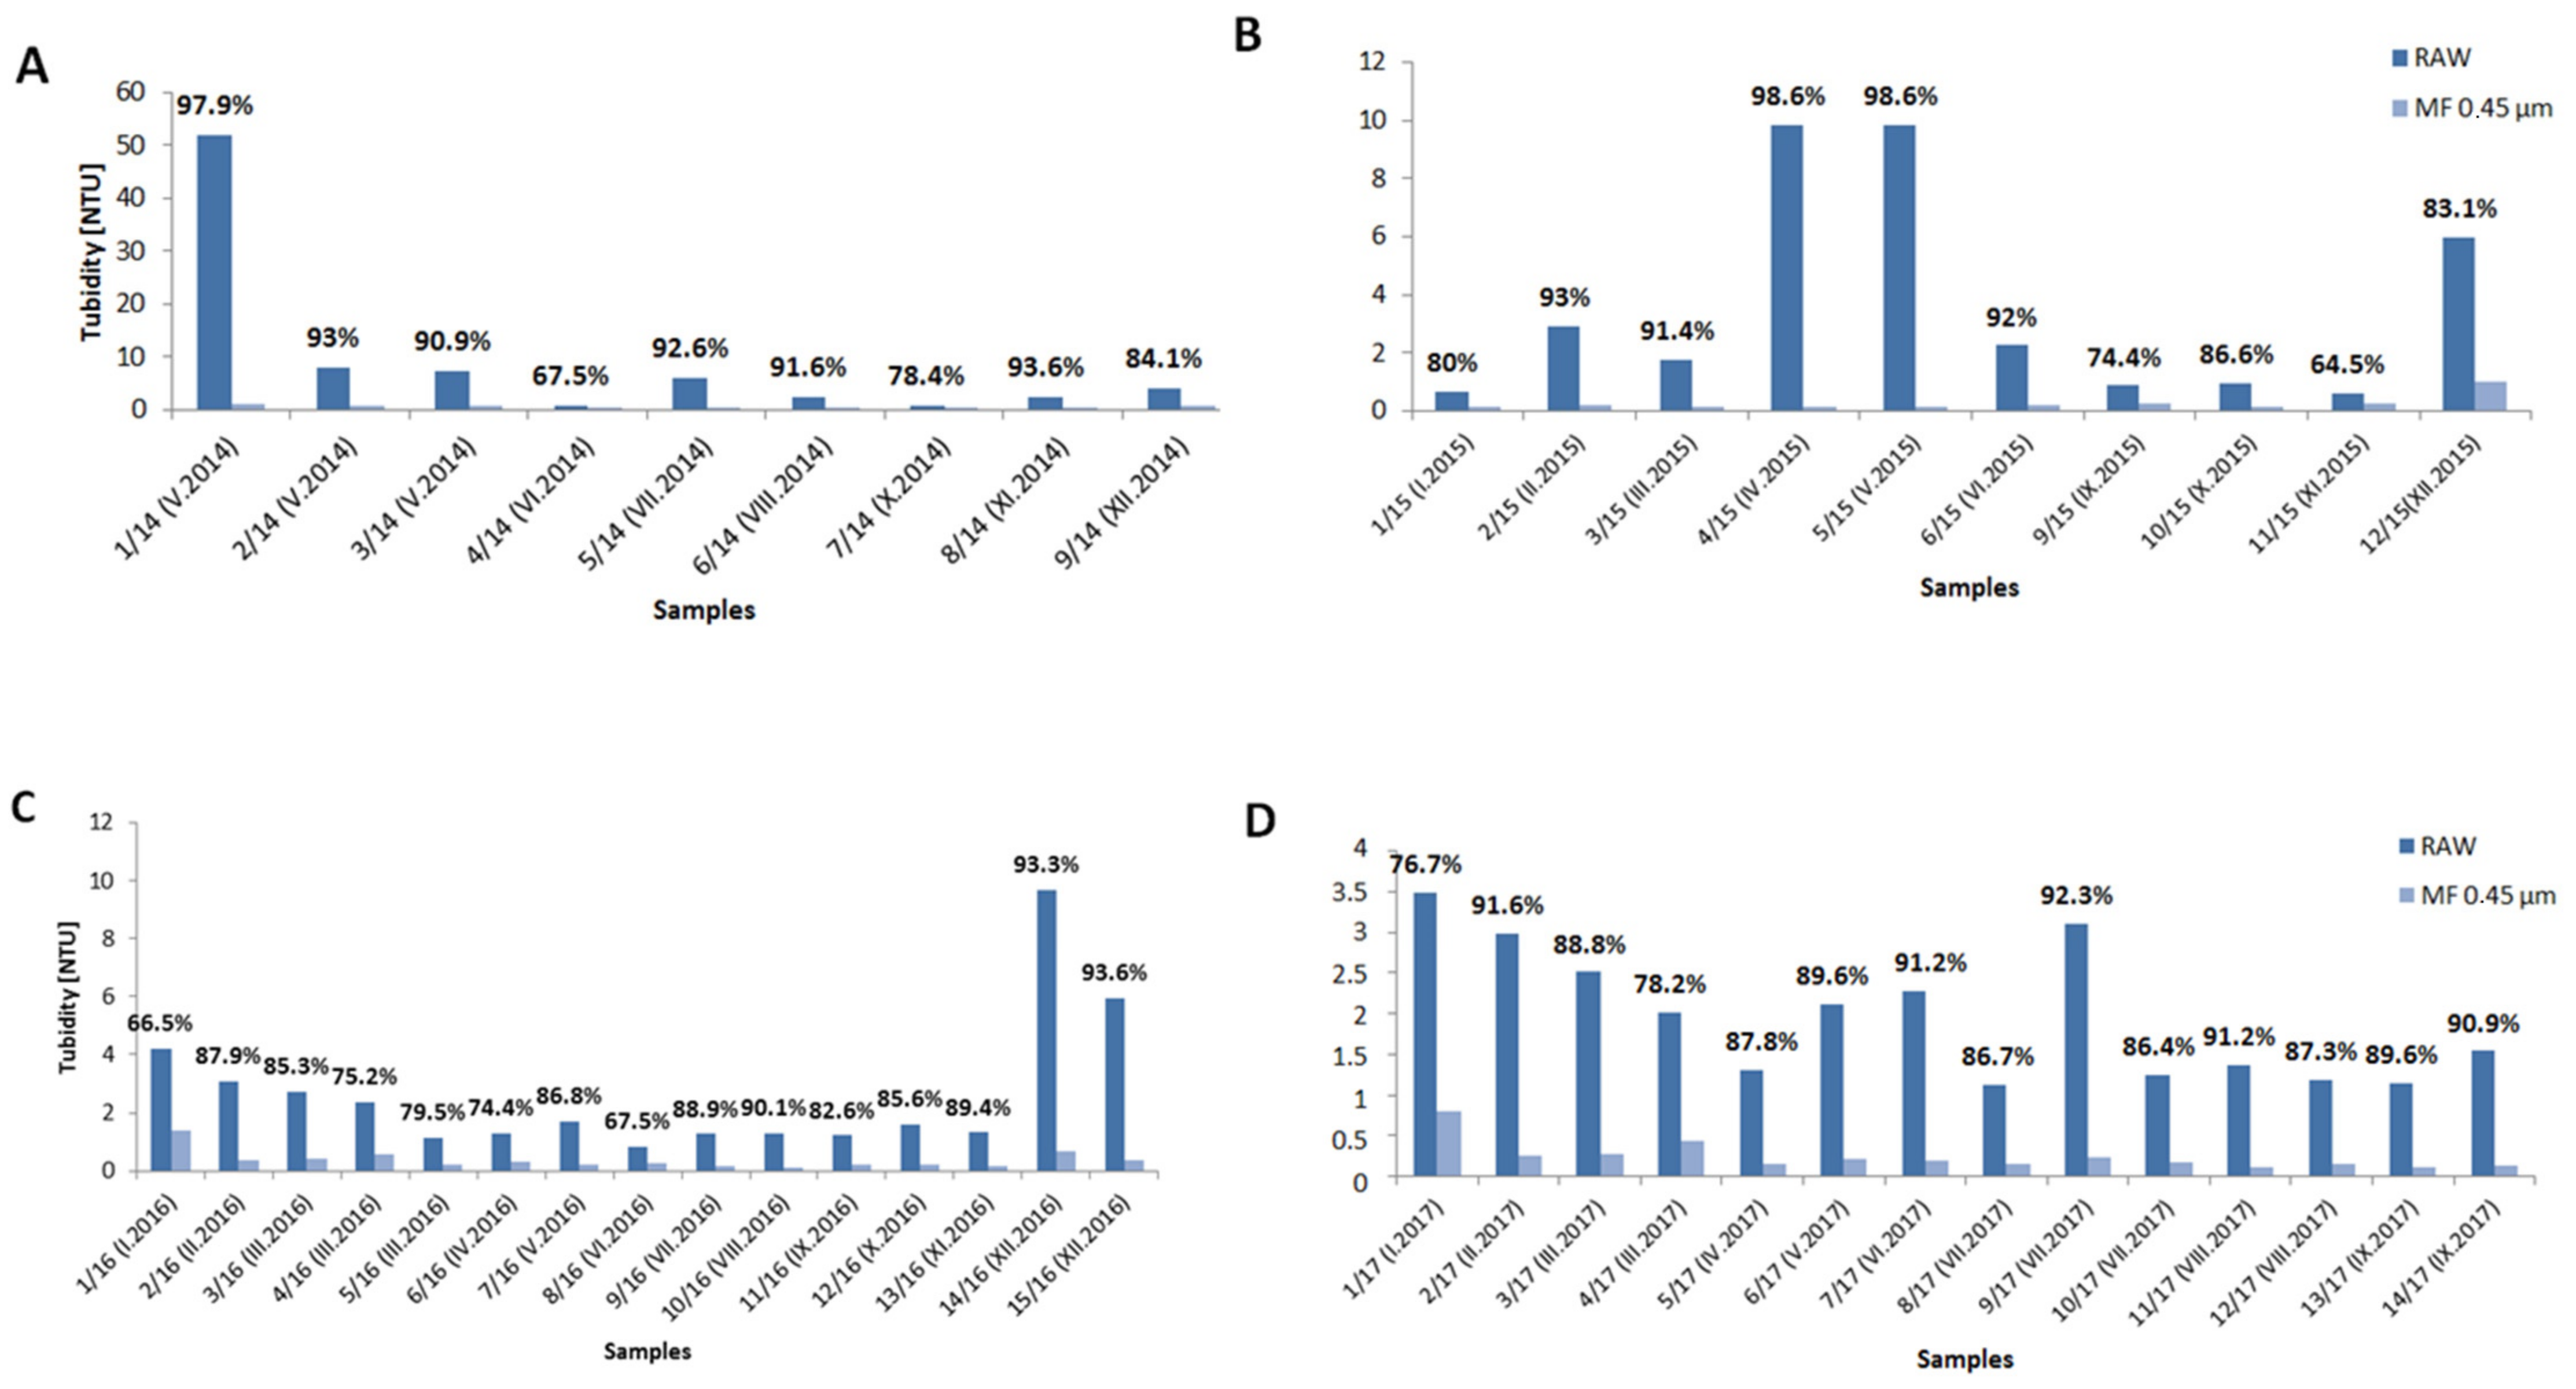
During the research conducted from May 2014 to September 2017, raw rainwater turbidity below 10 NTU was reported, wherein increased turbidity was periodically noted. In the samples tested in 2014, raw water turbidity generally did not exceed 5.95 NTU. After microfiltration, the water turbidity decreased to the level of 0.66 NTU, and the reduction of turbidity was between 67.5 and 93.6%. Particular attention should be paid to the results of the experiment carried out in May 2014 (Figure 3A), including subsequent phases of precipitation. The rainwater sample collected after the first 10 min of precipitation was characterized by the highest turbidity, and it was 51.91 NTU. It should be noted that significant amounts of plant pollen were observed in the sample. Over time, the turbidity of the rainwater decreased. In the sample collected after 20 min of precipitation, the turbidity was only 8.05 NTU, while after 30 min of rainfall, it was 7.25 NTU. The samples were microfiltered, as a result of which the turbidity in all three samples decreased by over 90% (respectively: 1.10 NTU (sample 1/14), 0.56 NTU (sample 2/14), and 0.66 NTU (sample 3/14)).
Samples collected in April and May 2015 (Figure 3B) were characterized by relatively high turbidity, equal to 9.84 NTU. Moreover, the samples were heterogeneous, with a lot of pollen of different morphology, which could also affect the average turbidity measurement. Microfiltration reduced the turbidity of the samples to the level of 0.14 NTU (corresponding to an almost 99% degree of turbidity removal). High turbidity of raw water was also recorded during measurements carried out in December 2015. Before purification, turbidity of the sample was equal to 5.98 NTU, whereas after microfiltration, it decreased to 1.01 NTU. The efficiency of the rainwater treatment process was 64.5%, which was one of the two lowest results in the study. Nevertheless, the reduction of turbidity of all tested samples in 2015 was not lower than 64.5%, and for the majority of samples equal or even higher than 80%.
The turbidity of the rainwater investigated in 2016 was not higher than 2 NTU for most samples (Figure 3C). After the microfiltration process, the turbidity of the samples usually did not exceed 0.5 NTU. On the other hand, samples collected in the winter season (December to February) were characterized by increased turbidity. Particularly high turbidity equal to 9.67 NTU (sample 14/16) and 5.95 NTU (sample 15/16) were recorded in December 2016. A similar correlation of results was obtained during the research conducted in 2017 (Figure 3D). Melt waters were characterized by the highest turbidity (samples collected in January and February 2017; respectively, turbidity equal to 3.48 and 2.98 NTU). The rainwater samples collected during the tree pollen season (May, June 2017) and in the period of low rainfall intensity and frequency (July 2017) were characterized by increased turbidity.
3.3. Granulometric Analysis
Presented results of roof runoff relate to selected samples obtained in the spring (May) and autumn (November) period in the year 2017. Tested samples were collected from the rainwater storage tank. Before sampling, rainwater was mechanically treated during transport (filter on a drain pipe and basket filter before the tank) and natural sedimentation as a result of retention in the underground tank. Thus, larger fractions of contaminations and a significant part of fine suspension were eliminated. Measurements were carried out in several series, with different settings (stirring speed: 600–2000 rpm; sensitivity: normal sensitivity or higher test sensitivity). Figure 4 and Figure 5 show the selected series of tests conducted in May and November. In May, two types of samples were tested (collected at the beginning of May and in mid-May), whereas in November, three types of samples were collected (collected at the beginning, in mid-November, and at the end of November). Series corresponded to the following samples and measurement settings, as presented in Table 1.
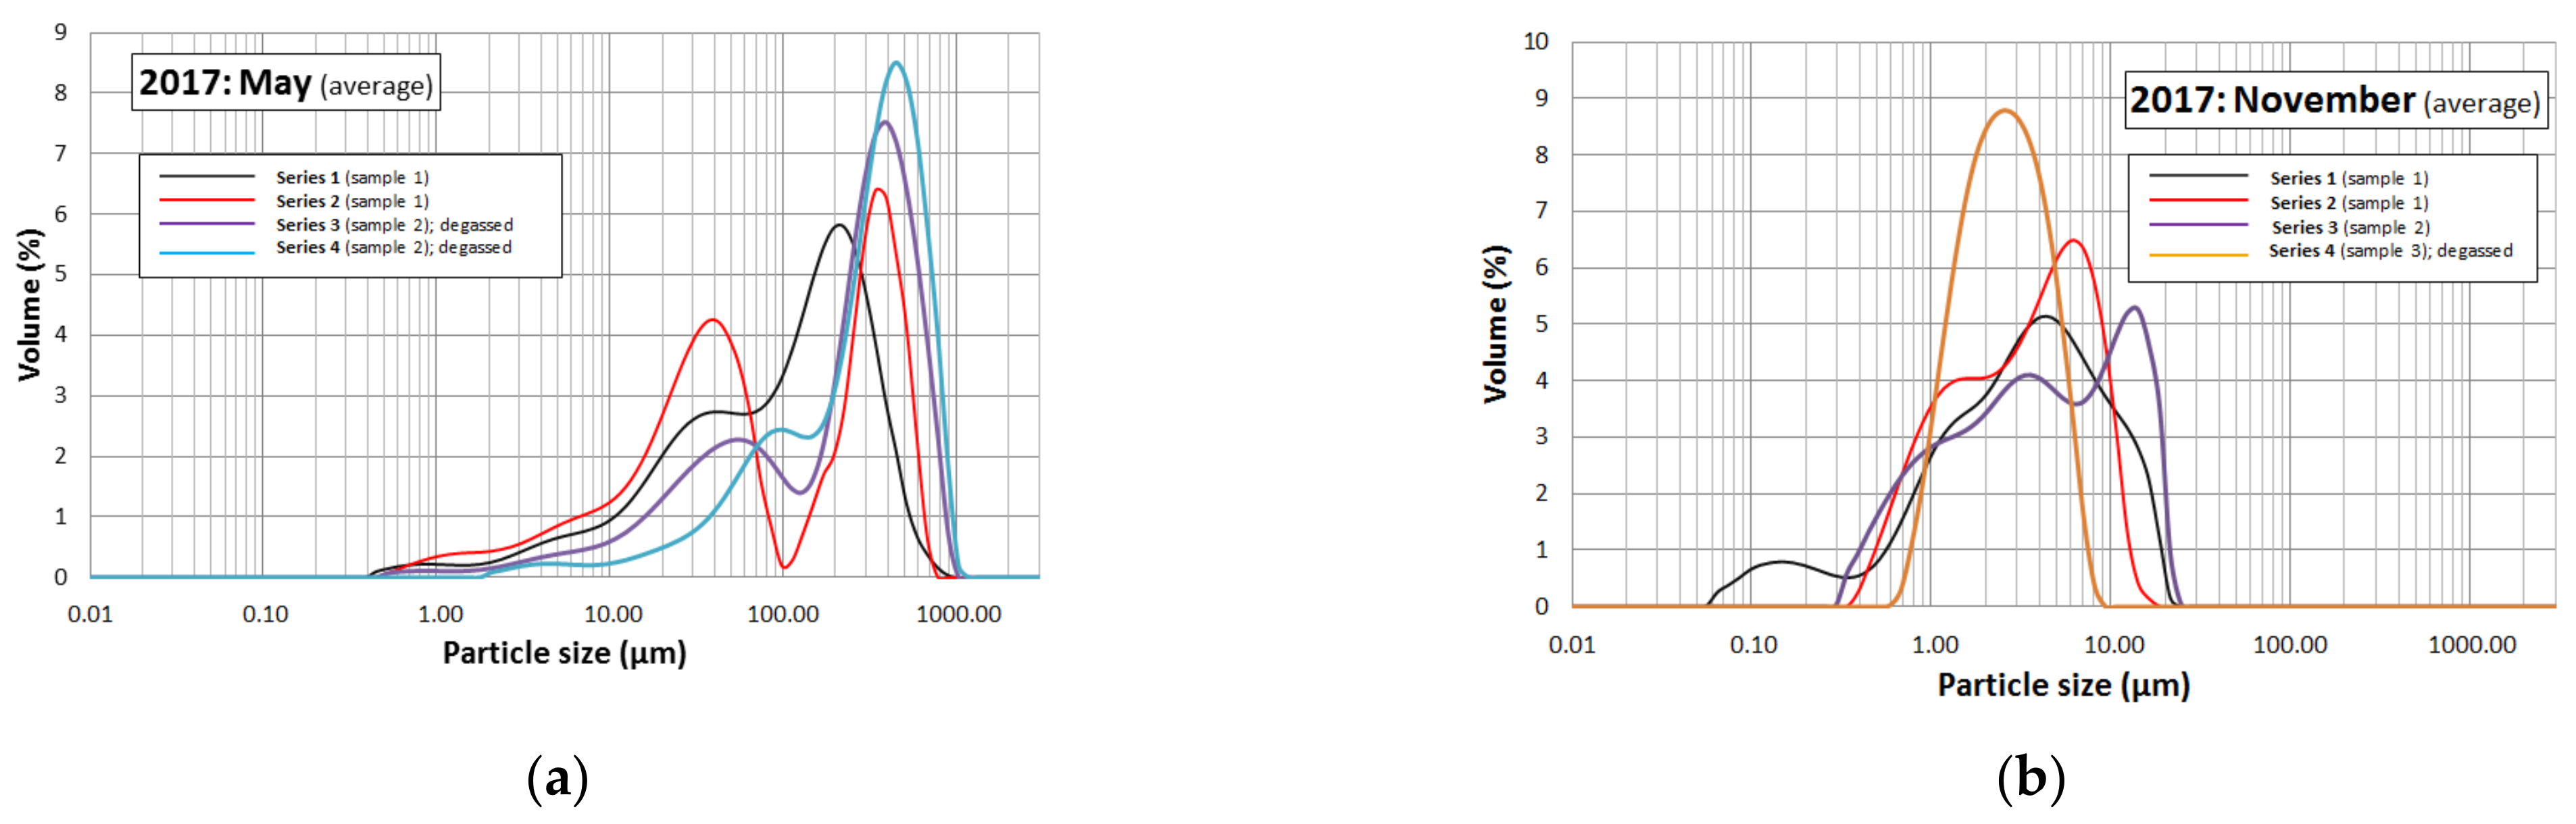
In the runoff samples collected during the spring period (May 2017; Figure 4), particle sizes ranged from approximately 0.4 μm to 1000 μm. For the whole spring season, the average particle size (d50) was approximately 175 μm. It should be added that 10% (by volume) of the analyzed suspension were particles smaller than 21 μm, whereas 90% (by volume) were smaller than approx. 470 μm. On the other hand, that means that 10% of particles present in the sample were larger than 470 μm. The smallest particles with dimensions below 10 μm (which are the most important for the separation of suspension from water, because they are the most problematic) accounted for about 12% of all suspension particles volume and particles with dimensions smaller than 1.0 μm and not more than 1.5%. Generally, two types of particles predominated: particles with dimensions below 100 μm and above 100 μm. The contractual boundary of this division is quite clearly indicated by the lowest minimum point of the graph relating to series 2 (May 2017; Figure 4). Such a trend was observed in almost every measurement series carried out in the spring season.
For this particular case (May 2017; Figure 4), smaller particles had dimensions from 0.48 μm to about 98 μm. Characteristic values were, accordingly, about 3.9 μm (d10), 25.7 μm (d50), and 56.6 μm (d90). Dimensions of larger particles ranged from about 90 μm even up to 1050 μm, whereas characteristic values were about 225 μm (d10), 415 μm (d50), and 1050 μm (d90). Thus, particles larger than 100 μm represented less than half of the volume (44%) of all suspension particles. The periodic appearance of larger particles (above 100 µm) in rainwater, despite sampling after sedimentation in a storage tank, was probably caused by a large amount of plant pollen. Such suspension was very light, and had a tendency for flotation, which can be connected with the morphological structure of pollen. Moreover, the presence of this type of suspension was observed during the four-year study only in spring (from May to June). After some time, suspension tended to aggregate, and formed larger, spongy structure complexes that easily disintegrated by stirring or using ultrasounds.
The particle size distribution of the autumn samples was completely different from the spring samples. In general, much smaller particles of suspension were observed (November 2017; Figure 4). The rainwater samples contained a suspension with particle sizes from 0.04 to 24 µm. The average diameter (d50) was 2.5 μm, while other characteristic values were about 0.25 µm (d10) and 7.8 µm (d90). Almost 93% of undissolved substances were particles smaller than 10 µm, whereas a quarter of the volume of the rest particles accounted for particles smaller 1.0 µm. It should be also mentioned that autumn samples were characterized by very low obscurance (i.e., optical concentration ratio) below 0.5%. Such low obscurance indirectly indicates a very small amount of suspension, which coincides with the results of TSS determinations. The relationship between the particle size distribution in investigated rainwater and season of the year is compared in Figure 5.
3.4. Silt Density Index Measurements
Silt Density Index measurements were carried out in November and December 2017, only for raw rainwater collected from the storage tank. Five independent experiments/tests were conducted, each consisting of no less than two measurements (Table 2). Additionally, the temperature of rainwater was monitored during each test.
The first experiment was conducted in November 2017 (Table 2, TEST 1). Raw rainwater collected from the underground storage tank was used. During the test, the water temperature was about 19 °C. The SDI values ranged from 5.96 to 6.63.
In another experiment in November (TEST 2), two measurements were made. Before measurement 1, the temperature of water was 5 °C, while before measurement 2, the water temperature rose to 15 °C. The micro-suspension contamination index was 6.42 for measurement 1 and 6.23 for measurement 2.
Test number 3 was conducted in mid-November 2017. The water temperature increased gradually from 10 °C (measurement 1, TEST 3) to 20 °C (measurement 3, TEST 3). The values of the SDI coefficient obtained as a result of calculations for subsequent measurements were in the range of 6.06–6.52 (Table 2, TEST 3).
The rainwater investigated in the fourth experiment, similarly to the previous experiments, was collected from the underground storage tank, and three measurements were made. The temperature of the sample at the beginning of the experiment (measurement 1, TEST 4) was between 5 °C and 10 °C, and it gradually increased with each subsequent measurement. In the last stage of the test (measurement 3, TEST 4), the temperature ranged between 15 °C (at the start point of the measurement) and 19 °C (at the end). The SDI coefficient for all measurements carried out in experiment 4 was high, and amounted to 6.48, 5.85, and 6.38, respectively, for measurements 1 to 3 (Table 2, TEST 4).
Experiment 5 was conducted in December 2017 (Table 2, TEST 5), and consisted of three measurements. The rainwater temperature was measured before the start of the test (T = 9.8 °C) and after each measurement. The temperature of the water immediately after the first measurement (measurement 1, TEST 5) was equal to 12.9 °C. After measurement 2, the temperature of 15.8 °C was recorded, and after measurement 3, the temperature increased to 18.3 °C. The results of the SDI measurements in test 5 significantly exceeded the value of 6 (respectively, 6.26, 6.32, and 6.23).
4. Discussion
4.1. Total Suspended Solid Concentration
All tested samples of rainwater and snowmelt were characterized by a rather low content of suspension, although slightly lower TSS concentrations were typical for the summer season. In addition, especially in the spring months, aggregation and flotation of the suspension was observed. It was probably related to the increased content of plant pollen rinsed from the roof surface. On the other hand, a high content of suspension in the winter months can be explained by the long-term exposure of snow to contaminations that were present in the atmosphere [25,26,27].
The main reason for low concentrations of undissolved substances in the tested rainwater should be explained by the specificity of the region in which the building is located. This region of Poland is located away from highly industrialized and urbanized areas (as a source of pollution), and is characterized by good air quality. Undoubtedly, the point and method of sampling also influenced the obtained results (initially treated rainwater collected from the roof or storage tank, in both cases, after sedimentation) and the length of the rainless periods. The reduced suspension content might be also connected with rainfall frequency (especially during the spring season) that regularly washed away impurities accumulated on the roof surface. Moreover, runoff from the roof is definitely less polluted than runoff from other sealed surfaces (roads and streets). Therefore, results were significantly different from those obtained by other authors [28,29,30].
In addition, the experiment of May 2014 confirmed that the quality of the runoff is strongly connected with the precipitation phase. The highest concentration of impurities was noticed in the first collected sample (after the first 10 min of precipitation) and decreased with time. Other authors also confirmed that the first phase of rain carries the greatest pollutant load [31,32,33]. Especially after a long rainless period, it flushes away substances accumulated on the roofing, as well as those that might be present in the atmosphere [34,35]. Thus, precipitation after long rainless periods (regardless of the season) will to some extent purify the atmosphere [36], at the same time deteriorating the quality of rainwater runoff.
4.2. Turbidity Changes
The results of turbidity measurements showed a similar trend to the results of the determination of total suspended solids in tested rainwater samples. In general, increased turbidity correlated with a high concentration of suspension. Most likely, the reasons for the appearance of periodic dependencies were also of a similar nature. The turbidity of raw rainwater for almost all tested samples was lower than 10 NTU, usually no more than 4 NTU. It was found that the turbidity was higher in samples collected directly from the roof of the building. Meltwater was also characterized by a high turbidity. In samples collected from the underground storage tank, the turbidity was relatively low, and did not exceed 3.1 NTU. As a result of microfiltration, a significant reduction in turbidity was observed. For all tested samples, the turbidity removal efficiency was higher than 60%, and in a few samples, it even exceeded 90%. Application of microfiltration (using membranes with a pore diameter of 0.45 µm) for the treatment of rainwater enabled the removal of certain amounts of suspension and achieved an acceptable water turbidity level below 1 NTU required for drinking water [11]. Moreover, the turbidity did not exceed 0.85 NTU in almost all treated samples. Admittedly, microfiltration is a treatment method that allows to remove only suspended substances or those that are present in water in an undissolved form. However, in the case of rainwater, undissolved fractions may constitute the largest pollutant load, and the remaining impurities can be associated with the suspension. A high concentration of suspended solids is closely related to the level of rainwater contamination, because suspension is an excellent carrier of pollutants. Depending on the type of catchment, it might be correlated with a higher concentration of organic substances (including petroleum-based products), nutrients, heavy metals, or microorganisms [37]. In the study, the microscale research with the use of a filtration system in laboratory conditions was not aimed at the comprehensive assessment of rainwater quality, but to define only specific parameters. Microbiological analyses were not carried out, therefore, nothing can be said about the bacteriological quality of tested rainwater before and after microfiltration. Other researchers indicated that in the rainwater runoff from the roof, fecal bacteria may be present [38]. According to Dobrowsky et al. [39], microfiltration of rainwater (with a synthesized PVA nanofiber membrane, followed by filtration through activated carbon column) reduced the amount of bacteria, but did not completely eliminate the risk of microbial contamination, as some strains of bacteria and viruses still remained. Therefore, in order to verify the safety of rainwater usage (including bacteriological quality), additional tests on a semi-technical or technical scale would be highly recommended.
4.3. Granulometric Analysis
Typical indicators of water quality, such as turbidity or total suspended solid concentration, do not provide the full characteristics of insoluble or colloidal substances present in rainwater. Application of laser granulometer to measure the size of suspension particles perfectly complements this information. An analyzer is a useful tool in assessing the morphology of suspension molecules and colloidal substances in all types of water [40,41,42], as well as in detailing the characteristics of suspension observed in rainwater/snowmelt samples, which were research materials.
Presented results concern selected samples of rainwater collected in spring and the autumn to winter period in 2017. Rainwater obtained from the storage tank was tested. Analyzed rainwater (before its collection) was subjected to filtration during transport and natural sedimentation in the underground tank. Due to both processes, larger fractions of impurities and a part of the finer suspension were initially removed. Despite the low concentration of suspension in the tested rainwater (confirmed by TSS determinations), which was the result of the pretreatment processes that took place in the tank, it cannot be assumed that such a preparation of the feed (rainwater) for microfiltration is sufficient. Particle size analysis revealed that, in rainwater, there were still fine particles that could cause microfiltration membrane blocking.
Granulometric analysis showed that the physical properties of the suspended particles present in rainwater varied depending on the season, while their distribution was irregular. In the spring season, particles of sizes up to 500 μm predominated. The particle size range was very wide, from 0.4 μm to even 1000 μm. The main component of solid substances present in tested rainwater could be pollen influencing the properties of the suspension (its higher susceptibility to flotation and the agglomeration of particles). Mineral particles (like sand or dust) were probably also rinsed from the roof surface. In the autumn and winter period, particles were much smaller (below 10 μm), whereas the total amount of suspension in the tested samples was reduced. Most likely, it was related to the frequency and intensity of precipitation in autumn, which is reflected in the amount of contamination accumulated on the sealed surfaces.
Obtained results indicated that the irregular particle size distribution might be connected with extended rainless periods. Substances of various morphological and qualitative characteristic accumulated on the sealed surfaces (including roofs) are rinsed off by rain. On the other hand, the wide particle size range in tested samples may lead to some mistakes during the analysis of particle size distribution. The smallest particles might be omitted, whereas their distribution might be overestimated, which was pointed out by Burszta-Adamiak and Stodolak [36]. It was also noticed that, in tested roof runoff samples, larger particles (with dimensions over 100 µm) with an irregular particle size distribution occasionally appeared. Furthermore, subsequent analyses of the same research material did not provide the expected repeatability of results. It was assumed that gas (air) bubbles present in the sample deposited on the surface of the granulometer’s measuring cell. Therefore, rainwater degassing was implemented before measurements. Irregular appearance of particles of an unknown origin was eliminated, and the degassing process was introduced as an essential step of sample preparation methodology. Moreover, such an operation influenced the sensitivity of the measurements by directing it towards the smallest particles.
When assessing the influence of the particles sizes present in rainwater on the membrane blocking, it can be expected that, in the spring season, the blocking of the membranes will be rather a reversible process due to the predominance of larger suspension particles. The fouling phenomenon will take place on the surface of membrane, which, with proper maintenance of the membrane (regular washing) or preparation of the feed (initial pretreatment of rainwater), should not cause operational problems. In periods when the amount of the smallest particles is the highest (especially in autumn), there is a risk of irreversible fouling. The study confirmed that the fine particles had dimensions smaller than the pores of the membrane used (0.45 μm). However, it should be noticed that, in both cases (the series of spring and autumn to winter tests), there were relatively few of the smallest particles (with dimensions smaller than 0.45 μm). With regard to the membranes with a pore sizes of 0.45 μm, the smallest particles may contribute to the phenomenon of irreversible blocking of pores. Therefore, it can be assumed that tested rainwater tended to cause surface fouling of microfiltration membranes.
A good solution seems to be the additional treatment of rainwater, before further purification with a microfiltration module. This would reduce the amount of suspended solids deposited on the surface of the membrane and prolong its usefulness. Perhaps, treatment by filtration (with a properly selected filter material to reduce turbidity) would be sufficient, however, studies confirming this assumption have not been performed so far. Certainly, an effective treatment preceding the use of microfiltration would be coagulation, which guarantees a significant removal of turbidity and suspended solids from water [43,44]. However, the introduction of additional chemical reagents might cause some difficulties under household conditions (because such a system application was considered). Among other operations, selection of the appropriate dose of coagulant could be troublesome. The coagulant dose would have to be constantly corrected due to the heterogeneous and variable nature of rainwater, especially in the spring and summer seasons. Thus, a hybrid coagulation–microfiltration system seems to be not suitable for small-scale solutions, because home system should be quite easy to operate and maintain.
4.4. Silt Density Index Measurements
The microfiltration contamination index for all tests was significantly higher than 5, with values in the range from 5.85 to 6.63. In parallel with the measurement of the SDI, the decrease in the volumetric flow rate over time was also monitored. Despite the fact that volumetric flow rate results are not presented in this paper, there are findings that are worth sharing. For all measurements, a significant reduction in the permeate flux occurred within the first 5 min of each test. In the further stage of the measurement (after 10 min of measurement and later), the flow was low, but relatively constant. This demonstrates that the phenomenon of fouling took place almost exclusively during the first 5 min of the measurement.
Another observation was related to the construction of SDI test system. The highest value of the SDI coefficient was obtained where the cell/filter holder elements were not washed between measurements (when changing the filter membrane). This may indicate that not only the pores of the filter membrane can be blocked, but also the perforated plate (sieve), which is a movable element of the filter holder. The specificity of the construction of the storage tank (column) should also be taken into account, resulting in faster sedimentation of suspension.
Rapid blocking of the membrane and the high SDI values can also be associated with the relatively high turbidity of raw rainwater (before microfiltration, for almost all samples turbidity was higher than 1 NTU), whereas it is said to be that the SDI test is dedicated to solutions of low turbidity (<1 NTU), such as groundwater (well water), filtered water, or treated sewage [23]. Therefore, for samples with higher turbidity, the membrane fouling occurs relatively quickly from the start of the SDI test, and measurement lasts a long time.
One of the key test conditions is also the temperature of the samples. As recommended [23], a sample temperature should be constant (±1 °C) during a measurement. For tested rainwater, there were difficulties in fulfilling the condition. Due to the quite long duration of single measurements, meeting this assumption turned out to be impossible. This method (the Silt Density Index test) does not take into account a possible correction for temperature changes during a measurement, which was an indispensable phenomenon accompanying the research (confirmed by temperature measurements). This kind of disadvantages of the classic SDI method (as well as the influence of pressure fluctuations, membrane resistance, and the lack of a linear relationship between the index and suspension concentration) was indicated by many authors [45,46,47]. A remedial measure is to use Modified Fouling Index (MFI0.45), although it still does not provide information on the smallest particles (<0.45 μm) present in water and also contributes to the fouling phenomenon [48].
Despite being fully aware of the limitations of the conventional SDI test, this method allowed to obtain, to some extent, the answer to question asked in the study. It was proven that microfiltration can be considered as a method of rainwater purification, under certain operating conditions of installation and with proper pretreatment of the feed (rainwater). Moreover, it was also confirmed that standard SDI test cannot be regarded as a universal tool for assessing the suitability of membrane techniques for treatment of all kinds of aqueous solutions, especially those (like rainwater) that are only seemingly pure.
5. Conclusions
The research carried out as part of the study shows that the storage of rainwater in the underground retention tank improved selected parameters of quality, such as turbidity and total suspended solids concentration. Additionally, physico-chemical analyses of raw rainwater samples revealed the convergence of the results of these determinations (TSS, turbidity), associated with the seasonal fluctuations in the concentrations of suspended particles. There was also a correlation between the level of rainwater pollution and precipitation parameters, including frequency and intensity.
Mechanical pretreatment during the transport of rainwater to the tank (filtration on downpipe filters and the basket filter), followed by a natural sedimentation process at the stage of water storage in the tank, probably reduced the amount of undissolved and colloidal substances, which was confirmed by the results of the TSS determinations. In turn, the use of microfiltration (although only on a laboratory scale) ensured a further reduction of the suspension concentration and improved the turbidity of rainwater. A microfiltration membrane was therefore an effective barrier for suspension particles larger than 0.45 μm. Microfiltration allowed to achieve a satisfactory level of turbidity (below 1 NTU), whereas the process efficiency was not lower than 60% and even exceeded 90%. On the other hand, undissolved substances retained by the membrane limited its usefulness and service life, which was indicated by the high values of the SDI. A significant decrease in the volumetric flow rate during measurements and their duration (approximately a 30 min, in some cases almost 50 min measurement) proved that even visually clean rainwater might contain a certain amount of suspended solids, which promotes membrane fouling. Due to the limitations of the standard SDI measurement method, on its basis, it was not possible to unequivocally demonstrate the relationship between the quantity and quality of the suspensions present in the tested samples and their potential impact on the phenomenon of fouling. The SDI measurements did not provide information on actual amount of suspended solids and undissolved substances in rainwater. It also did not define the specificity of these kind of substances. Such information was obtained by physico-chemical analyses (i.e., the concentration of total suspended solids and turbidity) and particles sizes measurements conducted with the laser granulometer. The last method in particular provided the characteristics of substances present in investigated samples, which made it possible to learn more about the morphology of the suspended particles in the rainwater. By analyzing the size of the particles present in samples of rainwater, a certain direction of application of the microfiltration membranes in water treatment was determined, valuable for designers and operators of such systems.
Moreover, the research showed that microfiltration can be used as a rainwater treatment process, but only under an important condition. A proper preparation of water before the filtration process with the use of a microfiltration membrane is recommended. Omission of the pretreatment not only makes the microfiltration process ineffective, but above all, it eliminates the membrane techniques as a possible method of rainwater purification. Despite the high cost of the microfiltration system, research on the proposed solution should be continued, as it turned out to have significant application potential.
Author Contributions
K.F. wrote the paper–from original draft to edited version. She developed the concept of article, its structure, and methodological approach. K.F. was also responsible for obtaining funds for research. She conducted the formal analysis and investigation as well as prepared graphic elements and tables. B.Q. supervised the overall process. All authors have read and agreed to the published version of the manuscript.
Funding
Part of the research was conducted thanks to financial support of the Faculty of Civil and Environmental Engineering (Gdansk University of Technology) for young scientists for the implementation of the research task in the academic year 2015/2016.
Institutional Review Board Statement
Not applicable.
Informed Consent Statement
Not applicable.
Data Availability Statement
Not applicable.
Conflicts of Interest
The authors declare no conflict of interest.
References
- Nika, C.E.; Vasilaki, V.; Expósito, A.; Katsou, E. Water Cycle and Circular Economy: Developing a Circularity Assessment Framework for Complex Water Systems. Water Res. 2020, 187, 116423. [Google Scholar] [CrossRef]
- Liang, X.; van Dijk, M.P. Economic and financial analysis on rainwater harvesting for agricultural irrigation in the rural areas of Beijing. Resour. Conserv. Recycl. 2011, 55, 1100–1108. [Google Scholar] [CrossRef]
- Gatt, K.; Schranz, C. Retrofitting a 3 star hotel as a basis for piloting water minimisation interventions in the hospitality sector. Int. J. Hosp. Manag. 2015, 50, 115–121. [Google Scholar] [CrossRef]
- Ghisi, E. Potential for potable water savings by using rainwater in the residential sector of Brazil. Build. Environ. 2006, 41, 1544–1550. [Google Scholar] [CrossRef]
- Ghisi, E.; da Fonseca Tavares, D.; Rocha, V.L. Rainwater harvesting in petrol stations in Brasília: Potential for potable water savings and investment feasibility analysis. Resour. Conserv. Recycl. 2009, 54, 79–85. [Google Scholar] [CrossRef]
- Nasif, M.S.; Kumar, A.G.A.; Roslan, R. An effective optimization of rainwater harvesting system in hotel and hospital buildings. In Proceedings of the 4th IET Clean Energy and Technology Conference (CEAT 2016), Kuala Lumpur, Malaysia, 14–15 November 2016. [Google Scholar] [CrossRef]
- Rysulová, M.; Káposztásová, D.; Vranayová, Z. Grey water system application—water savings and use in the hotel building. In New Developments in Environmental Science and Geoscience, Proceedings of the International Conference on Environmental Science and Geoscience (ESG 2015), Vienna, Austria, 15–17 March 2015; Mastorakis, N.E., Bulucea, A., Eds.; Energy, Environmental and Structural Engineering Series; INASE: Vienna, Austria, 2015; pp. 61–64. [Google Scholar]
- Bogacz, A.; Woźniczka, P.; Burszta-Adamiak, E.; Kolasińska, K. Methods of enhancing water retention in urban areas. Sci. Rev. Eng. Environ. Sci. 2013, 22, 27–35. [Google Scholar]
- Geiger, W.F. Think global, act local. In New Waterscapes: Planning, Building and Designing with Water; Dreiseitl, H., Grau, D., Eds.; Birkhäuser—Publishers for Architecture: Basel, Switzerland, 2005; pp. 78–111. [Google Scholar]
- Sands, P.; Galizzi, P. (Eds.) Council Directive 98/83/EC of 3 November 1998 on the Quality of Water Intended for Human Consumption; Cambridge University Press: Cambridge, UK, 1998. [Google Scholar] [CrossRef]
- Regulation of the Minister of Health of 7 December 2017 on the Quality of Water Intended for Human Consumption. Available online: http://isap.sejm.gov.pl/isap.nsf/DocDetails.xsp?id=WDU20170002294 (accessed on 28 February 2021).
- Khayan, K.; Heru Husodo, A.; Astuti, I.; Sudarmadji, S.; Sugandawaty Djohan, T. Rainwater as a source of drinking water: Health impacts and rainwater treatment. J. Environ. Public Health 2019, 2019, 1–10. [Google Scholar] [CrossRef] [Green Version]
- Kim, T.; Lye, D.; Donohue, M.; Mistry, J.H.; Pfaller, S.; Vesper, S.; Kirisits, M.J. Harvested rainwater quality before and after treatment and distribution in residential systems. J. Am. Water Work. Assoc. 2016, 108, E571–E584. [Google Scholar] [CrossRef]
- Stefanakis, A.I. The role of constructed wetlands as green infrastructure for sustainable urban water management. Sustainability 2019, 11, 6981. [Google Scholar] [CrossRef] [Green Version]
- Nicolaisen, B. Developments in membrane technology for water treatment. Desalination 2003, 153, 355–360. [Google Scholar] [CrossRef]
- Bodzek, M.; Konieczny, K.; Rajca, M. Membranes in water and wastewater disinfection. Arch. Environ. Prot. 2019, 45, 3–18. [Google Scholar] [CrossRef]
- Guo, W.; Ngo, H.H.; Li, J. A mini-review on membrane fouling. Bioresour. Technol. 2012, 122, 27–34. [Google Scholar] [CrossRef]
- Howe, K.J.; Clark, M.M. Fouling of microfiltration and ultrafiltration membranes by natural waters. Environ. Sci. Technol. 2002, 36, 3571–3576. [Google Scholar] [CrossRef]
- Water Quality—Determination of Turbidity—Part 1: Quantitative Methods; PN-EN ISO 7027-1:2016-09 Polish Standard. Available online: https://infostore.saiglobal.com/preview/98709941385.pdf?sku=879938_SAIG_NSAI_NSAI_2090663 (accessed on 28 February 2021).
- Vitton, S.J.; Sadler, L.Y. Particle size analysis of soils using laser light scattering and X-ray absorption technology. Geotech. Test. J. 1997, 20, 63–73. [Google Scholar] [CrossRef]
- Bray, R.T.; Fitobór, K. Sizes of iron hydroxide particles formed during ferric coagulation processes. Desalination Water Treat. 2017, 64, 419–424. [Google Scholar] [CrossRef]
- Bartmiński, P.; Krusińska, A.; Bieganowski, A.; Ryżak, M. Preparation of soil samples for grain size distribution analysis using the laser diffraction method. Rocz. Glebozn. 2011, 62, 9–15. [Google Scholar]
- ASTM International. Standard Test Method for Silt Density Index (SDI) of Water; D4189-07, An American National Standard; ASTM International: West Conshohocken, PA, USA, 2014; Available online: https://www.techstreet.com/standards/astm-d4189-07-2014?product_id=1873862#jumps (accessed on 28 February 2021).
- Promat-Woda. Operating Instructions—SDI Measuring Device; Promat-Woda: Gdynia, Poland, 2015. [Google Scholar]
- Ociepa, E.; Mrowiec, M.; Deska, I.; Okoniewska, E. Snow cover as a medium for deposition of pollution. Annu. Set Environ. Prot. 2015, 17, 560–575. [Google Scholar]
- Polkowska, Ż.; Demkowska, I.; Cichała-Kamrowska, K.; Namieśnik, J. Pollutants present in snow samples collected from various layers of snow cover as a source of information about the state of environment in a big urban agglomeration. Ecol. Chem. Eng. S 2010, 17, 203–231. [Google Scholar]
- Zhu, H.; Xu, Y.; Yan, B.; Guan, J. Snowmelt runoff: A new focus of urban nonpoint source pollution. Int. J. Environ. Res. Public Health 2012, 9, 4333–4345. [Google Scholar] [CrossRef] [PubMed]
- Meera, V.; Ahammed, M.M. Water quality of rooftop rainwater harvesting systems: A review. J. Water Supply: Res. Technol. AQUA 2006, 55, 257–268. [Google Scholar] [CrossRef]
- Sakson, G. The use of rainwater in buildings. Rynek Instal. 2010, 5, 50–53. [Google Scholar]
- Skwarzyńska, A.; Sosnowska, B.; Pytka, A.; Marzec, M.; Gizińska, M.; Słowik, T.; Zając, G. The quality of rainwater and evaluation of its use in individual households. Technol. Wody 2014, 6, 20–23. [Google Scholar]
- Todeschini, S.; Manenti, S.; Creaco, E. Testing an innovative first flush identification methodology against field data from an Italian catchment. J. Environ. Manag. 2019, 246, 418–425. [Google Scholar] [CrossRef] [PubMed]
- Bertrand-Krajewski, J.L.; Chebbo, G.; Saget, A. Distribution of pollutant mass vs volume in stormwater discharges and the first flush phenomenon. Water Res. 1998, 32, 2341–2356. [Google Scholar] [CrossRef]
- Sansalone, J.J.; Cristina, C.M. First flush concepts for suspended and dissolved solids in small impervious watersheds. J. Environ. Eng. 2004, 130, 1301–1314. [Google Scholar] [CrossRef]
- Friedler, E.; Gilboa, Y.; Muklada, H. Quality of Roof-Harvested Rainwater as a Function of Environmental and Air Pollution Factors in a Coastal Mediterranean City (Haifa, Israel). Water 2017, 9, 896. [Google Scholar] [CrossRef] [Green Version]
- Gikas, G.D.; Tsihrintzis, V.A. Assessment of water quality of first-flush roof runoff and harvested rainwater. J. Hydrol. 2012, 466–467, 115–126. [Google Scholar] [CrossRef]
- Burszta-Adamiak, E.; Stodolak, R. An assesment of grain size structure of dust in wet precipitation and its physico-chemical properties. Woda-Środowisko-Obsz. Wiej. 2007, 7, 83–94. [Google Scholar]
- Lye, D.J. Rooftop runoff as a source of contamination: A review. Sci. Total Environ. 2009, 407, 5429–5434. [Google Scholar] [CrossRef]
- Zdeb, M.; Zamorska, J.; Papciak, D.; Słyś, D. The quality of rainwater collected from roofs and the possibility of its economic use. Resources 2020, 9, 12. [Google Scholar] [CrossRef] [Green Version]
- Dobrowsky, P.H.; Lombard, M.; Cloete, W.J.; Saayman, M.; Cloete, T.E.; Carstens, M.; Khan, S.; Khan, W. Efficiency of microfiltration systems for the removal of bacterial and viral contaminants from surface and rainwater. Water Air Soil Pollut. 2015, 226, 1–14. [Google Scholar] [CrossRef]
- Rajca, M.; Bray, R.T.; Fitobór, K.; Gołombek, K. Laser Granulometer as an Useful Tool for Selection of Appropriate Membranes Used in the MIEX® DOC-UF/MF Hybrid Process. Arch. Metall. Mater. 2018, 63, 1133–1140. [Google Scholar] [CrossRef]
- Blott, S.J.; Pye, K. Particle size scales and classification of sediment types based on particle size distributions: Review and recommended procedures. Sedimentology 2012, 59, 2071–2096. [Google Scholar] [CrossRef]
- Pye, K.; Blott, S.J. Particle size analysis of sediments, soils and related particulate materials for forensic purposes using laser granulometry. Forensic Sci. Int. 2004, 144, 19–27. [Google Scholar] [CrossRef] [PubMed]
- Lee, J.D.; Lee, S.H.; Jo, M.H.; Park, P.K.; Lee, C.H.; Kwak, J.W. Effect of coagulation conditions on membrane filtration characteristics in coagulation-microfiltration process for water treatment. Environ. Sci. Technol. 2000, 34, 3780–3788. [Google Scholar] [CrossRef]
- Sakol, D.; Konieczny, K. Application of coagulation and conventional filtration in raw water pretreatment before microfiltration membranes. Desalination 2004, 162, 61–73. [Google Scholar] [CrossRef]
- Schippers, J.C.; Verdouw, J. The modified fouling index, a method of determining the fouling characteristics of water. Desalination 1980, 32, 137–148. [Google Scholar] [CrossRef]
- Boerlage, S.F.; Kennedy, M.D.; Dickson, M.R.; El-Hodali, D.E.; Schippers, J.C. The modified fouling index using ultrafiltration membranes (MFI-UF): Characterisation, filtration mechanisms and proposed reference membrane. J. Membr. Sci. 2002, 197, 1–21. [Google Scholar] [CrossRef]
- Alhadidi, A.; Kemperman, A.J.B.; Blankert, B.; Schippers, J.C.; Wessling, M.; van der Meer, W.G.J. Silt density index and modified fouling index relation, and effect of pressure, temperature and membrane resistance. Desalination 2011, 273, 48–56. [Google Scholar] [CrossRef]
- Khirani, S.; Aim, R.B.; Manero, M.H. Improving the measurement of the Modified Fouling Index using nanofiltration membranes (NF–MFI). Desalination 2006, 191, 1–7. [Google Scholar] [CrossRef] [Green Version]
Figure 1.
Silt Density Index (SDI) test bench. On the left: storage tank/column; on the right: equipment for measuring the Silt Density Index: flowmeter (1), pressure-reducing valve with manometer (2), pressure transducer (3), and membrane module (filter holder) (4) (photos: K. Fitobór).
Figure 1.
Silt Density Index (SDI) test bench. On the left: storage tank/column; on the right: equipment for measuring the Silt Density Index: flowmeter (1), pressure-reducing valve with manometer (2), pressure transducer (3), and membrane module (filter holder) (4) (photos: K. Fitobór).

Figure 2.
Seasonal total suspended solids variation for roof runoff (sampling sessions: (A) 2014, (B) 2015, (C) 2016, and (D) 2017).
Figure 2.
Seasonal total suspended solids variation for roof runoff (sampling sessions: (A) 2014, (B) 2015, (C) 2016, and (D) 2017).

Figure 3.
Seasonal turbidity variation of rainwater runoff (sampling sessions: (A) 2014, (B) 2015, (C) 2016, (D) 2017).
Figure 3.
Seasonal turbidity variation of rainwater runoff (sampling sessions: (A) 2014, (B) 2015, (C) 2016, (D) 2017).

Figure 4.
Particle sizes of the suspension in rainwater (after sedimentation). (a) Average of the spring measurements (May 2017); (b) average of the autumn measurements (November 2017).
Figure 4.
Particle sizes of the suspension in rainwater (after sedimentation). (a) Average of the spring measurements (May 2017); (b) average of the autumn measurements (November 2017).

Figure 5.
Comparison of particle size distribution in rainwater samples (after sedimentation) in spring and autumn season (2017). (a) Average of the measurements; (b) cumulative distribution function.
Figure 5.
Comparison of particle size distribution in rainwater samples (after sedimentation) in spring and autumn season (2017). (a) Average of the measurements; (b) cumulative distribution function.


Table 1.
Measurement settings of granulometric analysis (tests conducted in May and November 2017).
| May 2017 |
| Series 1: sample 1, beginning of May (600 rpm; higher sensitivity) |
| Series 2: sample 1, beginning of May (1200 rpm; normal sensitivity) |
| Series 3: sample 2, mid-May (1200 rpm; normal sensitivity); subjected to degassing |
| Series 4: sample 2, mid-May (1200 rpm; higher sensitivity); subjected to degassing |
| November 2017 |
| Series 1: sample 1, beginning of November (2000 rpm; normal sensitivity) |
| Series 2: sample 1, beginning of November (1600 rpm; normal sensitivity) |
| Series 3: sample 2, mid-November (600 rpm; higher sensitivity) |
| Series 4: sample 3, end of November (1600 rpm; normal sensitivity); subjected to degassing. |
Table 2.
Results of SDI measurements conducted with rainwater samples; t0: start time of the measurement, tx: end time of the measurement.
Table 2.
Results of SDI measurements conducted with rainwater samples; t0: start time of the measurement, tx: end time of the measurement.
| Measurement | t0 | tx | SDI |
|---|---|---|---|
| [Min] | [Min] | [-] | |
| TEST 1 | |||
| 1 | 01:39 | 13:10 | 5.96 |
| 2 | 00:13 | 24:55 | 6.63 |
| 3 | 02:32 | 29:25 | 6.14 |
| TEST 2 | |||
| 1 | 01:40 | 38:47 | 6.42 |
| 2 | 01:53 | 23:47 | 6.23 |
| TEST 3 | |||
| 1 | 01:08 | 48:37 | 6.52 |
| 2 | 01:37 | 15:14 | 6.06 |
| 3 | 02:26 | 46.52 | 6.34 |
| TEST 4 | |||
| 1 | 01:41 | 49:24 | 6.48 |
| 2 | 01:35 | 11:08 | 5.85 |
| 3 | 01:56 | 36:03 | 6.38 |
| TEST 5 | |||
| 1 | 01:24 | 20:45 | 6.26 |
| 2 | 01:57 | 30:58 | 6.32 |
| 3 | 01:12 | 17:11 | 6.23 |
Publisher’s Note: MDPI stays neutral with regard to jurisdictional claims in published maps and institutional affiliations. |
© 2021 by the authors. Licensee MDPI, Basel, Switzerland. This article is an open access article distributed under the terms and conditions of the Creative Commons Attribution (CC BY) license (http://creativecommons.org/licenses/by/4.0/).
Share and Cite
MDPI and ACS Style
Fitobór, K.; Quant, B. Is the Microfiltration Process Suitable as a Method of Removing Suspended Solids from Rainwater? Resources 2021, 10, 21. https://0-doi-org.brum.beds.ac.uk/10.3390/resources10030021
AMA Style
Fitobór K, Quant B. Is the Microfiltration Process Suitable as a Method of Removing Suspended Solids from Rainwater? Resources. 2021; 10(3):21. https://0-doi-org.brum.beds.ac.uk/10.3390/resources10030021
Chicago/Turabian StyleFitobór, Karolina, and Bernard Quant. 2021. "Is the Microfiltration Process Suitable as a Method of Removing Suspended Solids from Rainwater?" Resources 10, no. 3: 21. https://0-doi-org.brum.beds.ac.uk/10.3390/resources10030021
Note that from the first issue of 2016, this journal uses article numbers instead of page numbers. See further details here.