Article

Valorization of Agri-Food Waste from Pistachio Hard Shells: Extraction of Polyphenols as Natural Antioxidants

Department of Chemical Sciences, University of Catania, Viale A. Doria 6, 95125 Catania, Italy
*
Author to whom correspondence should be addressed.
Submission received: 19 April 2021 / Revised: 30 April 2021 / Accepted: 6 May 2021 / Published: 8 May 2021

Abstract

:
The agricultural processing industry usually generates a remarkable amount of by-products rich in bioactive compounds, which can be exploited for agri-food or nutraceutical applications. Pistachio’s hard shell is one of the major by-products from pistachio industrial processing. The aim of this work was the evaluation of pistachio shells as a potential source of natural antioxidants. We evaluated different extraction procedures by measuring total phenolic content, total flavonoid content and antioxidative activity (DPPH, TEAC and ORAC). The microwave-assisted ethanol extract turned out to be the most promising and was fractionated by XAD-16 column chromatography, affording six fractions analyzed through HPLC/ESI-MS/MS and 1H-NMR to identify the main antioxidative constituents. Fractions Fr4–Fr6 demonstrated the highest antioxidant activity. Gallic acid and a monogalloylglusose isomer are the main phenolic constituents of Fr4. Both simple and complex phenolics, such as flavonoids and hydrolysable tannins, were identified in fractions Fr5 and Fr6; pentagalloylglucose and kaempferol, well-known for their antioxidant activity, are the most abundant constituents. The results highlighted that the proposed methodology can be an effective way to recover bioactive phenolic compounds from pistachio hard shell, making this by-product a promising source of compounds with potential applications in food and healthcare sectors.

1. Introduction

Agricultural and forestry wastes are considered by-products with low economic value, generally used as feed for livestock or fuel for domestic heating [1,2]. Nevertheless, there is a growing interest in giving a second life to different types of food waste, thus reducing their environmental impact and providing added value to the entire food’s production process. In this context, the wide range of natural compounds found in by-products recovered from sustainable sources represents a challenging research topic with possible economic and environmental benefits, which might involve markets such as cosmetic, pharmaceutical, food supplements or additives [3].
In recent years, an increasing number of studies has been focused on bioactive compounds from plant sources: among these, polyphenols have deserved special attention for their antioxidant, anti-inflammatory, antineoplastic, antidiabetic, neuroprotective, and other biological activities [4,5]. Wastes derived from tannin-containing plants are employed to recover these valuable products, with multiple potential applications, namely, antioxidant, anti-inflammatory, anti-diabetic, and antimicrobial [6].
As a consequence of these studies, natural polyphenols have been exploited in agro-food, cosmetic and the over-the-counter (OTC) drug industry valorizing by-products of the agri-food industry as potential sources to produce added-value extracts. This prompted many research groups to develop effective extraction approaches to improve the product yields and reduce both solvent consumption and extraction time [7].
In light of the development of a circular bio-economy, recent efforts have been dedicated to promote nut shells as a promising source of bioactive compounds. These by-products accumulate from the industrial production of hazelnuts, chestnut, peanuts and almonds. Chlorogenic acid and catechin have been identified as polyphenols with high antioxidant activity among the compounds extractable from different varieties of almond hulls [8]. Moreover, 5,7-dihydroxychromone, eriodictyol and luteolin were extracted, isolated and quantified from peanut shells in a study including ultrasound-assisted methanol extraction and DPPH–HPLC–DAD–TOF/MS analysis [3]. A chestnut shells extract was subjected to Folin–Ciocalteu, FRAP, DPPH and ABTS+• assays and was revealed to contain high amounts of ellagic acid, caffeic acid derivatives and epigallocatechin [9]. The analysis of pecan nut shell’s hydroalcoholic extracts showed phenolic content, condensed tannins amount, and antioxidant activity higher than those of the aqueous extracts with epigallocatechin, ellagic acid, epicatechin and gallic acid being the most abundant constituents [10].
As far as we know, Pistacia vera hard shells have not yet been investigated as a potential source of bioactive compounds. The Pistacia genus belongs to the Anacardiaceae, a widespread family with about 70 genera and over 600 species. P. vera is the only species cultivated as food for commercial purposes [11,12] and P. lentiscus is exploited for food products, cosmetics and health products [13,14]. Italy produces less than 0.6% of P. vera world production. However, the pistachio cultivated in Bronte, a little town of Sicily located over Mount Etna, has raised considerable importance thanks to its unique characteristics, as confirmed in 2009 by the achievement of the Protected Designation of Origin (PDO) [15].
The fruit is a drupe constituted by an oval endocarp which is a thin and hard shell containing the edible seed, commonly called “pistachio” and characterized by a bright green color under a purplish skin. Only 50% of the pistachio nut’s weight is edible; all the remaining parts, such as hulls and hard shells (in the following, simply “shells”), are considered waste and, therefore, a by-product of low economic value. However, in some papers, pistachio kernel and green hulls have been evaluated as sources of bioactive compounds, namely polyphenols with antioxidant activity [16,17].
For the above reasons, we decided to focus our interest on Pistacia vera shells. In the present work, different extraction procedures have been evaluated. The extracts have been analyzed for their total phenolic content (TPC), total flavonoid content (TFC) and their antioxidant activity using DPPH, trolox equivalent antioxidant capacity (TEAC) and oxygen radical absorbance capacity (ORAC) assays. The ethanol extract with the highest antioxidant activity and the highest extraction yield was thus fractionated with an easily scalable methodology. The main constituents were identified mainly by HPLC/ESI-MS/MS, supported by literature search; 1H NMR spectra were also acquired to corroborate some MS-based identifications.

2. Materials and Methods

2.1. Chemicals

Catechin dihydrate, 96% ethanol (EtOH), fluorescein, NaNO2 and Folin–Ciocalteau reagent were purchased from Merck (Darmstadt, Germany); 2,2-diphenylpicrylhydrazyl radical (DPPH), and formic acid (FA) were obtained from Merck. AlCl3, quercetin, gallic acid, potassium persulfate, KH2PO4, Na2HPO4 12 H2O, 6-hydroxy-2,5,7,8-tetramethylchromane-2-carboxyl acid (Trolox), 2,2′-azino-bis(3-ethylbenzothiazoline-6-sulfonic acid) diammonium salt (ABTS+), DMSO-d6 and XAD-16 stationary phase were purchased from Sigma Aldrich (Milan, Italy). Furthermore, 2,2′-azobis(2-methylpropionamidine) dihydrochloride (AAPH) was purchased from Acros Organics (Thermo Fischer Scientific, San Jose, CA, USA). HPLC-grade water and acetonitrile (ACN) were purchased from Carlo Erba (Milan, Italy).

2.2. Preparation of Pistachio Shells Extracts

Dried pistachio shells from Pistacia vera (variety Bronte) were kindly provided by a pistachio local manufacturer (Bronte (CT), Italy); the material was ground to give 60-mesh size powder. Aliquots of ground pistachio shells (5.0 g) were extracted at room temperature (rt) under continuous stirring with the following solvents or solvent mixtures (50 mL): EtOH, MeOH, H2O (pH = 4), EtOH:H2O (50:50), EtOAc. Each sample was extracted three times for a total time of 16 h (2 h + 2 h + 12 h). The supernatants were filtered under vacuum and the solvent was removed with a rotavapor. The extracts were dried to a constant weight. Each extraction was carried out in triplicate and the extraction yields are listed in Table 1. The residue obtained from EtOAc extraction was subjected to a further extraction with EtOH (50 mL), in the conditions and with the same procedure above reported (EtOH 2).
Another sample of ground pistachio shells (100 g) was defatted with n-hexane (400 mL). The extraction was carried out three times (2 h + 2 h + 2 h). Then, the residue was subjected to further extraction procedures with EtOH using the same sample-to-solvent ratio above described. Briefly, defatted pistachio shells (5.0 g) were treated with EtOH at rt under stirring, three times for 72 h (24 + 24 + 24; EtOH 72 h). Another aliquot (5.0 g) was extracted in EtOH under ultrasonic probe sonication (Sonorex Super RK 102 H, Bandelin, Berlin, DE) operating at a constant ultrasonic power and frequency of 480 W and 35 kHz, respectively, for a total time of 60 min (20 + 20 + 20; EtOH UAE). Analogously, a further sample (5.0 g) was extracted in a microwave system (CEM Discover, CEM srl, Cologno al Serio, BG, Italy) with a microwave power of 1000 W for a total of 270 s (90 + 90 + 90; EtOH MAE). After each extraction, the supernatant was recovered by filtration under vacuum and finally the total extract was dried to constant weight. Each extraction procedure was repeated in triplicate. The extraction yields are reported in Table 1. The microwave-assisted extraction was repeated on a greater scale (50 g) and then the extract was subjected to column chromatography.

2.3. Amberlite XAD-16 Fractionation

The EtOH MAE extract (0.4 g) was fractionated onto a XAD-16 column (20 cm × 3 cm), eluted first with water (80 mL) and after with 15% (25 mL), 30% (25 mL), 60% (25 mL) and 100% EtOH (50 mL). Column eluates were pooled in six fractions: Fr1 (0.1428 g), Fr2 (0.0323 g), Fr3 (0.0159 g), Fr4 (0.0446 g), Fr5 (0.0789 g), Fr6 (0.0402 g), with a total weight of 0.3547 g (88.6% of total extract recovered).

2.4. Determination of Total Phenolic Content (TPC)

The total phenolic content of extracts and fractions was determined according to the Folin–Ciocalteu method described previously [18]. Samples (2.0–10.0 mg/mL; 50 µL) were mixed with Folin–Ciocalteu’s reagent (250 μL) and 1.9 M Na2CO3 solution (500 μL) in a 5 mL volumetric flask. The mixtures were incubated at 25 °C for 2 h, then the absorbance was read at 750 nm with Jasco V750 spectrometer (Jasco Europe srl, Cremella, LC, Italy). Gallic acid aliquots (10, 15, 20, 25 and 30 µL of 1.0 mg/mL) were treated with the same protocol to produce a calibration curve (r2 = 0.9994). Results, obtained as mean ± SD, were reported as mg of gallic acid equivalents per g of extract/fraction (mg GAE/g).

2.5. Determination of Total Flavonoid Content (TFC)

The total flavonoid content of extracts and fractions was determined according to a methodology adapted to a previous report [19]. Distilled water (100 μL) was added to each well of a 96-well plate, followed by 10 μL of NaNO2 (50 g/mL) and 25 μL of catechin solutions (10–240 µg/mL) or sample solutions (200 µg/mL). The plate was incubated at 27 °C for 5 min, then 15 μL of AlCl3 (100 g/mL) was added to each well and the plate was shaken at 27 °C for 6 min. A 0.5 M NaOH solution (100 μL) was added, and after 30 s, the absorbance at 510 nm was acquired. Catechin was employed as standard to build a calibration curve (r2 = 0.9996) and the data obtained were elaborated by linear regression and expressed as mg of catechin equivalents per g of extract/fraction (mg CatE/g).

2.6. DPPH Radical Scavenging Activity Assay

The radical scavenging activity was determined with a DPPH stable radical, as previously reported [19]. The samples were examined at three different concentrations. To a freshly prepared DPPH solution (10−4 M, 2 mL), 10, 20 or 30 µL of samples (1.0–2.0 mg/mL) or standard (quercetin, 0.2 mg/mL) was added. The test tubes were incubated for 2 h in the dark at 25 °C and the absorbance was measured at 515 nm with Jasco V630 spectrometer (Jasco Europe srl, Cremella, LC, Italy). The percentage of reacted DPPH was calculated according to this equation:
quenched   DPPH ( % ) = ( A 0   A sample ) A 0 × 100
where A0 is the absorbance measured for the DPPH solution; Asample is the absorbance measured for DPPH solution treated with tested compounds. EC50 is the effective concentration (µg/mL) of a given sample quenching 50% of the initial DPPH radicals. EC50 was calculated from the linear regression between the percentage of DPPH quenched and the sample concentration.

2.7. Determination of Oxygen Radical Absorbance Capacity (ORAC)

The ORAC of the extracts and fractions was determined with the methodology previously reported [18]. The assay was performed in a 96 well-microplate. Briefly, 25 µL of sample solutions (0.1 mg/mL) or of gallic acid (5–20 µM) or standard (quercetin, 2.5 mM) was added in each well followed by 150 µL of 1 × 10⁻⁷ M fluorescein solution. The microplate was incubated at 37 °C for 10 min. Then, 25 µL of AAPH (0.153 M) was added and the fluorescence was measured immediately after the addition every 1 min for 30 min using a microplate reader (Synergy H1 microplate reader, BioTek, Bad Friedrichshall, Germany) set at λEx = 485 nm and λEm = 528 nm. Trolox solutions were employed to obtain a calibration curve and to elaborate the data. The ORAC values were derived from the linear regression between the area under the curve (AUC) and the trolox concentration. The results were expressed as µmol of trolox equivalents per gram of extract or fraction (µmol TE/g).

2.8. Determination of Trolox Equivalent Antioxidant Capacity (TEAC)

The ABTS•+ radical cation was generated by treating ABTS•+ (7 mM) with potassium persulfate (2.45 mm) potassium. This solution was incubated in the dark at rt for 16h before use [20]. This stock solution (stable for 2 days) was diluted with EtOH to a final concentration of 70 µM (as ABTS•+). Subsequently, 200 µL of the ABTS•+ solution were added in the 96 well-microplate to 10, 20 or 30 µL of samples (from 0.2 to 0.04 mg/mL) or to 10 µL of standard solution of gallic acid (from 25 to 150 µM). The microplate was stirred at 23 °C for 6 min and the absorbance at 734 nm was recorded. Furthermore, a calibration curve was obtained in the same conditions employing trolox solutions at different concentrations (25–200 µM). The results obtained for the samples were elaborated by linear regression with the standard curve and are expressed as trolox equivalent (µmol) per gram of extract or fraction (µmol TE/g).

2.9. HPLC/ESI-MS/MS Analysis

Mass spectrometric analysis was performed on an ion trap mass spectrometer equipped with an ESI ion source (Thermo Scientific LCQ-DECA, Thermo Fischer Scientific, San Jose, CA, USA). The mass spectrometer was coupled online with an LC pump (Surveyor MS Pump, Thermo Scientific, Thermo Fischer Scientific, San Jose, CA, USA). Samples were dissolved in methanol (10 µg/µL) and 10 µL were loaded with an autosampler (Thermo Scientific, Thermo Fischer Scientific, San Jose, CA, USA) onto a Waters Symmetry RP-C18 column (150 mm × 1 mm i.d., 100 Å, 3.5 µm) heated at 25 °C. Elution was performed with the following gradient of H2O + 1% FA (solvent A) and ACN + 1% FA (solvent B) at 50 μL/min: t0 min B (5%), t25 min B (15%), t40 min B (25%), t55 min B (55%), t60 min B (95%), t65 min B (100%), t80 min B (5%). Full scan mass spectra were acquired in negative ion mode in the m/z range 150–2000. ESI ion source operated with 220 °C capillary temperature, 30 a.u. sheath gas, 4 kV source voltage and −18 V capillary voltage. Mass spectrometric analysis was performed by the data-dependent method with normalized collision energy of 29 a.u. and activation Q was set as 0.250. Mass calibration was achieved with a standard mixture of caffeine (Mr 194.1 Da), MRFA peptide (Mr 524.6 Da) and Ultramark (Mr 1621 Da). Data acquisition and data analyses were performed with the Xcalibur v. 1.3 Software (Thermo Fischer Scientific, San Jose, CA, USA).

2.10. H NMR Analysis

1H NMR spectra were acquired on a Varian 500 VNMR-S spectrometer (Varian, Milan, Italy)) operating at 499.86 MHz (1H) at 300 K and performed using software provided by the manufacturers. Samples were dissolved in DMSO-d6. Chemical shifts (δ) indirectly referred to DMSO-d6 solvent signal. The pre-sat technique has been employed to suppress the undesired signal of residual water.

2.11. HPLC-UV Aunatification of Gallic Acid (1)

The HPLC-UV chromatograms were carried out using an Agilent instrument (Milan, Italy) employing a quaternary pump (G1311A) and a diode array as detector (G1315D) set at 254, 280 and 325 nm. An Agilent Series 1100 G1313A autosampler was used for injection (5µL) of Fr3-6 and gallic acid (1) solutions. The analyses were performed on an analytical reversed phase column (Luna C18, 5 μm; 4.6 × 250 mm; Phenomenex) eluted with a gradient of H2O/H+ (99/1; A) and ACN/H+ (99/1; B) at 1 mL/min as follows: t0 min B (5%), t25 min B (15%), t40 min B (25%), t55 min B (55%), t60 min B (95%), t65 min B (100%), t80 min B (5%). In these conditions, gallic acid (1) was eluted at Tr = 6.28 min. An external calibration curve of 1 was obtained employing four solutions in a concentration ranges from 500 to 50 μg/mL (R2 = 0.9998). The concentration of 1 in fractions was determined by employing chromatograms obtained at 280 nm and expressed as g of gallic acid over 100 g of dried extract: Fr3 = 8%; Fr4 = 3.1%; Fr5 = 0.2%; Fr6 = 0.05%.

2.12. Statistical Analysis

All experiments were performed in triplicate, and the results were expressed as mean value ± standard deviations. Principal component analysis (PCA) was performed with the Pareto scaling method and an analysis of correlations was determined by a bivariate correlations test. All data were obtained by plotting the experimental measurements on Origin 8.0 software or on Excel 2016. All the obtained results were compared using analysis of variance (ANOVA) and differences were designated as statistically significant when p < 0.05, according to Tukey’s test.

3. Results and Discussion

3.1. Evaluation of Different Extractions

The powdered shells from Pistacia vera were subjected to extraction with selected solvents, namely methanol (MeOH), ethanol (EtOH 1), ethyl acetate (EtOAc), EtOH/H2O 50:50 and H2O at pH 4 (maintaining a 1:10 solid:liquid ratio). The choice of extraction solvents and conditions (time, pH, etc.) was performed based on both previous experience and a similar work on the phenolic compounds extracted from hazelnut shell [21]. A further extract was obtained by treating the residue from EtOAc extraction with ethanol (EtOH 2). This latter procedure was carried out to verify whether it was possible to extract additional antioxidant compounds after treating with a low-polar solvent. The extractions were carried out by stirring as described in the experimental section. The percentage yield of each extraction is reported in Table 1. From these data, it is evident that the extraction with H2O at pH 4 yielded the highest percentage of extract, followed by the extraction with EtOH/H2O and EtOH 1. All extracts were analyzed with two spectrophotometric assays to determine their TPC (expressed as gallic acid equivalent, GAE, in mg/g) and TFC (expressed as catechin equivalent, CatE, in mg/g). The antioxidant activity evaluation of the extracts was performed as scavenging of the DPPH radical (expressed as EC50 in μg/mL), TEAC (expressed as μmol TE/g) and ORAC (expressed as μmol TE/g). According to the reaction mechanism, the most used methods to measure the antioxidant activity are generally classified into two groups: those based on hydrogen atom transfer (HAT) such as ORAC, whereas others are based on single electron transfer (SET) such as DPPH, TEAC and FRAP [22]. The results are shown in Table 1. The flavonoid quercetin was used as a positive reference.
The MeOH extraction afforded a sample with the highest content of phenols and flavonoids (TPC = 381 mg GAE/g, TFC = 359 mg CatE/g, respectively). EtOH 2 extraction was the second in order for TPC and TFC values (293 mg GAE/g and 283 mg CatE/g), whereas the other extracts gave lower values. These data are in perfect agreement with the observed antioxidant activity. Namely, MeOH is the extract with the best DPPH scavenging activity (EC50 = 7.8 μg/mL) and the highest TEAC (3188 μmol TE/g) and ORAC values (798 μmol TE/g), followed by EtOH 2 (DPPH: EC50 8.9 μg/mL; TEAC: 2721 μmol TE/g; ORAC: 779 μmol TE/g). On the basis of these data, MeOH extraction would be the best method to obtain an antioxidative extract from pistachio hard shells; however, EtOH, affording an extract with good antioxidant activity, has the advantage of a lower toxicity being a GRAS solvent.
It is also noteworthy that the EtOH extraction performed after an extraction step with EtOAc (EtOH 2) allows one to obtain an extract with higher content of both polyphenols (+55%) and flavonoids (+44%), and greater antioxidant activity than the simple ethanol extraction (EtOH 1); this is reasonably related to the reduction of apolar constituents, presumably devoid of antioxidant activity. Thus, we adopted a modified EtOH extraction procedure, employing a preliminary defatting step with n-hexane to reduce apolar constituents. The defatting step is indicated as Hex in Table 1. With this procedure, about 1.43% of apolar components were removed from the starting material. As indicated by the high DPPH value, the Hex extract shows a very low antioxidant activity (EC50 = 160 μg/mL). We also planned to optimize the EtOH extraction with different methods, as reported in Table 1: stirring for 72 h (EtOH 72 h), ultrasound-assisted extraction for 1h (EtOH UAE) and microwave-assisted extraction for 270 s (EtOH MAE). All these extracts show high TPC (in the range 309–332 mg GAE/g) and TFC values (551–583 mg CatE/g), and very good antioxidant activity (DPPH: EC50 6.1–7.6 μg/mL, TEAC: 3677–4001 μmol TE/g and ORAC: 849–916 μmol TE/g). In particular, EtOH MAE gave the best extraction yield (+500% compared with EtOH 2) coupled with the highest antioxidant capacity. Consequently, this procedure was selected as an optimized extraction method and therefore replicated on the macro-scale (50 g). This latter extract was subjected to column chromatography as detailed below.

3.2. Preparation of Polyphenol-Enriched Fractions by XAD-16 Fractionation

The EtOH MAE extract was subjected to a gross-fractionation on Amberlite XAD-16, collecting the eluate in six fractions (Fr1–Fr6) of predefined volumes. This protocol was planned as a simple and reproducible procedure scalable for possible industrial applications. Both total phenolic and flavonoid contents of the fractions were determined, as well as their antioxidant activity. The results are reported in Table 1.
Fractions Fr1 and Fr2, corresponding respectively to 40.26% and 9.11% of the total eluate, show low TPC and TFC values and negligible antioxidant activity. These data show that the column separation allowed to remove about 50% of components that does not contribute to the antioxidant activity. Fraction Fr3, corresponding to 4.48% of the total eluate, shows fairly good values for both the polyphenol (TPC = 153 mg GAE/g) and flavonoid (TFC = 182.9 mg CatE/g) content and for the antioxidant activity (DPPH EC50 = 10 µg mL; TEAC = 1823 µmol TE/g; ORAC = 647 µmol TE/g).
Fractions Fr4-Fr6 show the most remarkable results in antioxidant assays. In particular, fraction Fr4, corresponding to 12.57% of the total eluate, has the highest values for both antioxidant activity (DPPH EC50 = 4.1 µg/mL; TEAC = 4155 µmol TE/g; ORAC = 1344 µmol TE/g), and polyphenol content (TPC = 458 mg GAE/g), also presenting a significant flavonoid content (TFC = 179 mg CatE/g). Similar results were observed for Fr5 and Fr6 (22.24% and 11.33% of the total eluate), showing good antioxidant activity (DPPH EC50 values of 5.5 and 6.9 µg/mL; TEAC of 3921 and 3475 µmol TE/g; ORAC = 1243 and 965 µmol TE/g) coupled with the highest TFC values (445 and 395 mg CatE/g). These results indicate that the XAD fractionation process allows one to obtain polyphenol-enriched fractions with enhanced antioxidant activity.

3.3. Correlation Analysis on Extracts and Fractions

Pearson’s correlation analysis directly correlates the TPC, TFC and antioxidant activity (DPPH, TEAC and ORAC) of all extracts and fractions reported in Table 1. Since, for DPPH, a lower EC50 value corresponds to a higher scavenging activity, EC50 values were converted into 1/EC50 values. DPPH, TEAC and ORAC values were highly correlated with TPC (R values raging between 0.85 and 0.92; p < 0.001) and moderately correlated with TFC (R values raging between 0.49 and 0.73; p < 0.05). All Pearson correlations are reported as Table S1 in Supplementary Materials.

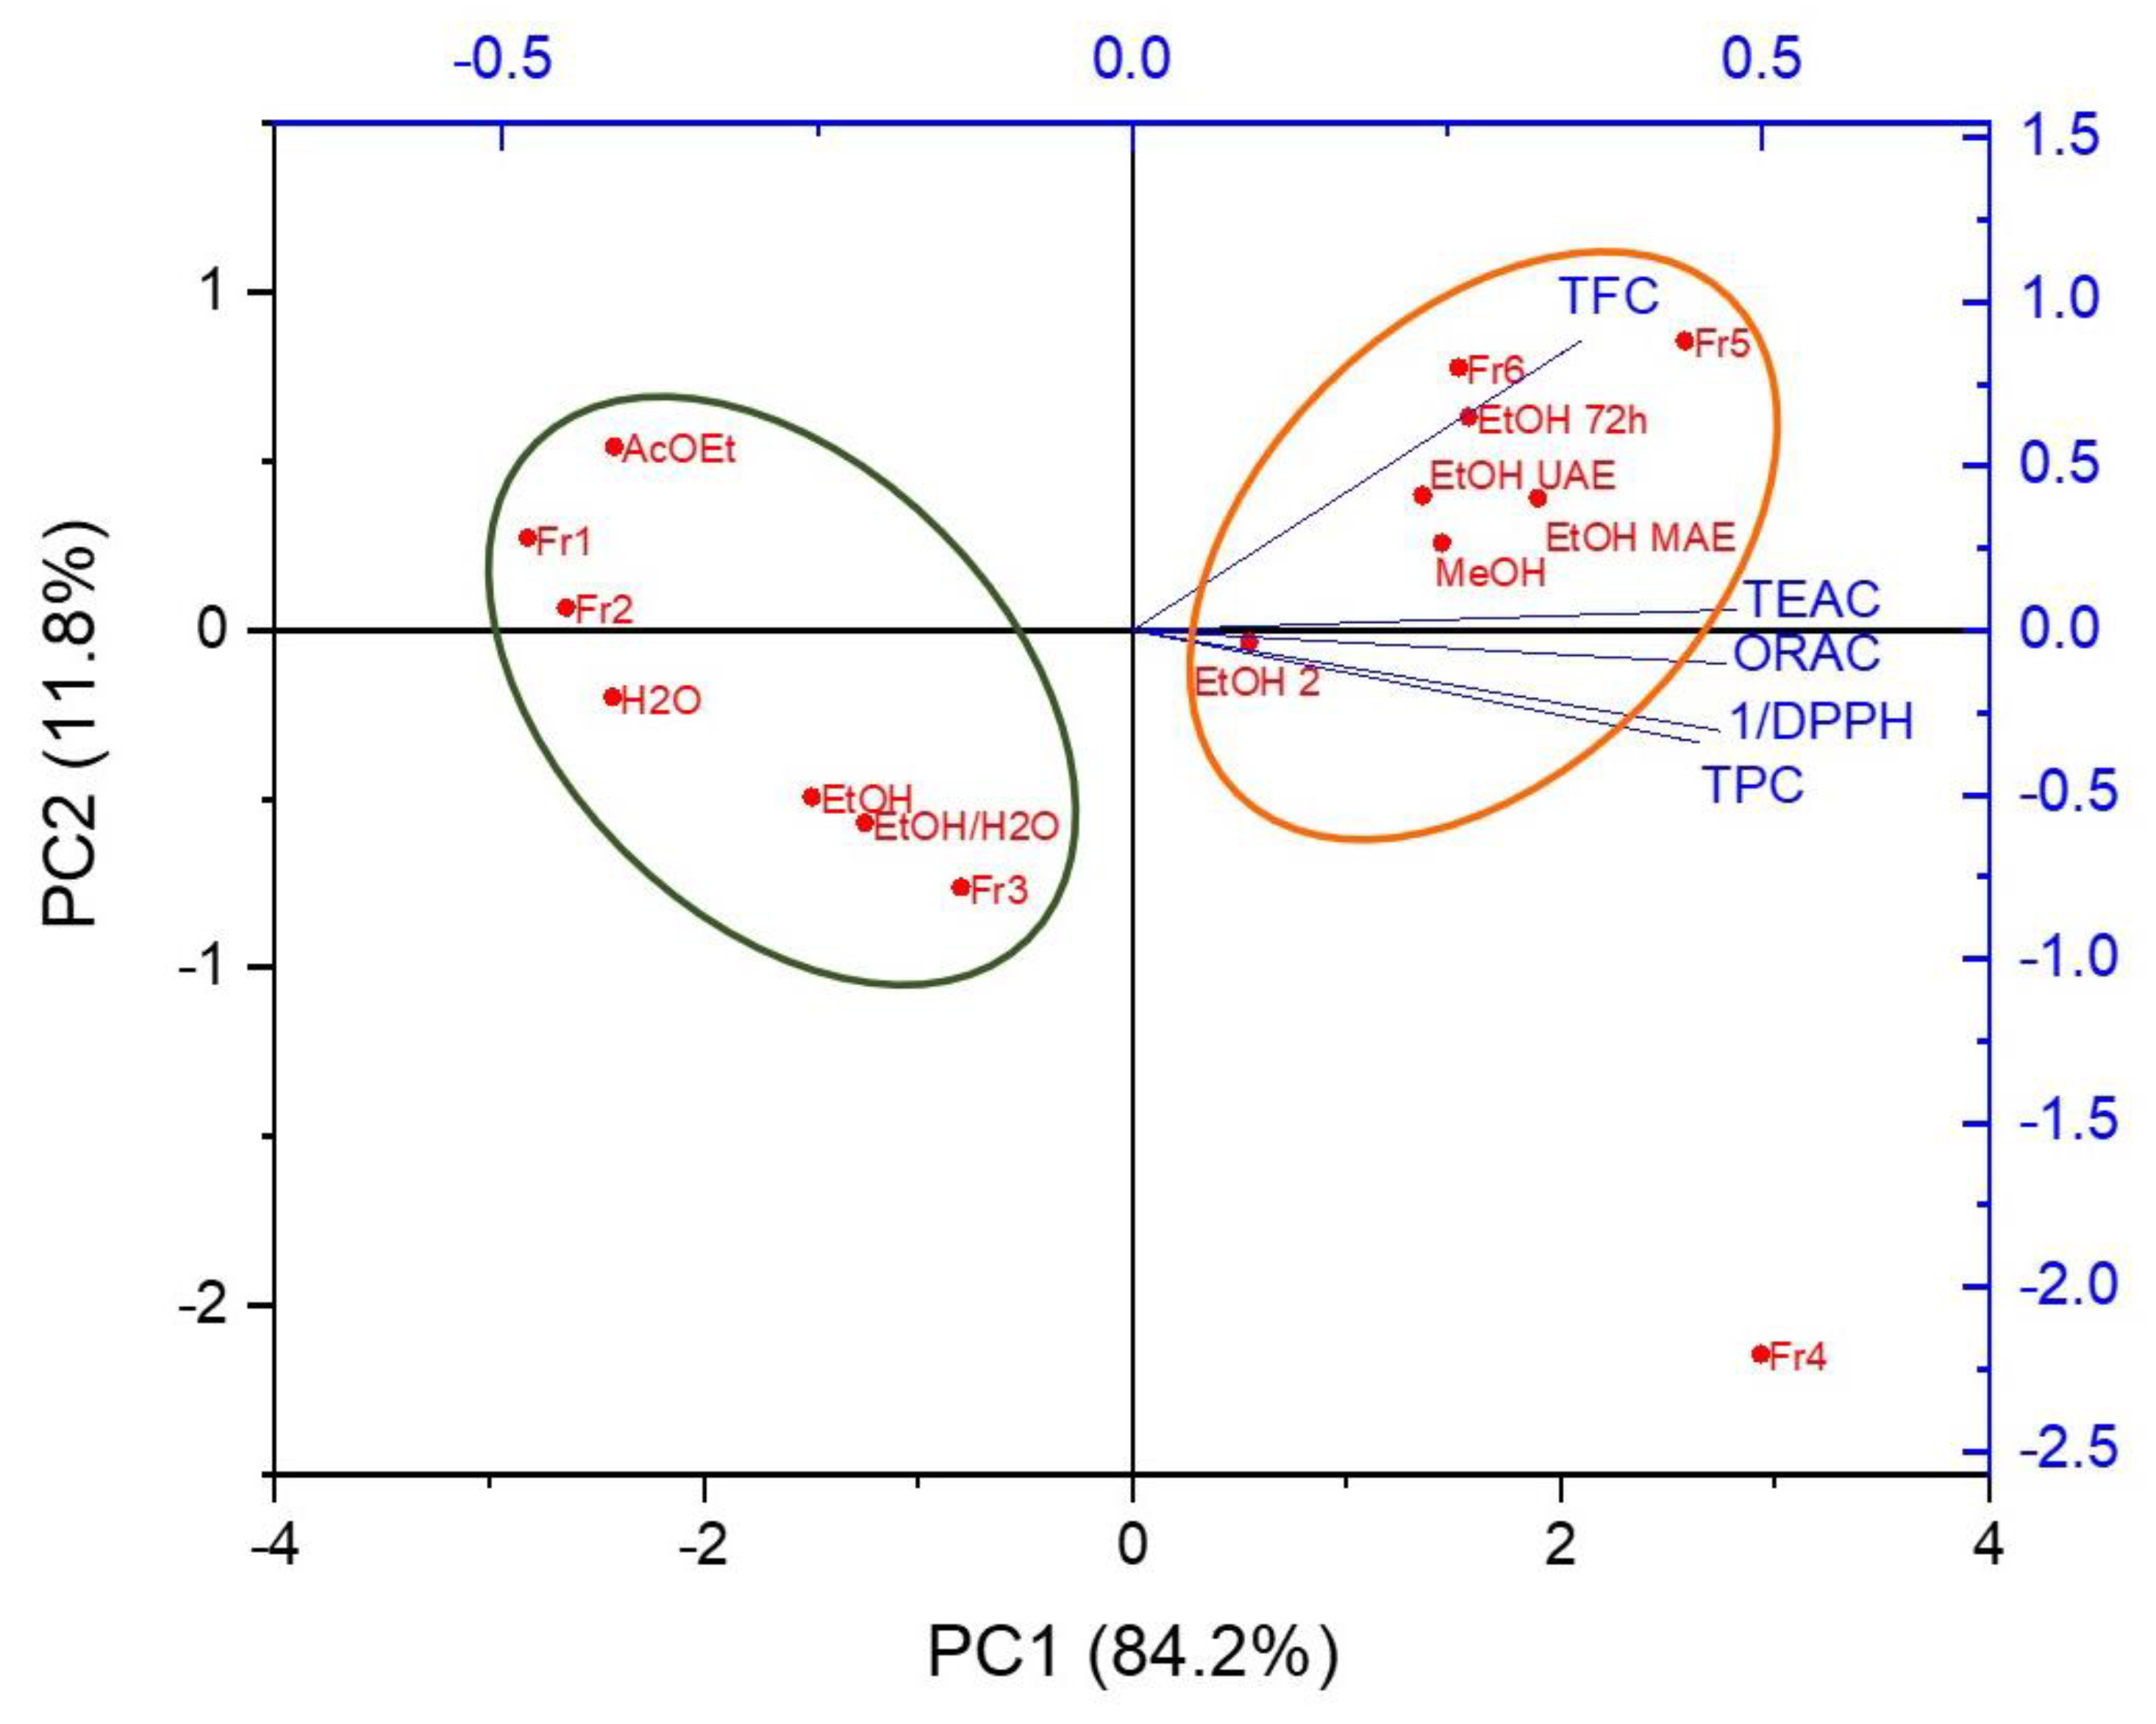
3.4. Principal Component Analysis (PCA)

A principal component analysis was performed to get a general overview of the data distribution in Table 1; results are summarized in Figure 1. The first principal component (PC1) has the highest eigenvalue of 4.21 and accounted for 84.2% of the dataset variability. The second, third, and fourth PCs (PC2, PC3, and PC4) had eigenvalues of 0.59, 0.13, and 0.04 and explained 11.8%, 2.7%, and 0.9% of the variance, respectively. Subsequently, by plotting the samples’ scores in the subspaces PC1 vs. PC2 (96.1% of the data’s total variance), a clear grouping of samples was observable. Figure 1 shows at least two clearly distinguishable clusters: the first group is composed of extracts ETOH 1, ETOH/H2O, H2O, AcOEt and fractions Fr1–Fr3; the second originated by grouping the EtOH 2, the optimized EtOH extracts and fractions Fr5 and Fr6. PCs axes’ components correlate the extracts MeOH, EtOH 2 and the fractions Fr4–Fr6 with antioxidant activity (DPPH, TEAC and ORAC) and total phenolic content (TPC); extract EtOH 72 h, EtOH UAE and EtOH MAE highly correlate with TFC and moderately with antioxidant activity and total phenolic content. The other extracts and fractions Fr1 and Fr2 were globally negatively correlated with the variables. The bigger the eigenvectors, the higher the correlations between variables and PCs. All the variables were positively associated with PC1, while TEAC and TFC were positively associated with PC2 (Table 2).

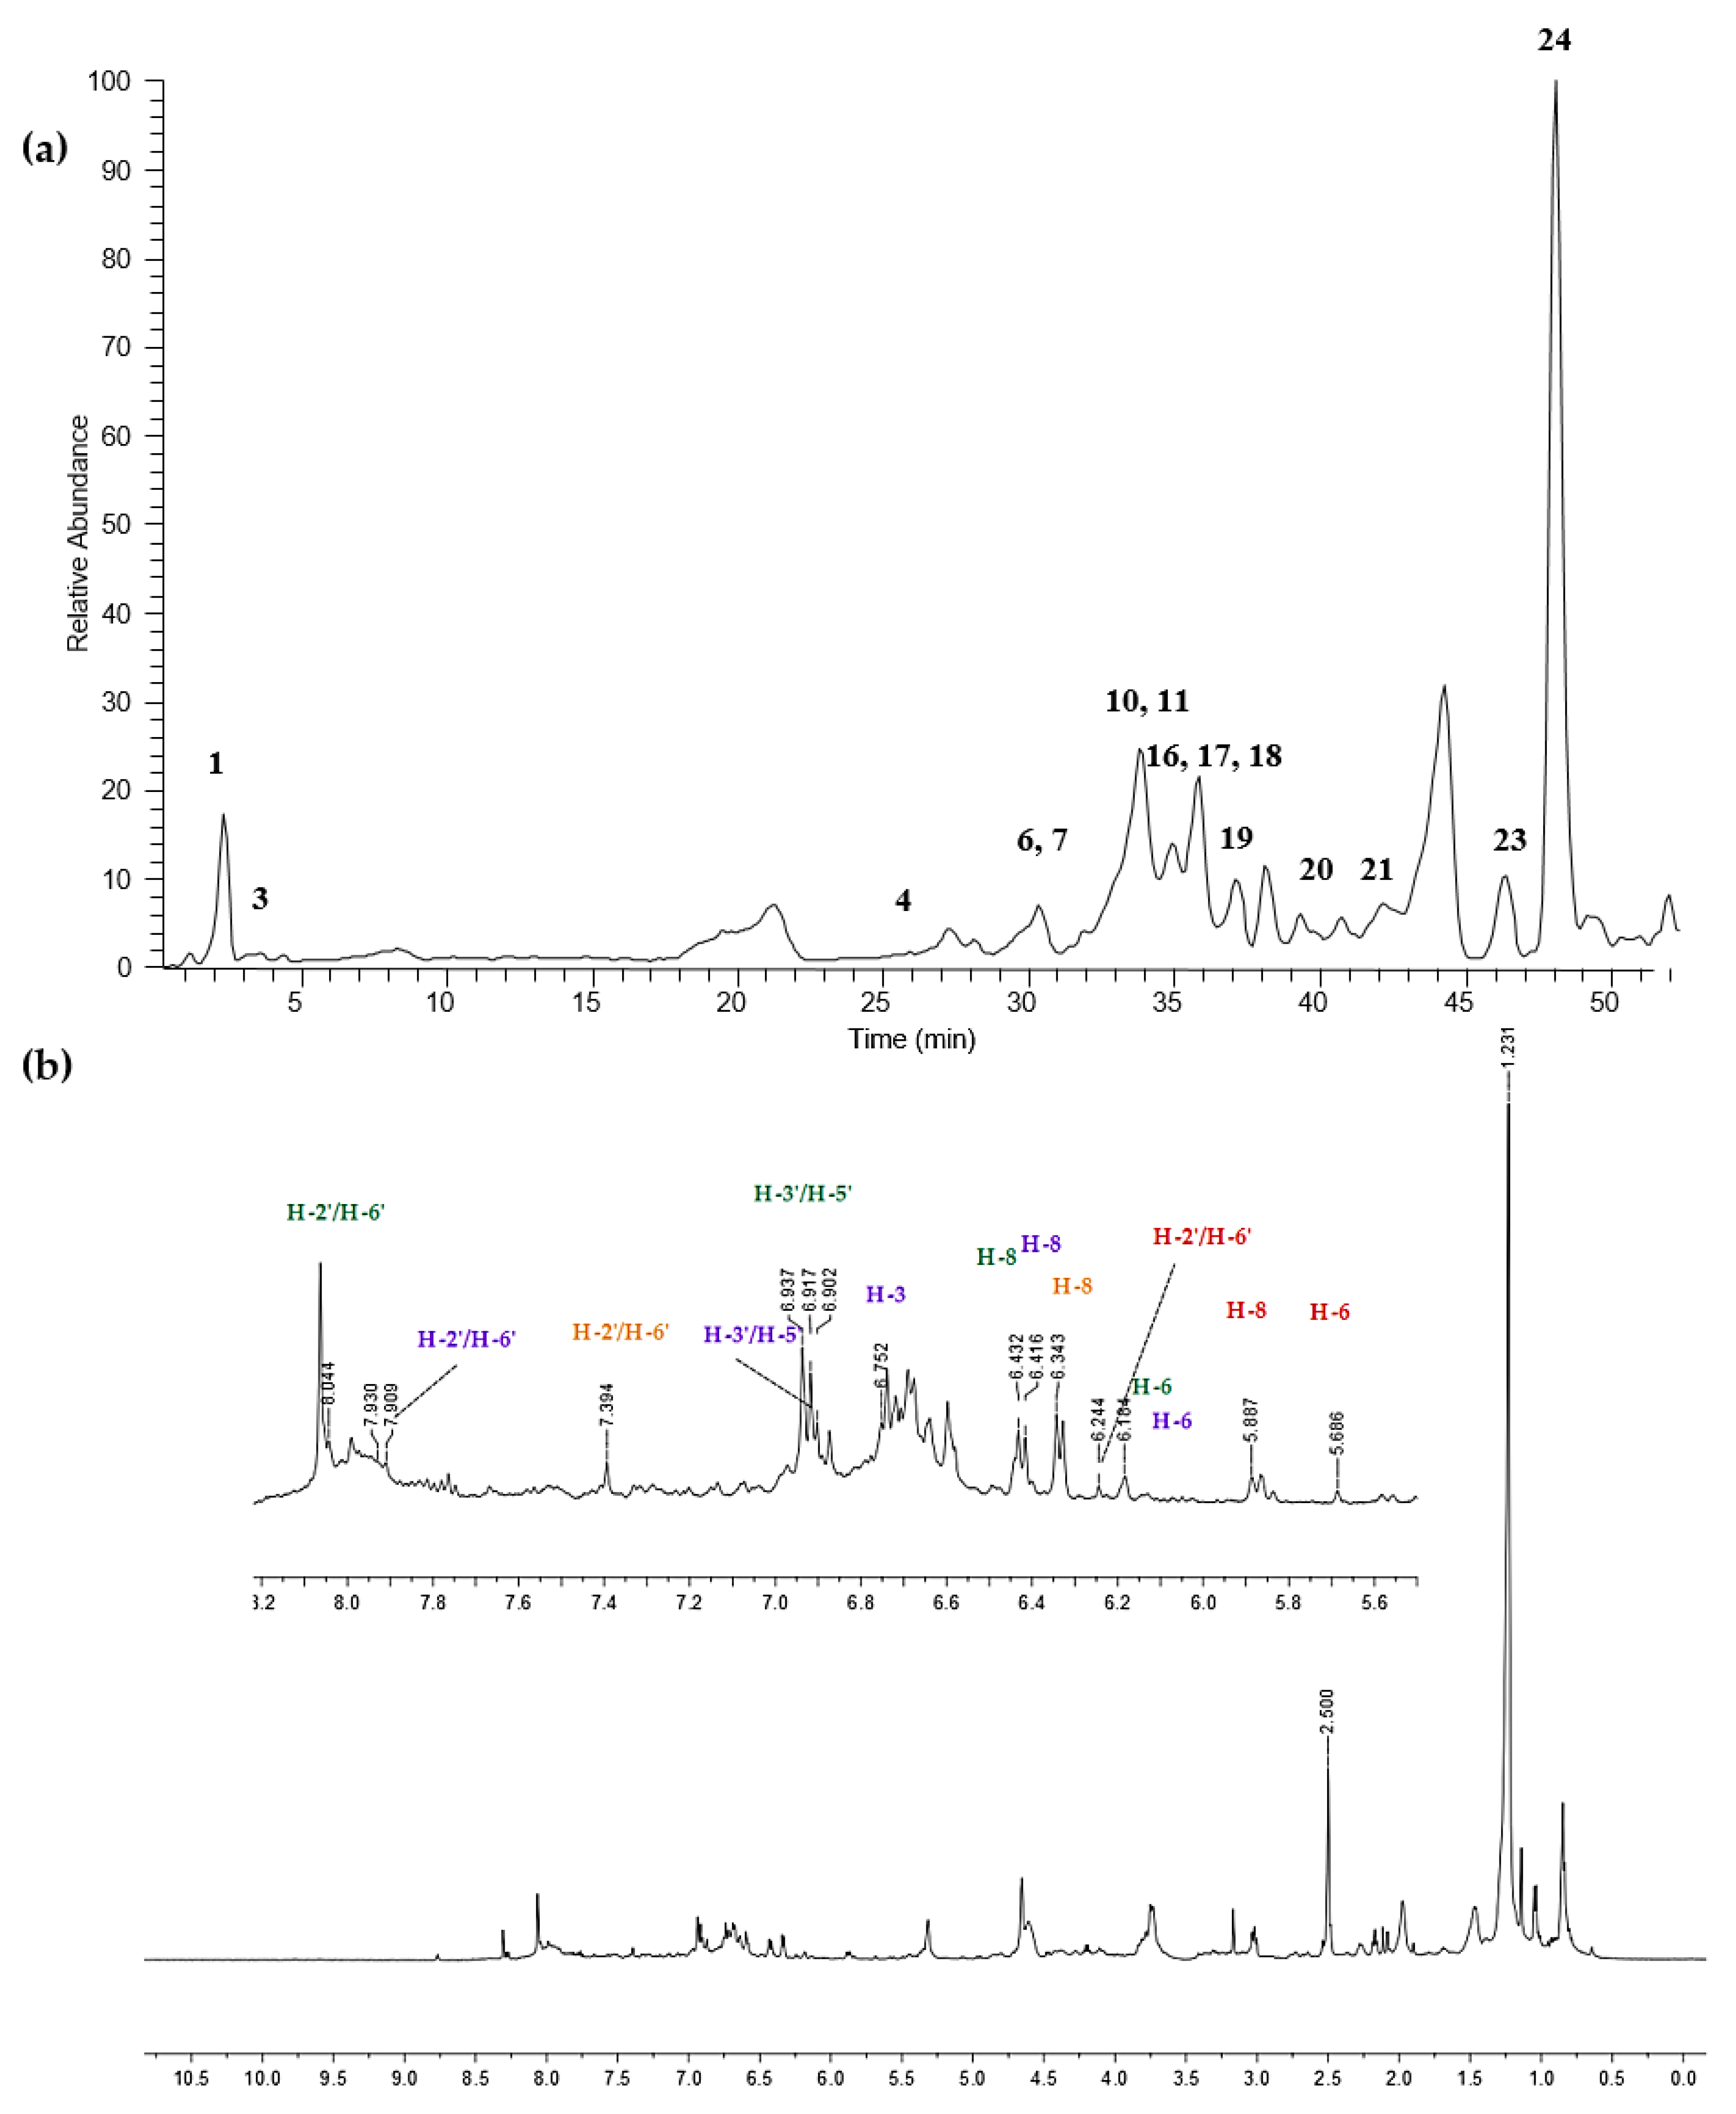
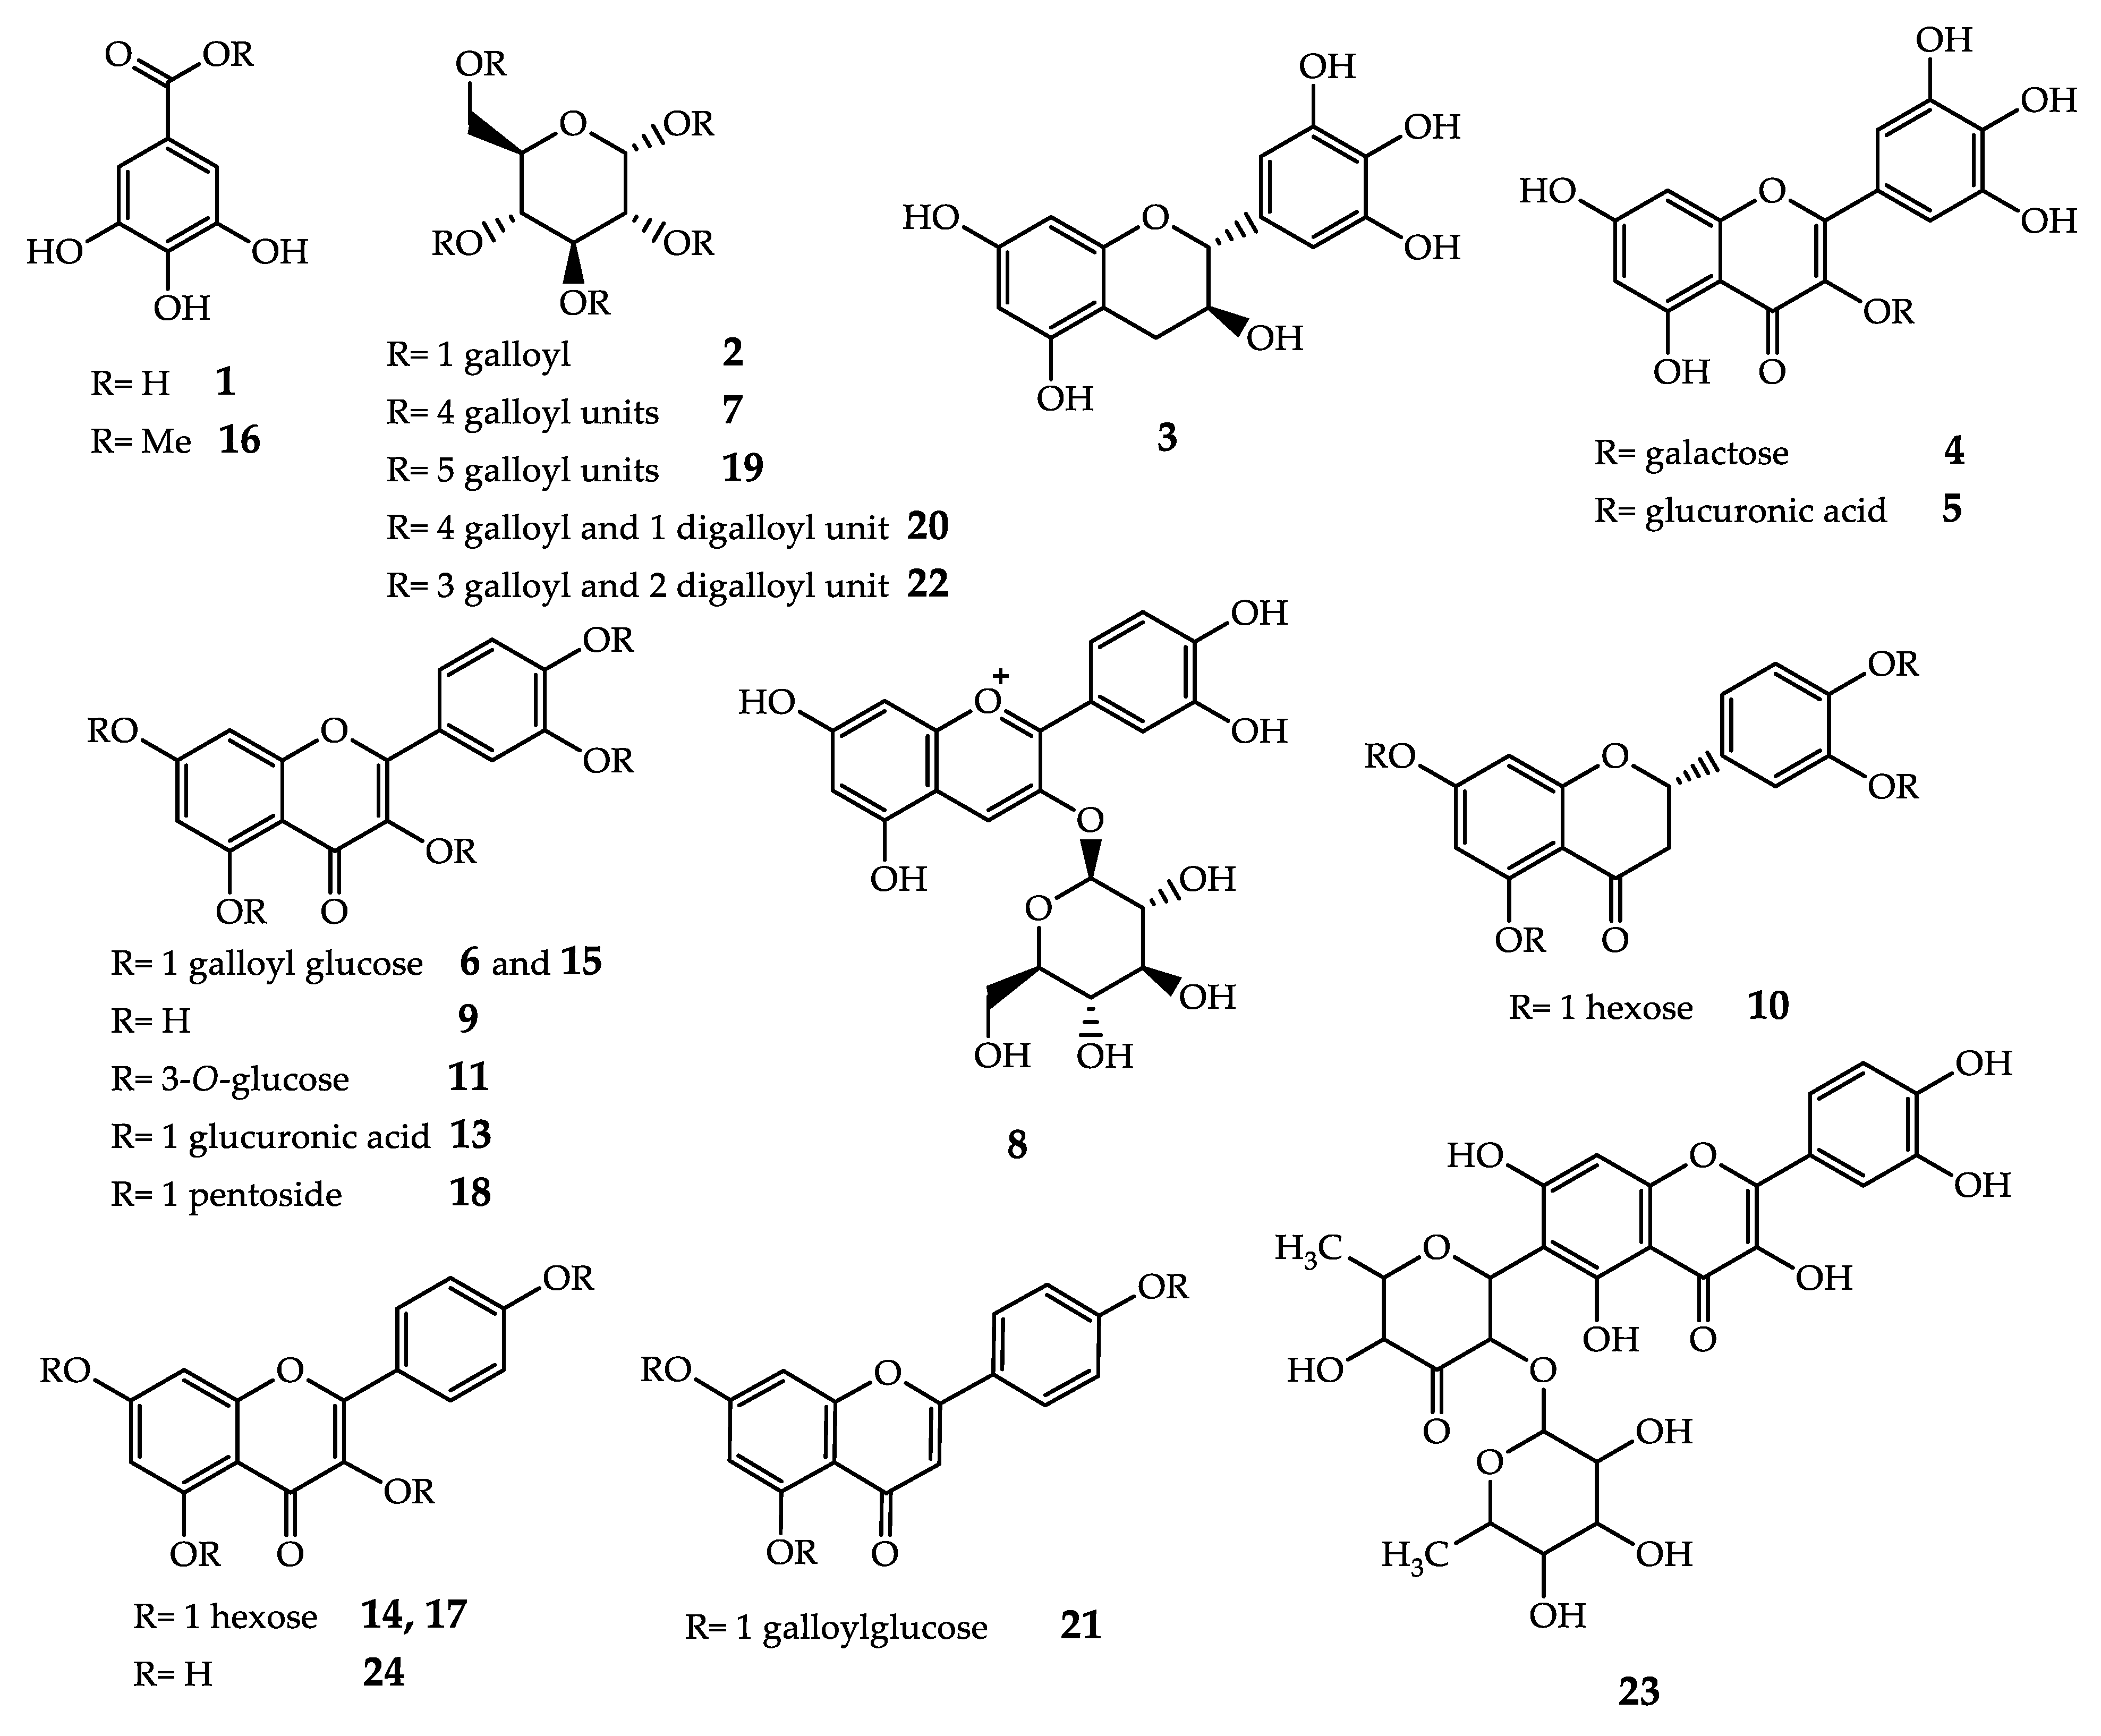
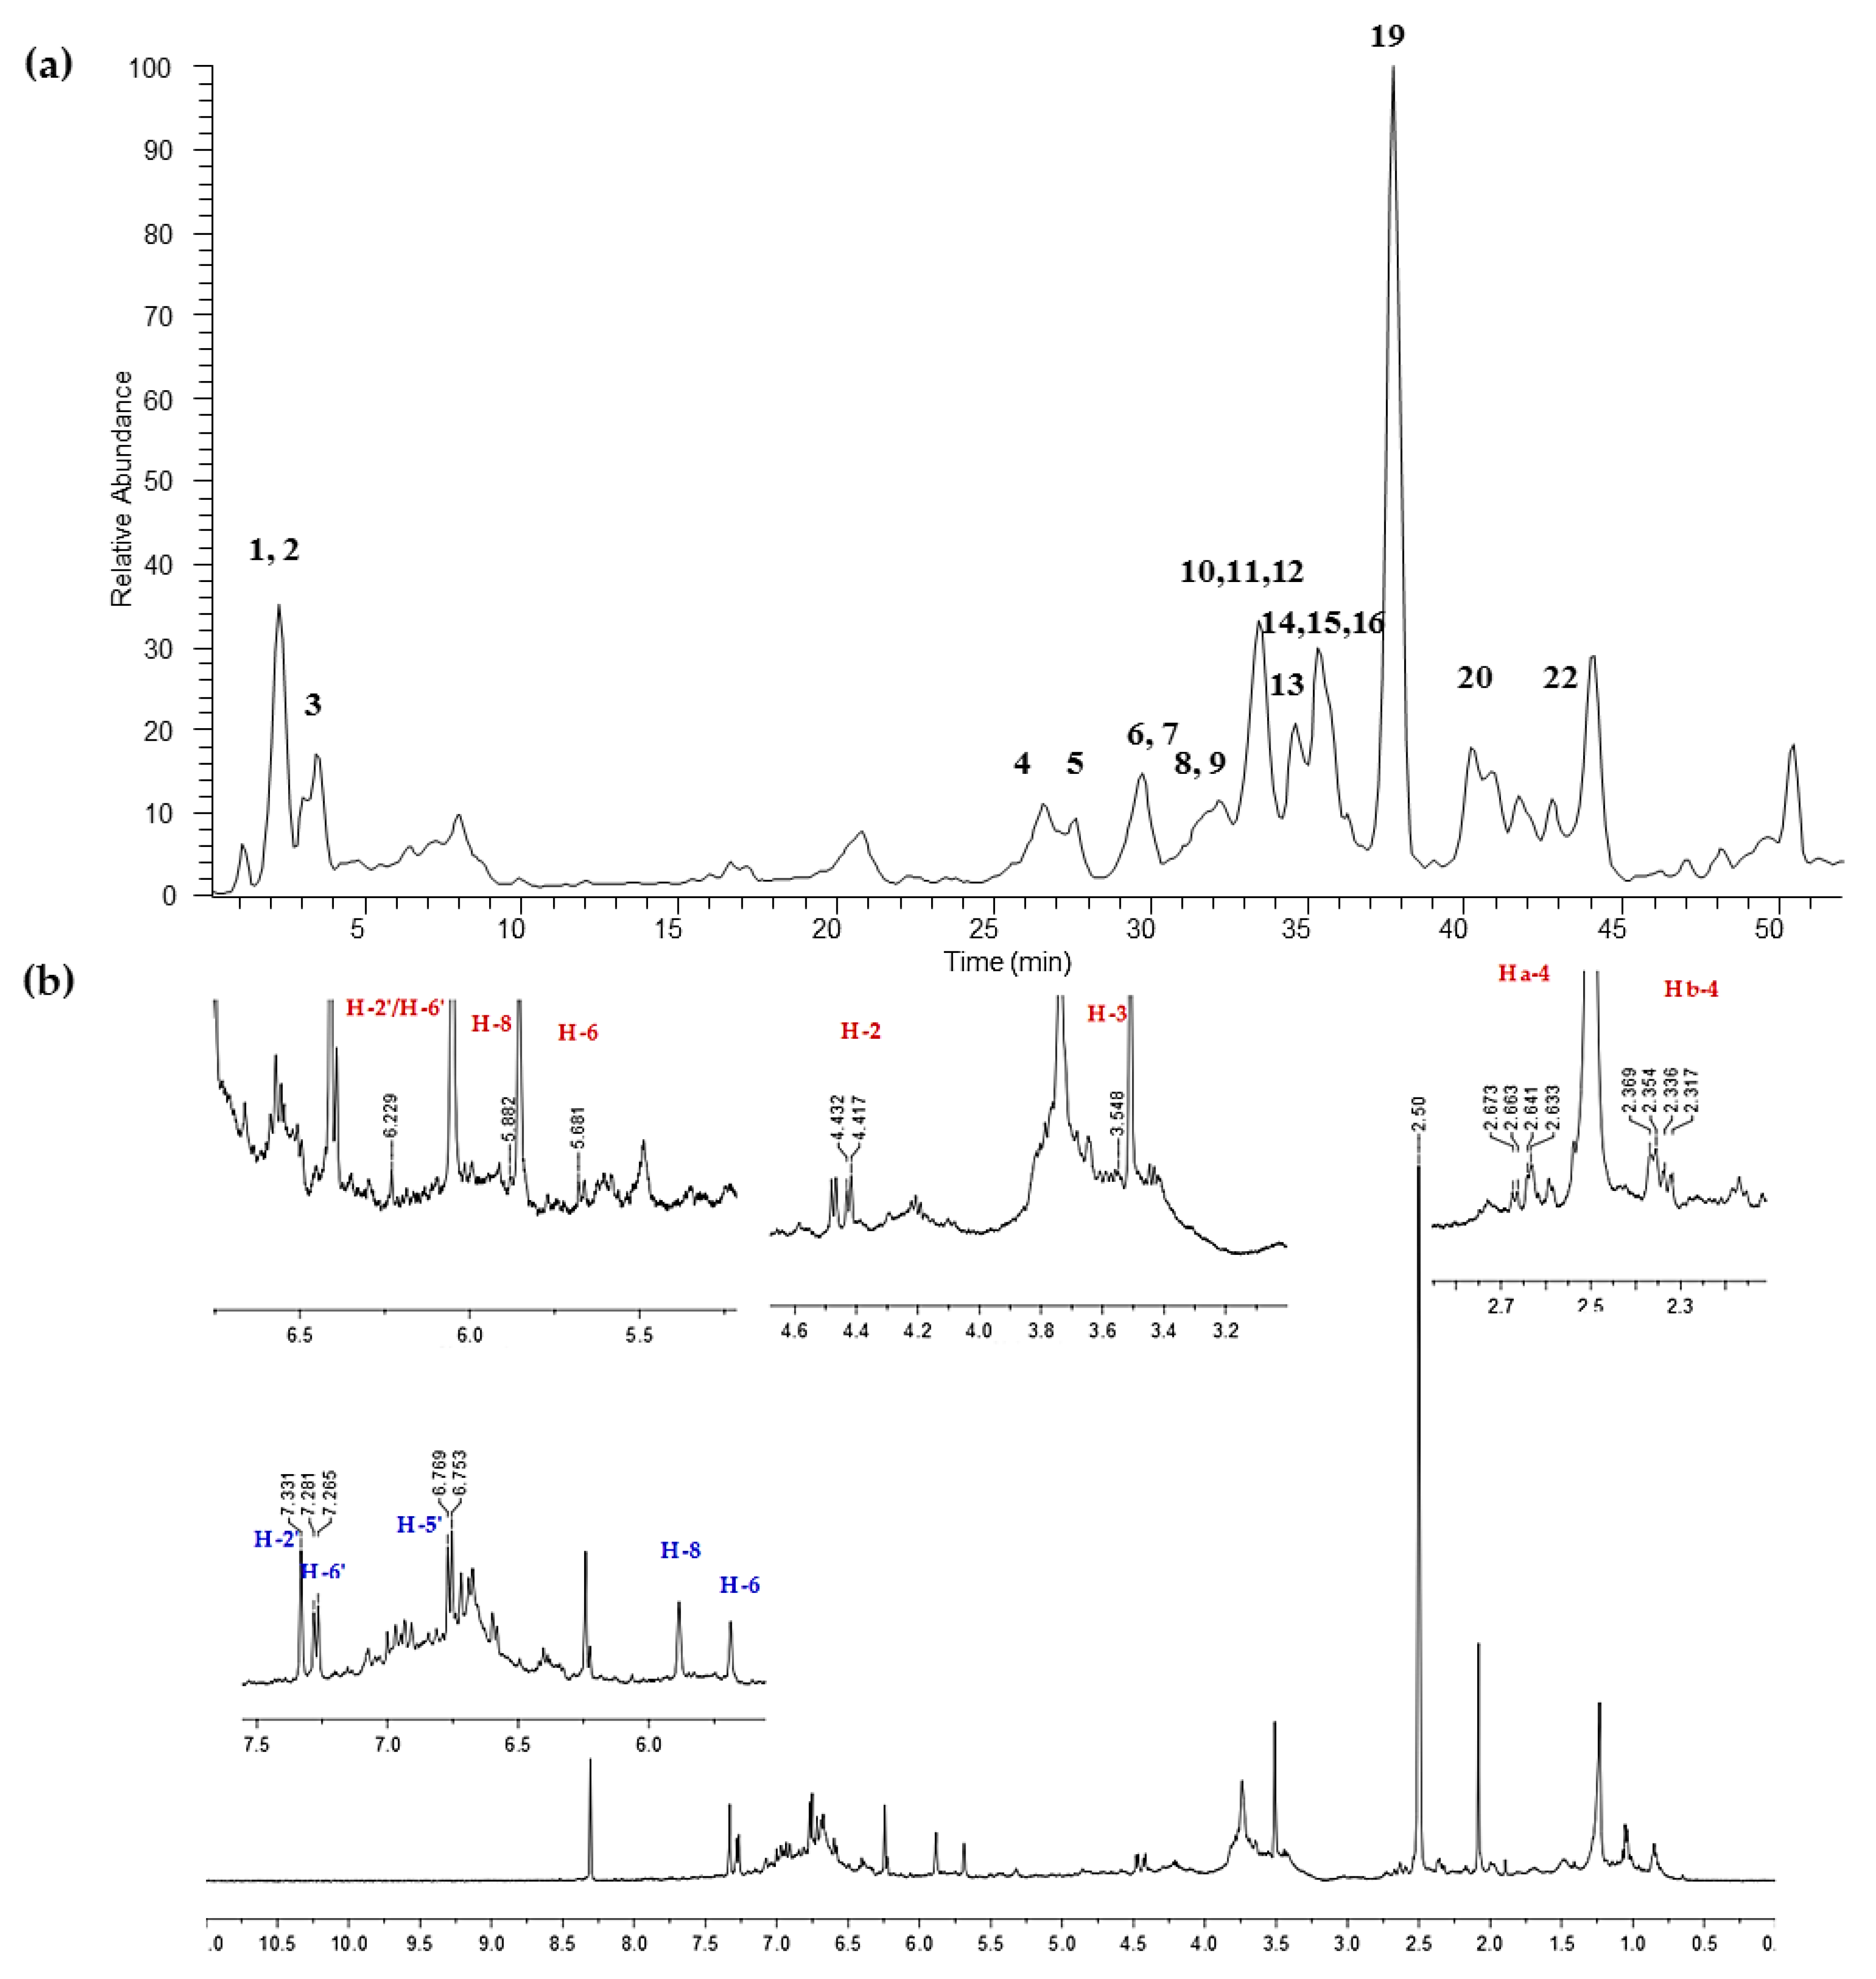
3.5. HPLC/ESI-MS/MS and 1H NMR Analysis of Fr1–Fr6 Fractions

The identification of the main constituents of fractions Fr1–Fr6 was carried out mainly by HPLC/ESI-MS/MS analysis, both in positive and negative ion mode ionization. The parent ions and tandem MS/MS fragmentation spectra were employed for identification, by a comparison with literature data. Some tentative identifications in the more complex fractions Fr5 and Fr6 were corroborated by 1H NMR spectroscopy. Table 3 reports the identified compounds progressively numbered according to their HPLC/ESI-MS retention times; each compound is listed with its [M-H] m/z value, as well as the main fragments observed in its MS/MS spectrum. In some cases, the MS data did not allow one to distinguish between structural isomers, as specified in Table 3. The structures of all the identified polyphenols are shown in Figure 2. The non-phenolic constituents identified in Fr1 and Fr2, fractions with negligible antioxidant activity, are not reported in Table 3 and Figure 2.
The total ion current (TIC) chromatograms recorded in positive ion mode of fractions Fr1 and Fr2 (Figure S1 in Supplementary Materials) show a single chromatographic peak at Tr = 2.22 min including three ions at m/z 365, 527 and 689, suggesting the presence of oligosaccharides. Namely, the component with [M+Na]+ at m/z 365 was identified with a dihexose because the spectrum of its fragment ions shows signals at m/z 185 (M+Na-180) and 203 (M+Na-162) arising from the loss of a hexose unit caused by glycosidic bond cleavage, and at m/z 347 (M-18) originated by the loss of an H2O molecule. The component with [M+Na]+ at m/z 527 was identified as a trihexose as its fragmentation pattern shows the presence of an intense signal m/z 365 fragments and a less intense one at m/z 347 attributable to glycosidic bond cleavages occurring at a terminal unit. The low intensity signal at m/z 689 does not show any fragmentation and was tentatively identified as a tetrahexose. An in-depth evaluation of the oligosaccharide composition was beyond the scope of this work. For this reason, no further investigation into these tentative identifications was performed.
The TIC chromatogram of fraction Fr3 (Figure S2) recorded in negative ion mode shows a single peak eluting at Tr = 2.30 min corresponding to compound 1 with [M-H] at m/z 169, whose tandem mass spectrum displays a fragment at m/z 125 originating from CO2 loss (M-H-44). These data allowed us to identify 1 as gallic acid; the assignment was confirmed by a HPLC-UV coelution with a reference sample. HPLC-UV quantification indicated a content of 8g/100g in Fr3. Gallic acid, previously detected in Pistacia vera hulls (exo- and mesocarps) [23,24,25,26], is reported in the literature as a powerful antioxidant [27] and may be responsible for the antioxidant activity of Fr3. Further constituents of this fraction are presumably non-ionizable compounds and do not contribute to the TIC chromatogram.
The TIC chromatogram of fraction Fr4 (Figure S2) shows a single peak at Tr = 2.30 min, whose ESI-MS/MS analysis revealed the coelution of gallic acid (1) with a component showing a [M-H] at m/z 331, identified as a monogalloylglucose isomer (2) based on MS/MS fragment ions (Figure S3) at m/z 271 (M-H-60) and m/z 241 (M-H-90), both originating from a glucosidic ring fragmentation [28], and at m/z 169 (M-H-162), attributable to the loss of one glucose unit [29]. The amount of gallic acid in Fr4 was 3.1 g/100 g, lower than that of Fr3; the higher antioxidant activity of Fr4 compared to that of Fr3 (Table 1) is therefore due to the contribution of 2, previously reported as a potent antioxidant [27].
Figure 3a displays the TIC chromatogram of fraction Fr5, much more complex than that of the previous fractions, although dominated by an intense peak around 38 min. The peak at Tr = 2.30 min was easily attributed to 1 and 2. A component with [M-H] at m/z 305, eluting at Tr = 3.56 min, was tentatively identified with (+)-gallocatechin (3) or its isomer (−)-epigallocatechin [30]. Its MS/MS spectrum shows the presence of a number of fragment ions: m/z 287 (M-H-18), corresponding to a loss of water; m/z 261 (M-H-44), due to a loss of CO2; m/z 179 (M-H-126) and m/z 125 (M-H-180) due to a Heterocyclic Ring Fission (HRF) mechanism corresponding to the heterocyclic ring C opening and the loss of the B-ring (See Figure S4) [31]. The unambiguous identification of this component as (+)-gallocatechin (3) was achieved by analysis of the 1H NMR spectrum of Fr5 (Figure 3b), aided by 1H-1H correlation spectroscopy (COSY). Although rich in overlapped signals, the spectrum shows the presence of signals in perfect agreement with gallocatechin literature data [32]. Namely: three singlets in the aromatic region, at 6.23 ppm (H-2′, H-6′, ring B), 5.88 ppm (H-8, ring A) and 5.68 ppm (H-6, ring A); the doublet at 4.42 ppm (J = 7.3 Hz; H-2, ring C) which correlates on COSY spectrum with a multiplet at 3.55 ppm (H-3, ring C), which in turn correlates with two double doublets at 2.65 ppm (J = 15.7 and 4.5 Hz; H-4a, ring C) and 2.34 ppm (J = 15.7 and 6.6 Hz H-4b, ring C).
The peak at Tr = 26.70 min shows a signal with [M-H] at m/z 479 whose MS/MS fragment ions are at m/z 317 (M-H-162) and 271 (M-H-162-CO-H2O), attributable respectively to the loss of a hexose and of both CO and H2O, which are typical losses of O-glycosides (Figure S5) [31]. Therefore, this compound was tentatively identified as myricetin hexoside (4), based on Saldana et al.’s report [33], as well as previous findings on Pistacia vera hulls [23,25,26]. A close peak at Tr = 27.50 min includes a component with [M-H] at m/z 493 and with a fragment ion at m/z 317 originating from the neutral loss of a hexuronide acid (M-H-176). Thus, this component was identified as myricetin hexuronide (5) according to previously reported data on pistachio hulls’ chemical composition [23,25,26,34]. The peak at Tr = 30.00 min is due to the coelution of two constituents. One, showing [M-H] at m/z 615, was identified as quercetin galloyl hexoside (6), since its MS/MS spectrum shows the presence of signals at m/z 301, related to quercetin, and 463, originated from the loss of a galloyl unit. Furthermore, this compound was previously identified in P. vera [23,25,26]. A second component with [M-H] at m/z 787 has an MS/MS spectrum consisting of ions at m/z 623 (M-H-152), 617 (M-H-170) and 465 (MH-152-170), which correspond respectively to the loss of one galloyl unit (152 Da), gallic acid (170 Da) and a subsequent loss of both galloyl and gallic acid. This compound was identified as a tetragalloyl glucose isomer (7) [23,25,26,35]. The peak at Tr = 31.90 min gives a [M-H] at m/z 449 and a related fragment ion at m/z 287 arising from the loss of 162 Da, typical of a hexose unit. According to these data, this compound was identified as a cyanidin-hexose pyranoside (8), previously found in P. vera [17,19,20]. Quercetin (9) was identified as the main component of the peak at Tr = 32.14 min, with [M-H] at m/z 301. The spectrum of the fragment ions shows signals at m/z 271, due to the loss of 30 Da (M-H-CH2O), 255 originating from the subsequent loss of H2O and CO (M-H-18-28) and 179 arising from the loss of ring B through a retro-Diels–Alder mechanism (rDA) [36]. The pertinent fragmentation pattern is shown in Figure S6. This identification was corroborated by 1H NMR signals at 5.70 ppm (H-8), 5.80 ppm (H-6), assigned to the aromatic protons of ring A, and at 6.75 ppm (H-5′), 7.27 ppm (H-6′) and at 7.33 ppm (H-2′), due to the aromatic protons of ring B [37].
A further peak was observed at Tr = 33.00 min; the pertinent [M-H]- is at m/z 449 and its MS/MS spectrum shows fragments ions at m/z 431 and 287, attributable respectively to the loss of H2O and the loss of a hexose (M-H-162). This compound was tentatively identified with eriodictyol hexose (10) [24,38] found also by Barreca et al. in Pistacia vera hulls, from Bronte variety, the same analysed in this work. The peak at Tr = 33.20 min is due to the coelution of two constituents giving [M-H] ions at m/z 463 and 441.The first was tentatively identified with quercetin hexoside (11), as the spectrum of fragment ions shows the presence of an intense signal at m/z 301, corresponding to the loss of a hexose, and a signal at m/z 300 caused by the subsequent loss of a proton from quercetin. This compound was previously found in pistachio’s hulls [23,24,25,26]. The second component was identified with a catechin gallate isomer (12), as its MS/MS spectrum shows an intense signal at m/z 289 that originated from the loss of a galloyl unit [39]. The peak at Tr = 34.40 min has a [M-H]- at m/z 477. The corresponding MS/MS spectrum shows a single fragment ion at m/z 301 originated by a loss of 176 corresponding to a glucuronide unit. Thus, this constituent was identified as quercetin glucoronide (13), previously detected in pistachio’s hulls [23,25,26,40]. The peak at Tr = 35.25 min is due to the coelution of three components with [M-H] at m/z 183, 447 and 615. The ion at m/z 183 was identified as methyl gallate (16), as its fragment ions spectrum presents signals at m/z 168 (M-H-CH3) and m/z 124 (M-H-CH3-CO2). The component at m/z 447 was identified with a hexoside of kaempferol (14). Its MS/MS spectrum shows a signal at m/z 285 corresponding to the loss of a hexose. The component at m/z 615 was assigned to an isomer of quercetin galloylglucoside (15) [23] different from 6. The peak at Tr = 37.70 min, the most intense in Fr5 chromatogram, gave a [M-H] peak at m/z 939, assigned to a pentagalloyl glucose isomer (19). Its MS/MS spectrum showed losses of galloyl (M-H-152) and gallic acid (M-H-170) units. This hydrolysable tannin is a well-known antioxidant [27] and may significantly contribute to the high antioxidant activity of this fraction, also due to the presence of flavonoids as minor constituents.
Two late eluting components of Fr5, with Tr = 40.16 and 43.10 min, afforded respectively [M-H] peaks at m/z 1091 and 1243 and were tentatively identified as hexagalloyl and heptagalloyl glucose isomers (20 and 22). Unfortunately, in the adopted experimental conditions, it was impossible to obtain the spectra of their fragment ions, so these identifications were based essentially on the comparison of their molecular weight with literature data [41]. The identification of hydrolysable tannins such as 7, 19 and 20 is in agreement with the results reported by Erşan et al. on Pistacia vera hulls extracts [23,25,26]. The health-promoting effects of galloylated compounds are often attributed to their antioxidant activity, although they exert numerous biological activities. Galloylated compounds are not only alternative sources of gallic acid under gastrointestinal conditions [42], but are also potent metabolic enzyme inhibitors [43,44,45] and prebiotic substances [46]. A number of in vitro and in vivo studies has previously shown that pentagalloylglucose exhibits a wide range of biological activities, such as anti-inflammatory, anti-angiogenic, antitumor, and antibacterial activity, and a broad range of antiviral activities [47] that make Fr5 suitable for a possible exploitation for biological and pharmacological studies.
The TIC chromatogram of fraction Fr6 is reported in Figure 4a. The TIC profile shows a largely predominant constituents around 48 min. We thought some of the identified constituents were the same found in fraction Fr5, namely 1, 3, 4, 6, 7, 10, 11, 16, 19 and 20. 1H NMR analysis supported the identification of 3 and 4 (Figure 4b); this latter was identified through two aromatic signals at 6.34 ppm (H-8, ring A) and 7.39 ppm (H-2′/H-6′, ring B) assigned to the myricetin aglycone [37]. A peak eluting at Tr = 35.66 min which shows a [M-H] at m/z 447 and was identified as a glucoside of kampferol (17) differing from 14 for its retention time. At Tr = 36.70 min elutes a constituent with [M-H] at m/z 433, which was tentatively identified as a quercetin pentoside isomer (18). Indeed, its MS/MS spectrum shows the presence of fragments at m/z 301 (M-H-132), suggesting the loss of a pentose and a fragment at m/z 300, due to the radical anion of quercetin [48]. This assumption was further corroborated by the presence of a fragment at m/z 271 (M-H-CH2O), typical of 3-O-glycosyl flavonols MS/MS spectra [49,50]. The peak eluting at Tr = 42.10 min is due to a component with [M-H] at m/z 583, whose MS/MS spectrum shows the presence of ions at m/z 431 (M-H-152) and 269 (M-H-152-162). This compound was tentatively identified as a galloylglucoside of apigenin (21) [51]. 1H NMR data corroborated the identification of apigenin as aglycone thanks to the presence of signals at 7.92 ppm (H-2′/H-6′, ring B), 6.90 ppm (H-3′/H-5′, ring B), 6.75 ppm (H-3, ring C), 6.42 ppm (H-8, ring A) and 6.18 ppm (H-6, ring A) [52].
At Tr = 46.10 min elutes a component with [M-H] at m/z 575, whose fragmentation produces two ions at m/z 411 (M-H-146-H2O) and m/z 429 (M-H-146), suggesting the presence of a deoxyosyl unit [53]. This component was identified as a luteolin deoxyosyl derivative (23) [54]. The main constituent of Fr6 elutes at Tr = 48.08 min and shows a [M-H] at m/z 285, which could be assigned to kaempferol or luteolin. 1H NMR analysis allowed one to discriminate between the two isomers in favour of kaempferol (24) based on the presence of two signals at 8.04 ppm (H-2′/H-6′) and 6.92 ppm (H-3′/H-5′), two singlets at 6.43 ppm (H-8) and 6.18 ppm (H-6), in agreement with literature data [37]. Of note, flavonol 24 has previously been identified in pistachio hulls extract [24] and its antioxidant activity is well documented [55,56]. Thus, the high antioxidant activity of fraction Fr6 should mainly be ascribed to the large amount of kaempferol; a smaller contribution may be due to the other flavonoids here identified. Moreover, many other biological activities have been reported for 24 and its glycosides, such as cardiovascular [57], neuroprotective [58], anti-inflammatory [56], anti-diabetic and anti-obesity [59]. These properties make Fr6 promising for further biological and pharmacological studies.

4. Conclusions

This work reports, for the first time, the evaluation of pistachio shells, a by-product of low economic value to date, as a promising source of antioxidant polyphenols. We have proposed and optimized an eco-sustainable extraction procedure with ethanol under microwaves irradiation, and an easily reproducible and scalable fractionation method, suitable for industrial applications. Extracts and fractions were evaluated for their antioxidant activity in view of a possible industrial exploitation of these waste materials. The HPLC/ESI-MS/MS and 1H NMR analyses revealed phenolic acids and their derivatives, as well as flavonoids and hydrolysable tannins as the main constituents of fractions with the highest antioxidant activity, namely Fr4–Fr6. Of note, the naturally occurring polyphenols identified in these fractions, and in particular gallic acid, pentagalloylglucose and kaempferol, are also well-known for a wide range of biological activities. In light of these data, pistachio shells are a valuable source of bioactive phenolics that have never been exploited. In particular, the extract obtained with an eco-sustainable process, and mostly fractions Fr4–Fr6 might be employed in several research fields, for the preparation of innovative and functional foods, as ingredients for pharmaceutical formulations, for the development of over-the-counter (OTC) drugs, or in medical devices.

Supplementary Materials

Copies of TIC chromatograms of Fr1–Fr4 are available online at https://0-www-mdpi-com.brum.beds.ac.uk/article/10.3390/resources10050045/s1. Table S1: Pearson correlation analysis, Figure S1: HPLC/ESI-MS profile of (a) Fr1 and (b) Fr2, Figure S2: HPLC/ESI-MS profile of (a) Fr3 and (b) F4, Figure S3: MS/MS fragmentation pattern of [M-H] at m/z 331 identified as monogalloylglucose isomer (2), Figure S4: MS/MS fragmentation pattern of [M-H] at m/z 305 identified as (+)-gallocatechin (3), Figure S5: MS/MS fragmentation pattern of [M-H] at m/z 479 identified as myricetin hexoside (4), Figure S6: MS/MS fragmentation pattern of [M-H] at m/z 301 identified as quercetin (9).

Author Contributions

Conceptualization, V.M.; methodology, N.C., M.L.; validation, V.M., N.C.; investigation, N.C. and M.L.; resources, V.M.; data curation, N.C., V.M.; writing—original draft preparation, V.M.; writing—review and editing, C.T., V.M., N.C.; visualization, N.C.; supervision, V.M.; project administration, V.M., C.T.; funding acquisition, V.M. All authors have read and agreed to the published version of the manuscript.

Funding

This research was funded by MIUR ITALY PRIN 2017 (Project No. 2017A95NCJ).

Acknowledgments

The authors gratefully acknowledge the Organic Mass Spectrometry Laboratory of the Department of Chemical Sciences, University of Catania, for making available the mass spectrometric facilities and the Bio-Nanotech Research and Innovation Tower (BRIT; PON project (PONa3_00136) financed by the Italian Ministry for Education, University and Research MIUR) for making available the Synergy H1 microplate reader.

Conflicts of Interest

The authors declare no conflict of interest. The funders had no role in the design of the study; in the collection, analyses, or interpretation of data; in the writing of the manuscript, or in the decision to publish the results.

References

  1. Herrera, R.; Hemming, J.; Smeds, A.; Gordobil, O.; Willför, S.; Labidi, J. Recovery of Bioactive Compounds from Hazelnuts and Walnuts Shells: Quantitative–Qualitative Analysis and Chromatographic Purification. Biomolecules 2020, 10, 1363. [Google Scholar] [CrossRef] [PubMed]
  2. Yang, X.; Wang, H.; Strong, P.J.; Xu, S.; Liu, S.; Lu, K.; Sheng, K.; Guo, J.; Che, L.; He, L.; et al. Thermal Properties of Biochars Derived from Waste Biomass Generated by Agricultural and Forestry Sectors. Energies 2017, 10, 469. [Google Scholar] [CrossRef] [Green Version]
  3. Qiu, J.; Chen, L.; Zhu, Q.; Wang, D.; Wang, W.; Sun, X.; Liu, X.; Du, F. Screening natural antioxidants in peanut shell using DPPH–HPLC–DAD–TOF/MS methods. Food Chem. 2012, 135, 2366–2371. [Google Scholar] [CrossRef]
  4. Quideau, S.; Deffieux, D.; Douat-Casassus, C.; Pouységu, L. Plant Polyphenols: Chemical Properties, Biological Activities, and Synthesis. Angew. Chem. Int. Ed. 2011, 50, 586–621. [Google Scholar] [CrossRef]
  5. Campos, M.R.S. Bioactive Compounds. Health Benefits and Potential Applications; Woodhead Publishing Elsevier: Duxford, UK, 2019. [Google Scholar]
  6. Fraga-Corral, M.; Otero, P.; Echave, J.; Garcia-Oliveira, P.; Carpena, M.; Jarboui, A.; Nuñez-Estevez, B.; Simal-Gandara, J.; Prieto, M.A. By-Products of Agri-Food Industry as Tannin-Rich Sources: A Review of Tannins’ Biological Activities and Their Potential for Valorization. Foods 2021, 10, 137. [Google Scholar] [CrossRef] [PubMed]
  7. Gil-Chávez, G.J.; Villa, J.A.; Ayala-Zavala, J.F.; Heredia, J.B.; Sepulveda, D.; Yahia, E.M.; González-Aguilar, G.A. Technologies for Extraction and Production of Bioactive Compounds to be Used as Nutraceuticals and Food Ingredients: An Overview. Compr. Rev. Food Sci. Food Saf. 2013, 12, 5–23. [Google Scholar] [CrossRef]
  8. Kahlaoui, M.; Vecchia, S.B.D.; Giovine, F.; Kbaier, H.B.H.; Bouzouita, N.; Pereira, L.B.; Zeppa, G. Characterization of Polyphenolic Compounds Extracted from Different Varieties of Almond Hulls (Prunus dulcis L.). Antioxidants 2019, 8, 647. [Google Scholar] [CrossRef] [PubMed] [Green Version]
  9. Lameirão, F.; Pinto, D.; Vieira, E.F.; Peixoto, A.F.; Freire, C.; Sut, S.; Dall’Acqua, S.; Costa, P.; Delerue-Matos, C.; Rodrigues, F. Green-Sustainable Recovery of Phenolic and Antioxidant Compounds from Industrial Chestnut Shells Using Ultrasound-Assisted Extraction: Optimization and Evaluation of Biological Activities In Vitro. Antioxidants 2020, 9, 267. [Google Scholar] [CrossRef] [PubMed] [Green Version]
  10. Kureck, I.; Policarpi, P.D.B.; Toaldo, I.M.; Maciel, M.V.D.O.B.; Bordignon-Luiz, M.T.; Barreto, P.L.M.; Block, J.M. Chemical Characterization and Release of Polyphenols from Pecan Nut Shell [Carya illinoinensis (Wangenh) C. Koch] in Zein Microparticles for Bioactive Applications. Plant Foods Hum. Nutr. 2018, 73, 137–145. [Google Scholar] [CrossRef]
  11. Bozorgi, M.; Memariani, Z.; Mobli, M.; Surmaghi, M.H.S.; Shams-Ardekani, M.R.; Rahimi, R. Five Pistacia species (P. vera, P. atlantica, P. terebinthus, P. khinjuk, and P. lentiscus): A Review of Their Traditional Uses, Phytochemistry, and Pharmacology. Sci. World J. 2013, 2013, 1–33. [Google Scholar] [CrossRef] [PubMed] [Green Version]
  12. Ozden-Tokatli, Y.; Akdemir, H.; Tilkat, E.; Onay, A. Current status and conservation of Pistacia germplasm. Biotechnol. Adv. 2010, 28, 130–141. [Google Scholar] [CrossRef]
  13. Maalej, A.; Elloumi, W.; Angelov, I.; Kardaleva, P.; Dimitrov, V.; Chamkha, M.; Guncheva, M.; Sayadi, S. Pistacia lentiscus by-product as a promising source of phenolic compounds and carotenoids: Purification, biological potential and binding properties. Food Bioprod. Process. 2021, 126, 245–255. [Google Scholar] [CrossRef]
  14. Garofulić, I.E.; Kruk, V.; Martić, A.; Martić, I.; Zorić, Z.; Pedisić, S.; Dragović, S.; Dragović-Uzelac, V. Evaluation of Polyphenolic Profile and Antioxidant Activity of Pistacia lentiscus L. Leaves and Fruit Extract Obtained by Optimized Microwave-Assisted Extraction. Foods 2020, 9, 1556. [Google Scholar] [CrossRef]
  15. Wilson, J.S.; Petino, G.; Knudsen, D.C. Geographic context of the Green Pistachio of Bronte, a protected designation of origin product. J. Maps 2018, 14, 144–150. [Google Scholar] [CrossRef]
  16. Arjeh, E.; Akhavan, H.-R.; Barzegar, M.; Carbonell-Barrachina, Á.A. Bio-active compounds and functional properties of pistachio hull: A review. Trends Food Sci. Technol. 2020, 97, 55–64. [Google Scholar] [CrossRef]
  17. Noorolahi, Z.; Sahari, M.A.; Barzegar, M.; Gavlighi, H.A. Tannin fraction of pistachio green hull extract with pancreatic lipase inhibitory and antioxidant activity. J. Food Biochem. 2020, 44, e13208. [Google Scholar] [CrossRef]
  18. Cardullo, N.; Muccilli, V.; Cunsolo, V.; Tringali, C. Mass Spectrometry and 1H-NMR Study of Schinopsis lorentzii (Quebracho) Tannins as a Source of Hypoglycemic and Antioxidant Principles. Molecules 2020, 25, 3257. [Google Scholar] [CrossRef]
  19. Herald, T.J.; Gadgil, P.; Tilley, M. High-throughput micro plate assays for screening flavonoid content and DPPH-scavenging activity in sorghum bran and flour. J. Sci. Food Agric. 2012, 92, 2326–2331. [Google Scholar] [CrossRef] [PubMed]
  20. Ngoh, Y.-Y.; Gan, C.-Y. Enzyme-assisted extraction and identification of antioxidative and α-amylase inhibitory peptides from Pinto beans (Phaseolus vulgaris cv. Pinto). Food Chem. 2016, 190, 331–337. [Google Scholar] [CrossRef] [PubMed]
  21. Stévigny, C.; Rolle, L.; Valentini, N.; Zeppa, G. Optimization of extraction of phenolic content from hazelnut shell using response surface methodology. J. Sci. Food Agric. 2007, 87, 2817–2822. [Google Scholar] [CrossRef]
  22. Ou, B.; Hampsch-Woodill, M.; Prior, R.L. Development and Validation of an Improved Oxygen Radical Absorbance Capacity Assay Using Fluorescein as the Fluorescent Probe. J. Agric. Food Chem. 2001, 49, 4619–4626. [Google Scholar] [CrossRef]
  23. Erşan, S.; Üstündağ, Ö.G.; Carle, R.; Schweiggert, R.M. Subcritical water extraction of phenolic and antioxidant constituents from pistachio (Pistacia vera L.) hulls. Food Chem. 2018, 253, 46–54. [Google Scholar] [CrossRef]
  24. Barreca, D.; Laganà, G.; Leuzzi, U.; Smeriglio, A.; Trombetta, D.; Bellocco, E. Evaluation of the nutraceutical, antioxidant and cytoprotective properties of ripe pistachio (Pistacia vera L., variety Bronte) hulls. Food Chem. 2016, 196, 493–502. [Google Scholar] [CrossRef]
  25. Erşan, S.; Üstündağ, Ö.G.; Carle, R.; Schweiggert, R.M. Identification of Phenolic Compounds in Red and Green Pistachio (Pistacia veraL.) Hulls (Exo- and Mesocarp) by HPLC-DAD-ESI-(HR)-MSn. J. Agric. Food Chem. 2016, 64, 5334–5344. [Google Scholar] [CrossRef]
  26. Erşan, S.; Üstündağ, Ö.G.; Carle, R.; Schweiggert, R.M. Determination of pistachio (Pistacia vera L.) hull (exo- and mesocarp) phenolics by HPLC-DAD-ESI/MSn and UHPLC-DAD-ELSD after ultrasound-assisted extraction. J. Food Compos. Anal. 2017, 62, 103–114. [Google Scholar] [CrossRef]
  27. Liu, T.; Li, Z.; Li, R.; Cui, Y.; Zhao, Y.; Yu, Z. Composition analysis and antioxidant activities of the Rhus typhina L. stem. J. Pharm. Anal. 2019, 9, 332–338. [Google Scholar] [CrossRef] [PubMed]
  28. Meyers, K.J.; Swiecki, T.J.; Mitchell, A.E. Understanding the Native Californian Diet: Identification of Condensed and Hydrolyzable Tannins in Tanoak Acorns (Lithocarpus densiflorus). J. Agric. Food Chem. 2006, 54, 7686–7691. [Google Scholar] [CrossRef] [PubMed]
  29. Muccilli, V.; Cardullo, N.; Spatafora, C.; Cunsolo, V.; Tringali, C. α-Glucosidase inhibition and antioxidant activity of an oenological commercial tannin. Extraction, fractionation and analysis by HPLC/ESI-MS/MS and 1H NMR. Food Chem. 2017, 215, 50–60. [Google Scholar] [CrossRef] [PubMed]
  30. Miketova, P.; Schram, K.H.; Whitney, J.; Li, M.; Huang, R.; Kerns, E.; Valcic, S.; Timmermann, B.N.; Rourick, R.; Klohr, S. Tandem mass spectrometry studies of green tea catechins. Identification of three minor components in the polyphenolic extract of green tea. J. Mass Spectrom. 2000, 35, 860–869. [Google Scholar] [CrossRef]
  31. Enomoto, H.; Nirasawa, T. Localization of Flavan-3-ol Species in Peanut Testa by Mass Spectrometry Imaging. Molecules 2020, 25, 2373. [Google Scholar] [CrossRef]
  32. Nonaka, G.; Kawahara, O.; Nishioka, I. Tannins and related compounds. XV. A new class of dimeric flavan-3-ol gallates, theasinensins A and B, and proanthocyanidin gallates from green tea leaf. (1). Chem. Pharm. Bull. 1983, 31, 3906–3914. [Google Scholar] [CrossRef] [Green Version]
  33. Saldanha, L.L.; Vilegas, W.; Dokkedal, A.L. Characterization of Flavonoids and Phenolic Acids in Myrcia bella Cambess. Using FIA-ESI-IT-MSn and HPLC-PAD-ESI-IT-MS Combined with NMR. Molecules 2013, 18, 8402–8416. [Google Scholar] [CrossRef] [Green Version]
  34. Barbosa, W.L.R.; Peres, A.; Gallori, S.; Vincieri, F.F. Determination of myricetin derivatives in Chrysobalanus icaco L. (Chrysobalanaceae). Rev. Bras. de Farm. 2006, 16, 333–337. [Google Scholar] [CrossRef]
  35. Cardullo, N.; Muccilli, V.; Saletti, R.; Giovando, S.; Tringali, C. A mass spectrometry and 1H NMR study of hypoglycemic and antioxidant principles from a Castanea sativa tannin employed in oenology. Food Chem. 2018, 268, 585–593. [Google Scholar] [CrossRef]
  36. Li, Z.-H.; Guo, H.; Xu, W.-B.; Ge, J.; Li, X.; Alimu, M.; He, D.-J. Rapid Identification of Flavonoid Constituents Directly from PTP1B Inhibitive Extract of Raspberry (Rubus idaeusL.) Leaves by HPLC–ESI–QTOF–MS-MS. J. Chromatogr. Sci. 2016, 54, 805–810. [Google Scholar] [CrossRef] [Green Version]
  37. Ren, G.; Hou, J.; Fang, Q.; Sun, H.; Liu, X.; Zhang, L.; Wang, P.G. Synthesis of flavonol 3-O-glycoside by UGT78D1. Glycoconj. J. 2012, 29, 425–432. [Google Scholar] [CrossRef] [PubMed]
  38. Da Silva, N.A.; Rodrigues, E.; Mercadante, A.Z.; De Rosso, V.V. Phenolic Compounds and Carotenoids from Four Fruits Native from the Brazilian Atlantic Forest. J. Agric. Food Chem. 2014, 62, 5072–5084. [Google Scholar] [CrossRef] [PubMed]
  39. Yuzuak, S.; Ballington, J.; Xie, D.-Y. HPLC-qTOF-MS/MS-Based Profiling of Flavan-3-ols and Dimeric Proanthocyanidins in Berries of Two Muscadine Grape Hybrids FLH 13-11 and FLH 17-66. Metabolites 2018, 8, 57. [Google Scholar] [CrossRef] [Green Version]
  40. Ye, L.-H.; He, X.-X.; Yan, M.-Z.; Chang, Q. Identification of in vivo components in rats after oral administration of lotus leaf flavonoids using ultra fast liquid chromatography with tandem mass spectrometry. Anal. Methods 2014, 6, 6088–6094. [Google Scholar] [CrossRef]
  41. Romeo, F.V.; Ballistreri, G.; Fabroni, S.; Pangallo, S.; Nicosia, M.G.L.D.; Schena, L.; Rapisarda, P. Chemical Characterization of Different Sumac and Pomegranate Extracts Effective against Botrytis cinerea Rots. Molecules 2015, 20, 11941–11958. [Google Scholar] [CrossRef] [Green Version]
  42. Velderrain-Rodríguez, G.R.; Torres-Moreno, H.; Villegas-Ochoa, M.A.; Ayala-Zavala, J.F.; Robles-Zepeda, R.E.; Wall-Medrano, A.; González-Aguilar, G.A. Gallic Acid Content and an Antioxidant Mechanism Are Responsible for the Antiproliferative Activity of ‘Ataulfo’ Mango Peel on LS180 Cells. Molecules 2018, 23, 695. [Google Scholar] [CrossRef] [Green Version]
  43. Moreno-Córdova, E.N.; Arvizu-Flores, A.A.; Valenzuela-Soto, E.M.; García-Orozco, K.D.; Wall-Medrano, A.; Alvarez-Parrilla, E.; Ayala-Zavala, J.F.; Domínguez-Avila, J.A.; González-Aguilar, G.A. Gallotannins are uncompetitive inhibitors of pancreatic lipase activity. Biophys. Chem. 2020, 264, 106409. [Google Scholar] [CrossRef]
  44. Kato-Schwartz, C.G.; Bracht, F.; Gonçalves, G.D.A.; Soares, A.A.; Vieira, T.F.; Brugnari, T.; Bracht, A.; Peralta, R.M. Inhibition of α-amylases by pentagalloyl glucose: Kinetics, molecular dynamics and consequences for starch absorption. J. Funct. Foods 2018, 44, 265–273. [Google Scholar] [CrossRef]
  45. Cardullo, N.; Muccilli, V.; Pulvirenti, L.; Cornu, A.; Pouységu, L.; Deffieux, D.; Quideau, S.; Tringali, C. C-glucosidic ellagitannins and galloylated glucoses as potential functional food ingredients with anti-diabetic properties: A study of α-glucosidase and α-amylase inhibition. Food Chem. 2020, 313, 126099. [Google Scholar] [CrossRef] [PubMed]
  46. Gutiérrez-Sarmiento, W.; Sáyago-Ayerdi, S.G.; Goñi, I.; Gutiérrez-Miceli, F.A.; Abud-Archila, M.; Rejón-Orantes, J.D.C.; Rincón-Rosales, R.; Peña-Ocaña, B.A.; Ruíz-Valdiviezo, V.M. Changes in Intestinal Microbiota and Predicted Metabolic Pathways During Colonic Fermentation of Mango (Mangifera indica L.)—Based Bar Indigestible Fraction. Nutrients 2020, 12, 683. [Google Scholar] [CrossRef] [PubMed] [Green Version]
  47. Zhang, J.; Li, L.; Kim, S.-H.; Hagerman, A.E.; Lü, J. Anti-Cancer, Anti-Diabetic and Other Pharmacologic and Biological Activities of Penta-Galloyl-Glucose. Pharm. Res. 2009, 26, 2066–2080. [Google Scholar] [CrossRef] [Green Version]
  48. Mosić, M.; Trifković, J.; Vovk, I.; Gašić, U.; Tešić, Ž.; Šikoparija, B.; Milojković-Opsenica, D. Phenolic Composition Influences the Health-Promoting Potential of Bee-Pollen. Biomolecules 2019, 9, 783. [Google Scholar] [CrossRef] [PubMed] [Green Version]
  49. Martini, S.; Conte, A.; Tagliazucchi, D. Comprehensive evaluation of phenolic profile in dark chocolate and dark chocolate enriched with Sakura green tea leaves or turmeric powder. Food Res. Int. 2018, 112, 1–16. [Google Scholar] [CrossRef]
  50. Ablajan, K.; Abliz, Z.; Shang, X.-Y.; He, J.-M.; Zhang, R.-P.; Shi, J.-G. Structural characterization of flavonol 3,7-di-O-glycosides and determination of the glycosylation position by using negative ion electrospray ionization tandem mass spectrometry. J. Mass Spectrom. 2006, 41, 352–360. [Google Scholar] [CrossRef]
  51. Li, J.; Kuang, G.; Chen, X.; Zeng, R. Identification of Chemical Composition of Leaves and Flowers from Paeonia rockii by UHPLC-Q-Exactive Orbitrap HRMS. Molecules 2016, 21, 947. [Google Scholar] [CrossRef] [Green Version]
  52. Telange, D.R.; Patil, A.T.; Pethe, A.M.; Fegade, H.; Anand, S.; Dave, V.S. Formulation and characterization of an apigenin-phospholipid phytosome (APLC) for improved solubility, in vivo bioavailability, and antioxidant potential. Eur. J. Pharm. Sci. 2017, 108, 36–49. [Google Scholar] [CrossRef] [Green Version]
  53. Ferreres, F.; Gil-Izquierdo, A.; Andrade, P.; Valentão, P.; Tomás-Barberán, F. Characterization of C-glycosyl flavones O-glycosylated by liquid chromatography–tandem mass spectrometry. J. Chromatogr. A 2007, 1161, 214–223. [Google Scholar] [CrossRef] [PubMed]
  54. Roriz, C.L.; Barros, L.; Carvalho, A.M.; Santos-Buelga, C.; Ferreira, I.C. Pterospartum tridentatum, Gomphrena globosa and Cymbopogon citratus: A phytochemical study focused on antioxidant compounds. Food Res. Int. 2014, 62, 684–693. [Google Scholar] [CrossRef] [Green Version]
  55. Park, J.S.; Rho, H.S.; Kim, D.H.; Chang, I.S. Enzymatic Preparation of Kaempferol from Green Tea Seed and Its Antioxidant Activity. J. Agric. Food Chem. 2006, 54, 2951–2956. [Google Scholar] [CrossRef]
  56. Wang, J.; Fang, X.; Ge, L.; Cao, F.; Zhao, L.; Wang, Z.; Xiao, W. Antitumor, antioxidant and anti-inflammatory activities of kaempferol and its corresponding glycosides and the enzymatic preparation of kaempferol. PLoS ONE 2018, 13, e0197563. [Google Scholar] [CrossRef] [PubMed]
  57. Suchal, K.; Malik, S.; Khan, S.I.; Malhotra, R.K.; Goyal, S.N.; Bhatia, J.; Ojha, S.; Arya, D.S. Molecular Pathways Involved in the Amelioration of Myocardial Injury in Diabetic Rats by Kaempferol. Int. J. Mol. Sci. 2017, 18, 1001. [Google Scholar] [CrossRef] [PubMed] [Green Version]
  58. Wu, Y.; Sun, J.; George, J.; Ye, H.; Cui, Z.; Li, Z.; Liu, Q.; Zhang, Y.; Ge, D.; Liu, Y. Study of neuroprotective function of Ginkgo bilobaextract (EGb761) derived-flavonoid monomers using a three-dimensional stem cell-derived neural model. Biotechnol. Prog. 2016, 32, 735–744. [Google Scholar] [CrossRef] [PubMed]
  59. Zang, Y.; Zhang, L.; Igarashi, K.; Yu, C. The anti-obesity and anti-diabetic effects of kaempferol glycosides from unripe soybean leaves in high-fat-diet mice. Food Funct. 2015, 6, 834–841. [Google Scholar] [CrossRef] [PubMed]
Figure 1. Biplot representation on the factor-plane (PC1 vs. PC2), showing vector distribution of TPC, TFC, DPPH, TEAC and within score plot of the extracts and fraction reported in Table 1.
Resources 10 00045 g001
Figure 2. Chemical structures of polyphenols identified in pistachio shells.
Resources 10 00045 g002
Figure 3. (a) HPLC/ESI-MS profile of Fr5. (b) 1H NMR spectrum (500 MHz, DMSO-d6) of Fr5; the proton assignments of 3 are highlighted with red, those of 9 with blue.
Resources 10 00045 g003
Figure 4. (a) HPLC/ESI-MS profile of Fr6. (b) 1H NMR spectrum (500 MHz, DMSO-d6) of Fr6; the proton assignments of 3 are highlighted in red, those of 4 in orange, those of 21 in purple, those of 24 in green.
Resources 10 00045 g004
Table 1. Percentage weight, Total Phenol Content (TPC), Total Flavonoid Content (TFC), DPPH· scavenging activity, Trolox Equivalent Antioxidant Capacity (TEAC) and Oxygen Radical Absorbance Capacity (ORAC) of extracts and fractions from pistachio shells.
Code%w/w 1TPC 2
(mg GAE/g)
TFC 3
(mg/CatEg)
DPPH 4
EC50 (µg/mL)
TEAC 5
(µmol TE/g)
ORAC 5
(µmol TE/g)
Evaluation of Different Extraction Procedures
EtOH 10.94 ± 0.08 a 189 ± 10 a157 ± 10 a15.1 ± 1.2 a1348 ± 9.8 a399 ± 11 a
MeOH0.81 ± 0.03 a 381 ± 17 b359 ± 12 b7.8 ± 1.0 b,f3188 ± 18 b798 ± 23 b
H2O pH 42.21 ± 0.09 b 146 ± 12 c162 ± 11 a239 ± 3.7 c166 ± 3.7 c203 ± 15 c
EtOH/H2O1.78 ± 0.10 c 272 ± 5 d191 ± 17 c11.0 ± 2.7 b697 ± 4.1 d240 ± 8 d
EtOAc0.37 ± 0.02 d 100 ± 5 e234 ± 5.4 d22.5 ± 5.9 a106 ± 5.4 e161 ± 13 e
EtOH 2 60.54 ± 0.01 7,e293 ± 10 f283 ± 18 e8.9 ± 1.2 b2721 ± 9.9 f779 ± 8 b
Optimization of Ethanol Extraction
Hex1.43 ± 0.10 f -
EtOH 72h 82.43 ± 0.09 9,b309 ± 9 f,g383 ± 15 b,f7.3 ± 0.3 b3677 ± 9.7 g916 ± 27 f
EtOH UAE 81.48 ± 0.11 9,f311 ± 7 g351 ± 17 b7.6 ± 1.3 b3682 ± 6.7 g849 ± 22 b
EtOH MAE83.00 ± 0.12 9,g332 ± 11 h376 ± 22 b,f6.1 ± 0.9 b4001 ± 7.5 h879 ± 17 f
Fractions from XAD-16 Chromatographic Separation
Fr140.26101 ± 1.3 e182 ± 9 c,d192 ± 7.1 d104 ± 29 e202 ± 20 c,e
Fr29.11110 ± 2.3 f170 ± 11a,b,c52.7 ± 3.3 e172 ± 32 c,e256 ± 18 d
Fr34.48 197 ± 5.6 a153 ± 4.6 a,c10.0 ± 0.2 f1823 ± 93 i647 ± 15.4 g
Fr412.57458 ± 9.1 i179 ± 13 a,b,c4.1 ± 0.5 g4155 ± 9.6 l1344 ± 21 h
Fr522.24310 ± 6.2 f,g445 ± 15 g5.5 ± 1.5 b,g3921 ± 5.2 h1243 ± 33 i
Fr611.33274 ± 5.3 d395 ± 11 f6.9 ± 0.3 b,g3475 ± 61 m965 ± 18 g
Que- 3.6 ± 0.1 g1.8 ± 0.6 107.9 ± 0.2 10
1 Data are expressed as g/100 g of dried pistachio shells or g/100 gr of total eluate. 2 Results are reported as equivalent of gallic acid (GAE) in mg/g of extract as mean ± SD (n = 3). 3 Results are reported as equivalent of catechin (CatE) in mg/g of extract as mean ± SD (n = 3). 4 Results are reported in μg/mL of a standard DPPH solution as mean ± SD (n = 3). 5 Results are reported as Trolox equivalent (TE) in µmol TE/g of extract or fraction as mean ± SD (n = 3). 6 Obtained from the residue of EtOAc extraction. 7 Yield calculated as g/100 g of solid residue from EtOAc extraction. 8 Extraction performed on the dried residue from Hex extraction. 9 Yield calculated as g/100 g of solid residue from Hex extraction. 10 Expressed as µmol TE. a–i,l,m Different letters by column represent significant differences by Tukey’s test (p < 0.05).
Table 2. Extracted eigenvectors of the included variables in PCA of Figure 2 on PC1 and PC2.
Coefficients of PC1Coefficients of PC2
1/DPPH0.46674−0.30523
TEAC0.48020.06349
ORAC0.47144−0.10192
TPC0.45003−0.34135
TFC0.356070.88085
Table 3. Identification by HPLC/ESI-MS/MS of the main constituents of Fr3–Fr6 fractions from pistachio shells.
TR (min)IdentificationMW[M-H]MS/MS Fragments, m/z (Relative Intensity)Fraction
2.30Gallic acid (1)170169125 (100)Fr3; Fr4; Fr5; Fr6
2.30Monogalloylglucose isomer (2)332331271 (100); 169 (90); 241 (40); 211 (40); 125 (10)Fr4; Fr5
3.56(−)-Gallocatechin (3)306305179 (100); 261 (45); 125 (10); 287 (10); Fr5; Fr6
26.70Myricetin hexoside (4)480479316 (100); 179 (10); 271 (5);Fr5; Fr6
27.50Myricetin hexuronide (5)494493317 (100);Fr5
30.00Quercetin galloyl hexoside isomer (6)616615463 (100)Fr5; Fr6
30.00Tetragalloyl glucose isomer (7)788787617 (100); 623 (20); 465 (10);Fr5; Fr6
31.90Cyanidin-hexose pyranoside (8)450449287 (100);Fr5
32.14Quercetin (9)302301271 (100); 255 (40); 179 (30)Fr5
33.00Eriodictyol hexoside (10)450449287 (100);431 (20)Fr5; Fr6
33.20Quercetin hexoside (11)464463301 (100); 300 (75); 271 (5); 179 (5)Fr5; Fr6
33.20Catechin gallate (12)442441289 (100);Fr5
34.40Quercetin monoglucoronide (13)478477301 (100)Fr5
35.25Kaempferol hexoside (14)448447285Fr5
35.25Quercetin galloyl hexoside isomer (15)616615301 (100); 463 (25)Fr5
35.25Methyl gallate (16)184183168 (78); 124 (20)Fr5, Fr6
35.66Kaempferol hexoside (17)448447285Fr6
36.70Quercetin pentoside (18)434433300 (100); 301 (30); 271 (20); 179 (5)Fr6
37.70Pentagalloylglucose isomer (19)940939769 (100); 787 (15); 617 (10); 447 (5)Fr5; Fr6
40.16Hexagalloyl glucose isomer (20)10921091-Fr5; Fr6
42.10Apigenin galloyl glucoside (21)584583431 (100), 269 (60) Fr6
43.10Eptagalloyl glucose (22)12441243-Fr5
46.10Luteolin 2′′-O-deoxyosyl-6-C-(6-deoxy-pento-hexosulosyl) (23)576575531 (35); 411 (25), 429 (50)Fr6
48.08Kaempferol (24)286285241 (100); 175 (40); 199 (30); 242 (25); 161 (10)Fr6
Publisher’s Note: MDPI stays neutral with regard to jurisdictional claims in published maps and institutional affiliations.

