
Formulation of Development Strategies for Regional Agricultural Resource Potential: The Ukrainian Case


Abstract
:1. Introduction
2. Literature Review
3. Materials and Methods
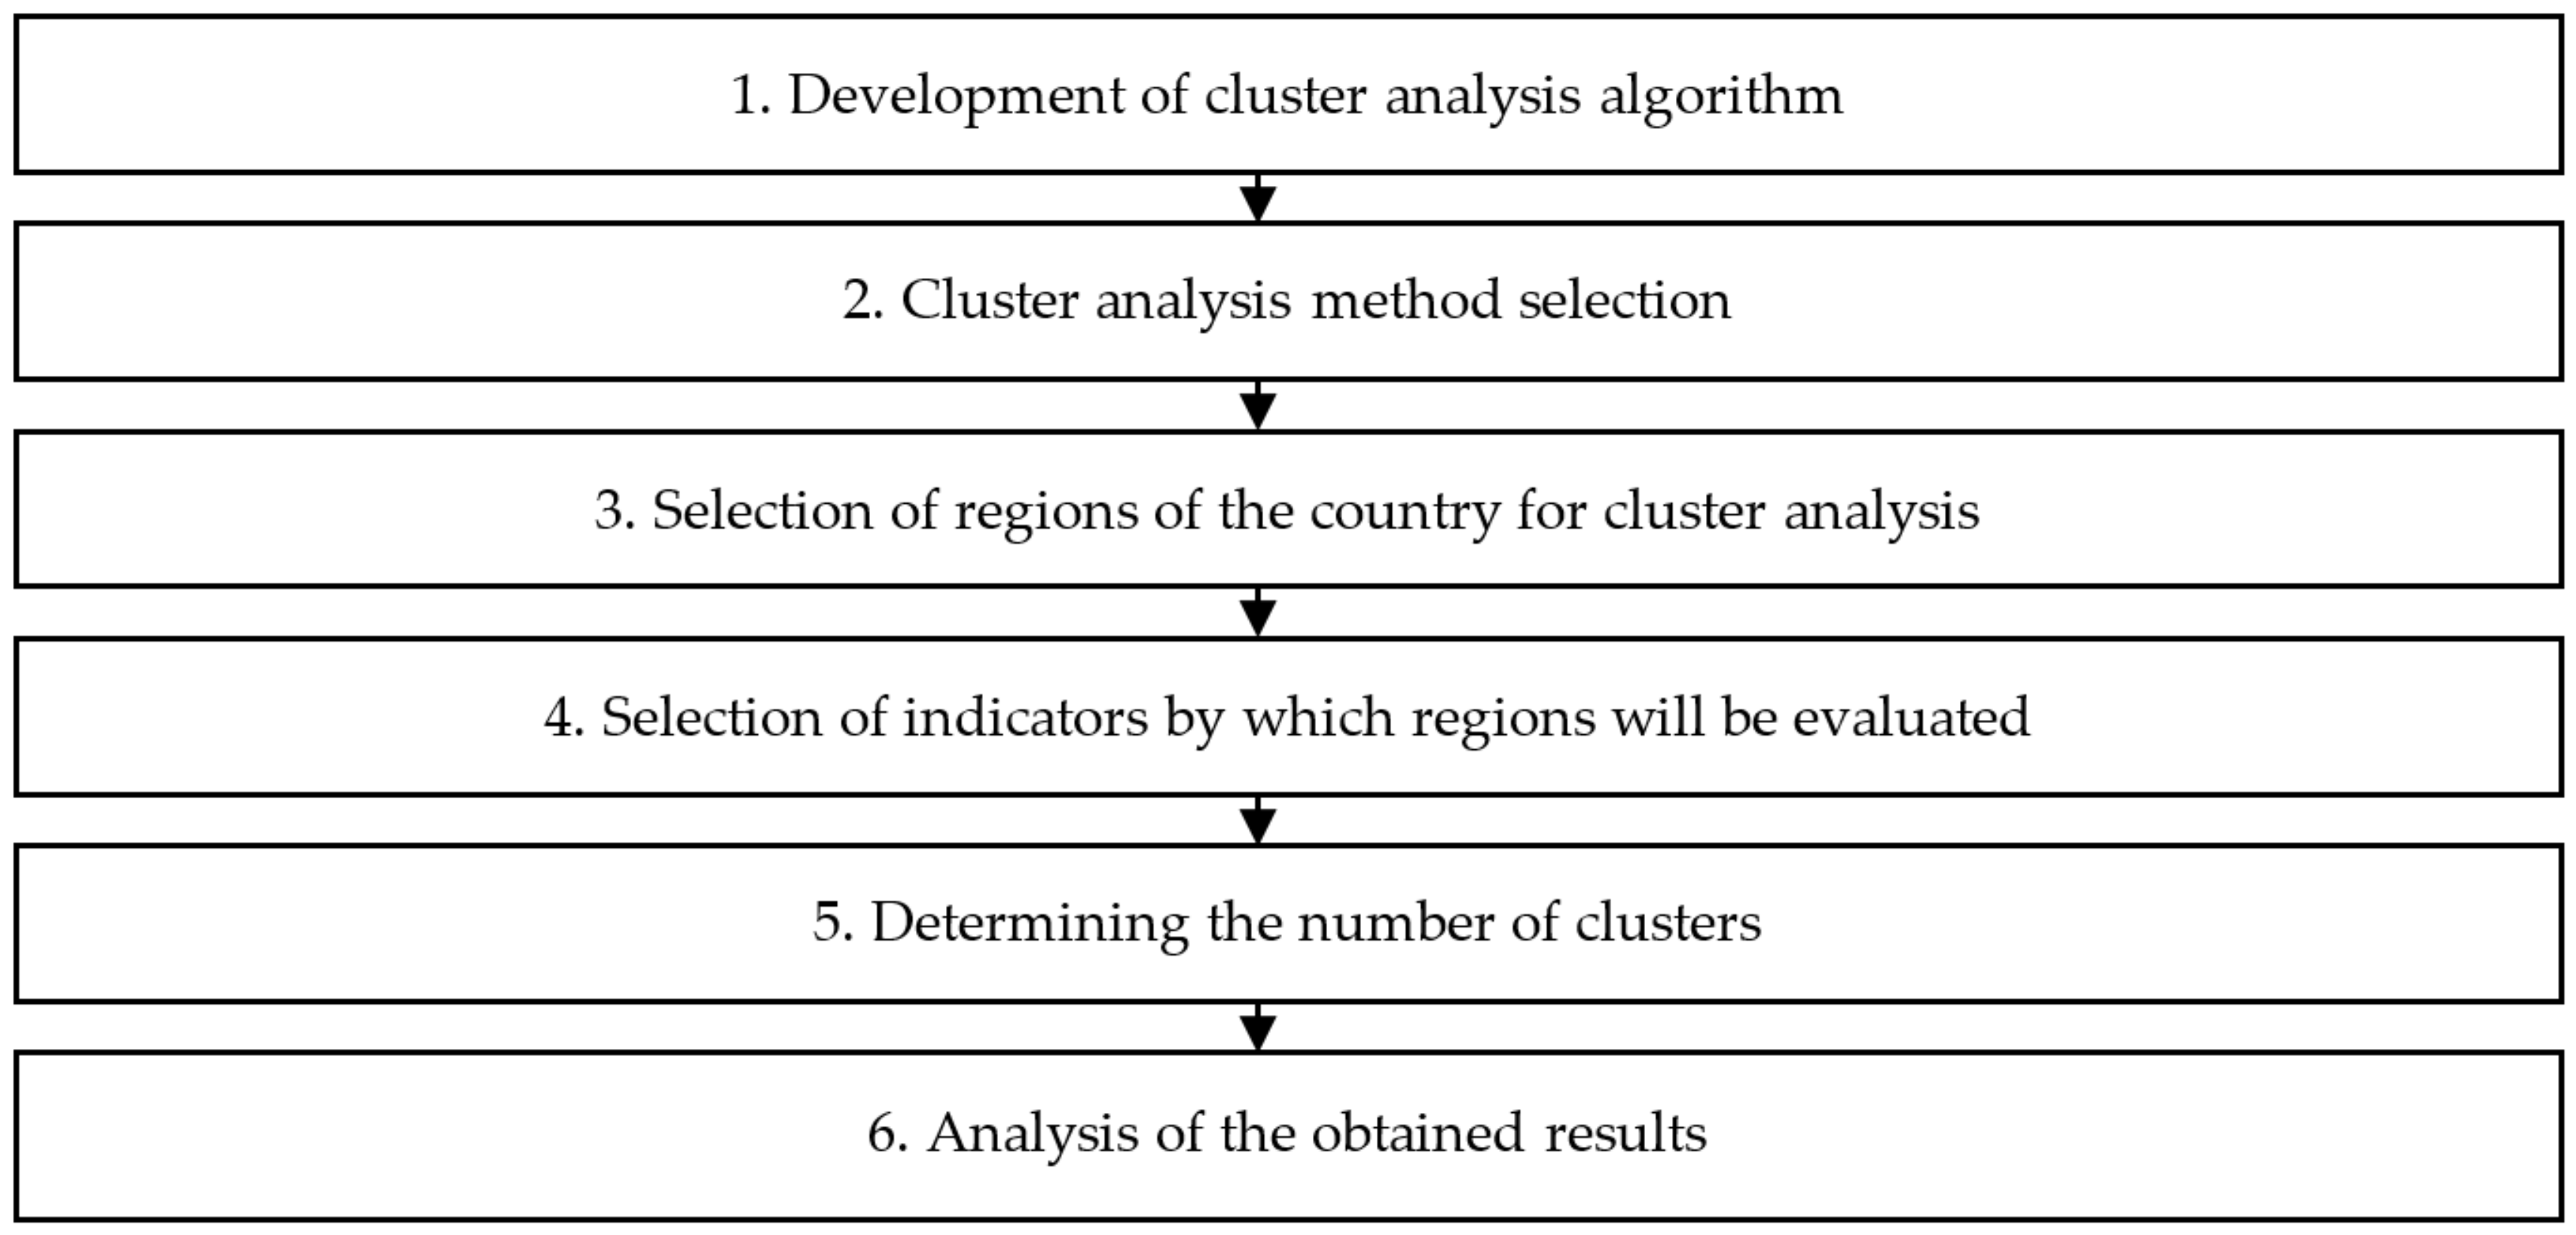
- Stage 1
- Selection of indicators for clustering of regions according to the level of development potential of crop production and animal husbandry as well as the level of profitability of crop production and animal husbandry;
- Stage 2
- grouping of the country’s regions according to the level of development of crop and livestock potential by cluster analysis using the method of K-means;
- Stage 3
- grouping of regions according to the level of profitability of crop and livestock products through cluster analysis using the predominance function;
- Stage 4
- grouping of the regions by the level of investment support of agriculture by the statistical method;
- Stage 5
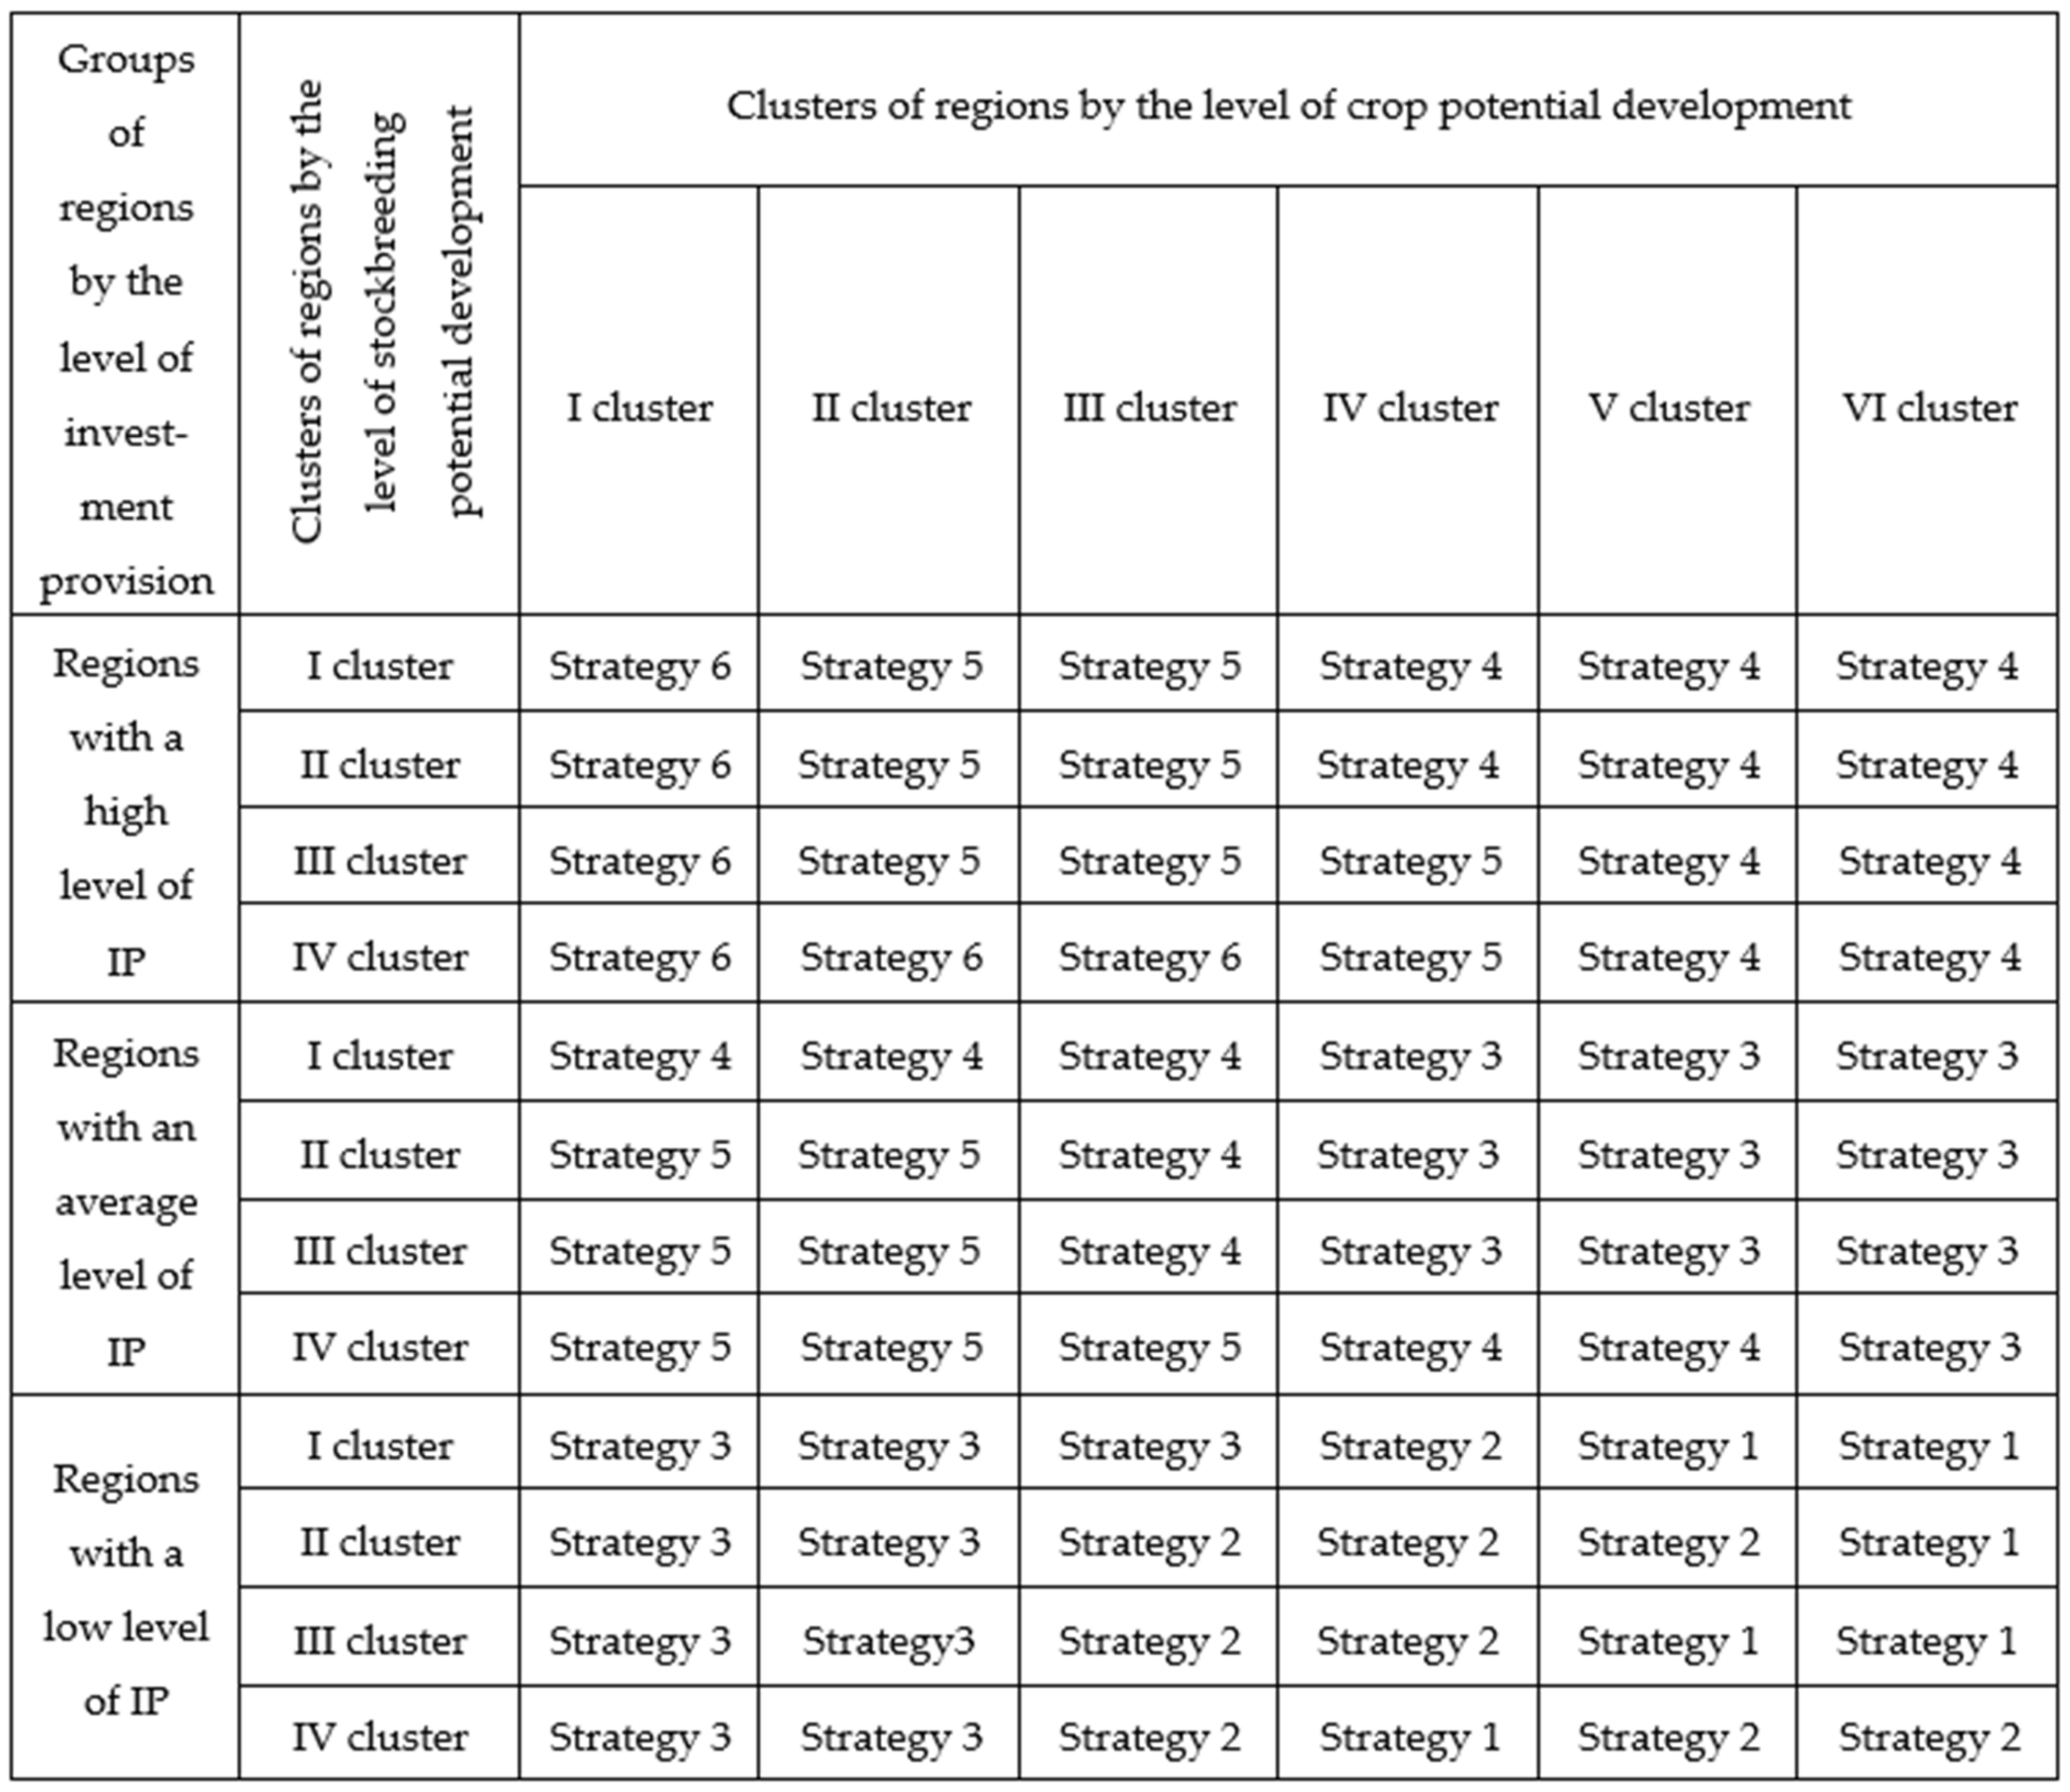
- selection of agricultural development strategy of the region depending on the importance of its resource potential, profitability of products and investment support.
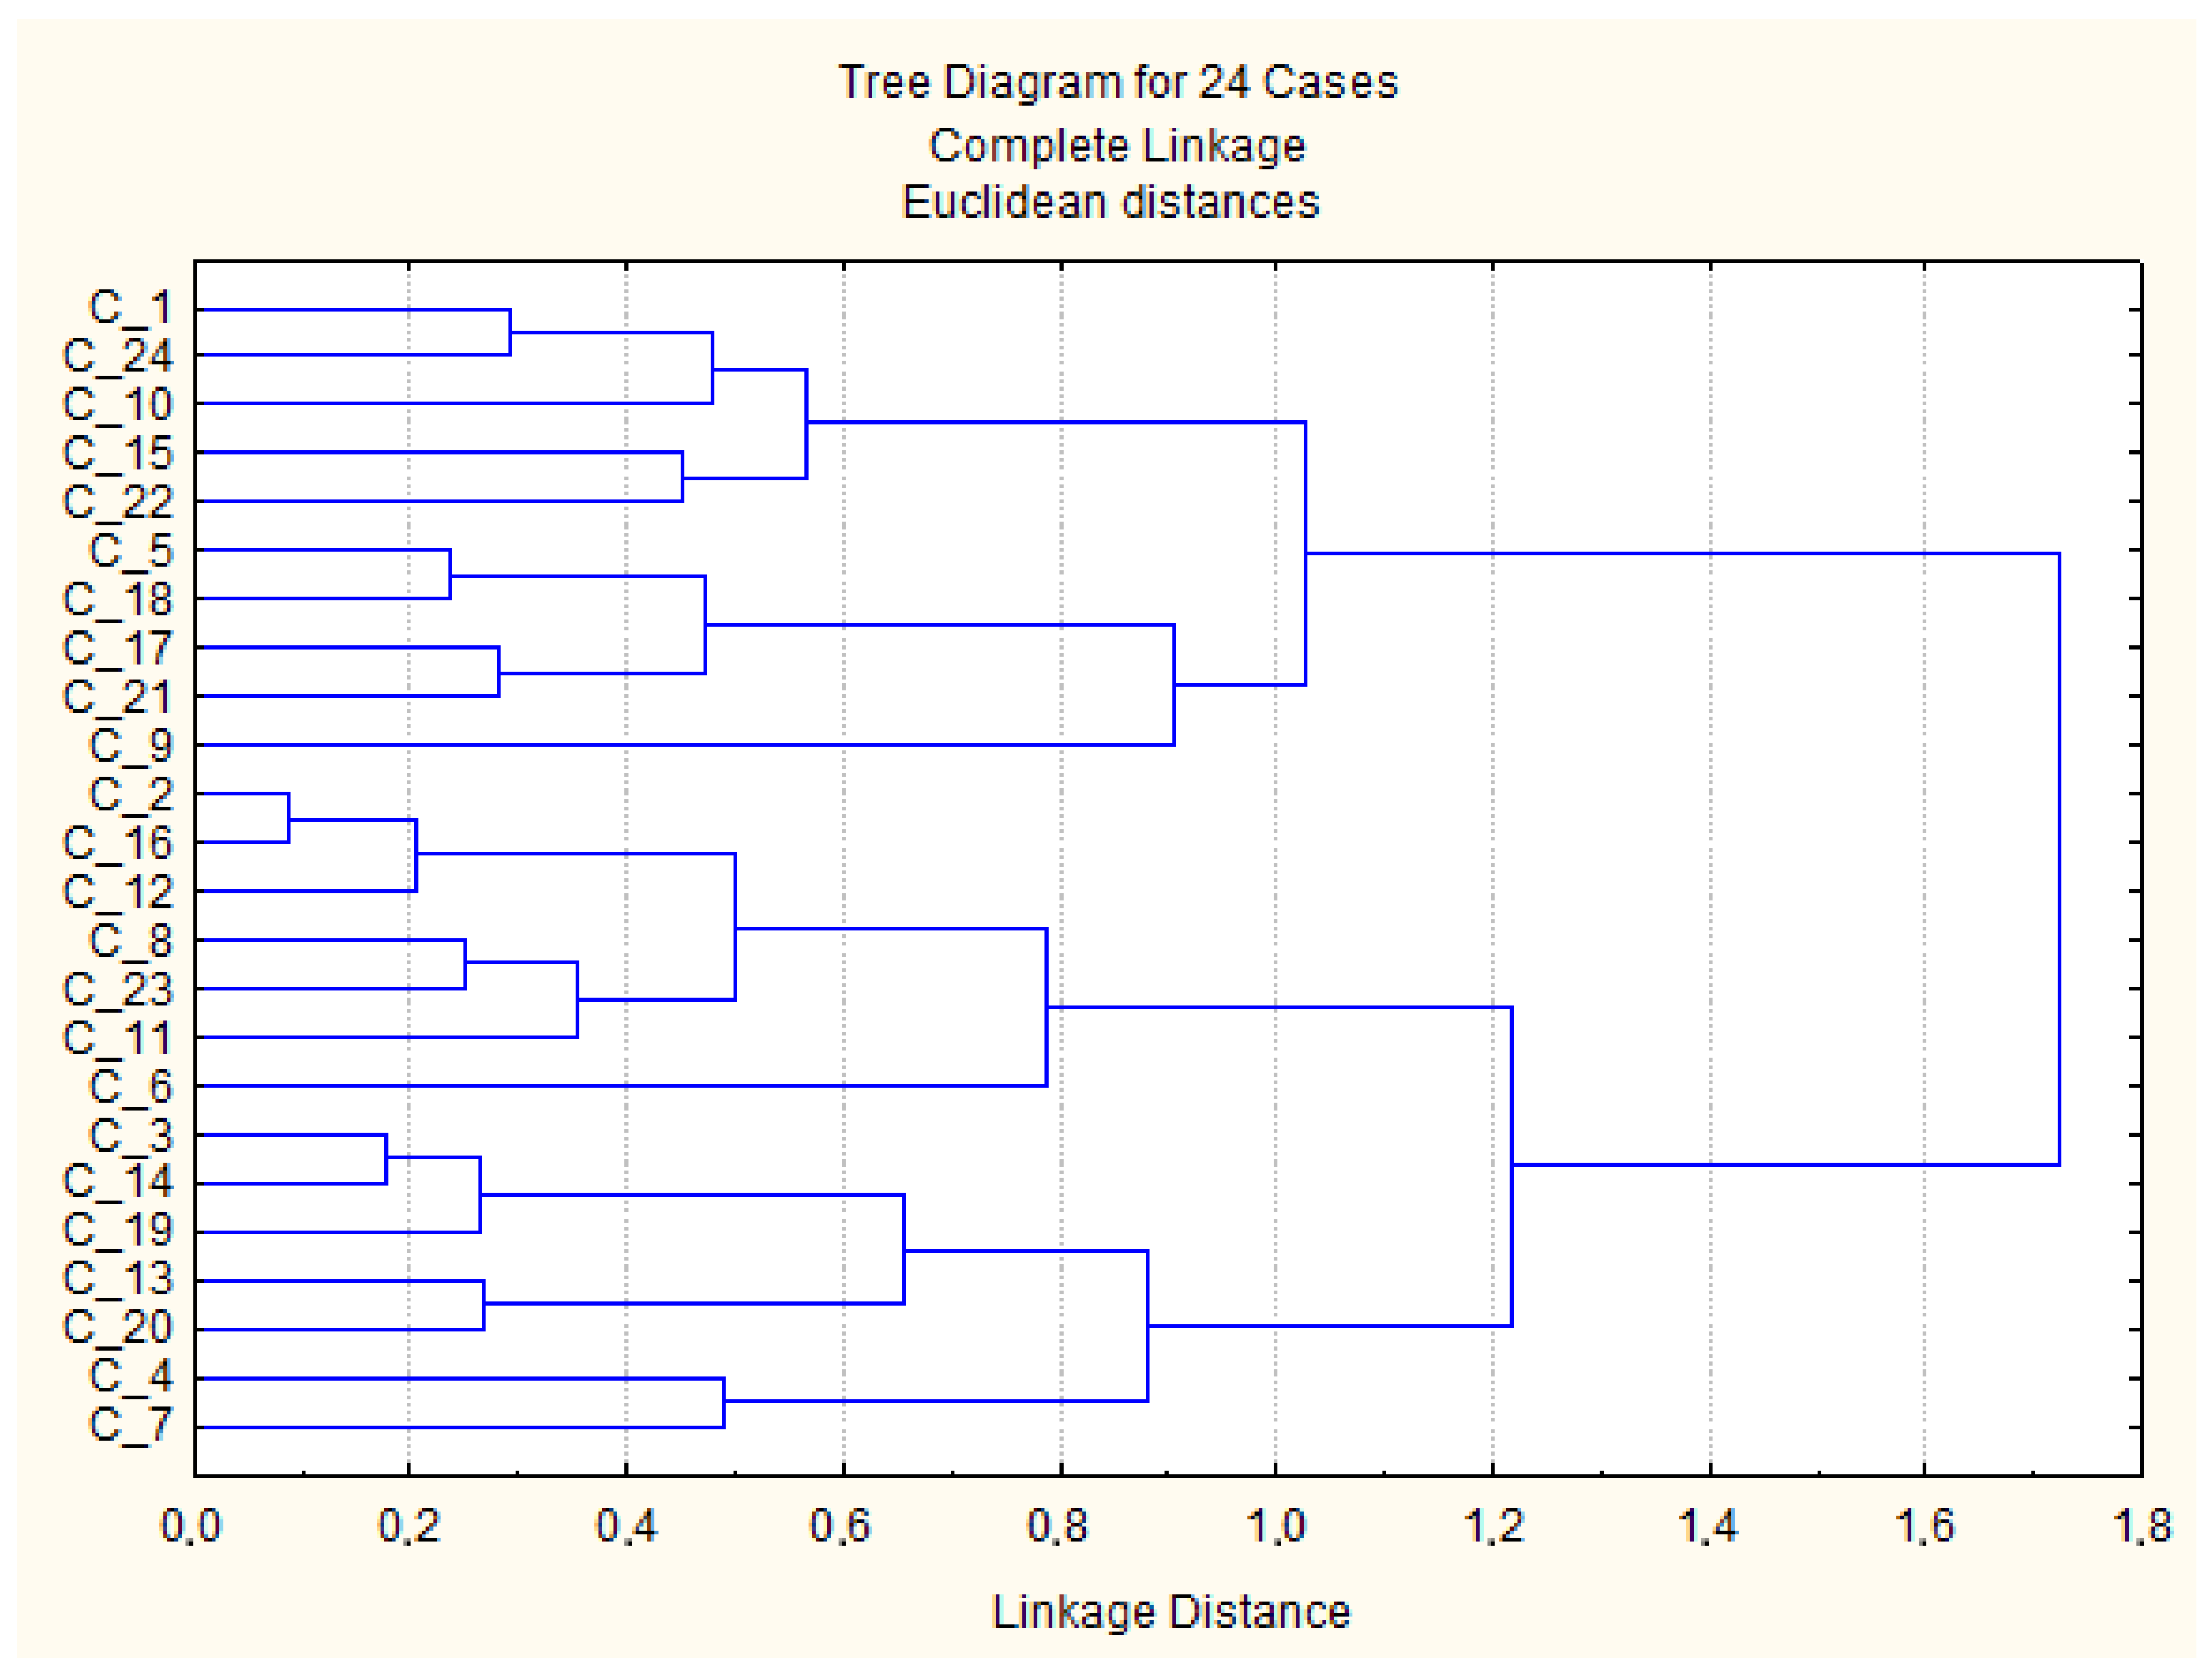
3.1. Method of Cluster Analysis
3.2. Selection of Indicators for Regional Clustering
- (1)
- According to the level of development of crop potential:
- -
- sown areas of crops [in thousands of hectares];
- -
- indices of crop production of farms of all categories [%];
- -
- crop production per capita [UAH] (1 UAH = 0.0306 EUR (on 3 April 2021));
- -
- labour productivity at agricultural (crop) enterprises [UAH];
- -
- gross harvest of cereals and legumes [in thousands of tons].
- (2)
- According to the level of development of stockbreeding potential:
- -
- volume of farm animals breeding [in thousands of tons];
- -
- indices of stockbreeding production of farms of all categories [%];
- -
- stockbreeding products per capita [UAH];
- -
- labour productivity at agricultural (stockbreeding) enterprises [UAH];
- -
- number of cattle [in thousands of heads].
3.3. Methodology of Grouping of Regions by the Level of Profitability of Crop and Stockbreeding Products
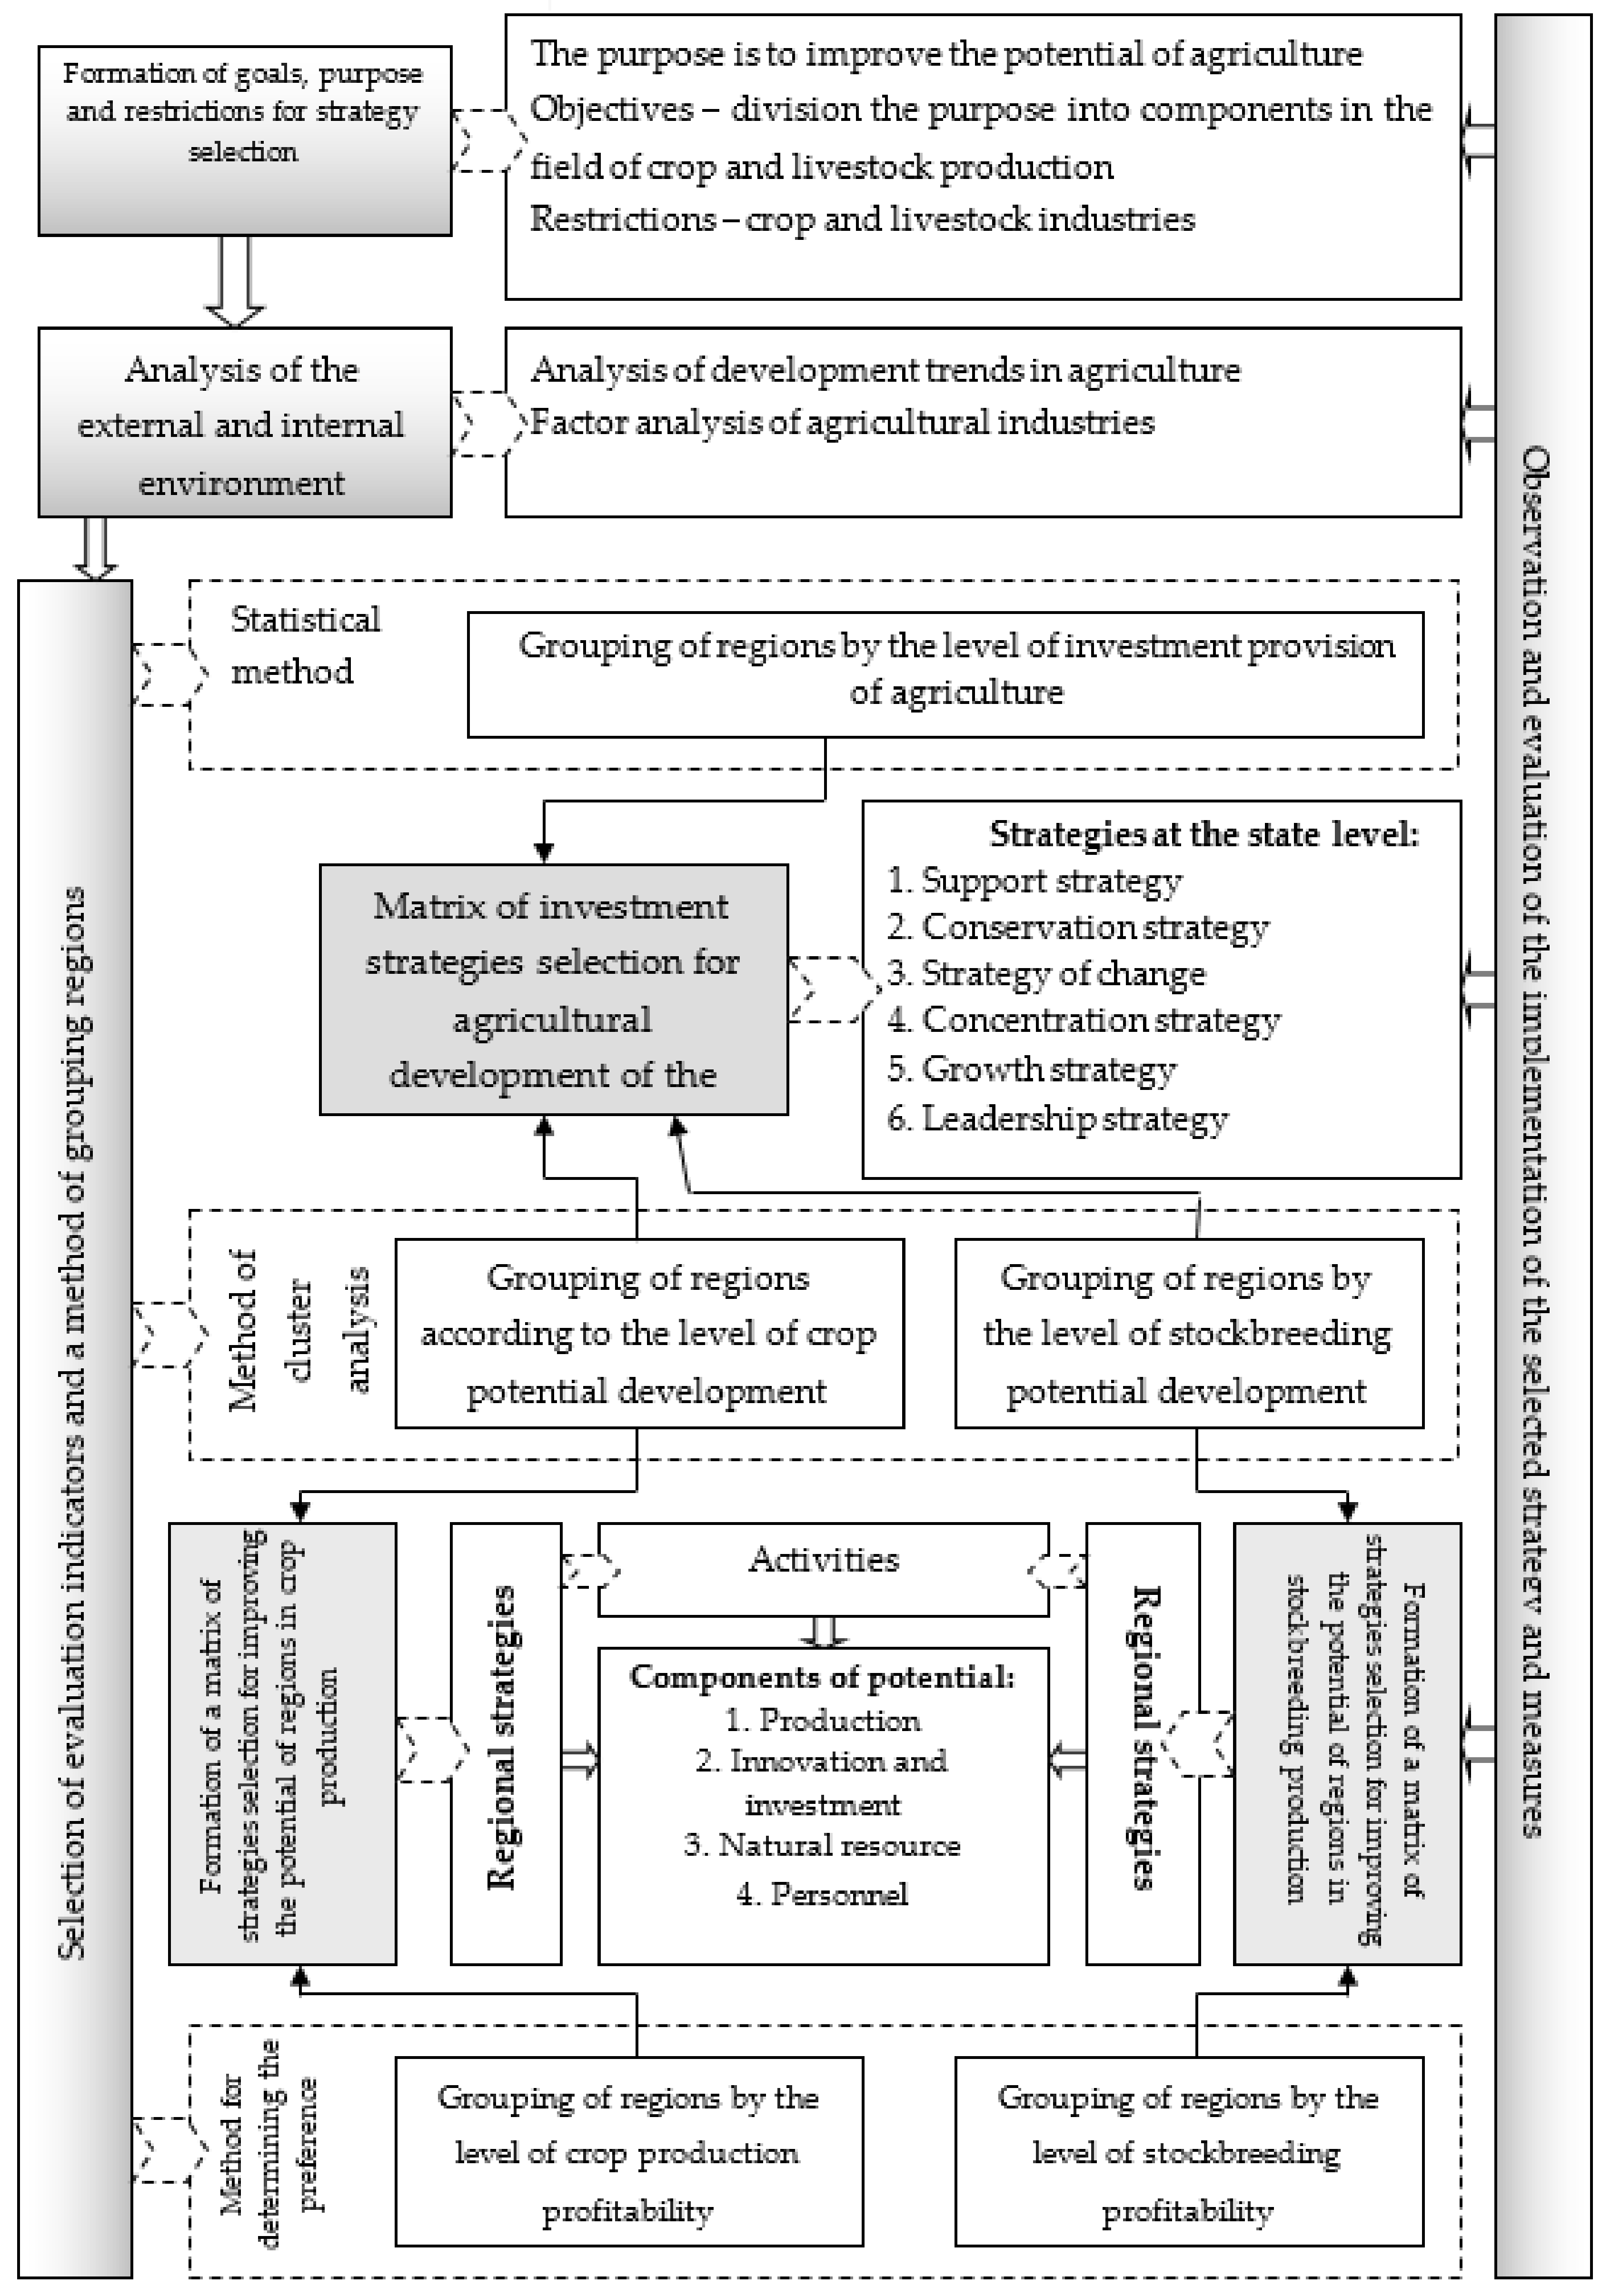
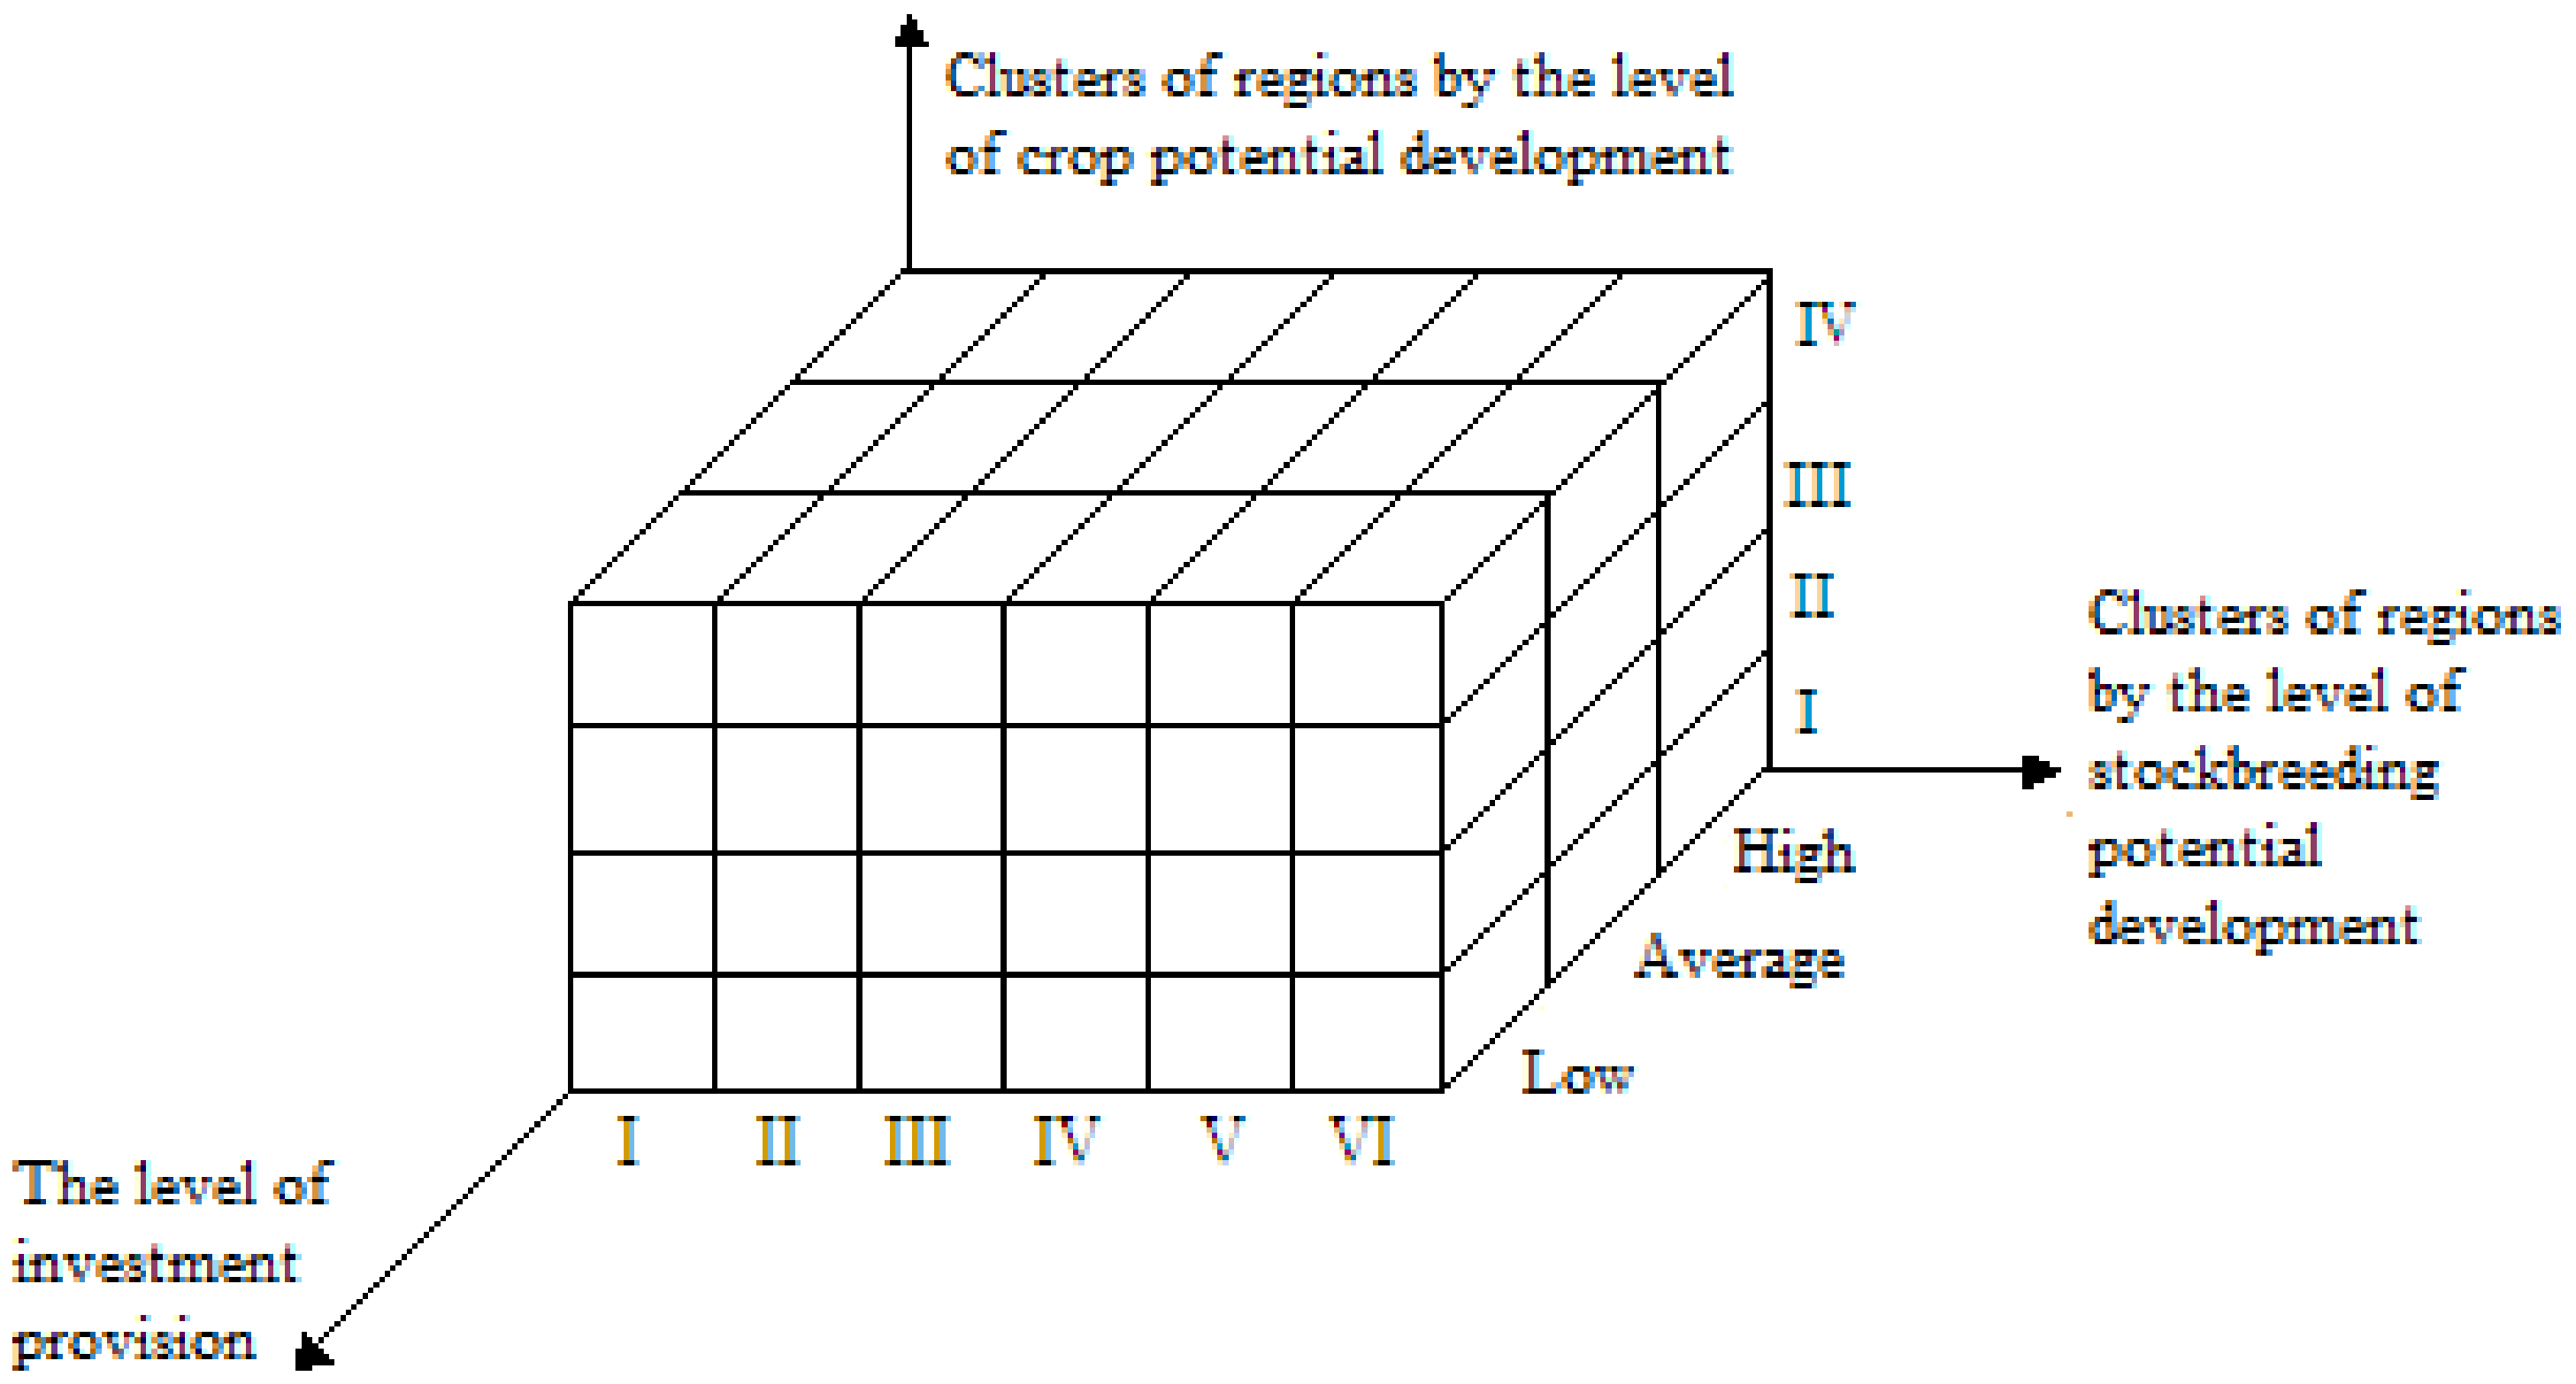
3.4. Approach to the Choice of Investment Strategy
4. Results
4.1. Development of Crop Potential
4.2. Development of Stockbreeding Potential
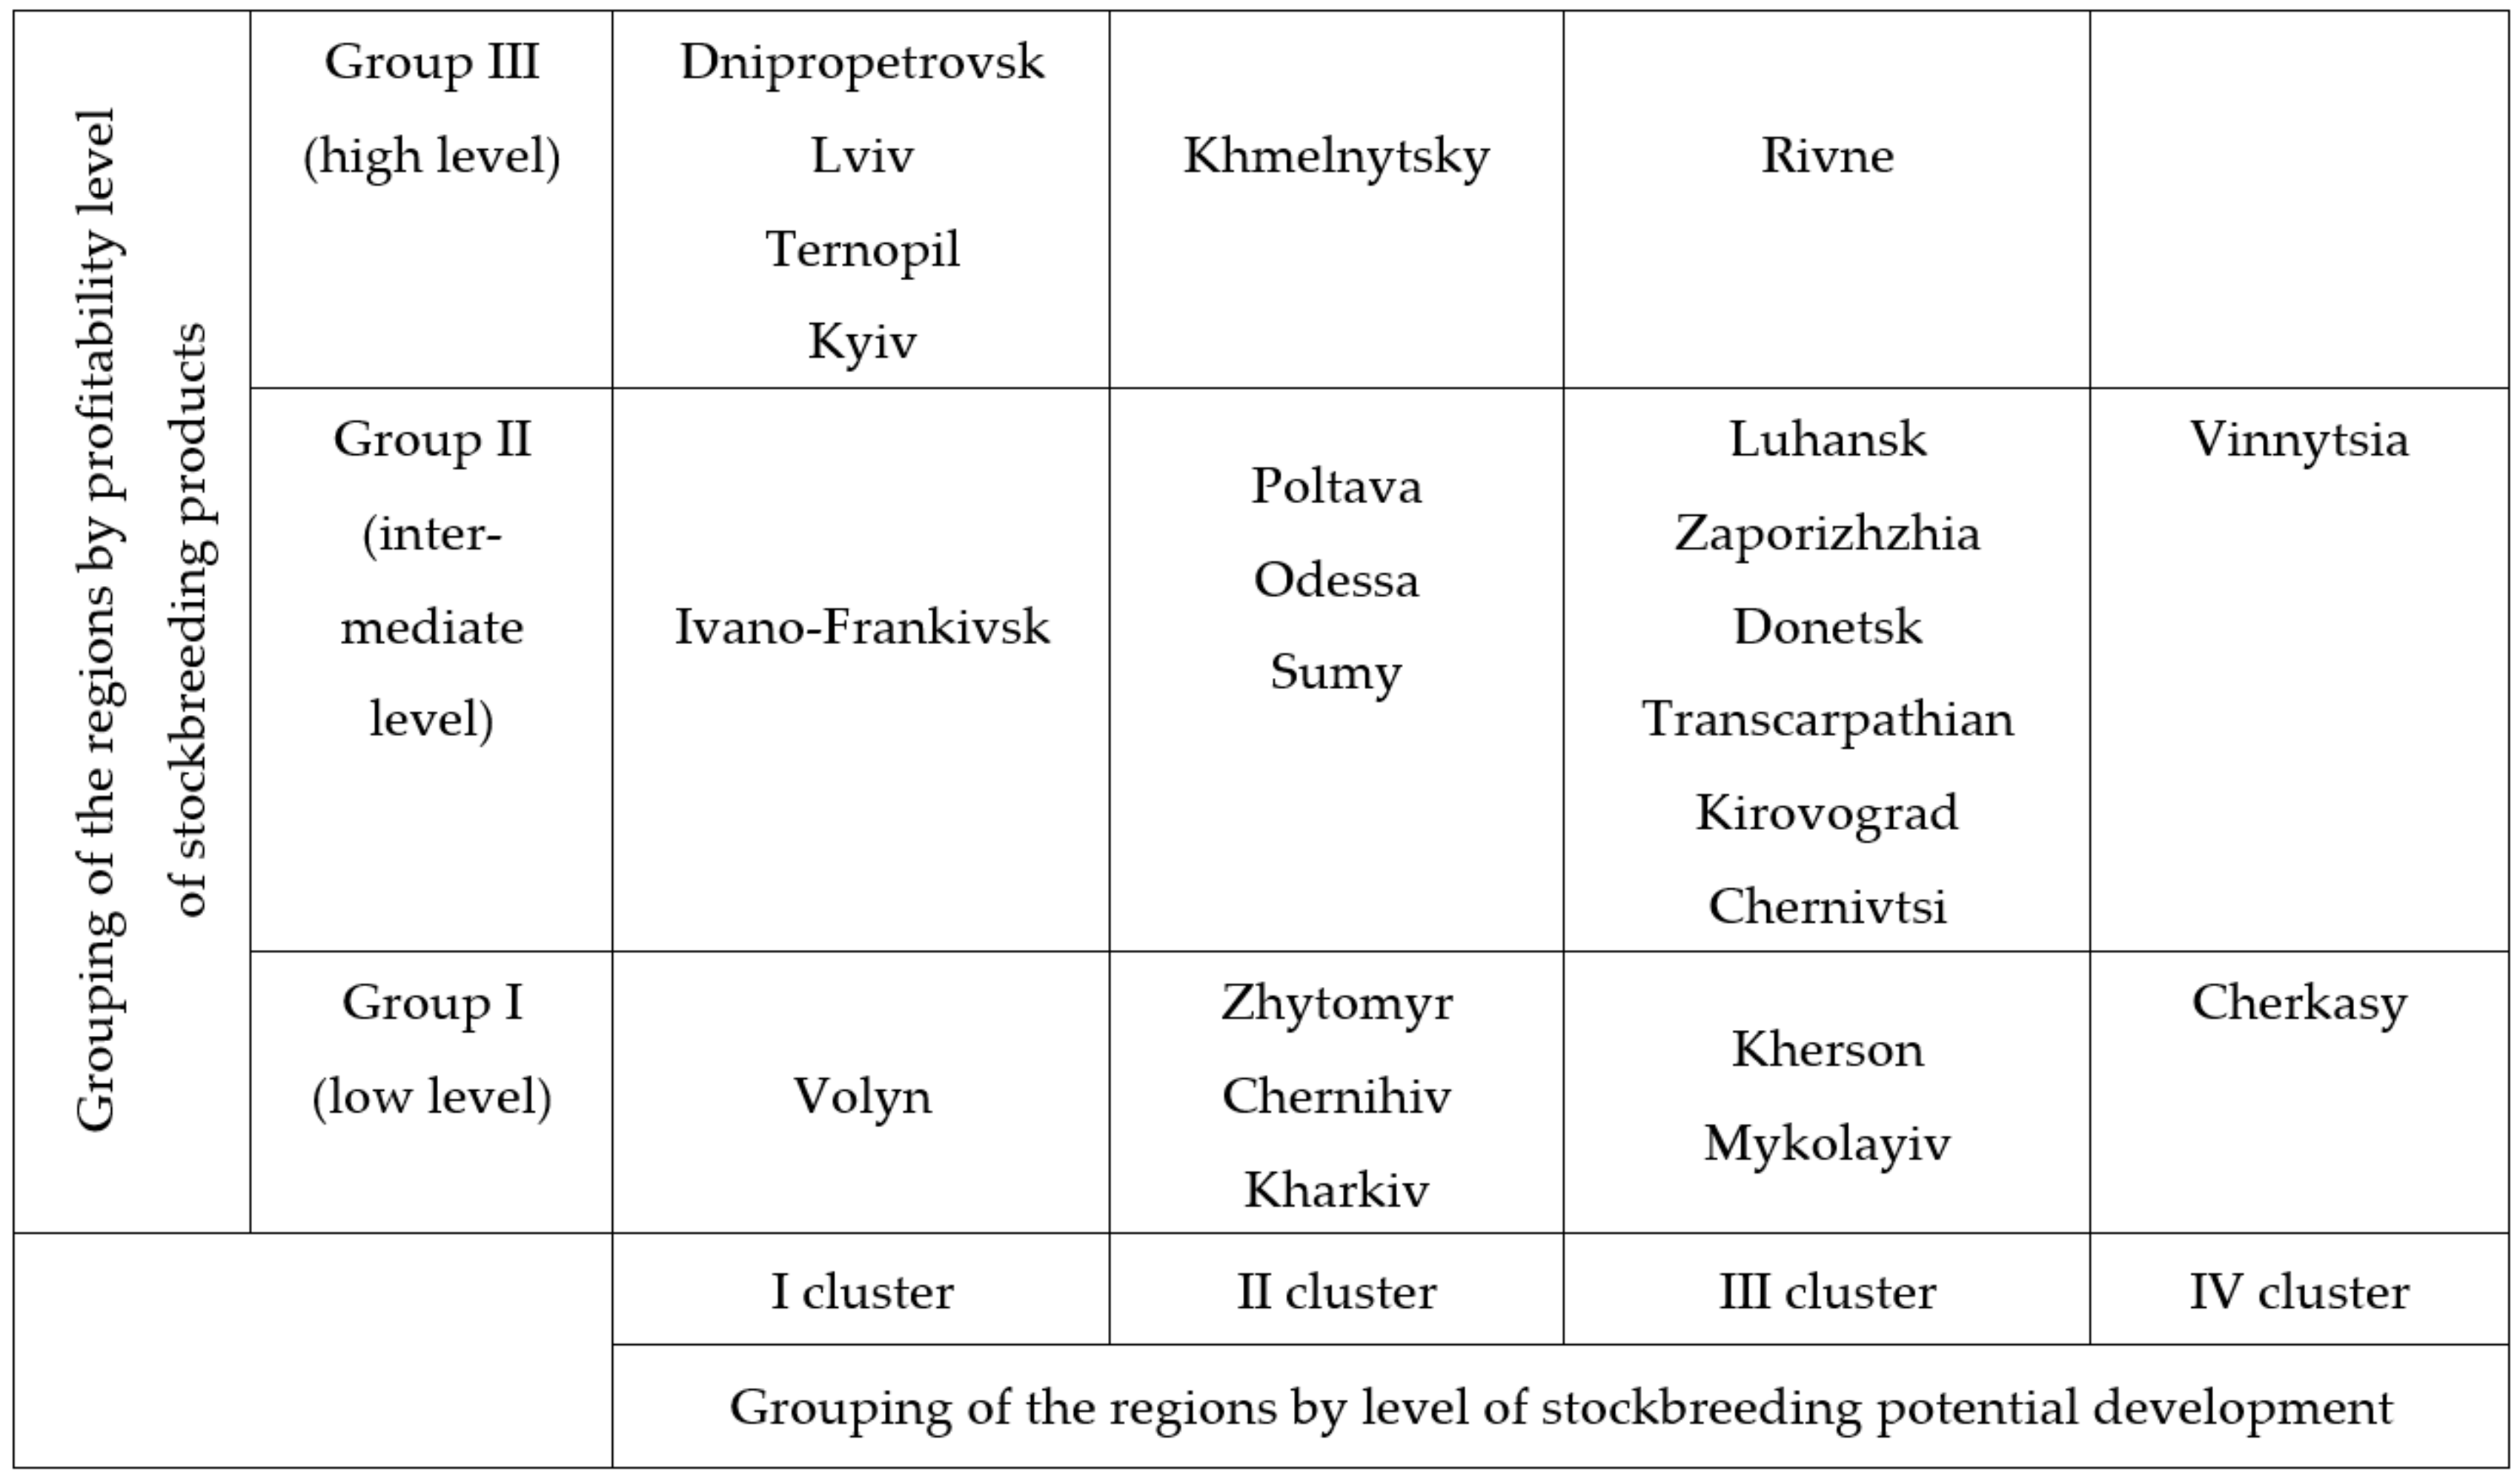
4.3. Level of Profitability of Crop and Stockbreeding Products
4.4. The Level of Investment Provision in Agriculture

| Regions with a Low Level of Investment Provision | Regions with an Average Level of Investment Provision | Regions with a High Level of Investment Provision |
|---|---|---|
| Transcarpathian (3.3 *) Donetsk (4.4) Dnipropetrovsk (5.2) Lviv (5.3) Chernivtsi (11.9) Ivano-Frankivsk (12.3) Kharkiv (12.7) Zaporizhzhia (13.2) Odessa (14.0) Rivne (16.5) Kyiv (16.6) | Volyn (17.5) Poltava (22) Mykolayiv (23.6) Vinnytsia (27.3) Zhytomyr (27.3) Khmelnytsky (28.1) Kherson (30.5) | Ternopil (33.3) Cherkasy (35.1) Sumy (35.3) Luhansk (36.4) Chernihiv (44.5) Kirovograd (45.7) |
5. Discussion
- (1)
- Production potential—a set of means of production, technical and technological production capacity, etc., used for production of agricultural products.
- (2)
- Innovation and investment (including financial) potential—an ability to attract financial and investment resources and effectively use and distribute cash flows (current and future) to create new value through targeted integration of tangible and intangible assets of a firm to ensure its innovative development.
- (3)
- Natural resource potential—a set of natural resources and conditions that can be used to meet the needs of the agro-industrial complex.
- (4)
- Personnel (labour) potential—a set of existing and potential employment opportunities for personnel who under certain conditions are able to realise their ability to work in the field of agricultural production.
6. Conclusions
Author Contributions
Funding
Institutional Review Board Statement
Informed Consent Statement
Data Availability Statement
Conflicts of Interest
References
- Meyer, D.F.; Meyer, N.; Neethling, J.R. Perceptions of business owners on service delivery and the creation of an enabling environment. Adm. Publica 2016, 24, 52–73. [Google Scholar]
- Wosiek, M. Rural–urban divide in human capital in Poland after 1988. Oecon. Copernic. 2020, 11, 183–201. [Google Scholar] [CrossRef] [Green Version]
- Bartova, L.; Fandel, P. Membership in agricultural producer organisations and farm technical efficiency in Slovakia. Equilib. Q. J. Econ. Econ. Policy 2020, 15, 489–509. [Google Scholar] [CrossRef]
- Gorb, O.; Greblikaitë, J.; Yasnolob, I. The problem of concentration of agricultural holdings in rural development discourse. Forum Sci. Oecon. 2018, 6, 69–82. [Google Scholar] [CrossRef]
- Praburaj, L. Role of agriculture in the economic development of a country. Shanlax Int. J. Commer. 2018, 6, 1–5. [Google Scholar] [CrossRef]
- Gorb, O. Development of complex approach to defining the notion “sustainable development of rural territories”. Forum Sci. Oecon. 2017, 5, 87–99. [Google Scholar] [CrossRef]
- Lutsenko, Y.O. Agroholdings in Ukraine and their increased socially aware activities. Econ. AIC 2014, 7, 5–21. [Google Scholar]
- Kotykova, O.; Babych, M. Limitations in availability of food in Ukraine as a result of loss and waste. Oecon. Copernic. 2019, 10, 153–172. [Google Scholar] [CrossRef]
- Shpak, N.; Seliuchenko, N.; Kharchuk, V.; Kosar, N.; Sroka, W. Evaluation of product competitiveness: A case study analysis. Organizacija 2019, 52, 107–125. [Google Scholar] [CrossRef] [Green Version]
- Lindsay, A.R.; Sanchirico, J.N.; Gilliland, T.E.; Ambo-Rappe, R.; Taylor, J.E.; Krueck, N.C.; Mumby, P.J. Evaluating sustainable development policies in rural coastal economies. Proc. Natl. Acad. Sci. USA 2021, 117, 33170–33176. [Google Scholar] [CrossRef]
- Shpak, N.; Naychuk-Khrushch, M.; Kohut, U.; Honchar, M.; Sroka, W. The usage of modern instruments of business planning administration for small enterprises: A case study analysis. Cent. Eur. Bus. Rev. 2020, 9, 20–42. [Google Scholar] [CrossRef] [Green Version]
- Casini, L.; Contini, C.; Romano, C. Paths to developing multifunctional agriculture: Insights for rural development policies’. Agric. Resour. Gov. Ecol. 2012, 9, 185–203. [Google Scholar] [CrossRef] [Green Version]
- Morkūnas, M.; Volkov, A.; Bilan, Y.; Raišienė, A.G. The role of government in forming agricultural policy: Economic resilience measuring index exploited. Adm. Manag. Public 2018, 31, 111–131. [Google Scholar] [CrossRef]
- Zakharin, S.; Stoyanova-Koval, S.; Kychkoc, I.; Marhasova, V.; Shupta, I. Strategic Management of the Investment Process in the Agricultural Sector (for Example, Agricultural Enterprises and the Food Industry). J. Optim. Ind. Eng. 2021, 14, 209–218. [Google Scholar] [CrossRef]
- Troitino, D.R.; Chochia, A. The Common Agricultural Policy, its role in European integration and influence on the enlargements of the organization (case study: Georgia). Int. Comp. Law Rev. 2013, 13, 39–60. [Google Scholar] [CrossRef] [Green Version]
- Stverkova, H.; Pohludka, M.; Kurowska-Pysz, J.; Szczepańska-Woszczyna, K. Cross-border enterprepreneurship in euroregion Beskydy. Pol. J. Manag. Stud. 2018, 18, 324–337. [Google Scholar] [CrossRef]
- Boiko, V.V. Threats to economic mechanism functioning of rural areas development: Structural and functional aspects. Actual Probl. Econ. 2016, 182, 195–204. [Google Scholar]
- Kliestikova, J.; Krizanova, A.; Corejova, T.; Kral, P.; Spuchlakova, E. Subsidies to Increase Remote Pollution? Sci. Eng. Ethics 2018, 24, 755–767. [Google Scholar] [CrossRef]
- Popp, J.; Kovács, S.; Oláh, J.; Divéki, Z.; Balázs, E. Bioeconomy: Biomass and biomass-based energy supply and demand. New Biotechnol. 2020, 60, 76–84. [Google Scholar] [CrossRef]
- Ul Haque, A.; Aston, J.; Kozlovski, E.; Caha, Z. Role of external CSR and social support programme for sustaining human capital in contrasting economies. Pol. J. Manag. Stud. 2020, 22, 147–168. [Google Scholar] [CrossRef]
- Komarek, A.M.; Thierfelder, C.; Steward, P.R. Conservation agriculture improves adaptive capacity of cropping systems to climate stress in Malawi. Agric. Syst. 2021, 190, 103117. [Google Scholar] [CrossRef]
- Arora, N.K. Impact of climate change on agriculture production and its sustainable solutions. Environ. Sustain. 2019, 2, 95–96. [Google Scholar] [CrossRef] [Green Version]
- Wang, Z.; Zhang, T.Q.; Tan, C.S.; Xue, L.; Bukovsky, M.; Qi, Z.M. Modeling impacts of climate change on crop yield and phosphorus loss in a subsurface drained field of Lake Erie region, Canada. Agric. Syst. 2021, 190, 103110. [Google Scholar] [CrossRef]
- Sörqvist, P.; Langeborg, L. Why People Harm the Environment Although They Try to Treat It Well: An Evolutionary-Cognitive Perspective on Climate Compensation. Front. Psychol. 2019, 10, 348. [Google Scholar] [CrossRef]
- Rongjian, Y.; Obomufok, I.N.; Khan, N. The role of advanced technology in agricultural innovation. Mod. Concepts Dev. Agron. 2019, 4, 379–383. [Google Scholar] [CrossRef] [Green Version]
- Meyer, D.F.; Meyer, N. The relationship between the creation of an enabling environment and economic development: A comparative analysis of management at local government sphere. Pol. J Manag Stud. 2016, 14, 150–160. [Google Scholar] [CrossRef]
- Khosravi, M.; Boshrabadi, H.M. Agricultural economic dynamics in a bayesian DSGE model for Iran. Iran. Econ. Rev. 2020, 24, 267–297. [Google Scholar]
- Baryshnikova, N.; Kiriliuk, O.; Klimecka-Tatar, D. Management approach on food export expansion in the conditions of limited internal demand. Pol. J. Manag. Stud. 2020, 21, 101–114. [Google Scholar] [CrossRef]
- Pazienza, P.; De Lucia, C. For a new plastics economy in agriculture: Policy reflections on the EU strategy from a local perspective. J. Clean. Prod. 2020, 253, 119844. [Google Scholar] [CrossRef]
- Polgár, A.; Kovács, Z.; Fodor, V.E.; Bidló, A. Environmental Life-Cycle Assessment of Arable Crop Production Technologies Compared to Different Harvesting Work Systems in Short Rotation Energy Plantations. Acta Silv. Lignaria Hung. 2020, 15, 55–68. [Google Scholar] [CrossRef]
- Chams, N.; Guesmi, B.; Gil, J.M. Beyond scientific contribution: Assessment of the societal impact of research and innovation to build a sustainable agri-food sector. J. Environ. Manag. 2020, 264, 110455. [Google Scholar] [CrossRef]
- Ncube, A.; Fiorentino, G.; Colella, M.; Ulgiatic, S. Upgrading wineries to biorefineries within a Circular Economy perspective: An Italian case study. Sci. Total Environ. 2021, 775, 145809. [Google Scholar] [CrossRef]
- Shpak, N.; Kuzmin, O.; Melnyk, O.; Ruda, M.; Sroka, W. Implementation of a Circular Economy in Ukraine: The context of European Integration. Resources 2020, 9, 96. [Google Scholar] [CrossRef]
- Coutts, J.; White, T.; Blackett, P.; Rijswijk, K.; Bewsell, D.; Park, N.; Turner, J.A.; Botha, N. Evaluating a space for co-innovation: Practical application of nine principles for co-innovation in five innovation projects. Outlook Agric. 2017, 46, 99–107. [Google Scholar] [CrossRef]
- Shokhnekh, A.V.; Melnikova, Y.V.; Gamayunova, T.M. The investment concept strategy of development of innovative activities of agricultural organisations in the conditions of techno-economic modernization. In Digital Economy: Complexity and Variety vs. Rationality; Popkova, E.G., Sergi, B.S., Eds.; Lecture Notes in Networks and Systems; Spinger: Cham, Switzerland, 2020; Volume 87. [Google Scholar] [CrossRef]
- Kuzmin, O.Y.; Kulyniak, I.Y. Polyparametric modeling for selecting measures on risks minimization in leasing. Actual Probl. Econ. 2011, 12, 280–289. [Google Scholar]
- Mesterházy, Á.; Oláh, J.; Popp, J. Losses in the grain supply chain: Causes and solutions. Sustainability 2020, 12, 2342. [Google Scholar] [CrossRef] [Green Version]
- Tompa, O.; Lakner, Z.; Oláh, J.; Popp, J.; Kiss, A. Is the sustainable choice a healthy choice?—Water footprint consequence of changing dietary patterns. Nutrients 2020, 12, 2578. [Google Scholar] [CrossRef]
- Zeng, L.; Li, J.; Zhou, Z.; Yu, Y. Optimizing land use patterns for the grain for Green Project based on the efficiency of ecosystem services under different objectives. Ecol. Indic. 2020, 114, 106347. [Google Scholar] [CrossRef]
- Skliar, Y.; Bohinska, L.; Kapinos, N.; Prokopenko, N. Improvement of land management in Ukraine. J. Optim. Ind. Eng. 2021, 14, 199–207. [Google Scholar] [CrossRef]
- Jung, J.; Maeda, M.; Chang, A.; Bhandari, M.; Ashapure, A.; Landivar-Bowles, J. The potential of remote sensing and artificial intelligence as tools to improve the resilience of agriculture production systems. Curr. Opin. Biotechnol. 2021, 70, 17–22. [Google Scholar] [CrossRef]
- Eze, S.; Dougill, A.J.; Banwart, S.A.; Hermans, T.D.G.; Ligowe, I.S.; Thierfelder, C. Impacts of conservation agriculture on soil structure and hydraulicproperties of Malawian agricultural systems. Soil Tillage Res. 2020, 201, 104639. [Google Scholar] [CrossRef]
- Blumetto, O.; Castagna, A.; Cardozo, G.; García, F.; Tiscornia, G.; Ruggia, A.; Scarlato, S.; Albicette, M.M.; Aguerre, V.; Albin, A. Ecosystem Integrity Index, an innovative environmental evaluation tool for agricultural production systems. Ecol. Indic. 2019, 101, 725–733. [Google Scholar] [CrossRef]
- Usman, M.; Farooq, M.; Wakeel, A.; Ashraf, I.; Sanaullah, M. Nanotechnology in agriculture: Current status, challenges and future opportunities. Sci. Total Environ. 2020, 721, 137778. [Google Scholar] [CrossRef]
- Nazzaro, C.; Marotta, G. The Common Agricultural Policy 2014–2020: Scenarios for the European agricultural and rural systems. Agric. Econ. 2016, 4, 16. [Google Scholar] [CrossRef] [Green Version]
- Laurett, R.; Paço, A.; Mainardes, E.W. Sustainable development in agriculture and its antecedents, barriers and consequences—An exploratory study. Sustain. Prod. Consum. 2021, 27, 298–311. [Google Scholar] [CrossRef]
- Androniceanu, A. Social responsibility, an essential strategic option for a sustainable development in the field of bio-economy. Amfiteatru Econ. 2019, 21, 503–519. [Google Scholar] [CrossRef]
- Androniceanu, A. Major structural changes in the EU policies due to the problems and risks caused by COVID-19. Adm. Manag. Public 2020, 34, 137–149. [Google Scholar] [CrossRef]
- Kadyrus, I.; Donskykh, A.; Tereshchenko, V. Formation of a development strategy for agricultural enterprise. Effic. Econ. 2020. [Google Scholar] [CrossRef]
- Fadhil, R.; Maarif, M.S.; Bantacut, T.; Hermawan, A. A Review on the Development Strategies of Agro-industrial Institutions in Indonesia. Asian J. Appl. Sci. 2017, 5. Available online: https://www.ajouronline.com/index.php/AJAS/article/view/4877 (accessed on 28 August 2017).
- Ianenkova, I.G.; Solesvik, M.Z. Mergers and acquisitions in Ukraine and worldwide: Analysis of recent trends. Forum Sci. Oecon. 2016, 4, 39–52. [Google Scholar]
- Madhulatha, T. An overview on clustering methods. IOSR J. Eng. 2012, 2, 719–725. [Google Scholar] [CrossRef]
- Kassambara, A. Practical Guide to Cluster Analysis in R. Unsupervised Machine Learning; STHDA, 2017; Available online: https://xsliulab.github.io/Workshop/week10/r-cluster-book.pdf (accessed on 14 May 2021).
- Omran, M.; Engelbrecht, A.; Salman, A. An overview of clustering methods. Intell. Data Anal. 2007, 11, 583–605. [Google Scholar] [CrossRef]
- Ližbetinová, L.; Štarchoň, P.; Lorincová, S.; Weberová, D.; Pruša, P. Application of cluster analysis in marketing communications in small and medium-sized enterprises: An empirical study in the Slovak Republic. Sustainability 2019, 11, 2302. [Google Scholar] [CrossRef] [Green Version]
- Shubat, O.M.; Shmarova, I.V. Cluster analysis as an analytical tool of population policy. Econ. Reg. 2017, 13, 1175–1183. [Google Scholar] [CrossRef]
- Gavurova, B.; Soltes, M.; Kovac, V. Application of cluster analysis in process of competitiveness modelling of slovak republic regions. Transform. Bus. Econ. 2017, 16, 129–147. [Google Scholar]
- Horoshkova, L.A.; Khlobystov, I.V. United territorial communities socio-economic development potential (the case of zaporizhzhia region). Ukr. Geogr. J. 2019, 4, 18–27. [Google Scholar] [CrossRef]
- Mishra, B.K.; Rath, A.; Nayak, N.R.; Swain, S. Far efficient K-means clustering algorithm. In Proceedings of the International Conference on Advances in Computing, Communications and Informatics, Chennai, India, 3–5 August 2012; pp. 106–110. [Google Scholar] [CrossRef]
- Chakraborty, S.; Nagwani, N.K. Analysis and Study of Incremental K-Means Clustering Algorithm. In Proceedings of the High Performance Architecture and Grid Computing International Conference, HPAGC 2011, Chandigarh, India, 19–20 July 2011; pp. 338–341. [Google Scholar] [CrossRef]
- Nguyen, C.D.; Duong, T.H. K-means—A fast and efficient K-means algorithms. Int. J. Intell. Inf. Database Syst. 2018, 11, 27–45. [Google Scholar] [CrossRef]
- Halachenko, O.O. Cluster analysis of the regions of Ukraine by the level of development of the market of sanatorium services. Form. Mark. Relat. Ukr. 2017, 11, 117–122. [Google Scholar]
- Markov, B.M. Cluster analysis of retail trade enterprises. Black Sea Econ. Stud. 2018, 26, 29–33. [Google Scholar]
- Romesburg, C. Cluster Analysis for Researchers; Lili Press: Morrisville, NC, USA, 2004. [Google Scholar]
- Agriculture. Official Site of the State Statistics Service of Ukraine. Available online: http://www.ukrstat.gov.ua (accessed on 9 February 2021).
- State Statistics Service of Ukraine. Crop Production of Ukraine, 2018. Statistical Collection. Available online: http://www.ukrstat.gov.ua/druk/publicat/kat_u/2019/zb/04/zb_rosl_2018.pdf (accessed on 9 February 2021).
- State Statistics Service of Ukraine. Agriculture of Ukraine, 2018: Statistical Collection. Available online: http://www.ukrstat.gov.ua/druk/publicat/kat_u/2019/zb/09/Zb_sg_2018%20.pdf (accessed on 9 February 2021).
- State Statistics Service of Ukraine. Stockbreeding of Ukraine, 2018: Statistical Collection. Available online: http://www.ukrstat.gov.ua/druk/publicat/kat_u/2019/zb/05/zb_tu2018.pdf (accessed on 9 February 2021).
- Chang, X.-W.; Paige, C.C. Euclidean distances and least squares problems for a given set of vectors. Appl. Numer. Math. 2007, 57, 1240–1244. [Google Scholar] [CrossRef]
- Xia, S.; Xiong, Z.; Luo, Y.; Wei, X.; Zhang, G. Effectiveness of the euclidean distance in high dimensional spaces. Optik 2015, 126, 5614–5619. [Google Scholar] [CrossRef]
- Hendersen, B. Product Portfolio. BCG Rev. Dig. 2008, 2, 7–8. [Google Scholar]
- Enduring Ideas: The GE–McKinsey Nine-Box Matrix. 2008. Available online: https://www.mckinsey.com/business-functions/strategy-and-corporate-finance/our-insights/enduring-ideas-the-ge-and-mckinsey-nine-box-matrix# (accessed on 9 February 2021).
- Arthur, D. A Management System for 1980’s; Little Inc.: San Francisco, CA, USA, 1980. [Google Scholar]
- Ansoff, I. New Corporate Strategy; Peter Kom: St. Petersburg, Russia, 1999. [Google Scholar]
- Kodenska, M.Y. Integration as a factor of intensification of investment activity. Econ. Agro Ind. Complex 2008, 6, 24–31. [Google Scholar]
- Borodina, O.; Krupin, V. Is it possible to utilise the agricultural potential of Ukraine under the current agrarian system? EuroChoices 2018, 17, 46–51. [Google Scholar] [CrossRef]
- Kyryzyuk, S.; Krupin, V.; Borodina, O.; Wąs, A. Crop residue removal: Assessment of future bioenergy generation potential and agro-environmental limitations based on a case study of Ukraine. Energies 2020, 13, 5343. [Google Scholar] [CrossRef]
- Porter, M. Competitive Strategy: Techniques for Analyzing Industries and Competitors; Free Press: New York, NY, USA, 1998. [Google Scholar]
- Hofer, C.W.; Schendel, D. Strategy Formulation: Analytical Concepts; West Publishing: St. Paul, MN, USA, 1978. [Google Scholar]
- Malcolm, H.; McDonald, M. Some Methodological Comments on the Directional Policy Matrix. J. Mark. Manag. 1990, 6, 59–68. [Google Scholar] [CrossRef]
- Meldrum, M.; McDonald, M. The directional policy matrix. In Key Marketing Concepts; Palgrave Macmillan: London, UK, 1995. [Google Scholar] [CrossRef]
- Poprozman, N.V. Methodological bases of formation of strategy of development of agroindustrial production on the basis of the system analysis. Econ. Agro Ind. Complex 2015, 4, 35–40. [Google Scholar]
- Kim, W.C.; Mauborgne, R. Blue Ocean Strategy: How to Create Uncontested Market Space and Make the Competition Irrelevant; Harvard Business School Press: Boston, MA, USA, 2005; ISBN 978-1591396192. [Google Scholar]
- Maistro, S.V. Strategy of state regulation of agro-industrial complex of Ukraine in the context of globalization. State Build. 2007, 1. Available online: http://nbuv.gov.ua/UJRN/DeBu_2007_1(2)__24 (accessed on 9 February 2021).
- Kvasha, S.; Khomenko, V. The state of the agrarian market and food security of Ukraine. Economist 2007, 7–8, 72–78. [Google Scholar]


| Regions of Ukraine | Symbols | Sown Areas of Crops, in Thousands of Hectares | Indices of Crop Production of Farms of All Categories, % | Crop Production Per Capita, UAH | Labour Productivity in Agricultural (Crop) Enterprises, UAH | Gross Harvest of Cereals and Legumes, in Thousands of Tons |
|---|---|---|---|---|---|---|
| Vinnytsia region | C1 | 1625 | 114.1 | 9920 | 331,070.3 | 5911.1 |
| Volyn region | C2 | 577 | 106.9 | 4249 | 359,635.6 | 1237.2 |
| Dnipropetrovsk region | C3 | 1953 | 105.3 | 3480 | 243,516.5 | 3487.5 |
| Donetsk region | C4 | 1004 | 85.9 | 1084 | 190,790.2 | 1344.4 |
| Zhytomyr region | C5 | 1042 | 115.3 | 6692 | 402,973.3 | 2424.1 |
| Transcarpathian region | C6 | 189 | 105.3 | 1749 | 145,932 | 375.9 |
| Zaporizhzhia region | C7 | 1672 | 83.1 | 3723 | 180,828.7 | 2233.3 |
| Ivano-Frankivsk region | C8 | 381 | 101.1 | 2358 | 304,553.4 | 804.5 |
| Kyiv region | C9 | 1191 | 129.8 | 2528 | 280,747.3 | 4081.5 |
| Kirovohrad region | C10 | 1703 | 125 | 11,105 | 279,710.9 | 3763.2 |
| Luhansk region | C11 | 825 | 108.8 | 1971 | 272,699.3 | 1159.4 |
| Lviv region | C12 | 675 | 104.3 | 2565 | 388,793.5 | 1440 |
| Mykolaiv region | C13 | 1565 | 108.6 | 6879 | 252,300.7 | 2673.4 |
| Odessa region | C14 | 1860 | 102.4 | 4267 | 241,534.6 | 4319.9 |
| Poltava region | C15 | 1719 | 133.0 1 | 10,042 | 328,358.6 | 6341.8 |
| Rivne region | C16 | 575 | 104.8 | 4325 | 386,665.1 | 1259.5 |
| Sumy region | C17 | 1162 | 113.7 | 8529 | 491,638.8 | 4470.1 |
| Ternopil region | C18 | 839 | 104.6 | 7186 | 419,574.6 | 2631.9 |
| Kharkiv region | C19 | 1793 | 107.1 | 4445 | 318,703.2 | 3829.2 |
| Kherson region | C20 | 1396 | 100.8 | 8817 | 253,383.5 | 2267.7 |
| Khmelnytsky region | C21 | 1186 | 104.7 | 8709 | 420,937.3 | 3861 |
| Cherkasy region | C22 | 1188 | 138.2 | 8600 | 305,361.7 | 4644 |
| Chernivtsi region | C23 | 307 | 108.4 | 3492 | 245,523.7 | 586.4 |
| Chernihiv region | C24 | 1272 | 114.1 | 9905 | 377,357.8 | 4909.5 |
| Regions of Ukraine | Symbols | Volume of Farm Animals Breeding, in Thousands of Tons | Indices of Stockbreeding Production of Farms of All Categories, % | Stockbreeding Products Per Capita, UAH | Labour Productivity in Agricultural (Stockbreeding) Enterprises, UAH | Number of Cattle, in Thousands of Heads |
|---|---|---|---|---|---|---|
| Vinnytsia region | C1 | 476.2 | 103.5 | 4486 | 671,800.6 | 239.4 |
| Volyn region | C2 | 153.3 | 97.6 | 2588 | 435,109.9 | 130.3 |
| Dnipropetrovsk region | C3 | 326.7 | 96.7 | 1387 | 547,424.7 | 122.1 |
| Donetsk region | C4 | 122.4 | 100.7 | 579 | 378,923.2 | 59.7 |
| Zhytomyr region | C5 | 86.6 | 103.3 | 2387 | 180,450.2 | 189.4 |
| Transcarpathian region | C6 | 83.3 | 108.8 | 1671 | 123,612.4 | 122.9 |
| Zaporizhzhia region | C7 | 66.9 | 95.7 | 1072 | 235,448.9 | 91.5 |
| Ivano-Frankivsk region | C8 | 128.4 | 101.6 | 2083 | 485,685.6 | 136.2 |
| Kyiv region | C9 | 375.4 | 114.3 | 1390 | 427,957.7 | 117.1 |
| Kirovohrad region | C10 | 69.3 | 101.3 | 2044 | 187,174 | 89.7 |
| Luhansk region | C11 | 22.8 | 112 | 319 | 99,813.7 | 52.4 |
| Lviv region | C12 | 192.6 | 102.8 | 1469 | 491,214.6 | 170.9 |
| Mykolaiv region | C13 | 41.1 | 94.6 | 1361 | 184,810 | 98.5 |
| Odessa region | C14 | 59 | 94.6 | 748 | 136,343.7 | 154.9 |
| Poltava region | C15 | 97.5 | 97.9 | 2570 | 206,068.1 | 231.3 |
| Rivne region | C16 | 81.9 | 97.8 | 1920 | 287,702.3 | 118.5 |
| Sumy region | C17 | 65.8 | 102.6 | 1916 | 159,967.5 | 146.3 |
| Ternopil region | C18 | 74.7 | 101.6 | 2190 | 387,897.8 | 138.7 |
| Kharkiv region | C19 | 118.6 | 102 | 1123 | 243,943.3 | 180.8 |
| Kherson region | C20 | 66.3 | 99.2 | 1970 | 358,611.1 | 96 |
| Khmelnytsky region | C21 | 99.6 | 96.4 | 2654 | 271,622.9 | 230.2 |
| Cherkasy region | C22 | 449.2 | 102.4 | 4821 | 491,745.9 | 161 |
| Chernivtsi region | C23 | 62.4 | 99.6 | 1754 | 301,821.2 | 81.5 |
| Chernihiv region | C24 | 48.2 | 98.8 | 2078 | 171,315.3 | 173.6 |
| Regions of Ukraine | The Level of Profitability of Crop Production, % | |||||
|---|---|---|---|---|---|---|
| Cereals and Legumes | Sunflower | Sugar (Factory) Beets | Vegetables | Potatoes | Fruits and Berries | |
| x1 | x2 | x3 | x4 | x5 | x6 | |
| Vinnytsia region | 28.1 | 37.4 | −19.6 | −13.0 | −2.2 | 6.0 |
| Volyn region | 27.6 | 20.6 | −6.3 | 31.2 | −2.3 | 179.6 |
| Dnipropetrovsk region | 24.6 | 37.8 | 0.3 | 41.4 | 1.2 | 7.1 |
| Donetsk region | 23.8 | 32.6 | 0.0 | 27.9 | −4.2 | 4.8 |
| Zhytomyr region | 23.1 | 22.4 | −16.2 | 10.0 | 29.0 | 70.3 |
| Transcarpathian region | 18.3 | 3.7 | 0.0 | −22.8 | −19.5 | 16.5 |
| Zaporizhzhia region | 21.0 | 27.7 | 0.0 | 29.0 | 10.9 | −27.3 |
| Ivano-Frankivsk region | 6.2 | 4.0 | −9.0 | −7.5 | −2.8 | 50.8 |
| Kyiv region | 24.2 | 31.1 | −24.4 | 6.6 | 6.7 | −4.3 |
| Kirovohrad region | 20.5 | 30.6 | −39.7 | −60.8 | −7.1 | −27.2 |
| Luhansk region | 22.4 | 30.5 | 4.2 | −59.4 | 0.0 | −9.7 |
| Lviv region | 17.5 | 12.4 | 8.1 | 4.5 | 23.5 | −1.5 |
| Mykolaiv region | 32.2 | 38.0 | 0.0 | 15.6 | −21.7 | −29.8 |
| Odessa region | 28.1 | 30.8 | 0.0 | 28.1 | −3.9 | −2.2 |
| Poltava region | 23.9 | 31.5 | 3.2 | 5.4 | −43.4 | −1.7 |
| Rivne region | 17.9 | 19.5 | −49.6 | 4.0 | 53.6 | 16.7 |
| Sumy region | 28.6 | 35.8 | −6.7 | 6.8 | 12.0 | −6.7 |
| Ternopil region | 27.8 | 28.5 | −20.3 | −1.3 | −53.5 | 21.2 |
| Kharkiv region | 16.7 | 32.5 | −16.8 | −0.3 | 19.8 | −9.0 |
| Kherson region | 28.0 | 26.2 | 0.0 | 0.8 | 2.5 | −17.5 |
| Khmelnytsky region | 32.0 | 32.6 | −10.1 | 24.0 | 51.8 | 23.0 |
| Cherkasy region | 32.9 | 45.4 | −40.0 | 26.3 | 16.6 | −49.5 |
| Chernivtsi region | 9.7 | 34.1 | 0.0 | 181.3 | 50.9 | 6.9 |
| Chernihiv region | 17.9 | 28.1 | −19.8 | 21.0 | 20.3 | 38.5 |
| Regions of Ukraine | The Level of Profitability of Stockbreeding, % | |||||
|---|---|---|---|---|---|---|
| Milk | Cattle for Meat | Pigs for Meat | Sheep and Goats for Meat | Poultry for Meat | Eggs | |
| x1 | x2 | x3 | x4 | x5 | x6 | |
| Vinnytsia region | 17.9 | −7.7 | −4.9 | −31.3 | −8.7 | 7.5 |
| Volyn region | 30.6 | −0.8 | 14.7 | 31.6 | −8.7 | −96.8 |
| Dnipropetrovsk region | 24.4 | −14.3 | 8.6 | 11.4 | −22.1 | 13.8 |
| Donetsk region | 10.4 | −22.3 | −7.3 | −25.3 | −26.4 | 14.1 |
| Zhytomyr region | 13.7 | −25.4 | −4.2 | −65.1 | −7.3 | 22.1 |
| Transcarpathian region | −22.8 | −36.0 | −1.0 | −9.6 | 30.6 | −6.4 |
| Zaporizhzhia region | 6.0 | −36.5 | −12.7 | −29.9 | −6.6 | 14.4 |
| Ivano-Frankivsk region | 23.3 | −8.7 | 18.8 | 37.6 | 0.8 | −24.0 |
| Kyiv region | 8.7 | −16.6 | 15.4 | 1.3 | 18.6 | 14.2 |
| Kirovohrad region | 0.1 | −26.6 | −0.4 | −15.3 | 15.5 | −20.5 |
| Luhansk region | 6.1 | −30.4 | −27.9 | −17.9 | −22.5 | 39.6 |
| Lviv region | 5.9 | −7.5 | 3.2 | −3.0 | 4.4 | 13.4 |
| Mykolaiv region | 28.7 | −8.4 | 4.1 | −19.7 | −59.5 | −6.0 |
| Odessa region | 7.4 | −23.8 | −3.3 | −26.4 | −11.2 | −11.2 |
| Poltava region | 17.2 | −27.5 | −10.8 | −48.0 | −10.4 | 23.4 |
| Rivne region | 11.3 | −7.4 | −0.1 | 3.5 | 9.7 | 37.2 |
| Sumy region | 20.1 | −11.5 | 0.7 | −17.7 | −21.4 | −8.4 |
| Ternopil region | 12.6 | −10.4 | 21.8 | 22.7 | −21.7 | 32.4 |
| Kharkiv region | 14.7 | −18.8 | 4.3 | −47.2 | 17.2 | −22.0 |
| Kherson region | 13.6 | −15.1 | 8.9 | −51.5 | −72.5 | 0.3 |
| Khmelnytsky region | 23.8 | −19.1 | 21.1 | −7.6 | −8.3 | 15.5 |
| Cherkasy region | 17.0 | −17.2 | 3.1 | −4.2 | −17.2 | −76.1 |
| Chernivtsi region | 15.7 | −19.2 | −13.5 | −22.3 | −6.2 | 4.6 |
| Chernihiv region | 21.8 | −20.5 | −1.8 | −55.8 | −43.3 | −0.8 |
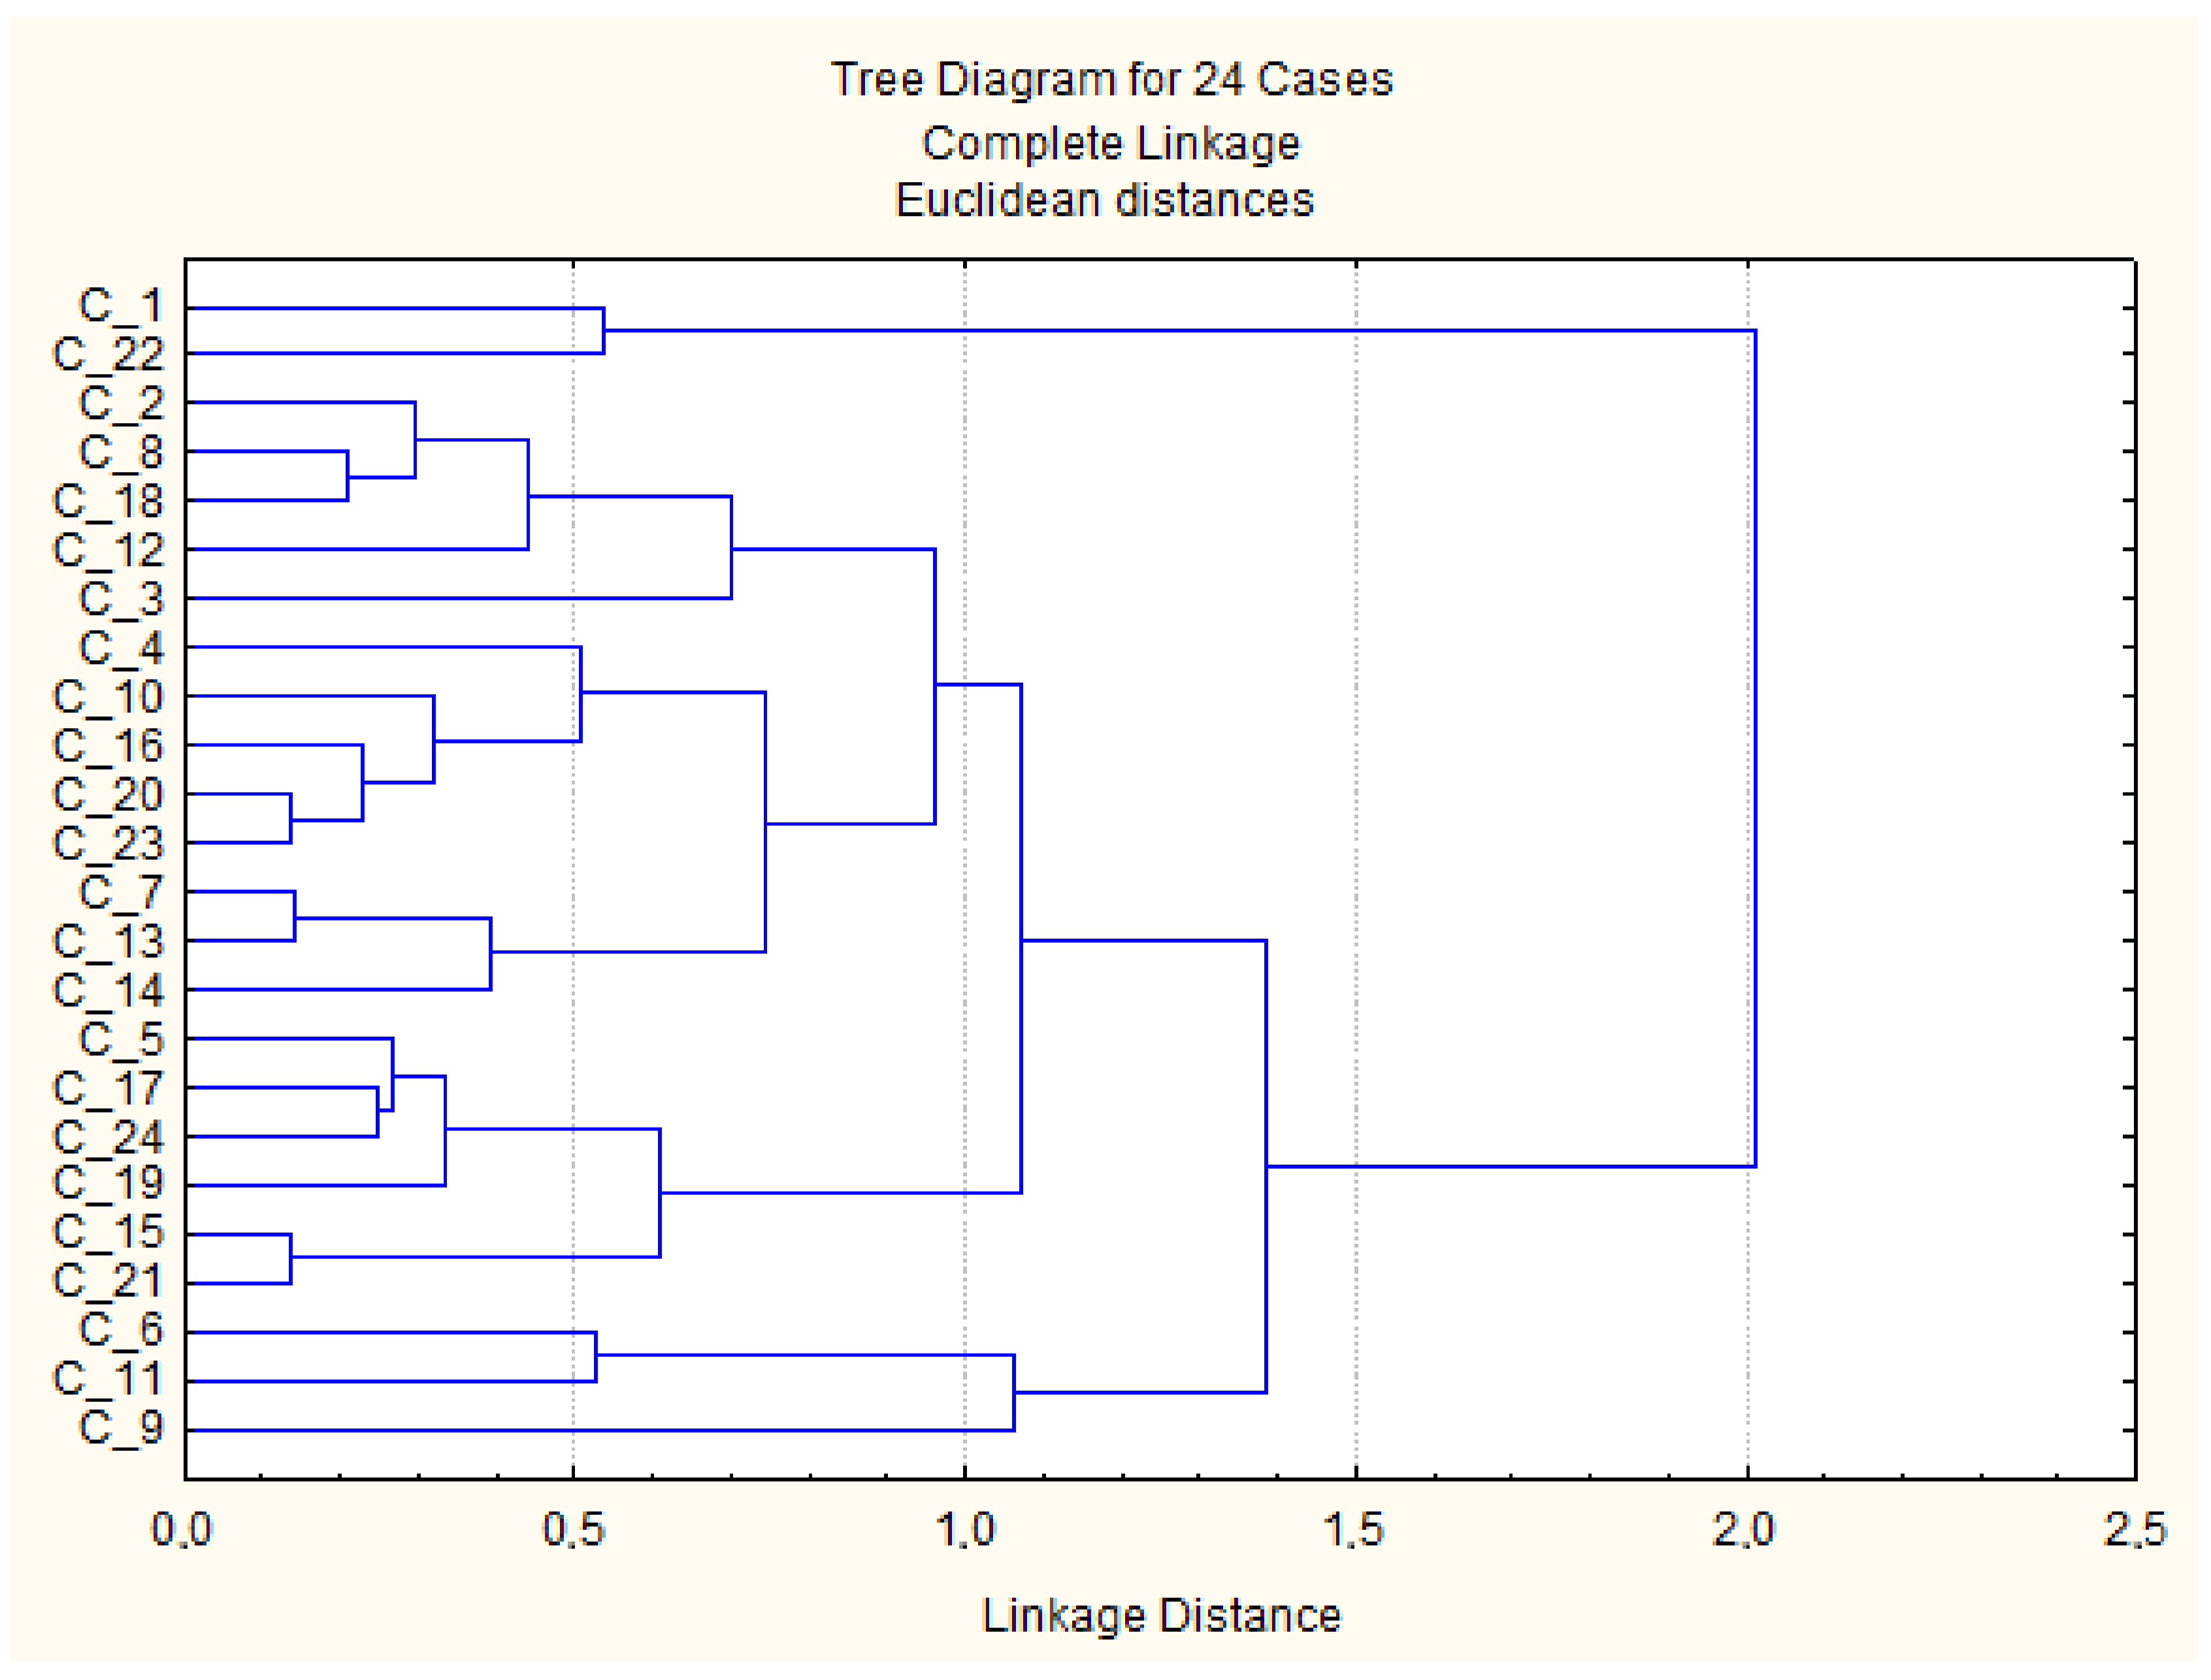
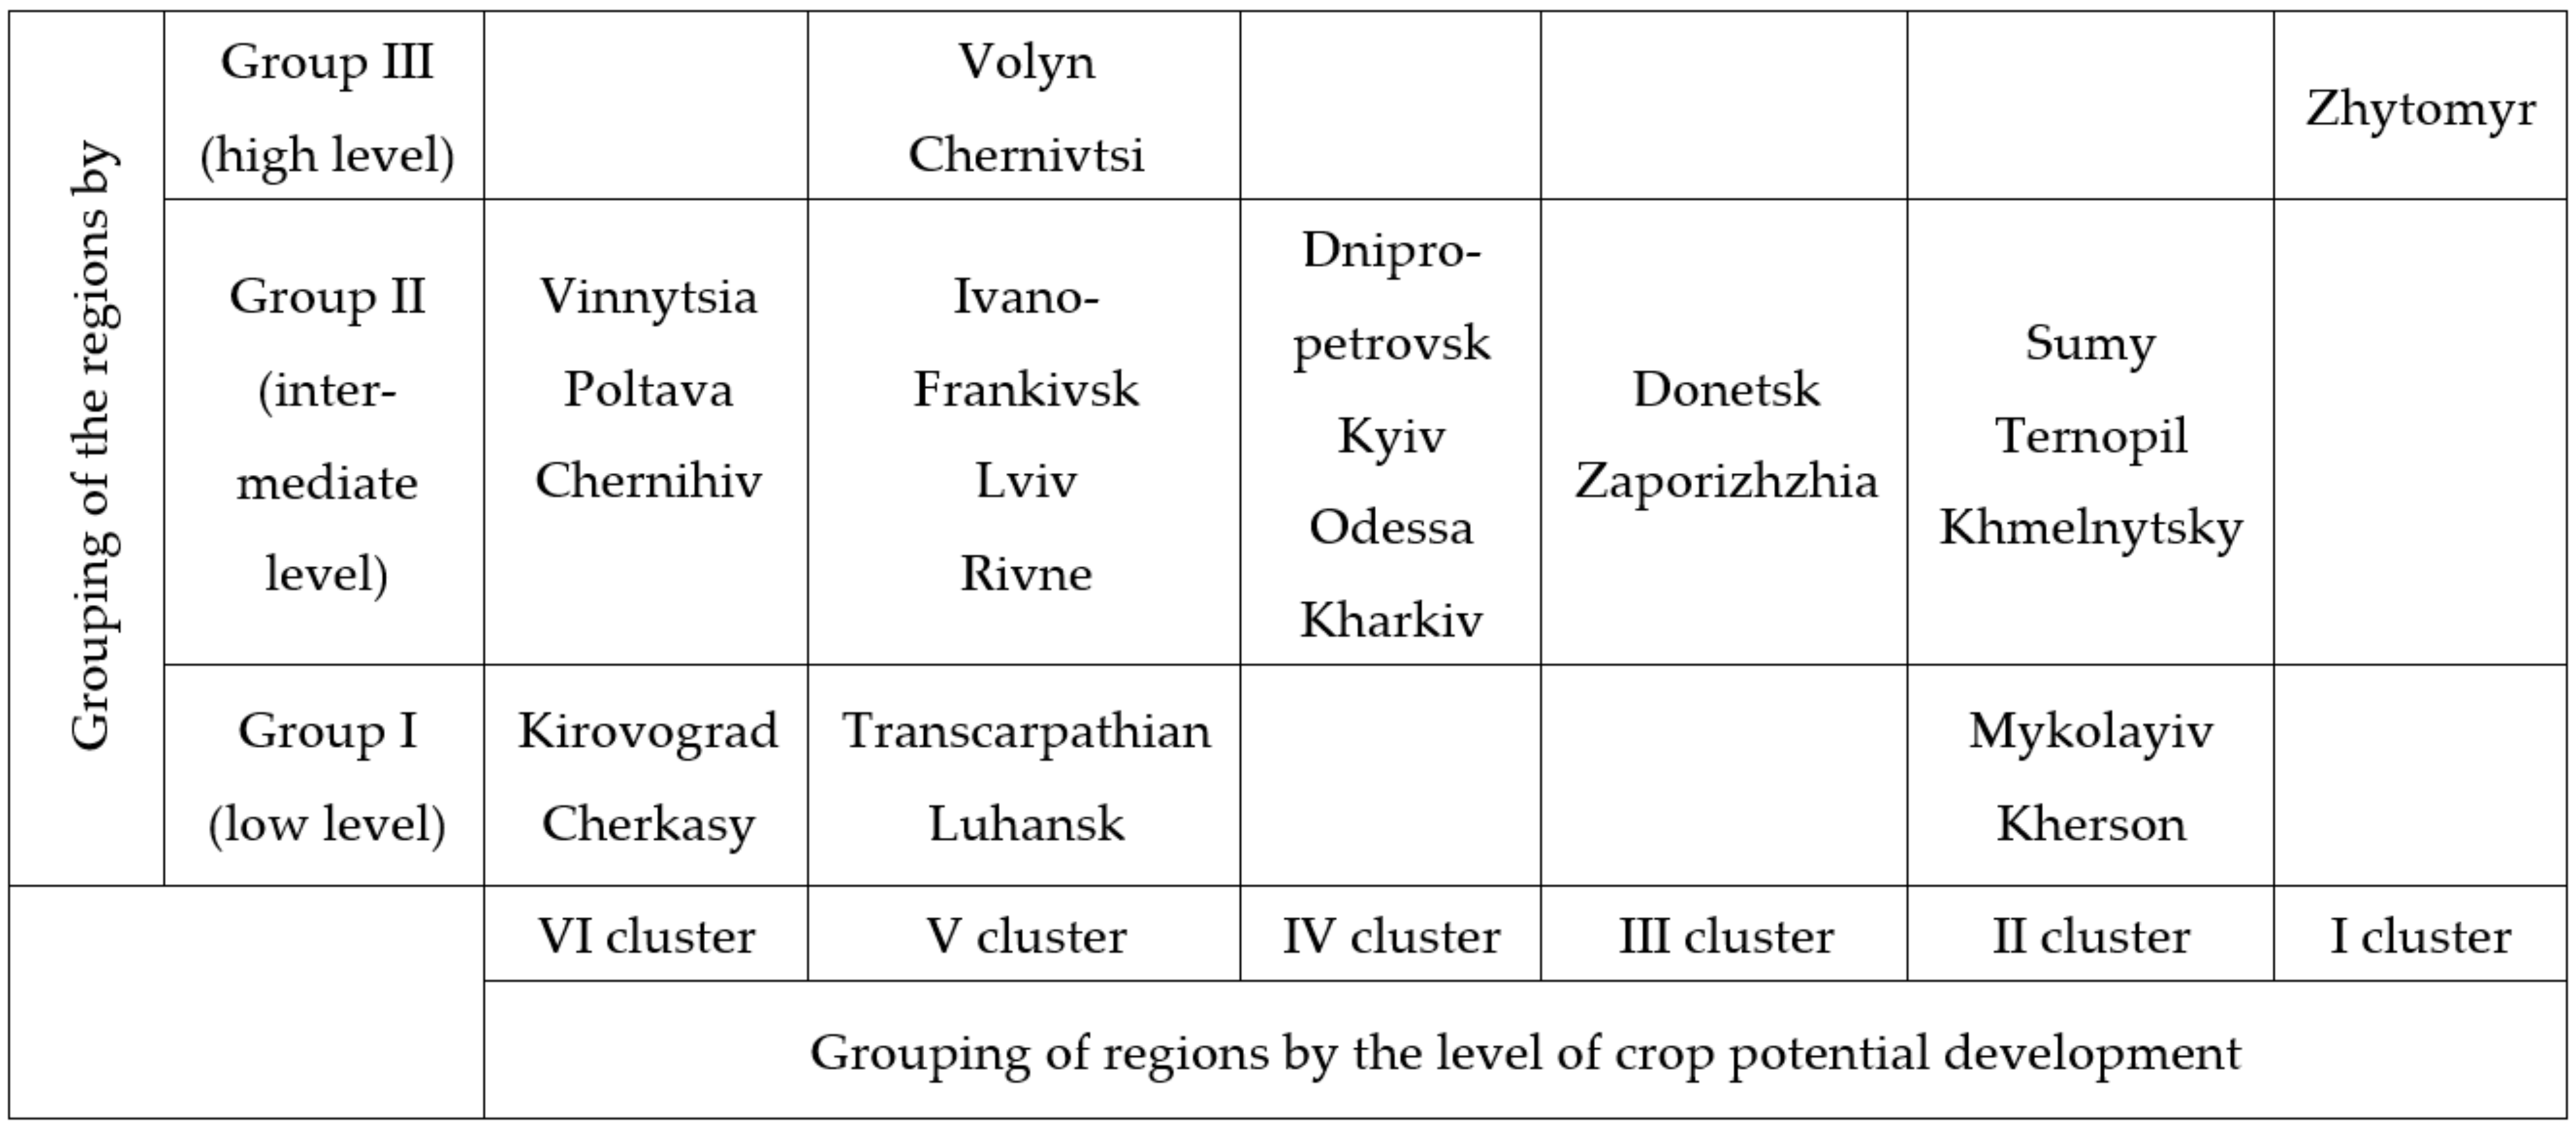
| I Cluster | II Cluster | III Cluster |
| Zhytomyr region (C5) Sumy region (C17) Ternopil region (C18) Khmelnytsky region (C21) | Mykolaiv region (C13) Kherson region (C20) | Donetsk region (C4) Zaporizhzhia region (C7) |
| IV Cluster | V Cluster | VI Cluster |
| Dnipropetrovsk region (C3) Kyiv region (C9) Odessa region (C14) Kharkiv region (C19) | Volyn region (C2) Transcarpathian region (C6) Ivano-Frankivsk region (C8) Luhansk region (C11) Lviv region (C12) Rivne region (C16) Chernivtsi region (C23) | Vinnytsia region (C1) Kirovohrad region (C10) Poltava region (C15) Cherkasy region (C22) Chernihiv region (C24) |
| Cluster | Number of Regions | Sown Area of Agricultural Crops, in Thousands of Hectares | Crop Production Indices of Farms of All Categories, % | Crop Production Per Capita, UAH | Labour Productivity at Agricultural Enterprises, UAH | Gross Harvest of Cereals and Legumes, in Thousands of Tons |
|---|---|---|---|---|---|---|
| I | 4 | 1057.25 | 109.575 | 7779 | 433781 | 3346.775 |
| II | 2 | 1480.5 | 104.7 | 7848 | 252,842.1 | 2470.55 |
| III | 2 | 1338 | 84.5 | 2403.5 | 185,809.45 | 1788.85 |
| IV | 4 | 1699.25 | 111.15 | 3680 | 271,125.4 | 3929.525 |
| V | 7 | 504.14 | 105.65 | 2958.42 | 300,543.22 | 980.41 |
| VI | 5 | 1501.4 | 122.85 | 9914.4 | 324,371.86 | 5113.92 |
| I Cluster | II Cluster |
| Volyn region (C2) Dnipropetrovsk region (C3) Ivano-Frankivsk region (C8) Kyiv region (C9) Lviv region (C12) Ternopil region (C18) | Zhytomyr region (C5) Odessa region (C14) Poltava region (C15) Sumy region (C17) Kharkiv region (C19) Khmelnytsky region (C21) Chernihiv region (C24) |
| III Cluster | IV Cluster |
| Donetsk region (C4) Transcarpathian region (C6) Zaporizhzhia region (C7) Kirovohrad region (C10) Luhansk region (C11) Mykolaiv region (C13) Rivne region (C16) Kherson region (C20) Chernivtsi region (C23) | Vinnytsia region (C1) Cherkasy region (C22) |
| Cluster | Number of Regions | Volume of Farm Animals Breeding, Thousands of Tons | Stockbreeding Production Indices of Farms of All Categories, % | Stockbreeding Products Per Capita, UAH | Labour Productivity at Agricultural Enterprises, UAH | Number of Cattle, Thousands of Heads |
|---|---|---|---|---|---|---|
| I | 6 | 208.52 | 102.43 | 1851.17 | 462,548.38 | 135.88 |
| II | 7 | 82.19 | 99.37 | 1925.14 | 195,673.00 | 186.64 |
| III | 9 | 68.49 | 101.08 | 1410.00 | 239,768.53 | 90.08 |
| IV | 2 | 462.70 | 102.95 | 4653.50 | 581,773.25 | 200.20 |
| Regions of Ukraine | Distance to the Ideal Point, djo | The Value of the Advantage Function, f (xj) | Integral Level of Product Profitability | Regions of Ukraine | Distance to the Ideal Point, djo | The Value of the Advantage Function, f (xj) | Integral Level of Product Profitability |
|---|---|---|---|---|---|---|---|
| Crop production | Stockbreeding production | ||||||
| Kirovograd | 67.00 | 0.09 | Low level | Kherson | 29.42 | 0.18 | Low level |
| Luhansk | 63.57 | 0.14 | Volyn | 29.04 | 0.19 | ||
| Cherkasy | 57.81 | 0.22 | Cherkasy | 27.55 | 0.23 | ||
| Mykolayiv | 56.68 | 0.23 | Chernihiv | 26.49 | 0.26 | ||
| Transcarpathian | 56.13 | 0.24 | Zhytomyr | 24.03 | 0.33 | ||
| Kherson | 55.71 | 0.24 | Mykolayiv | 24.03 | 0.33 | ||
| Poltava | 55.35 | 0.25 | Average level | Kharkiv | 22.41 | 0.36 | |
| Vinnytsia | 54.72 | 0.26 | Poltava | 21.63 | 0.40 | Average level | |
| Ternopil | 54.40 | 0.26 | Odessa | 20.54 | 0.43 | ||
| Kharkiv | 54.29 | 0.26 | Luhansk | 20.25 | 0.43 | ||
| Zaporizhzhia | 53.36 | 0.28 | Zaporizhzhia | 20.05 | 0.44 | ||
| Kyiv | 53.18 | 0.28 | Donetsk | 19.97 | 0.44 | ||
| Sumy | 52.92 | 0.28 | Transcarpathian | 19.32 | 0.46 | ||
| Lviv | 52.55 | 0.29 | Sumy | 19.08 | 0.47 | ||
| Rivne | 50.91 | 0.31 | Kirovograd | 19.07 | 0.47 | ||
| Odessa | 50.05 | 0.32 | Vinnytsia | 18.53 | 0.48 | ||
| Ivano-Frankivsk | 49.22 | 0.33 | Chernivtsi | 18.23 | 0.49 | ||
| Donetsk | 49.05 | 0.34 | Ivano-Frankivsk | 14.52 | 0.54 | ||
| Dnipropetrovsk | 46.66 | 0.37 | Dnipropetrovsk | 13.73 | 0.62 | High level | |
| Khmelnytsky | 45.54 | 0.38 | Khmelnytsky | 13.72 | 0.62 | ||
| Chernihiv | 44.73 | 0.40 | Lviv | 12.95 | 0.64 | ||
| Zhytomyr | 42.38 | 0.43 | High level | Ternopil | 11.95 | 0.67 | |
| Chernivtsi | 35.69 | 0.52 | Kyiv | 10.95 | 0.69 | ||
| Volyn | 33.23 | 0.55 | Rivne | 10.21 | 0.72 | ||
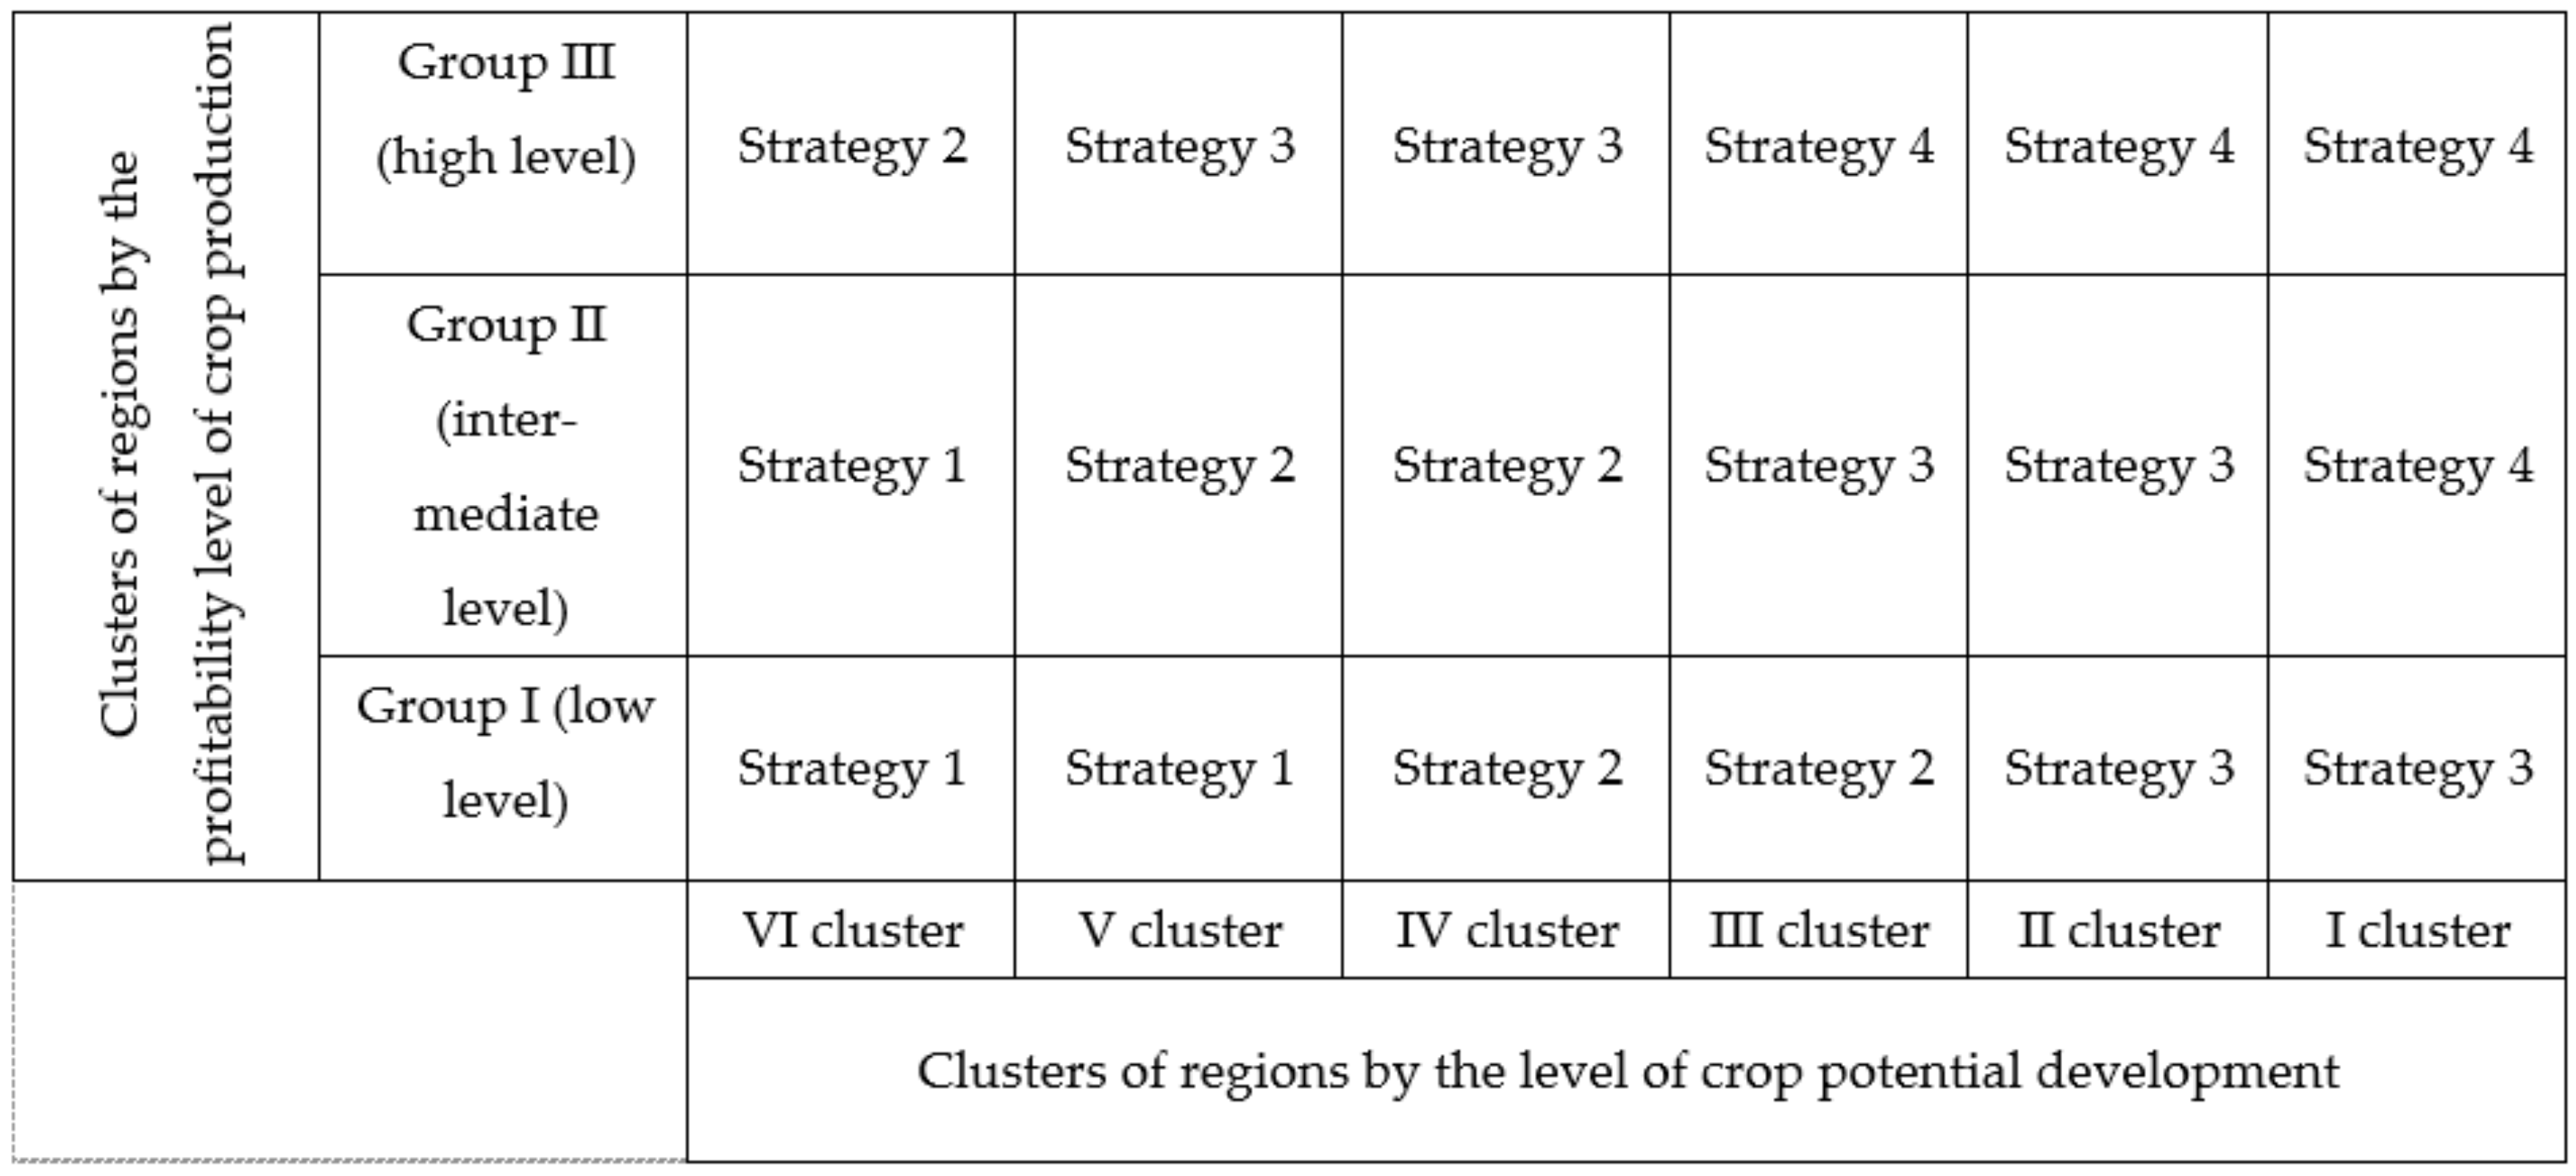
| Strategies | Characteristics |
|---|---|
| Strategy 1 (support strategy) | The strategy is aimed at support of regions with low productivity in the field of crop production. The biggest role should be given to the state support. As part of this strategy, diversification should be considered, and unprofitable organisations should be reoriented to other activities or growing other crops. |
| Strategy 2 (development strategy) | The strategy envisages supporting the development of regions in crop production, in particular, the provision of cheap loans, or state financing of promising projects. Enterprises should use the experience of competitors to improve product quality. |
| Strategy 3 (competition strategy) | The strategy envisages the development of measures to strengthen the competitive advantages of the region as well as enter international agro-markets. |
| Strategy 4 (leadership strategy) | The strategy envisages the development of measures to maintain the leading positions of the regions, maintaining high production results, introduction of innovative methods, and adaptation of developed countries’ experience in crop production. |
| Components of Resource Potential | Strategy 1 | Strategy 2 | Strategy 3 | Strategy 4 |
|---|---|---|---|---|
| Production potential | 1. Ensuring a stable volume of manufactured products. 2. Detailing of the production plan. | 1. Ensuring a stable volume of manufactured products. 2. Increasing the rate of return. | 1. Consideration of export opportunities. 2. Production increase. 3. Quality control of planting raw materials and plants during their maturation. | 1. Production increase. 2. Detailing of the production plan. |
| Innovation and investment potential | 1. Involvement of specialists in the field of crop production. 2. Search for sources of funding—public and private. | 1. Cooperation with educational institutions. 2. Leasing and purchase of new processing equipment. | 1. Leasing and purchase of new processing equipment. 2. Cooperation of farms within the regions. | 1. Growing environmentally friendly innovative products. 2. Search for foreign sources of funding. |
| Natural resource potential | 1. Quality land use. 2. Use of crop by-products for fertiliser. 3. Cooperation with the peasants. | 1. Quality land use. 2. Lease of land shares from the state. | 1. Quality land use. 2. Application of soil protection technologies of tillage. 3. Land melioration and chemicalisation. | 1. Rational use of land resources. 2. Conservation of heavily eroded and sloping lands. |
| Human resource potential | 1. Professional training. 2. Increasing the number of jobs. 3. Decent wages. | 1. Improving the professional qualification level of workers. 2. Increase in wages. | 1. Improving the professional qualification level of workers. 2. Increasing the number of jobs. | 1. Training of staff abroad. 2. Increasing the number of jobs. 3. Increasing labour productivity. |
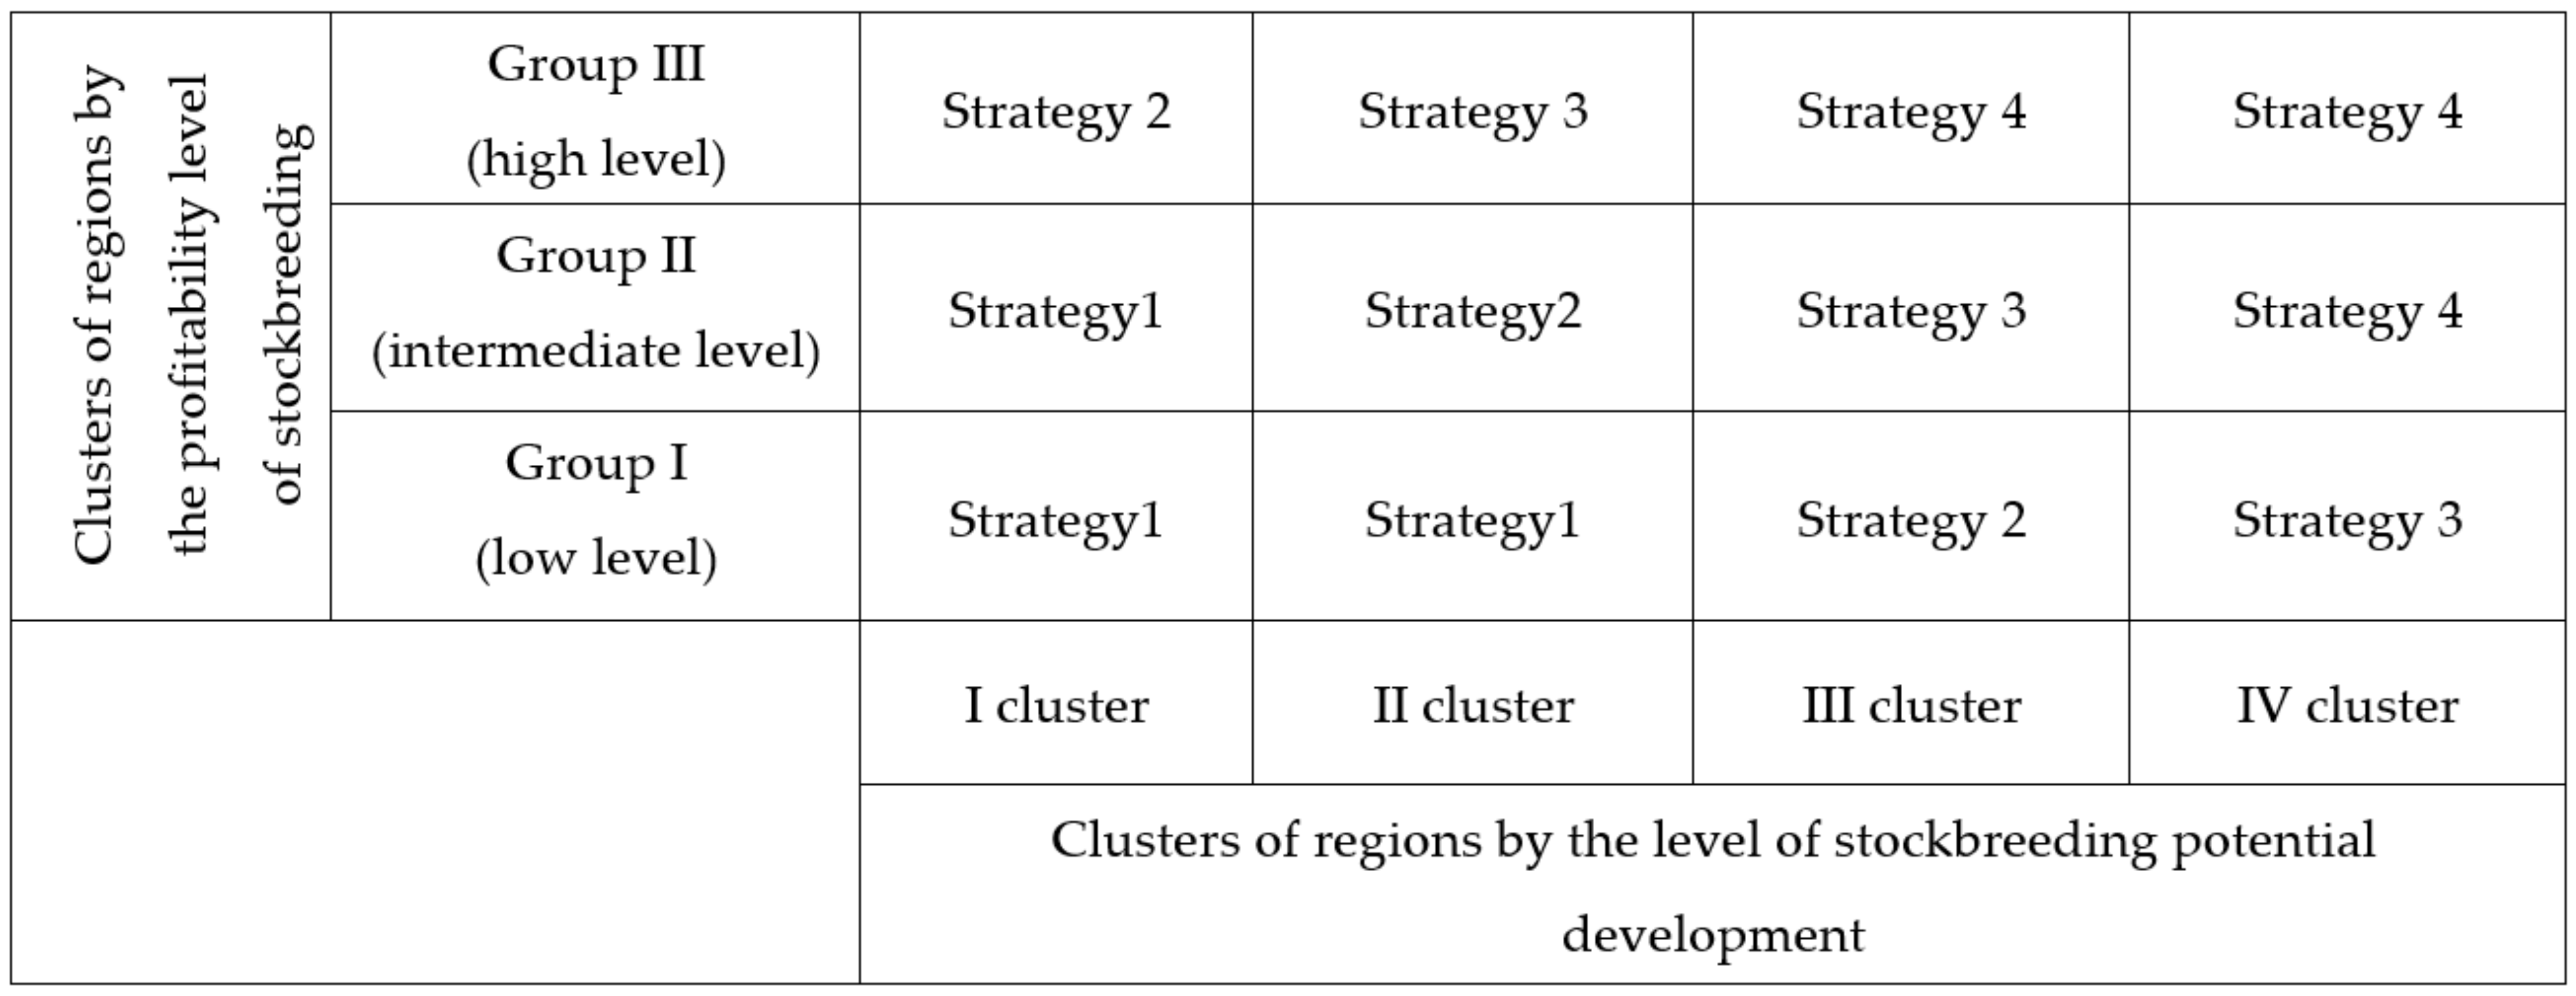
| Strategies | Characteristics |
|---|---|
| Strategy 1 (support strategy) | The strategy is aimed at strengthening state support for the stockbreeding sector, including the introduction of a simplified taxation system, loosening of regulation, restoring the state insurance support program, facilitating access to cheap credit resources, etc. |
| Strategy 2 (development strategy) | The strategy envisages renewal and modernisation of stockbreeding facilities, investment attraction, introduction of new forms and methods, etc. |
| Strategy 3 (competition strategy) | The strategy envisages the search for competitive advantages in the industry by improving product quality, entering the EU market, and increasing the investment attractiveness of the region. |
| Strategy 4 (leadership strategy) | The strategy envisages increasing efficiency using innovative and advanced production and processing technologies, promoting the development of diversified and innovative production structures. |
| Components of Potential | Strategy 1 | Strategy 2 | Strategy 3 | Strategy 4 |
|---|---|---|---|---|
| Production potential | 1. Quality control of manufactured products. 2. Increase in organic fertilisers for intra-district sales and use. 3. Concentration and specialisation. | 1. Intensification of the industry. 2. Improving the professional qualification level of workers. | 1. Rational system of herd reproduction. 2. Creating a strong fodder provision. | 1. Modernisation of the production base. 2. Concentration and specialisation. 3. Diversification of production. |
| Innovation and investment potential | 1. Improving the management of innovation processes. 2. Attracting innovative capital. 3. Participation in state innovation and investment programs. | 1. Increasing the innovative attractiveness of the region. 2. Marketing of agricultural products. 3. Conducting research. | 1. Business performance insurance. 2. Search for funding sources—public and private. 3. Modernisation of the technological provision. | 1. Implementation of mechanical processing of raw materials. 2. Implementation of socio-economic target programs. |
| Natural resource potential | 1. Increasing the number of cattle 2. Directed breeding of young cattle. | 1. Increasing the productivity of animals by expanding their diet. 2. Improvement of natural pastures. | 1. Improvement of natural pastures. 2. Increasing the average daily growth in live weight of animals. | 1. Purchase of animals from households to increase the animal amount. 2. Increasing the volume of egg harvesting. |
| Human resource potential | 1. Training of staff abroad. 2. Increasing the number of jobs. | 1. Increasing productivity. 2. Raising the level of wages. | 1. Labour cooperation. 2. Raising the level of wages. | 1. Increasing labour productivity. 2. Rational use of human resources. 3. Provision of medical services. |
| Strategy | Type of the Strategy | Measures to Increase the Level of Agricultural Development within the Strategy Implementation |
|---|---|---|
| Strategy 1 | Support strategy |
|
| Strategy 2 | Conservation strategy |
|
| Strategy 3 | Change strategy |
|
| Strategy 4 | Concentration strategy |
|
| Strategy 5 | Growth strategy |
|
| Strategy 6 | Leadership strategy |
|
Publisher’s Note: MDPI stays neutral with regard to jurisdictional claims in published maps and institutional affiliations. |
© 2021 by the authors. Licensee MDPI, Basel, Switzerland. This article is an open access article distributed under the terms and conditions of the Creative Commons Attribution (CC BY) license (https://creativecommons.org/licenses/by/4.0/).
Share and Cite
Shpak, N.; Kulyniak, I.; Gvozd, M.; Vveinhardt, J.; Horbal, N. Formulation of Development Strategies for Regional Agricultural Resource Potential: The Ukrainian Case. Resources 2021, 10, 57. https://0-doi-org.brum.beds.ac.uk/10.3390/resources10060057
Shpak N, Kulyniak I, Gvozd M, Vveinhardt J, Horbal N. Formulation of Development Strategies for Regional Agricultural Resource Potential: The Ukrainian Case. Resources. 2021; 10(6):57. https://0-doi-org.brum.beds.ac.uk/10.3390/resources10060057
Chicago/Turabian StyleShpak, Nestor, Ihor Kulyniak, Maryana Gvozd, Jolita Vveinhardt, and Natalia Horbal. 2021. "Formulation of Development Strategies for Regional Agricultural Resource Potential: The Ukrainian Case" Resources 10, no. 6: 57. https://0-doi-org.brum.beds.ac.uk/10.3390/resources10060057