1. Introduction
The development of rich mineral resources in the Arctic has been of global interest for several decades [
1,
2,
3]. Five countries with coastal access to the Arctic seas (Canada, USA, Russia, Norway, and Denmark) have long been seeking opportunities to explore and extract or expand their exclusive rights to these resources [
1,
4]. The development of the Arctic is of great interest to both business and science communities around the world [
5,
6,
7], including Russia, which is primarily due to the depletion of proven natural resources in traditional mining regions.
Oil and gas are the most attractive for exploration and production in the Arctic zone, and the sustainable development of the country is impossible without the constant replenishment of proven oil and gas reserves, since 30–40% of the Russian budget depends on oil and gas revenues [
5,
6,
7,
8,
9,
10]. In addition to hydrocarbon resources, the Arctic territory contains reserves and resources of platinum metals, nickel and cobalt, copper, oil and gas, and so on [
11].
The successful development of technologically complex Arctic fields implies the creation of a technologically modern, competitive industry [
12]. With the development of the mining industry, including the oil and gas industry as the largest driver, the Arctic could potentially attract over
$100 billion of investments [
13].
Nevertheless, the development of the Arctic mineral resource potential is limited by political, climate, environmental, and other problems [
14,
15], which are characterized by an outflow of human resources. The rapid population growth that occurred during the Soviet period ceased at the end of the 1980s, after which all regions of the Arctic experienced a sharp decline in population, primarily due to migration outflow.
The need to increase industrial production combined with the reduction in the working-age population is one of the most important problems in the development of the Arctic mineral resource potential, namely, a lack of human resources. Therefore, the study of migration attractiveness as a factor of the successful development of the Arctic mineral resource potential is relevant.
The development of Arctic territories and mineral resource potential, especially the functioning of high-tech industries, is impossible without skilled personnel [
16,
17]. However, residing in the Arctic is not appealing due to difficult living and working conditions, including a severe climate, poor infrastructure (including healthcare), large distances from economic and cultural centers, and other factors [
18,
19,
20,
21,
22,
23].
The Arctic presents unique challenges for human occupation, with snow cover for up to 10 months a year, up to 24 h of darkness during the winter, a limited variety of resources, and sea-ice-dependent travel and food [
24]. People in the Arctic face many interrelated social and economic challenges that add to the many difficulties of daily life in the region [
25].
The regions of the Russian Federation located entirely or partially beyond the Arctic Circle are leaders in terms of the number of people involved in territorial movement. These regions are not very attractive as places of permanent residence and work, which is confirmed by an analysis conducted by the authors. We assume that there is a need to create certain social and economic incentives that compensate for the specific working and living conditions in the Arctic to attract labor resources. The combination of such incentives in the region impacts the level of its socio-economic development and reflects its attractiveness.
The research goal is to identify how the attractiveness of an Arctic region affects the migration of the labor resources necessary to ensure its development. This will allow us to effectively regulate and predict the inflow and outflow of the population in Arctic regions, which is essential for the development of its mineral resource potential.
In the research process, extensive practical materials and academic literature were analyzed. Particular attention was paid to the United Nations Development program and reports, the Directorate-General for Regional and Urban Policy of European Commission report, the report of The Reason Public Policy Institute in the USA, and publications by international experts in scientific electronic and printed journals such as “Energy Research”, “Social Science”, “Marine Policy”, “Polar Science”, and others.
2. Materials and Methods
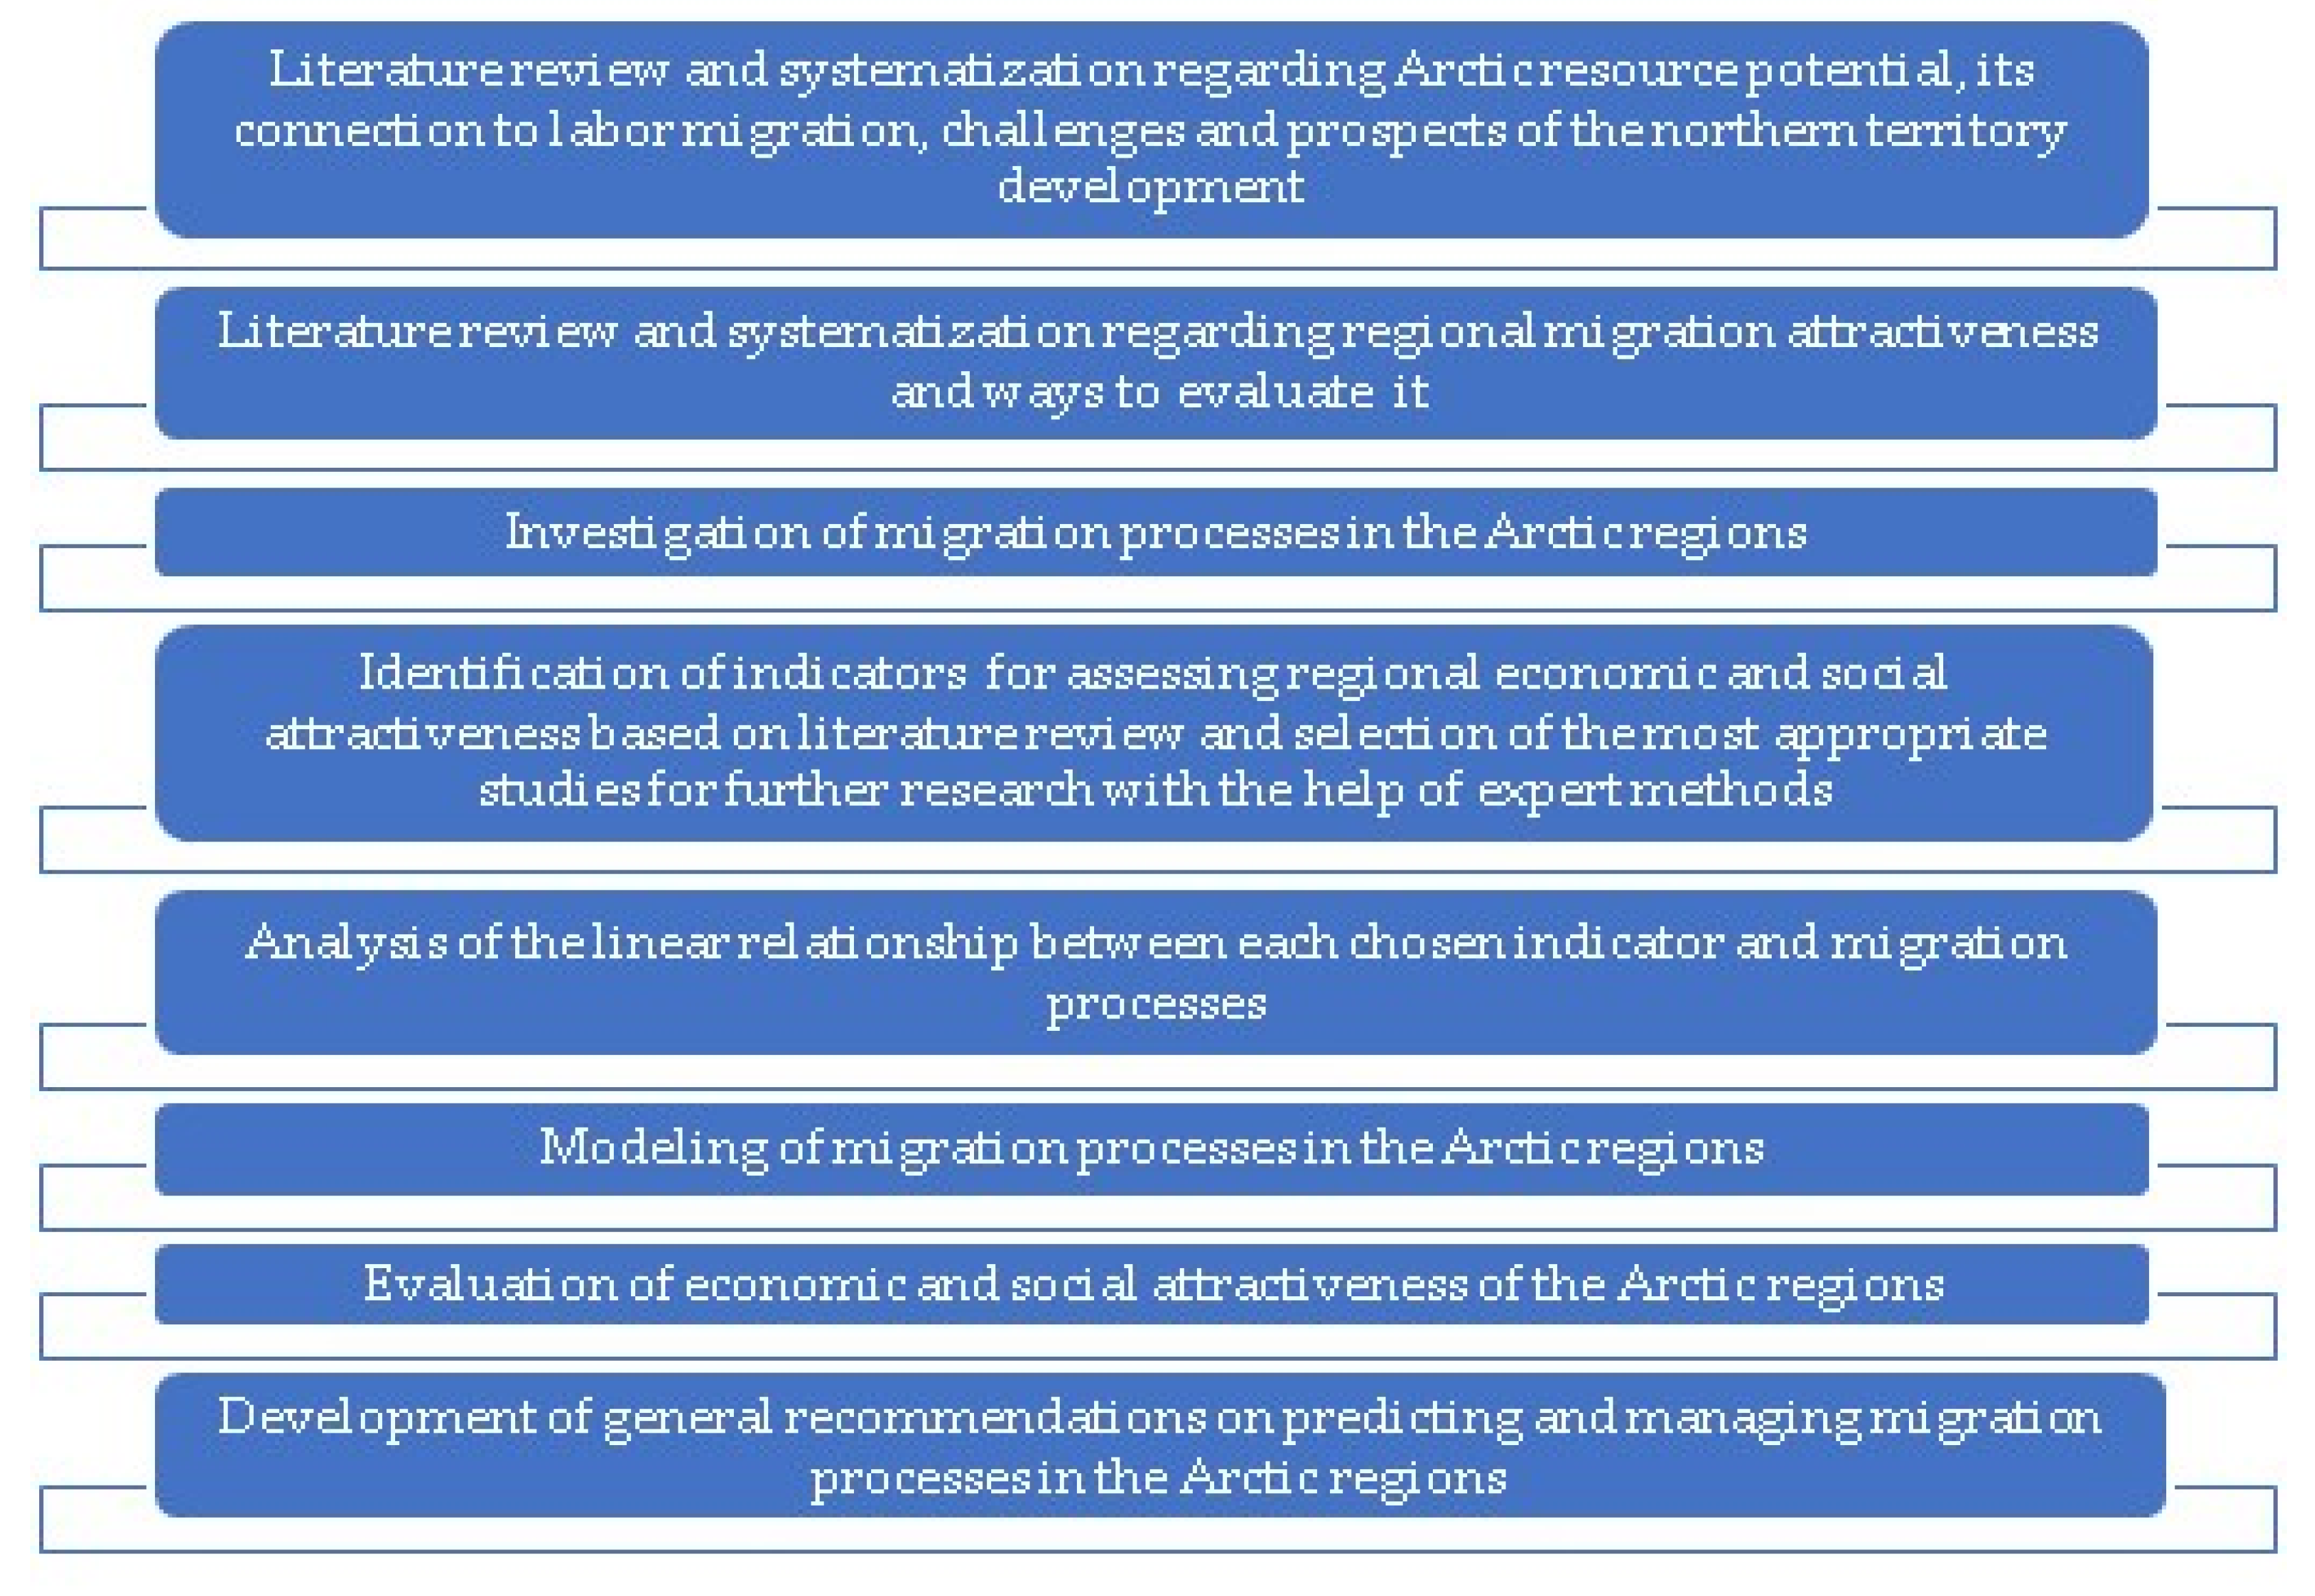
In the first stages of the research, desk studies were carried out based on an academic literature review focused on the Arctic resource potential; northern territory development; the definition of the concepts of migration, economic and social attractiveness, and regional competitiveness; and approaches to their assessment. We identified the role of resource potential in the Russian economy and the main challenges and prospects of the Arctic region and analyzed approaches and indicators for assessing regional attractiveness.
The analysis of the literature described above led us to the first research hypothesis:
To confirm this hypothesis, we investigated key indicators that reflect migration processes in the Russian Arctic regions—the number of arrivals and departures in the region from 2010 to 2019. To this end, we analyzed time series of official state statistics and used a graphical method and arithmetic calculations.
Based on the analysis of migration indicators’ dynamics, we formed the second research hypothesis:
- 2.
The migration processes taking place in the Arctic regions depend on the level of attractiveness of the region, which can be determined by a number of social and economic indicators.
In order to choose the number of indicators for assessing the regional economic and social attractiveness, the following process was implemented. In the first stage, the authors reviewed the literature and created a list of the most common quantitative indicators, which were readily found in official Russian statistics. Then, we used an individual expert survey and interviewed representatives from Russian universities and scientific centers (Saint-Petersburg Polytechnical University, Saint-Petersburg Mining University, Saint-Petersburg State University, Kola Scientific Center of the Russian Academy of Sciences), as well as representatives from mining and energy companies (PJSC Gazpromneft, PJSC Gazprom). The experts were chosen on the basis of their ability to quickly communicate with the researchers, specific knowledge in the research field, high level of erudition, and industrial or scientific experience. The authors asked the experts to choose 5 social and 5 economic indicators that, in their opinion, could be used to assess regional attractiveness. The survey was conducted online by sending the form (
Appendix A) to the participants through e-mail. The information in the responses was processed, and the most frequently mentioned indicators in the experts’ answers were selected. Thus, the experts helped the authors to create a list of 12 social and economic indicators affecting the migration attractiveness of the Arctic regions.
Then, we performed a correlation analysis to identify linear relationships between each of the 12 regional attractiveness and migration indicators. Based on the statistical analysis, we identified social and economic indicators that could potentially be used to model migration processes in the Arctic regions.
The third research hypothesis was Equationted as follows:
- 3.
Modern tools of the complex-valued economy can be successfully used to model migration processes in the Arctic regions.
To test this hypothesis, we applied methods for analyzing the complex-valued economy to create econometric models. Four simple linear regression models were formed with the identified social and economic indicators.
Finally, we aimed to determine which of the four Arctic regions under consideration (Murmansk region, Nenets Autonomous district, Yamalo-Nenets Autonomous district, and Chukotka Autonomous district) is more appealing to working migrants in terms of its social and economic attractiveness. For this purpose, we converted the value of each indicator to a value on a relative scale using the “maximum–minimum” method. The attractiveness of the regions was assessed by calculating integral indicators as weighted averages of specific social and economic indicators.
The structure of the research is presented in
Figure 1.
3. Results
3.1. Resource Potential of the Russian Arctic and Its Role in the Russian Economy
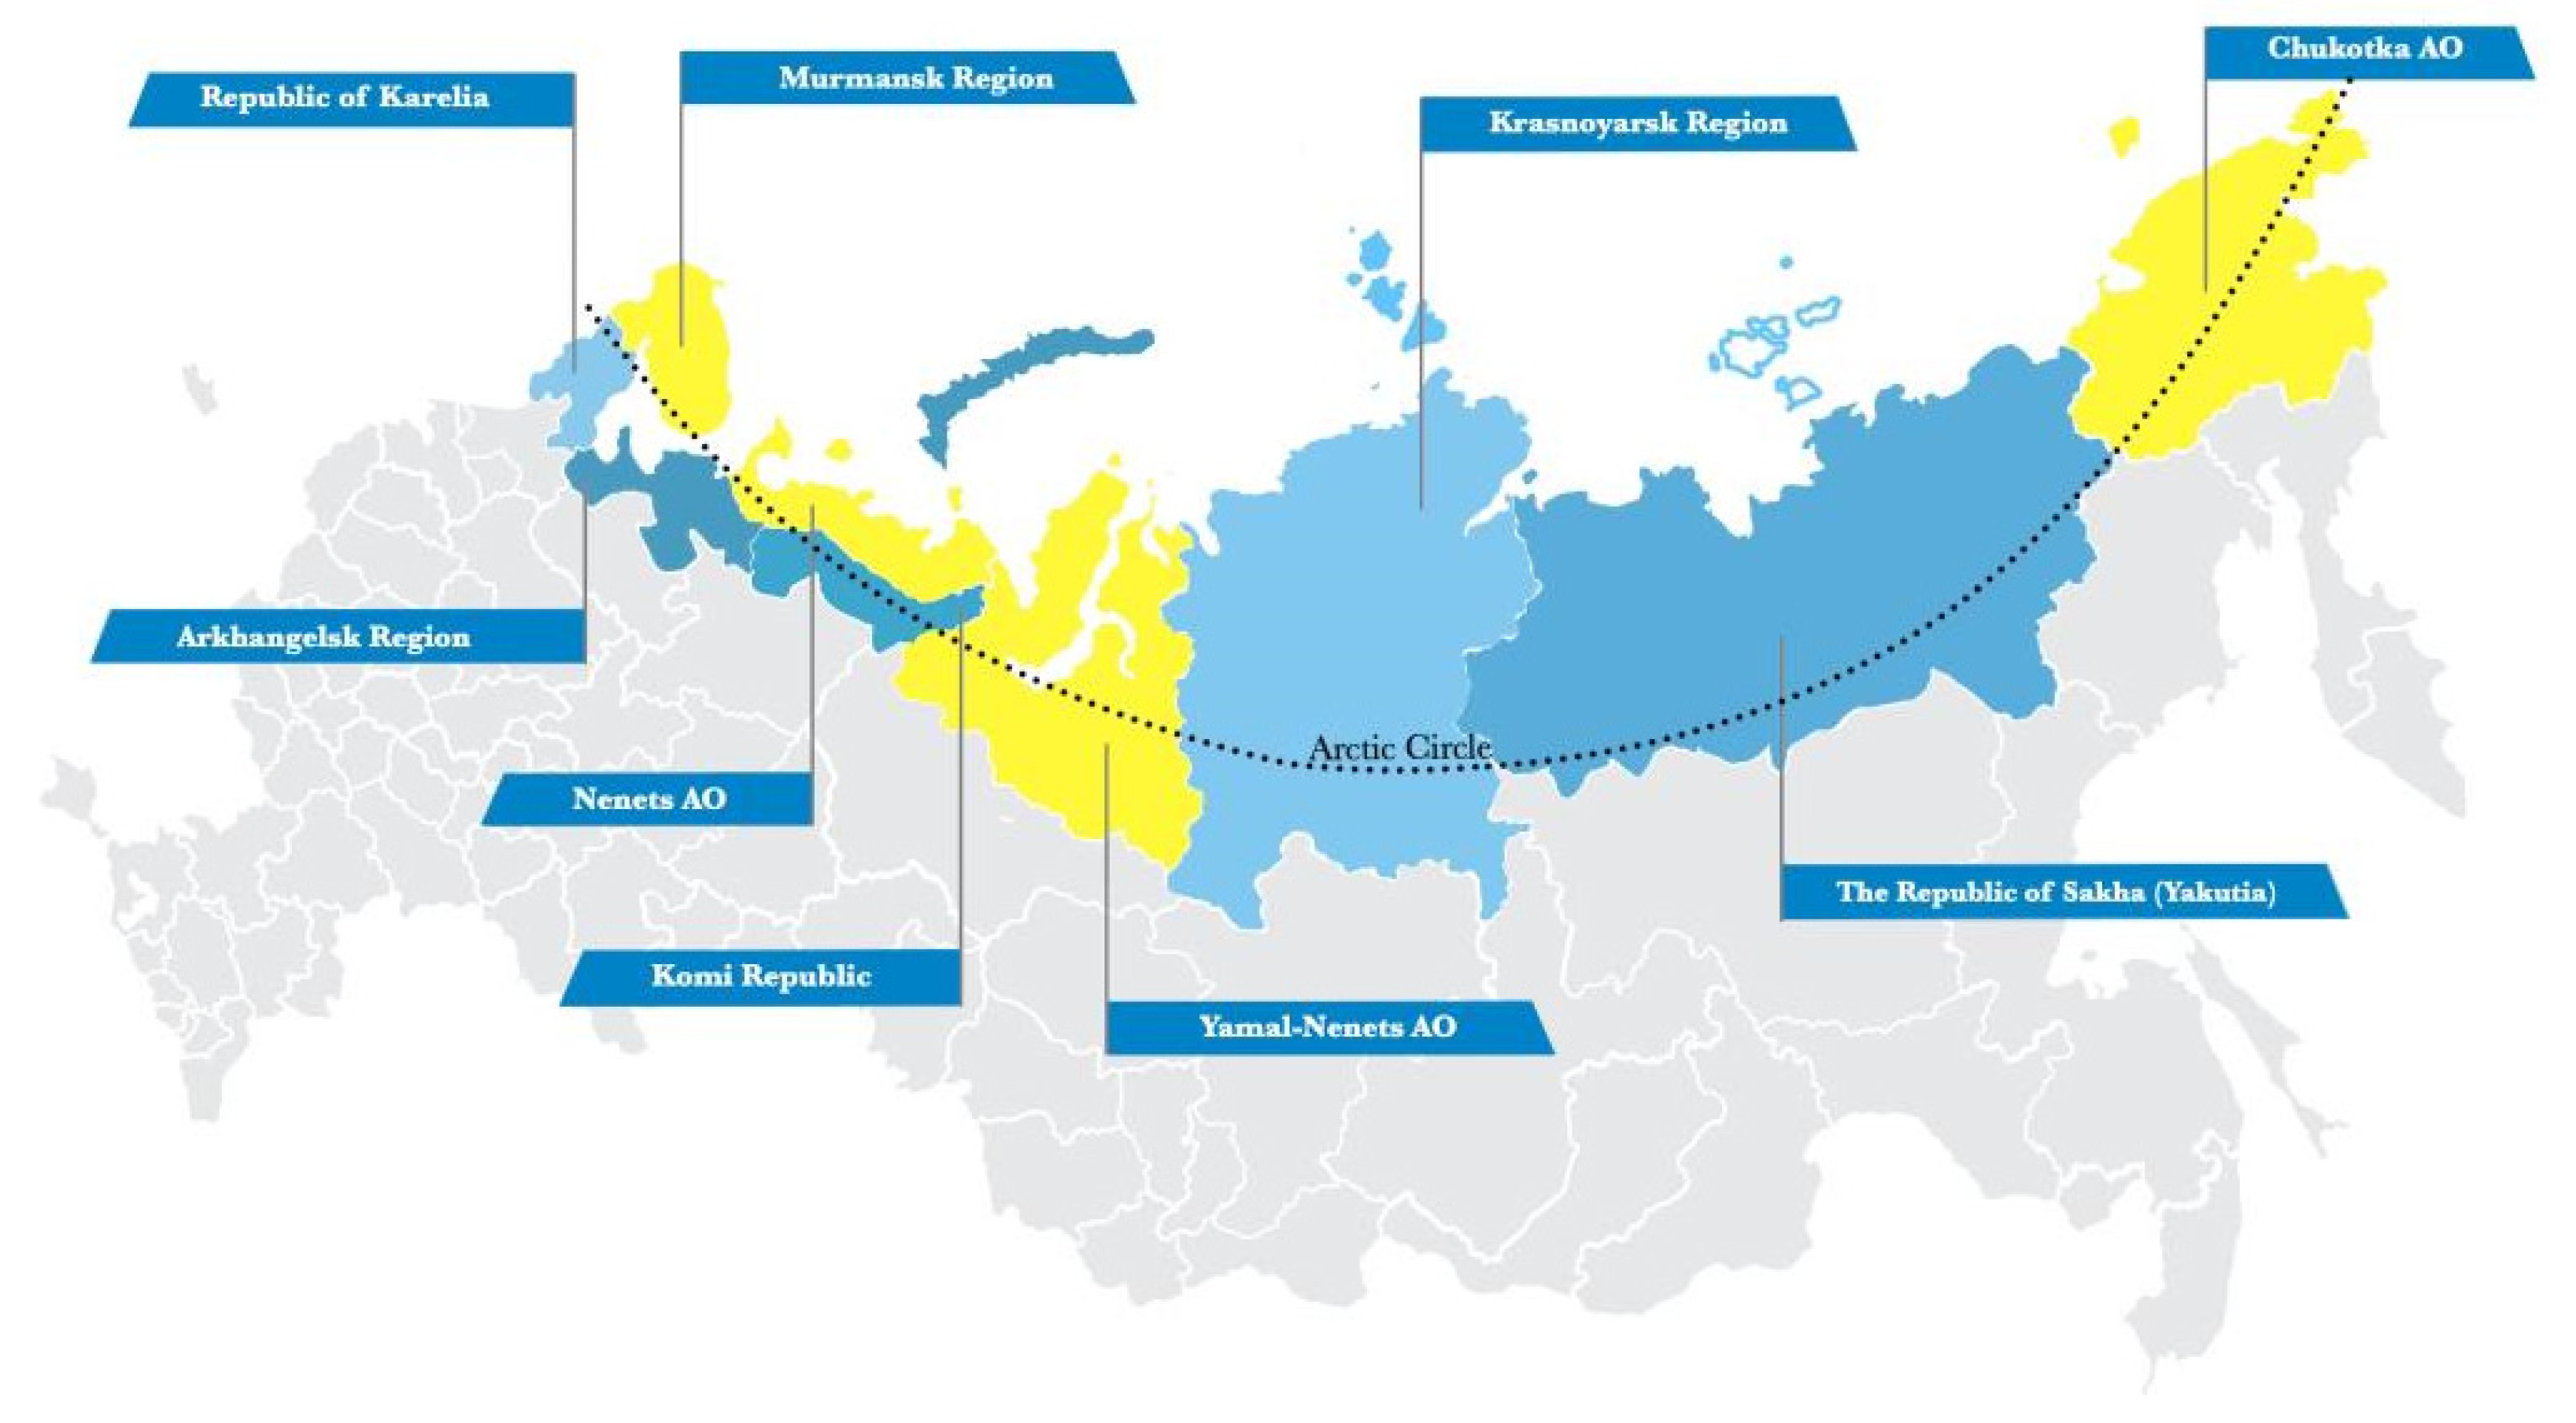
The Arctic zone of the Russian Federation covers an area of about 9 million km
2; it is home to more than 2.5 million people, which is about 40% of the population of the entire Arctic. The Arctic zone of the Russian Federation includes seven regions: the Republic of Sakha (Yakutia); the Murmansk, Arkhangelsk, and Krasnoyarsk regions; and the Nenets, Yamalo-Nenets, and Chukotka Autonomous districts (
Figure 2) [
26].
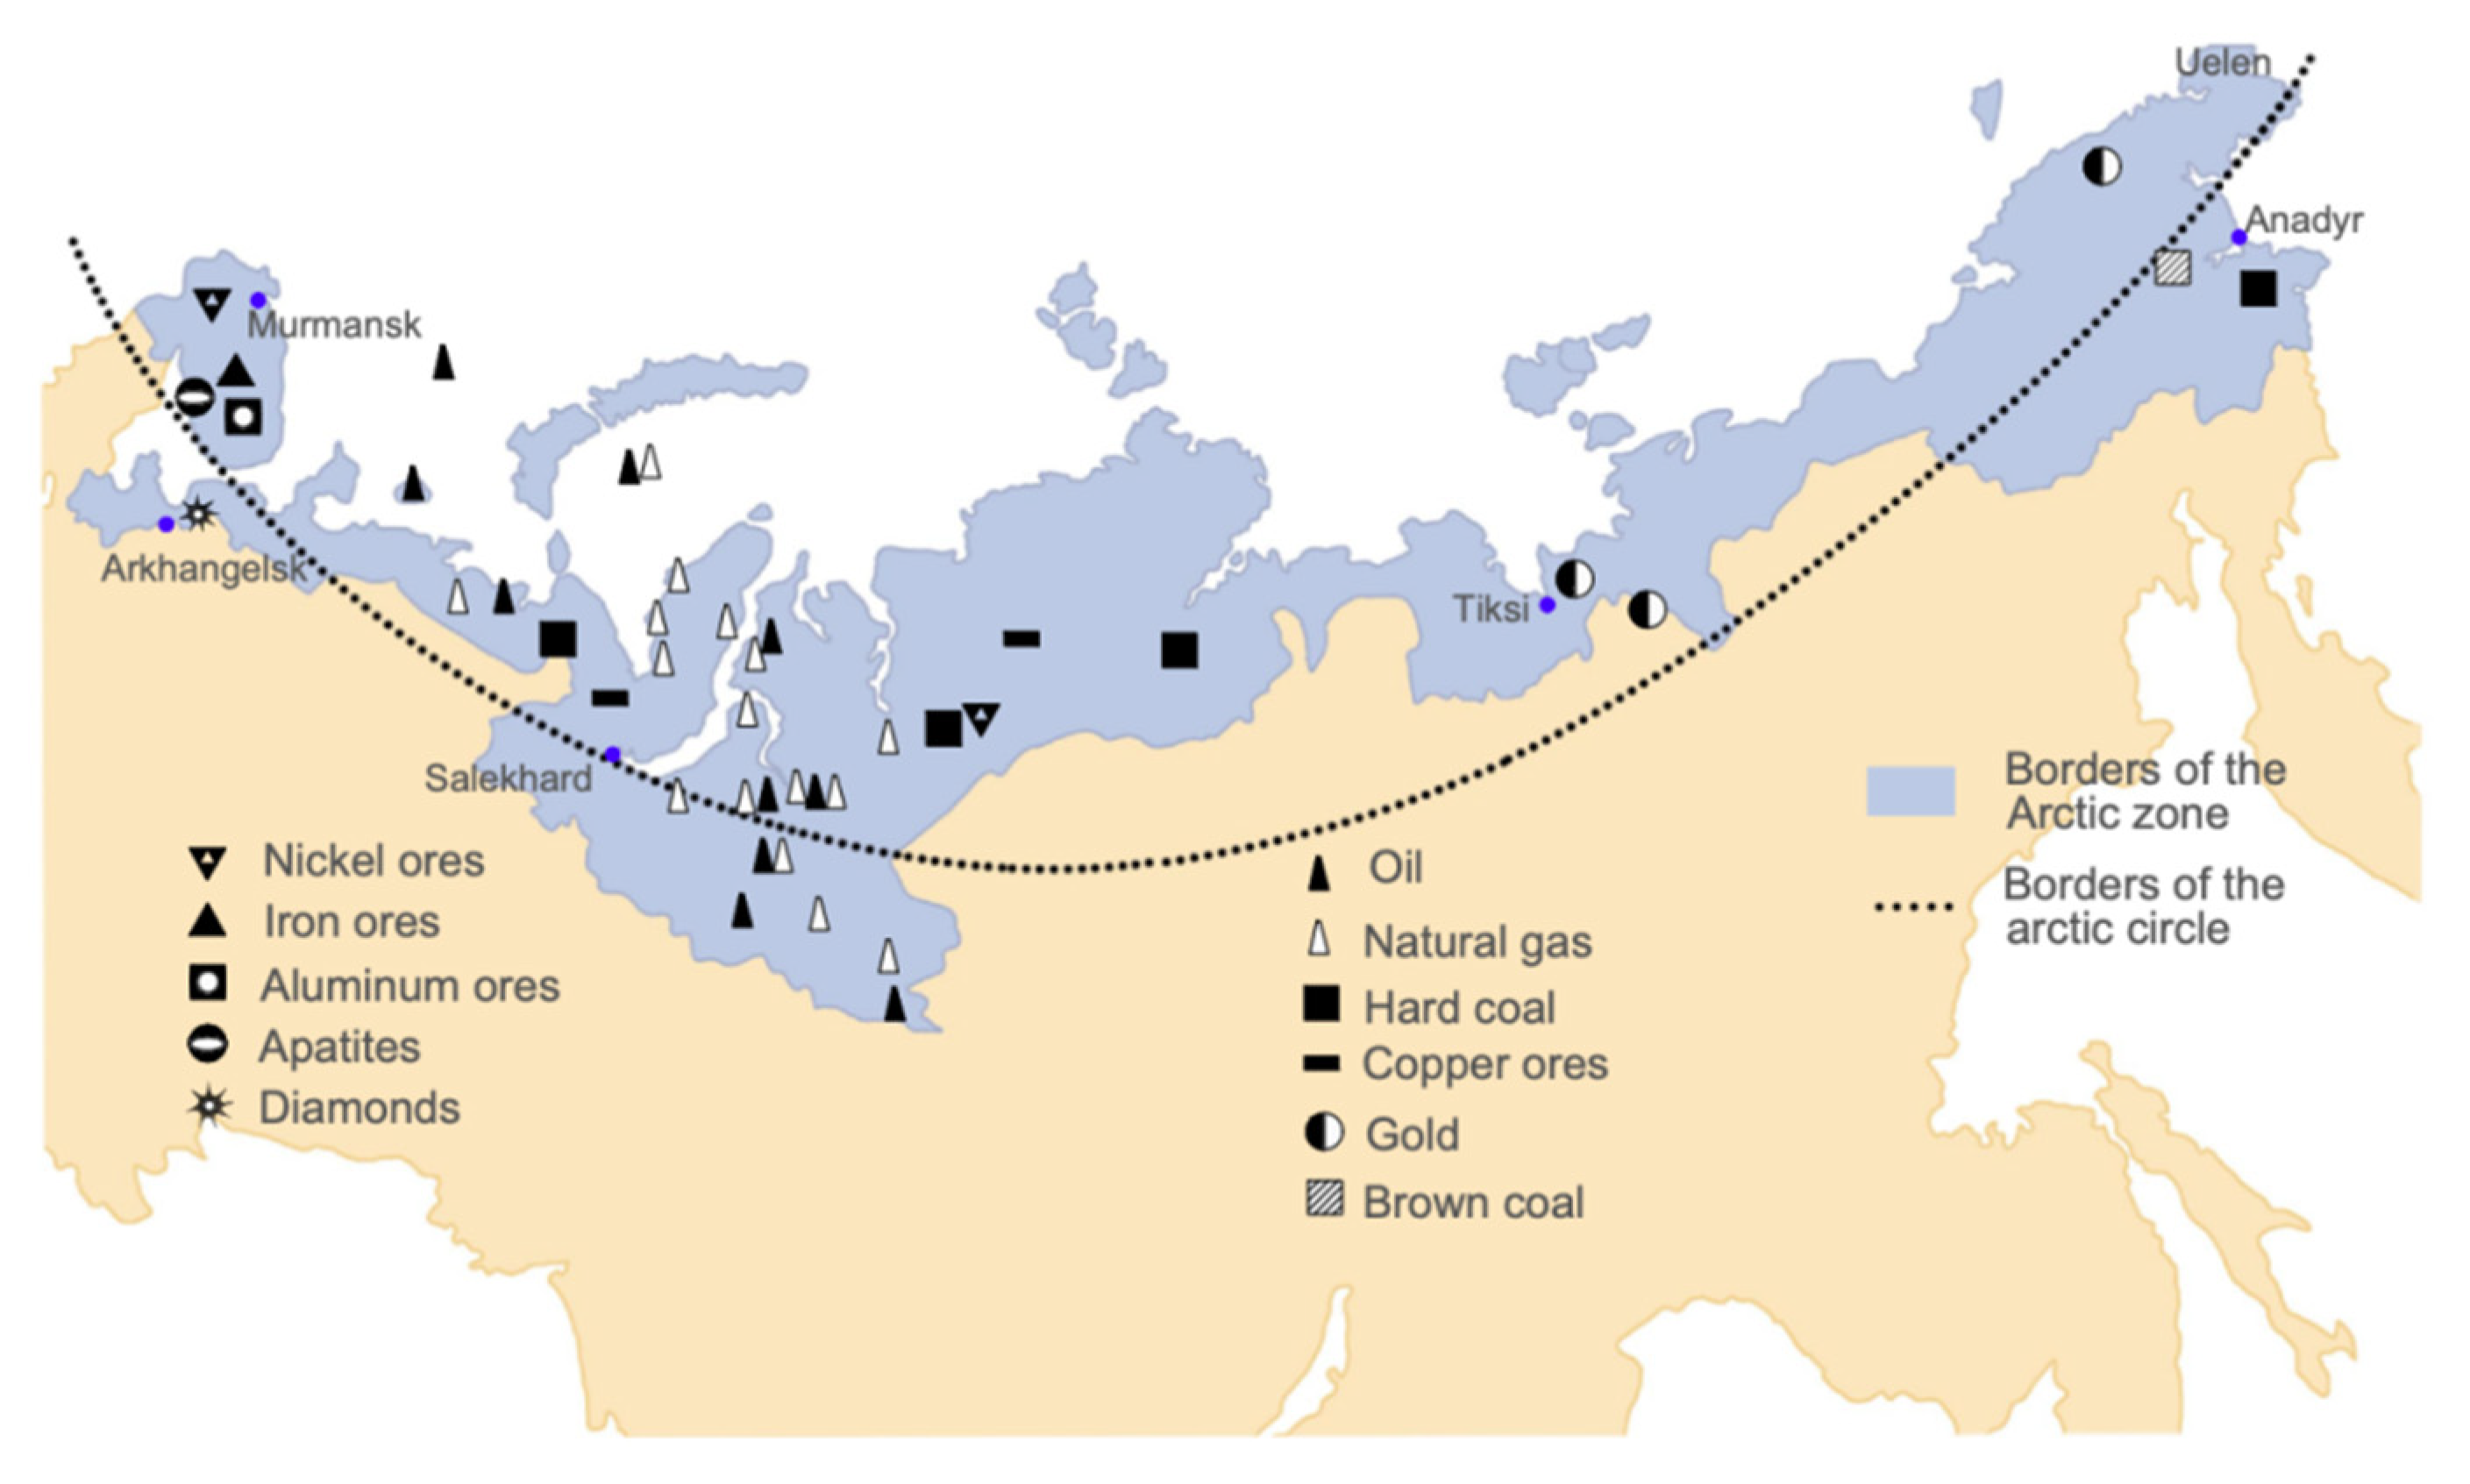
The Arctic is a territory rich in natural resources with strategic geopolitical importance. The Arctic contains more than 97% of Russia’s reserves of platinoids, 43% of the tin reserves, and a significant amount of nickel, titanium, and apatite ores and rare earth metals. The proven reserves provide almost 98% of the internal production of platinum, 100% of its titanium, zirconium, rare earth metal, and apatite ores, and more than 97% of its nickel. In the Arctic, about half of the volume of copper and bauxite is extracted, and up to a quarter of the production of diamonds, gold and silver, iron ores, and coal are mined [
11] (
Figure 3).
According to the Minister of Natural Resources of the Russian Federation (Dmitry Kobylkin), the Russian Arctic zone is estimated to have 7.3 billion tons of oil reserves, 2.7 billion tons of gas condensate, and about 55 trillion cubic meters of natural gas. The Arctic produces 17% of all Russian oil and 83% of its gas. The Yamalo-Nenets Autonomous district has the greatest potential. It accounts for approximately 43.5% of the initial total resources of the Arctic zone. Approximately 41% of the region’s oil and gas resources are located on the Arctic shelf [
11,
29]. The largest fields of the Russian Arctic shelf are presented in
Table 1.
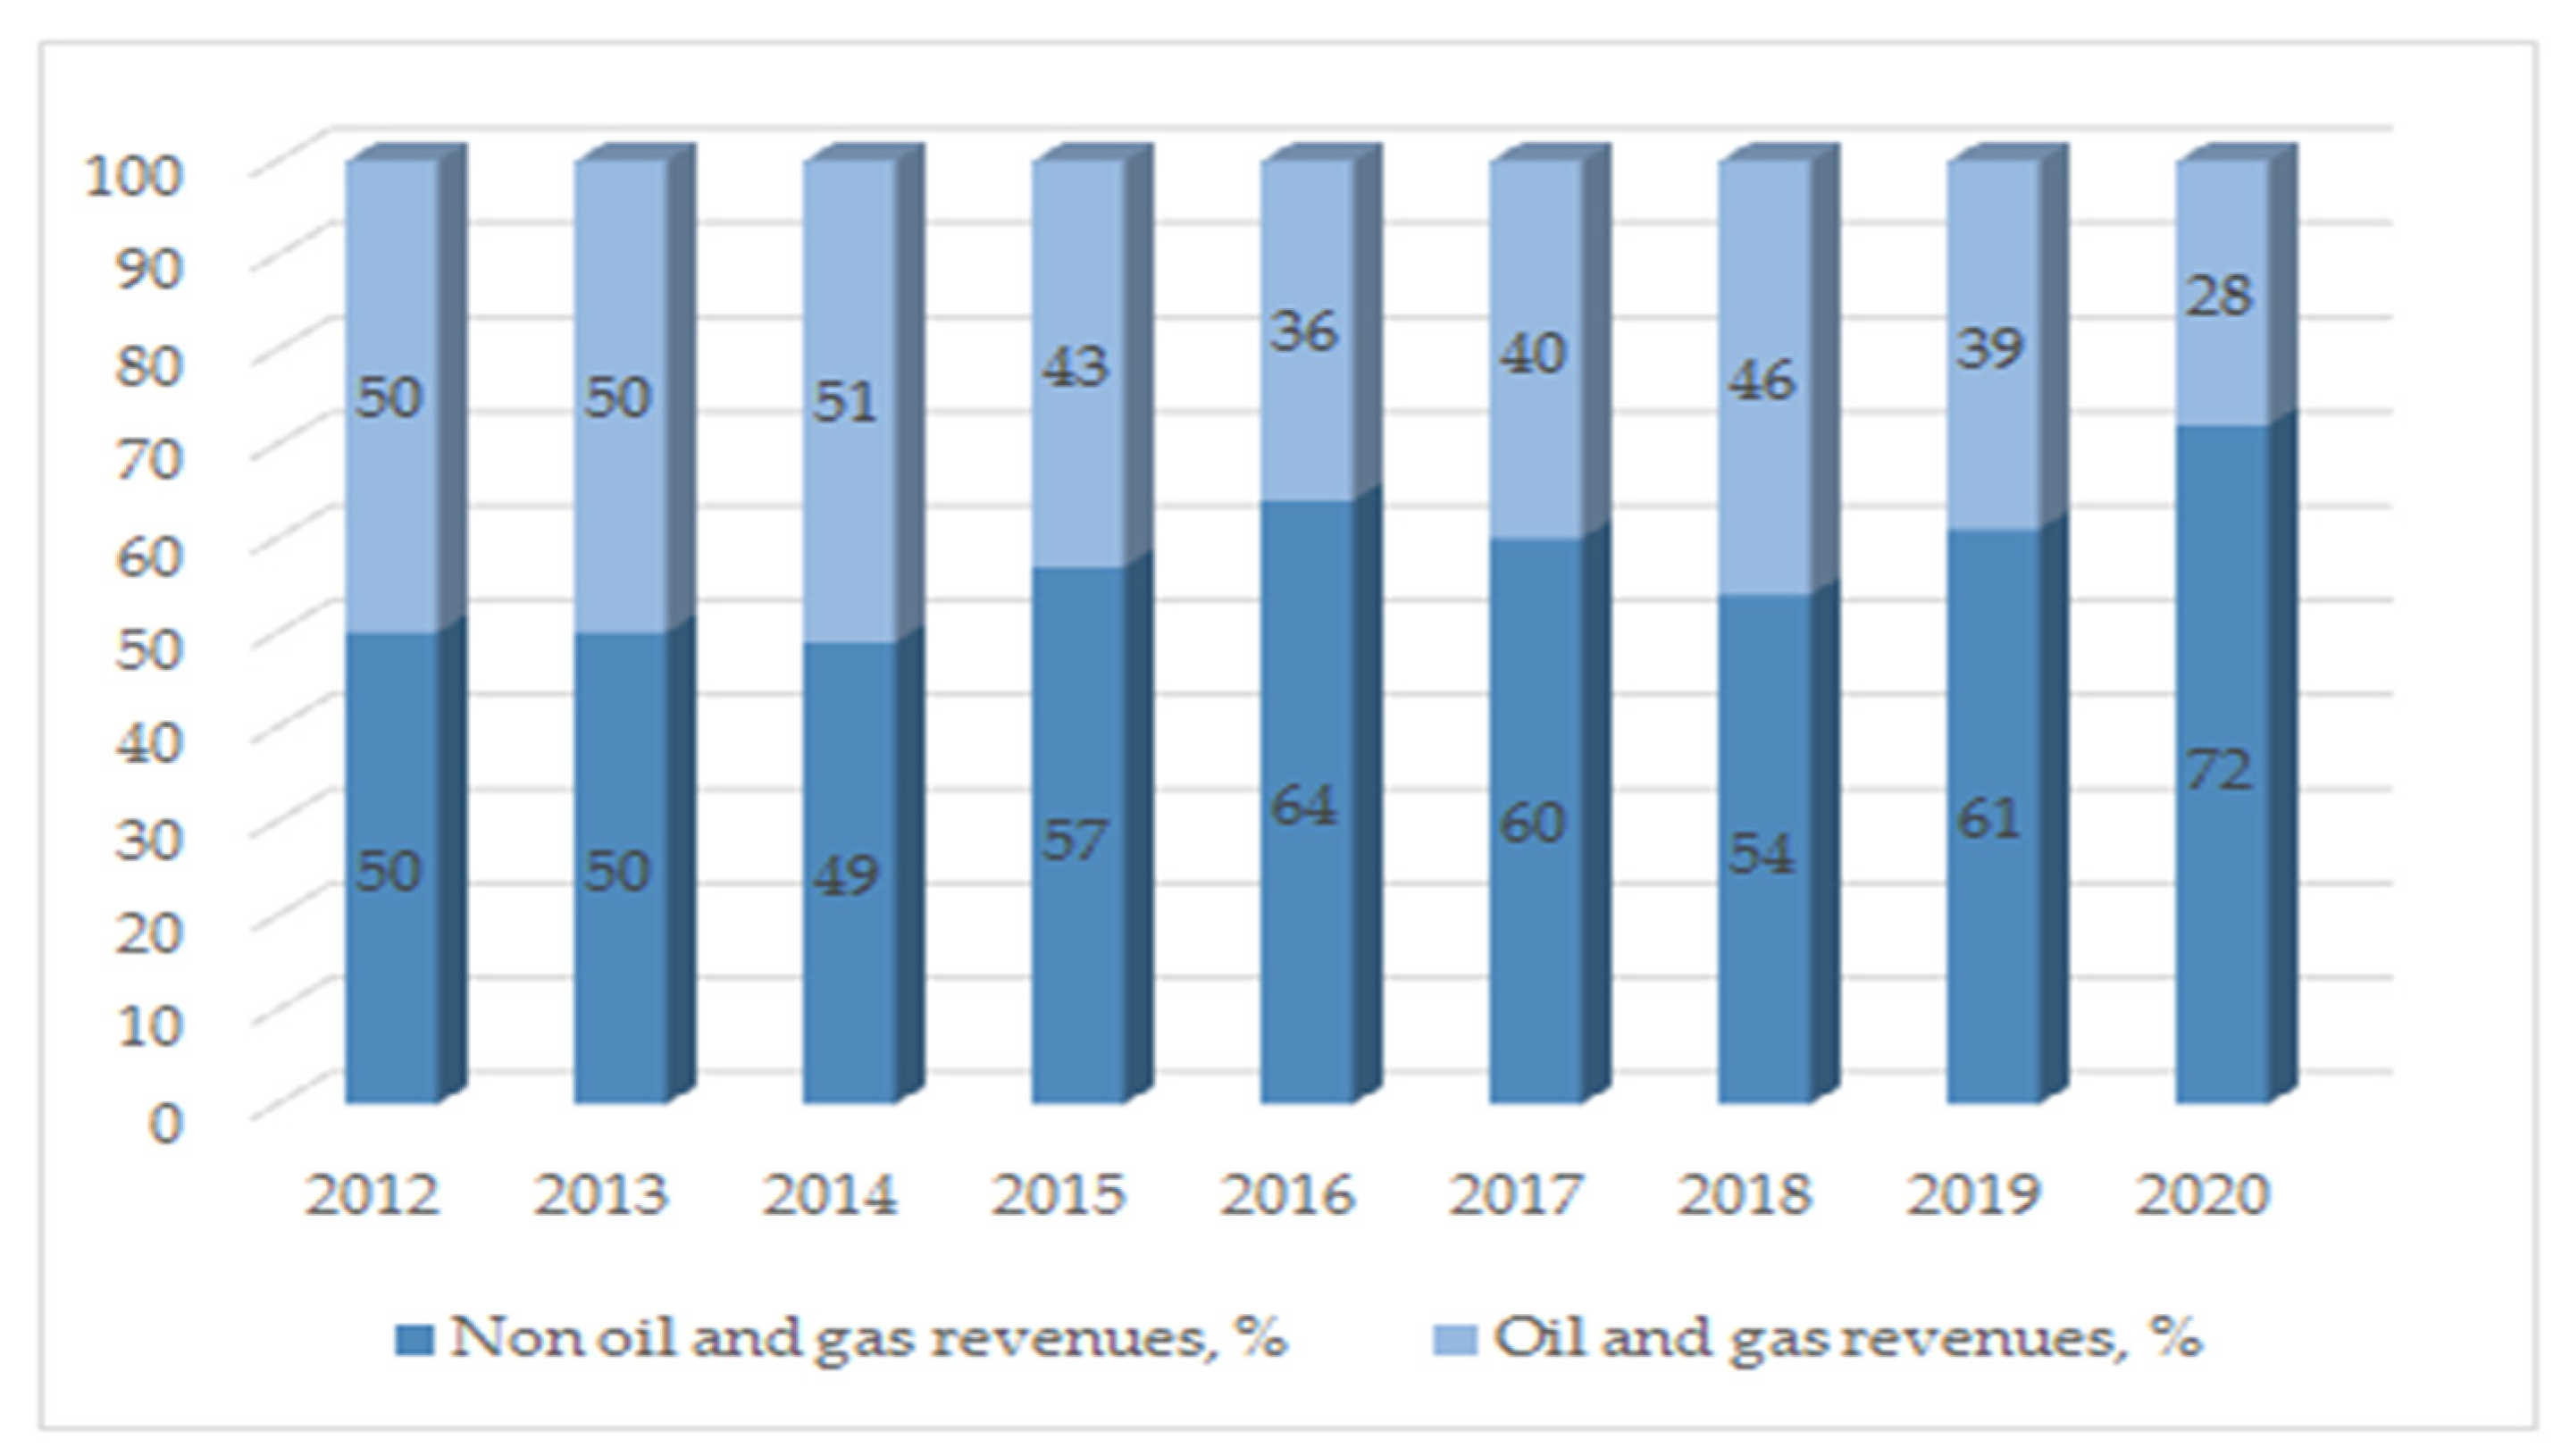
Oil and gas resources play a fundamental role in the stability of the Russian economy. The Russian budget is calculated on the basis of three main indicators: the price of oil, the price of gas, and the exchange rate of the US dollar against the ruble (since sales of oil and gas resources are carried out mostly in US dollars). The share of oil and gas revenues in the budget of the Russian Federation remained 30–50% until 2019 (
Figure 4).
The year 2020 brought significant challenges [
30]: the rapid spread of the coronavirus (COVID-19) pandemic forced governments all around the world to establish lockdown measures, which significantly affected economic activity, employment, and people’s livelihoods [
31]. The economic crisis caused by the coronavirus pandemic has had a negative impact on many industries; however, some of them have proved to be quite resilient [
32,
33]. The world fuel and energy market experienced the greatest impact of COVID-19: the decline in economic activity has dramatically affected global energy demand, which, according to the Global Energy Perspective 2021 by McKinsey and Company, fell by 7% [
30]. The fall in demand for fuel and energy resources in key sales markets led to a record drop in prices. At the end of the first quarter of 2020, the gas price had reached a 30-year low, and the oil price had reached a 22-year low. However, due to the partial lifting of restrictions in some countries, the demand for energy resources has partially returned [
30]. According to the International Energy Agency’s forecast published in the Global Energy Review 2021, global energy demand will grow by 4.6%, with the bulk of the demand coming from developing countries [
34].
Furthermore, according to the OPEC forecast, world oil demand in 2021 will grow by 5.9 million barrels per day. It is predicted to grow in China, India, and some Asian countries. According to the forecast of the World Energy Agency, oil demand will increase by 5.5 million barrels per day, and it will recover mainly in the second half of the year [
35].
With the global demand for energy resources, the share of gas will increase in the next few decades and peak in the late 2030s. The growth in oil demand will slow down, but oil will remain the most important energy resource for many years to come [
30]. In this case, given the depletion of traditional fields with easily recoverable hydrocarbon reserves and the importance of mineral resources for the economy, resource provision is crucial for Russia. Despite the current macroeconomic conditions, the Arctic shelf is a promising area for providing Russia with raw materials, especially hydrocarbons [
36,
37].
3.2. Resource Potential Development and Labor Migration
As noted above, a significant share of Russian oil and gas resources is concentrated in the Arctic zone, specifically on the Arctic shelf. Projects for the development of offshore hydrocarbon fields in the Russian Arctic are technologically complex. The availability of the appropriate technologies is one of the key factors determining the commercial effectiveness of such projects. Moreover, complex technologies imply the need for relevant competencies of the workforce at all levels, from project managers to lower-level workers. Thus, it is impossible to implement complex mining technologies without qualified personnel.
It follows that the Arctic regions have great job opportunities for potential high-skilled labor immigrants. However, jobs in the field of raw material extraction in the Arctic are characterized by difficult working conditions, as mentioned above, including low temperatures, long and dark winters that provoke a depressive emotional state, a large number of physically stressful tasks, weak infrastructure, lack of social life, and so on. These factors make the work related to the development of the resource potential of the Arctic and its territories unattractive to the working population. At the moment, there is an acute personnel problem in the field of mineral resource extraction in the Arctic [
38] (p. 1). As the analysis below shows, the Russian Arctic was characterized by an outflow of human resources at the time of this research.
There is unquestionably a close relationship between the migration of labor and the development of raw materials in the Arctic, which is clearly identified in a number of scientific works [
38] (p. 3), [
39,
40]. Heleniak [
39] (p. 2) demonstrated this for two Russian Arctic regions, Khanty-Mansiy and Yamalo-Nenets districts, which are key regions for the extraction of raw materials that are vital for the country: oil and gas. These regions were the only Russian Arctic territories that had constant migration inflows during the post-Soviet period due to high incomes, in contrast to the considerable outflows from other Arctic regions that do not possess rich natural resources. The same situation can be observed in the Nenets Autonomous district, which is rich in hydrocarbon resources. This is the only region in which migration inflows exceeded outflows throughout 2010–2019, as shown below (
Figure 5).
In this regard, the task of attracting qualified personnel to work at Arctic mining enterprises, which are the main employers in the Arctic regions, is currently relevant. This task should be planned and solved primarily within industrial enterprises that perform the extraction of Arctic mineral resources. Such organizations should form material and non-material incentives for personnel that would increase the inflow of human resources from other regions to the Arctic. All of this should take place with active support from the state for the development of the Arctic regions and their infrastructure, thus increasing their attractiveness to migrant workers.
The next task in our study was to analyze the factors that influence the attractiveness of the Arctic region from the point of view of a potential labor immigrant.
3.3. Migration Processes in the Arctic Regions
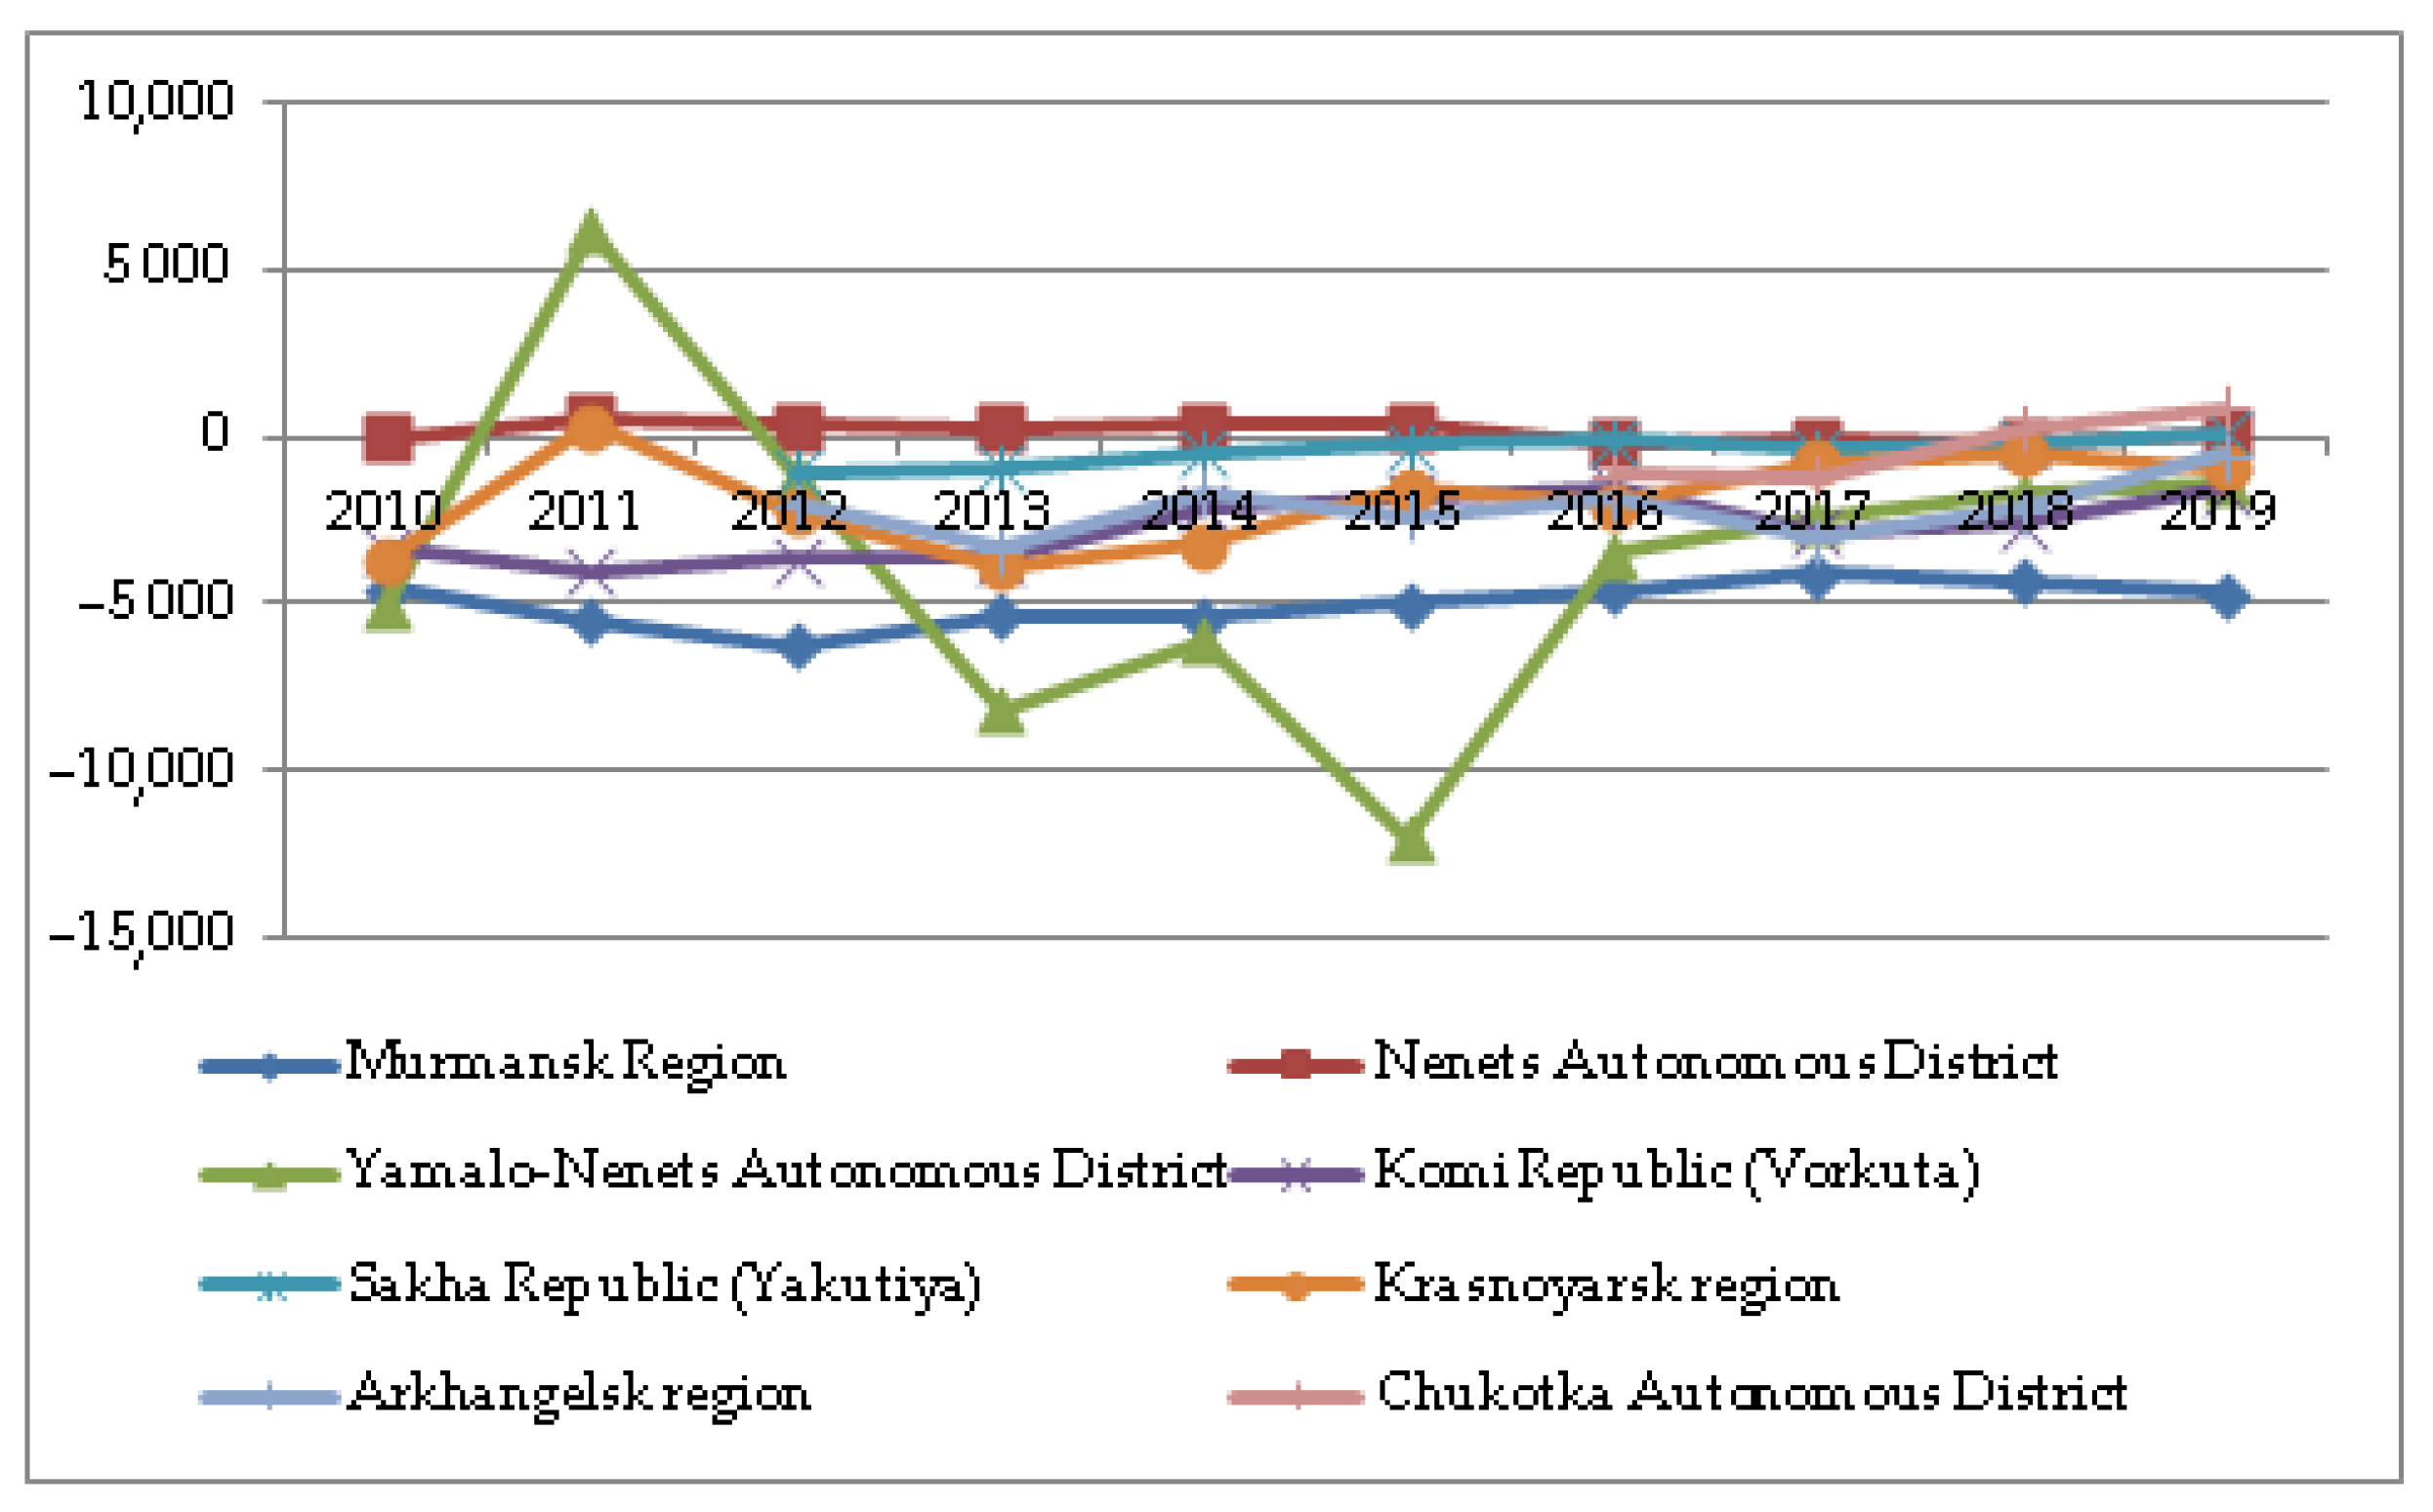
The aim of this stage of the study was to identify the main trends associated with the inflow and outflow of the population in the Arctic regions. To this end, we chose an indicator of migration growth calculated as the difference between the number of arrivals and departures in the region. The dynamics of migration growth in the Arctic regions between 2010 and 2019 are shown in
Figure 5. Data from state statistics bodies were collected for all the municipal areas of the Russian Arctic regions and used as the initial information for the analysis [
41].
Figure 5 shows that the Yamalo-Nenets Autonomous district had the highest volatility of migration growth (calculated as the difference between migration increase and decline): its values ranged from 6249 people in 2011 to −11,972 people in 2015. These peak values are due to a significant inflow of labor resources to the city of Novy Urengoy in 2011 (5448 people), as well as the cities of Gubkinsky, Salekhard, and Nadym (1886, 1088, and 1071 people, respectively), and a significant outflow of the population across all municipal districts of the region in 2015. The maximum outflow of 5361 people was observed in the city of Novy Urengoy. Mass inflows and outflows of labor resources in such cities and municipalities are due to the launch of new oil and gas projects and the development of new fields, the closure of old ones, the movement of employees working in shifts, the outflow of young residents to promising regions of the country, and the departure of senior citizens to favorable climatic zones.
The lowest volatility of migration growth was in the Nenets Autonomous district, the Republic of Sakha, and the Murmansk region, which showed a consistent significant outflow of the population throughout the entire period, with an average of 5072 people per year.
Negative dynamics of migration growth were typical for the following Arctic regions (or the parts that are located in the Russian Arctic zone):
Positive dynamics of migration growth were observed in:
“Above-zero” values of migration growth from 2010 to 2015 are observed only in the territory of the Nenets Autonomous district. This indicates that the inflows to the region were higher than the outflows over that period. However, since 2016, the situation has changed.
The results of the analysis show that migration processes in the Yamalo-Nenets Autonomous district have the highest volatility among the Arctic regions, which is primarily due to the ongoing mining activities in this region. At the time of the study, all Arctic territories were characterized by a stable outflow of the population. To identify the reasons for such trends, we analyzed key factors and socio-economic indicators that affect the influx of the population, particularly labor resources, to the Arctic regions.
3.4. Analysis of Methods and Indicators Used for Assessing Regional Attractiveness
In the literature, the attractiveness of a region to the working-age population is often described by the term “migration attractiveness”. There are various methods and approaches to assessing the level of migration attractiveness of a region [
42,
43,
44,
45,
46,
47,
48,
49]. Niedomysl [
42] described two alternative approaches to analyzing a location’s attractiveness—assumption-based and statement-based—and their pros and cons. Portnov [
43] identified employment and housing factors of interregional migration and proposed an approach to determine sustainable regional development policies aimed at a more balanced distribution of a country’s population. Karachurina [
44] focused her research on the attractiveness of centers and secondary cities in 74 Russian regions to internal migrants. Lundholm and others [
45] examined interregional migration within the five Nordic countries—Sweden, Norway, Denmark, Finland, and Iceland—with a focus on the main motivating factors for moving.
Beglova and others [
46] calculated the coefficient of migration attractiveness as a root of the ratio of the arrival coefficient to the departure coefficient, which reflects the excess of migration inflows over outflows. In addition, researchers studied the correlation between the coefficient of migration attractiveness and the economic, social, demographic, and environmental factors that determine it, resulting in a total of 16 quantitative indicators [
46]. Similarly, in [
47], the correlation between the migration balance and the migration attractiveness of cities was assessed using 18 socio-economic indicators.
Petrov et al. [
48] investigated the relationship between migration growth rates and the quality of life of the population in the regions of Russia. The latter was used to assess the attractiveness of a region and was calculated on the basis of 12 indicators divided into 4 groups: physiological needs, safety needs, communication needs, and achievement needs. The researchers suggested assessing regional attractiveness in terms of the system of needs of migrants. Moreover, the study showed that migration growth in the Yamalo-Nenets Autonomous district, the Republic of Komi, Magadan, Murmansk, and some other regions was much lower than the national average. This is due to the fact that these regions are located in the Arctic zone of the Russian Federation and are characterized by special living conditions. Druzhinina et al. [
49] focused their study on the influence of factors on the processes of external and internal migration in the northern territories of the Russian Federation. According to the authors, population density is the most attractive factor for internal migration, while external migration largely depends on the provision of communication services and the social security of the population. Additionally, providing the population with new housing is the most important area of socio-economic development for all migrants in the northern territories.
Much attention in the literature is paid to the issues of population migration and the attractiveness of territories. For decades, researchers have been studying the factors that contribute to the attractiveness of specific regions and territories to migrants. Thus, factors such as urban attractiveness, ecology, and proximity to amenities now play a more important role in the migration of young people than in the past [
50]. The Organisation for Economic Co-operation and Development (OECD) names seven determinants that contribute to a country’s attractiveness to high-skilled migration: quality of opportunities; income and tax; future prospects; family environment; skills environment; inclusiveness; and quality of life [
51]. Each determinant includes several specific indicators, which can be both qualitative and quantitative. The term “talent attractiveness” is used to identify highly educated and talented people migrating in search of better living conditions. Its level is assessed in [
52]. Ewers and Dicce [
53] examined the relationship between highly skilled international migration and urban–regional development.
It is abundantly clear that the prospect of a better job, improved living conditions, and personal development are the principal motives that drive people to emigrate. “Power of attraction” is based on notable differences in social conditions, the situation in the labor market or, for example, the quality of life of society. Matuszczyk [
54] analyzed 14 different indicators to measure migration attractiveness, such as the unemployment rate, GDP per capita, median of annual income (PPS), cost of living index, rent index, law enforcement index, severe material deprivation rate, and others. However, many researchers consider the unemployment situation to be one of the main factors influencing the resettlement of people [
48].
The sustainable attractiveness of regions, including the Arctic zone, is influenced by economic and social circumstances within the territory. The latter can be estimated with the help of specific indicators. For this purpose, a number of methods exist and are widely discussed in the academic literature.
In 1993, Lipshitz [
55] summarized the key factors and methods for assessing the development of a territory. In further research, Cziraky and others [
56] proposed a multivariate statistical framework for assessing regional development, and Shahraki [
57] investigated important factors in the process of regional development. Erlinda and others [
58] provided an evaluation framework for the assessment of sustainable regional development using multiple criteria related to development scenarios established by stakeholders.
According to some research, assessing regional development is often performed using aggregate indexes. They involve various economic, social, and other indicators such as GRP, the number of beds in hospitals, investment attractiveness, income values, budget characteristics, and other factors [
59,
60].
Professor Svetunkov [
61] highlights two main groups of methods used to evaluate the development of a region: integral indicators and econometric modeling.
Many researchers have assessed the attractiveness of a region, territory, or city using concepts such as its competitiveness [
62,
63,
64,
65]. The competitiveness of the region mainly involves the allocation of capital in the territory, the development of productive forces, the internal stability and strength of the role and influence of the region in external systems, and the ability to compete with homogeneous systems in their economic development and to offer a stable environment for business and residence. Some researchers have also included the living standards of the population.
Similar to the level of socio-economic development, researchers have proposed different approaches to assessing the level of competitiveness of a region, territory, or city based on various indicators or mathematical and statistical models [
66,
67,
68].
International institutions and administrative bodies also participate in the calculation of territorial competitiveness indices. For example, the following techniques can be used:
The Human Development Index (HDI) is assessed by the United Nations Development Program. The HDI is a cumulative measure of key aspects of human development: a long and healthy life, knowledge, and suitable living standards [
69].
The Regional Competitiveness Index (RCI) is assessed by the Directorate-General for Regional and Urban Policy of the European Commission. It aims to provide a consistent, comparable, and effective measurement of economic and social issues in the EU regions and is based on 11 factors, such as infrastructure, health, opportunities for education and business, technologies and innovation, and employment [
66].
The level of competitiveness of the largest cities in the state of California is assessed by The Reason Public Policy Institute in the USA. It identifies the best cities to live in in the state. The rating is based on indicators that assess the location of the city, the temperature conditions, and services (medicine, transport, recreation, etc.) [
70].
Almost all approaches studied by the authors assess the competitiveness of the region using a set of particular social and economic indicators combined into several key factors. The factors often include the standard of living, investment attractiveness, innovative activity, the level of development, the efficiency of resource use, and the financial, environmental, and organizational potential of the region.
The most commonly used indicators are the average per capita monetary income of the population; the profitability of gross output (works, services) of the region; the share of unprofitable organizations; the share of investments in fixed assets in the GRP; expenses of the consolidated budget per capita; the share of innovatively active organizations in their total number; exports; the share of small enterprises in the total number of registered enterprises; the share of graduated specialists, postgraduates, and doctoral students in the economically active population, etc.
The estimates obtained reflect various aspects of competitiveness at the regional level as well as the integral competitiveness of the region, allowing us to determine its strengths and weaknesses and serving as a basis for developing sustainable regional development strategies.
3.5. Correlation Analysis
To identify indicators that have a strong linear relationship with migration processes and the attractiveness of the Arctic regions, a number of economic and social indicators were selected with the help of experts.
The population size, thousands of people;
The number of registered crimes per capita, pcs.;
Commissioning of residential buildings, thousands m2 of total area of residential premises per person;
The volume of paid services to the population (in actual prices for the period), million rubles;
The birth rate, natural population growth (decline) per 1000 people;
The gross enrollment rate in preschool education as a percentage of the number of children aged 1–6 years.
Economic indicators:
- 7.
Income per capita, rubles;
- 8.
Average consumer expenditure per capita (per month), rubles;
- 9.
Number of enterprises and organizations per 1000 people, pcs.;
- 10.
Unemployment rate, percentage;
- 11.
Share of the population with incomes below the subsistence minimum in the total population, percentage;
- 12.
Cost of a fixed set of consumer goods and services, rubles.
We assessed the influence of each factor on migration processes by evaluating linear correlation coefficients between each of the above-mentioned indicators and the number of arrivals and departures in the region from 2010 to 2018.
Table 2 presents the values of linear correlation coefficients calculated for the Murmansk region.
The correlation analysis led us to Equationte the following conclusions:
The share of the population with incomes below the subsistence minimum in the total population of the region has almost no linear relationship with migration indicators. This is due to the high volatility of the indicator. Similarly, the unemployment rate indicator has a low linear impact on migration, since it is characterized by the absence of any clearly defined linear trend that is inherent in indicators of migration inflows and outflows. Therefore, these indicators are not recommended for use in linear econometric migration models.
Income per capita has a stronger linear correlation with the number of arrivals than with the number of departures. This can be interpreted from the point of view of the region’s economic attractiveness: relocation to the Far North and Arctic regions is often due to material incentives, which, in this case, is the growth of income. A similar trend is observed for indicators that reflect consumer expenditure on goods and services.
The number of enterprises and organizations per 1000 people has a very low correlation with migration indicators and thus has little influence on the attractiveness of the region. This is also the case for the indicator “Number of registered crimes”.
Migration inflows and outflows have a strong linear relationship with the indicators “Gross enrollment rate in preschool education” and “Population size” and a slightly weaker association with the indicator “Commissioning of residential buildings”. At present, the correlation coefficient values of these indicators suggest that they are acceptable for use in simple linear econometric models.
“Birth Rate per 1000 people” has an insignificant linear relationship with migration. In other words, a natural increase or decrease in the population within the region is unlikely to be an incentive for potential migrants to relocate to the Arctic region and will not significantly contribute to a population influx from other regions.
In addition, analysis of the correlation of indicators shows that the population has an inverse linear relationship with income per capita with a correlation coefficient of −0.984.
In general, migration processes have a stronger linear relationship with social indicators than with economic ones, which may be a confirmation of the fact that migration of the population to/from the Arctic regions is not caused only by material incentives but, on the contrary, is mainly determined by social factors.
3.6. Econometric Modeling
In this research, we applied a contemporary economic and mathematical instrument that uses complex variables. It has been successfully used by some researchers to solve different economic problems [
61]. The key principle of this tool is to combine two economic indicators into one model variable. This approach allows different aspects of a phenomenon to be addressed and its influence on parameters to be analyzed, which, in turn, could be a complex variable. Thus, we applied basic complex-valued model (1) with regard to migration processes.
where
yr and
yi are components of an endogenous complex variable;
xr and
xi are components of an exogenous complex variable; and
a0 +
ia1 and
b0 + ib1 are model coefficients.
Correlation between two complex indicators is evaluated as follows [
61]:
If the real part of rXY is close to 1, then the endogenous variable is linearly dependent on the exogenous one, while the imaginary part reflects the plot scatter of the regression model.
Econometric modeling of migration processes was carried out using data published by state statistics bodies using the Murmansk region as an example. We used indicators representing migration processes—the number of arrivals and departures from the region in the period—as the dependent complex variable in all econometric models. As factors that determine the variability of the considered indicators of migration, we chose seven socio-economic indicators that have high linear correlations with the dependent variables (
Table 2). Then, we formed complex variables by grouping a pair of particular indicators that describe one process or phenomenon from two different aspects. The time series included seven observations, namely, the real values of the indicators from 2011 to 2017. Using the developed models, we predicted the values of migration inflows and outflows in the Murmansk region for the year 2018. The actual values in 2018 were used as benchmarks to assess the adequacy of the obtained forecasts.
Taking the above into account, we studied simple linear complex-valued models of type (1), as follows:
“Income per capita” (Xr, rubles) and “Volume of paid services to the population” (Xi, million rubles) are variables in model 1. The complex coefficient of linear correlation between the exogenous and endogenous variables of the model is quite high: 0.731–0.048i.
“Average consumer expenditure per capita” (Xr, rubles) and “Cost of a fixed set of consumer goods and services” (Xi, rubles) are variables in model 2. The complex coefficient of linear correlation between the exogenous and endogenous variables of the model is high: 0.814–0.005i.
“Gross enrollment rate in preschool education, as a percentage of the number of children aged 1–6 years” (Xr) and “Commissioning of residential buildings” in thousands m2 of the total area of residential premises per person (Xi) are the variables in model 3. The complex coefficient of linear correlation between the exogenous and endogenous variables of the model is high: 0.875–0.046i.
“Gross enrollment rate in preschool education, as a percentage of the number of children aged 1–6 years” (Xr) and “Birth rate, natural population growth (decline) per 1000 people” (Xi) are variables in model 4. The complex coefficient of linear correlation between the exogenous and endogenous variables of the model is high: 0.895–0.066i.
Model 1 includes social and economic indicators as factors. Income per capita is the real part of the complex factor, and its imaginary part is the indicator of the volume of paid services provided to residents in the Arctic regions. This indicator reflects the degree to which high-level personal needs are satisfied in contrast to the basic ones.
The profit indicator is normally the main appeal to potential labor migrants to the region [
71]. Additionally, high-level needs require appropriate social infrastructure. The amount of money spent indirectly indicates the availability of various social opportunities [
61]. Therefore, we deemed the volume of paid services rendered to be a crucial factor in judging regional attractiveness and incorporated it as an imaginary component.
Model 2 is a simple linear regression model in which migration processes are the result of variation in two economic indicators that characterize the average expenses of residents of the Arctic regions. Consumer expenditure per capita and the cost of a fixed set of consumer goods and services both describe the process of spending personal funds but from different angles. In fact, they represent the average amount of money that the consumer possesses after all compulsory monthly expenses. This value is of interest to potential migrants to the Arctic regions, since it characterizes their material security if they move there.
Model 3 is a simple linear regression model in which the values of migration indicators depend on the social components of the attractiveness of the region; these components represent the provision of families with preschool educational institutions and housing. Model 4 is a modification of Model 3 and incorporates the social indicator of natural population growth instead of the indicator “Commissioning of residential buildings”.
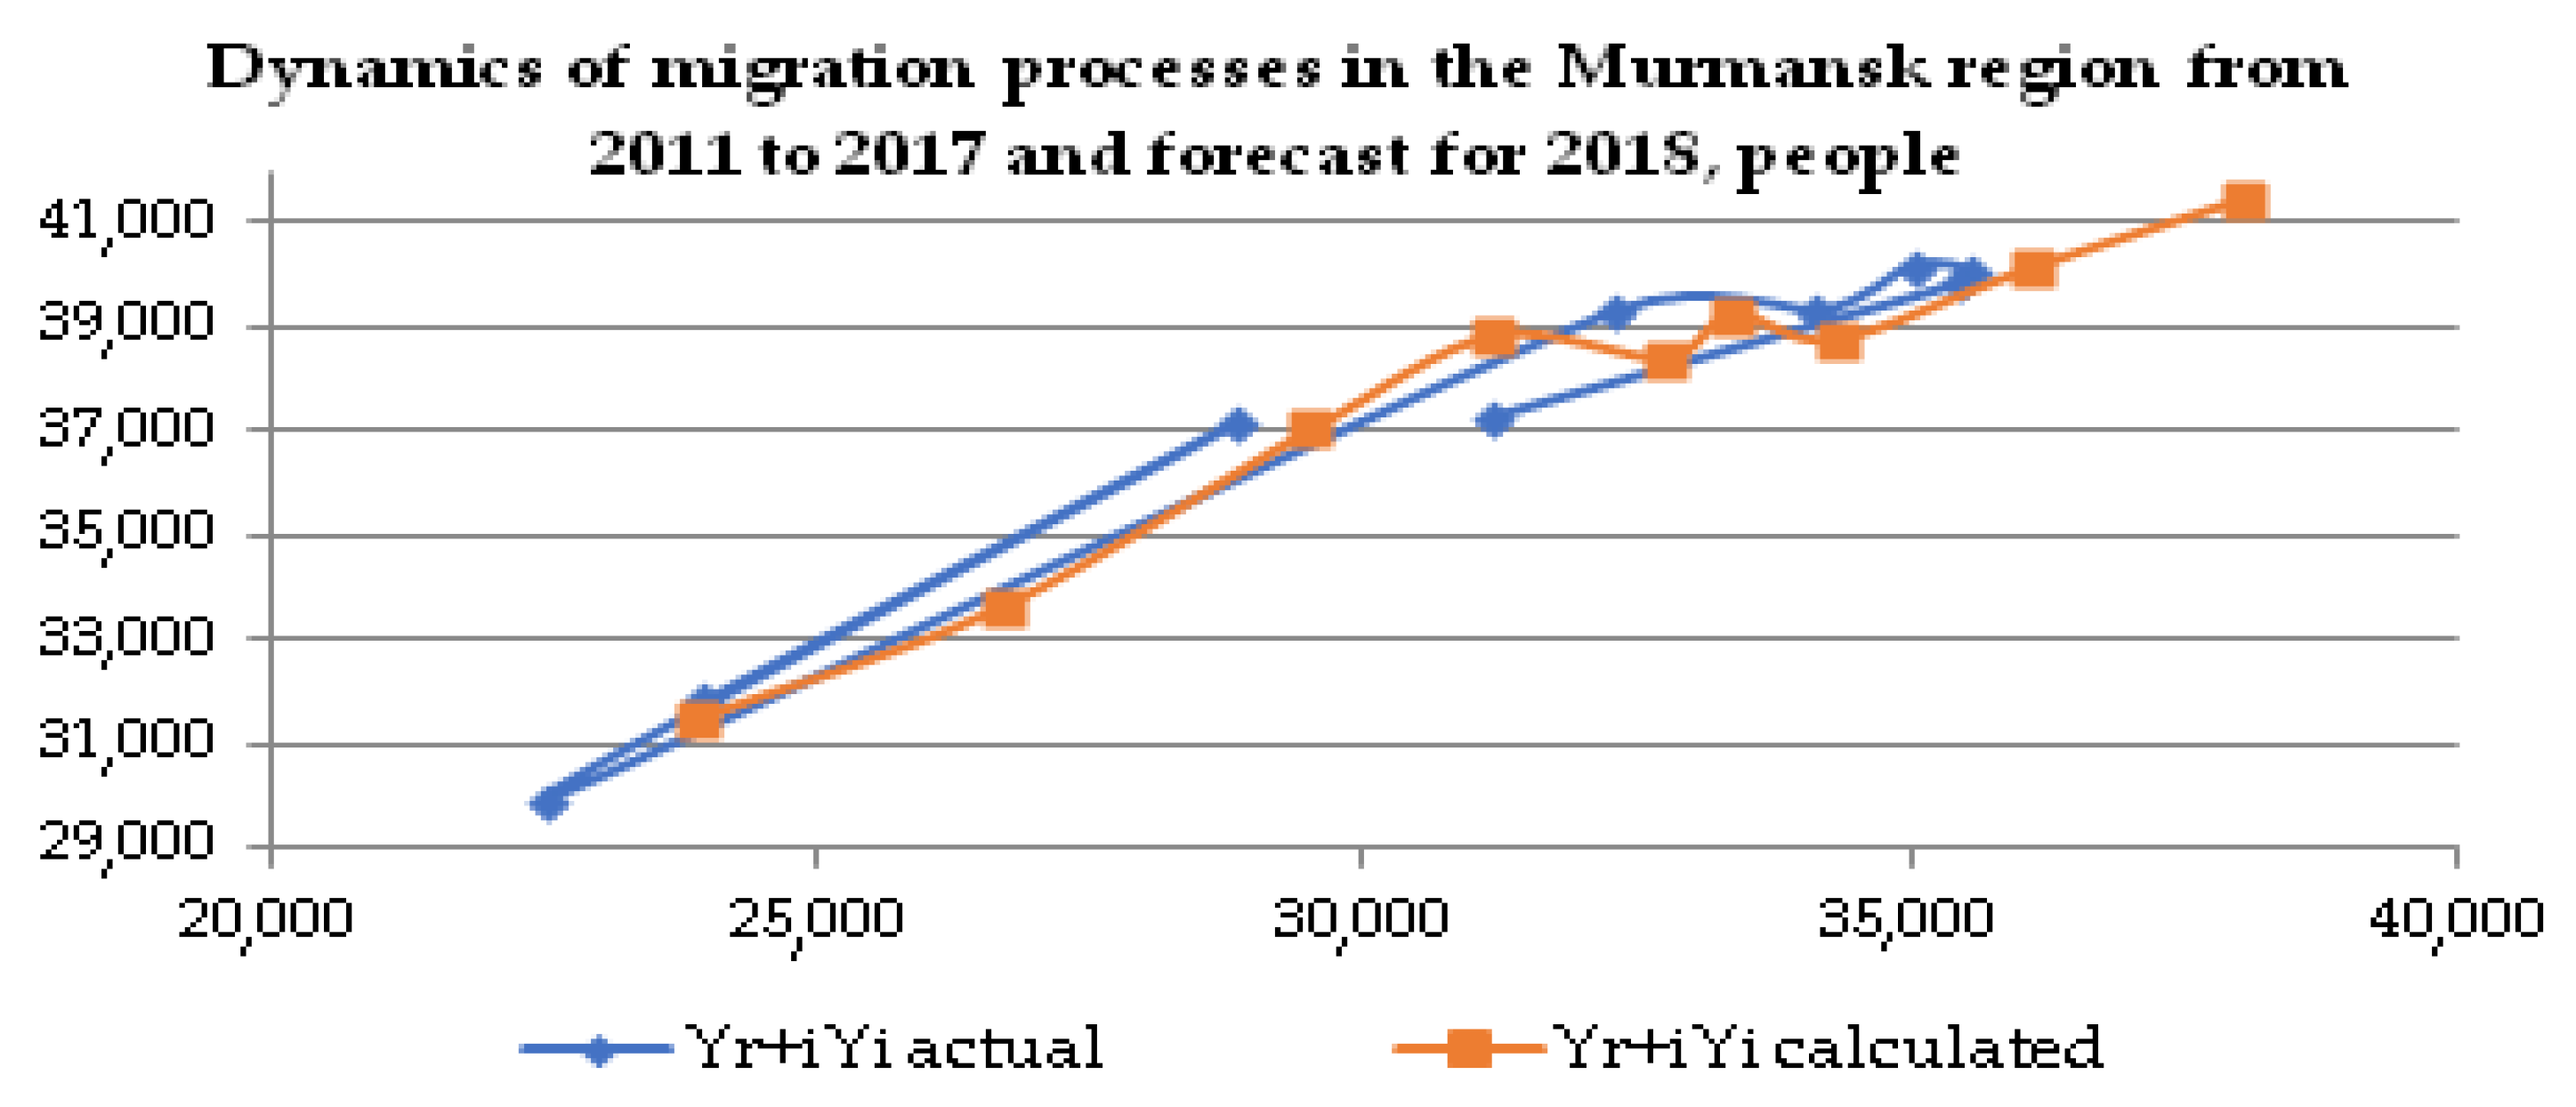
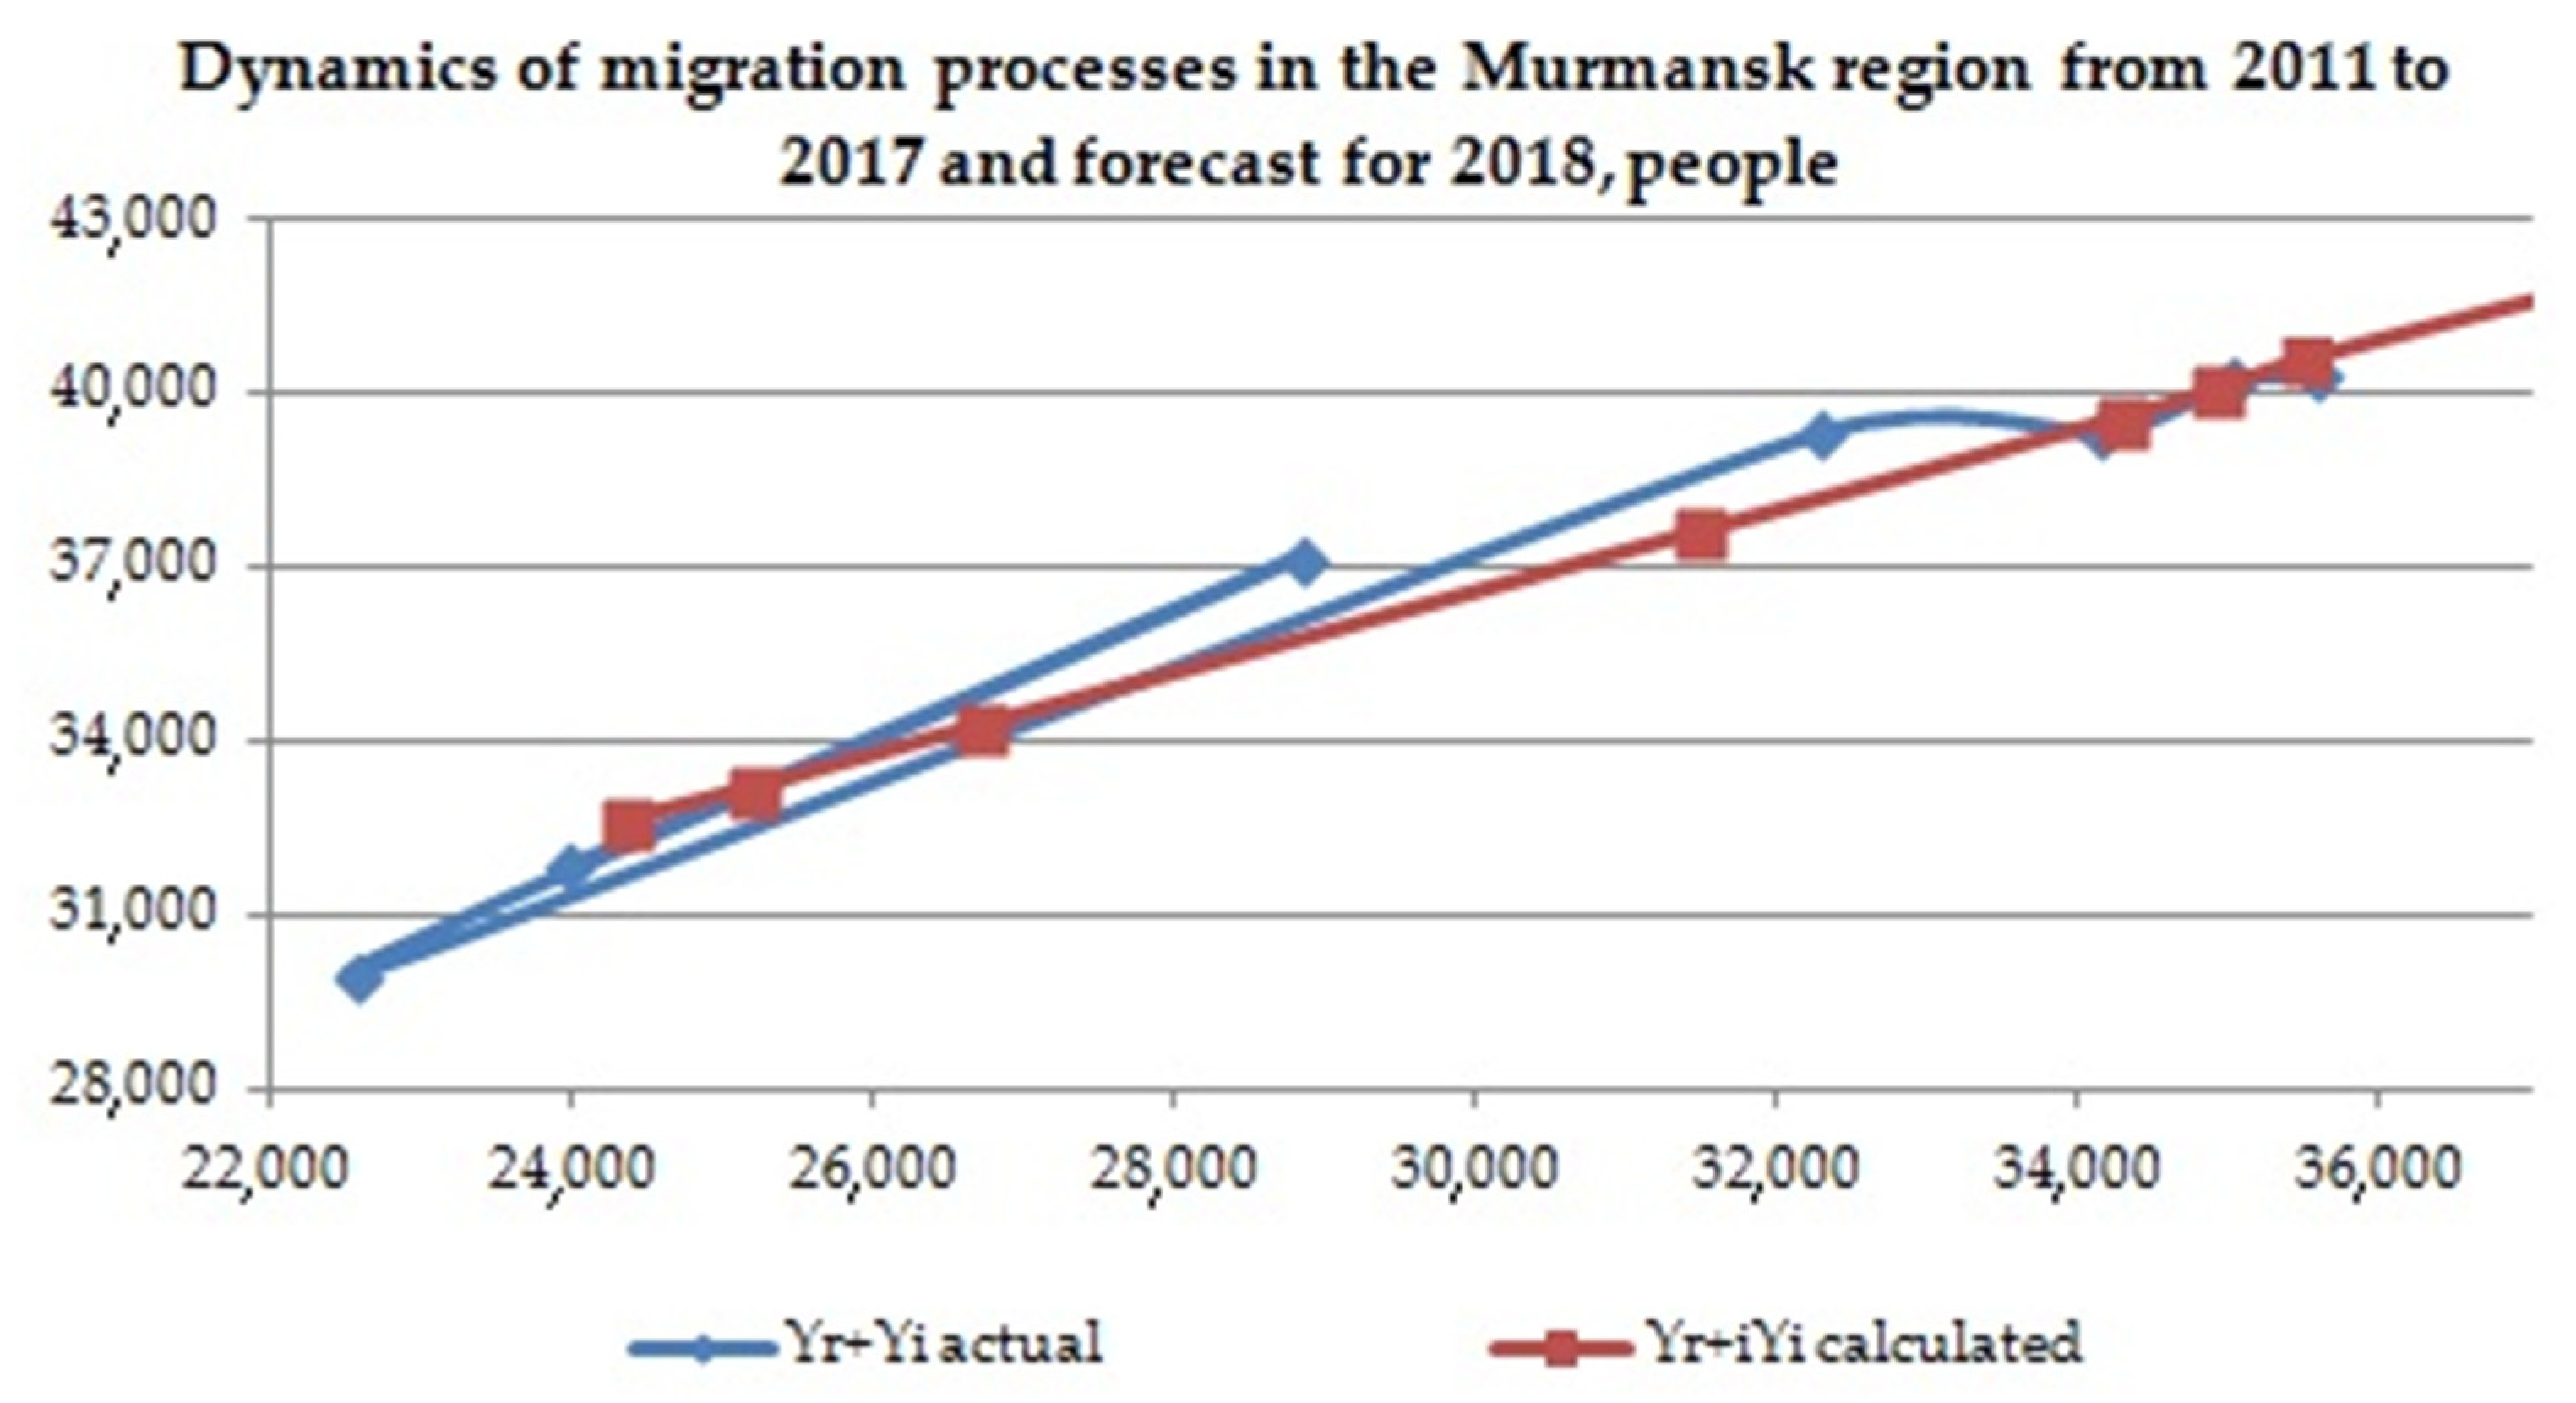
Figure 6,
Figure 7,
Figure 8 and
Figure 9 show graphs of the actual and calculated values of arrivals and departures in the Murmansk region. The calculated values were obtained using the above econometric complex-valued models.
The figures show that the predictions of all four econometric models closely match the initial data and are suitable for forecasting. In addition to the four models presented above, we performed a linear extrapolation of trends of migration inflows and outflows based on their dynamics from 2011 to 2017 in order to calculate forecast values for 2018.
Table 3 shows the results of an analysis that compares different forecasts of arrivals and departures in the Murmansk region.
As indicated in the table, the forecasts of the arrivals and departures derived from the four studied complex-valued models are closer to the actual data than the results of a linear extrapolation of their trends for 2018.
Furthermore, the best forecasting results are obtained with model 2 for the indicator “arrivals” and model 4 for the indicator “departures”. The fourth model has the highest complex R-squared. Thus, we can conclude that linear complex-valued models are suitable for predicting migration processes in the Arctic regions of Russia, despite their simplicity and inability to consider many factors.
3.7. Integral Estimation of the Attractiveness of Arctic Regions
As mentioned above, a large number of domestic studies have been devoted to assessing the attractiveness of territories. However, the literature contains little research assessing the attractiveness of the Arctic regions to labor migrants. However, it should be noted that living and working conditions in the regions of the Russian Arctic differ significantly. In this regard, one of the objectives of the study was to conduct a comparative analysis of four Arctic regions that are entirely included in the Arctic zone of the Russian Federation (Murmansk region and Nenets, Yamalo-Nenets, and Chukotka Autonomous districts) according to a number of key indicators. For this purpose, we calculated two integral indicators characterizing the economic and social attractiveness of the territories of the Russian Arctic using state statistics data.
To calculate the integral indicators of economic and social attractiveness of the Arctic regions, the authors used the values of six economic and six social indicators presented above for the period 2010–2018. To this end, four source data tables were generated for each region under consideration, one of which is shown below as an example (
Table 4). The source data series were converted into values on a relative scale according to the “maximum–minimum” method. Its minimum and maximum values correspond to 0 and 1, respectively. The following Equations were used:
where
Хi is the value of the indicator for region
i,
Xmax is the maximum value of the indicator among the regions in the year under review, and
Xmin is the minimum value of the indicator among the regions in the year under review.
The authors used the “maximum –minimum” method because it avoids the excessive influence of each individual indicator on the integral one. Equation (3) is used when higher values of the indicator are preferred, and Equation (4) is applied otherwise.
The integral indicators of economic and social attractiveness were calculated separately for each year of the studied period according to Equations (5)–(7):
where
EAj is the economic attractiveness of the region in year
j; aij, cij are values of the
i-th economic and social indicator in year
j, respectively;
Saj is the social attractiveness of the region in year
j;
wi,
zi are the
i-th economic and social indicators’ weights, respectively;
n and
m are the number of economic and social indicators, respectively.
Table 5 presents the values obtained for each of the four regions, which were calculated based on 12 socio-economic indicators. We assume that the weight coefficients of all indicators are equal in order to avoid the excessive influence of any of the studied indicators on the integral assessment.
The data in this table show that the Yamalo-Nenets Autonomous district had the most economic stimulation in the 9 studied years. The economic activity is related to the high income per capita in the region, which, in turn, is conditioned by the presence of oil and gas extraction companies with good salaries and a small population. This region has had the best values of average consumer expenditure per capita, share of the population with incomes lower than the subsistence minimum in the total population, and unemployment rate. The Murmansk region has the lowest economic appeal. This is due to low incomes and consumer spending and high unemployment rates.
The Chukotka Autonomous district also has low economic attractiveness. It ranks last in terms of “Cost of a fixed set of consumer goods and services”, which is significantly higher in the Chukotka district than in the other regions, and “Average consumer expenditure per capita”. Although the “Unemployment rate” and “Share of population with incomes below the subsistence minimum in the total population” are quite low, these variables have had little effect on its attractiveness. “Income per capita” is also quite good. However, the Chukotka district does not have a leading position in any of the indicators for the studied period, which determined its relatively low attractiveness.
In terms of social attractiveness, the Chukotka Autonomous district is highlighted by the set of studied indicators. When analyzing the individual values of indicators, it was found that this region was characterized by the lowest crime rate per person for almost all 9 years under review. Moreover, the region has a large number of square meters of commissioned residential buildings per person, which is several times higher compared to the Nenets Autonomous district, which has almost the same population size.
In addition, this region has consistently had the leading position among the four regions in terms of “Gross enrollment rate in preschool education” since 2010. In 2013, the “Volume of paid services per capita” in the Chukotka Autonomous district almost doubled compared to its value in 2012.
As a result, the region took the leading position for this indicator until 2018. In terms of “Birth rate”, the Chukotka Autonomous district is significantly behind the Yamalo-Nenets Autonomous district, which has a population that is about 10 times higher.
Despite having the largest population of the four Arctic regions studied, which seems to be an attractive factor for young people, the Murmansk region ranks only third after the Chukotka and Yamalo-Nenets Autonomous districts according to the integral indicator of social attractiveness. This is due to its low (or even minimum) values of indicators such as “Commissioning of residential buildings per person”, “Volume of paid services per capita”, and “Birth rate”, which is actually associated with a natural population decline. In addition, the Chukotka, Nenets, and particularly Yamalo-Nenets Autonomous districts show stable natural population growth.
The Nenets Autonomous district ranks last in terms of social attractiveness, primarily because it has the lowest values of “Population size” and “Volume of paid services per capita”, as well as poor values of all the other indicators in comparison with other regions.
In the course of the study, the authors attempted to analyze the relationship between migration growth and the integral indicators of the attractiveness of the region. We hypothesized that changes in indicators of social and economic attractiveness have linear effects on the number of arrivals and departures in the region. However, the calculation of the linear complex correlation coefficient did not reveal a simple linear relationship between them, and this hypothesis was not confirmed. Further research can aim to identify non-linear models that reflect the relationship between migration flows in the regions of the Russian Arctic and their attractiveness to labor migrants.
4. Discussion
This study focused on the socio-economic assessment of the attractiveness of Arctic territories to potential migrants. We should note that the regions under consideration are significantly heterogeneous in terms of most indicators. The Murmansk region is characterized by the highest population, which is largely due to its milder climatic conditions, proximity to European countries, and developed infrastructure. The lowest population for the 9 studied years was in the Nenets Autonomous district, whose indicator values are 17–19 times lower than those in the Murmansk region. The rest of the indicators are also scattered for different Arctic regions. However, the territories under consideration have a common problem: the outflow of the working population to more favorable climatic zones.
The main limitations of the study are discussed below.
It is evident that the migration attractiveness of the Arctic region to the working population is determined by a range of indicators. However, not all indicators can be quantified. This is due to the fact that people rarely base their choices only on quantitative indicators in the decision-making process. In particular, it seems doubtful that a potential immigrant would analyze regional statistics on indicators such as GRP per capita, investment in fixed assets, or infant mortality rates before moving to a region. The decision to move is made on the basis of the individual’s principles, life attitudes, beliefs, and other personal characteristics that cannot be quantified, as mentioned in [
71]. Thus, the migration attractiveness of a region also depends on a range of non-measurable personal characteristics, such as tolerance to difficult weather conditions. Our research does not separate the influence of quantitative and qualitative parameters on migration processes, as the qualitative characteristics of the research object are difficult to formalize. This fact also prevents their use for assessing the attractiveness of the region together with socio-economic indicators. In addition, only measurable parameters can be analyzed with the proposed research methods. For these reasons, we limited our research to the investigation of quantitative characteristics of the object. Additional research covering qualitative characteristics in order to analyze their influence on migration processes in the Russian Arctic and assess the attractiveness of regions would provide further insight into the problem of migration outflows. Nevertheless, we consider it possible to identify key economic and social indicators that can be used to objectively assess the attractiveness of the Russian Arctic regions based on statistical data, which was performed in the framework of this study.
The second limitation is that this study focuses only on simple linear regression relationships between migration indicators and the indicators that cause their variation. In this regard, as dependent variables of the models, we studied only those indicators that have a close linear correlation with migration. The presented models do not account for other factors. In the future, we plan to apply complex-valued non-linear econometric models and include a wider range of indicators. In addition, it is possible to apply an individual approach to each region separately, adjusting the list of indicators for building regression models depending on their individual characteristics.
Finally, the research was limited by the relatively small amount of retrospective data for the following key reasons: (1) the investigated time series data must be stationary, and (2) statistical data are not publicly available for all analyzed regions. Since migration processes are very sensitive to changes such as legislative and legal regulations, social benefits, and economic incentives, we considered time series that were formed in relatively stable conditions, which limits the study timeframe. Moreover, we faced a data acquisition problem when trying to separate the statistical data for areas located beyond the Arctic Circle from the whole administrative region’s dataset. For this reason, we had to analyze only those regions that are fully located beyond the Arctic Circle. In addition, some Arctic regions do not have any publicly available unified statistical information within the 2010–2019 timeframe, which also limited our research.
There is also one disputable point that should be mentioned. The choice of specific indicators for assessing the social and economic attractiveness of regions and building regression models may seem controversial. However, in the course of the study, the authors conducted a thorough analysis and selected attractiveness indicators based on the works of Russian and foreign researchers, specifics of the studied regions, and possibilities of accessing quantitative information for their assessment. According to our assessment, the list of selected indicators best characterizes the attractiveness of the Arctic region to migrants from other territories, especially Russian ones. Choosing equal weight coefficients for all indicators is debatable, although it prevents the excessive influence of any indicator on the result.
The objectivity of the research in selecting indicators for estimating the attractiveness of regions was achieved by using a number of independent experts and conducting correlation analyses to determine indicators that have a significant linear relationship with migration processes. The use of complex-valued econometric methods makes this study unique, since this is the first time that the tools of a complex-valued economy are used to simulate migration processes in the Arctic regions. The procedure for evaluating regional attractiveness is also new, as it involves a unique list of indicators identified during the research, which are specific to Arctic regions.
Thus, the results of this study are the six economic and six social indicators identified on the basis of a thorough literature review and expert surveys; the assessments of the linear relationship between each indicator and migration processes in the Arctic regions; four complex linear regression models that can be used to predict the number of arrivals and departures in the region; and evaluation of the attractiveness of four Arctic regions in terms of their social and economic development.
The key findings of the research are as follows: (i) all Russian Arctic regions are characterized by a stable outflow of the population throughout the 10 studied years; (ii) migration processes are more linearly dependent on social indicators than on economic ones, which confirms the importance of the former; (iii) the four presented complex linear models produced better forecasting results than the simple extrapolation of the trends, so linear complex-valued models are suitable for predicting migration processes in the Arctic regions of Russia; (iv) the Chukotka Autonomous district has the highest social attractiveness, while economic incentives for migration are the highest for the Yamalo-Nenets Autonomous district.
The unexpected result of the study was that among all Arctic regions, the Chukotka Autonomous district took the lead in terms of social attractiveness. It should be emphasized that Chukotka is the most sparsely populated region of Russia and the most distant from the center. According to the Russian Statistical Agency, the area of the region is 4% of the total area of Russia, the population in 2021 is 49,527 people (0.03% of the population of Russia), and the population density is only 0.07 people/km2. The region is very rich in mineral resources, so all socio-economic indicators are at a high level. The finding that the Yamalo-Nenets Autonomous district emerges at the top in terms of economic indicators is more predictable since oil and gas resources, the basis of the national budget, are concentrated in this region. The region is in 7th place for GRP among all regions of the country. However, due to the larger population (547.01 million people) and the population density (0.71 people/km2) compared to Chukotka, the Yamalo-Nenets Autonomous district has a lower score in terms of social attractiveness.
The scientific contribution of this article to the study of migration processes in Arctic regions is the use of complex-valued econometric models to predict future migration flow. These studies were conducted for the first time, and the calculations proved to be effective and have potential practical applications.
We suggest that this method be tested on a larger dataset on migration.
5. Conclusions
The social and economic development of the Arctic region depends directly on the number of its residents, migration changes, and its migration attractiveness. The analysis of the region’s migration attractiveness helps to identify the reasons for population outflow and, therefore, makes it possible to influence and eliminate them.
The study of the migration attractiveness of the Arctic regions was carried out in several stages. The first stage was devoted to a detailed analysis of the foreign and domestic literature on the problems and prospects of the development of the Northern territories, the migration attractiveness of the region, and various ways of assessing it. Analysis of migration processes in the Russian Arctic showed that there was an outflow of population from all regions over the past decade. The authors assume that there is a relationship between the migration processes currently taking place in the Arctic regions and their attractiveness to the working population.
In the second stage of the study, key social and economic indicators that contribute to the region’s attractiveness to potential migrants were identified. For this purpose, the authors involved experts on the problems of economic development of the Arctic territories. The result of the expert survey was a list of 12 quantitative socio-economic indicators characterizing the attractiveness of the Arctic region.
To assess the dependence of migration processes on each of the selected socio-economic indicators, the authors conducted a correlation analysis using official data from state statistics bodies. It was revealed that not all indicators have a linear relationship with migration growth; simple relationships are attributed to a greater association between the number of arrivals and departures in the region and the level of its social development. This confirms that the motives for moving to the Far North are not just economic incentives.
Migration processes were modeled using the tools of a complex-valued economy. In particular, simple linear regression complex-valued models were used that reflect the relationship between a pair of dependent and a pair of independent model variables. The number of arrivals and the number of departures in the Arctic region were selected as a pair of dependent variables. For the independent variable of the linear complex-valued model, four pairs of indicators were proposed that reflect the social and economic attractiveness of the region. Thus, the authors formed four linear complex-valued models in order to test them for their ability to form good predictions of migration indicators. Calculations performed on the Murmansk region as an example showed that these models are suitable for forecasting, since the values of the number of arrivals and departures in the region calculated for 2018 are close to the actual data.
In the final stage of the study, a comparative analysis of the attractiveness of the Arctic regions (Murmansk region and Nenets, Yamalo-Nenets and Chukotka Autonomous districts) was performed. The authors evaluated the integral indicators of the social and economic attractiveness of the region on the basis of 12 indicators by calculating the weighted averages. It was found that the most attractive region over a 10-year period in terms of the economic situation is the Yamalo-Nenets Autonomous district, whereas the Chukotka Autonomous district is the most attractive in terms of social conditions. However, it should be noted that the Yamalo-Nenets Autonomous district is the country’s oil and gas center, which implies significant tax revenues at all budget levels, as well as a high level of income of the population. The Chukotka Autonomous district is a region with a minimum population density, which affects the statistical indicators in terms of their increase.
Further research in this area will focus on modeling migration processes in all Arctic regions using linear and non-linear econometric complex-valued models.


