Article

Empirical Models to Characterize the Structural and Physiochemical Properties of Vacuum Gas Oils with Different Saturate Contents

1
LUKOIL Neftohim Burgas, 8104 Burgas, Bulgaria
2
Laboratory of Intelligent Systems, Department of Industrial Technologies and Management, University Prof. Dr. Assen Zlatarov, Professor Yakimov 1, 8010 Burgas, Bulgaria
3
Institute of Biophysics and Biomedical Engineering, Bulgarian Academy of Sciences, Academic Georgi Bonchev 105, 1113 Sofia, Bulgaria
4
Department of Mathematics, University of Chemical Technology and Metallurgy, Kliment Ohridski 8, 1756 Sofia, Bulgaria
*
Author to whom correspondence should be addressed.
Submission received: 11 June 2021 / Revised: 6 July 2021 / Accepted: 7 July 2021 / Published: 9 July 2021

Abstract

:
Inter-criteria analysis was employed in VGO samples having a saturate content between 0.8 and 93.1 wt.% to define the statistically significant relations between physicochemical properties, empirical structural models and vacuum gas oil compositional information. The use of a logistic function and employment of a non-linear least squares method along with the aromatic ring index allowed for our newly developed correlation to accurately predict the saturate content of VGOs. The empirical models developed in this study can be used not only for obtaining the valuable structural information necessary to predict the behavior of VGOs in the conversion processes but can also be utilized to detect incorrectly performed SARA analyses. This work confirms the possibility of predicting the contents of VGO compounds from physicochemical properties and empirical models.

1. Introduction

Petroleum is a mineral resource used to produce fuels for automotive and aviation transportation, light olefins (in the C2–C4 range) and aromatics (mostly benzene, toluene and xylenes, BTXs)—the most valuable building blocks of the chemical industry [1]. The demand for oil-derived fuels is expected to decrease after 2030 due to the advances in clean energy generation and strong environmental concerns along with stricter policy [1]. In the next two decades, however, oil demand for petrochemicals is expected to increase by ca. 4 Mb/d per year, achieving 34% of the total oil market in 2040, in contrast to the current 15% [1]. The role of the conversion processes which break the higher molecular weight petroleum hydrocarbons to lower molecular weight ones is expected to grow in the future due to the increased demand of the building blocks for the chemical industry. Fluid catalytic cracking (FCC) and steam cracking (thermal cracking) are the current technologies that provide feedstock for the chemical industry. The performance of these processes has been shown in many studies to strongly depend on the quality of the feedstock [2,3,4,5,6,7,8,9,10,11,12,13,14,15,16,17]. The vacuum gas oil fraction from petroleum is the typical feed for the FCC [2,3,5,6,7,8,9,10,11,12,13,14,15,16,17] and it has been explored as a feedstock for steam cracking as well [4]. Considering that in both FCC and thermal cracking the reactivity of the vacuum gas oils increases with the saturate content enhancement and aromatic carbon content reduction, the information about these vacuum gas oil characteristics is of paramount importance for optimizing their performance [17]. Different empirical models for predicting important vacuum gas oil characteristics have been developed and published in the open literature [18,19,20,21,22,23,24,25,26,27,28]. To the best of our knowledge, these empirical models have not been evaluated to predict the content of saturates of vacuum gas oils in the whole range of possible variation (between 0 and 100%). There is also a lack of knowledge about the existence of relations between the VGO characteristics predicted by the empirical models and the content of heavy aromatics (tri- and tetra+ condensed aromatic rings). The yield of the least valuable product from the VGO conversion processes—the unconverted VGO (bottoms) product—is defined by the content of heavy aromatics because it is difficult to crack [7,29]. Considering that the conversion level and the yields of valuable products from the VGO conversion processes depend on the contents of the saturates, aromatic carbon and heavy aromatics we investigated the properties of 74 VGOs published in the open literature [2,3,4,15,30,31,32,33,34,35,36,37,38,39,40]. The studied VGOs had been characterized by HPLC-MS (high-performance liquid chromatography-mass spectrometry), NMR (nuclear magnetic resonance), SARA (saturates, aromatics, resins, asphaltenes) analysis and the typical physicochemical properties like density, distillation, refractive index, etc. We employed the different empirical models published in the literature and examined their capability to predict the contents of the saturates, aromatic carbon and heavy aromatics in the VGO based on the physicochemical properties which are routinely measured in any petroleum refinery. We made improvements in the correlations where it was necessary and developed a new correlation to predict the saturate content from the VGO physicochemical properties. The aim of this work is to discuss the results of our study.

2. Materials and Methods

A total of 74 vacuum gas oils characterized by HPLC-MS, NMR, SARA analysis and density, refractive index, aromatic carbon content, hydrogen content, molecular weight as reported in [2,3,4,15,33,34,35,36,37,38,39,40] were used in this study (Table S1 from Supplementary material). The empirical models evaluated in this research are summarized below:

2.1. Determination of Content of Paraffinic Carbon, Naphthenic Carbon and Aromatic Carbon by the n-d-M (ASTM D-3238)

The n-d-M method was originally developed by Van Nes and van Westen [41] and relates the structural group composition determined by the use of NMR in terms of the contents of paraffinic, naphthenic and aromatic carbon to three oil physical properties: refractive index, density and molecular weight. That is why it is called n-d-M method. The n-d-M method does not directly give the composition of vacuum gas oils in terms of paraffins, naphthenes and aromatics. It predicts the distribution of carbon in the paraffins (CP), naphthenes (CN) and aromatics (CA) of studied VGOs. The following equations are used for the estimation of CP, CN and CA:
C A = a v + 3660 / M W
C N = C R C A
C N = C R C A
Equations (1)–(3) include parameters a, v, w and CR, which are estimated by Equations (4)–(7). Equations (4)–(7) are summarized below:
v = 2.51 R I 1.475 d 0.851 a = 430       i f   v > 0 a = 670     i f   v < 0
w = d 0.851 1.11 R I 1.475
i f   w > 0 C R = 820 w 3 S + 10000 / M W
i f   w < 0 C R = 1440 w 3 s + 10600 M W
The property range of the n-d-M method as specified in ASTM D-3228 is given below:
  • %CA: 2.7 to 34.6
  • %CN: 23.7 to 47.2
  • %CP: 32.3 to 68.6
  • RA: 0.12 to 1.69
  • RN: 1.61 to 2.90
  • RT: 1.73 to 3.77

2.2. Determination of Content of Paraffinic (P), Naphthenic (N) and Aromatic (A) Portions by API Procedure 2B4.1 and 3

API adopted the methods developed by Riazi and Daubert for the prediction of the content of paraffinic, naphthenic and aromatic portions on the basis of data from distillation characteristics, specific gravity, molecular weight (MW) and carbon to hydrogen ratio. Riazi found that the n-d-M method gives high errors in the prediction of the composition of petroleum fractions [42]. For that reason, Riazi and Daubert developed a set of correlations for molecular type analysis [19]. The API Procedure for predicting the composition of heavy petroleum fractions with MW > 200 presented in Equations (8)–(10) was used in this study:
P = 193.82 + 0.74855 m 19.966 C H
N = 42.260 0.777 m + 10.7625 C H
A = 100 P N
Parameters m and CH of the investigated VGOs were calculated using the following forms:
m = M W R I 1.4750
C H = C H
Refractive index of studied VGOs was predicted by using the following equations:
R I = 1 + 2 I 1 I 1 2
I = 1.8422 × 10 2 exp 11.6352 × 10 4 T b + 5.144 S G 5.92 × 10 4 T b S G T b 0.4077 S G 3.333
The property range of the methods developed by Riazi and Daubertas specified in [19] is given below:
  • %P: 10.2 to 81.0
  • %N: 13.3 to 63.9
  • %A: 0 to 44.3
The property range of Riazi and Daubert correlations is wider than that of the n-d-M method.

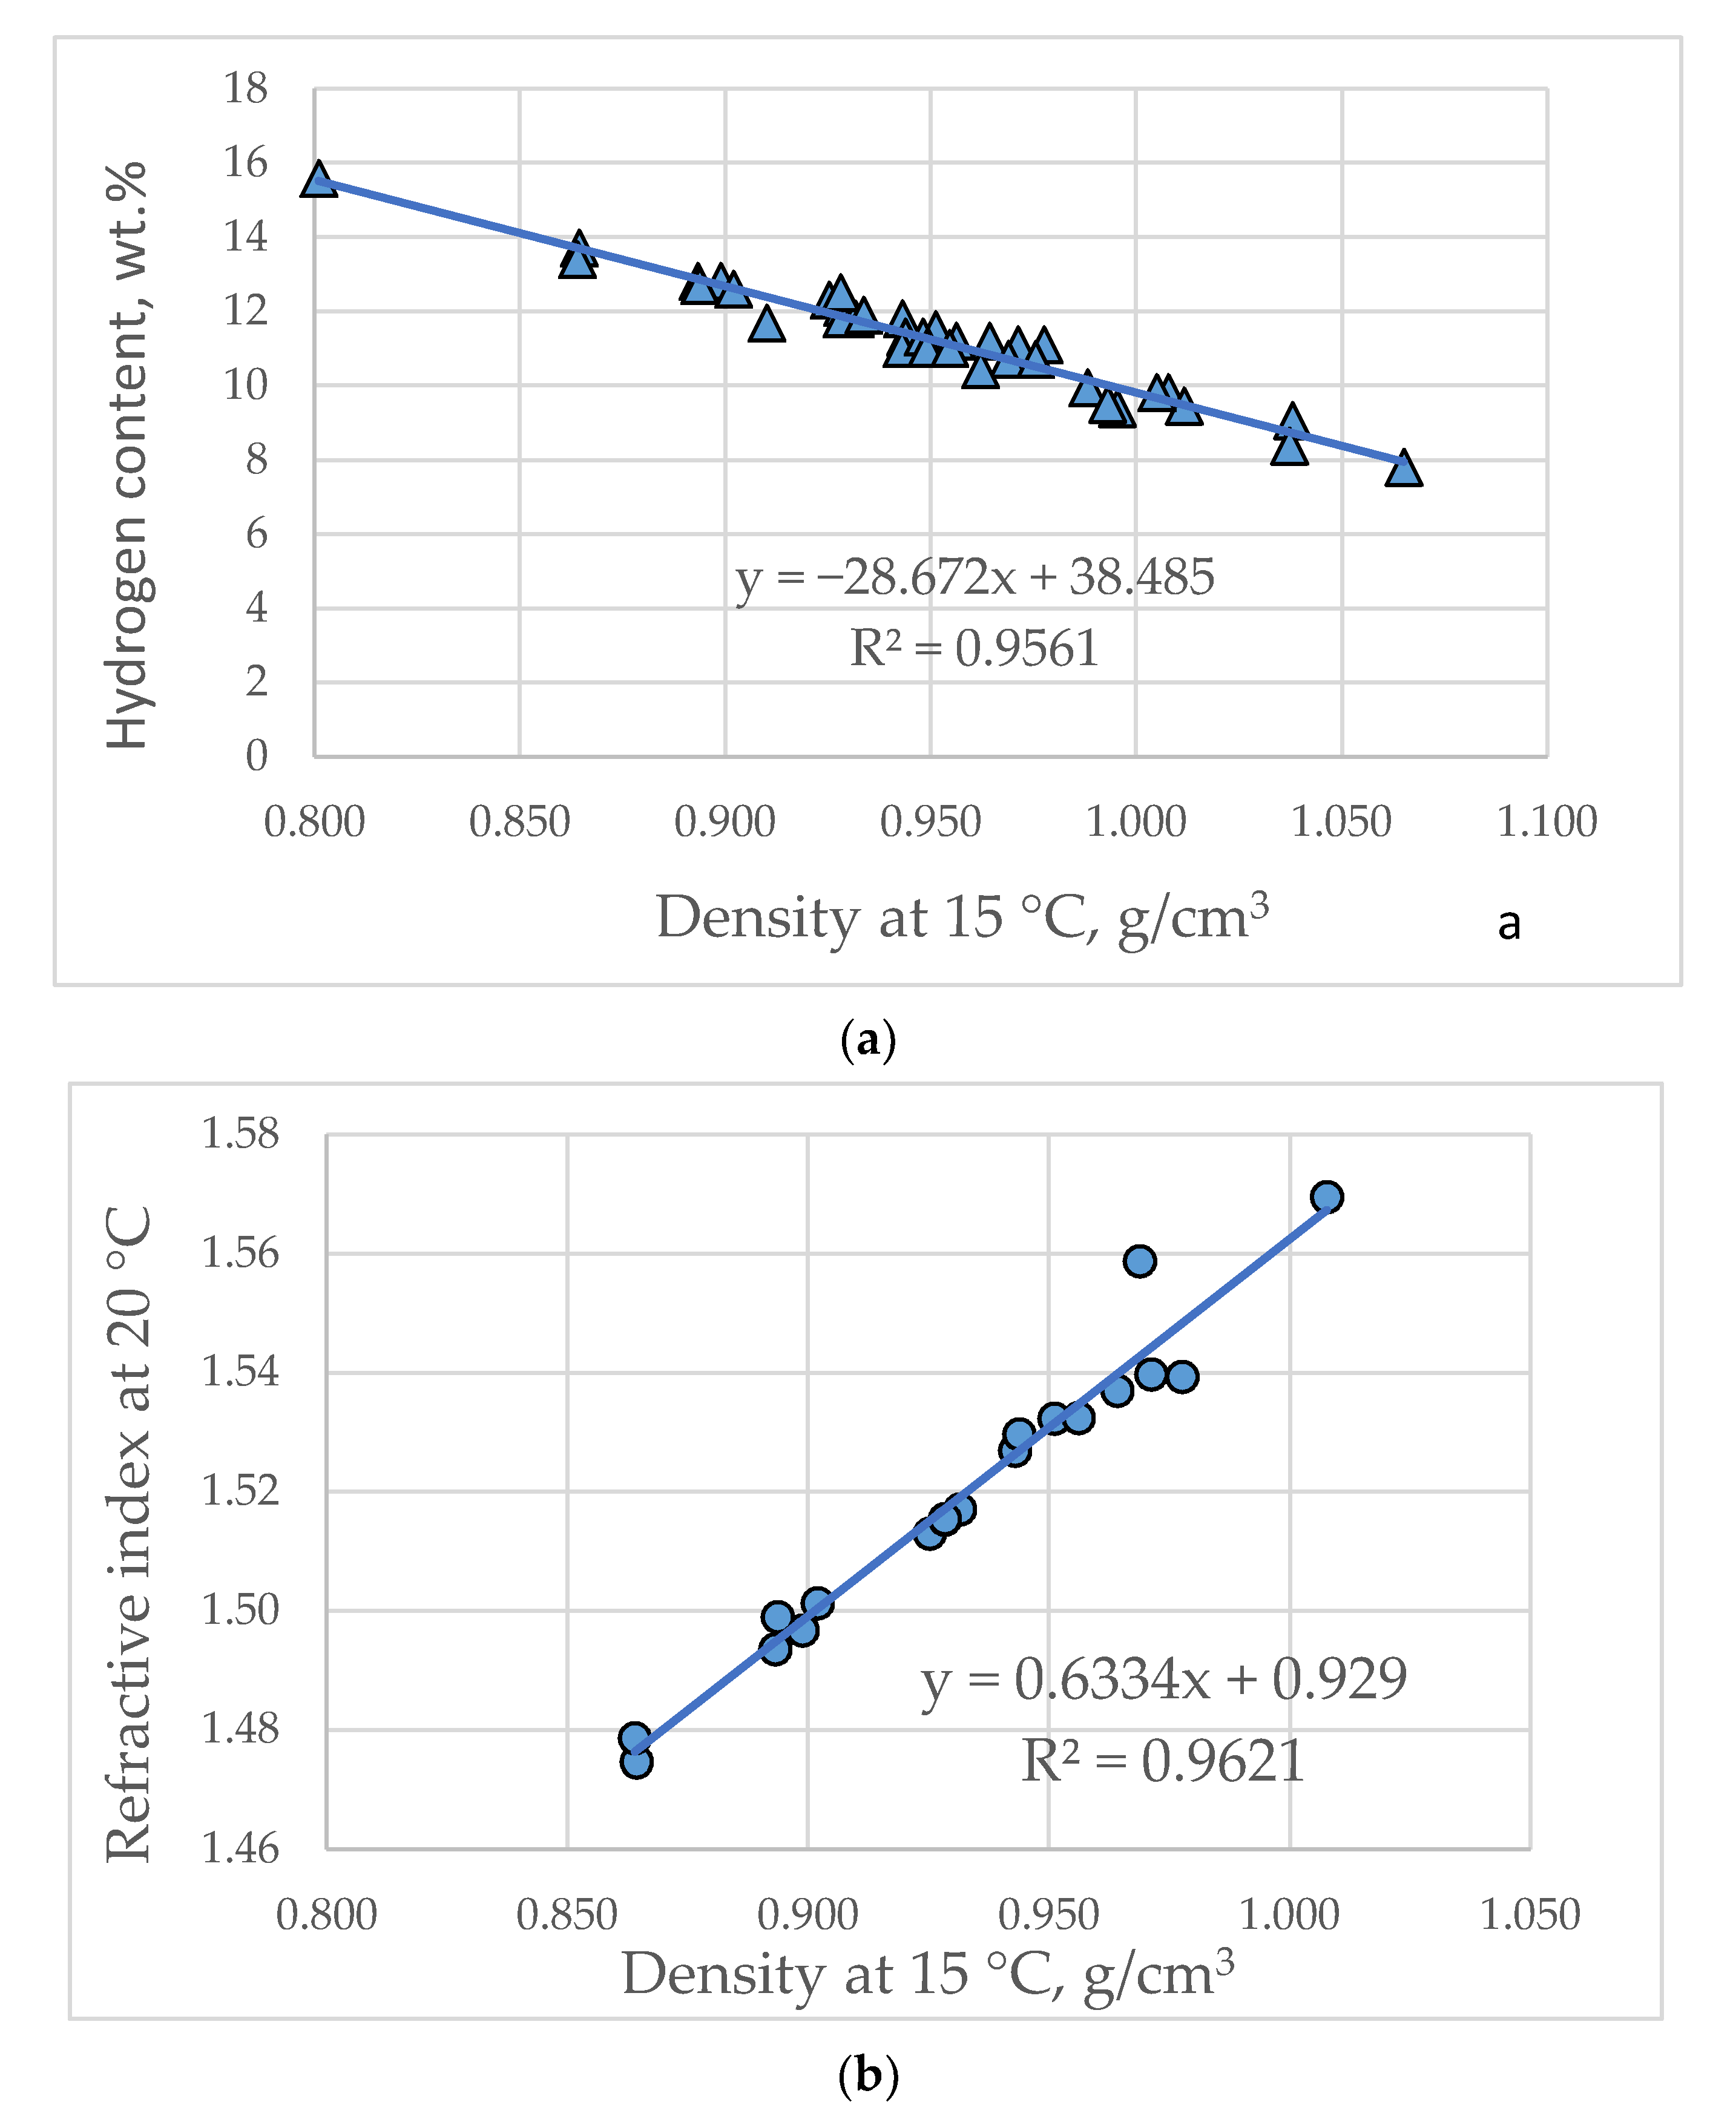
2.3. Determination of Refractive Index, Aromatic Carbon and Hydrogen Content by the Total Method

The Total method was originally developed by Dhulesia to predict the aromatic carbon content, hydrogen content and refractive index of fluid catalytic cracking feedstocks [25]. Since the n-d-M method and API procedure were developed mainly on data from lower boiling fractions, the Total method was developed on data from some heavy feeds [21]. This method uses the values of specific gravity, molecular weight, sulfur content, viscosity at 98.9 °C and distillation according to ASTM D1160. Equations (15)–(18) describe the Total method that was used for estimation of the characteristic parameters of the VGOs under study.
C A = 814.136 + 635.192 R I 129.266 S G + 0.013 M W 0.340 S 6.872 ln V I S
H = 52.825 14.260 R I 21.329 S G 0.0024 M W 0.052 S + 0.757 ln V I S
R I = 1 + 0.8447 S G 1.2056 T + 273.16 0.0557 M W 0.0044
T = T 10 + T 30 + T 50 + T 70 + T 90 / 5
Viscosity at 98.9 °C of studied VGOs was calculated by using the Abbott et al. correlation [30] employing the following equations:
l o g V I S = 0.463634 0.166532 A P I + 5.13447 × 10 4 A P I 2 8.48995 × 10 3 K W A P I
F = 8.0325 × 10 2 K W + 1.24899 A P I + 0.19768 A P I 2 A P I + 26.786 2.6296 K W
The range of properties of the Total method as specified in [25] is given below:
  • %CA: 1.2 to 51.6
  • %H: 9.6 to 14.58
  • SG: 0.8335 to 1.0133
  • RI: 1.4459 to 1.5681
  • T10%, °C: 27 to 478
  • T50%, °C: 385 to 504
  • Viscosity at 98.9 °C, mm2/s: 3.6 to 41.8

2.4. Determination of Hydrogen Content and Molecular Weight by the Method of Goosens

Goosens highlighted the importance of accurate hydrogen content prediction of petroleum fractions, which is used as input in the kinetic models that simulate and optimize the performance of conversion processes like steam cracking and catalytic cracking [22]. He reported that while Dhulesia’s method exhibited a 1% average deviation in hydrogen prediction of FCC feeds, Goosens’ method achieved a standard deviation of only 0.3% in predicted wt.% hydrogen for the full practical range of oil fractions for olefin manufacture. [22]. Goosens’ method requires data on the refractive index, density and distillation characteristics of VGOs to predict hydrogen content [22]. It is inferred from the concept of the molar additivity of the structural contributions of the carbon types in the average hydrocarbon molecule. The following equations were used to calculate the molecular weight and hydrogen content of the studied VGOs:
M W = 0.010770 T b [ 1.52869 + 0.06486 ln T b 1078 T b ] / d
H = 30.346 65.341 R I d + 82.952 d 306 M W
The property range of Goosens’ method as specified in [22,23] is given below:
  • MW, g/mol: 84 to 459 [22]; 76 to 1685 [23]
  • %H: 12.18 to 15.64
  • d, g/cm3: 0.6775 to 0.9292 [22]; 0.63 to 1.08 [23]
  • RI: 1.3832 to 1.5141

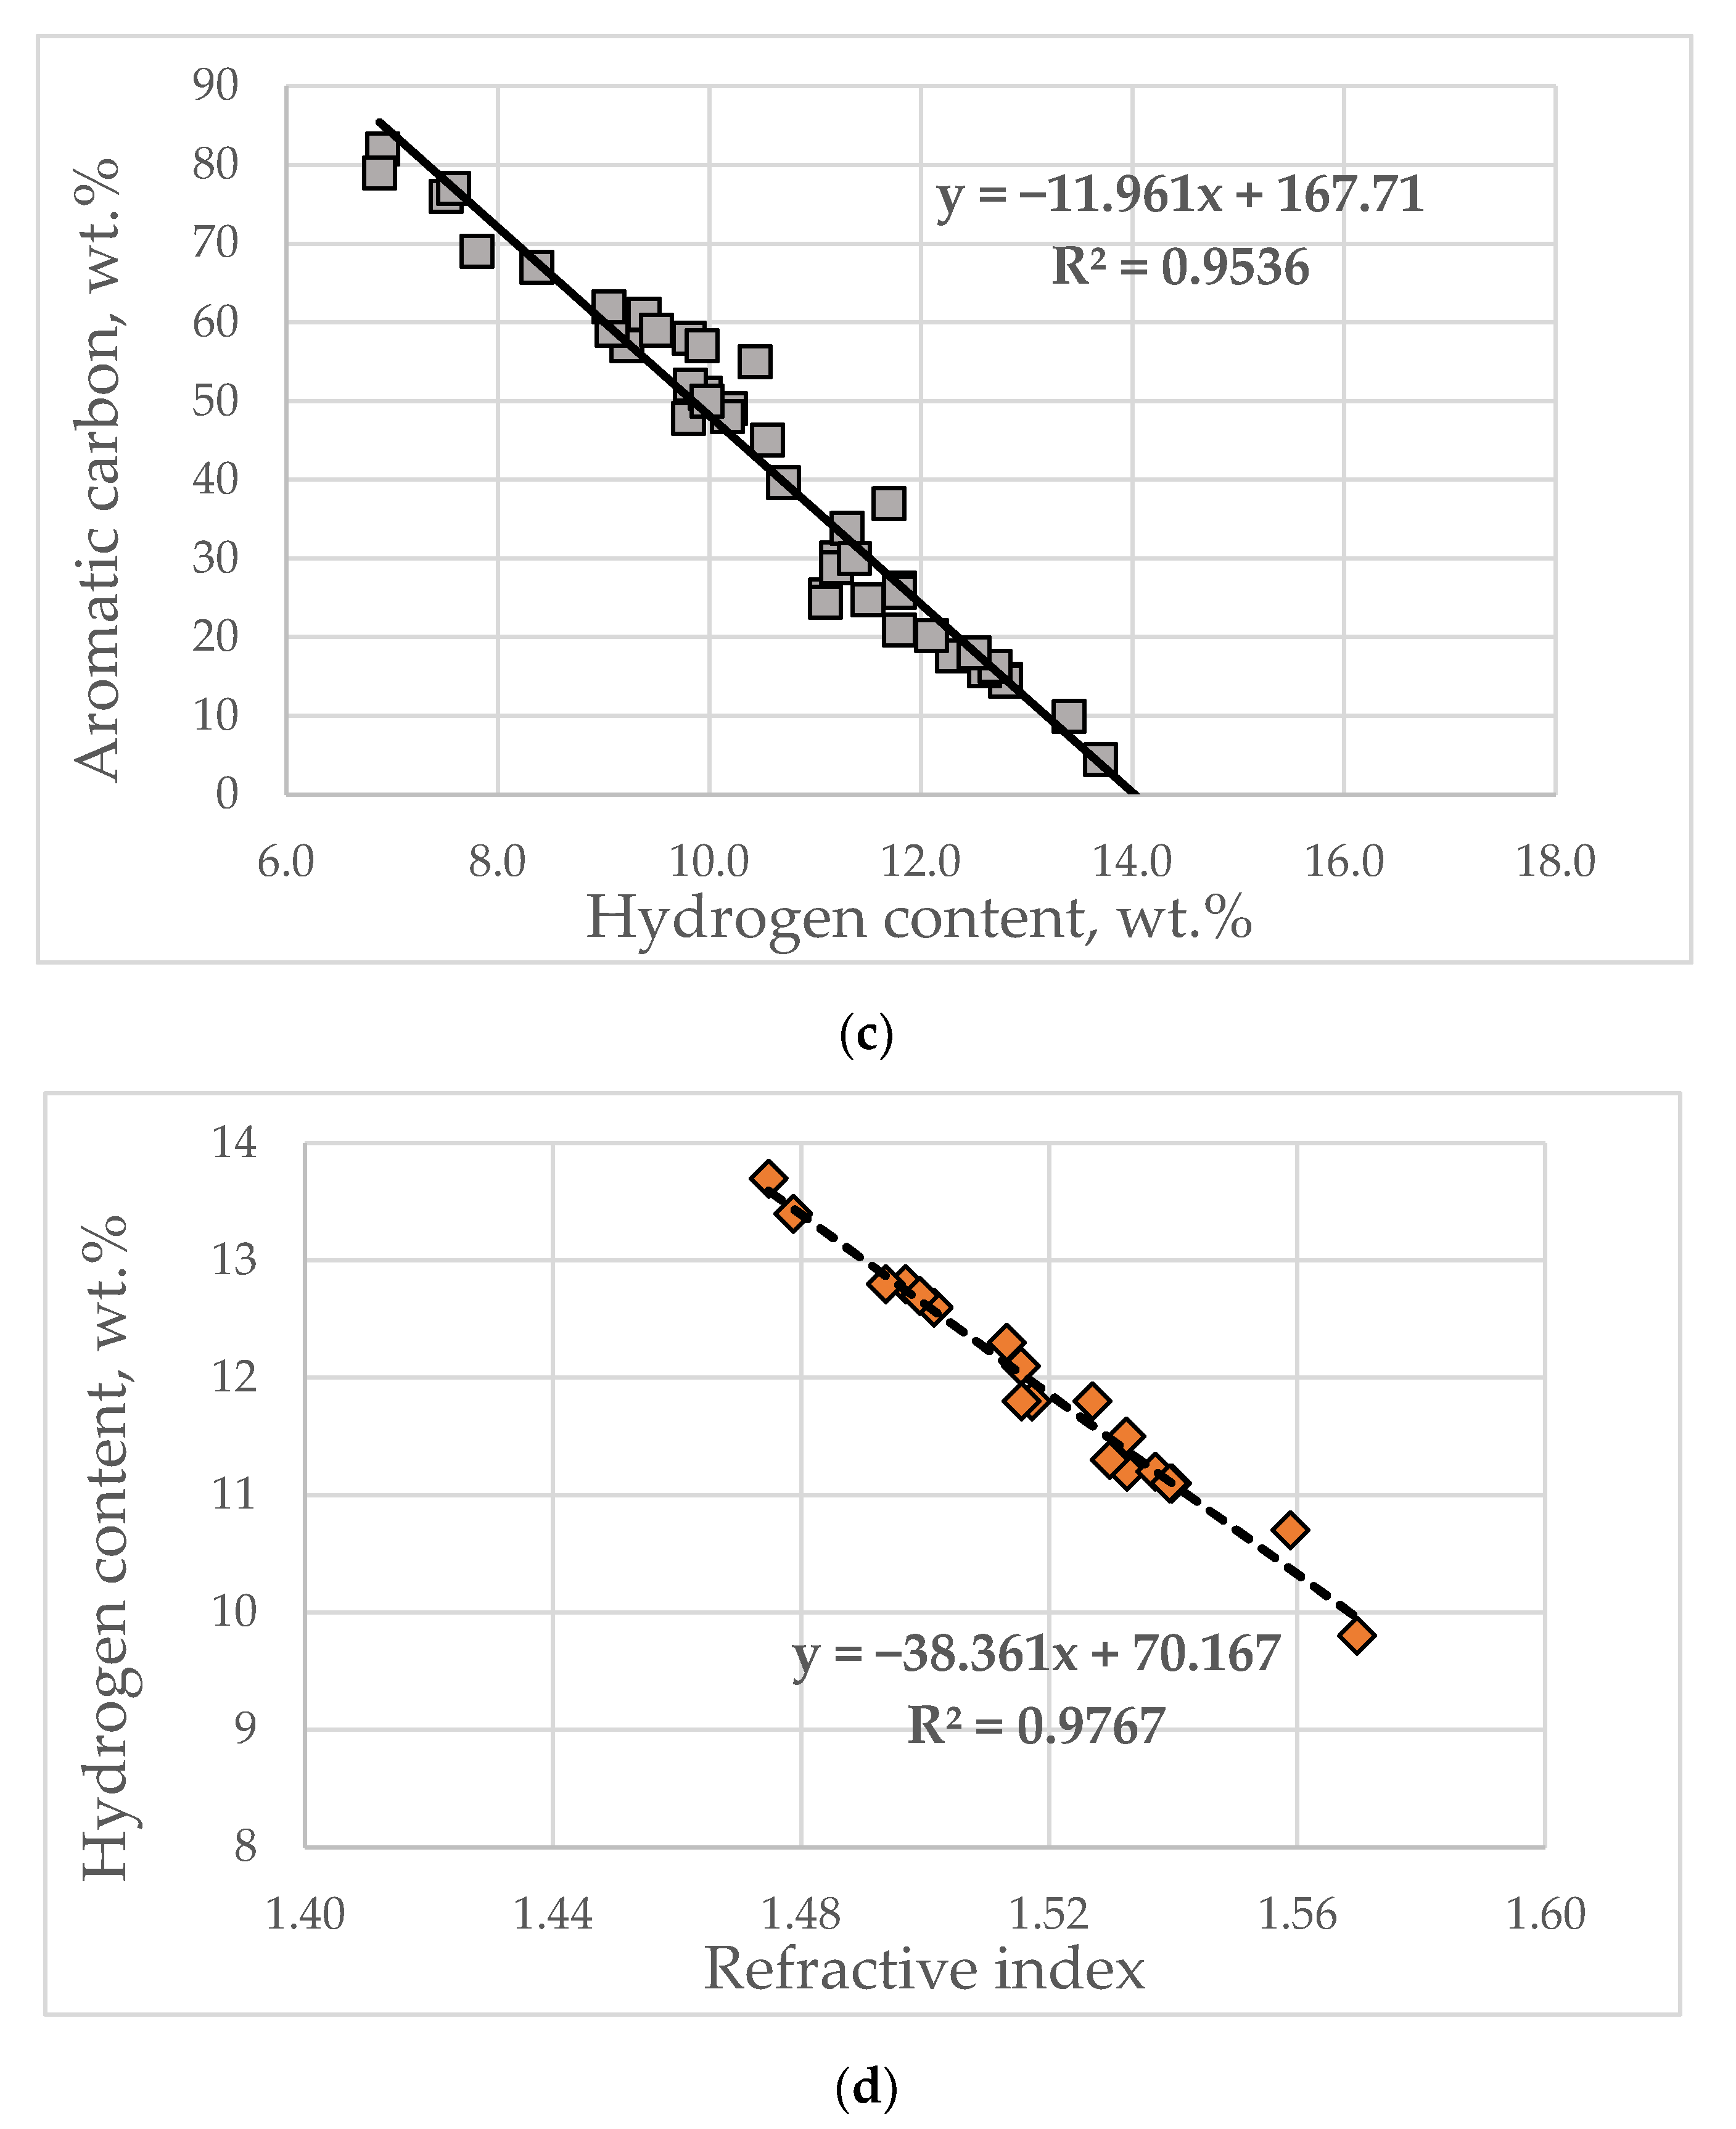
2.5. Determination of Aromatic Carbon and Hydrogen Content by the Conoco Philips Method (COP)

The COP method can accurately predict the carbon aromatic and hydrogen contents of heavy petroleum fractions, employed as feeds for fluid catalytic cracking and hydroprocessing, on the basis of routine analysis data—the specific gravity and T50% (°F). It was developed to accurately estimate aromatic carbon and hydrogen content for the entire heavy petroleum range [21]. In contrast to the Total method that was based on 33 petroleum samples, the COP method was developed based on 354 heavy petroleum samples [21].
Equations (23) and (24) were used to estimate the aromatic carbon and hydrogen content of investigated VGOs.
C A = 292.1 S G 0.043 T 50 F + 35.2
H = 26.25 S G + 0.0013 T 50 F + 35.2
The property range of the COP method as specified in [21] is given below:
  • %CA: 14.0 to 75.0
  • %H: 8.2 to 13.1
  • API (SG): 2.7 to 28 (0.887 to 1.098)
  • RI: 1.485 to 1.660
  • T10%, °C: 277 to 418
  • T50%, °C: 354 to 546
This investigation has also evaluated the refractive index correlations reported by Stratiev et al. in [31,32], Equations (25) and (26).
R I L N B = 0.702091 d 15 0.00011 T 50 + 0.91493  
R I = 0.77887 d 15 + 0.80065
The property range of the Stratiev et al. method as specified in [30,31] is given below:
  • RI: 1.4747 to 1.6538
  • T50%, °C: 243 to 475
  • d15, g/cm3: 0.8630 to 1.0971

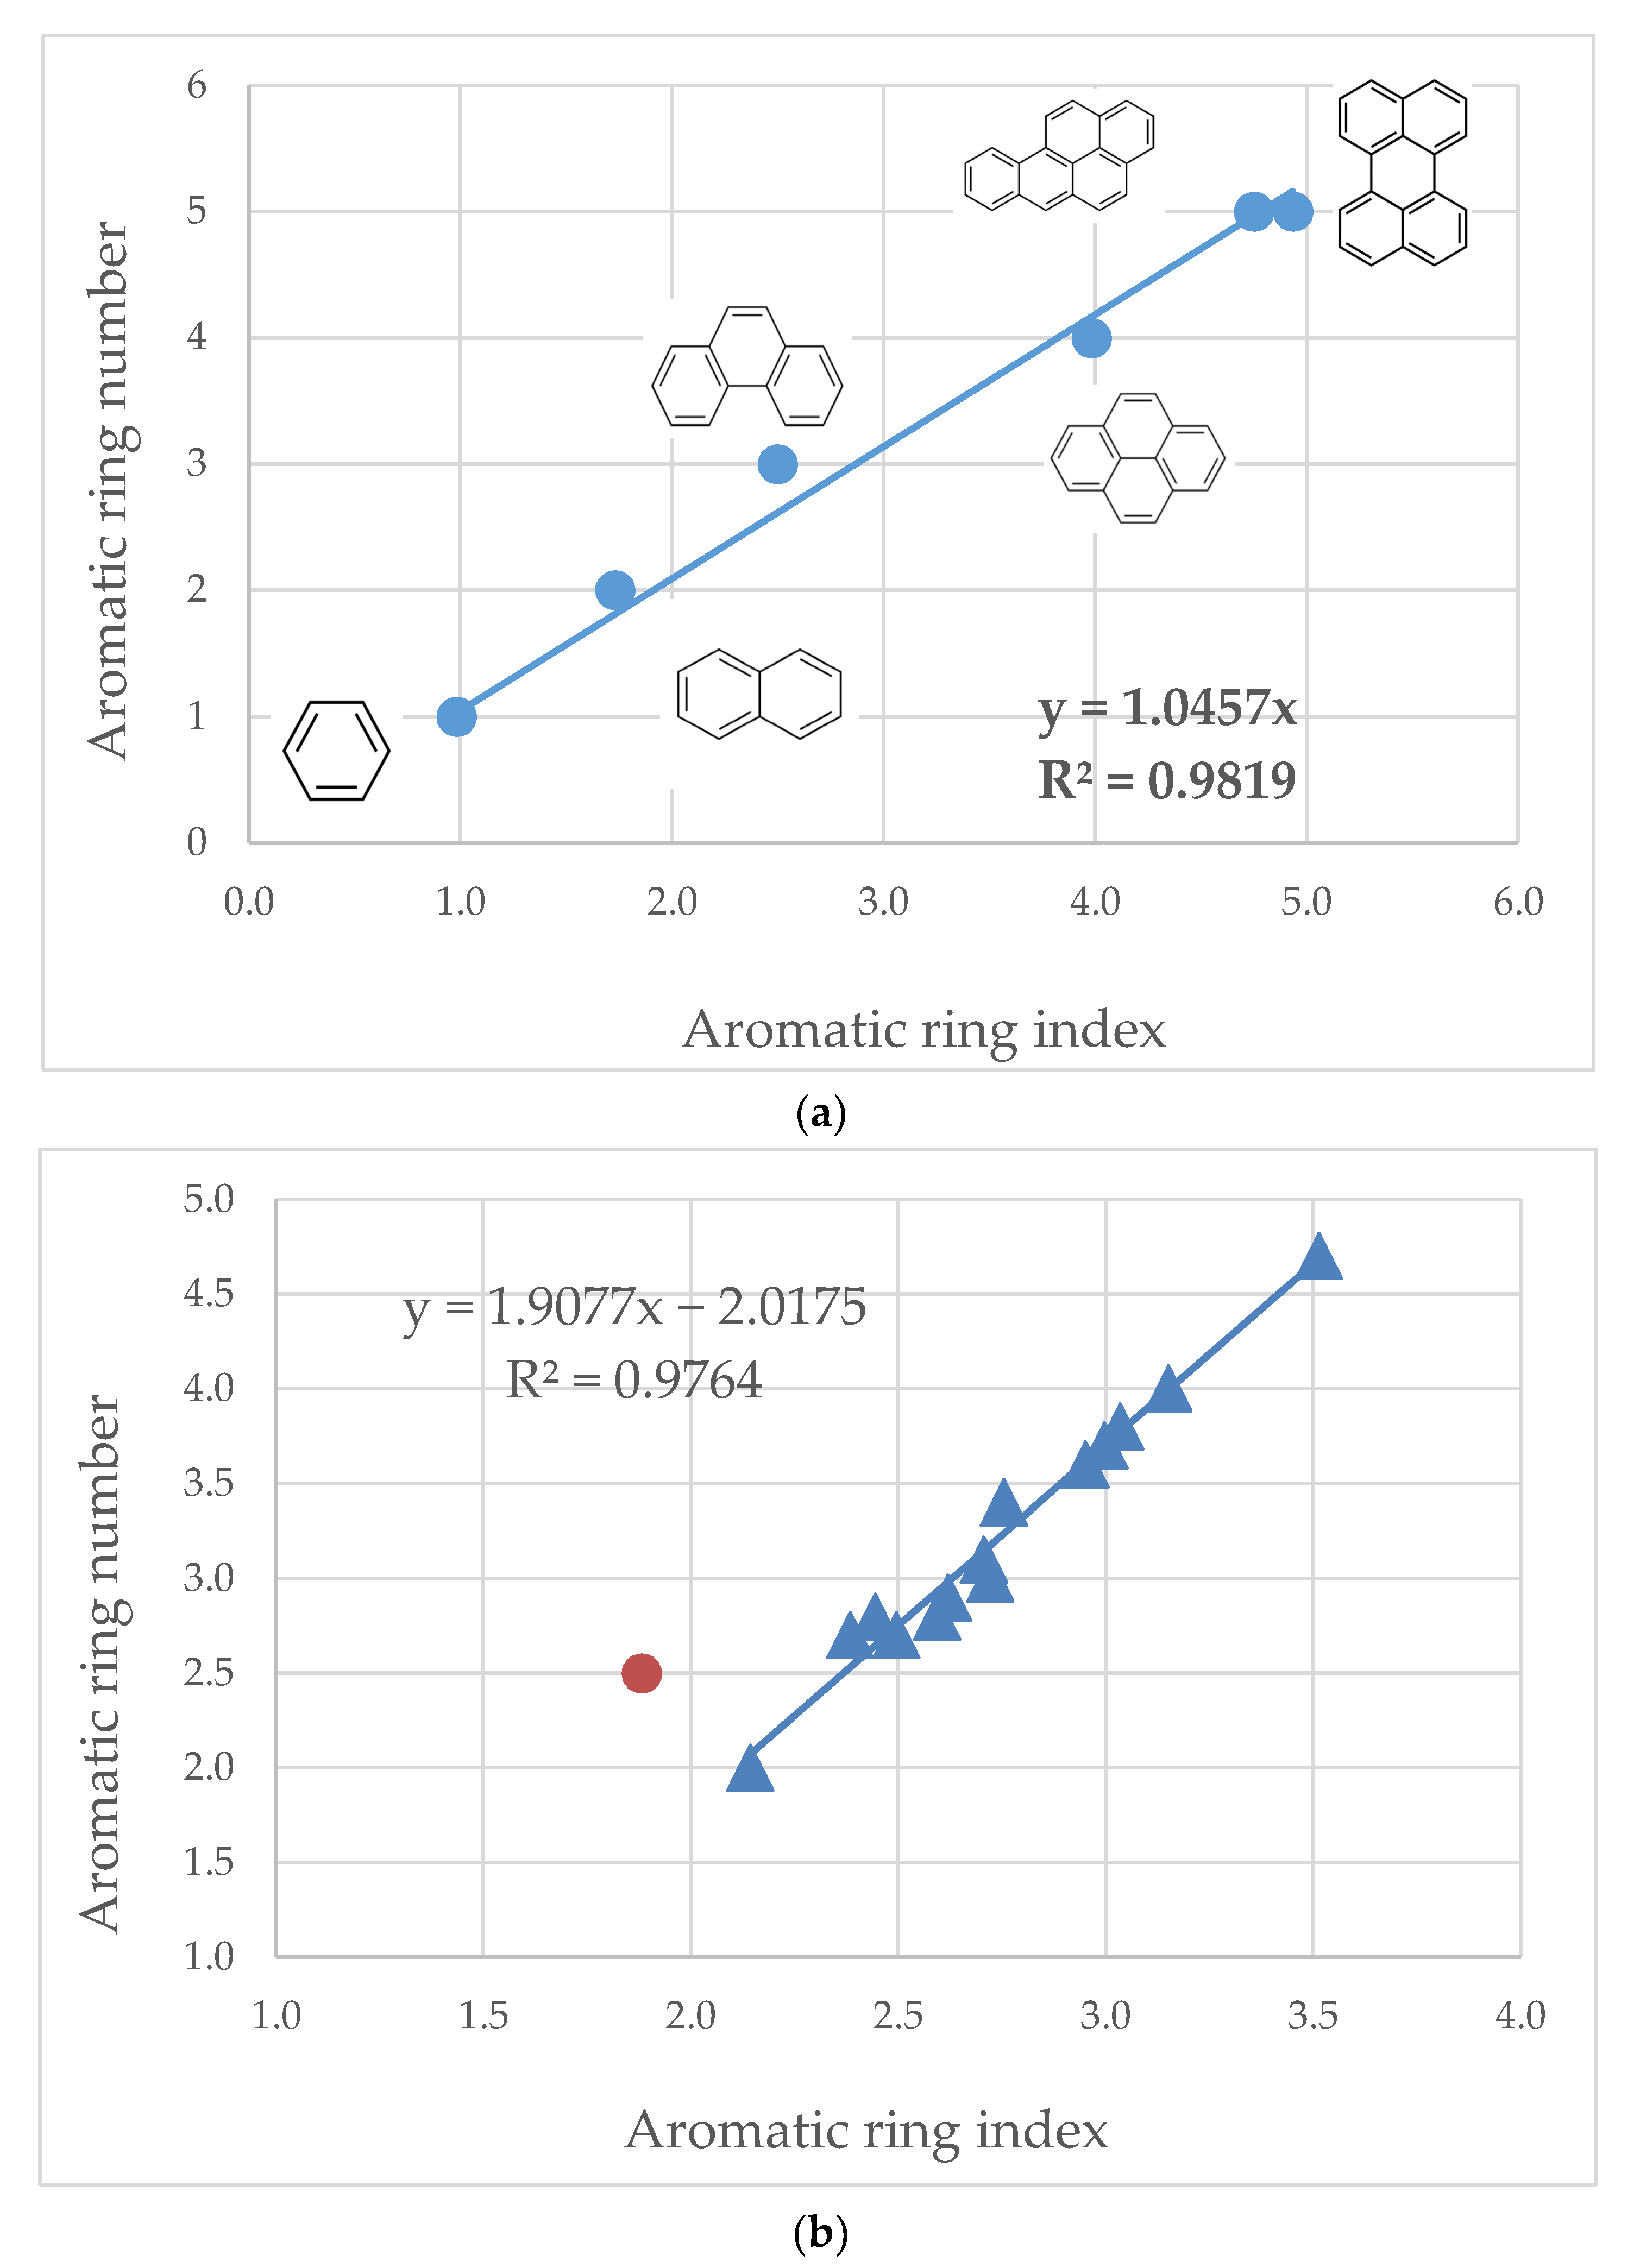
2.6. Aromatic Ring Index (ARI), Developed by Abutaqiya et al. Is a Characterization Factor, Which Is a Function of Molecular Weight and Refractive Index and Is Used to Estimate the Average Aromatic Ring Numbers in the Average Hydrocarbon Structure of the Investigated Vacuum Gas Oils. ARI Is Estimated by Equations (27) and (28)

A R I = f M W , F R I = 2 [ M W F R I   ( 3.5149 M W + 73.1858 } ( 3.5074 M W 91.972 3.5149 M W + 73.1858
where,
MW = molecular weight of EBVRHC heavy oils, g/mol;
FRI = function of refractive index
F R I = n D 20 2 1 n D 20 2 + 2  
where, nD20 = refractive index at 20 °C [26,27].
The methods discussed in this section describe the complex mixture, which is the VGO, in terms of average structural features of the molecules, that is, groups of carbon and/or hydrogen types, in contrast to the compound group. These methods do not provide information in terms of compound types such as saturates, aromatics, mono, di, tri and four plus aromatics. Compound group type methods are based on mass spectrometry (MS) [43]. It was shown in our earlier research [31] that the content of saturates and mono-nuclear aromatics measured by MS can be reasonably well predicted by the empirically estimated aromatic carbon and hydrogen content. However, the property range of variation of the VGOs employed in [31] was narrower than that used in this study. The variation of hydrogen content in our recent investigation [31] was between 7.6 and 13.6 wt.% and that of aromatic carbon content was between 4.3 and 73.5 wt.%.

3. Results

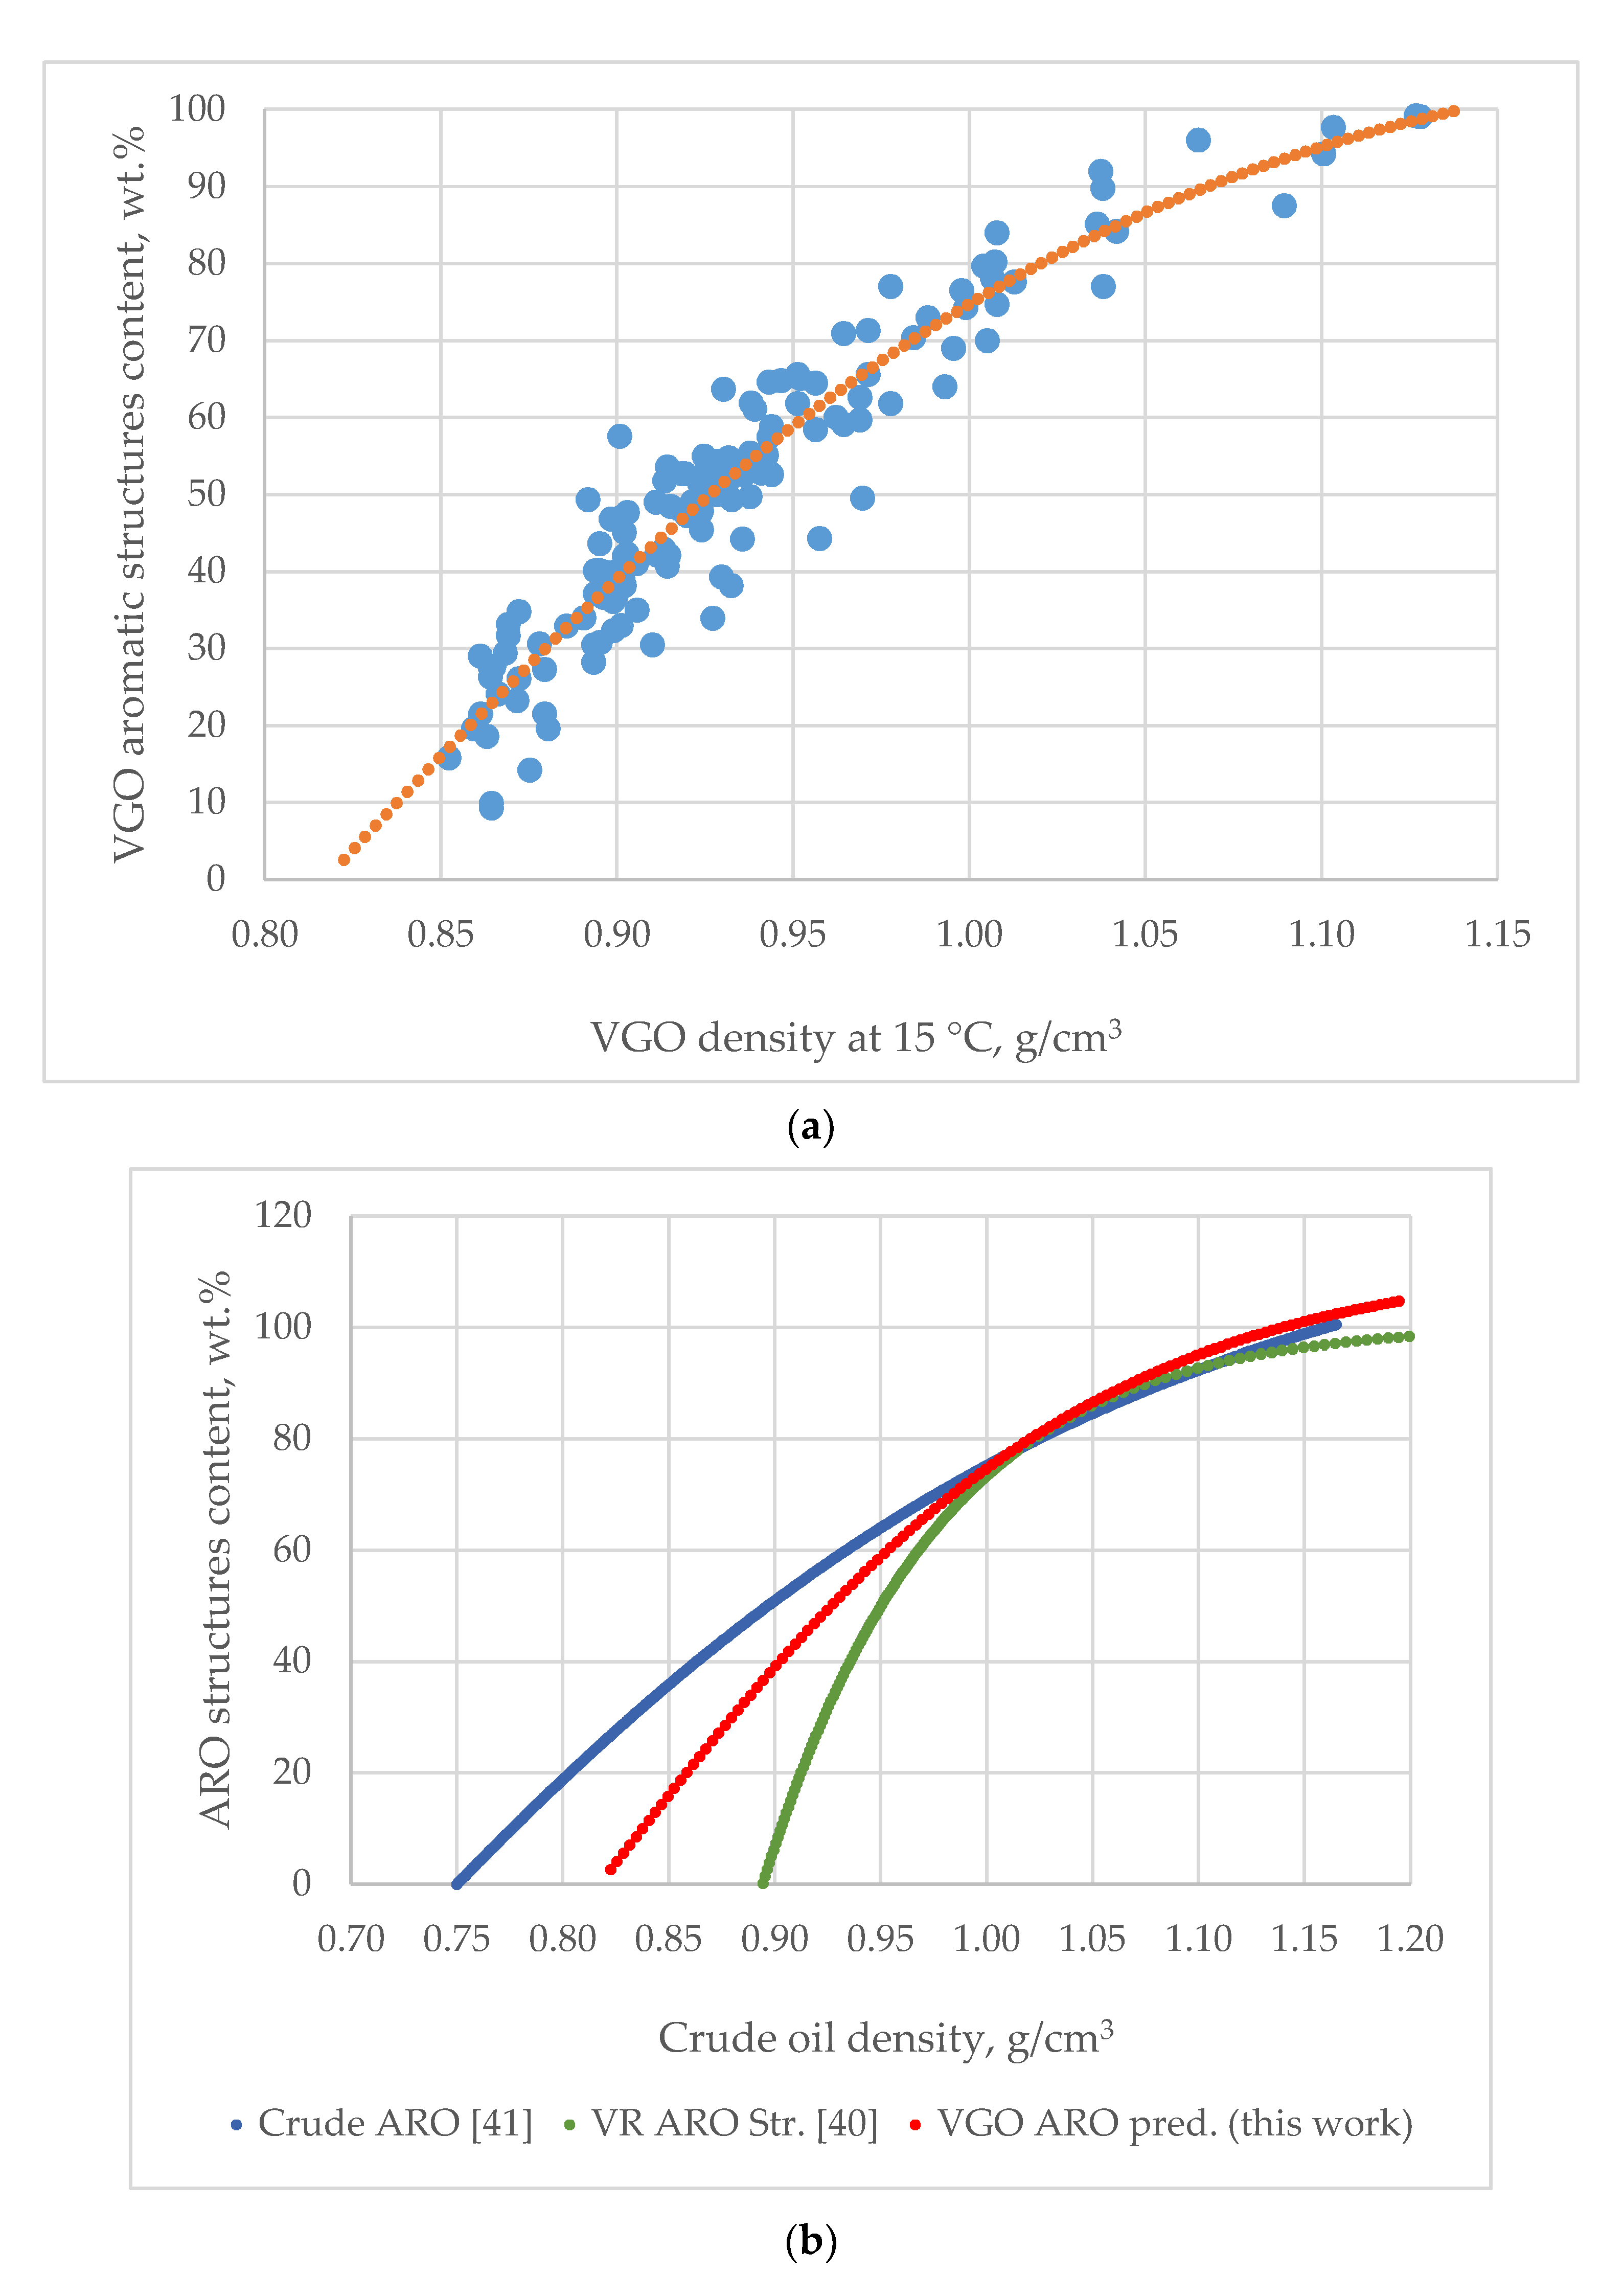
3.1. Evaluation of VGO Property Relations and Predictions of the Empirical Models and Development of New Empirical Models

Table 1 summarizes the range of variation of the evaluated vacuum gas oils. It is evident from these data that the range of variation in the composition and in the physical and chemical properties is very big and is wider than the property ranges for the empirical models discussed in the Materials and Methods section. Therefore, it could be considered representative enough for the purpose of the investigation of the vacuum gas oil properties’ relations. Inter-criteria analysis (ICrA) was employed to search for statistically significant relationships between different VGO properties. The reader can find more information concerning the application of ICrA in our recent studies [7,44]. ICrA defines the relations between the studied criteria (parameters) in terms of intuitionistic fuzzy pairs 〈μ, ν〉 [7,44]. Depending on the values of μ, ν seen in pair, positive consonance, negative consonance and dissonance between any pair of criteria (parameters) can be defined. Values of μ = 0.75 ÷ 1.00 and ν = 0.00 ÷ 0.25 denote a statistically meaningful positive relation, where the strong positive consonance is exhibited at values of μ = 0.95 ÷ 1.00, ν = 0.00 ÷ 0.05 and the weak positive consonance is exhibited at values of μ = 0.75 ÷ 0.85, ν = 0.15 ÷ 0.25. Respectively, the values of negative consonance with μ = 0.00 ÷ 0.25 and ν = 0.75 ÷ 1.05 represent a statistically meaningful negative relation, where the strong negative consonance exhibits values of μ = 0.00 ÷ 0.05, ν = 0.95 ÷ 1.00 and the weak negative consonance exhibits values of μ = 0.15 ÷ 0.25, ν = 0.15 ÷ 0.25. All other cases are characterized as dissonance [7,44].
Table 2 presents the statistically significant relations quantified by μ-value of ICrA for the evaluated vacuum gas oils. The data in Table 2 indicate that density strongly negatively correlates with hydrogen content (μ = 0.02), H/C atomic ratio (μ = 0.03) and strongly positively with refractive index (μ = 0.98). The density intermediately negatively correlates with saturate content (μ = 0.07) and intermediately positively with aromatic carbon content (μ = 0.91) and weakly positively with di-nuclear aromatic hydrocarbons (μ = 0.76). These data confirm that density is a property that well describes aromaticity and hydrogen deficiency as already reported in our recent studies [44,45]. Kw-factor strongly negatively correlates with the aromatic carbon content (μ =0.05) and strongly positively with H/C atomic ratio (μ = 0.96). This finding is in line with the results reported in our recent research [46] showing that the Kw-factor correlates with the aromaticity of petroleum and petroleum products. Hydrogen content strongly negatively correlates with aromatic carbon content (μ = 0.02) and with refractive index (μ = 0.02). The hydrogen strongly positively correlates with the aniline point and intermediately positively correlates with the saturate content. The refractive index strongly negatively correlates with the aromatic carbon content. These data show that density, refractive index and hydrogen content strongly correlate with the aromatic carbon content and they also correlate with each other. Figure 1 exemplifies these correlations. They were used to estimate some of the properties employed in Equations (4) and (5). The relationship between density and refractive index shown in Figure 1b was juxtaposed against the correlations predicting refractive index reported in [20,25,31,32]. Table S4 from Supplementary material presents a comparison between measured and predicted by the empirical correlations refractive index: Equations (13), (19), (31), (32) and Figure 1b. It is evident from these data that the average absolute deviation increases in the order: Equation (30) (AD = 0.0044) < Equation (19) (AD = 0.0047) < Equation (Figure 1b; AD = 0.0078) < Equation (31) (AD = 0.0094) < Equation (13) (0.0104). Based on these data one may conclude that density and T50% are the VGO characteristics that best describe the refractive index.
Table S5 from Supplementary material exhibits a comparison between the measured and predicted hydrogen content in VGOs of different origins by the empirical correlations studied in this work. It is evident from these data that the average absolute deviation increases in the order: (H, COP correlation; Equation (16); AD = 0.05 wt.%) < (Figure 1d; AD = 0.11 wt.%) < (H, Dhulesia; Equation (16); AD = 0.34 wt.%) < (H, Goosens, Equation (22); AD = 0.43 wt.%). It could be concluded here again that density and T50% are the VGO characteristics that best describe the hydrogen content.
The data from Table S1 from Supplementary material were used to develop two more correlations of predictions of VGO aromatic carbon content, by employing multiple linear regression. They are summarized below as Equations (29) and (30):
C A = 168.2 11.2109 H 0.02552 M W R 2 = 0.981
C A = 245.8 0.07053 T 50 + 325.6533 d 15 R 2 = 0.966
The property range for Equations (29) and (30) are as follows: CA = 4.4 to 82 wt.%; H = 6.88 to 13.7 wt.%; d15 = 0.864 to 1.102 g/cm3; T50% = 369 to 690 °C.
Table S6 from Supplementary material shows a comparison between measured and predicted aromatic carbon content by the empirical correlations of Dhulesia [25] and Choudhary (COP) [21], Figure 1c, Equations (32) and (33). These data show that the average absolute deviation increases in the order: (Equation (32); AD = 2.1 wt.%) < (Equation (33); AD = 2.8 wt.%) < (Figure 1c; AD = 3.1 wt.%) < (COP, Equation (23); AD = 3.4 wt.%) < (Dhulesia; Equation (15); AD = 7.5 wt.%). The most accurate is the prediction of VGO CA content from the information on the hydrogen content, the molecular weight and Equation (32), followed by information on the density and T50% and Equation (33). Here, again the significance of density and T50% of VGO for its characterization is highlighted by modeling the aromatic carbon content prediction.
Table 3 summarizes the range of variation of the contents of aromatic carbon, hydrogen, paraffinic carbon, naphthenic carbon, aromatic parts, naphthenic parts, paraffinic parts and aromatic ring index. It is worth noting here that the n-d-M method reports negative values for aromatic carbon (DQ-VGO, sample Nr.40 from Table S1 from Supplementary material), naphthenic carbon contents (Visbroken, sample Nr.18 from Table S1 from Supplementary material), the API method reports a negative value for the content of paraffinic parts (DQ-VGO, sample Nr.40 from Table S1 from Supplementary material); (DG-CGO, sample Nr.41) and (FCC SLO (CLO-15), sample Nr. 56). These findings support the reasoning of Choudhary and Meier [21] that the n-d-M method and API procedure, due to their development being based mainly on data for lower boiling factions, are expected to be less accurate. Nevertheless, the n-d-M method has been used in several studies on the reactivity of FCC feedstocks to characterize the heavy oils [5,7,47,48]. The data from this study suggest that the n-d-M method and API procedure cannot be employed for the characterization of the whole range of investigated vacuum gas oils, because a negative value for the content of any component has no physical meaning. All three methods for the prediction of aromatic carbon content, as well as the ARI, report negative values. It was found that the negative value for the aromatic carbon content and ARI is reported for the DQ-VGO [36] (see Table S2 from Supplementary material). However, if we calculate the number of carbon and hydrogen atoms employing the formulas (31) and (32) we can get the following empirical composition for DQ-VGO—C30H66.
N C = C a r b o n   c o n t e n t 100 * M W 12
N H = H y d r o g e n   c o n t e n t 100 * M W 1
This empirical composition for DQ-VGO is very close to that of Triacontane (C30H62) whose physical properties like density = 0.81 g/cm3, molecular weight = 423 g/mol [49] and boiling point 450 °C) are very close to those of DQ-VGO (density = 0.801 g/cm3 and molecular weight = 426 g/mol (see Table S1 from Supplementary material)). Based on these facts one may suggest that the saturate content of DQ-VGO should be 100%, and the content of aromatic carbon should be zero. Instead, the reported content of saturates for the DQ-VGO is 83.0 wt.%. In our earlier researches [44,45] we employed the non-linear least squares method to model the function of aromatic structure contents of vacuum residual oils and crude oils from density. In this way, the density at zero aromatic structure content was modeled for the vacuum residual oils and crude oils. The model developed was used as a tool for detecting incorrect results from SARA analysis of vacuum residual oils [44]. We decided to apply the same approach to model the dependence of aromatic structure content on the density of vacuum gas oils using another set of data for density and aromatic structure (aromatics + resins + asphaltenes fractions) content of 144 VGOs taken from the literature source [50]. This data set is given in Table S3 from Supplementary material and covers VGOs having density = 0.8521 to 1.1279 g/cm3 and aromatic structure content = 9.3 to 99.2 wt.%. These data were processed by the non-linear least squares method to construct the function f1 of VGO aromatic structure content from the VGO density such that:
  • The function f1 is monotonically increasing.
  • There exists a point x0 in the interval [0.8, 0.9 g/cm3] such that f1(x0) = 0 (aromatic structure content = 0). (This interval was defined by the value for density of triacontane (C30H62).
  • f1(x) < 100 for all x ∈ [x_0, ∞].
  • The function f1 approximates data xi (density), yi (aromatic structure content) from the data in Table S3 from Supplementary material (mentioned above).
As model function f1 we consider logistic function in the form
f 1 x ; a 1 , b 1 , c 1 , d 1 = 100 c 1 + a 1 exp b 1 x d 1
Here a1, b1, c1 and d1 are constant. Let us set (x0 is any real number)
d 1 = 100 c 1 + a 1 exp b 1 x 0
Then, obviously f i x 0 = 0 .
Therefore, we have to solve the following min-min problem
m i n x 0 { m i n a 1 , b 1 , c 1 { i = 1 107 y i f 1 x i 2 } + m i n a 2 , b 2 , c 2 { i = 1 21 y i f 2 x i 2 }   + m i n a 3 , b 3 , c 3 { i = 1 20 y i f 3 x i 2 } }
We use the computer algebra system Maple (and GlobalOptimization Toolbox) to solve numerically the obtained non-linear min-min problem. As a global search algorithm, we used a differential evolution method, see [51] and references therein.
The following expression was obtained for the VGO aromatic structure content dependence on VGO density for the data from Table S3 from Supplementary material (Equation (36)):
A R O = 100 0.4426 + 547.9 e 8.719 d 113.1
Figure 2a illustrates a graph of the dependence of VGO aromatic structure content on density. The dotted lines are the values predicted by Equation (39) for the aromatic structure contents for the 144 VGOs. The zero content of the aromatic structures obtained from Equation (39) was found to correspond to the VGO density of 0.817 g/cm3. This value was obtained from the solution of Equation (39). This value is close to the density of Triacontane and therefore could be considered reliable. The data in Figure 2b indicate different shapes of the three curves describing the relationship of density to the aromatic structure content for crude oils, VGOs and vacuum residues at densities lower than 1.02 g/cm3. Zero aromatic structures were found to correspond to density of 0.750 g/cm3 for crude oils [45], 0.817 g/cm3 for VGOs and 0.881 g/cm3 [44] for vacuum residues. At densities higher than 1.02 g/cm3 the dependence of aromatic structure content on density becomes equal for the three studied oils: crude oils; VGO and vacuum residue and the slope of increase of aromatic structure content decreases with the enhancement of density. This suggests that the augmentation of density at a value above 1.02 g/cm3 is associated with the magnification of the content of the aromatic structures having a higher number of condensed rings, without a significant increase of the total content of aromatic structures. An evaluation of the content of the aromatic structures with a higher number of condensed rings could be obtained by the use of the ARI model [26,27]. The verification of the good fit of ARI to the number of aromatic rings in hydrocarbons and in vacuum gas oils (fluid catalytic cracking slurry oils (FCC SLOs); data taken from Ref. [38]) is illustrated in Figure 3a,b. As apparent from the data in Figure 3b, one sample of FCC SLO deviates from the regression line (Sample Nr 56 from Table S1 from Supplementary material). The same sample exhibited the biggest absolute deviation in aromatic carbon prediction by Equation (15) (AD = 21.7 wt.% (Dhulesia), Equation (23) (AD = 15.0 wt.%) (COP), Equation (29) (AD = 11.1 wt.%) and Equation (30) (AD = 13.4 wt.%). This implies some kind of unusual behavior of Sample Nr. 56 that is difficult to explain in this study. Keeping in mind that 100-aromatic structure content equals the saturate content, Equation (36) was used to predict saturate content of the studied VGOs from Table S1 from Supplementary material. Figure 4a shows the agreement between measured and estimated VGO saturate content to be 100 according to Equation (36). The average absolute deviation is 5.6 wt.% with the biggest absolute deviation observed for DQ-VGO (AD = 24.9 wt.%). By the use of multiple linear regressions of the data obtained by subtraction from 100% Equation (36) and the ARI, the following correlation was developed:
V G O   S a t u r a t e s = 1.867 + 0.9103 100 A R O + 9.3398 A R I 2 R 2 = 0.933
where,
VGO saturates = VGO saturate content, wt.%;
ARO = VGO aromatic structure content, estimated by Equation (36);
ARI = Aromatic ring index
Equation (37) was developed for the following VGO property range: d15 = 0.8010 to 1.1023 g/cm3; ARI = −1.6 to 3.6; saturate content = 0.8 to 90.1 wt.%.
Figure 4b presents the agreement between the measured and calculated VGO saturate contents by Equation (37). It is evident from the data in Figure 1 that Equation (37) predicts the VGO saturate content better (average absolute deviation of 4.1 wt.%) than Equation (36). This could be ascribed to the inclusion of ARI in the regression implying that the ARI is an important parameter in the characterization of VGOs. Table S7 from Supplementary material presents detailed data on the measured and predicted VGO saturate contents by Equations (36) and (37) and their absolute deviations. Considering that the reproducibility of measurement of the saturate content of heavy oils according to ASTM D 2007 is 7.8 wt.% [52], one can see that four predictions out of 37 are outside of that limit for Equation (40) (10.8%). For Equation (36), the predictions outside of the reproducibility limit for VGO saturate content measurement are eight. However, if we assume that saturate content in DQ-VGO is 100%, due to the reasons explained beforehand, the number of predictions falling outside the reproducibility limit would become three out of 37 (8.1%). The verification of the correctness of measurement of saturate content of FCC SLO (sample Nr 57 from Table S1 from Supplementary material) by juxtaposing its hydrogen content against the relation established for FCC slurry oils (data extracted from Ref. [38]), shown in Figure S1, indicates that this FCC SLO should have saturate content of 19 wt.%. This value almost completely coincides with that predicted by Equation (37)—19.4 wt.%. Therefore, an assumption can be made that the saturate content of FCC SLO (sample Nr 57 from Table S1 from Supplementary material) might be wrong.
Concerning the heavy aromatic content (tri + condensed aromatics) prediction it was found that it correlates with the aromatic carbon content. However, two VGO groups were identified to obey different dependencies: the FCC slurry oils and the remaining VGOs. Figure 5a indicates the relationship between aromatic carbon content and heavy aromatic content for FCC slurry oils, which is described by a second-order polynomial. Figure 5b exhibits the relationship between aromatic carbon content and heavy aromatic content for VGOs different from FCC slurry oils, which is described by a linear function. The content of heavy aromatics specifies the part of the VGO that, during thermal and catalytic cracking, will define the yield of unconverted VGO, that is, the product with the lowest value as reported in our recent study [53].

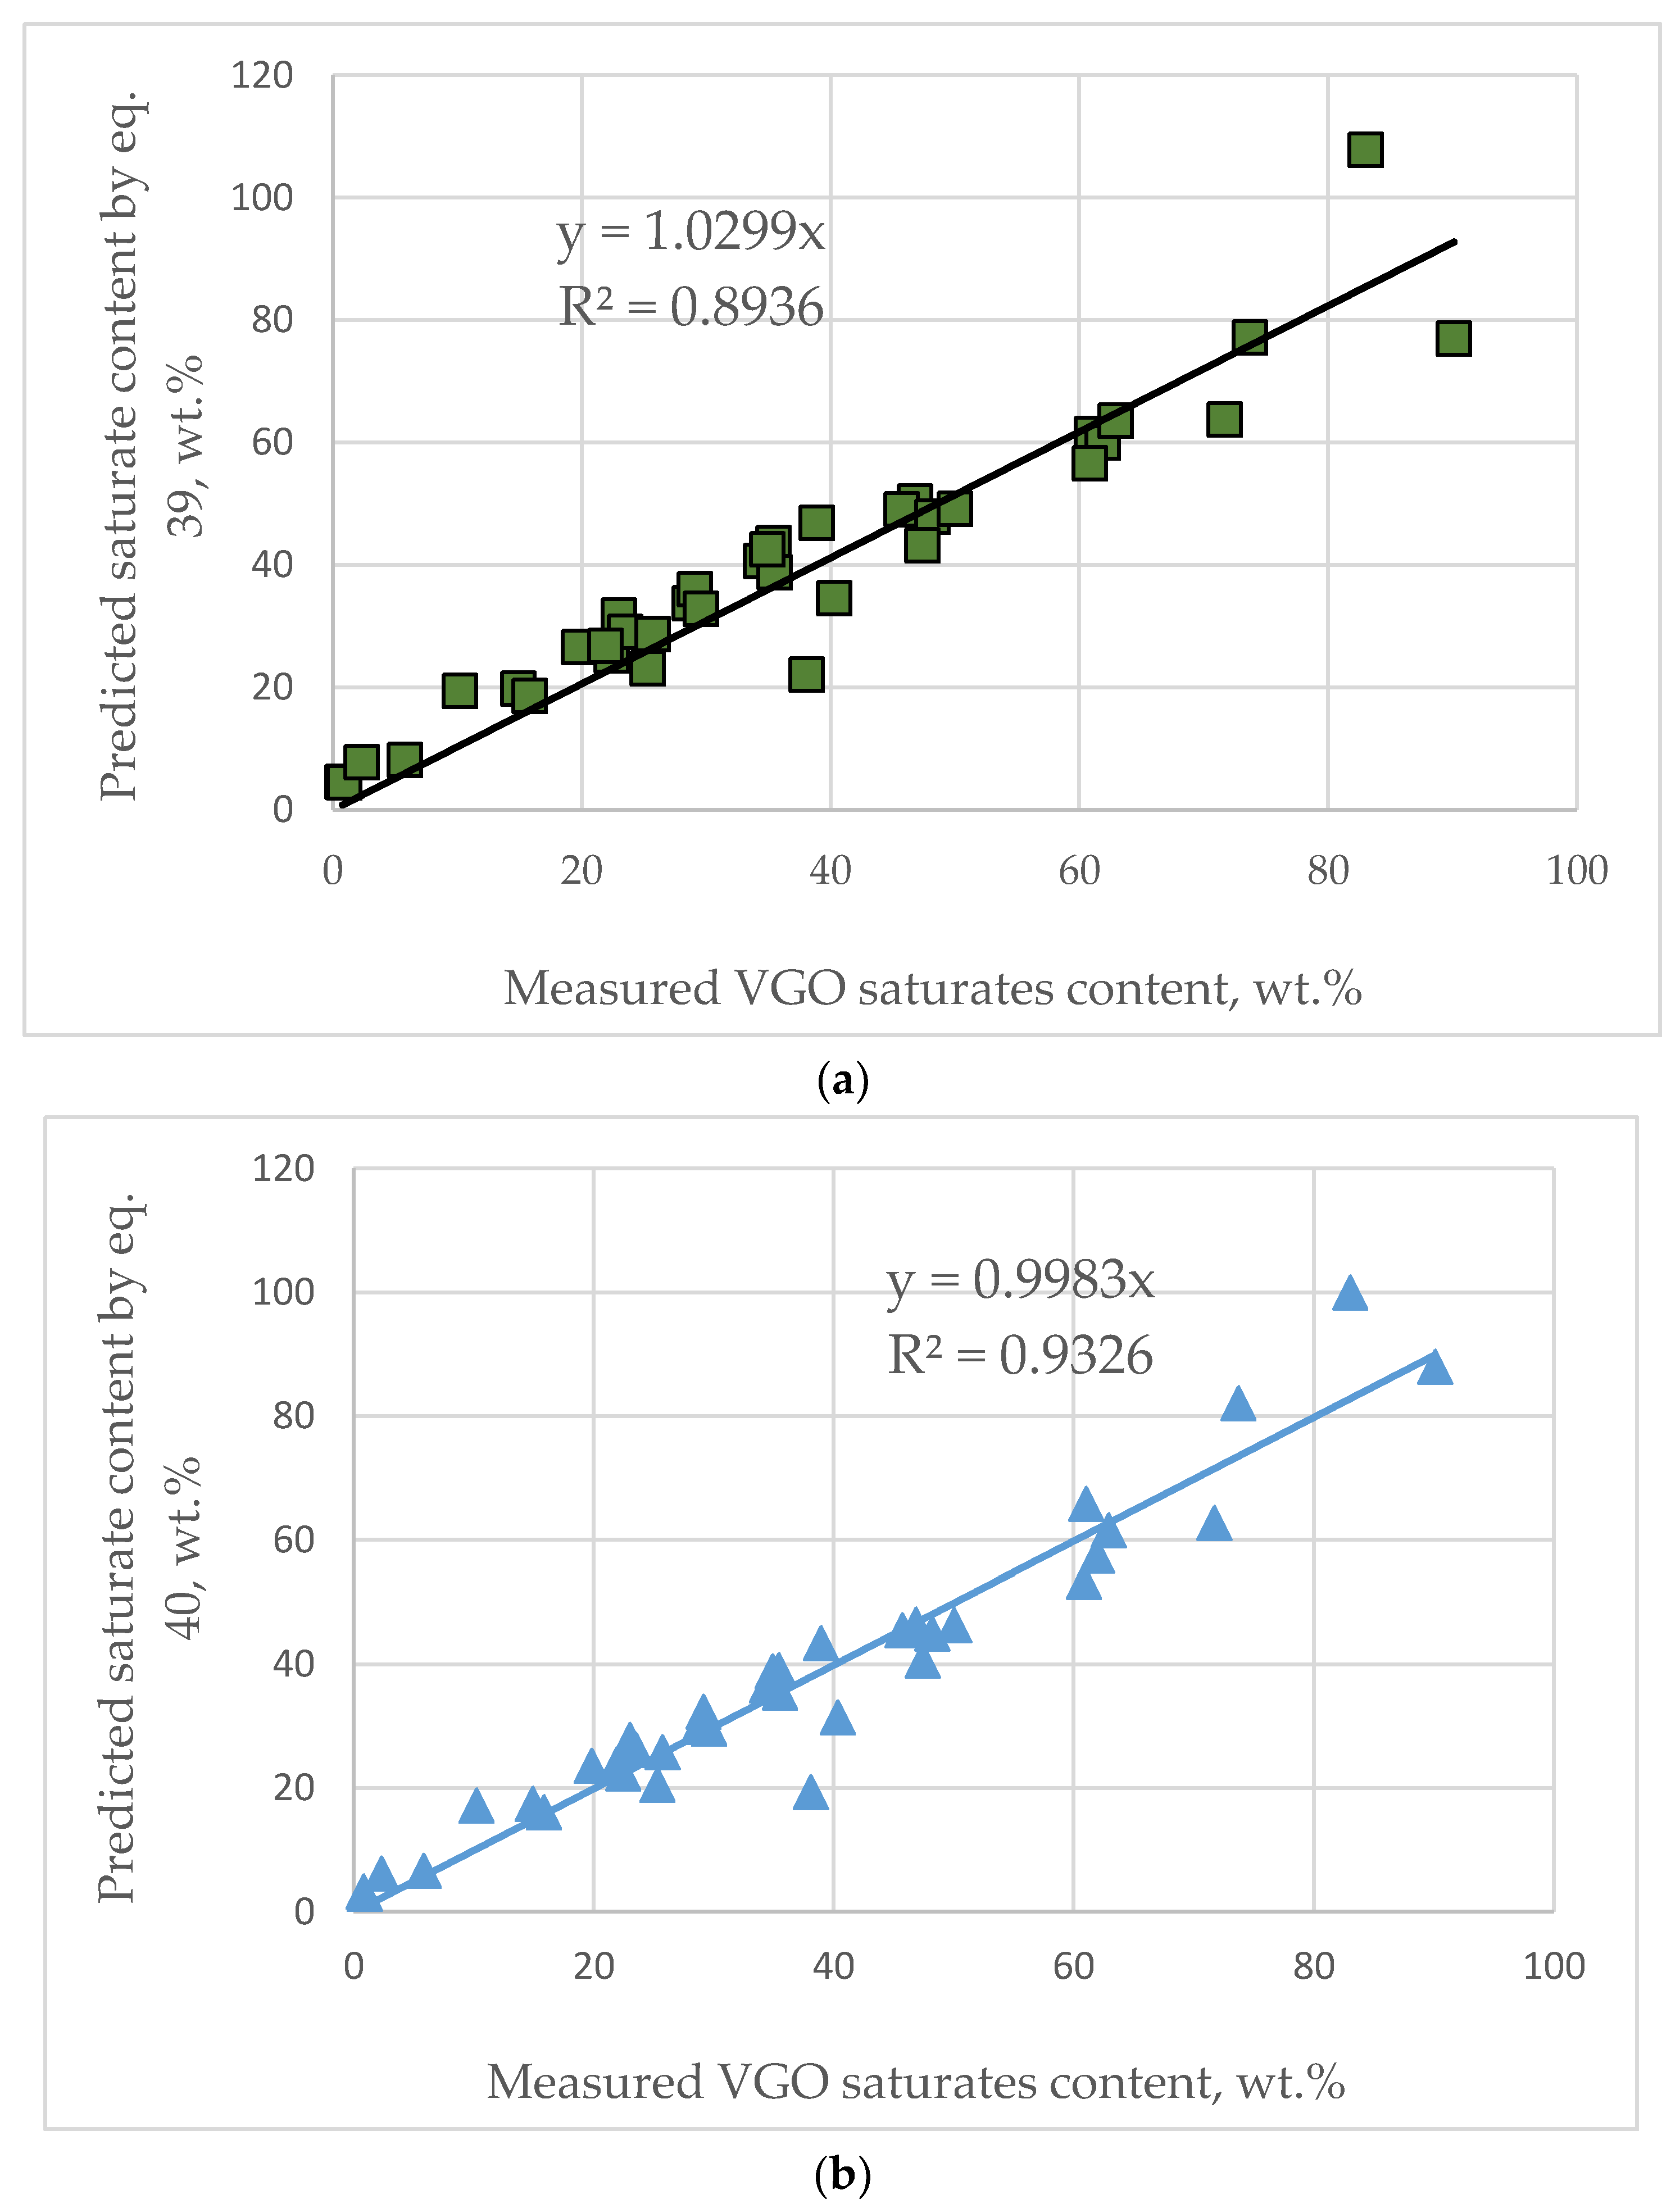
3.2. Validation of the Developed Model for Prediction of VGO Saturate Content

Two very different vacuum gas oils: hydrocracked VGO from a hydrocracking unit, which processes Urlas VGO, and FCC slurry oil from LUKOIL Neftohim Burgas refinery were analyzed for their hydrocarbon group composition according to the SARA method described in [54]. Their properties along with the SARA analysis data and estimated saturate contents are summarized in Table 4.
The FCC slurry oil sample was initially analyzed for the determination of the SARA composition by the method described in [54] but without using the refractive index for specifying the separation between saturates and aromatics. This way of action in measuring the SARA composition of heavy oils was also practiced in our earlier study [55] in order to shorten the time for the performance of SARA analysis from four to three days. The saturate content predicted by Equation (40) and that of the first FCC SLO SARA analysis exhibited a difference of 38.6 wt.%, which was far from the repeatability limit of ±2 wt.% for this method. Another SARA analysis of this FCC SLO was performed and the difference between the saturate content predicted by Equation (37) and that of the second FCC SLO SARA analysis was already within the repeatability limit (1.4 wt.%). In the second SARA analysis of that FCC SLO, the separation between saturates and aromatics was identified by refractive index measurement as described in [54]. The difference between the measured and estimated by Equation (37) saturate contents of the hydrocracked VGO was also within the repeatability limit (−1.5 wt.%). This is an indicator that Equation (40) can be used to predict VGO saturate content from density, molecular weight and refractive index and also for the verification of the correctness of the performance of the SARA analysis. In the case of missing data for the molecular weight or refractive index T50%, Equation (30) can be used to estimate the refractive index and the molecular weight reported by the correlations reported in [23,56,57].
The characterization of petroleum fractions by empirical models, which relate the oil bulk physicochemical properties to the content of important structural parameters, has been developed for the last 70 years (from 1951 [41] with the n-d-M method to 2021 with ARI [27]. They have proved their usefulness in predicting VGO reactivity and product selectivity in the processes of catalytic and thermal cracking [5,7,17,47,48] and in the modeling of the most complex petroleum compounds—the asphaltenes [27]. Over the years improvement in the predictions of the content of the VGO characterizing parameters has been registered [19,21]. It has also been shown that the empirical models are capable of predicting VGO compound content in [31] and in this work. Unfortunately, the empirical models can prove their accuracy in prediction for the property range of variation for which they have been developed but outside of this range, a failure in the prediction is possible because the type of the mathematical expressions can be different for the new property range. This was also observed in this work, registering negative values for DQ-VGO aromatic carbon content and ARI. This implies that further improvement in the predictions is required by widening the range of property variation and involving new characterizing factors and possibly new mathematical techniques.

4. Conclusions

The structural information about vacuum gas oils with a very wide range of variation of saturate content between 0.8 and 93.1 wt.% can be obtained by empirical models and a combination of two main physicochemical properties: density and T50%. From these properties refractive index, molecular weight, hydrogen and aromatic carbon contents, the number of aromatic rings in the average molecular structure and saturate content can be derived.
  • The aromatic ring index developed by Abutiqiya et al. [26,27] was confirmed to properly predict the actual aromatic ring numbers of individual hydrocarbons and fluid catalytic cracking slurry oils characterized by NMR.
  • The use of a logistic function and employment of nonlinear least squares method along with ARI allows prediction of the VGO saturate content by the newly developed correlation in this work.
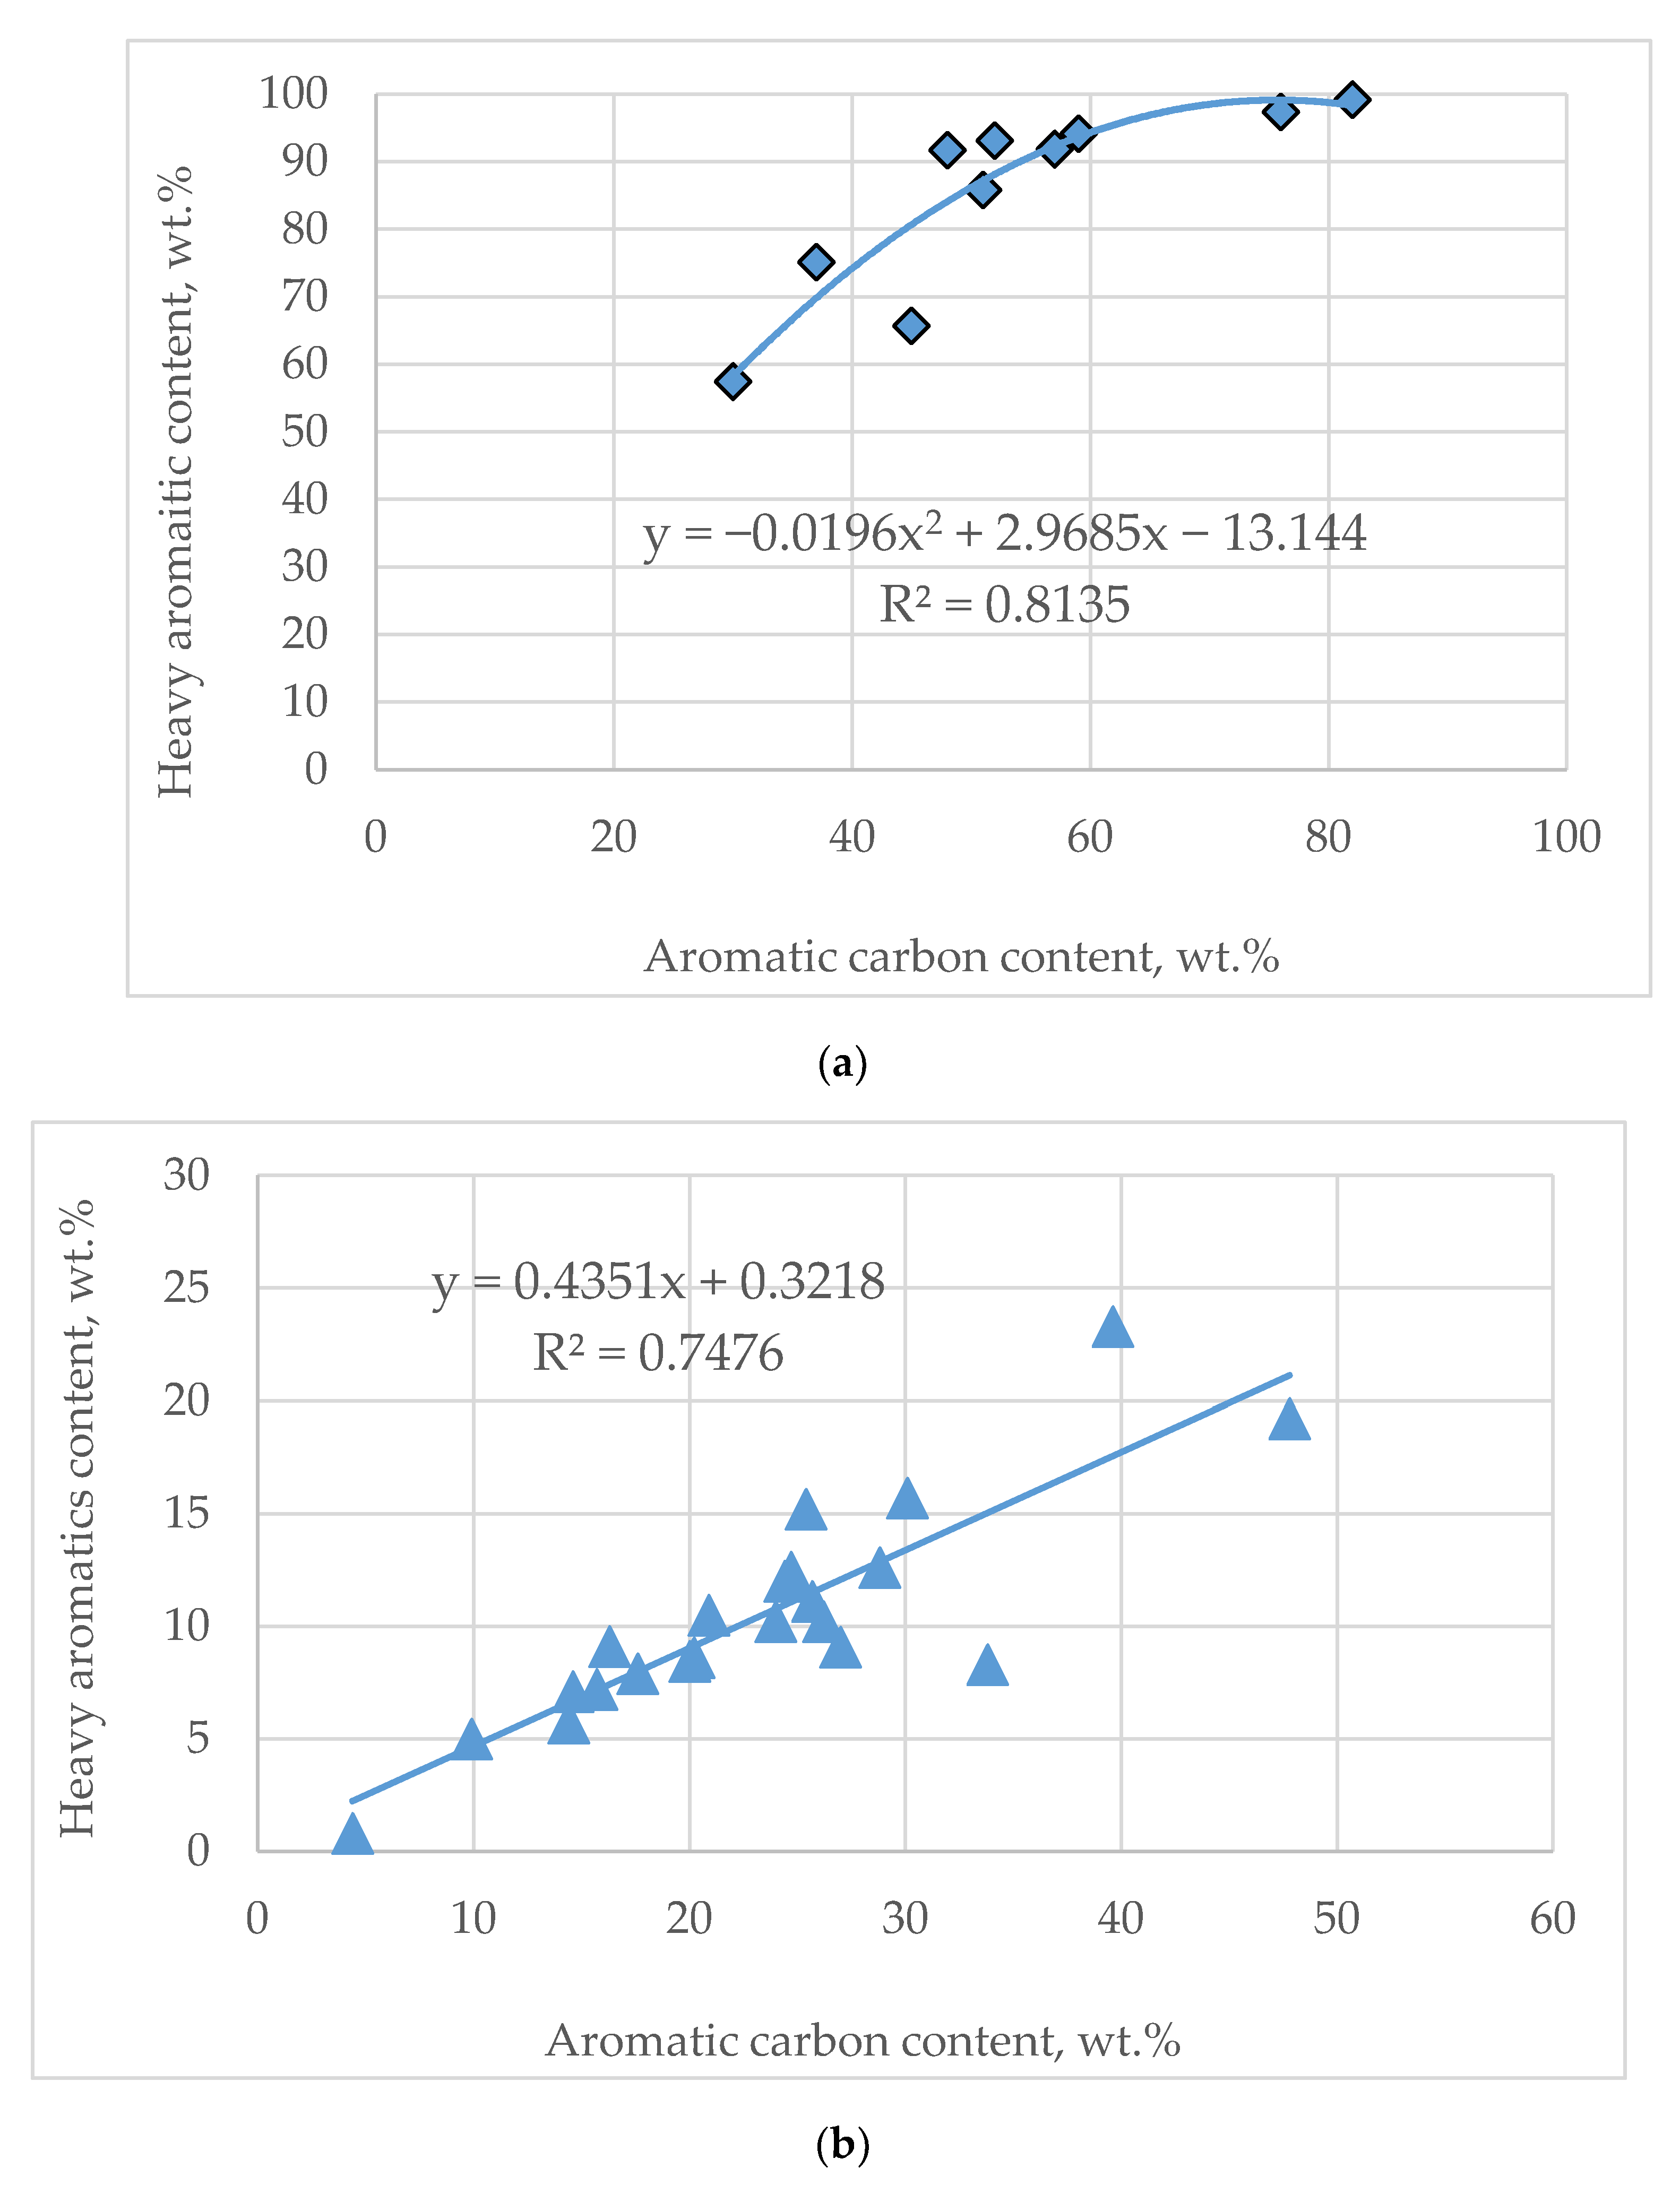
  • The content of heavy aromatics was found to correlate with the aromatic carbon content.
  • The dependence of heavy aromatic content on the aromatic carbon content was found to differentiate between FCC slurry oils and other VGOs.
  • The relationship of aromatic carbon content with heavy aromatic content for FCC slurry oils can be predicted by a second-order polynomial, while that of the remaining VGOs can be predicted by a linear function.
  • The empirical models developed in this study can be used not only for obtaining the valuable structural information necessary to predict the behavior of the VGOs in the conversion processes but can also be applied for the detection of incorrectly performed SARA analyses.
  • In the current study, it was shown that the two physical properties, density and T50%, and the ARI estimated on their base along with empirical modeling are capable of predicting the contents of saturates and heavy poly-nuclear (tri-nuclear plus) aromatics in vacuum gas oils with reasonable accuracy.

Supplementary Materials

The following are available online at https://0-www-mdpi-com.brum.beds.ac.uk/article/10.3390/resources10070071/s1, Figure S1: Relation of fluid catalytic cracking slurry oil hydrogen content to saturates content, Table S1: Properties of the vacuum gas oils under study, Table S2: Empirically modeled characterizing parameters of the vacuum gas oils under study, Table S3: Data for density at 15 °C and content of aromatic structures (aromatic, resin, and asphaltene fractions) in 144 vacuum gas oils, Table S4: Comparison between measured and predicted by the empirical correlations refractive index of VGO from different origin, Table S5: Comparison between measured and predicted by the empirical correlations hydrogen content in VGO from different origin, Table S6: Comparison between measured and predicted by the empirical correlations aromatic carbon content in VGO from different origin, Table S7: Comparison between measured and predicted by the empirical correlations saturates content in VGO from different origin.

Author Contributions

Conceptualization, E.S.; Data curation, R.K.D. and S.N.; Formal analysis, I.P.P. and D.Y.; Investigation, I.V.K. and L.T.-Y.; Methodology, S.S.; Software, V.A., S.R. and D.D.S.; Supervision, K.A.; Writing—original draft, D.S.S. and I.K.S. Writing—revised manuscript D.S.S. and K.Z. All authors have read and agreed to the published version of the manuscript.

Funding

This research was funded by Asen Zlatarov University–Burgas, Project: Information and Communication Technologies for a Digital Single Market in Science, Education and Security DCM # 577/17.08.2018 (2018–2021).

Institutional Review Board Statement

Not applicable.

Informed Consent Statement

Not applicable.

Data Availability Statement

Not applicable.

Acknowledgments

The authors are grateful for the support provided by the Bulgarian Ministry of Education and Science under the National Research Programme “Information and Communication Technologies for a Digital Single Market in Science, Education and Security” approved by DCM # 577/17.08.2018.

Conflicts of Interest

The authors declare no conflict of interest.

Abbreviations

List of symbols and abbreviations used
APIAPI gravity
ARIAromatic ring index
CCarbon content, wt. %
CAAromatic carbon content, %
CHCarbon to hydrogen ratio
CNNaphthenic carbon content, %
CpParaffinic carbon content, %
dDensity at 20 °C, g/cm3
d15Density at 15 °C, g/cm3
FRIFunction of refractive index
FCC SLOFluid catalytic cracking slurry oil
HHydrogen content, wt.%
IRefractive index parameter
KwWatson K factor
m, v, w, CRParameters
MWMolecular weight
nD20Refractive index at 20 °C
RIRefractive index at 20 °C
SSulfur content, wt.%
SGSpecific gravity
TbNormal boiling point or 50 wt.% TBP, K
T5050% boiling point, °C
T50F50% boiling point, °F
VGOVacuum gas oil
VISViscosity at 98.9 °C (210 °F), cSt

References

  1. Alabdullah, M.A.; Gomez, A.; Vittenet, J.; Bendjeriou-Sedjerari, A.; Xu, W.; Abba, I.; Gascon, J. A viewpoint on the refinery of the future: Catalyst and process challenges. ACS Catal. 2020, 10, 8131–8140. [Google Scholar] [CrossRef]
  2. Ng, S.H.; Wang, J.; Fairbridge, C.; Zhu, Y.; Yang, L.; Ding, F.; Yui, S. Study of Canadian FCC feeds from various origins and treatments. 1. Ranking of feedstocks based on feed quality and product distribution. Energy Fuels 2004, 18, 160–171. [Google Scholar] [CrossRef]
  3. Fisher, I.P. Effect of feedstock variability on catalytic cracking yields. Appl. Catal. 1990, 65, 189–210. [Google Scholar] [CrossRef]
  4. Billaud, F.; Berthelin, M.; Freund, E. Thermal cracking of vacuum distillates. J. Anal. Appl. Pyrolysis 1986, 10, 139–151. [Google Scholar] [CrossRef]
  5. Bollas, G.M.; Vasalos, I.A.; Lappas, A.A.; Iatridis, D.K.; Tsioni, G.K. Bulk molecular characterization approach for the simu-lation of FCC feedstocks. Ind. Eng. Chem. Res. 2004, 43, 3270–3281. [Google Scholar] [CrossRef]
  6. Stratiev, D.; Galkin, V.; Shishkova, I.; Minkov, D.; Stanulov, K. Yield of products from catalytic cracking of vacuum gasoils. Chem. Technol. Fuels Oils 2007, 43, 311–318. [Google Scholar] [CrossRef]
  7. Stratiev, D.; Shishkova, I.; Ivanov, M.; Dinkov, R.; Georgiev, B.; Argirov, G.; Atanassova, V.; Vassilev, P.; Atanassov, K.; Yordanov, D.; et al. Catalytic cracking of diverse vacuum residue hydrocracking gas oils. Chem. Eng. Technol. 2021, 44, 997–1008. [Google Scholar] [CrossRef]
  8. Nazarova, G.; Oreshina, A.; Kaliyev, T.; Arkenova, S.; Antonov, A.; Lemeshko, E. Development of a formalized scheme of hydrocarbon transformations in the catalytic cracking for forecasting the individual composition of gases. AIP Conf. Proc. 2020, 2285, 020014. [Google Scholar]
  9. Ivanchina, E.D.; Ivashkina, E.N.; Nazarova, G.Y.; Seitenova, G.Z. Influence of feedstock group composition on the octane number and composition of the gasoline fraction of catalytically cracked vacuum distillate. Pet. Chem. 2018, 58, 225–236. [Google Scholar] [CrossRef]
  10. Ivanchina, E.; Ivashkina, E.; Nazarova, G. Mathematical modelling of catalytic cracking riser reactor. Chem. Eng. J. 2017, 329, 262–274. [Google Scholar] [CrossRef]
  11. Nazarova, G.; Ivashkina, E.; Ivanchina, E.; Oreshina, A.; Dolganova, I.; Pasyukova, M. Modeling of the catalytic cracking: Catalyst deactivation by coke and heavy metals. Fuel Process. Technol. 2020, 200. [Google Scholar] [CrossRef]
  12. Nazarova, G.; Ivashkina, E.; Ivanchina, E.; Oreshina, A.; Vymyatnin, E. A predictive model of catalytic cracking: Feedstock-induced changes in gasoline and gas composition. Fuel Process. Technol. 2021, 217, 106720. [Google Scholar] [CrossRef]
  13. Nazarova, G.Y.; Ivashkina, E.N.; Oreshina, A.A.; Vymyatnin, E.K.; Seytenova, G.Z.; Burumbaeva, G.R. Vacuum distillate catalytic cracking technology modelling: Feedstock and products composition and properties investigation. Pet. Coal 2020, 62, 380–389. [Google Scholar]
  14. Nazarova, G.; Ivashkina, E.; Ivanchina, E.; Vosmerikov, A.; Vosmerikova, L.; Antonov, A. A model of catalytic cracking: Product distribution and catalyst deactivation depending on saturates, aromatics and resins content in feed. Catalysts 2021, 11, 701. [Google Scholar] [CrossRef]
  15. Ng, S.H.; Heshka, N.E.; Zheng, Y.; Ling, H.; Wang, J.; Liu, Q.; Little, E.; Ding, F.; Wang, H. Virgin heavy gas oil from oil sands bitumen as FCC feed. Catalysts 2020, 10, 277. [Google Scholar] [CrossRef] [Green Version]
  16. Stratiev, D.; Shishkova, I.; Veli, A.; Nikolova, R.; Stratiev, D.D.; Mitkova, M.; Yordanov, D. Fluid catalytic cracking and thermal cracking of vacuum gas oils. Effect of feedstock properties on conversion and yields. OGEM 2017, 84–89. [Google Scholar] [CrossRef]
  17. Stratiev, D.; Minkov, D. Prediction of FCC yields from feedstock quality characterized by empirical methods. Oil Gas Eur. Mag. 2000, 1, 27–32. [Google Scholar]
  18. ASTM International. ASTM International. ASTM D 3238-17a. In Calculation of Carbon Distribution and Structural Group Analysis of Petroleum Oils by the n-d-M Method; ASTM International: West Conshohocken, PA, USA, 2017. [Google Scholar]
  19. Riazi, M.R.; Daubert, T.E. Prediction of molecular-type analysis of petroleum fractions and coal liquids. Ind. Eng. Chem. Res. 1986, 25, 1009–1015. [Google Scholar] [CrossRef]
  20. Riazi, M.R.; Daubert, T.E. Characterization parameters for petroleum fractions. Ind. Eng. Chem. Res. 1987, 26, 755–759. [Google Scholar] [CrossRef]
  21. Choudhary, T.; Meier, P.F. Characterization of heavy petroleum feedstocks. Fuel Process. Technol. 2008, 89, 697–703. [Google Scholar] [CrossRef]
  22. Goossens, A.G. Prediction of the hydrogen content of petroleum fractions. Ind. Eng. Chem. Res. 1997, 36, 2500–2504. [Google Scholar] [CrossRef]
  23. Goossens, A.G. Prediction of molecular weight of petroleum fractions. Ind. Eng. Chem. Res. 1996, 35, 985–988. [Google Scholar] [CrossRef]
  24. Riazi, M.R. Characterization and Properties of Petroleum Fraction; ASTM Manual Series MNL50; ASTM International: Philadelphia, PA, USA, 2005. [Google Scholar]
  25. Dhulesia, H. New correlations predict FCC feed characterizing parameters. Oil Gas J. 1986, 84, 51–54. [Google Scholar]
  26. Abutaqiya, M. Advances in Thermodynamic Modeling of Nonpolar Hydrocarbons and Asphaltene Precipitation in Crude Oils. Ph.D. Thesis, Rice University, Houston, TX, USA, 2019. [Google Scholar]
  27. Abutaqiya, M.I.L.; Alhammadi, A.A.; Sisco, C.J.; Vargas, F.M. Aromatic Ring Index (ARI): A characterization factor for nonpolar hydrocarbons from molecular weight and refractive index. Energy Fuels 2021, 35, 1113–1119. [Google Scholar] [CrossRef]
  28. Modarress, H.; Vakili-Nezhaad, G.R.A. New characterization factor for hydrocarbons and petroleum fluids fractions. Oil Gas Sci. Technol. 2002, 57, 149–154. [Google Scholar] [CrossRef]
  29. Pujro, R.; Falco, M.; Sedran, U. Catalytic cracking of heavy aromatics and polycyclic aromatic hydrocarbons (PAHs) over FCC catalysts. Energy Fuels 2015, 29, 1543–1549. [Google Scholar] [CrossRef]
  30. Abbott, M.M.; Kaufmann, T.G.; Domash, L. A correlation for predicting liquid viscosities of petroleum fractions. Can. J. Chem. Eng. 1971, 49, 379–384. [Google Scholar] [CrossRef]
  31. Stratiev, D.S.; Marinov, I.M.; Shishkova, I.K.; Dinkov, R.K.; Stratiev, D.D. Investigation on feasibility to predict the content of saturate plus mono-nuclear aromatic hydrocarbons in vacuum gas oils from bulk properties and empirical correlations. Fuel 2014, 129, 156–162. [Google Scholar] [CrossRef]
  32. Stratiev, D.; Shishkova, I.; Tankov, I.; Pavlova, A. Challenges in characterization of residual oils. A review. J. Pet. Sci. Eng. 2019, 178, 227–250. [Google Scholar] [CrossRef]
  33. Marques, J.; Maget, S.; Verstraete, J.J. Improvement of ebullated-bed effluent stability at high conversion operation. Energy Fuels 2011, 25, 3867–3874. [Google Scholar] [CrossRef]
  34. Ding, F.; Ng, S.H.; Xu, C.; Yui, S. Reduction of light cycle oil in catalytic cracking of bitumen-derived crude HGOs through catalyst selection. Fuel Process. Technol. 2007, 88, 833–845. [Google Scholar] [CrossRef]
  35. Prabha, K.; Dasila, I.R.; Choudhury, D.N.; Saraf, V.; Kagdiyal, S.; Rajagopal, S.J.; Chopra, S.J. Estimation of FCC feed composition from routinely measured lab properties through ANN model. Fuel Process. Technol. 2014, 125, 155–162. [Google Scholar]
  36. Sheppard, C.M.; Green, J.B.; Vanderveen, J.W. Relating feedstock composition to product slate and composition in catalytic cracking. 4. An extended pendant-core model for gasoline composition. Energy Fuels 1998, 12, 320–328. [Google Scholar] [CrossRef]
  37. Li, Z.-K.; Wang, G.; Shi, Q.; Xu, C.-M.; Gao, J.-S. Retardation effect of basic nitrogen compounds on hydrocarbons catalytic cracking in coker gas oil and their structural identification. Ind. Eng. Chem. Res. 2011, 50, 4123–4132. [Google Scholar] [CrossRef]
  38. Mondal, S.; Yadav, A.; Kumar, R.; Bansal, V.; Das, S.K.; Christopher, J.; Kapur, G.S. Molecular-level structural insight into clarified oil by nuclear magnetic resonance (NMR) spectroscopy: Estimation of hydrocarbon types and average structural parameters. Energy Fuels 2017, 31, 7682–7692. [Google Scholar] [CrossRef]
  39. Li, W.; Chen, Y.; Zhang, L.; Xu, Z.; Sun, X.; Zhao, S.; Xu, C. Supercritical fluid extraction of FCC slurry oil: Bulk property and molecular composition of narrow fraction. Energy Fuels 2016, 30, 10064–10071. [Google Scholar] [CrossRef]
  40. Nesumi, Y.; Oyama, T.; Todo, Y.; Azuma, A.; Mochida, I.; Korai, Y. Properties of fluid catalytic cracking decant oils of different origins in their single carbonization and cocarbonization with a petroleum vacuum residue. Ind. Eng. Chem. Res. 1990, 29, 1793–1801. [Google Scholar] [CrossRef]
  41. VanNes, K.; VanWesten, H.A. Aspects of the Constitution of Mineral Oils; Elsevier: New York, NY, USA, 1951. [Google Scholar]
  42. Riazi, M.R. Prediction of Thermophysical Properties of Petroleum Fractions. Ph.D. Thesis, The Pennsylvania State University, University Park, PA, USA, 1979. [Google Scholar]
  43. Altgeld, K.H.; Boduszynski, M. Composition and Analysis of Heavy Petroleum Fractions; Marcel Dekker, Inc.: New York, NY, USA, 1994. [Google Scholar]
  44. Stratiev, D.; Nenov, S.; Shishkova, I.; Georgiev, B.; Argirov, G.; Dinkov, R.; Yordanov, D.; Atanassova, V.; Vassilev, P.; Atanassov, K. Commercial investigation of the ebullated-bed vacuum residue hydrocracking in the conversion range of 55–93%. ACS Omega 2020, 5, 33290–33304. [Google Scholar] [CrossRef]
  45. Todorova-Yankova, L.; Yordanov, D.; Stratiev, D.; Shishkova, I. Investigation on SARA composition of light, medium, heavy, and extra heavy crude oils, and oil sands, and bitumen. Ind. Technol. 2021. article in press. (In Bulgarian) [Google Scholar]
  46. Stratiev, D.S.; Shishkova, I.K.; Dinkov, R.K.; Petrov, I.P.; Kolev, I.V.; Yordanov, D.; Sotirov, S.; Sotirova, E.; Atanassova, V.; Ribagin, S.; et al. Crude slate, FCC slurry oil, recycle, and operating conditions effects on H-Oil product quality. Processes 2021, 9, 952. [Google Scholar] [CrossRef]
  47. Jacob, S.M.; Gross, B.; Voltz, S.E.; Weekman, V.W. A lumping and reaction scheme for catalytic cracking. AIChE J. 1976, 22, 701–713. [Google Scholar] [CrossRef]
  48. Ancheyta-Juarez, J.; Lopez-Isunza, F.; Aguilar-Rodriguez, E.; Moreno-Mayorga, J.C. A strategy for kinetic parameter estimation in the fluid catalytic cracking process. Ind. Eng. Chem. Res. 1997, 36, 5170–5174. [Google Scholar] [CrossRef]
  49. Higher Alkanes. Available online: https://en.wikipedia.org/wiki/Higher_alkanes (accessed on 10 June 2021).
  50. Mitkova, M.; Stratiev, D.; Shishkova, I.; Dobrev, D. Thermal and Thermo-Catalytic Processes for Heavy Oil Conversion; Professor Marin Drinov Publishing House of Bulgarian Academy of Sciences: Sofia, Bulgaria, 2017. [Google Scholar]
  51. Das, S.; Suganthan, P.N. Differential evolution: A survey of the state-of-the-art. IEEE Trans. Evol. Comput. 2011, 15, 4–31. [Google Scholar] [CrossRef]
  52. ASTM International. ASTM International. ASTM D 2007-19. In Standard Test Method for Characteristic Groups in Rubber Extender and Processing Oils and Other Petroleum-Derived Oils by the Clay-Gel Absorption Chromatographic Method; ASTM International: West Conshohocken, PA, USA, 2019. [Google Scholar]
  53. Stratiev, D.; Shishkova, I.; Ivanov, M.; Dinkov, R.; Georgiev, B.; Argirov, G.; Atanassova, V.; Vassilev, P.; Atanassov, K.; Yordanov, D.; et al. Role of catalyst in optimizing fluid catalytic cracking performance during cracking of h-oil-derived gas oils. ACS Omega 2021, 6, 7626–7637. [Google Scholar] [CrossRef] [PubMed]
  54. Stratiev, D.; Shishkova, I.; Nikolova, R.; Tsaneva, T.; Mitkova, M.; Yordanov, D. Investigation on precision of determination of SARA analysis of vacuum residual oils from different origin. Pet Coal 2016, 58, 109–119. [Google Scholar]
  55. Stratiev, D.; Shishkova, I.; Tsaneva, T.; Mitkova, M.; Yordanov, D. Investigation of relations between properties of vacuum residual oils from different origin, and of their deasphalted and asphaltene fractions. Fuel 2016, 170, 115–129. [Google Scholar] [CrossRef]
  56. Liñan, L.Z.; Lima, N.M.N.; Maciel, M.R.W.; Filho, R.M.; Medina, L.C.; Embiruçu, M. Correlation for predicting the molecular weight of Brazilian petroleum residues and cuts: An application for the simulation of a molecular distillation process. J. Pet. Sci. Eng. 2011, 78, 78–85. [Google Scholar] [CrossRef]
  57. Sánchez-Lemus, M.; Schoeggl, F.; Taylor, S.; Yarranton, H. Physical properties of heavy oil distillation cuts. Fuel 2016, 180, 457–472. [Google Scholar] [CrossRef]
Figure 1. Strong correlations between density and hydrogen content (a) and refractive index (b), between hydrogen and aromatic carbon contents (c) and between refractive index and hydrogen content (d).
Resources 10 00071 g001aResources 10 00071 g001b
Figure 2. Dependence of the VGO aromatic structure (aromatic, resin + asphaltene fractions) content on VGO density (a) and dependence of aromatic structure content on crude oils, vacuum residual oils and VGO predicted by the use of the non-linear least squares method and reported in [40,41] (b).
Resources 10 00071 g002
Figure 3. A comparison between the estimated by Equation (25) [26,27] aromatic ring index (ARI) and the actual aromatic ring numbers of benzene, naphthalene, phenantrene, pyrene, benze(a)pyrene and perylene (a) and a comparison between estimated ARI and the average aromatic ring numbers of fluid catalytic cracking slurry oils measured by NMR analysis (data taken from Ref. [38]) (b) Reprinted with permission from [Mondal, S.; Yadav, A.; Kumar, R.; Bansal, V.; Das, S.K.; Christopher, J.; Kapur, G.S. Molecular-level structural insight into clarified oil by nuclear magnetic resonance (NMR) spectroscopy: Estimation of hydrocarbon types and average structural parameters. Energy Fuels 2017, 31, 7682–7692, doi:10.1021/acs.energyfuels.7b00994.] Copyright [2017, AMERICAN CHEMICAL SOCIETY/COPYRIGHT AMERICAN CHEMICAL SOCIETY].
Resources 10 00071 g003
Figure 4. Agreement between predicted and measured saturate content by Equation (36) (a) and by Equation (37) (b).
Resources 10 00071 g004
Figure 5. Dependence of heavy aromatic (tri + condensed aromatics) content on aromatic carbon content for FCC slurry oils (a) and VGOs different from FCC slurry oils (b).
Resources 10 00071 g005
Table 1. Range of variation in the properties of the studied vacuum gas oils.
MinMax
Density at 15 °C (g/mL)0.8011.065
Kw10.7213.47
MW258715
Kin. viscosity at 100 °C2.6161.66
T50%369620
CCR, wt.%011
Hydrogen content (wt.%)6.8815.59
H/C atomic ratio1.032.23
Total Nitrogen Content (wppm)04122
Basic Nitrogen Content (wppm)0.51543
Sulphur %0.00084.6
Aromatic Carbon Content, wt.%4.482
Aniline Point, °C33.199.8
Refractive Index at 20 °C1.47471.5695
Saturates0.890.1
Paraffins035.2
Cyclo-paraffins16.768.4
Aromatics9.399.2
mono-ARO6.8731.3
di-ARO0.742.56
tri-ARO0.145.33
tetra- and greater ARO0.574.94
Aromatic Sulfur0.110.7
Polar Compounds0.715.2
Table 2. μ-value of the ICrA evaluation of relationships between properties of the studied vacuum gas oils from different origins.
D15KwVIS100HH/CCAAPRISat.AroTri-Aro4+ARO
D151.00
Kw0.121.00
CCR0.520.490.97
H0.020.920.381.00
H/C0.030.960.331.001.00
CA0.910.050.050.020.031.00
AP0.070.850.280.960.940.081.00
RI0.980.100.270.010.010.040.061.00
Sat.0.070.700.490.920.850.120.850.091.00
Par.0.190.350.500.740.840.460.680.320.78
Naph.0.300.640.360.610.560.260.710.340.76
Aro0.460.200.320.380.400.510.070.630.241.00
DI-Aro0.760.220.200.030.200.500.150.040.470.28
Tri-Aro0.500.300.030.510.400.740.330.550.400.671.00
4+ARO0.400.380.220.200.320.890.290.780.280.780.841.00
Polars0.600.360.720.400.420.460.490.560.340.530.190.31
Heavy ARO0.620.270.210.270.420.870.130.700.310.760.930.98
Note: The figures in bold concern statistically meaningful relations.
Table 3. Range of variation in the empirically predicted VGO characterizing parameters.
MinMax
CA (ndM)−34.284.2
CN (ndM)−6.270.7
CP (ndM)11.066.2
P (API)−31.175.3
N (API)4.988.0
A (API)3.545.2
Hydrogen content, wt. (Goosens)7.217.8
Hydrogen content, wt.% (COP)6.315.2
CA, wt.% (COP)−12.4108.7
ARI−1.63.6
Table 4. Properties of hydrocracked VGO and FCC SLO not included in the data from Table S1 from Supplementary material.
PropertiesHydrocracked VGOFCC SLO (1st SARA Analysis)FCC SLO (2nd SARA Analysis)
Density at 15°C (g/mL)0.85201.0826
T50%, °C425401
Refractive index at 20°C1.47311.6349
Molecular weight, g/mol350250
Aromatic ring index (26, 27)0.673.00
Hydrocarbon group composition, wt.%
Saturates93.144.57.3
Total aromatics 50.35.8
Light aromatics2.5 0.7
Middle aromatics2.4 12.3
Heavy aromatics0.9 75.8
Resins1.12.72.1
Asphaltenes02.51.8
Estimated by Equation (40) saturates content, wt.%94.65.95.9
Deifference between measured and predicted by Equation (40) saturates content, wt.%−1.538.61.4
Publisher’s Note: MDPI stays neutral with regard to jurisdictional claims in published maps and institutional affiliations.

