Article

Integration of Regression Analysis and Monte Carlo Simulation for Probabilistic Energy Policy Guidelines in Pakistan

1
Department of Process Engineering, Faculty of Engineering and Applied Science, Memorial University of Newfoundland, St. John’s, NL A1B 3X5, Canada
2
Department of Business Administration, University of the People, Pasadena, CA 91101, USA
3
Department of Computer Science, Memorial University of Newfoundland, St. John’s, NL A1B 3X5, Canada
4
School of Mechanical Engineering, Sungkyunkwan University (SKKU), 2066 Seobu-ro, Jangan-gu, Suwon 16419, Gyeonggi-do, Korea
5
Institute of Chemical Engineering and Technology, University of the Punjab, Lahore 54590, Pakistan
6
Department of Chemical Engineering, University of Engineering and Technology, Lahore 54590, Pakistan
*
Author to whom correspondence should be addressed.
Submission received: 25 June 2021 / Revised: 11 August 2021 / Accepted: 18 August 2021 / Published: 25 August 2021

Abstract

:
Forecasting energy demand and supply is the most crucial concern for energy policymakers. However, forecasting may introduce uncertainty in the energy model, and an energy policy based on an uncertain model could be misleading. Without certainty in energy data, investors cannot quantify risk and trade-offs, which are compulsory for investments in energy projects. In this work, the energy policies of Pakistan are taken as a case study, and flaws in its energy policymaking are identified. A novel probabilistic model integrated with curve fitting methods was proposed and was applied to 17 different energy demand and supply variables. Monte Carlo simulation (MCS) was performed to develop probabilistic energy profiles for each year from 2017 to 2050. Results show that the forecasted energy supply of Pakistan in the years 2025 and 2050 would be 70.69 MTOE and 131.65 MTOE, respectively. The probabilistic analysis showed that there is 14% and 6% uncertainty in achieving these targets. The research shows the expected energy consumption of 70.33 MTOE and 189.48 MTOE in 2025 and 2050, respectively, indicating uncertainties of 65% and 31%. Based on the results, eight energy policy guidelines and recommendations are provided for sustainable energy resource management. This study recommends developing a robust and sustainable energy policy for Pakistan with the help of transparent governance.

1. Introduction

Coordinated energy planning and formulation of energy policy can help a country to overcome an energy crisis. Such a milestone is only plausible when using robust energy models that can predict future energy demand and supply in a reliable manner [1]. The analytical mechanism to achieve such a goal is developing an integrated energy planning (IEP) and policy formulation for the energy sector [2]. The IEP helps to integrate energy plans and policies of the energy sector through rigorous coordination among various energy subsectors. Moreover, IEP and energy policymaking can help build indigenous capacity, optimizing the energy utilization for short, medium, and long-term energy planning processes [3]. However, an energy forecast that fails to account for the uncertainties in the model or the energy system can lead to the failure of IEPs and could be a setback to developing a robust energy policy. Energy policymakers can make better decisions by considering uncertainties in energy data measurement methods and tools.
Moreover, the considerations of multiple outcome scenarios of energy demand and supply, instead of one, can help energy policymakers to assess the risk of failure of energy policies. Subsequently, an effective energy policy can be developed [4]. As shown in Figure 1, using energy modelling tools, IEP integrates the energy plans and procedures to meet socio-economic objectives and provides policy scenarios based on demand and supply of energy [5]. Figure 1 shows the five stages of the IEP process, starting from national socio-economic objectives, energy demand, energy supply, energy balance, and policy formulation. At the first stage of IEP, national socio-economic goals are established, which analyze the economic impacts of energy policies. The analysis and quantification of energy demand and supply are performed in the second and third stages. The energy balance and projections are constructed in the fourth stage. Based on the energy balance and projections, appropriate adjustments can be made in stage 2 and stage 3. The last step, considered as the highest tier, formulates short or long-term energy policy guidelines. In the IEP process, the main objective of demand analysis is to determine future energy requirements and identify potential consumers (such as industry, transport sector, household, or commercial use). The energy supply stage examines all potential energy supply sources in the future. The energy balance step includes the quantification of energy flow from the supply (domestic production and importation) to consumption (energy utilization, line losses, and distribution) [5].
Reliable quantification of the energy flow can help to develop long-term energy planning goals. However, these energy predictions face multiple challenges, such as uncertainties in energy demand [6]. Other than the national economic recession, efficiency of energy production and distribution systems, and energy conservation, energy policy and planning decisions are based on knowledge of past energy demands of a country [7]. In this context, historical energy data plays an important role. However, energy modelling based on historical data faces challenges such as incomplete data or a lack of reliable information [8].
Nevertheless, the predictive models based on historical data are helpful tools to forecast energy demand and develop energy policies. The regression analysis has been extensively used to predict energy demand in some countries [9]. While the regression technique is helpful to forecast energy demand, it does not assess the uncertainty in data. The current study aims to fulfill this gap. Hence, the objective of this study is to develop a predictive model integrated with a stochastic approach. Based on the results of the model, energy policy guidelines are also presented. The scope of this study includes stages 2–5 of IEP, as shown in Figure 1. Pakistan’s energy crisis and energy policy development are taken as a case study to elaborate the methodological framework. This study neither assesses the environmental [10] nor the social [11] impacts of the proposed energy policy guidelines. It does not perform an uncertainty analysis of cost [12,13] associated with the development of energy projects.

1.1. Problem Statement

Pakistan is facing a severe energy crisis. Over the last decade, there have been power outages ranging from 8 to 12 h a day in urban areas, while rural areas are without power for up to 18 h [14]. Although one of the primary reasons behind such a blackout is enhanced energy demand, poor energy policymaking and inadequate energy planning have also played vital roles in exacerbating this dilemma [15]. Technically speaking, among other factors, such as load failure of transmission systems and line losses [16], the inability of robust energy policy formation and energy planning are among the top reasons. A study argues that this failure in Pakistan’s energy policy is due to incorrect forecasting of future energy demand and supply [17]. Another study identified an inefficient measurement of energy consumption data as a root cause of the failed energy policies [18]. In the past, such inadequate energy measurements had contributed to the failure of energy policy and planning. Figure 2 summarizes the evolution of Pakistan’s energy policies over the years.
For example, in 2005, the Energy Security Action Plan 2005–2030 (ESAP) was announced under Pakistan’s Vision 2030. It aimed to increase the electricity generation capacity to 162,590 MW from 19,540 MW by 2030 [28]. In the Energy Security Action Plan, the projected energy demand of 162,590 MW was based on predicted future energy needs and past energy consumption trends. However, ESAP did not identify how certain their forecasted values were. It did not show how much certainty was present in the predicted value of 162,590 MW. It failed to address whether the forecasted value of 162,590 MW represented the actual energy demand in the year 2030. In 2014, the Government of Pakistan presented its Vision 2025, which aimed to eliminate the energy crisis by 2018 and set a goal to double power generation to 45,000 MW by 2025 [25].
Additionally, the energy plan did not specify the likelihood of achieving a value of 45,000 MW in 2025. It was unable to address the level of vagueness in their energy data. What was the level of uncertainty in the energy data? Most of the past energy policies were based on energy data reported by either government agencies or literature [29]. As evident, none of the past energy policies of Pakistan explained the level of reliability in their forecasting methods, did not show the level of uncertainty in their modelling tool, and subsequently did not identify the level of uncertainty in the energy policy. The presence of uncertainty in forecasting techniques can develop an inaccurate portrait of future energy demand and supply. Hence, energy policies based on uncertain data are vague. Therefore, there is a need to develop a methodology to deal with this issue. Another closer analysis of Pakistan’s past energy policies reveals that Pakistan has never achieved its energy targets. For example, in the Energy Policy of 1998, Pakistan aimed to have an energy demand of between 19,000 and 25,500 MW by 2008, and adequate energy policies were developed based on such requirements. However, in 2008, Pakistan was in a shortfall of 3000–4000 MW energy per day, which indicates the inadequate energy forecast data of 1998. The current study addresses such challenges and proposes a probabilistic methodology integrated with forecasting techniques. Based on probabilistic forecasted data, this study presents energy policy guidelines and recommendations. This work can help to develop an energy management system [30,31,32].

1.2. Literature Review
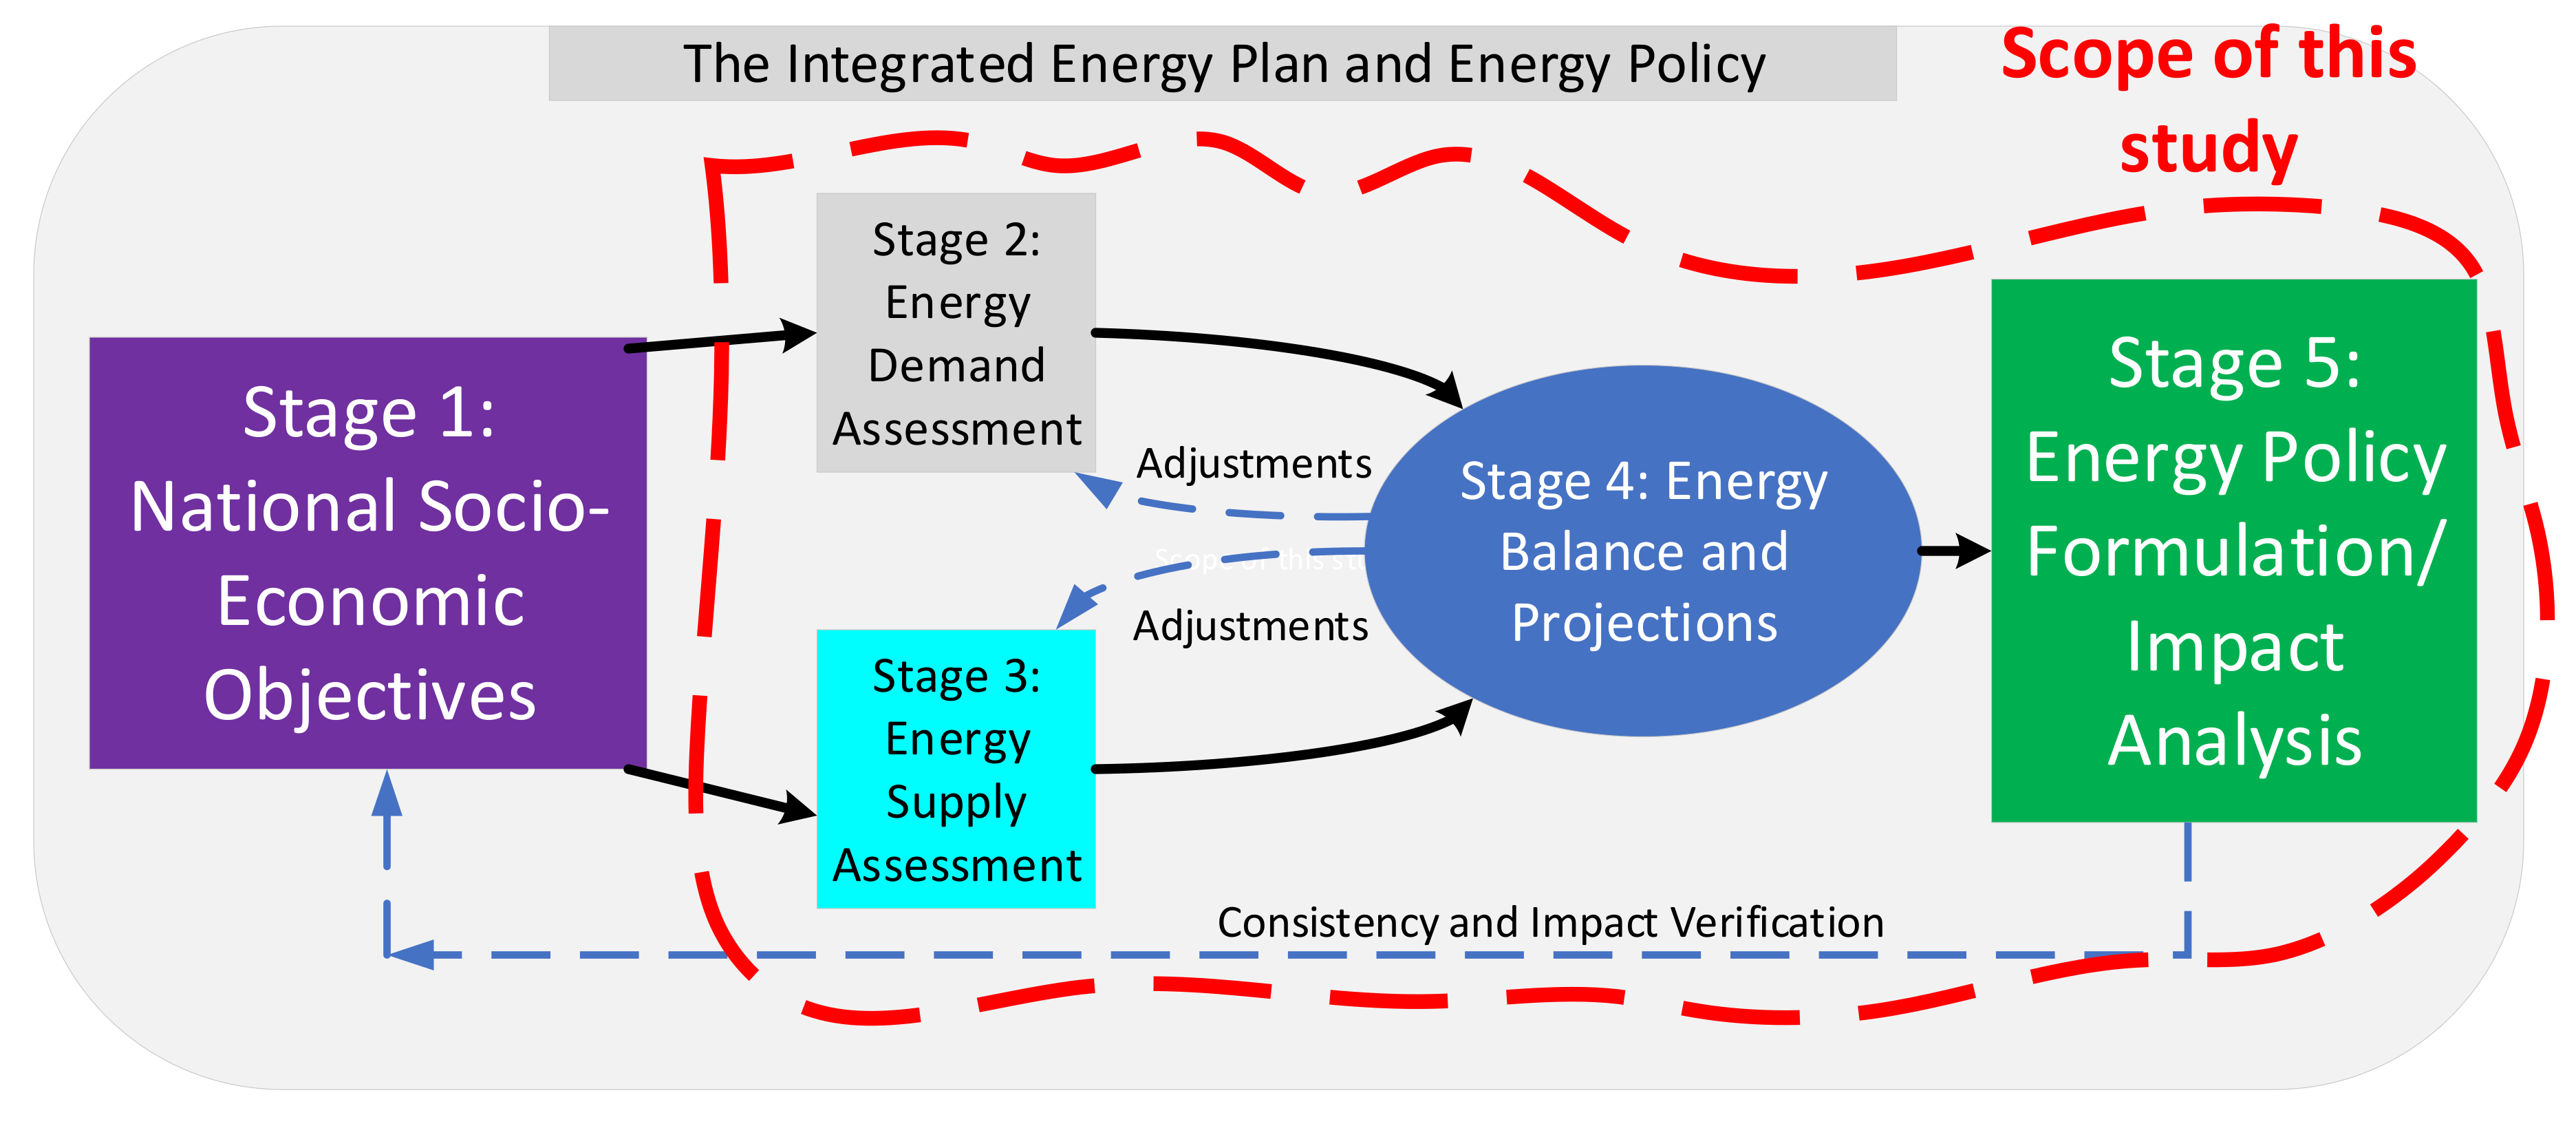
In an attempt to model energy demand and supply, various researchers have performed forecast analysis. Rehman et al., proposed an integrated model to forecast the long-term energy demand of Pakistan [33]. They studied three different energy demand models: the autoregressive integrated moving average (ARIMA), Holt–Winters, and the long-range energy alternative planning (LEAP) model. Their study forecasted Pakistan’s energy demands for oil, natural gas, coal, and liquefied petroleum gas (LPG). They found that, by 2035, oil (crude oil) will be the most consumed energy source, followed by natural gas. Regression analysis is a tool that studies the relationship between dependent and independent variables [13]. In a study, multiple linear regression and an artificial neural network were used to predict Turkey’s electricity demand [34]. Researchers used historical data from 1992 to 2014 to forecast electricity consumption in Turkey from 2015 to 2023. In another work, Deka and co-researchers compared five energy demand forecasting techniques for the United States of America [35]. These techniques included artificial neural network models, an autoregressive integrated moving average model, and regression analysis. They used historic data from 1950 to 2013 and the forecasted energy demand of the USA for 2014–2019.
Predictive models based on historical data have been beneficial in predicting future demand and supply of energy. Fumo and Biswas used regression analysis to predict residential energy consumption and emphasized that this forecasting technique requires less computational power [36]. Leo and co-researchers applied the regression analysis technique to predict energy demand trends [37]. Their work used a regression technique to forecast the energy demands of commercial, transportation, and residential sectors. They validated the goodness of fit of their regression model using the coefficient of determination (R2) [37]. While the regression technique is widely accepted, it fails to provide uncertainty in the energy model.
Furthermore, the regression technique cannot identify the data uncertainty in energy demand and supply. Hence, forecasted demand and supply results are not reliable for the IEP process and energy policymaking. This study aims to develop a methodological framework that can address the issue of uncertainty in energy policymaking.
Moreover, previous studies are either based on five or six energy variables, limiting their applicability. In this study, 17 different energy variables are studied and categorized as energy supply and demand. Table 1 provides definitions of these energy variables and their corresponding units. Under the portfolio of energy supply, (1) oil, (2) natural gas, (3) LPG, (4) coal, (5) hydroelectricity, (6) nuclear, and (7) imported electricity are studied. The demand sectors discussed are (8) domestic, (9) commercial, (10) industrial, (11) agriculture, (12) transport, (13) infrastructure (streetlights), and (14) government properties. Other variables discussed are (15) the population of Pakistan, (16) transmission losses, and (17) the corruption perception index (CPI). The purpose of considering CPI in this study is to assess the corruption level and transparency in the energy projects of Pakistan. Renewable energy resources discuss combined renewable energy produced from solar, wind, biofuel, tidal, and geothermal sources. The study also predicts the population increase of Pakistan by 2050 and discusses potential energy challenges associated with population rise.

2. Methodology

The methodological framework for this research consists of the following steps:
  • Step 1: Data sources
Historical data of energy demand and supply of Pakistan were collected and represented in Table A1, Table A2 and Table A3 of Appendix A.
Table A1 contains the values of Pakistan’s energy supply data from 1972 to 2016 and describes the energy variables of oil, natural gas, LPG, coal, hydropower, nuclear energy, imported electricity, and renewable energy [39,40,41]. Table A2 contains Pakistan’s energy consumption data from 1990 to 2016 for domestic, industrial, agriculture, transportation, infrastructure (streetlights), and government properties [39,41]. Table A2 also contains historical data of the CPI for Pakistan from 1995 to 2017 [42]. Table A3 includes historical data of Pakistan’s population from 1960 to 2016 [43] and distribution losses [44].
  • Step 2: Statistical analysis
In this step, the energy supply and demand models were developed using regression analysis and the input data was used from step 1. Regression analysis provides relationships between a dependent quantity and one or more independent quantities. Time was an independent variable in this study, while the quantities under consideration (1–17) were dependent variables. The relationship developed between dependent and independent variables helped to analyze the future relationships among them. Linear regression was first tested on the historical data of individual energy variables to model energy demand and supply. Microsoft (MS) Excel 2016 (v16.0) was used as a tool in this step. The linear regression was tested on an energy variable by selecting the yearly data of the variable under study in MS Excel and clicking the ‘Regression’ sub-tab in the ‘Data Analysis’. Table ‘Input X Range’ was the time range (in years), and ‘Input Y Range’ was the variable under study. Residual plots were selected to be drawn. The pattern of the residual plot was the criteria for classifying a linear or non-linear relationship. If the output of the resultant residual plot had a pattern, that variable was not considered linear. Instead, the non-linear regression model was tested using the curve fitting method in the Microsoft Excel tool. The historical data of the energy variable under study versus respective year (time) were plotted, and curve fitting was subsequently tested for exponential, logarithmic, polynomial, and power functions. In non-linear curve fitting, the model which produced an R-square closer to 1 was chosen as the best fit model for the variable under study.
For methodological explanation, the procedure for only one variable (population) is elaborated here, and the methodological framework was the same for the rest of the 16 variables. First, linear regression analysis was performed by selecting population data from 1960 to 2016 in MS Excel. Using the ‘Regression’ tab, ‘Input X Range’ was given from 1960 to 2016 (time), while the ‘Input Y Range’ was the population values corresponding to 1960–2016. The outcome was the residual plot for the population, which had a pattern. Considering the classification criteria, the relationship between time and population was not linear, and therefore non-linear regression was performed. The R-square value in the case of the exponential function was closest to 1 and hence was chosen as the best fit model for population–time data. Regression outputs provided the following model:
P = 3 × 10⁻²² e0.0272(t)
P is the population (in millions) while t is the time (in years), and the value 3 × 10⁻²² denotes the model’s coefficient. Besides the residual plot and R-square value, the p-value (significance F) and the coefficients’ signs were also analyzed to interpret the models’ results. Once the best fit models for all variables were developed, energy demand and supply were forecasted from 2017 to 2050 with a one-year increment. The value of the respective dependent variable was calculated. The presented model and the predicted values were validated using known periods’ data by computing mean average percentage error (MAPE), and the results were reported and discussed.
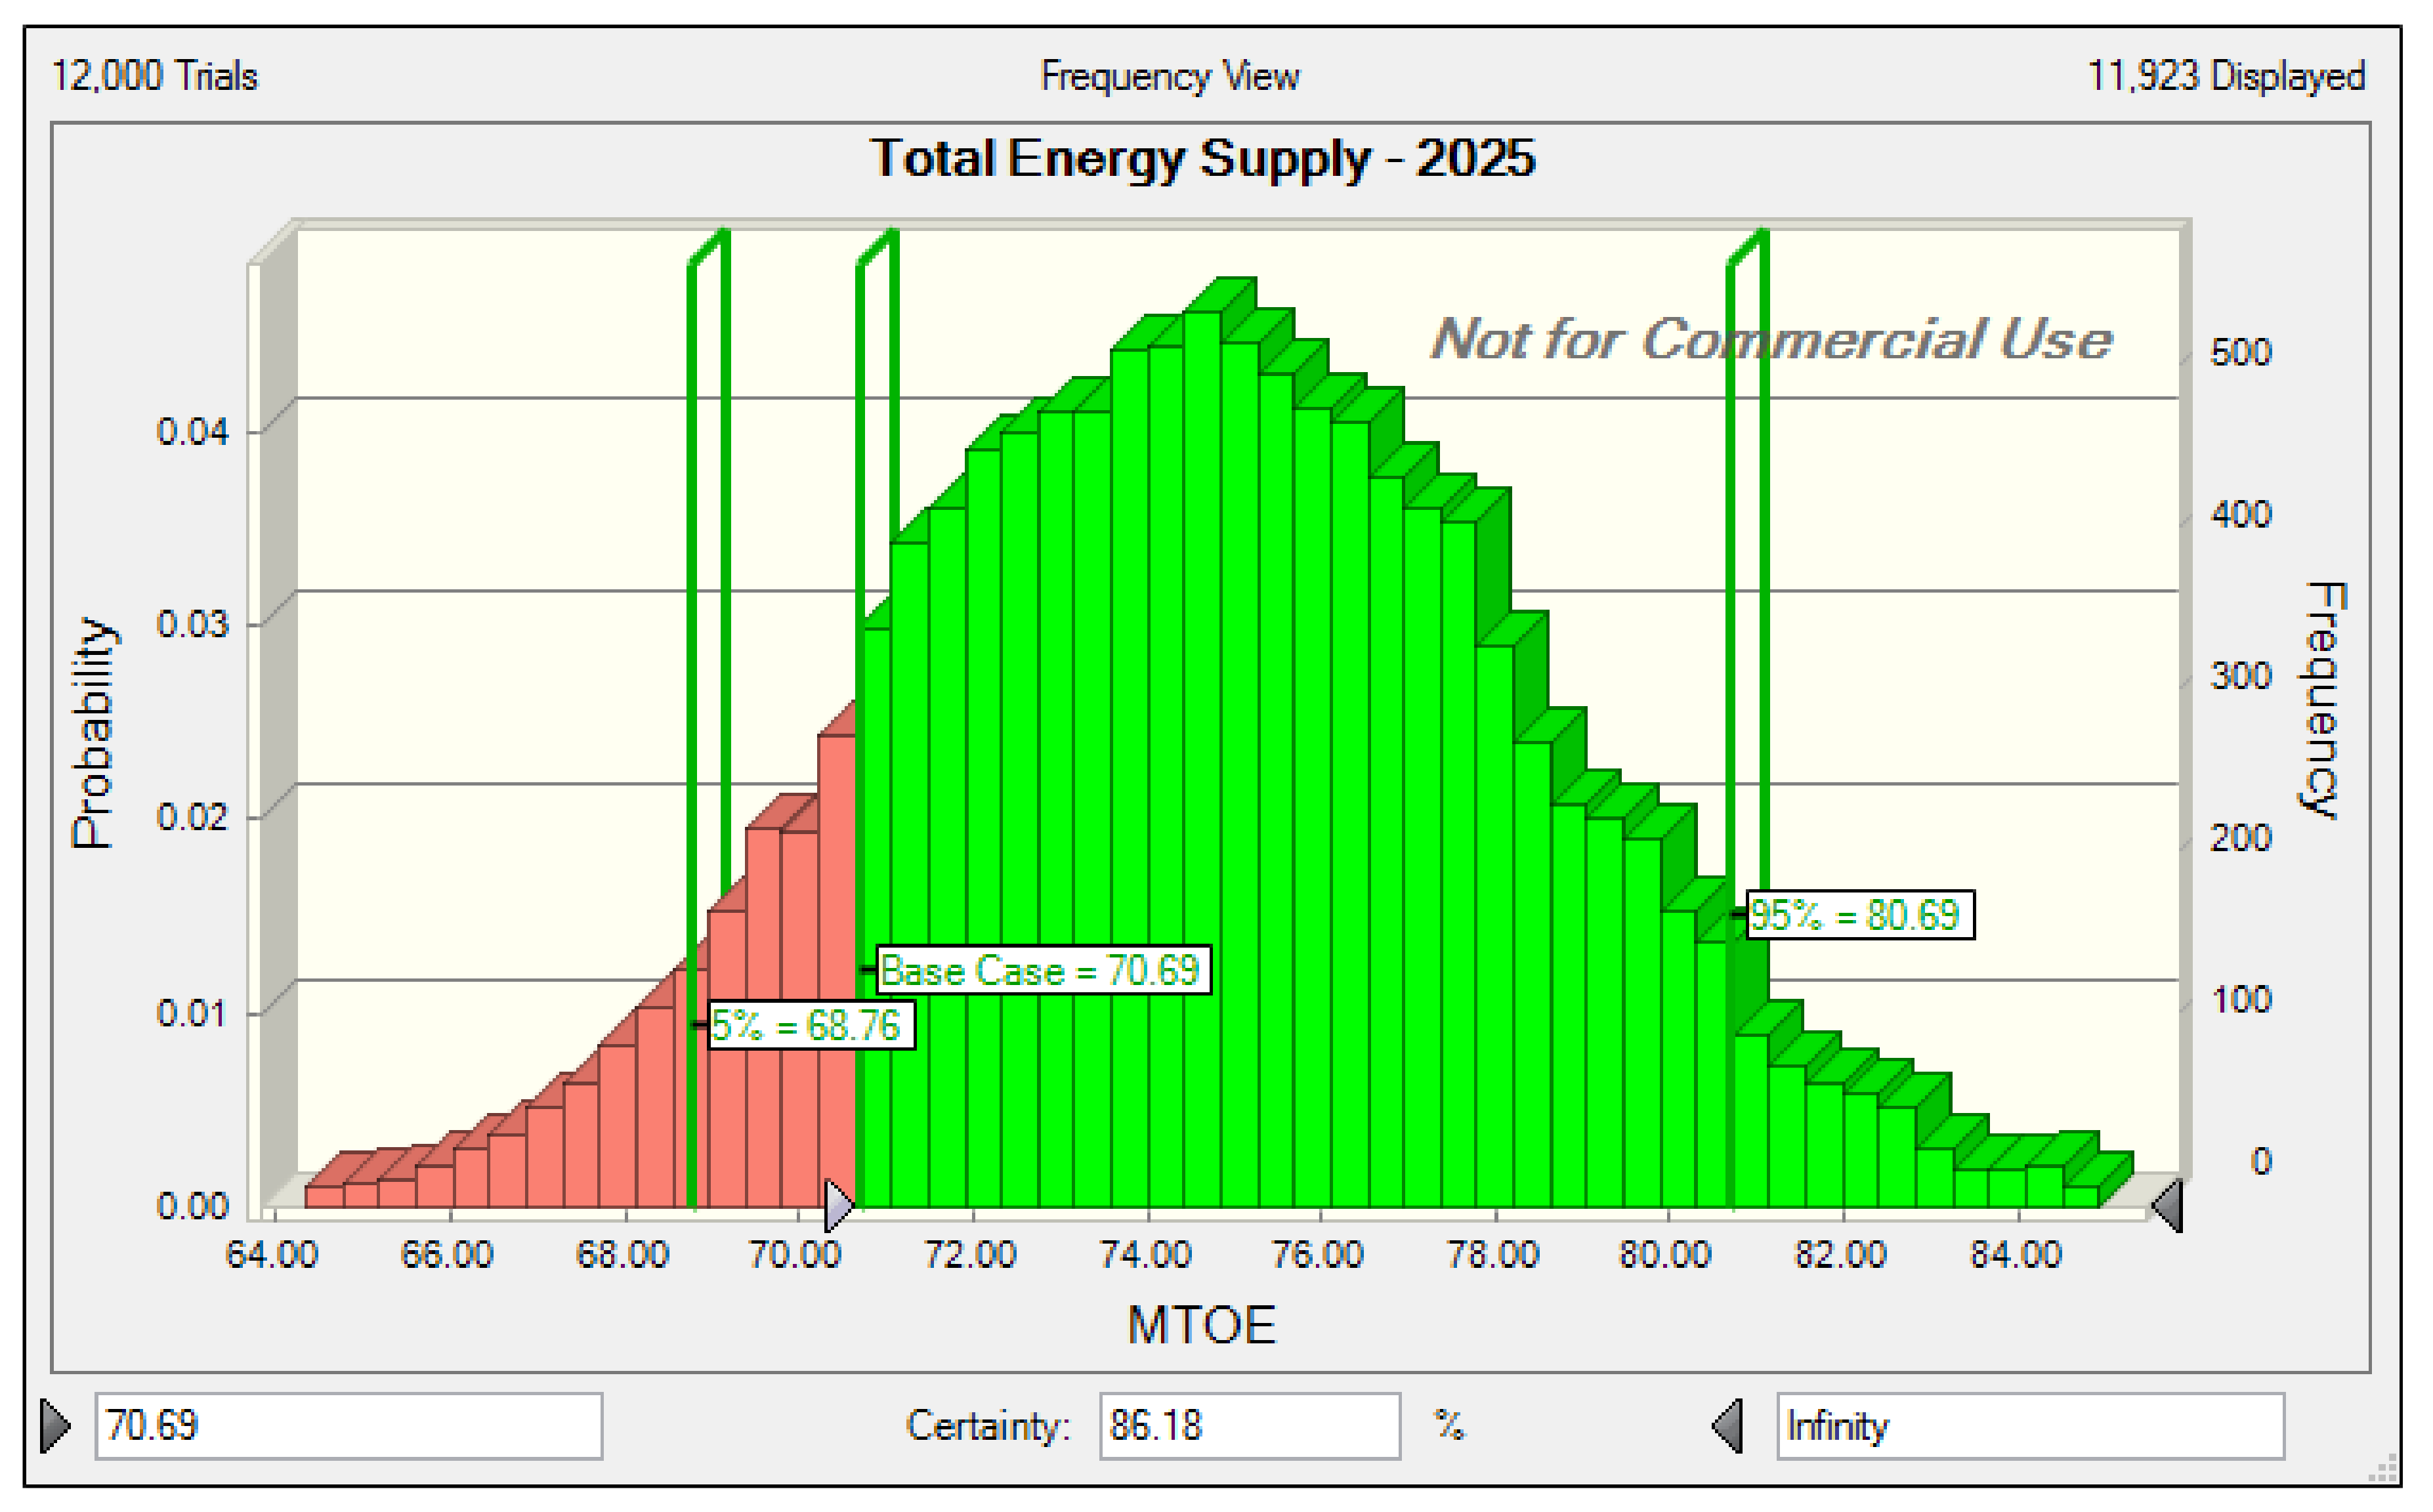
  • Step 3: Stochastic analysis
In this step, stochastic analysis was performed using the methodology presented in the literature [29]. Oracle Crystal Ball software version 11.1.2.4, built by Oracle, was used to perform uncertainty analysis. Monte Carlo simulation (MCS) was performed for each energy supply variable from 2017 to 2050 by assigning distributions, as shown in Table 2 (for the year 2017). The simulation was performed for 12,000 iterations, and the probabilistic profile of total energy supply for each year was reported, set as a forecast variable in the software. The total energy supply for 2017–2050 was defined as the sum of energy supplies from oil, gas, LPG, coal, hydroelectricity, nuclear, imported electricity, and renewable energy sectors minus transmission losses. Steps 2 and 3 were repeated for energy consumption variables. Distributions assigned to energy consumption variables in 2017 are shown in Table 3. Total energy consumed was defined as the sum of energy utilized by domestic, commercial, industrial, agriculture, transport, infrastructure (streetlights), and other government properties. The outcomes of this step were probabilistic profiles of energy supply and consumption for each year (2017–2050). Explanations on assigned distributions are presented in Table 4.
  • Step 4: Development of Energy policy guidelines
The resulting probabilistic profiles of total energy supply and consumption for each year (2017–2050) were analyzed to report uncertainty. The probabilistic profiles of each year were also analyzed at 5th and 95th percentile values, and based on the results, energy policy guidelines and recommendations were put forward.

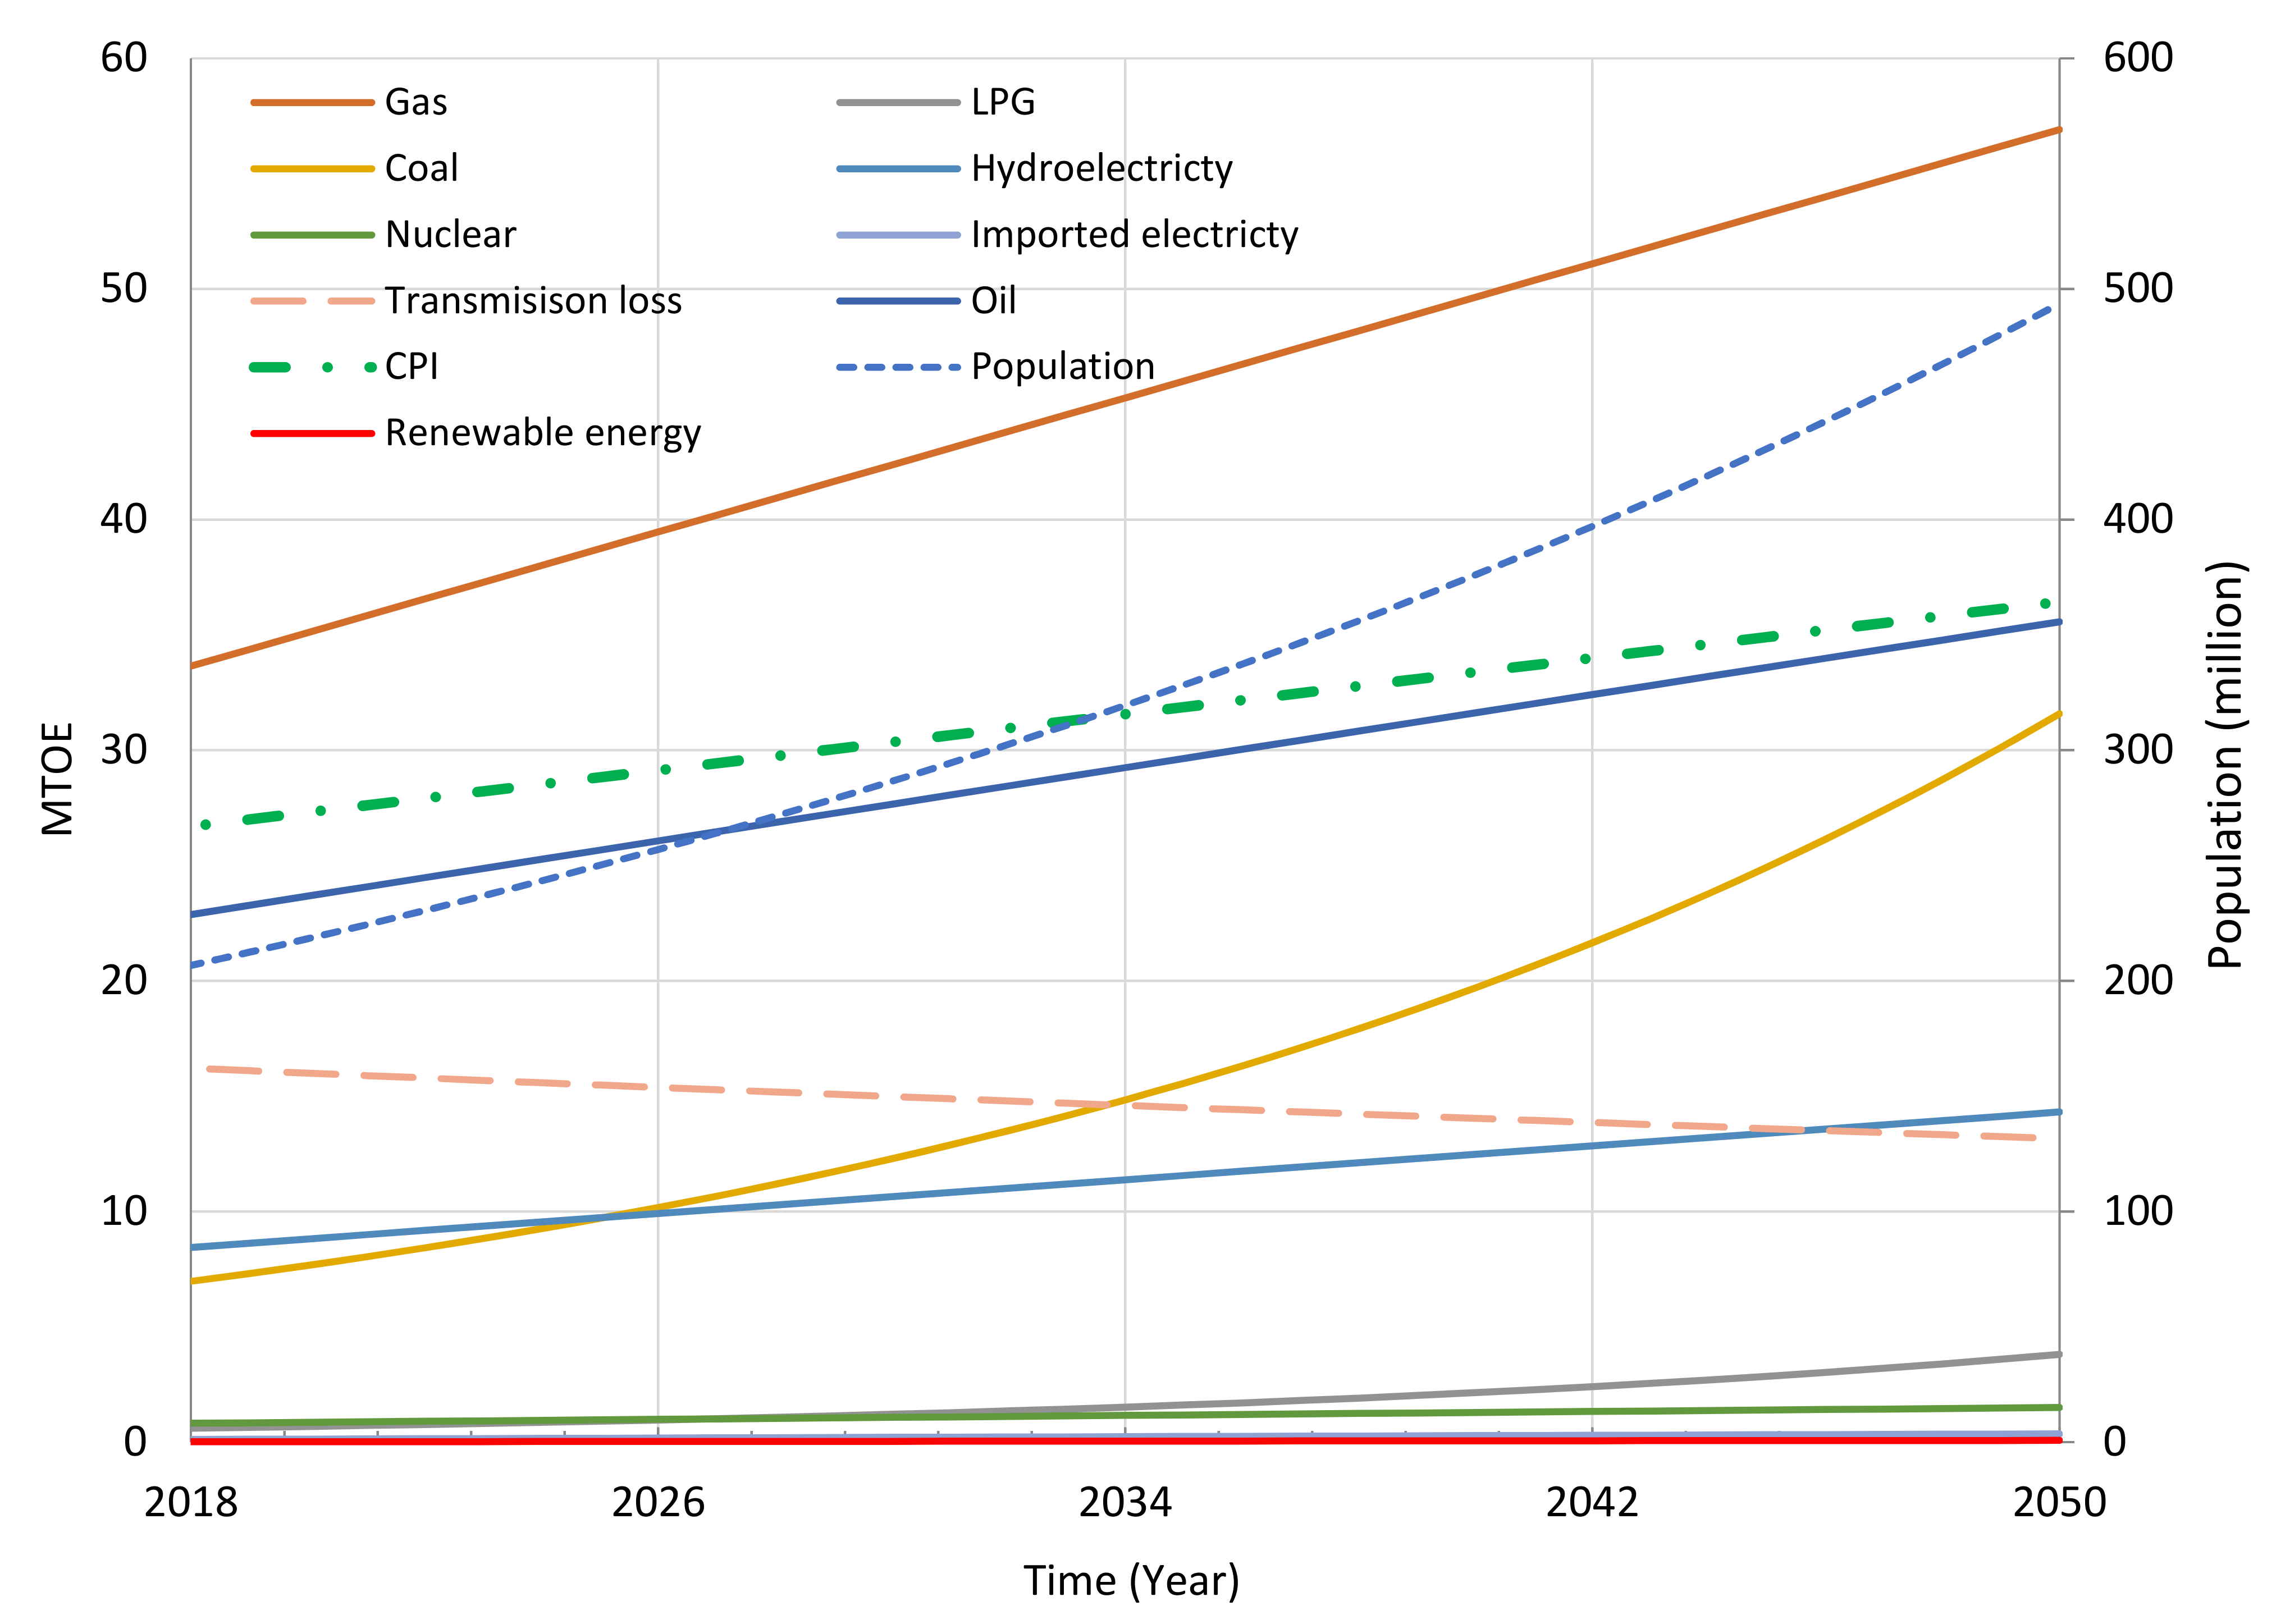
3. Results and Discussion

The results of the residual plot for the population variable are shown in Figure 3a. A pattern is visible in Figure 3a; this indicates that the linear model was not the best fit for the historical population data then a non-linear model was tested. Figure 3b shows the results of the population model and R-square value. The results indicate that an exponential model is the best fit for the historical population data since its R-square value is 0.9948, a value closer to 1; hence, the exponential model, shown in Equation (1), for the population is statistically viable [45]. The time-dependent model in Equation (1) is based on historical population data. The results of time-dependent models using the same energy supply and consumption procedures are presented in Table 5 and Table 6, respectively.
Models in Table 5 and Table 6 were used to forecast energy supply and consumption from 2018 to 2050 using one-year increments, and the results of energy supply are plotted in Figure 4.
Figure 4 indicates that in 2018, Pakistan was highly dependent on natural gas resources to fulfill its energy needs, and this dependency also seems highly likely in 2050. There appears to be an increase in the supply of natural gas supply from 33.64 MTOE in 2018 to 56.90 MTOE in 2050. The utilization of clean coal also seems promising, with its supply of 6.97 MTOE in 2018. In 2050 this supply is forecasted to be 353.85 MTOE. In the case of oil, its supply could increase to 35.56 MTOE by 2050. This trend makes the oil supply the second highest contributor to Pakistan’s energy sector after natural gas. The LPG supply of 0.61 MTOE in 2018 increases to 3.80 MTOE in 2050. Results in Figure 4 show that other important contributing factors for the future energy supply of Pakistan are hydroelectricity and nuclear energy, which will increase by 69.49% and 83.28% by 2050, respectively. The results of imported electricity show that Pakistan will increase its imported electricity by 197.09% to meet its energy demands. The results indicate that renewable energy supply will continue to be relatively low at the present growth rate. In 2018, renewable energy stood at 0.151 MTOE, while it increases to barely 0.767 MTOE in the year 2050, indicating that the contributions of renewable energy to the national energy grid, as compared to the supply of non-renewable energy resources such as natural gas, oil, and coal, are insignificant.
Based on the historical data of CPI from 1995 to 2016, there is a linear increase in CPI, as shown in Figure 4. The results indicate a rise of 36.46% in CPI by 2050, while the CPI value would be 36.43 in 2050. Since the CPI value of 36.43 is higher than 26.69 (in 2018), this reveals that by 2050 there would be slightly less corruption in the government departments; hence, it could be expected that the energy sector would also see gains. Transmission and distribution losses affect the overall production efficiency and thus are essential to discuss. Results show that the transmission distribution losses in Pakistan would decrease from 16.21 MTOE in 2018 to 13.16 MTOE in 2050, which indicates a decrease of 18.36%.
Results of uncertainty analysis from Oracle Crystal Ball simulation for the year 2025 are shown in Figure 5. The year 2025 is chosen merely to demonstrate the interpretation of the results of this research. Figure 5 indicates a probabilistic or forecast chart of energy supply for the entire range of possible energy supply outcomes in 2025. The likelihood of achieving those values can be analyzed using Figure 5. Figure 5 is a frequency chart in which the certainty level represents the probability of achieving energy supply values in 2025. It ranges from negative infinity to positive infinity. As shown in Figure 5, the forecasted value of 70.69 MTOE energy supply (computed from step 2 of the methodology) is presented, but it is just a number among many. To analyze the level of certainty in the forecasted value of 70.69 MTOE, the value of 70.69 was entered in the left infinity cell as shown in Figure 5, and the result was a certainty level of 86.18%, shown in Figure 5. Hence, the level of uncertainty is 13.82% (100 − 86.18% = 13.82%). The results of other years are shown in Figure 6.
Results of the uncertainty analysis in Figure 6 can help Pakistan’s energy policymakers to answer the various questions. For example, what is the likelihood that the energy supply in 2025 will be 72.66 MTOE?
Based on the simulation results shown in Figure 6, there is about 86% certainty of achieving or exceeding the original total energy supply value of 70.69 MTOE in the year 2025. A percentile is defined as the likelihood or percent chance that a forecast value will be less than or equal to the (default) percentile value. Due to space limitations, the 95th percentile and 5th percentile results are shown in detail in Figure 5, while Figure 6 summarizes results from the years 2017–2050. Figure 5 or Figure 6 shows that for the year 2025, the 95th percentile for total energy supply is 80.69 MTOE, meaning that there is a 95% chance of a forecast value of total energy supply being equal to or less than 82.69 MTOE in 2025. Figure 5 or Figure 6 shows that the 5th percentile for total energy supply in the year 2025 is 68.76 MTOE, indicating a 5% chance of a forecast value being less than or equal to 68.76 MTOE in 2025. Figure 6 shows a gradual decrease in the level of uncertainty in total energy supply over time from 2017 to 2050. This trend indicates an increase in certainty level. Results in Figure 6 show that in the year 2050, the forecasted value of total energy supply is 131.65 MTOE and that there is nearly 94% (100 − 6.22% = 93.78%) certainty of achieving or exceeding this value in 2050. In other words, there is 94% certainty that the energy supply in 2050 will be equal to or greater than 131.65 MTOE, while there is almost 6% certainty that the energy supply will be below 131.65 MTOE in 2050. Figure 6 shows that the 95th percentile and 5th percentile values of forecasted total energy supply in 2050 are 152.3 MTOE and 129.63 MTOE, respectively. This result is interpreted as in the year 2050, there is a 95% chance that the total energy supply will be 152.3 MTOE or less, or there is a 5% chance that the total energy supply needed will be higher than 152.3 MTOE. Results of the 5th percentile for total energy supply show that, in 2050, there is a 5% chance that the forecasted total energy supply will be equal to or less than 129.63 MTOE. Alternatively, there is a 95% chance of total energy supply being greater than 129.63 MTOE.
The results of forecasted energy consumption from 2018 to 2050 are presented in Figure 7, which represents the predicted energy–time consumption results from 2018 to 2050.
By the year 2050, the results show that the future most energy-hungry sector of Pakistan will be its industrial sector, the energy consumption of which will reach 79.97 MTOE by 2050. The domestic sector of Pakistan will be the second-highest consumer of energy by 2050. The results show that there would be a need for 63.45 MTOE of energy by 2050 to meet the entire energy demand of domestic consumers. Results in Figure 7 show that household energy consumption follows an exponential curve, and a sharp increase is observed from 2027 onwards. The energy requirements of transportation and commercial sectors are the third (24.24 MTOE) and fourth highest (19.71 MTOE). Figure 8 shows the results of the MCS for total energy consumption in the year 2025 and represents the base value of 70.3 MTOE (energy consumed as computed by step 2 of the methodology), at the 5th percentile value (67.20 MTOE) and 95th percentile value (75.24 MTOE).
Results show a 95% chance that, in the year 2025, the total energy consumption by domestic, commercial, industrial, agriculture, transport, infrastructure (streetlights), and other government properties will be 75.24 MTOE or less. In other words, there will be a 5% chance that the total energy consumption will be higher than 75.24 MTOE in 2025. Results of the 5th percentile show that, in 2025, there is a 5% chance that the forecasted total energy consumed will be equal to or less than 67.20 MTOE. This result indicates a 95% chance of total energy consumption being greater than 67.20 MTOE. For the year 2025, the results of certainty of achieving a value of 70.33 MTOE are shown in Figure 8. Results show that there is about a 35% chance (100 − 65.068% = 34.93% ≈ 35%) that this value of 70.33 MTOE will not be the total energy consumed in the year 2025, and it represents the level of uncertainty in total energy consumption in the year 2025. Results of MCS for total energy consumption from 2017 to 2050 are shown in Figure 9, indicating respective uncertainty levels, 5th percentile, and 95th percentile values for each year.
Figure 9 indicates the variation in uncertainty levels from 2017 to 2050. Results show that in the year 2050, the forecasted value of energy consumption is 189.48 MTOE. However, probabilistic analysis indicates uncertainty in this value, and there is almost 31% (30.76% ≈ 31%) uncertainty in achieving this value by 2050. Hence an energy policy based on energy consumption data of 189.4 MTOE would be misleading, and a holistic way to represent the energy demand and supply is through a probabilistic approach, as presented in this study. Figure 9 shows that the 95th percentile value for energy consumption in 2050 is 210.23 MTOE, which means there is a 95% chance that the forecasted energy consumption in 2050 will be equal to or less than 210.23 MTOE, while there is a 5% (100 − 95% = 5%) chance that energy consumed will be more than 210.23 MTOE. Figure 9 also reveals that the 5th percentile value of energy consumption in 2050 is 180.81 MTOE. The interpretation of this result is that there is a 5% chance that the energy consumed in 2050 will be less than or equal to 180.81 MTOE, while there is a 95% chance that the energy consumed in 2050 will be more than 180.81 MTOE, indicating the presence of uncertainty in energy consumption.
The results of Pakistan’s total energy need and supply from 2018 to 2050 are quite alarming. The historical input data for energy consumption and supply are shown in Table A3 of Appendix A and adopted from the literature [41]. The analysis outcomes (as shown in the methodology section) of this data are drawn in Figure 10. As shown in Figure 10, the results of total energy supply and consumption show an increasing trend in energy demand and energy supply. Results also indicate that from 2018 to 2050, the energy demand or consumption is higher than the energy produced or supplied. Figure 10 shows that by 2050, Pakistan could have a much higher energy demand than the energy supply available, and this could cause an energy shortfall of 43.21 MTOE by 2050. The yearly gaps (difference) between projected energy demand and supply are shown in Figure 10. Based on historical data, the forecasted energy shortfall (gap) between energy production and energy consumption is increasing over the years. The results of high energy consumption in Pakistan are due to a sharp increase in Pakistan’s population by 2050 (shown in Figure 4).
The model presented in the paper was validated using a single variable of gas supply data. The forecasted model was applied to previous years’ gas supply data and was compared with actual past values. MAPE measures the forecast accuracy by calculating absolute percent error minus actual values and divides the result by actual values. The actual values are values of the known period (i.e., 1971–2013). The results illustrated in Figure 11 show the proximity of the actual gas produced from 1972 to 2013 to the values obtained from the model developed for gas supply. The MAPE is 19.72%, which means that the percentage error in forecasted values is 19.72%.

4. Conclusions and Policy Implications

This study integrates regression analysis, curve fitting methods, and Monte Carlo simulation and forecasts Pakistan’s energy demand and supply from 2017 to 2050. Energy demand and supply–demand models used non-linear regression models, and input data were the historical data of Pakistan’s energy demand and supply. A stochastic analysis was performed on 17 energy variables using Monte Carlo simulation, and probabilistic profiles of energy supply and consumption for each year from 2017 to 2050 were developed. The study concludes that in 2050 Pakistan will be highly likely dependent on natural gas when the supply of natural gas reaches 56.90 MTOE from 33.64 MTOE in 2018. The study identifies that the national grid will have small contributions from renewable energy sources at the current pace of renewable energy projects in Pakistan. Therefore, the study emphases a need to initiate new renewable energy projects in the country immediately. One of the alarming results of the study is the massive increase in Pakistan’s population by 2050. Study shows that in 2050 Pakistan will have a population of 493.60 million. Such a colossal population will need an enormous amount of energy resources. The study also concludes that over time the energy consumption in Pakistan is increasing more rapidly than energy production, and the country can face an energy shortfall of 43.21 MTOE by 2050. Further conclusions and energy policy guidelines are discussed next.
Based on the analysis and results of this study, the following energy policy guidelines and recommendations are made:
Inclusion of data uncertainty in energy policymaking
Pakistan’s past energy policies have consistently failed to identify the likelihood of achieving their future set energy demand and supply targets. This study shows uncertainty in future energy demand and supply; hence, an energy policy based on such uncertain data could be misleading. Instead, as presented in this study, a probabilistic methodology can help develop a robust energy policy. For example, referring to Figure 9, the forecasted energy consumption in the year 2050 is 189.48 MTOE. However, the probabilistic model shows 31% uncertainty associated with this value, which means the energy consumed will be more than 189.48 MTOE. Hence an energy policy based merely on forecasted values will not be adequate; instead, it should include a probabilistic approach. In light of this study, it is recommended to incorporate uncertainty in energy data before decision-making to help develop a robust energy policy for Pakistan. The importance of this recommendation is also evident from the fact that in Vision 2025, the government aimed to have 45,000 MW of energy supply by the year 2025; however, as shown in this study, such an estimate without an uncertainty level leads to uncertain energy policy.
Inclusion of success likelihood in the energy-policy formulation
Implementing an energy policy faces various challenges such as compliance with the country’s laws, availability of investors, and natural disasters. Other obstacles are institutional barriers (departments do not work jointly), poor access to technology, lack of public awareness, and the challenge of gaining the confidence of local community members at a project site. In terms of renewable energy projects, additional challenges such as market barriers (competition with non-renewable power producers), financial barriers, lack of capacity, and inadequate training are also present. The proposed methodology in this study can help identify the success of achieving a set energy target under such scenarios. The use of a percentile can help to assess the certainty level of achieving energy goals. For example, as shown in Figure 5, in 2025, the 5th percentile of total energy supply is 68.76 MTOE, which shows a 5% chance of achieving this value in 2025. Based on the given challenge, this percentile value can take on any value based on need, and the results can be analyzed. Therefore, it is recommended to include the likelihood of success in formulating energy policy for different scenarios.
Development of capacity building programs
In a serious effort to combat national energy challenges, energy policymakers should develop a capacity-building program in which all stakeholders should be looked after, both in the governmental and private energy sectors. Energy policy development should incorporate residents, provincial and federal governments, community energy development programs, and educational tools such as training and webinars. One of the biggest challenges in this research was the collection of reliable energy data. It is recommended that the Government of Pakistan develop coordination among different departments with energy in their portfolios.
Exploration and optimization of indigenous resources utilization
The analysis indicates that in 2050, Pakistan would need indigenous resources to meet energy demand. As a policy recommendation, this analysis suggests that Pakistan should optimize its indigenous energy resources, including natural gas, oil, coal, nuclear, and hydropower resources. The study also emphasizes exploring more and new oil and gas reservoirs in the country. There is a need to develop effective, sustainable, long-term, and techno-economic-based policies to explore new and alternate energy resources. As results show, Pakistan will be highly dependent on electricity importation if new resources are not explored. Given these results, it is recommended that Pakistan develop energy conservation practices, which could help to reduce the dependency on imported electricity and help reduce additional expenditures.
Emphasis on renewable energy resources
This study reveals that renewable energy options have insignificant contributions to the national energy grid, while Pakistan is highly dependent on fossil fuel resources. Based on these results, it is recommended that Pakistan should introduce renewable energy technologies in the country. The Alternate Energy Development Board (AEDB) of the Government of Pakistan should develop investor-friendly incentives to accomplish this energy policy goal. The private sector should be encouraged to invest, and the public sector should be mobilized to defeat the status quo. The AEDB should be empowered to reduce the monopolistic markets of the oil and gas sectors in the country.
Energy losses and theft control
Pakistan’s energy policies have focused on energy generation and utilization, while less attention has been paid to control energy transmission and distribution losses. In the light of this study, it is recommended that Pakistan develop more rigorous means to minimize energy losses through transmission and distribution. Energy theft should be controlled through various techniques, as highlighted in the other energy policy guidelines [29,46].
Pakistan’s population and a coordinated energy policymaking
While energy policies are meant to address energy development and utilization in a country, equally important is the number of consumers in a country. The results of this study are quite alarming in these aspects; they show that Pakistan’s population is and will be increasing at an alarming rate. Results indicate that in 2050, Pakistan’s population is predicted to be 493.60 million. Considering this vast population, it would be a highly challenging task to meet their energy demands. A large population will need vast quantities of energy and require an increased supply of food, water, land, and a viable economy. This vast population would create a massive burden on employment creation and the health sector of the country. Without adequate planning and management, the increased population would also bring about sewerage and environmental issues such as air, water, and soil pollution. This situation could make Pakistan a significant contributor to global warming by 2050. To avoid such adverse conditions, energy policymakers should coordinate with the Ministry of National Health Services, Regulation, and Coordination (MoNHSRC), Government of Pakistan, to develop a shared understanding of energy and health value challenges. Here, it is acknowledged that some of these efforts were made in Vision 2025 [20].
Corruption-free energy projects
This study shows that there is an increasing trend in the numbers for the CPI. However, it is not a sharp rise over the period, which establishes a need for the government to improve its accountability and oversight of energy projects in the country. The government should take concrete steps to stop corruption in government departments, especially in the energy sector. Corruption in Pakistan’s government is quite evident [47], and energy projects are no exception. The CPI of Pakistan in 2050 is predicted to be 36.43. It is recommended that Pakistan develop guidelines to curb corruption in energy projects, enhancing Pakistan’s chances to defeat the battle of its energy crisis.
In conclusion, an innovative probabilistic methodology to assess proper future energy demand supply is proposed here. The proposed methodological framework helps to develop energy policy guidelines and recommendations. The applications of the method were demonstrated using the development of energy policies for Pakistan. The study assessed probabilistic energy supply and demand in Pakistan from 2017 to 2050. Past energy consumption and supply data from 1972 to 2016 were used as inputs. Results indicated that by 2050, Pakistan’s energy demand would be much higher than its supply for that year. The current energy-deficiency gap of 25.60 MTOE will increase to 43.21 MTOE. The industrial sector is projected to have the highest demand of 79.97 MTOE in 2050. Due to an increased gap between energy supply and demand, Pakistan may have serious energy issues in the future. Therefore, the study recommends that the Government of Pakistan should launch both short and long-term energy projects to mitigate the supply and demand gap.
Furthermore, policymakers must focus on energy generation from different resources such as hydropower plants, clean coal, natural gas and oil, and renewable energy. This study emphasizes the development of a comprehensive and well-integrated energy policy for the country. It is suggested that future energy policies should focus on more energy resources and should promote energy security and sustainability in Pakistan.
The study shows that by 2050, Pakistan will have its highest dependency on natural gas. It also reveals that Pakistan’s population is increasing at an alarming rate and that by 2050, Pakistan could have a population of 493.60 million. It suggests that Pakistan should control its population growth rate. The probabilistic analysis of energy data shows variations in uncertainty levels. The results reveal that forecasted energy supply data has less uncertainty than energy consumption data. This result indicates a high level of variation in energy consumption data, and it necessitates the adoption of more rigorous means to record and monitor energy consumption data in Pakistan.
Based on the results of the proposed methodology, eight energy policy guidelines have been presented. Recommended energy policy guidelines can help energy policymakers to develop better energy policy guidelines using the proposed method. This work could be used to study uncertainties in the energy policies of other countries and can be further improved by performing a risk assessment of energy policy practices.

Author Contributions

Conceptualization, Z.S.; Data curation, Z.S. and A.J.; Formal analysis, Z.S.; Funding acquisition, Z.S. and A.J.; Investigation, Z.S., A.J., M.K.K., H.S. and U.H.; Methodology, Z.S.; Project administration, Z.S.; Resources, Z.S.; Software, Z.S.; Validation, Z.S.; Visualization, Z.S., A.J., M.K.K., H.S. and U.H.; Writing—original draft, Z.S.; Writing—review & editing, Z.S., A.J., M.K.K., H.S. and U.H. All authors have read and agreed to the published version of the manuscript.

Funding

This research received no external funding.

Institutional Review Board Statement

Not applicable.

Informed Consent Statement

Not applicable.

Data Availability Statement

Not applicable.

Acknowledgments

The authors would like to thank Farooq Sher for sharing the energy data used in this study. The authors would also like to thank Janat Javed for helping in preparing graphs in the first draft of this paper.

Conflicts of Interest

The authors declare no conflict of interest.

Appendix A

Table A1. Energy Supply Data.
YearOil Gas LPG Coal Hydro Electricity Nuclear Electricity Imported Electricity Renewable Energy †,‡
19726.1633.2320.0420.8090.6430.009--
19736.1523.7060.0430.7950.6950.026--
19746.4754.2260.0460.8080.7400.039--
19755.6454.5570.0460.8630.8030.052--
19765.7504.5640.0430.7030.8350.052--
19776.0644.9430.0460.8000.9000.036--
19787.0095.1780.0560.8341.0450.020--
19797.2405.7330.0590.8581.2100.009--
19807.7136.7270.0661.0461.2880.000--
19818.0457.7650.0661.0511.3690.013--
19828.7738.3740.0711.1671.5060.016--
19838.5878.9900.0721.0731.6750.020--
19848.8138.9790.0771.2461.8540.028--
19859.4309.3720.0821.4921.9490.030--
198610.4299.8460.0861.4682.1650.037--
198710.19610.4260.0961.5072.4260.043--
198810.59011.3260.1111.8332.8250.022--
198910.50611.7970.1151.6913.1980.003--
199010.89210.5610.0931.8304.0400.070--
199110.84911.0300.1102.0054.3690.092--
199212.07711.6620.0962.3264.4510.100--
199313.14612.4070.1072.1155.0390.139--
199414.49313.1370.0892.3014.6390.119--
199514.99313.2640.1452.0825.4560.122--
199616.48514.0850.1842.3385.5390.115--
199716.59815.0680.1572.1424.9790.083--
199817.47915.1160.1642.0455.2660.089--
199917.83816.1390.1812.1475.3580.068--
200018.74117.4880.2082.0474.6040.095--
200119.26818.4020.1442.0104.1040.477--
200218.38819.2530.1722.2004.5210.547--
200318.01620.5900.1822.5205.3350.4150.0001-
200415.22125.2540.2063.3006.4310.4200.017-
200516.33027.9530.2524.2286.1270.6670.026-
200616.41229.2030.4004.0507.3660.5930.035-
200718.18829.3240.4714.4277.6270.5460.041-
200819.20629.8750.4195.7846.8520.7350.048-
200920.10330.2560.4024.7336.6320.3860.0540.001
201019.80630.8090.3964.6226.7060.6910.0600.002
201120.67530.6830.3404.3517.5930.8160.0640.004
201219.80632.0330.3214.2856.8071.2570.0660.006
201320.96931.1440.3103.8637.1271.0870.0900.047
201421.79030.7370.3494.3737.8520.7000.0900.089
201522.19531.4640.3584.4728.0350.7210.0970.096
201622.59932.1910.3664.5728.2190.7430.1050.122
= MTOE, = electricity net generation, hyphen (-) denotes data are unknown or unavailable.
Table A2. Energy consumption data.
YearDomestic Commercial Industrial Agriculture Transport Streetlights Other government CPI
19903.4280.4556.5470.7084.9310.0200.586-
19913.5060.4976.6110.7345.0970.0230.521-
19923.3300.5157.2380.7695.9150.0270.510-
19933.5980.5627.5590.7586.4210.0260.560-
19943.7780.5937.8930.7916.7440.0260.558-
19954.3260.6507.8810.7896.9840.0280.57010.000
19964.7480.6318.7390.8067.4960.0330.72730.000
19974.8240.6648.0250.8577.5390.0340.72123.000
19985.3510.6858.0010.8207.7420.0330.73110.000
19995.3440.7578.2910.7178.3030.0190.70125.000
20005.7090.7808.6630.6758.7850.0210.67227.000
20015.8260.7788.6080.6668.6860.0180.69222.000
20025.8950.8098.8090.6928.6120.0180.78622.000
20036.0920.8529.3180.6958.7710.0210.58423.000
20046.2790.92811.0990.7349.2810.0230.65826.000
20056.8131.08012.7600.71710.0710.0260.66325.000
20067.0551.24814.6540.7339.4940.0300.76221.000
20077.6051.37715.7920.7679.7210.0330.74221.000
20088.0461.45616.8040.80411.5670.0360.73622.000
20098.0921.46014.8460.78911.3720.0370.78624.000
20108.3601.53015.6050.85011.6550.0390.76925.000
20118.7251.52114.9570.77312.0190.0390.84724.000
20129.3611.58515.0340.72012.5620.0410.76323.000
201310.1191.64514.2560.66012.7130.0390.79225.000
20149.5761.64916.4270.74212.8360.0390.82122.700
20159.8541.70416.8810.74113.1550.0400.83228.000
201610.1331.75917.3360.74013.4740.0410.84329.000
= MTOE, = dimensionless, hyphen (-) denotes data are unknown or unavailable.
Table A3. Data of population, distribution losses, energy production, and consumption.
YearPopulation (Million)Distribution Losses (%)
196044.912-
196145.988-
196247.123-
196348.313-
196449.555-
196550.849-
196652.195-
196753.594-
196855.046-
196956.546-
197058.094-
197159.69026.255
197261.34126.255
197363.06223.732
197464.87423.158
197566.79125.259
197668.81828.023
197770.95428.105
197873.20427.976
197975.57625.455
198078.07229.084
198180.69225.794
198283.42824.864
198386.26525.080
198489.18325.095
198592.16520.289
198695.20720.286
198798.30221.771
1988101.42121.674
1989104.53120.083
1990107.60820.726
1991110.63419.851
1992113.61622.190
1993116.58122.799
1994119.56522.764
1995122.60022.812
1996125.69823.432
1997128.84624.611
1998132.01430.414
1999135.15826.684
2000138.25024.267
2001141.28226.064
2002144.27226.475
2003147.25225.202
2004150.26824.568
2005153.35624.037
2006156.52422.311
2007159.76819.592
2008163.09721.171
2009166.52119.880
2010170.04416.226
2011173.67016.883
2012177.39217.032
2013181.19317.032
2014185.04420.189
2015188.92520.044
2016181.83219.899
The hyphen (-) denotes data that is unknown or unavailable.

References

  1. Urban, F.; Benders, R.M.J.; Moll, H.C. Modelling energy systems for developing countries. Energy Policy 2007, 35, 3473–3482. [Google Scholar] [CrossRef]
  2. Mirakyan, A.; De Guio, R. Integrated energy planning in cities and territories: A review of methods and tools. Renew. Sustain. Energy Rev. 2013, 22, 289–297. [Google Scholar] [CrossRef]
  3. Mirakyan, A.; Lelait, L.; Khomenko, N.; Kaikov, I. Methodological Framework for the analysis and development of a sustainable, integrated, regional energy plan–A French region case study. EcoMod 2009, 7, 1–26. [Google Scholar]
  4. Hodge, B.-M.S.; Huang, S.; Siirola, J.D.; Pekny, J.F.; Reklaitis, G.V. A multi-paradigm modeling framework for energy systems simulation and analysis. Comput. Chem. Eng. 2011, 35, 1725–1737. [Google Scholar] [CrossRef]
  5. Alahdad, Z. Pakistan’s Energy Sector: From Crisis to Crisis: Breaking the Chain; Pakistan Institute of Development Economics: Islamabad, Pakistan, 2012. [Google Scholar]
  6. Sioshansi, F. Energy, Sustainability and the Environment: Technology, Incentives, Behavior; Elsevier: Amsterdam, The Netherlands, 2011. [Google Scholar]
  7. Yang, G.; Li, W.; Wang, J.; Zhang, D. A comparative study on the influential factors of China’s provincial energy intensity. Energy Policy 2016, 88, 74–85. [Google Scholar] [CrossRef]
  8. Bianco, V.; Manca, O.; Nardini, S.; Minea, A.A. Analysis and forecasting of nonresidential electricity consumption in Romania. Appl. Energy 2010, 87, 3584–3590. [Google Scholar] [CrossRef]
  9. Bianco, V.; Manca, O.; Nardini, S. Electricity consumption forecasting in Italy using linear regression models. Energy 2009, 34, 1413–1421. [Google Scholar] [CrossRef]
  10. Sajid, Z.; Khan, F.; Zhang, Y. Process simulation and life cycle analysis of biodiesel production. Renew. Energy 2016, 85, 945–952. [Google Scholar] [CrossRef]
  11. Sajid, Z.; Lynch, N. Financial modelling strategies for social life cycle assessment: A project appraisal of biodiesel production and sustainability in Newfoundland and Labrador, Canada. Sustainability 2018, 10, 3289. [Google Scholar] [CrossRef] [Green Version]
  12. Sajid, Z.; Zhang, Y.; Khan, F. Process design and probabilistic economic risk analysis of bio-diesel production. Sustain. Prod. Consum. 2016, 5, 1–15. [Google Scholar] [CrossRef]
  13. Sajid, Z.; Khan, F.; Zhang, Y. A novel process economics risk model applied to biodiesel production system. Renew. Energy 2018, 118, 615–626. [Google Scholar] [CrossRef]
  14. Valasai, G.D.; Uqaili, M.A.; Memon, H.R.; Samoo, S.R.; Mirjat, N.H.; Harijan, K. Overcoming electricity crisis in Pakistan: A review of sustainable electricity options. Renew. Sustain. Energy Rev. 2017, 72, 734–745. [Google Scholar] [CrossRef]
  15. Mirjat, N.H.; Uqaili, M.A.; Harijan, K.; Valasai, G.D.; Shaikh, F.; Waris, M. A review of energy and power planning and policies of Pakistan. Renew. Sustain. Energy Rev. 2017, 79, 110–127. [Google Scholar] [CrossRef] [Green Version]
  16. Khan, A.N.; Begum, T.; Sher, M. Energy crisis in Pakistan: Causes and consequences. Abasyn J. Soc. Sci. 2012, 4, 341–363. [Google Scholar]
  17. Rauf, O.; Wang, S.; Yuan, P.; Tan, J. An overview of energy status and development in Pakistan. Renew. Sustain. Energy Rev. 2015, 48, 892–931. [Google Scholar] [CrossRef]
  18. Hassan, S.Z.; Kamal, T. Evaluating the issues and challenges in context of the energy crisis of Pakistan. Indian J. Sci. Technol. 2016, 9, 36. [Google Scholar]
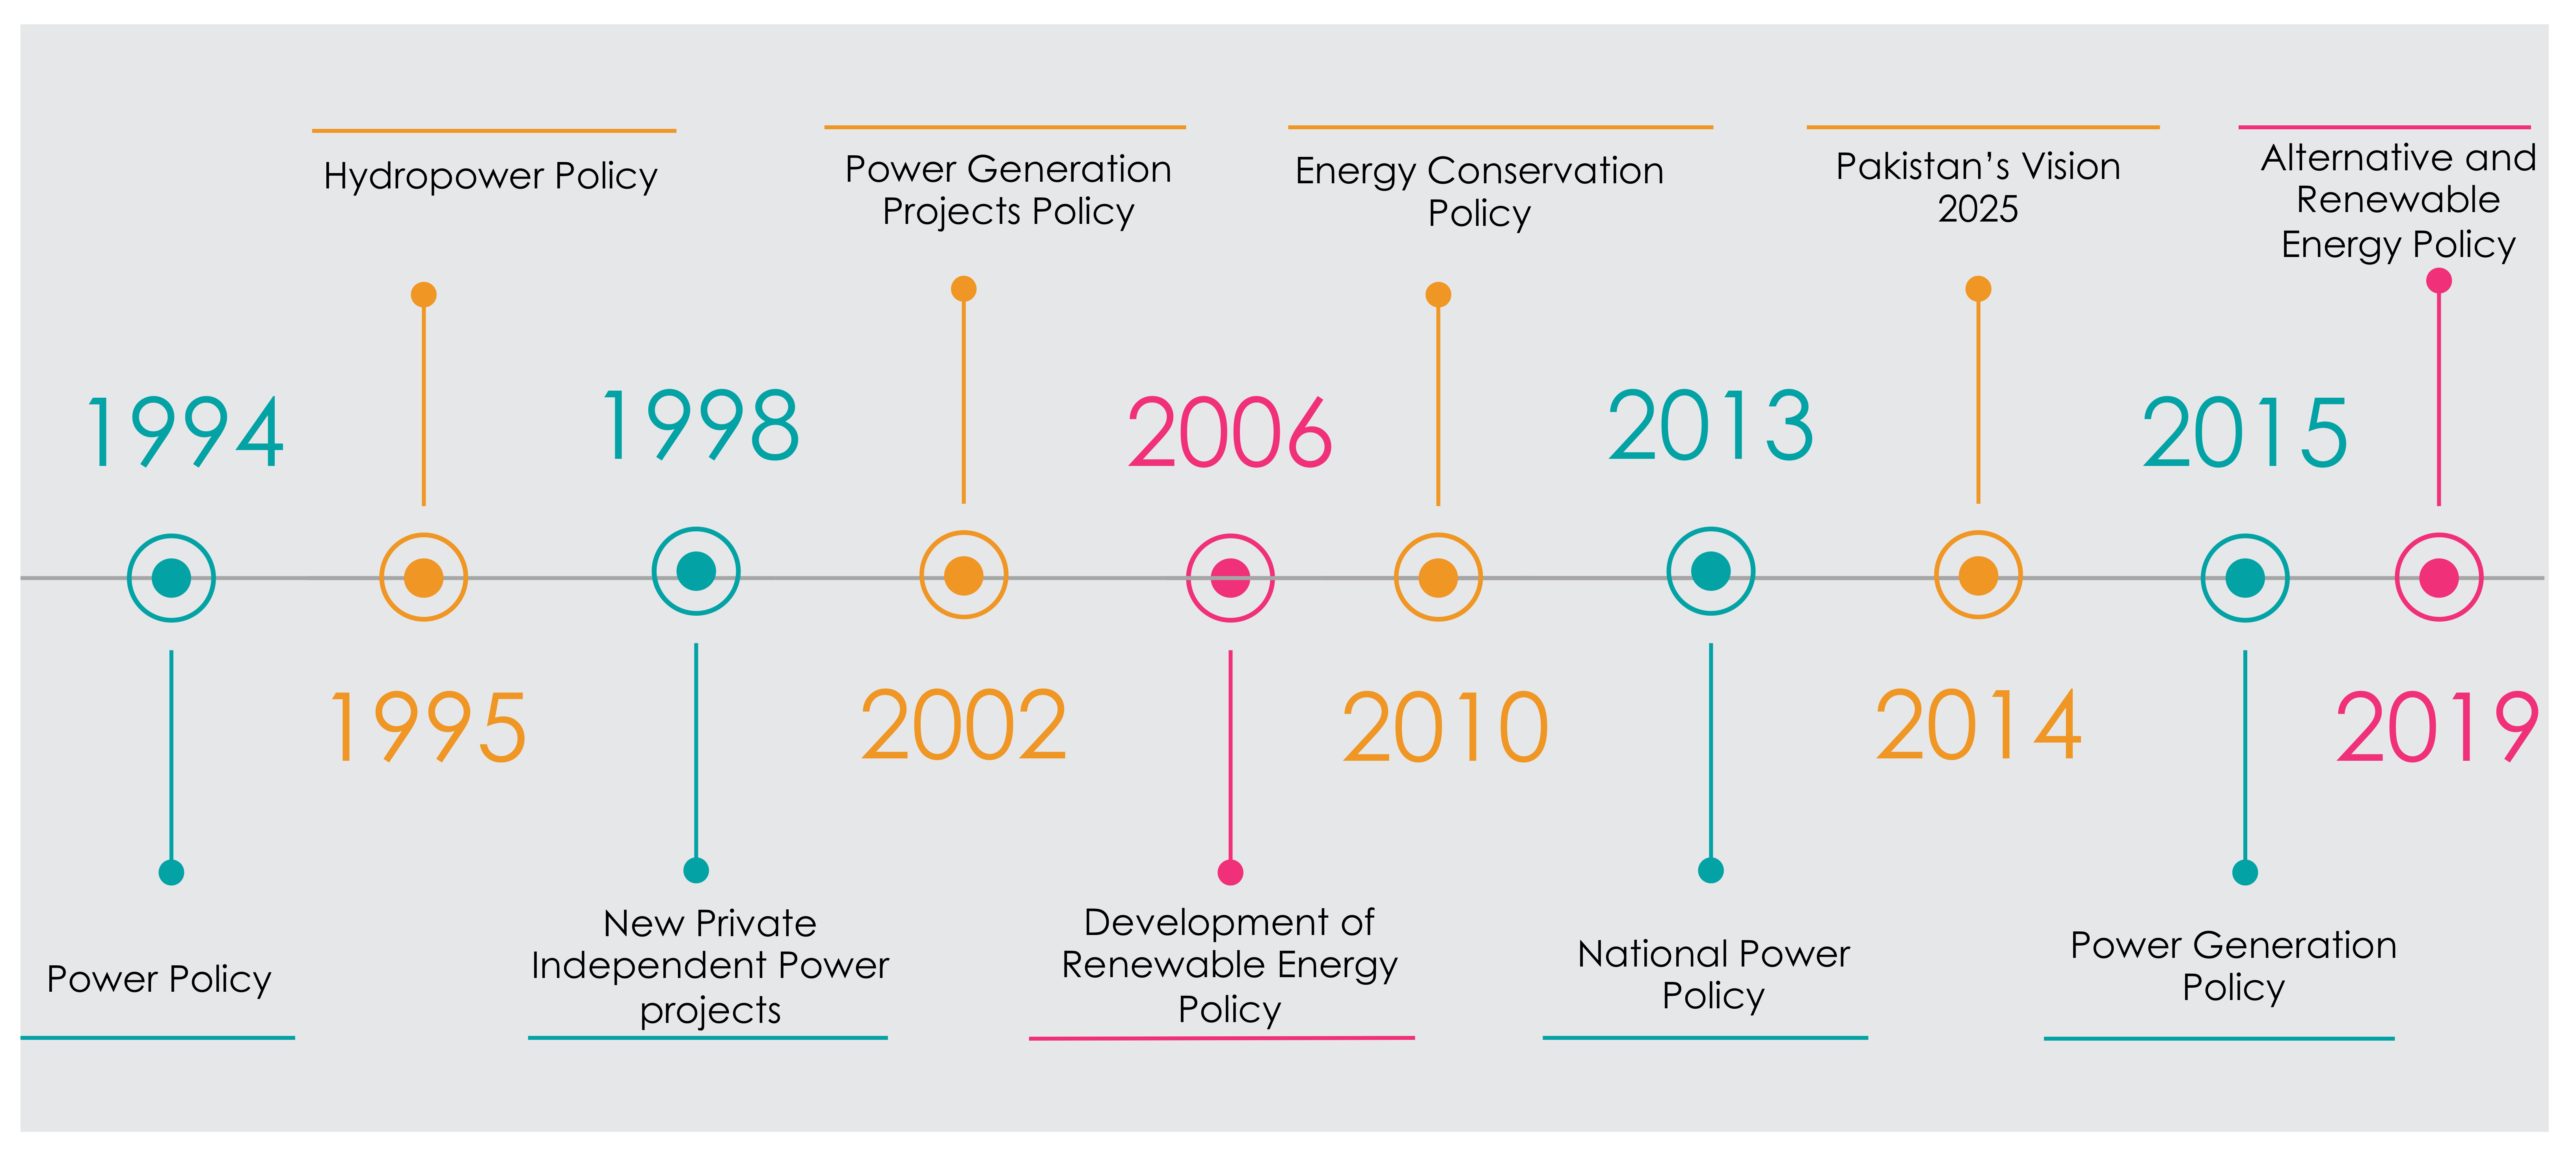
  19. Government of Pakistan. Policy Framework and Package of Incentives for Private Sector Power Generation Projects in Pakistan. 1994. Available online: http://www.ppib.gov.pk/Power%20Policy%201994.pdf (accessed on 10 August 2021).
  20. Government of Pakistan. Hydel Power Potential of Pakistan and Hydel Power Policy 1995. 1995. Available online: http://embassyofpakistanusa.org/wp-content/uploads/2017/05/Hydel-Power-Potential-of-Pakistan1.pdf (accessed on 10 August 2021).
  21. Government of Pakistan. Policy for New Private Independent Power Projects. 1998. Available online: https://nepra.org.pk/Policies/Power%20Policy%201998.pdf (accessed on 10 August 2021).
  22. NEPRA. Policy for Power Generation Projects Year 2002; Government of Pakistan: Islamabad, Pakistan, 2002.
  23. Government of Pakistan. Policy for Development of Renewable Energy for Power Generation—Employing Small Hydro, Wind, and Solar Technologies 2006. Available online: http://www.aedb.org/Documents/Policy/REpolicy.pdf (accessed on 10 August 2021).
  24. Government of Pakistan. National Power Policy. 2013. Available online: https://www.ppib.gov.pk/National%20Power%20Policy%202013.pdf (accessed on 10 August 2021).
  25. Pakistan Planning Commission. Pakistan 2025—One Nation One Vision. 2014. Available online: https://www.pc.gov.pk/uploads/vision2025/Pakistan-Vision-2025.pdf (accessed on 10 August 2021).
  26. Government of Pakistan. Power Generation Policy 2015. 2015. Available online: https://nepra.org.pk/Policies/Power%20Policy%202015.pdf (accessed on 10 August 2021).
  27. Government of Pakistan. Alternative and Renewable Energy Policy 2019. 2019. Available online: https://www.aedb.org/images/Draft_ARE_Policy_2019_-_Version_2_July_21_2019.pdf (accessed on 10 August 2021).
  28. Muzalevsky, R. Enhancing Pakistan’s Energy Security. Cent Secur Stud—ETH Zurich. 2011. Available online: https://ethz.ch/content/specialinterest/gess/cis/center-for-securities-studies/en/services/digital-library/articles/article.html/131190 (accessed on 10 August 2021).
  29. Sajid, Z.; Javaid, A. A Stochastic Approach to Energy Policy and Management: A Case Study of the Pakistan Energy Crisis. Energies 2018, 11, 2424. [Google Scholar] [CrossRef] [Green Version]
  30. Akram, U.; Nadarajah, M.; Shah, R.; Shafiq, S. Frequency security constrained energy management in an isolated power system. WSEAS Trans. Power Syst. 2020, 15, 222–229. [Google Scholar] [CrossRef]
  31. Rosini, A.; Bonfiglio, A.; Mestriner, D.; Minetti, M.; Bracco, S. A Simplified Study for Reactive Power Management in Autonomous Microgrids. WSEAS Trans. Power Syst. 2019, 14, 107–112. [Google Scholar]
  32. Esmail, E.M.; Elsadd, M.A.; Elkalashy, N.I.; Kawady, T. A review: Smart Distribution Grid Management using Agents. WSEAS Trans. Syst. 2020, 19, 257–270. [Google Scholar] [CrossRef]
  33. Rehman, S.A.U.; Cai, Y.; Fazal, R.; Walasai, G.; Mirjat, N.H. An integrated modeling approach for forecasting long-term energy demand in Pakistan. Energies 2017, 10, 1868. [Google Scholar] [CrossRef] [Green Version]
  34. Birim, Ş.; Tümtürk, A. Modeling and forecasting Turkey’s electricity consumption by using artificial neural network. Am. Sci. Res. J. Eng. Technol. Sci. 2016, 25, 192–208. [Google Scholar]
  35. Deka, A.; Hamta, N.; Esmaeilian, B.; Behdad, S. Predictive modeling techniques to forecast energy demand in the United States: A focus on economic and demographic factors. J. Energy Resour. Technol. 2016, 138, 22001. [Google Scholar] [CrossRef]
  36. Fumo, N.; Biswas, M.A.R. Regression analysis for prediction of residential energy consumption. Renew. Sustain. Energy Rev. 2015, 47, 332–343. [Google Scholar] [CrossRef]
  37. Di Leo, S.; Caramuta, P.; Curci, P.; Cosmi, C. Regression analysis for energy demand projection: An application to TIMES-Basilicata and TIMES-Italy energy models. Energy 2020, 196, 117058. [Google Scholar] [CrossRef]
  38. Transparency International. Corruption Perceptions Index 2013: Now is the Time for Action 2013. Available online: https://www.transparency.org/en/news/cpi-2013-now-is-the-time-for-action# (accessed on 10 August 2021).
  39. Ministry of Energy (Petroleum Division). Yearbook PE; Hydrocarbon Development Institute of Pakistan: Islamabad, Pakistan, 2017.
  40. Ministry of Energy (Petroleum Division). Book PEY; Hydrocarbon Development Institute of Pakistan: Islamabad, Pakistan, 2010.
  41. United States Energy Information Administration. Pakistan Total Primary Energy Production and Consumption by Year (Quadrillion Btu). 2021. Available online: https://www.indexmundi.com/energy/?country=pk&product=total-primary-energy&graph=production+consumption (accessed on 10 August 2021).
  42. Global Economy. Pakistan: Freedom from Corruption. The Global Economy Com. 2019. Available online: https://www.theglobaleconomy.com/Pakistan/herit_corruption/ (accessed on 10 August 2021).
  43. The World Bank. Population, Total—Pakistan. 2020. Available online: https://data.worldbank.org/indicator/SP.POP.TOTL?end=2015&locations=PK&start=1960&view=chart (accessed on 10 August 2021).
  44. The World Bank. Electric Power Transmission and Distribution Losses (% of output). 2019. Available online: https://data.worldbank.org/indicator/EG.ELC.LOSS.ZS?locations=PK (accessed on 10 August 2021).
  45. Cox, D.R.; Snell, E.J. Analysis of Binary Data; Routledge: London, UK, 2018. [Google Scholar]
  46. Irfan, M.; Suleman, A.H.; Sarwar, U.; Bin, A.N.; Saleem, M.S. SWOT analysis of energy policy 2013 of Pakistan. Eur. J. Eng. Sci. Technol. 2019, 2, 71–94. [Google Scholar] [CrossRef] [Green Version]
  47. Chêne, M. Overview of corruption in Pakistan. Transpar. Int. 2008. Available online: https://www.incpak.com/wp-content/uploads/2012/12/expert-helpdesk-174.pdf (accessed on 24 August 2021).
Figure 1. IEP process and energy policy making.
Resources 10 00088 g001
Figure 2. Roadmap of Pakistan’s energy policies; 1994: Aimed to fulfill power shortages of 2000 MW [19], 1995: Inclusion of private sector in hydropower plants [20], 1998: Power demand forecasted between 19,000 and 25,000 MW by July 2008 [21], 2002: Short (5 years), medium (10 years), and long (25 years) term energy plans to produce 792 MW, 10,600 MW, and 23,493 MW energy, respectively [22], 2006: Inclusion of minimum 9700 MW of renewable energy in national energy supply mix by 2030 [23], 2010: Focused on energy conservation, short and long-term energy production plans, 2013: Decrease supply-demand gap from 5000 MW to zero by 2017 [24], 2014: Eliminate current (2014) electricity gap by 2018 and add 25,000 MW energy by 2025 [25], 2015: Public, private partnership encouraged to meet country’s energy demand [26], 2019: Development of sustainable renewable energy (RE) market and increase of RE shares in country’s power sector [27]. The pink colors indicate the initiatives for renewable energy policymaking.
Resources 10 00088 g002
Figure 3. (a) Residual plot for population; (b) exponential plot for the population model.
Resources 10 00088 g003
Figure 4. Forecasted time-series energy supplies from 2018 to 2050.
Resources 10 00088 g004
Figure 5. Level of certainty in energy supply for the year 2025.
Resources 10 00088 g005
Figure 6. Uncertainty levels in total energy supply from 2017 to 2050.
Resources 10 00088 g006
Figure 7. Forecasted time–series energy consumption from 2018 to 2050.
Resources 10 00088 g007
Figure 8. Level of certainty in energy consumption for the year 2025.
Resources 10 00088 g008
Figure 9. Uncertainty levels in total energy consumption from 2017 to 2050.
Resources 10 00088 g009
Figure 10. The projected gap between energy production and consumption from 2018 to 2050.
Resources 10 00088 g010
Figure 11. Model validation for actual gas produced versus the forecasted value of gas produced.
Resources 10 00088 g011
Table 1. Explanation of energy variables used in this study.
NumberEnergy VariableDefinitionUnits
1OilOil represents the energy obtained from liquid fossil-based hydrocarbon fuels (carbon and hydrogen compounds). Significant examples are furnace oil, gasoline, and diesel fuels.MTOE
2Natural gasNatural gas indicates the energy obtained from gaseous fossil-based fuels. These fuels mainly consist of methane (CH4), and other compounds are propane, ethane, butane, and pentane.MTOE
3LPGThis factor indicates the energy obtained from LPG. LPG stands for liquified petroleum gas (LPG) and is a mixture of gaseous fuels such as butane and propane.MTOE
4CoalIt indicates the energy obtained by the burning of coal. Coal is a combustible fossil-based solid fuel. Consisting mainly of carbon and hydrogen, oxygen, sulphur, and nitrogen.MTOE
5HydroelectricityIt is the form of energy produced from flowing water such as from dams.MTOE
6NuclearNuclear energy is the energy obtained from controlled nuclear reactions such as fission.MTOE
7Imported electricityIt indicates the electricity that Pakistan imports from other countries.MTOE
8DomesticThis variable indicates energy use for household purposes such as space and water heating, lighting, cooking, washing, drying, air conditioning, space cooling, and other electrical appliances.MTOE
9CommercialIt represents the energy needed for nonmanufacturing business units such as restaurants, retail stores, hotels, educational institutions, motels, wholesalers, health, and social institutions.MTOE
10IndustrialIt denotes the energy utilized in processes in which raw materials are converted into other valuable products at a large scale.MTOE
11AgricultureIt denotes the energy used in the cultivation of livestock and plants.MTOE
12TransportTransport shows the energy used to move products and people from one location to another through various means such as airlines, railroads, trucking, logistic firms, and shipping.MTOE
13InfrastructureIt indicates the energy required for the physical structure and facilities that support day-to-day government and private operations in Pakistan, such as roads and buildings.MTOE
14Government propertiesIt indicates the energy needed for immovable properties owned and operated by the Government of Pakistan and commonly known as state properties.MTOE
15PopulationThis variable indicates the total number of humans living in Pakistan.Number of people
16Transmission lossesIt describes the energy, power, or voltage loss of a transmitted current while passing along a transmission path through an electric circuit.MTOE
17Corruption Perception Index (CPI)The corruption perception index (CPI), annually published by Transparency International, ranks countries based on the corruption level of their governments. CPI scores range from 0 to 100, where 0 denotes a high level of corruption in government businesses, while 100 shows a low level of corruption [38].Dimensionless
Table 2. Distributions assigned to energy supply variables.
Variables (MTOE)Assigned DistributionParameters (MTOE)
OilNormal Distribution Resources 10 00088 i001
Mean 22.48, Standard Deviation 2.25
GasTriangular Resources 10 00088 i002
Minimum 29.63, Likeliest 32.92, Maximum 36.21
LPGNormal Distribution Resources 10 00088 i003
Mean 0.57, Standard Deviation 0.06
CoalGamma Distribution Resources 10 00088 i004
Location 6.65, Scale 0.67, Shape 2
HydroelectricityGamma Distribution Resources 10 00088 i005
Location 8.26, Scale 0.83, Shape 2
NuclearNormal Distribution Resources 10 00088 i006
Mean 0.80, Standard Deviation 0.08
Imported ElectricityNormal Distribution Resources 10 00088 i007
Mean 0.11, Standard Deviation 0.01
Transmission LossesBetaPERT Distribution Resources 10 00088 i008
Minimum 14.69, Likeliest 16.32, Maximum 17.95
Renewable EnergyNormal Distribution Resources 10 00088 i009
Mean 0.13, Standard Deviation 0.01
Table 3. Distributions assigned to energy consumption variables.
Variables (MTOE)Assigned DistributionParameters (MTOE)
DomesticNormal Distribution Resources 10 00088 i010
Mean 13.28, Standard Deviation 1.33
CommercialGamma Distribution Resources 10 00088 i011
Location 2.87, Scale 0.29, Shape 2
IndustrialTriangle Distribution Resources 10 00088 i012
Minimum value 18.17, Likeliest value 20.19, Maximum value 22.21
AgricultureNormal Distribution Resources 10 00088 i013
Mean 0.83, Standard Deviation 0.08
TransportBetaPERT Distribution Resources 10 00088 i014
Minimum 12.35, Likeliest 13.73, Maximum 15.10
Infrastructure (Streetlights)Normal Distribution Resources 10 00088 i015
Mean 0.06, Standard Deviation 0.01
Other government propertiesStudent’s t distribution Resources 10 00088 i016
Midpoint 0.85, Scale, 0.08, Degree of Freedom 5
Table 4. Definitions of assigned distributions.
Distribution TypeDefinition
Normal distributionIt is a function that shows the distribution of random variables as a symmetrical graph, also known as a bell-shaped curve. It is defined using mean and standard deviation.
Triangular distributionIt is the probability distribution having three points, namely, minimum, maximum, and likeliest values.
Gamma distributionIt indicates the probability distribution that is right-skewed and consists of location, shape, and scale parameters.
BetaPERT distributionThis distribution is a smooth version of triangular distribution and is represented using maximum, minimum, and likeliest values.
Student’s t distributionIt is also known as t distribution and is a probability distribution used to estimate the parameters of a small sample size or when the variance of the population is unknown. With the increase in sample size, it becomes similar to the normal distribution. It is defined using the degree of freedom, midpoint, and scale.
Table 5. Energy supply model based on historical data.
Variable CategoryTime-Dependent Model Nature of the Model
Population 3 × 10⁻²²+0.0272(t)Exponential
Oil *806.760ln(t)–6116Logarithmic
Gas *0.72701(t)–1433.4Linear
LPG *3 × 10−51+0.0574(t)Exponential
Coal *3 × 10−41+0.0472(t)Exponential
Hydroelectricity *0.18340(t)–361.656Linear
Nuclear *0.02130(t)–42.165Linear
Imported electricity *0.00743(t)–14.865Linear
Renewable energy *0.01924(t)–38.681Linear
Corruption Perception Index (CPI) 0.30420(t)–587.179Linear
Transmission distribution losses **1 × 1045t−13.25Non-linear Power series
Million, dimensionless, ** percentage (%), * MTOE, time in years.
Table 6. Energy consumption model based on historical data.
Variable CategoryTime-Dependent Model Nature of the Model
Domestic *4 × 10−41+0.0474(t)Exponential
Commercial *2 × 10−51+0.0584(t)Exponential
Industrial *1 × 10−279 t84.82Power
Agriculture *6.25291 × 10−0.001(t)Exponential
Transport *0.31860(t)–628.891Linear
Infrastructure (streetlights) *0.00091(t)–1.759Linear
Other government *21.76ln(t)–164.730Logarithmic
* MTOE time in years.
Publisher’s Note: MDPI stays neutral with regard to jurisdictional claims in published maps and institutional affiliations.

