1. Introduction
The sustainable and affordable supply of clean, safe, and adequate quality water is one of the world’s most challenging problems [
1]. As is known, the relationship between mining and sustainability is complex and controversial [
2]. That is why many developing countries whose main economic activity is mining are highly vulnerable to the negative impacts on different environmental factors, especially water. According to the World Health Organization, diseases associated with the lack of drinking water, adequate sanitation, and hygiene continue to be one of the leading causes of mortality for millions of developing countries [
3]. The current water problem is reflected as a priority in Goal 6, “Clean Water and Sanitation,” within the Sustainable Development Goals (SDG), which frame the 2030 agenda [
4].
Water resources in developing regions of the world have high social and ecological value, and many vulnerable human communities depend on these resources for their livelihoods [
5]. In this sense, the quality of surface water bodies represents an aspect of great relevance that should be a fundamental object of study for its preservation [
6,
7]. There are various tools to analyze the state of the quality of water bodies; among these, a reasonably conventional one that is frequently applied is the Water Quality Index (ICA). This index (ICA) indicates the degree of contamination of a water body for a given use and is related to the anthropic activities that cause it [
8].
Likewise, there are emerging tools such as the Normalized Chlorophyll-a Index (NDCI) [
9,
10,
11]. Through methodologies related to remote sensing, this index focuses on the measurement of the organic load in a body of water as an indicator of eutrophication processes, in addition to the presence of a turbidity level, by identifying a specific pigment (chlorophyll-a) [
12,
13,
14]. Geographic information systems and remote sensing applied to the management of water resources allow us to study various biophysical factors, such as the delimitation of basins, identification of bodies of water, and their characterization, among other fundamental aspects [
15].
The marked water deficit that exists in the semi-arid areas of the Bolivian Altiplano exposes the need to protect the water sources in the region [
16]. The first step is to estimate water quality in terms of spatial and temporal variability to use these resources sustainably [
17]. During and after mining, the environment is being negatively impacted [
18]. This study takes the upper part of the Milluni micro-basin as the study area. The Milluni lagoons, which come from natural snowy mountains, are very close to illegal, exploited, and abandoned mines, which compromises the quality of their waters [
19]. The main water problem caused by mining operations is contamination with heavy metals at toxic levels, particularly copper, lead, cadmium, zinc, and arsenic, which are naturally found in traces in the natural environment [
20,
21]. This makes Milluni highly vulnerable to the contamination of its water resources, which are natural drinking water sources that supply two cities with a high population density in Bolivia.
This research aims to proposes a combined monitoring system to complement the traditional monitoring designed for Milluni [
22] with the remote sensing of pollutants. The latter was obtained using remote sensing methodologies and programming on the “Google Earth Engine” platform [
23]. As a result, more information on water quality in Milluni would be accessible to decision-makers in water management. This could help improve the monitoring of water resources in Bolivia and worldwide.
2. Materials and Methods
In this section, a description of the study area is presented, which is followed by a description of the methodology used in this study.
2.1. Description of the Study Area
Milluni is approximately 4600 m.a.s.l., it has an area of 40 km
2 and is part of the Altiplano basin system. This micro-basin presents extreme climatic conditions typical of the region [
24]. Mining activity developed in this area from 1940 to 1990. Although mining activities stopped approximately 20 years ago, the impact of mining waste on water quality remains a severe national environmental problem. Another issue that affects water quality in this area is small-scale and illegal mining activities for which there is no precise information [
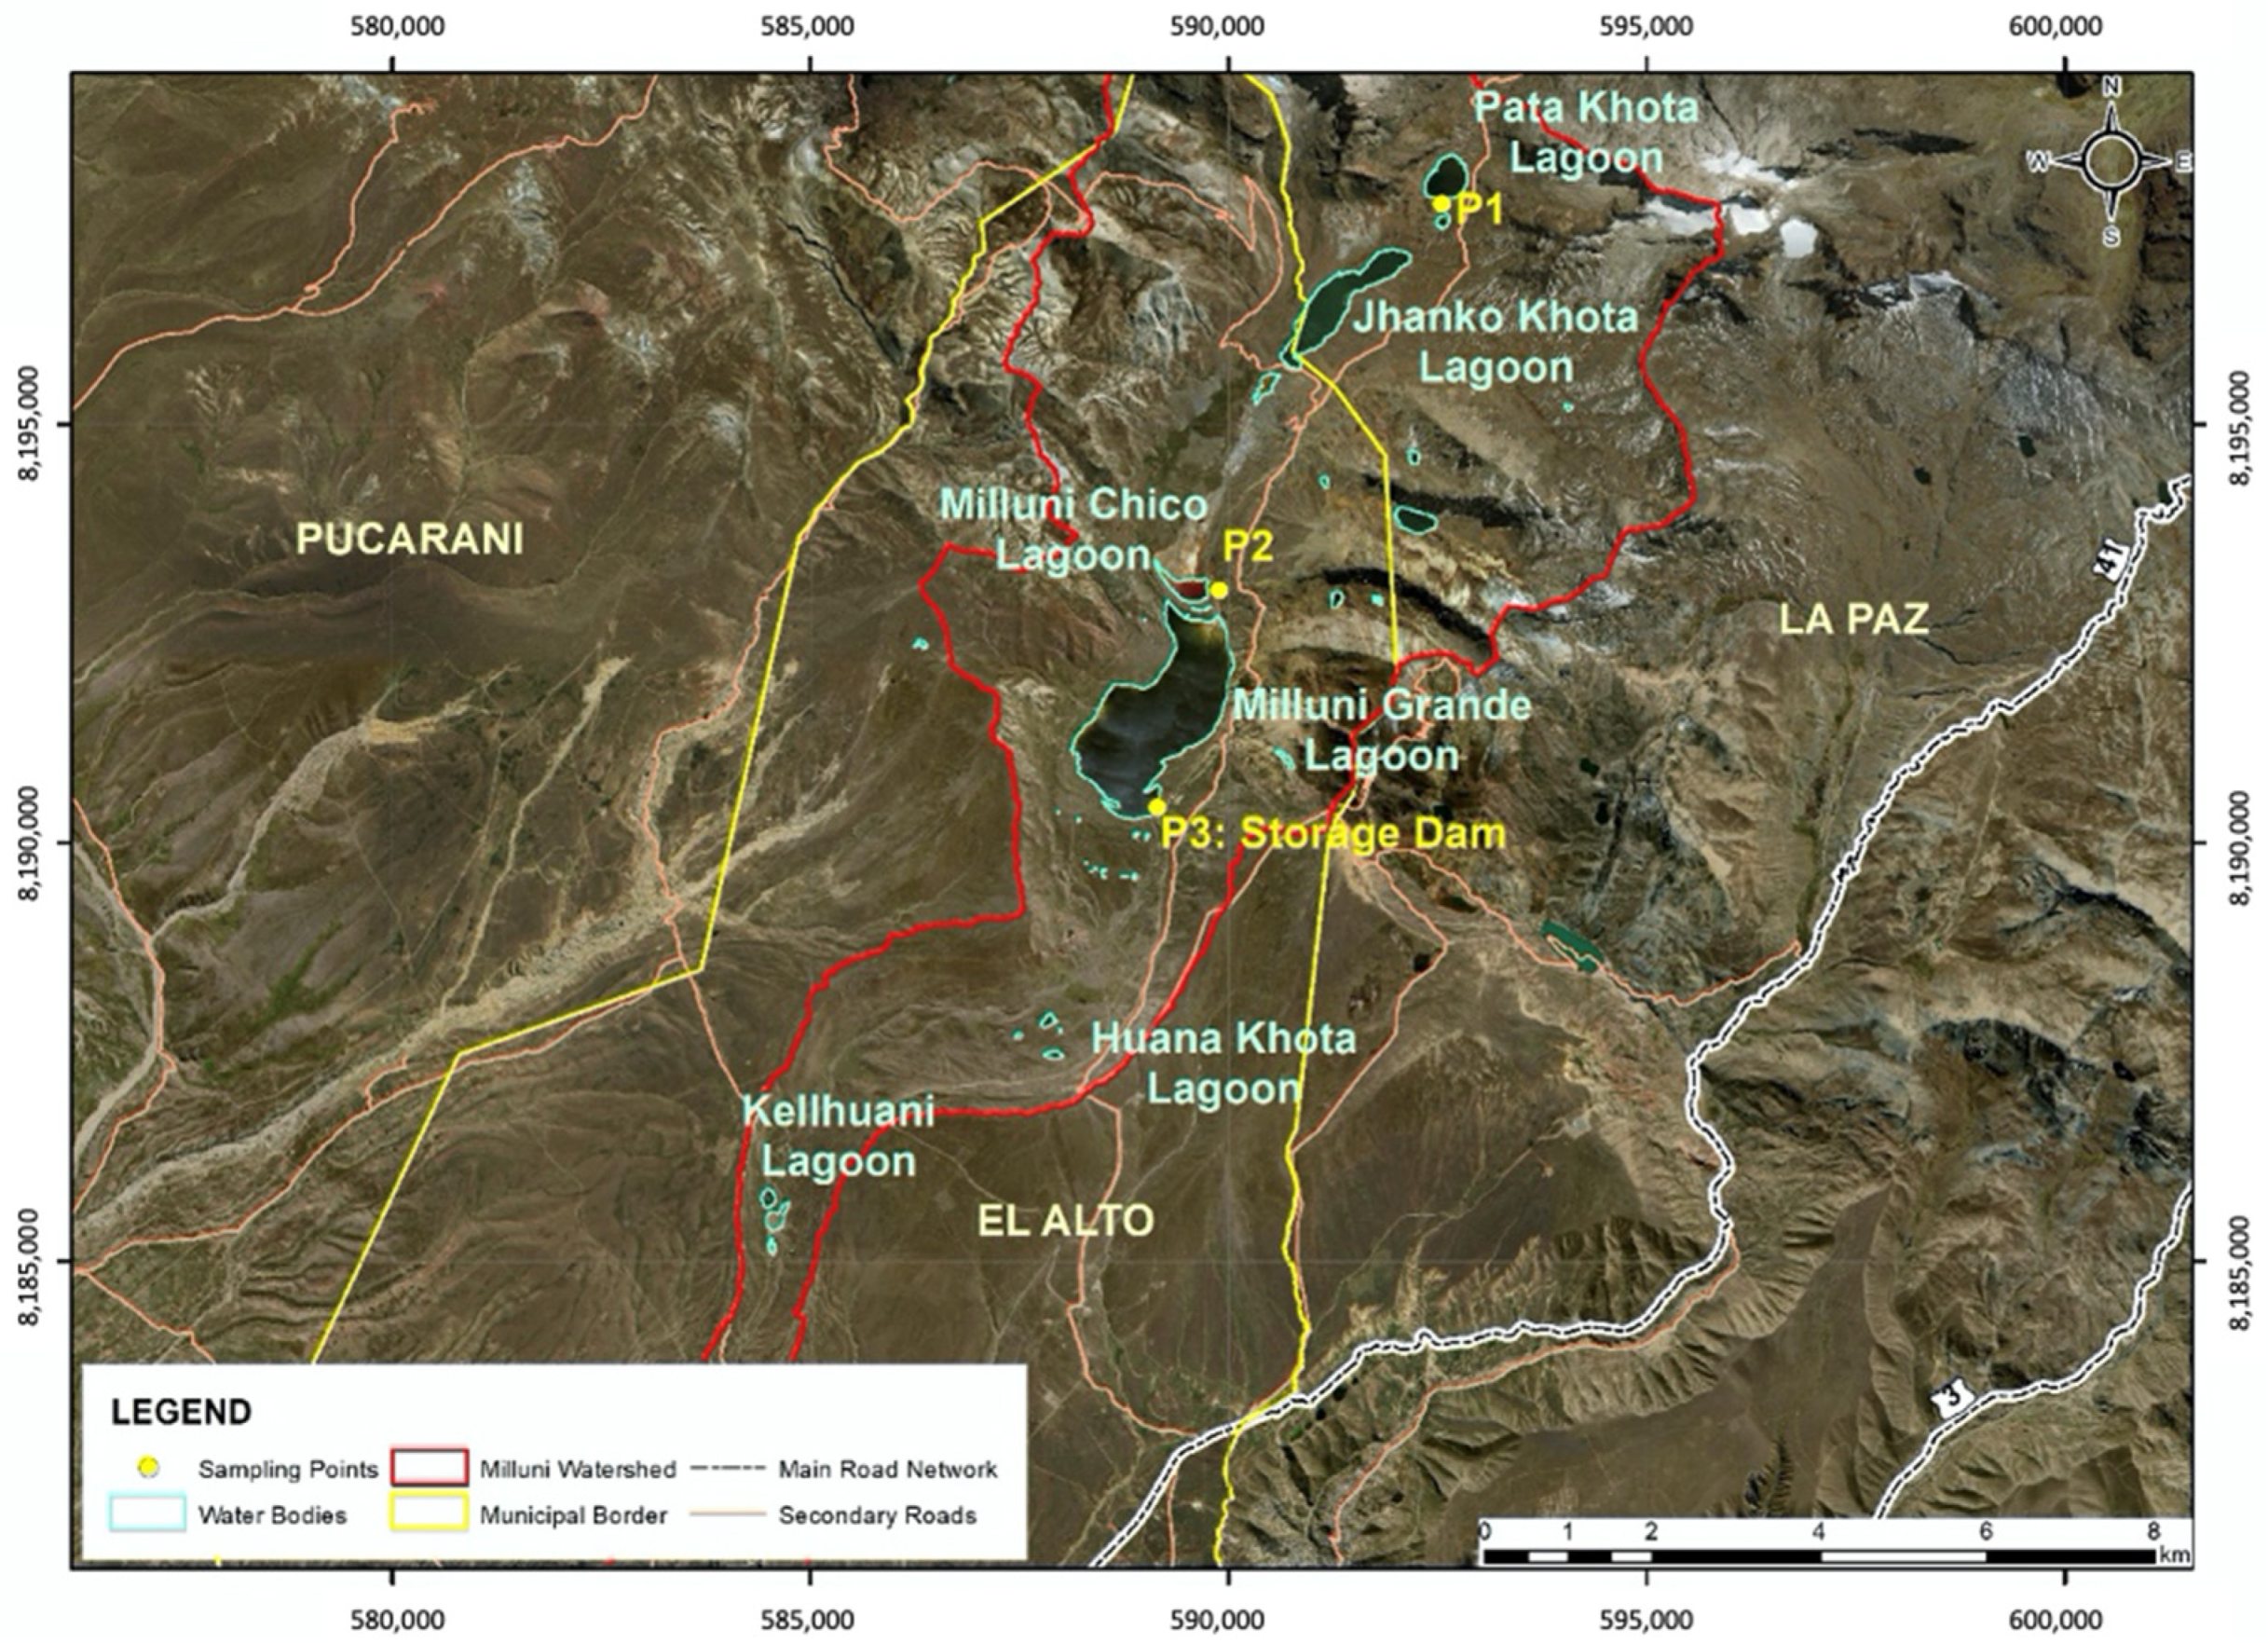
19]. There are four lagoons in the upper part of the Milluni micro-basin; their names are Pata Khota lagoon, Jankho Khota lagoon, Milluni Chico lagoon, and Milluni Grande lagoon; a brief detail of these lagoons is presented below [
25].
Pata Khota: A natural lagoon of irregular shape that receives water from the glacier of the Huayna Potosí. It is located at 4665 m.a.s.l.
Jankho Khota: Located at 4560 m.a.s.l., an irregular-shaped natural lagoon that receives water from the Pata Khota lagoon.
Milluni Chico: An artificial lagoon at an altitude of 4550 m.a.s.l., having an irregular shape and receiving water from natural springs, Jankho Khota lagoon, and mines. This artificial lagoon aims to capture the acid drainage of the mines to prevent it from entering the Milluni Grande lagoon.
Milluni Grande: Located at 4530 m.a.s.l., the Milluni Grande lagoon receives effluents from natural springs, mines’ drainage, and the Milluni Chico lagoon, specifically located 2.7 km from this lagoon; it also receives water from the Jankho Khota lagoon through a bypass system. There is a water storage dam for public supply in this lagoon, which has a high probability of contamination by heavy metals due to its tributaries.
The upper part of the Milluni micro-basin is relevant because its lagoons are a source of water for the public supply. This area has a high probability of contamination by heavy metals, which was exposed in the study in 2008 [
19] and was ratified in 2019 [
26]. This last study carried out a review of historical data on water quality in the area, where the presence of heavy metals such as arsenic, cadmium, iron, zinc, and manganese was identified, which were found with concentrations higher than those values established in Bolivian Standard 512 for drinking water [
27]. For this reason, the Milluni area must be closely monitored to avoid risk to public health. For this purpose, a monitoring program for surface water bodies was designed, which considers the Milluni area’s specific characteristics [
22].
The Water Quality Monitoring Program (WQMP) for Milluni was based on two international standards: the UNEP/WHO monitoring program design guide [
28] and Bolivian Norm NB, which adopts ISO 5667-1 [
29], the latter specific to bodies’ surface water. The objective of the WQMP is to determine the quality of the water of Milluni to become a control program that generates representative data and contributes to the water management of the place. There were three designated monitoring points; their locations can be seen in
Figure 1, and the image of each of them can be seen in
Figure 2.
Point 1 (E: 592549; N: 8197635) has the purpose of determining the reference conditions in the watercourse system; for this reason, it is located in the headwaters of the lagoon system in the Pata Khota lagoon. Point 2 (E: 589887; N: 8193022) seeks to identify any sign of deterioration in the quality of the water in the water system due to anthropogenic activities and is located in the Milluni Chico lagoon. Finally, Point 3 (E: 589147; N: 8190424) aims to expose whether the body of water in the course system meets the desired quality standards when located in a storage dam.
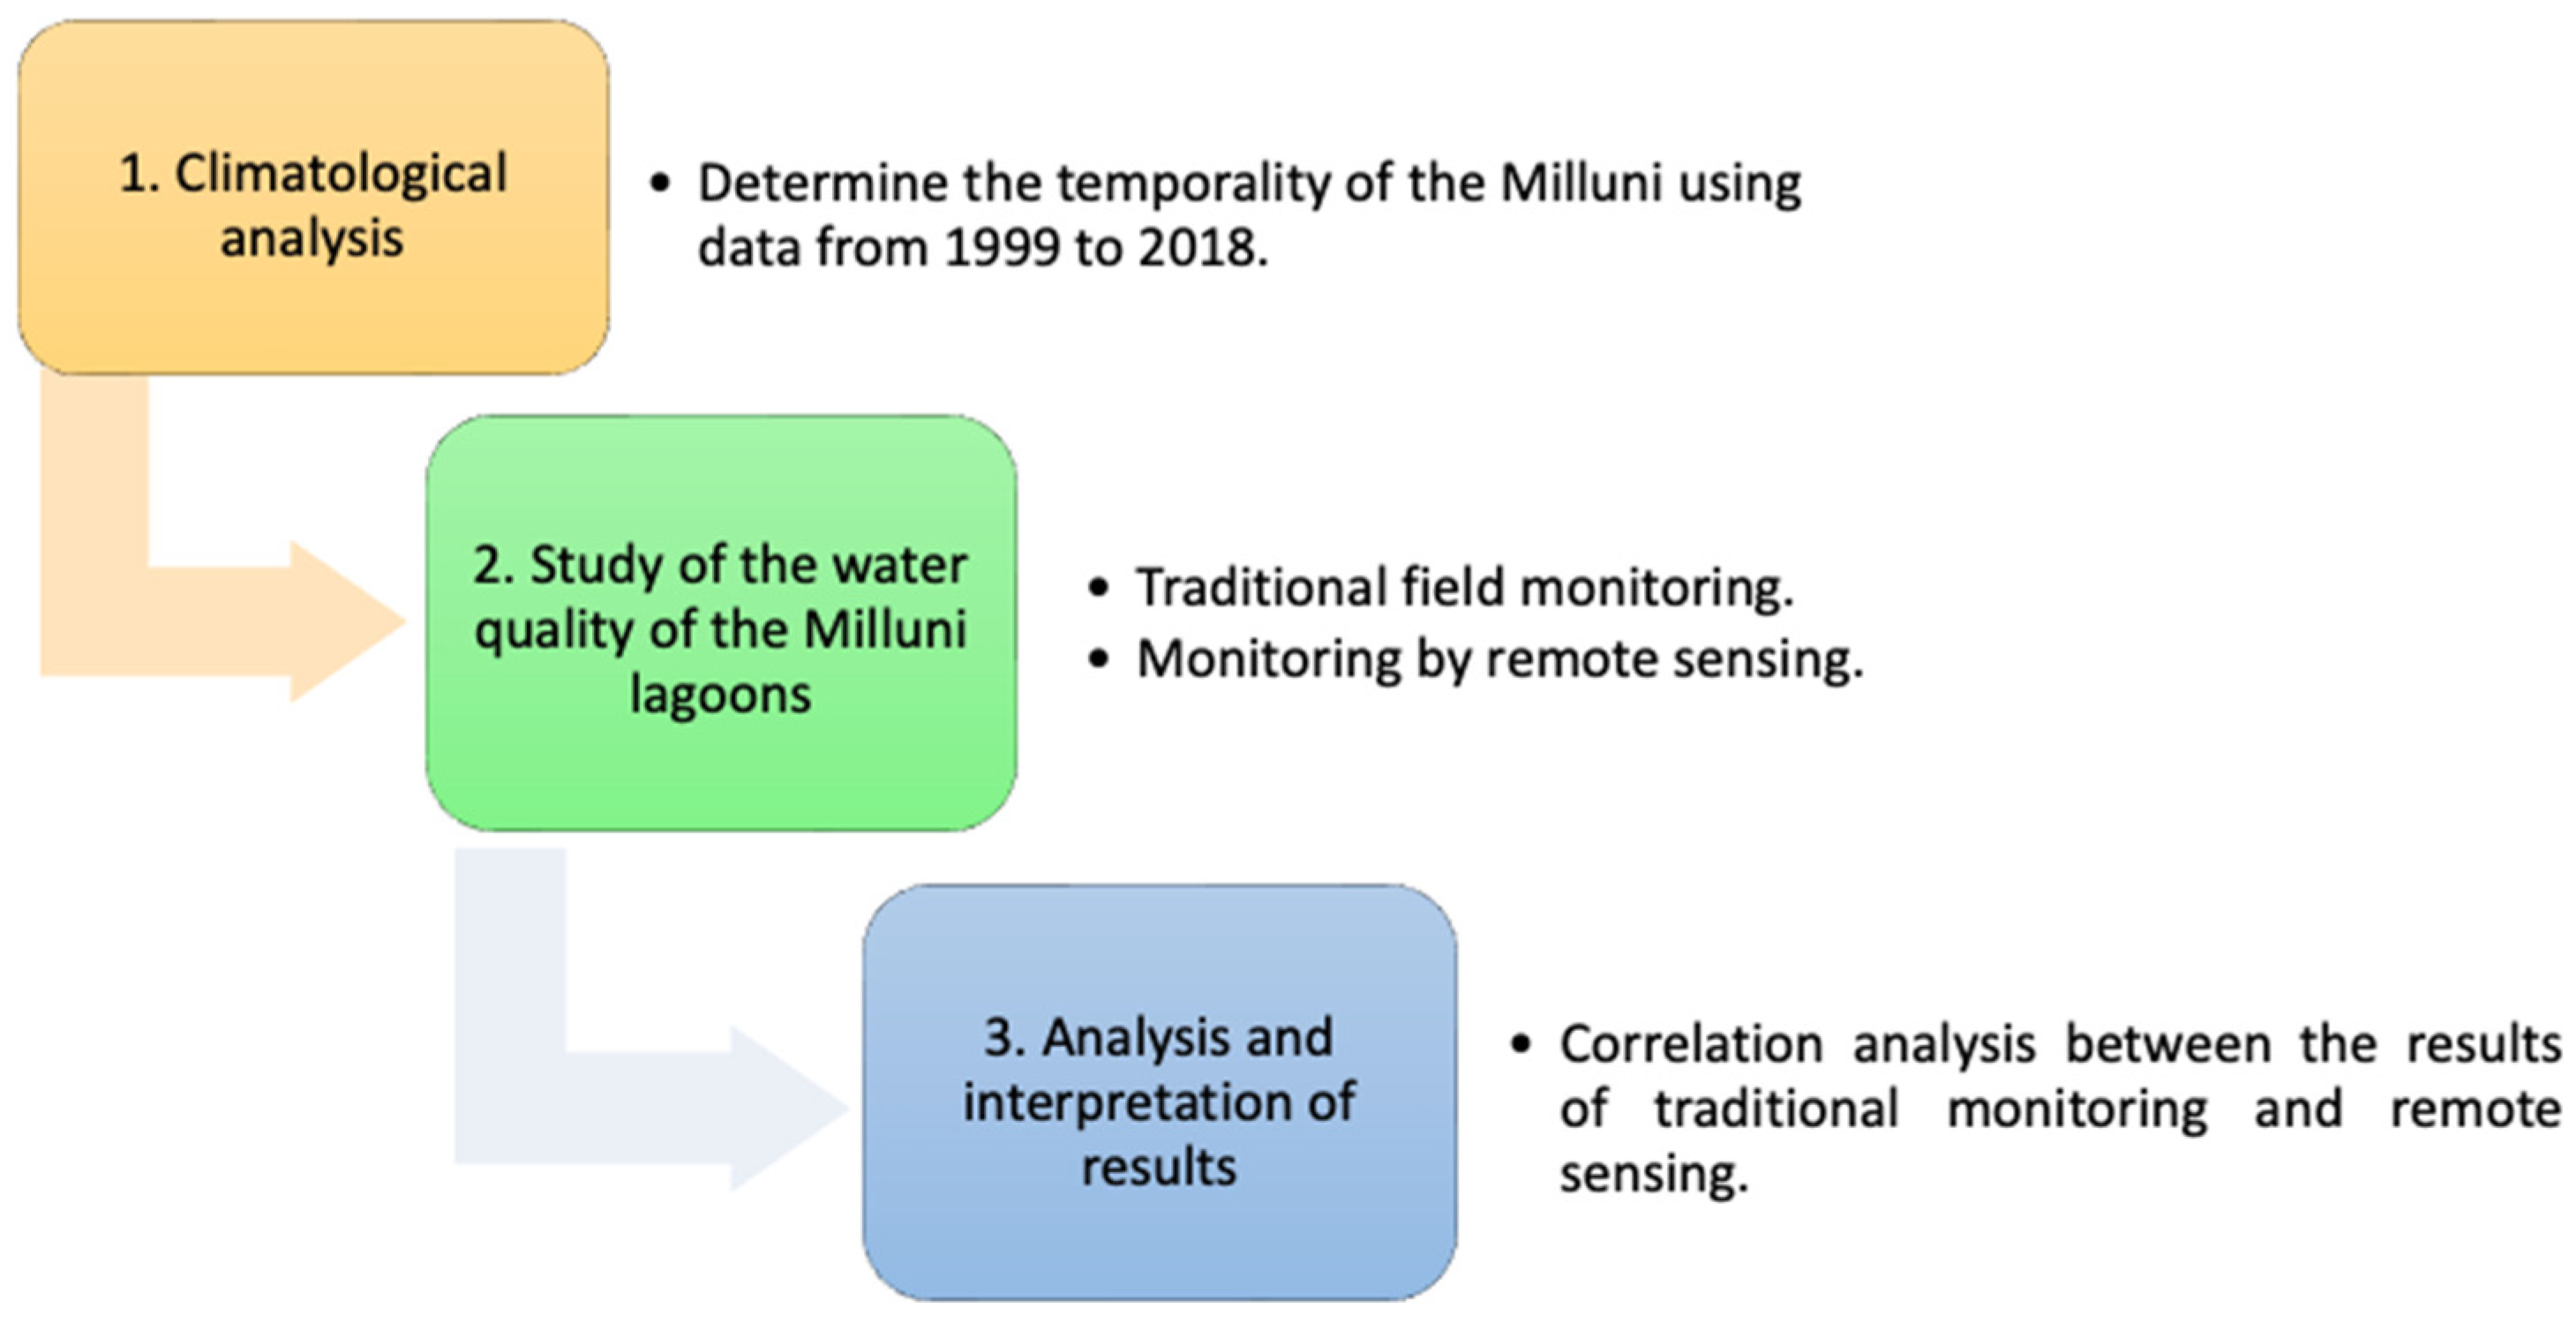
2.2. Methodology
The study was carried out in 3 stages, as shown in
Figure 3, and developed in the following sections.
2.2.1. Climatological Analysis
The hydrological analysis is essential for monitoring the quality of water resources [
30,
31]. Through the climatological analysis of the area of interest, it will be possible to know the distribution of dry and wet seasons by month in a hydrological year (July–June). The above is used to interpret the incidence of hydrological behavior on contamination levels in the central bodies of water in the Milluni micro-basin. For the development of this analysis, the following procedure was carried out:
Compilation of meteorological information from the Alto Achachicala station of SENHAMI for the climatological analysis [
32]: precipitation (mm) and evapotranspiration (mm) with a return rate of 18 years (1999–2018), in the framework of a hydrological year;
Statistical processing of the information collected to obtain total data and averages per month of the precipitation and evapotranspiration parameters;
Generation of a graph with monthly data of total precipitation, mean, and total evapotranspiration parameters;
Analysis of the results obtained to identify dry and wet seasons.
2.2.2. Study of Water Quality of the Milluni Lagoons
This section presents the two parts developed for the Milluni water quality study. The first part is traditional monitoring, and the second is remote sensing of contaminants.
Traditional Field Monitoring
Fieldwork to monitor Milluni was completed in 2019 following the designed WQMP. The monitoring frequency was determined according to the temporality of the study area. The samplings were carried out three times in the dry season and three times in the rainy season with intervals of 1 month between samples. Fundamental in situ control parameters (pH, dissolved oxygen, conductivity, turbidity, and temperature) were measured with an HQ40D—Hach Handheld Multimeter and Hach 2100Q Handheld Turbidimeter. Ex situ parameters (heavy metals) were analyzed with an Agilent Model 7700x Inductively Coupled Plasma Mass Spectrometer (ICP-MS). The sampling protocol adopted was ISO 5667-4:2016 Water quality—Sampling—Part 4: Guidance on sampling of lakes, natural and artificial [
33].
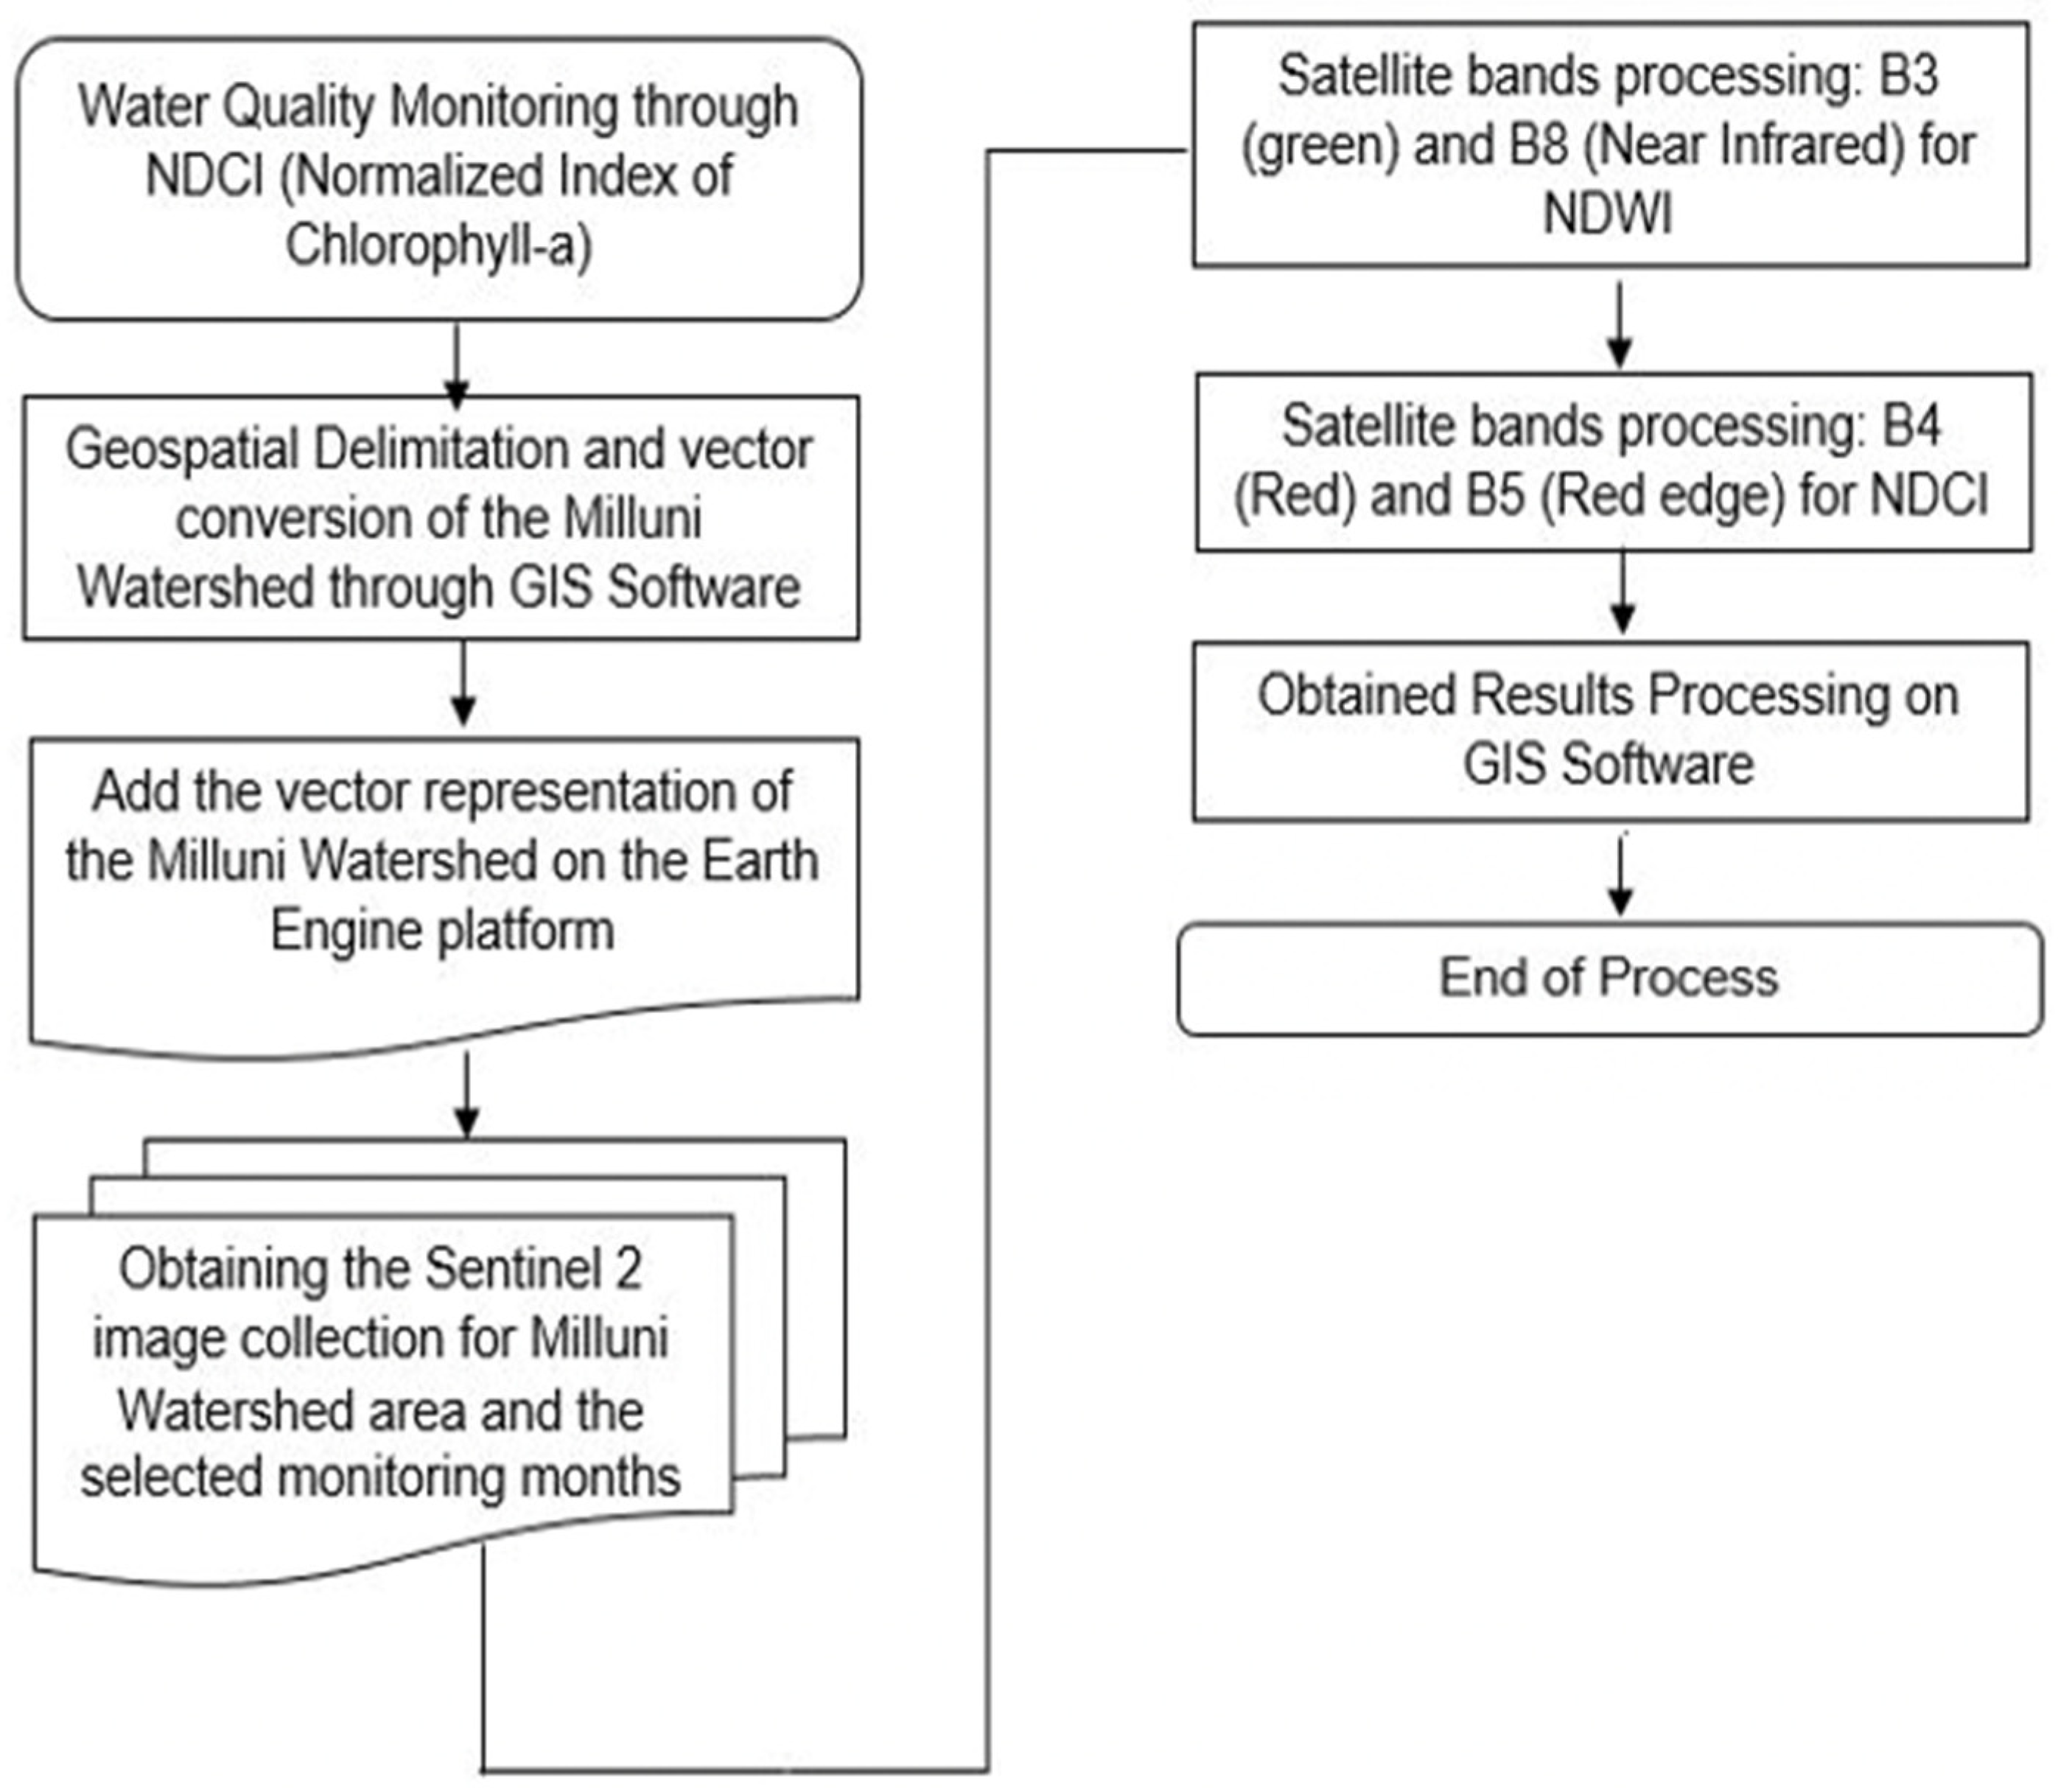
Remote Sensing
This part applied sequential processes developed based on remote sensing through the Google Earth Engine platform. Thanks to its adequate spatial resolution, the satellite images selected for this purpose were captured by the Sentinel-2 satellite. The temporality that was handled was monthly during 2019; it was fitted to the availability of images captured by the satellite and the monitoring dates in the field.
To study the water quality in the central water bodies of the Milluni micro-basin, the manipulation of satellite bands was carried out using scripts in Java language within the Google Earth Engine platform. Two leading indicators were obtained: the Normalized Water Index (NDWI) and the Normalized Chlorophyll-a Index (NDCl). It should be noted that the NDCI is an indicator of the presence of eutrophication. The equations to determine the values for the indices are presented below.
NDWI. To obtain the pixels that represent water, the work was carried out with two spectral bands, green and shortwave infrared (SWIR), following Equation (1).
NDCI. To obtain the pixels representing water, the work was completed with two spectral bands, Red edge one and Red, following Equation (2).
It was possible to identify the representative pixels of areas with water coverage and their quality level.
Figure 4 details the sequence of processes that have been followed in this phase of the investigation.
The satellite images obtained from the previous process are presented in
Section 3.2.2. The lagoons will show three colors related to the concentration levels determined for the NDCI. It is essential to analyze the three levels of the indicator to assess the risk of eutrophication in each lagoon. Low concentration, represented by yellow, means little chance of eutrophication. The medium concentration implies a moderate risk of eutrophication with an orange coloration. Finally, a high concentration, presented in red, suggests a high risk of eutrophication.
2.2.3. Analysis and Interpretation of Results
The last phase of this research interprets the correlation of the results obtained from remote sensing and the values obtained through implementing the first year of the Water Quality Monitoring Program (WQMP), where in situ and ex situ parameters were measured.
3. Results
In this section, the results will be presented for the different stages of the study.
3.1. Climatological Analysis
Information was collected from SENHAMI meteorological stations on precipitation and evapotranspiration from 1999 to 2018 [
32].
Table 1 below shows the average data for all months of the year in terms of total rainfall and total and mean evapotranspiration.
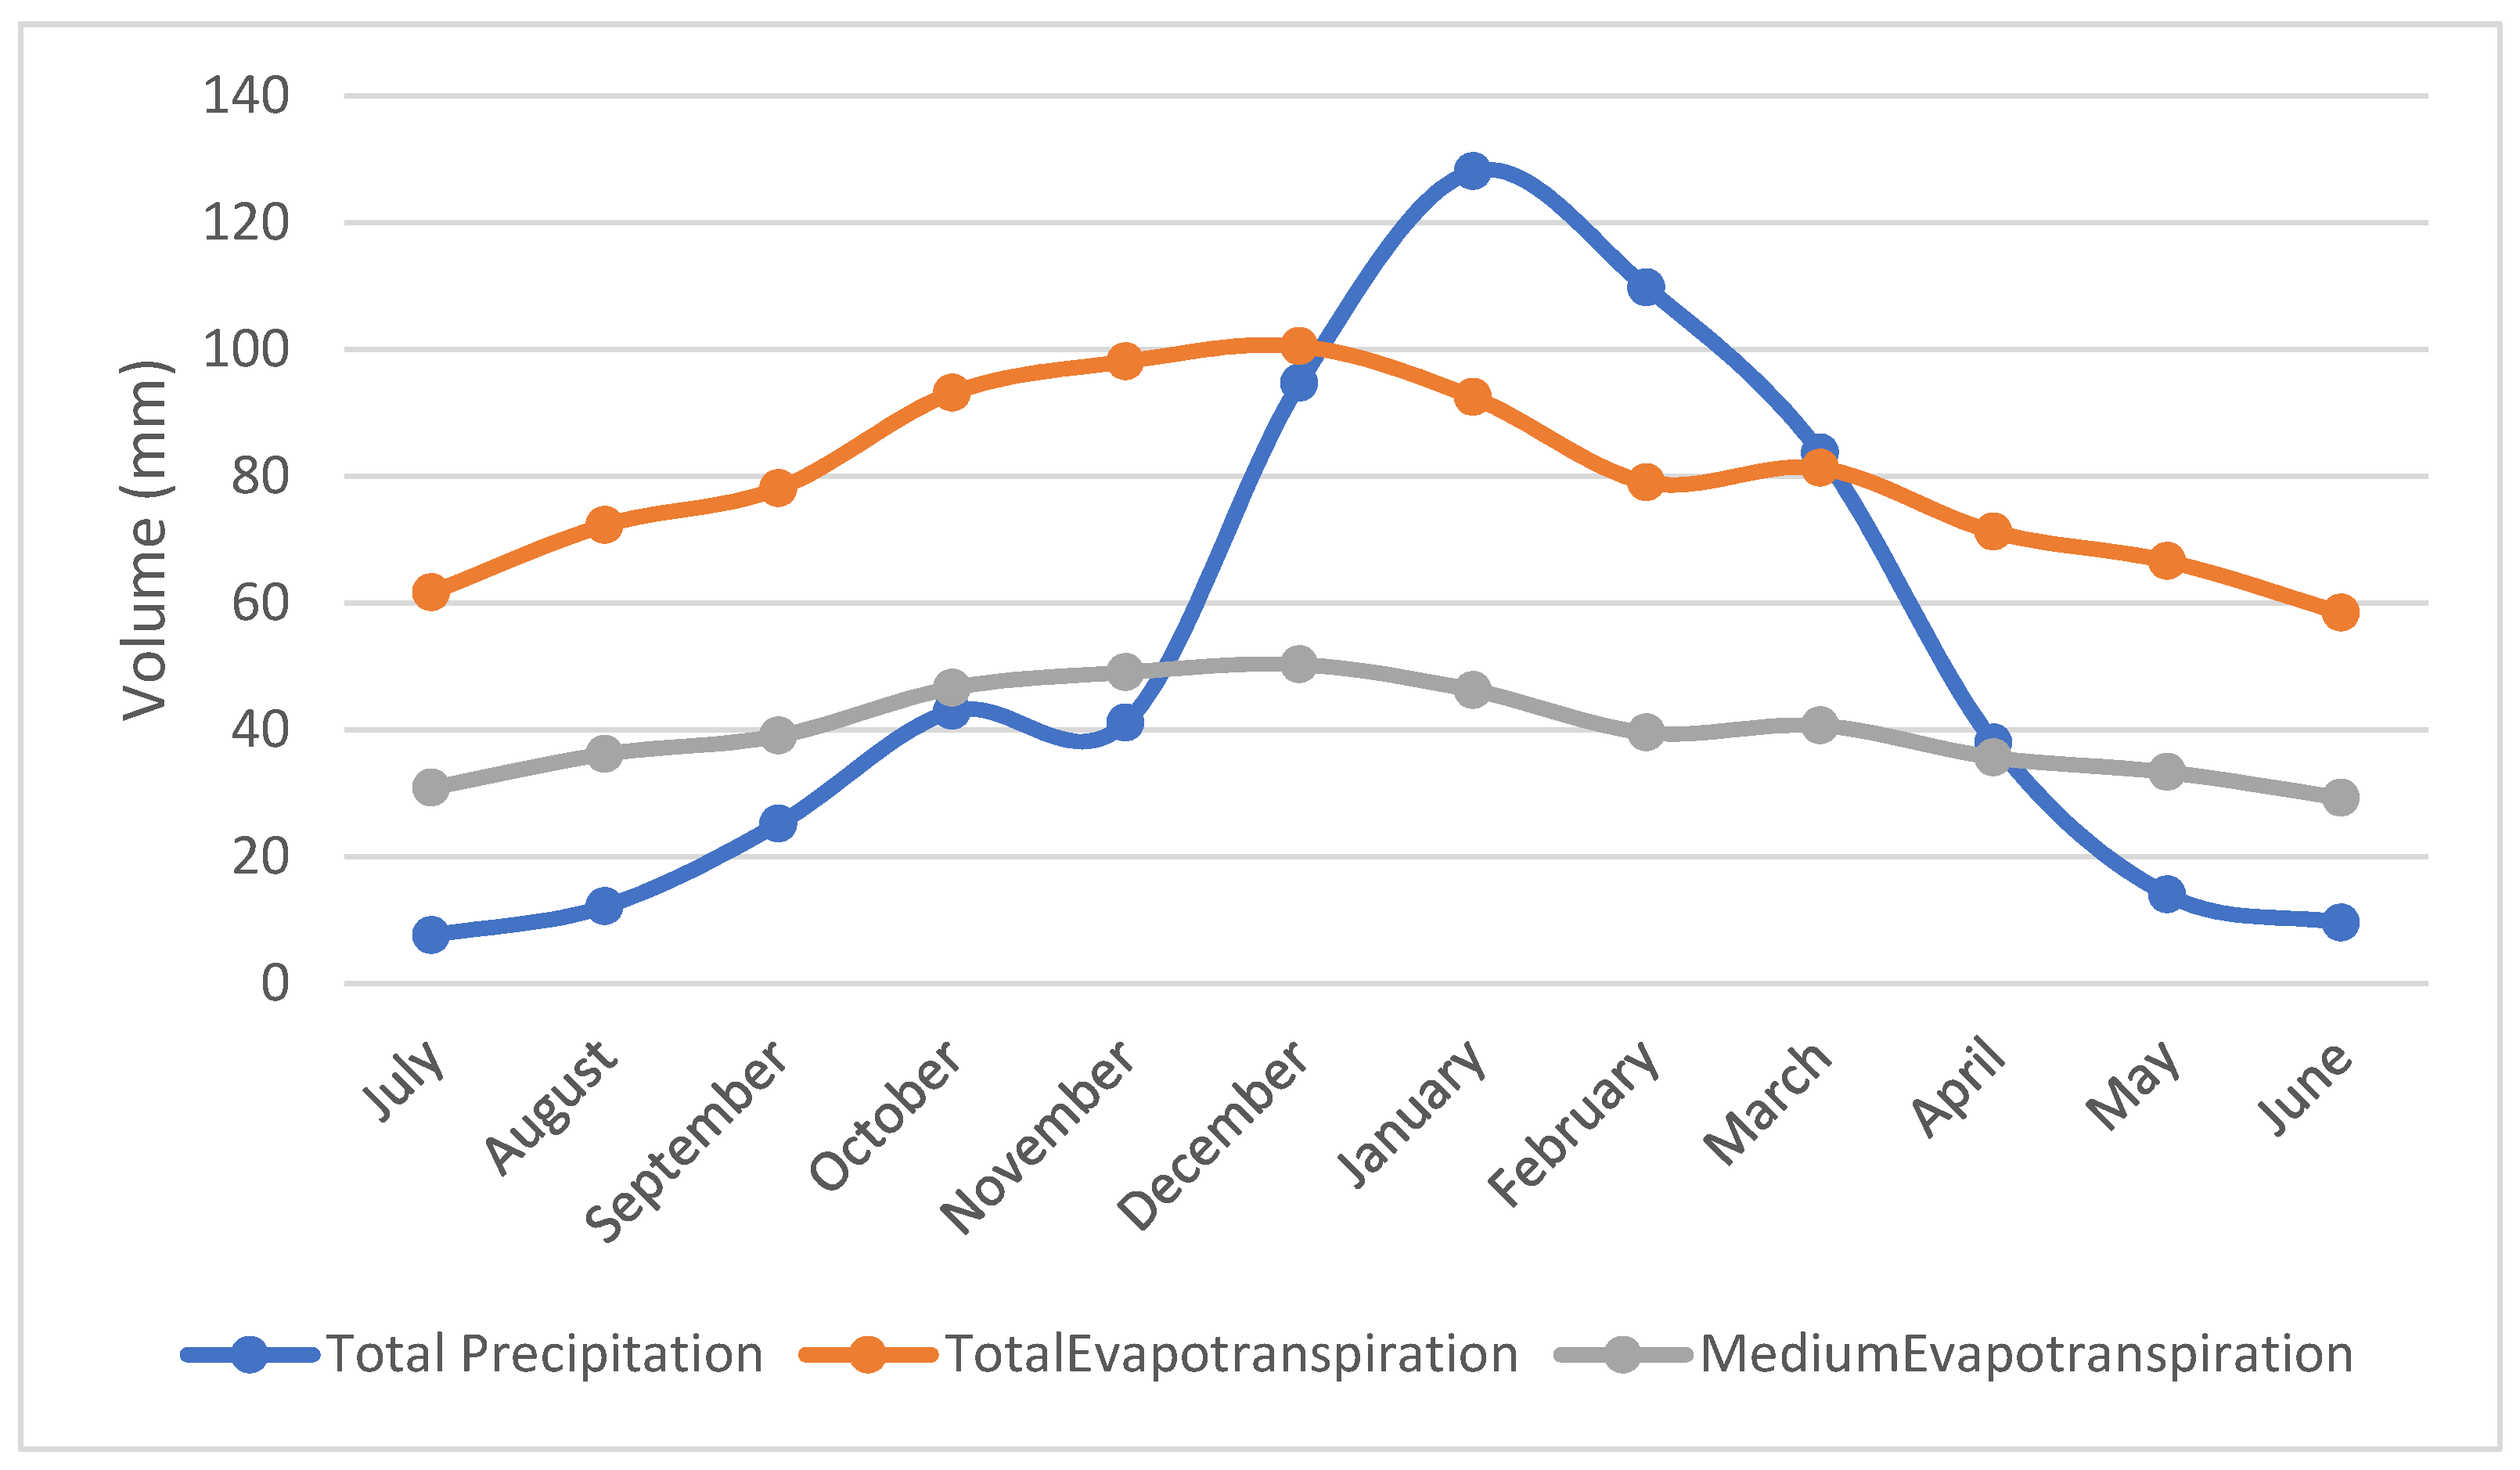
With the data in
Table 1,
Figure 5 was made, and this area’s dry and humid periods can be appreciated. On the one hand, the dry period starts in May and last until October. On the other hand, the wet period begins in November and ends at the end of April.
From the climatological analysis of the Milluni area, it is observed that the maximum precipitation peak occurs during the month of January. This can cause the lagoons to increase volume and the pollutant dilution phenomenon to occur naturally. In addition, it should be considered that the driest months are June and July. In the dry period, a concentration of pollutants could occur due to reducing the volume of water in the lagoons. The months of January, June, and July should be carefully examined later when interpreting the results.
3.2. Study of the Water Quality of Milluni Lagoons
This section presents the results of traditional monitoring where physicochemical control parameters were measured and the results were obtained by remote sensing of contaminants.
3.2.1. Results of Traditional Field Monitoring
In the three points defined by the Water Quality Monitoring Program for the upper part of Milluni, 4 in situ control parameters and 33 ex situ control parameters were monitored. The results of the in situ and ex situ parameters are presented below.
Results of In-Situ Parameters
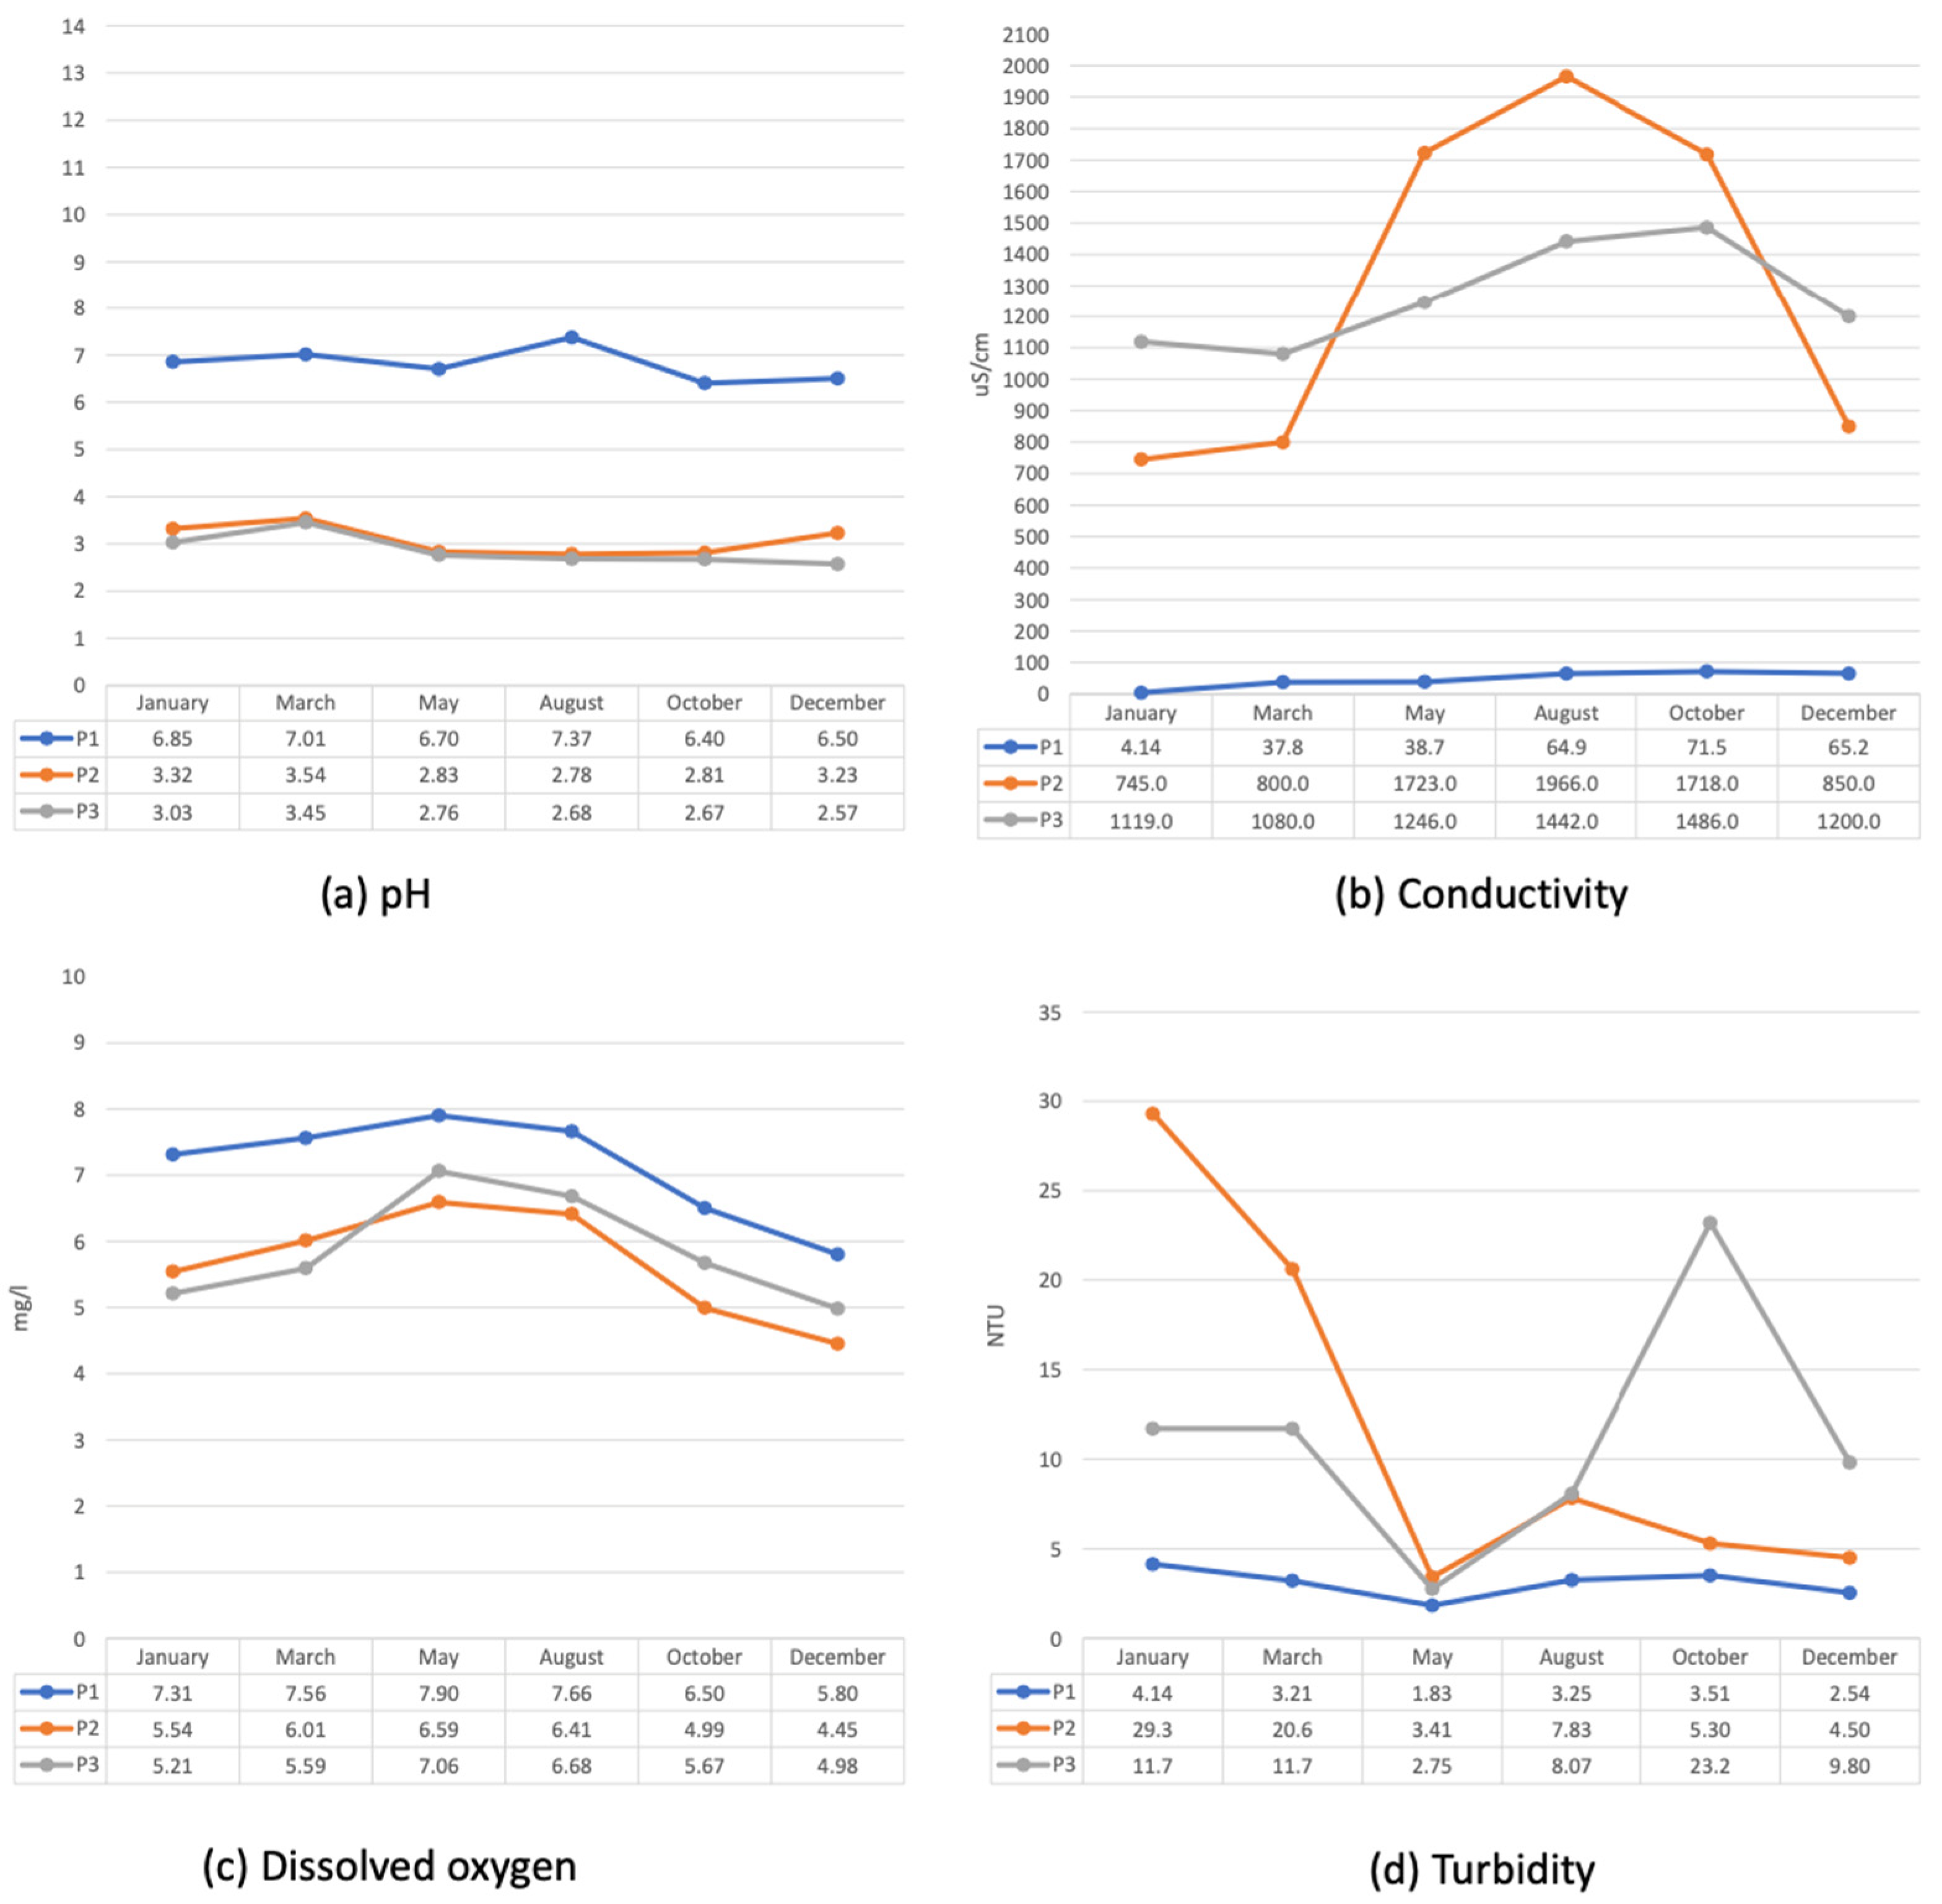
The pH and conductivity are related to the presence of metal ions and dissolved oxygen, and turbidity is directly associated with NDCI, which is an indicator of eutrophication. As for the four parameters measured in situ, point 1 is the only one with values below what is stipulated in the Bolivian standard 512 [
27], indicating that it is free of contamination. However, points 2 and 3 are negatively impacted by anthropogenic activities in the area, presenting acidic pH values, conductivities above 700 uS/cm, and high turbidity in January for point 2 and October for point 3.
Figure 6 shows the measured values for the in situ parameters at the three monitored points.
These four parameters will be correlated with the indicator of the presence of eutrophication in
Section 3.3.
Results of Ex Situ Parameters
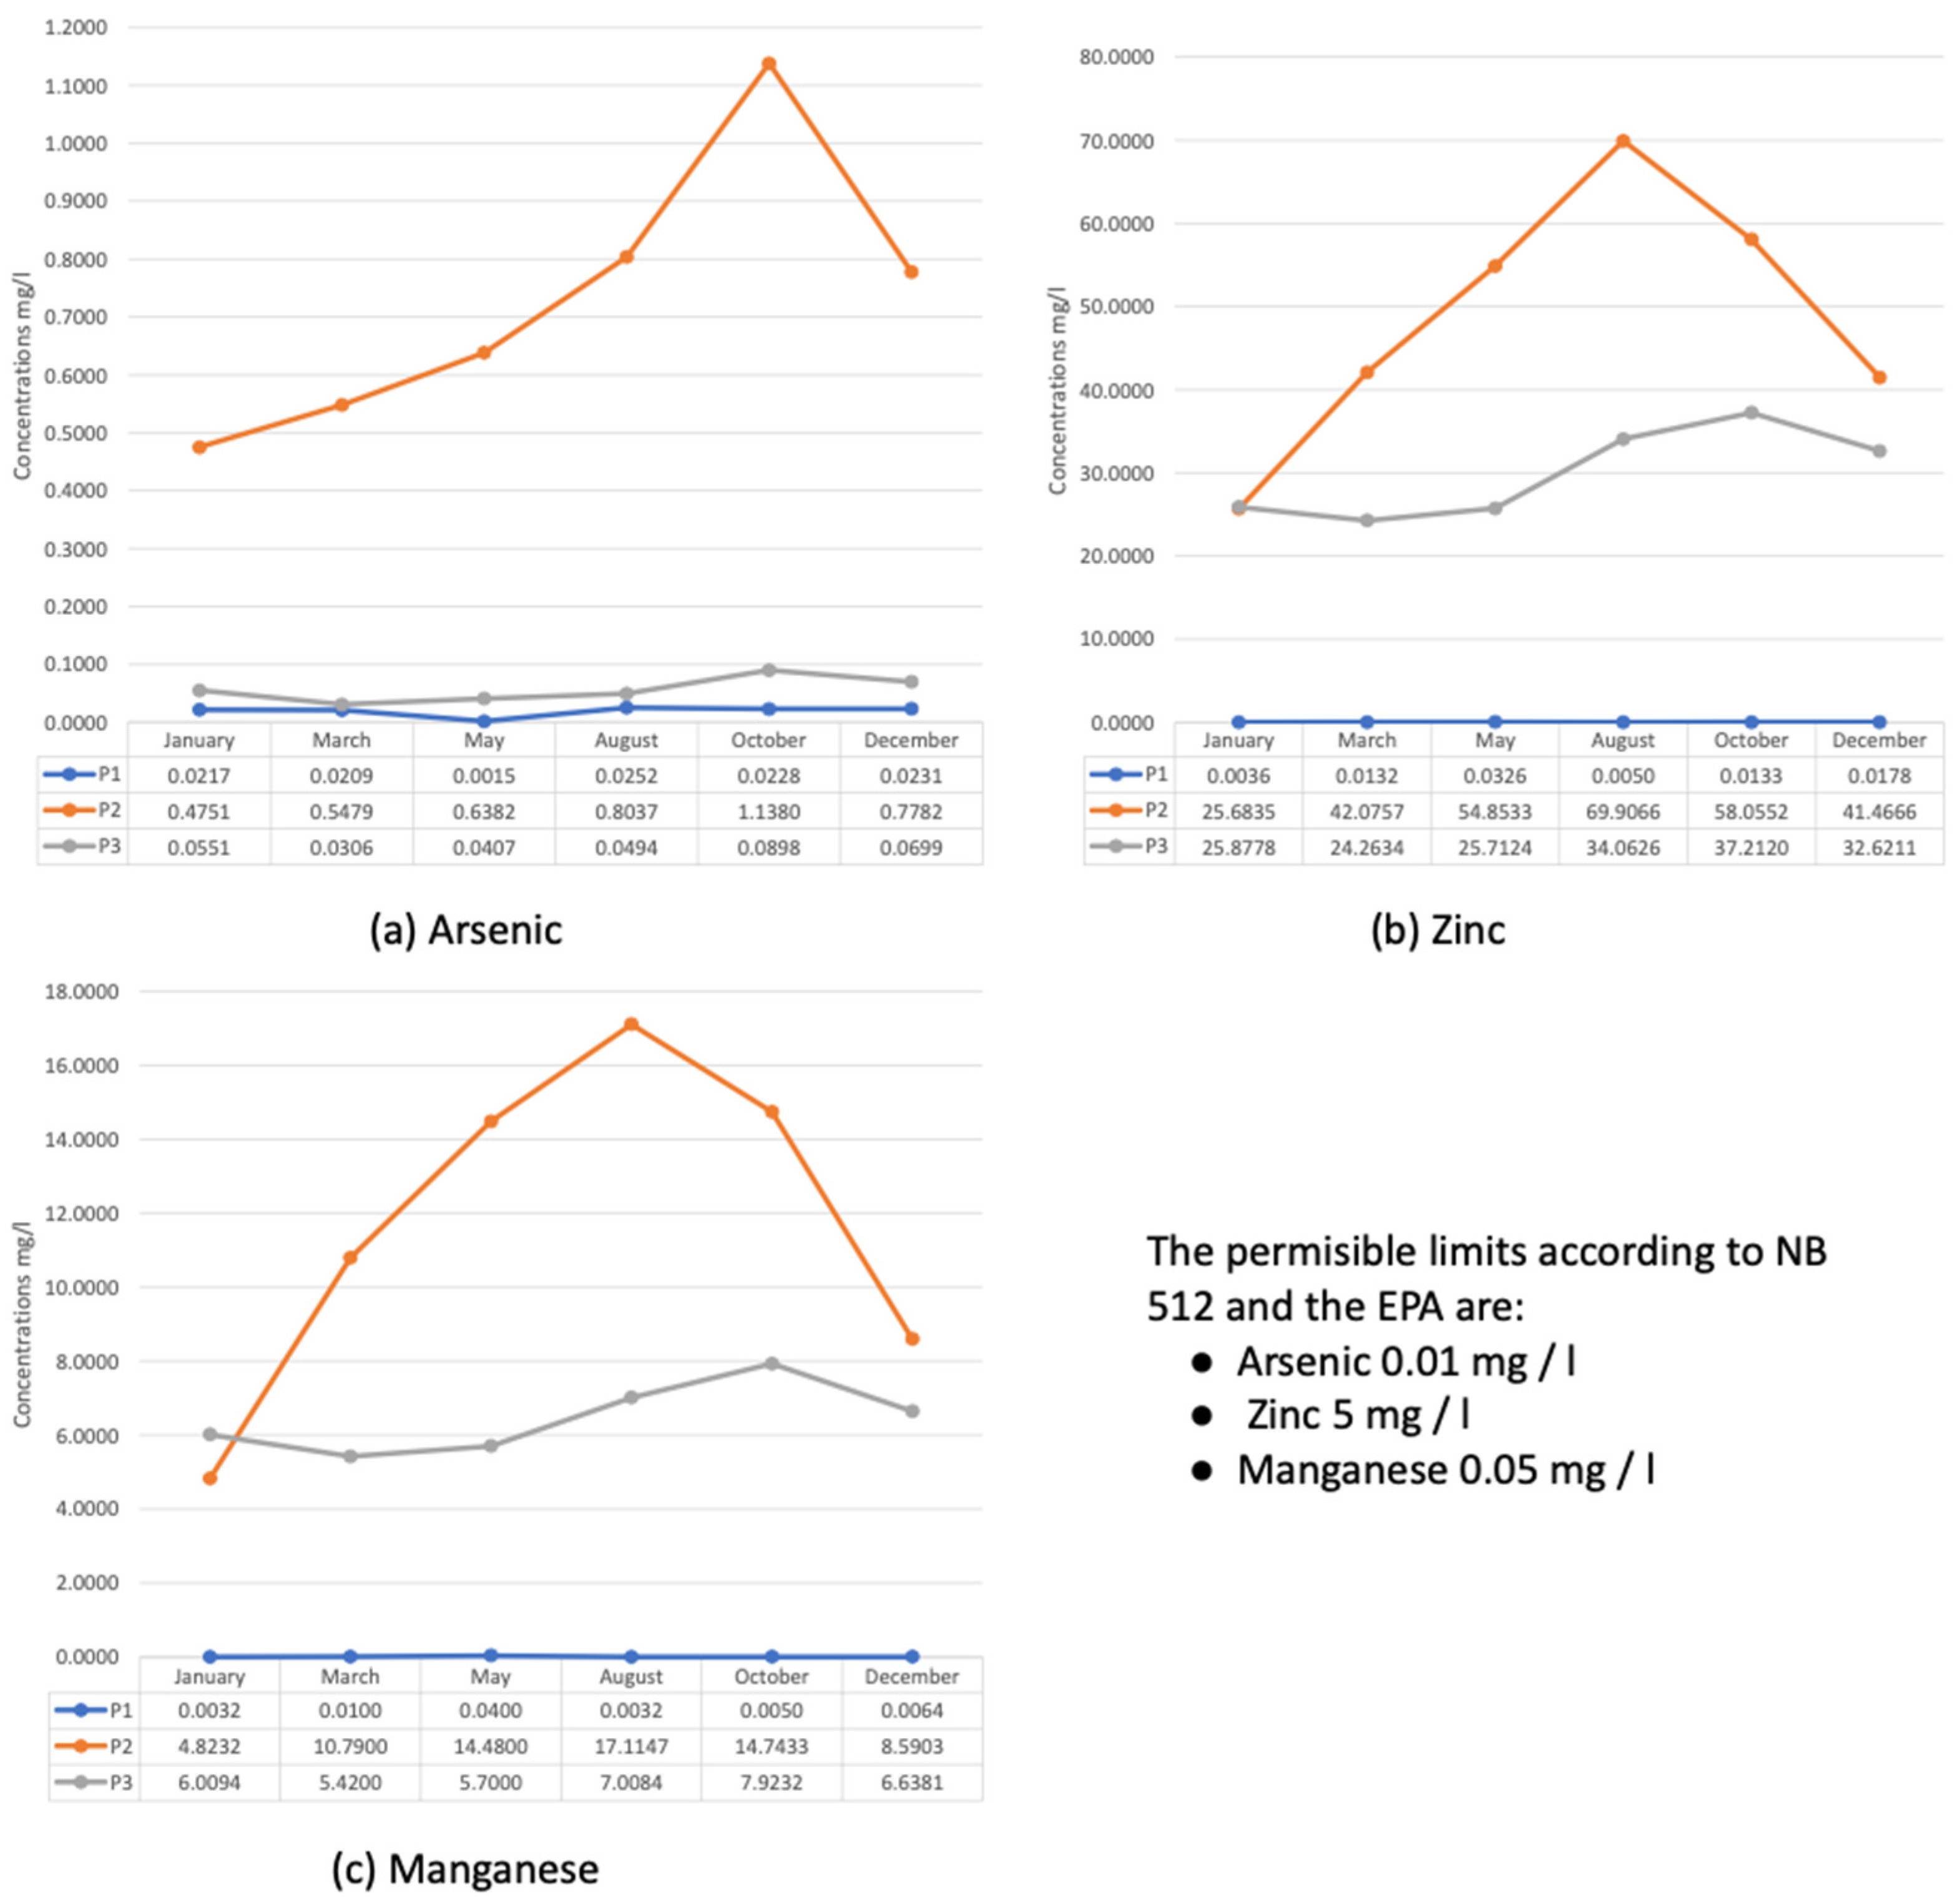
At the same time, 33 heavy metals were monitored. Seven metal ions were found with concentrations outside the current environmental regulations: arsenic, cadmium, iron, zinc, manganese, nickel, and aluminum. Some of these metals were also identified in previous studies [
19,
22]. In this study, only three of these will be analyzed due to their toxicity (arsenic), their high concentration (zinc), and their persistence in the area (manganese).
Figure 7 shows the attention of the three metals analyzed.
From the graphs presented above, we can see that point 1 continues to be the point without heavy metal contamination. However, points 2 and 3 are contaminated by the three metals studied. It should be noticed that point 2 is the most affected. The three metals were previously exposed. These parameters will also be correlated with the indicator of the presence of eutrophication in
Section 3.3.
3.2.2. Results of Remote Sensing
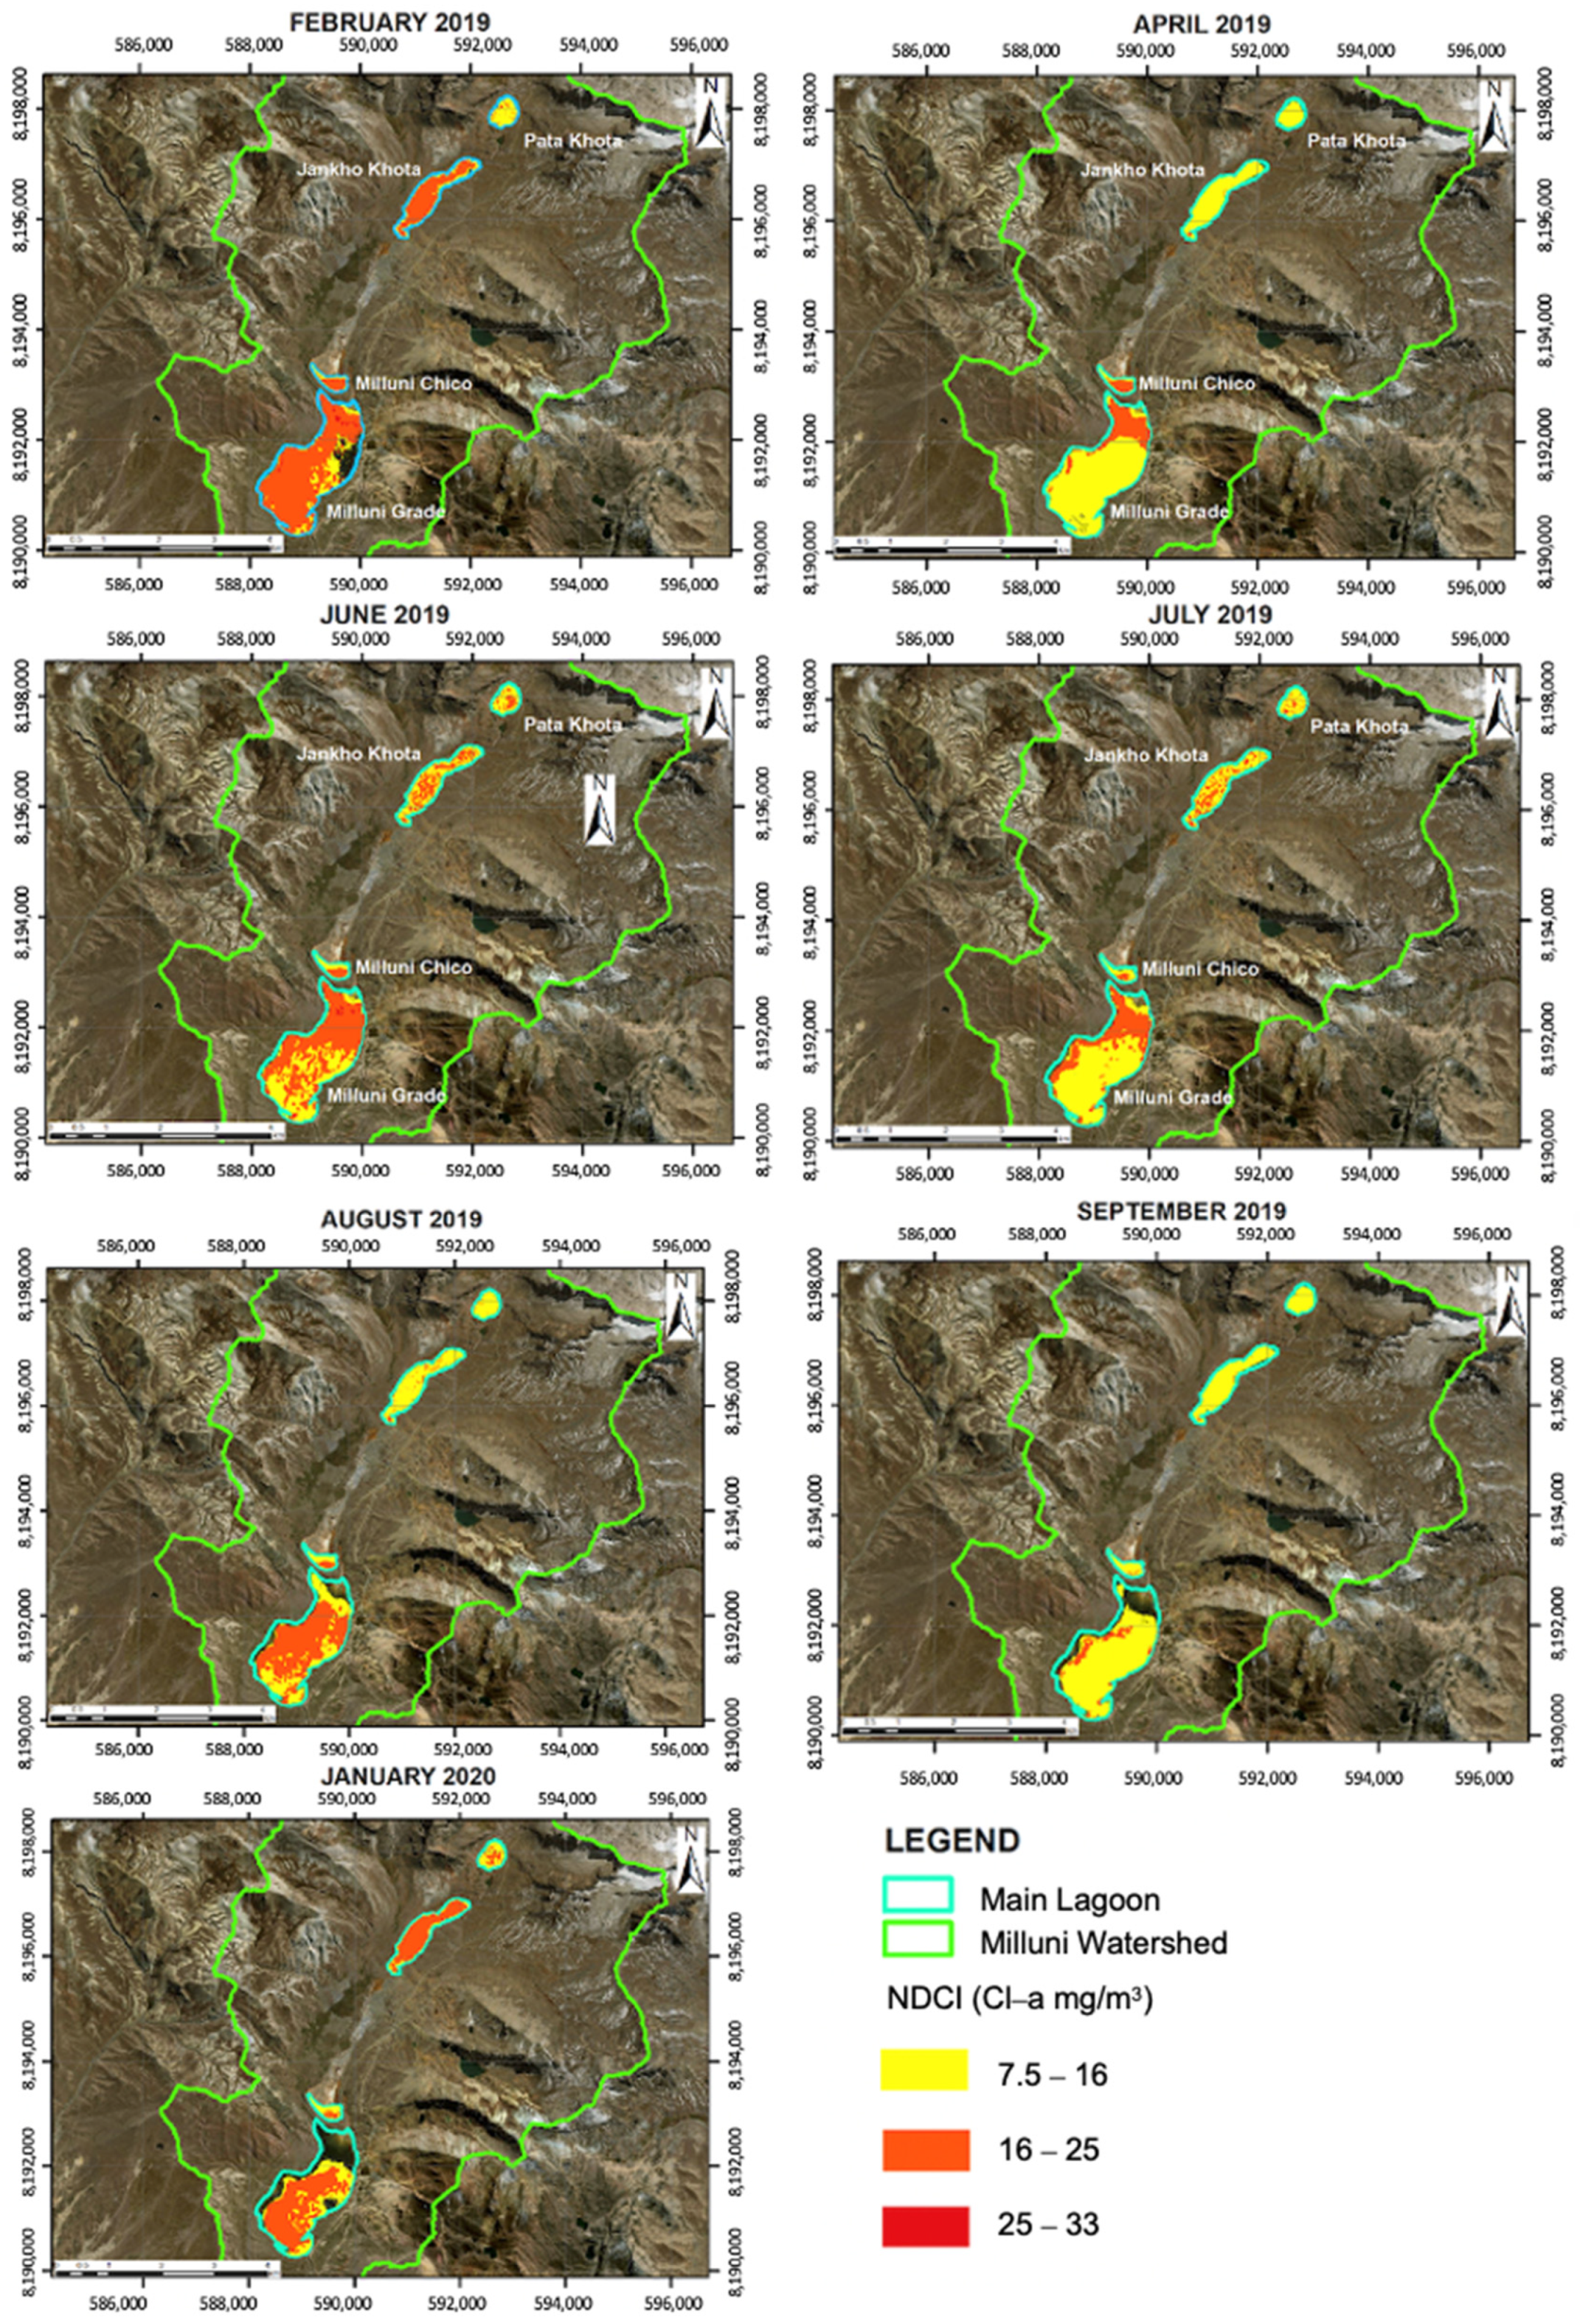
The satellite images selected for the study include the months of February, April, June, July, August, September 2019, and January 2020. The months of January, March, May, October, November, and December 2019 could not be considered due to the low visibility caused by the dense clouds of those months.
Figure 8 presents the satellite views of Milluni.
From
Figure 8, it can be seen that there are no high concentrations of NDCI in any of the months studied, which shows that the risk of extreme eutrophication in the surface water bodies of Milluni is low. However, the medium concentrations of the NDCI are prevalent in some months, such as February, June, and August 2019, and January 2020. February 2019 and January 2020 are months in the wet season according to the area’s climatological analysis, which would indicate that an increase or decrease in precipitation would not affect the medium concentration prevalent in the Milluni lagoons. This would imply that time does not fully influence the presence of organic pollutants in the Milluni lagoon system.
3.3. Analysis and Interpretation of the Results
The correlation of the results of the parameters monitored in situ, ex situ, and the NDCI for each lagoon belonging to the upper part of the Milluni micro-basin is shown below.
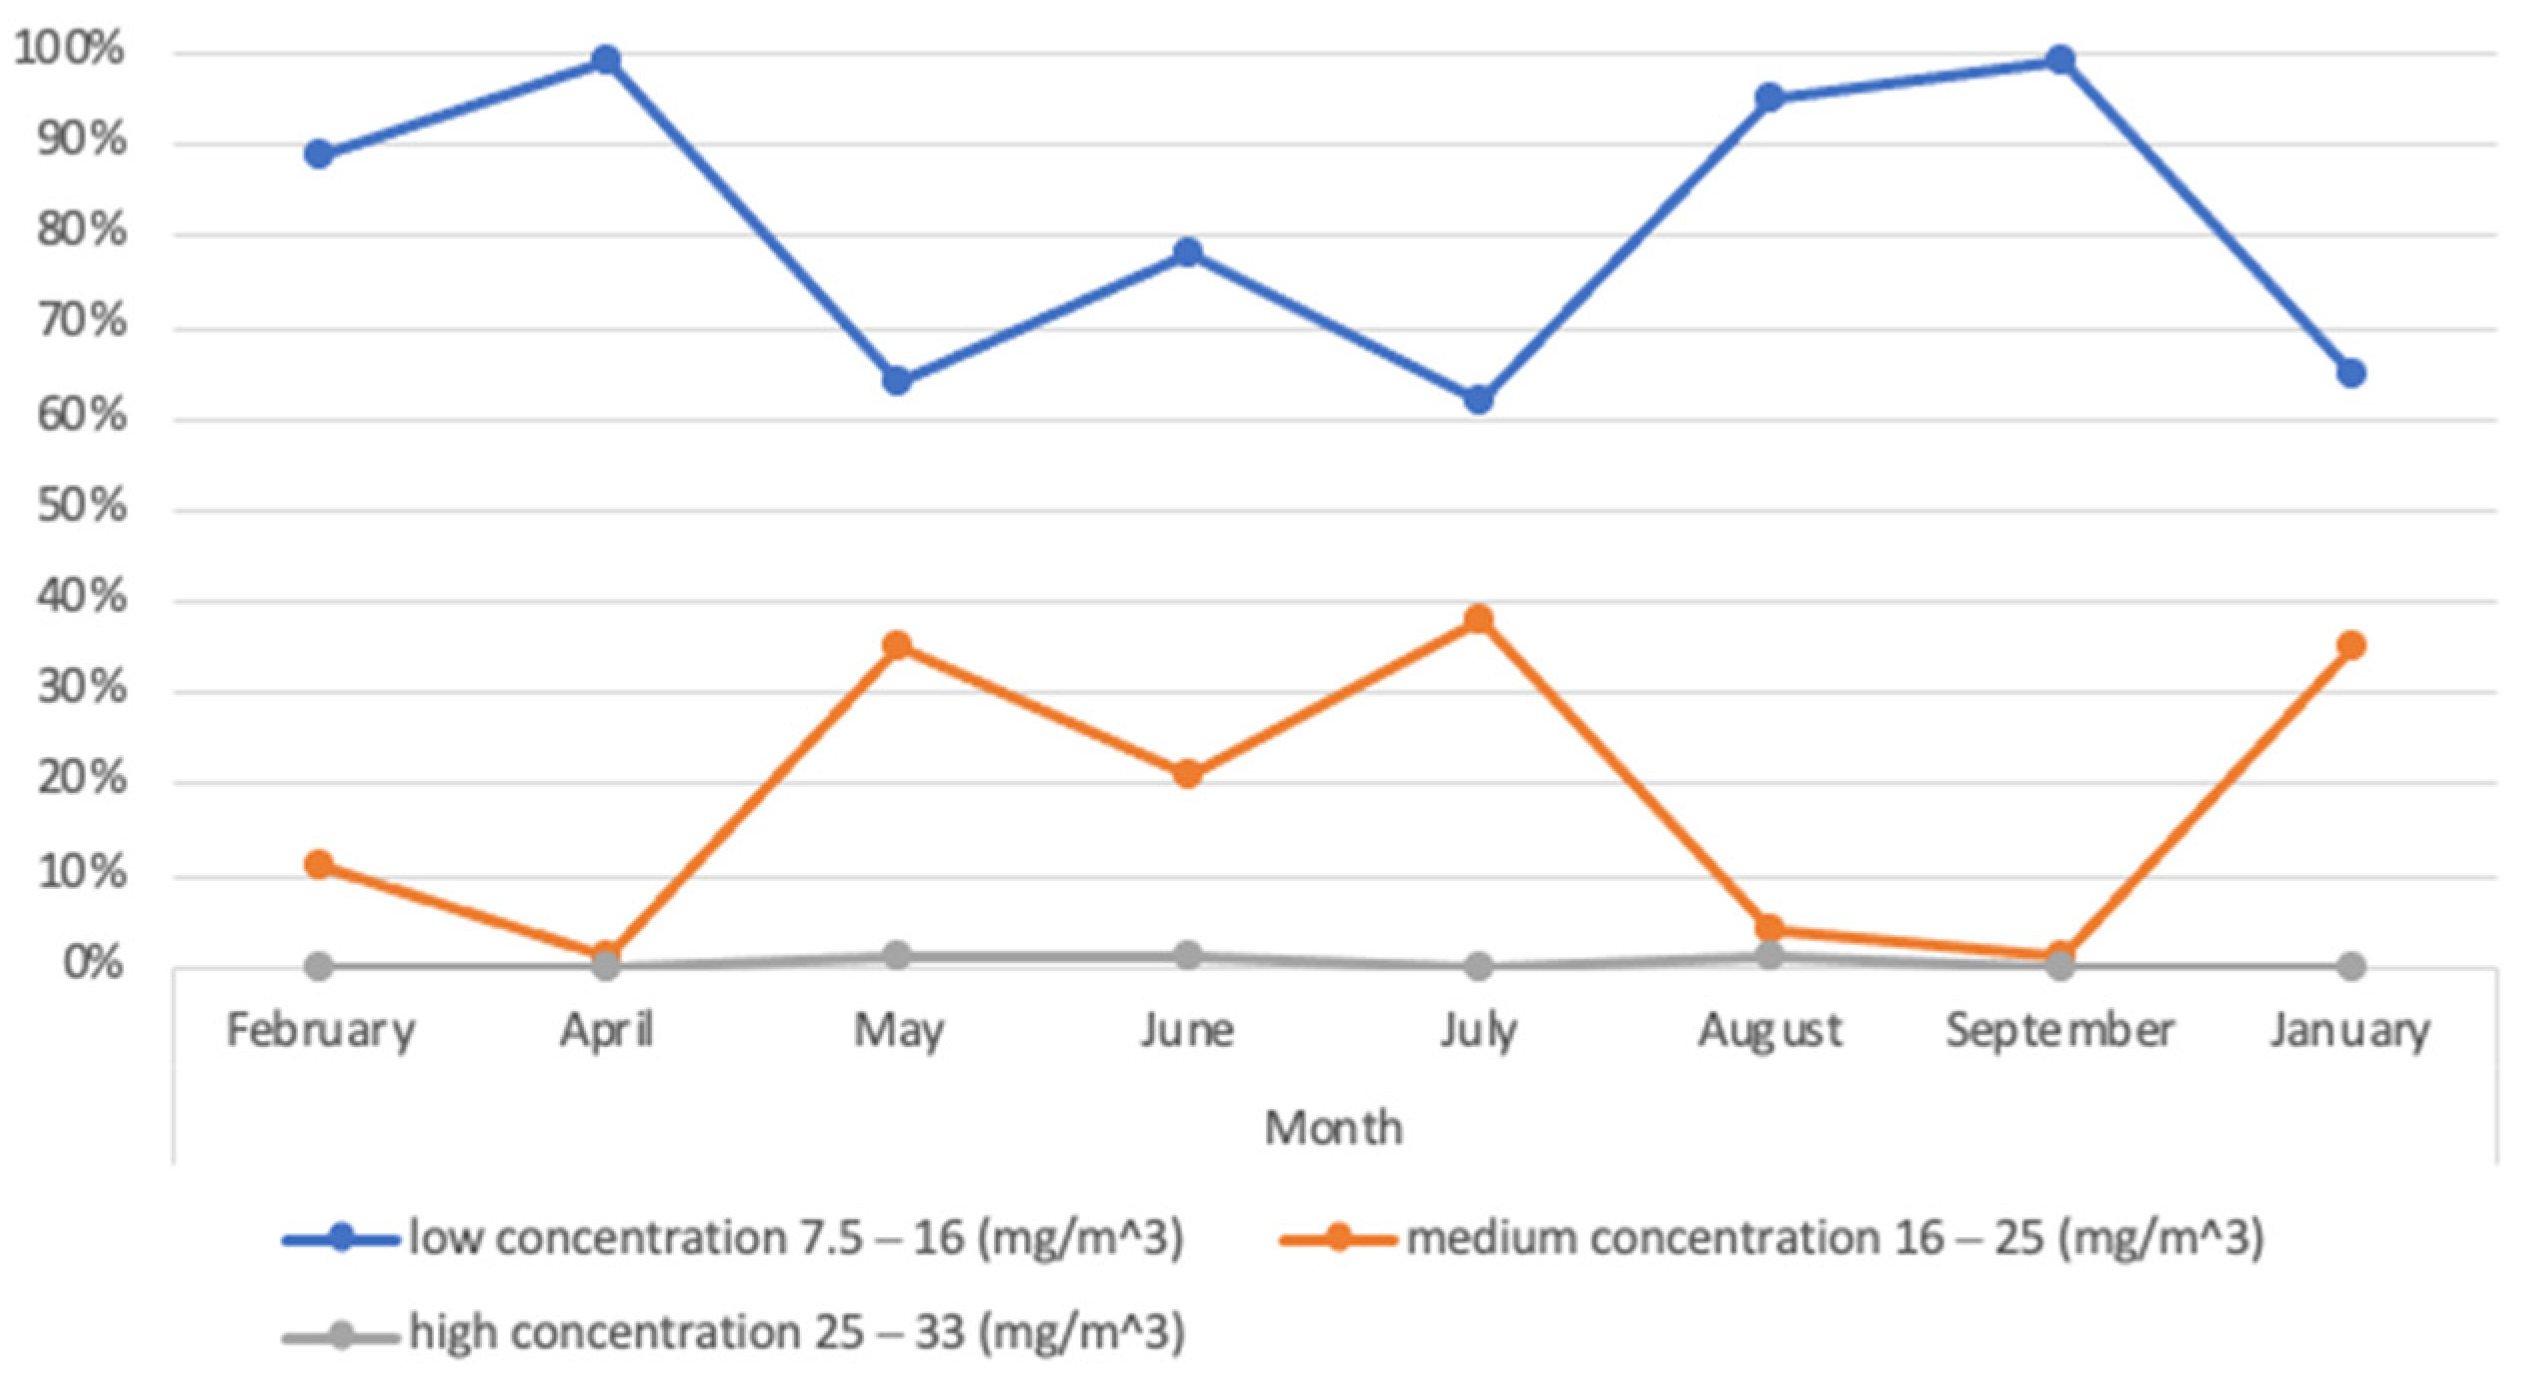
3.3.1. Pata Khota Lagoon
The Pata Khota Lagoon is the first lagoon of the water system, with waters coming from the natural glacier called Huayna Potosí. Monitoring point 1 was located in this lagoon. Point 1 is the least polluted according to the contrast of the in situ and ex situ parameters with the Bolivian Regulation 512. The dynamics of the Pata Khota lagoon are based on the climatological analysis where wet and dry times are denoted. The organic load based on what is registered by the NDCI is in the function of the season.
Figure 9 shows concentrations of NDCI in the lagoon.
When comparing the predominant chlorophyll-a concentration in the Pata Khota lagoon, which is the low one, with the turbidity and dissolved oxygen values, they showed that there would not be a pollutant increasing the organic load of the lagoon. On the contrary, if the dissolved oxygen values decrease and the turbidity values rise, a eutrophication process would occur in the Pata Khota lagoon, and the predominant concentration of chlorophyll-a would be medium or high range. In addition, the monitored point 1 has a neutral pH and a low conductivity throughout the year without being affected by the dry or wet season. This would indicate the absence of metal ions, which is confirmed by the heavy metals’ low concentrations.
In summary, the results of the monitoring and what can be seen in the satellite images indicate that the Pata Khota lagoon would not be negatively affected by contamination from human activities. The water in this body of surface water is of sufficient quality and can be used for human consumption.
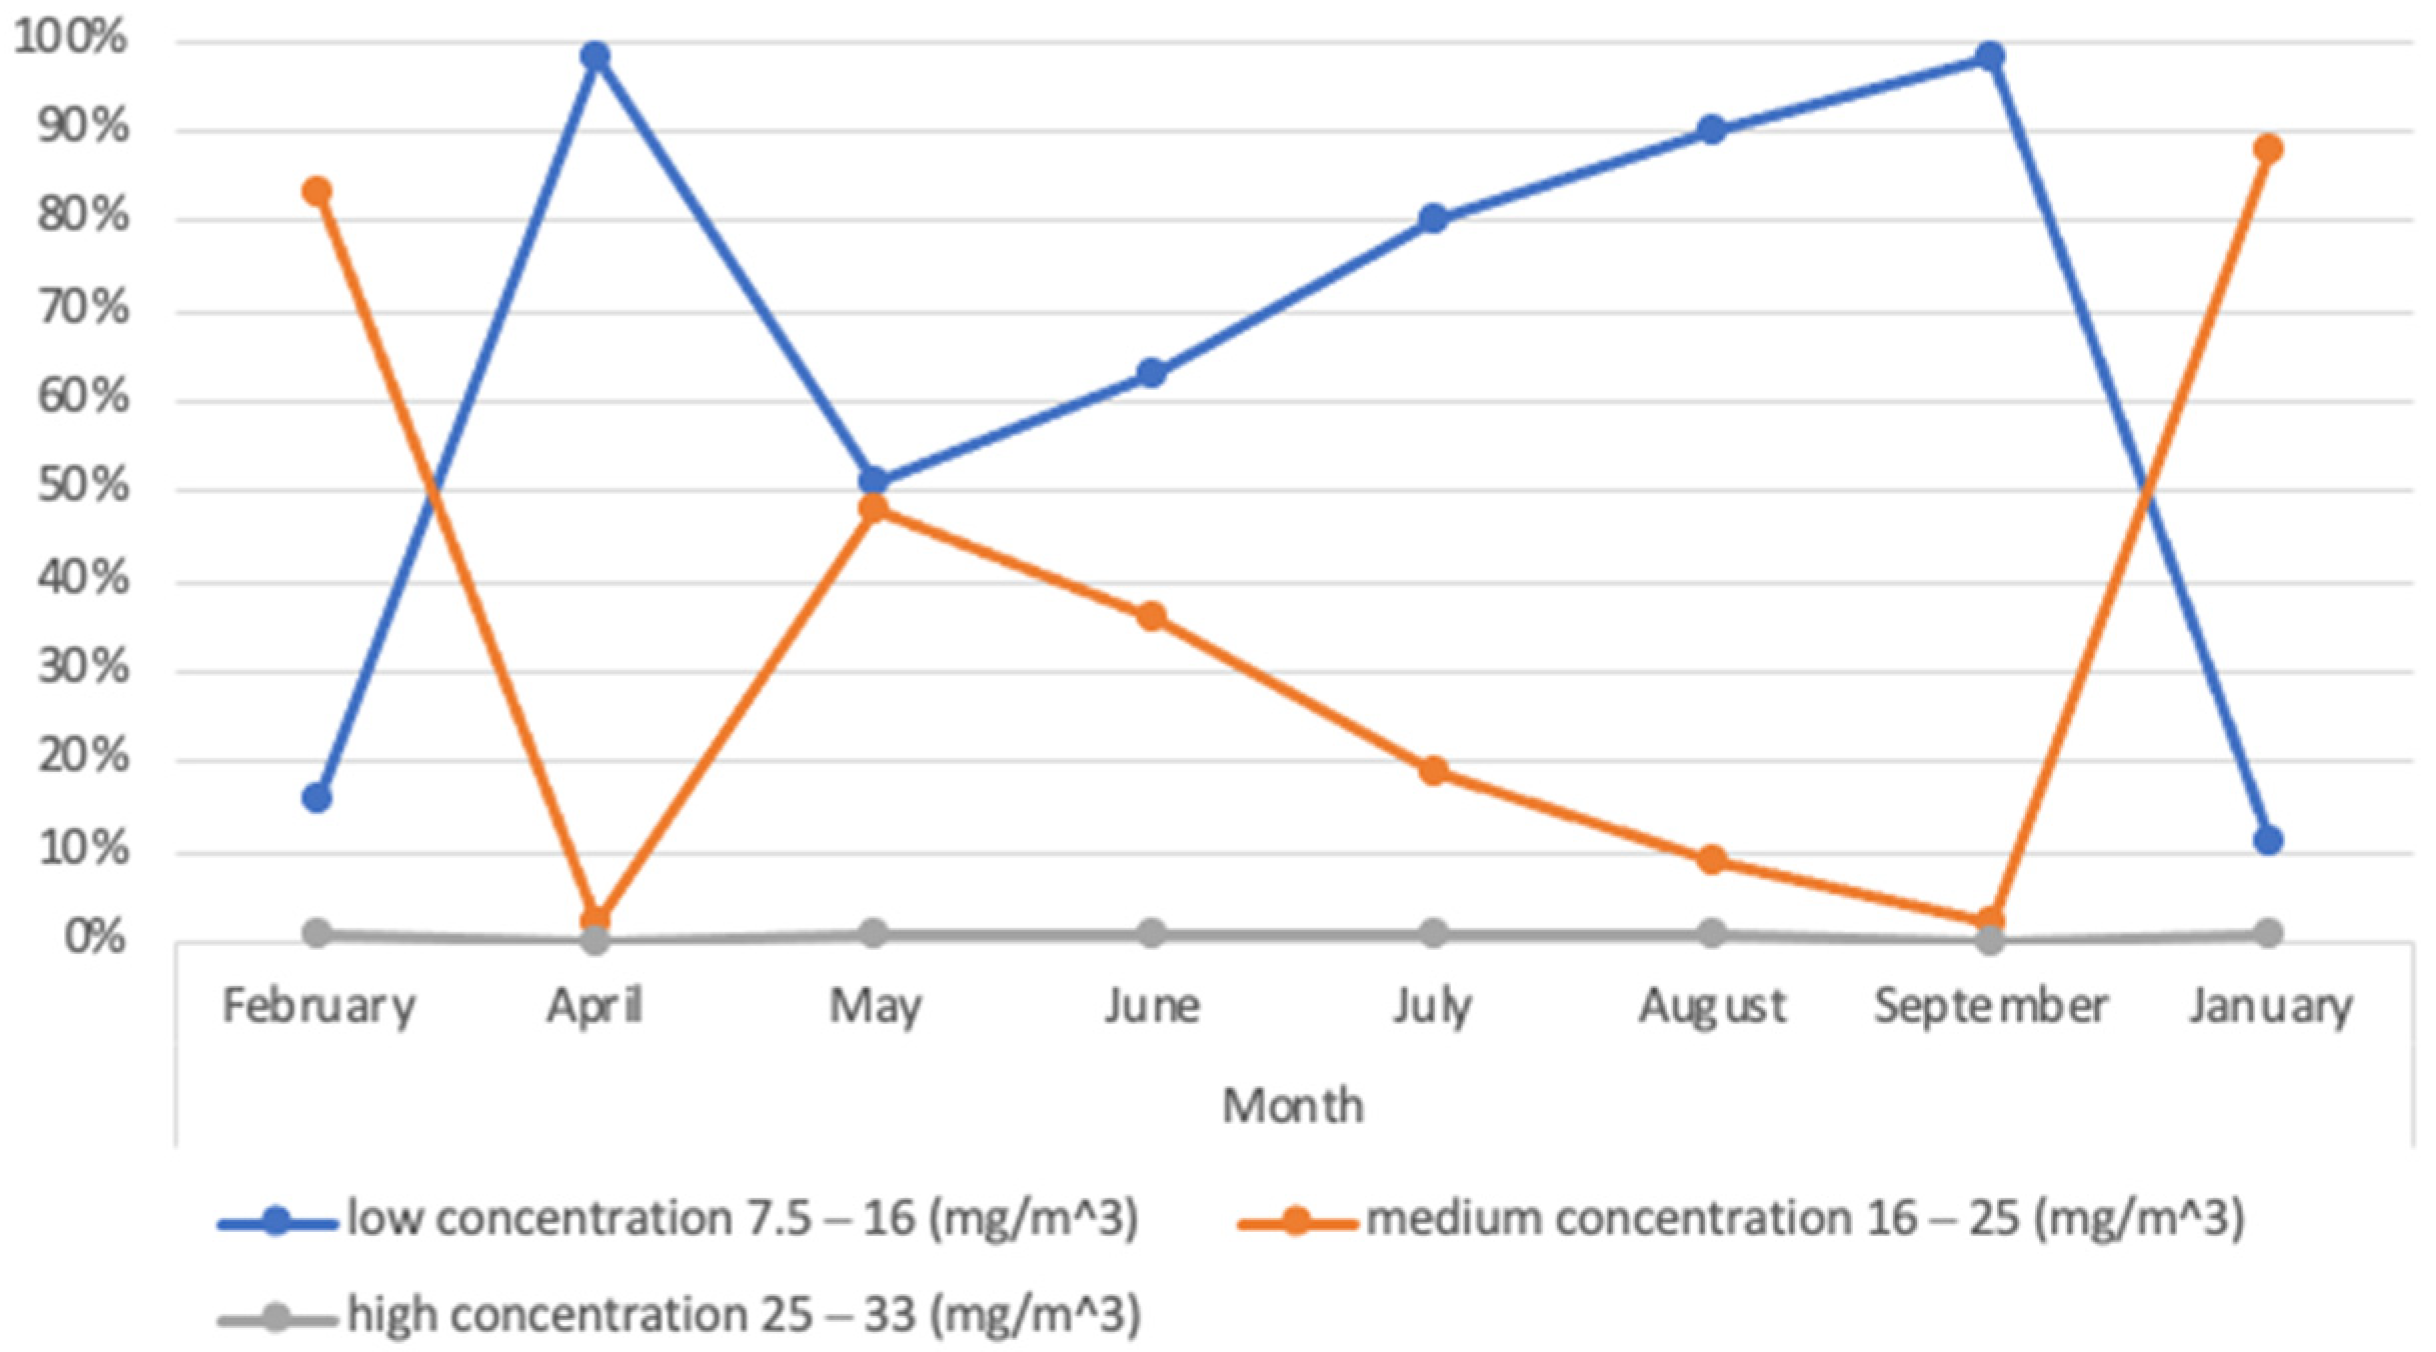
3.3.2. Jhanko Khota Lagoon
This lagoon was not monitored because, visually, it is very similar to the first Pata Khota lagoon. However, satellite images show that its water quality is different from the first lagoon. In the months of January and February, belonging to the wet season according to the climatological analysis carried out, the most notable differences are presented. This exposes the existence of a polluting agent that would be altering the water quality of this lagoon, the source of which must be studied.
Figure 10 reveals the concentrations of NDCI in the second lagoon.
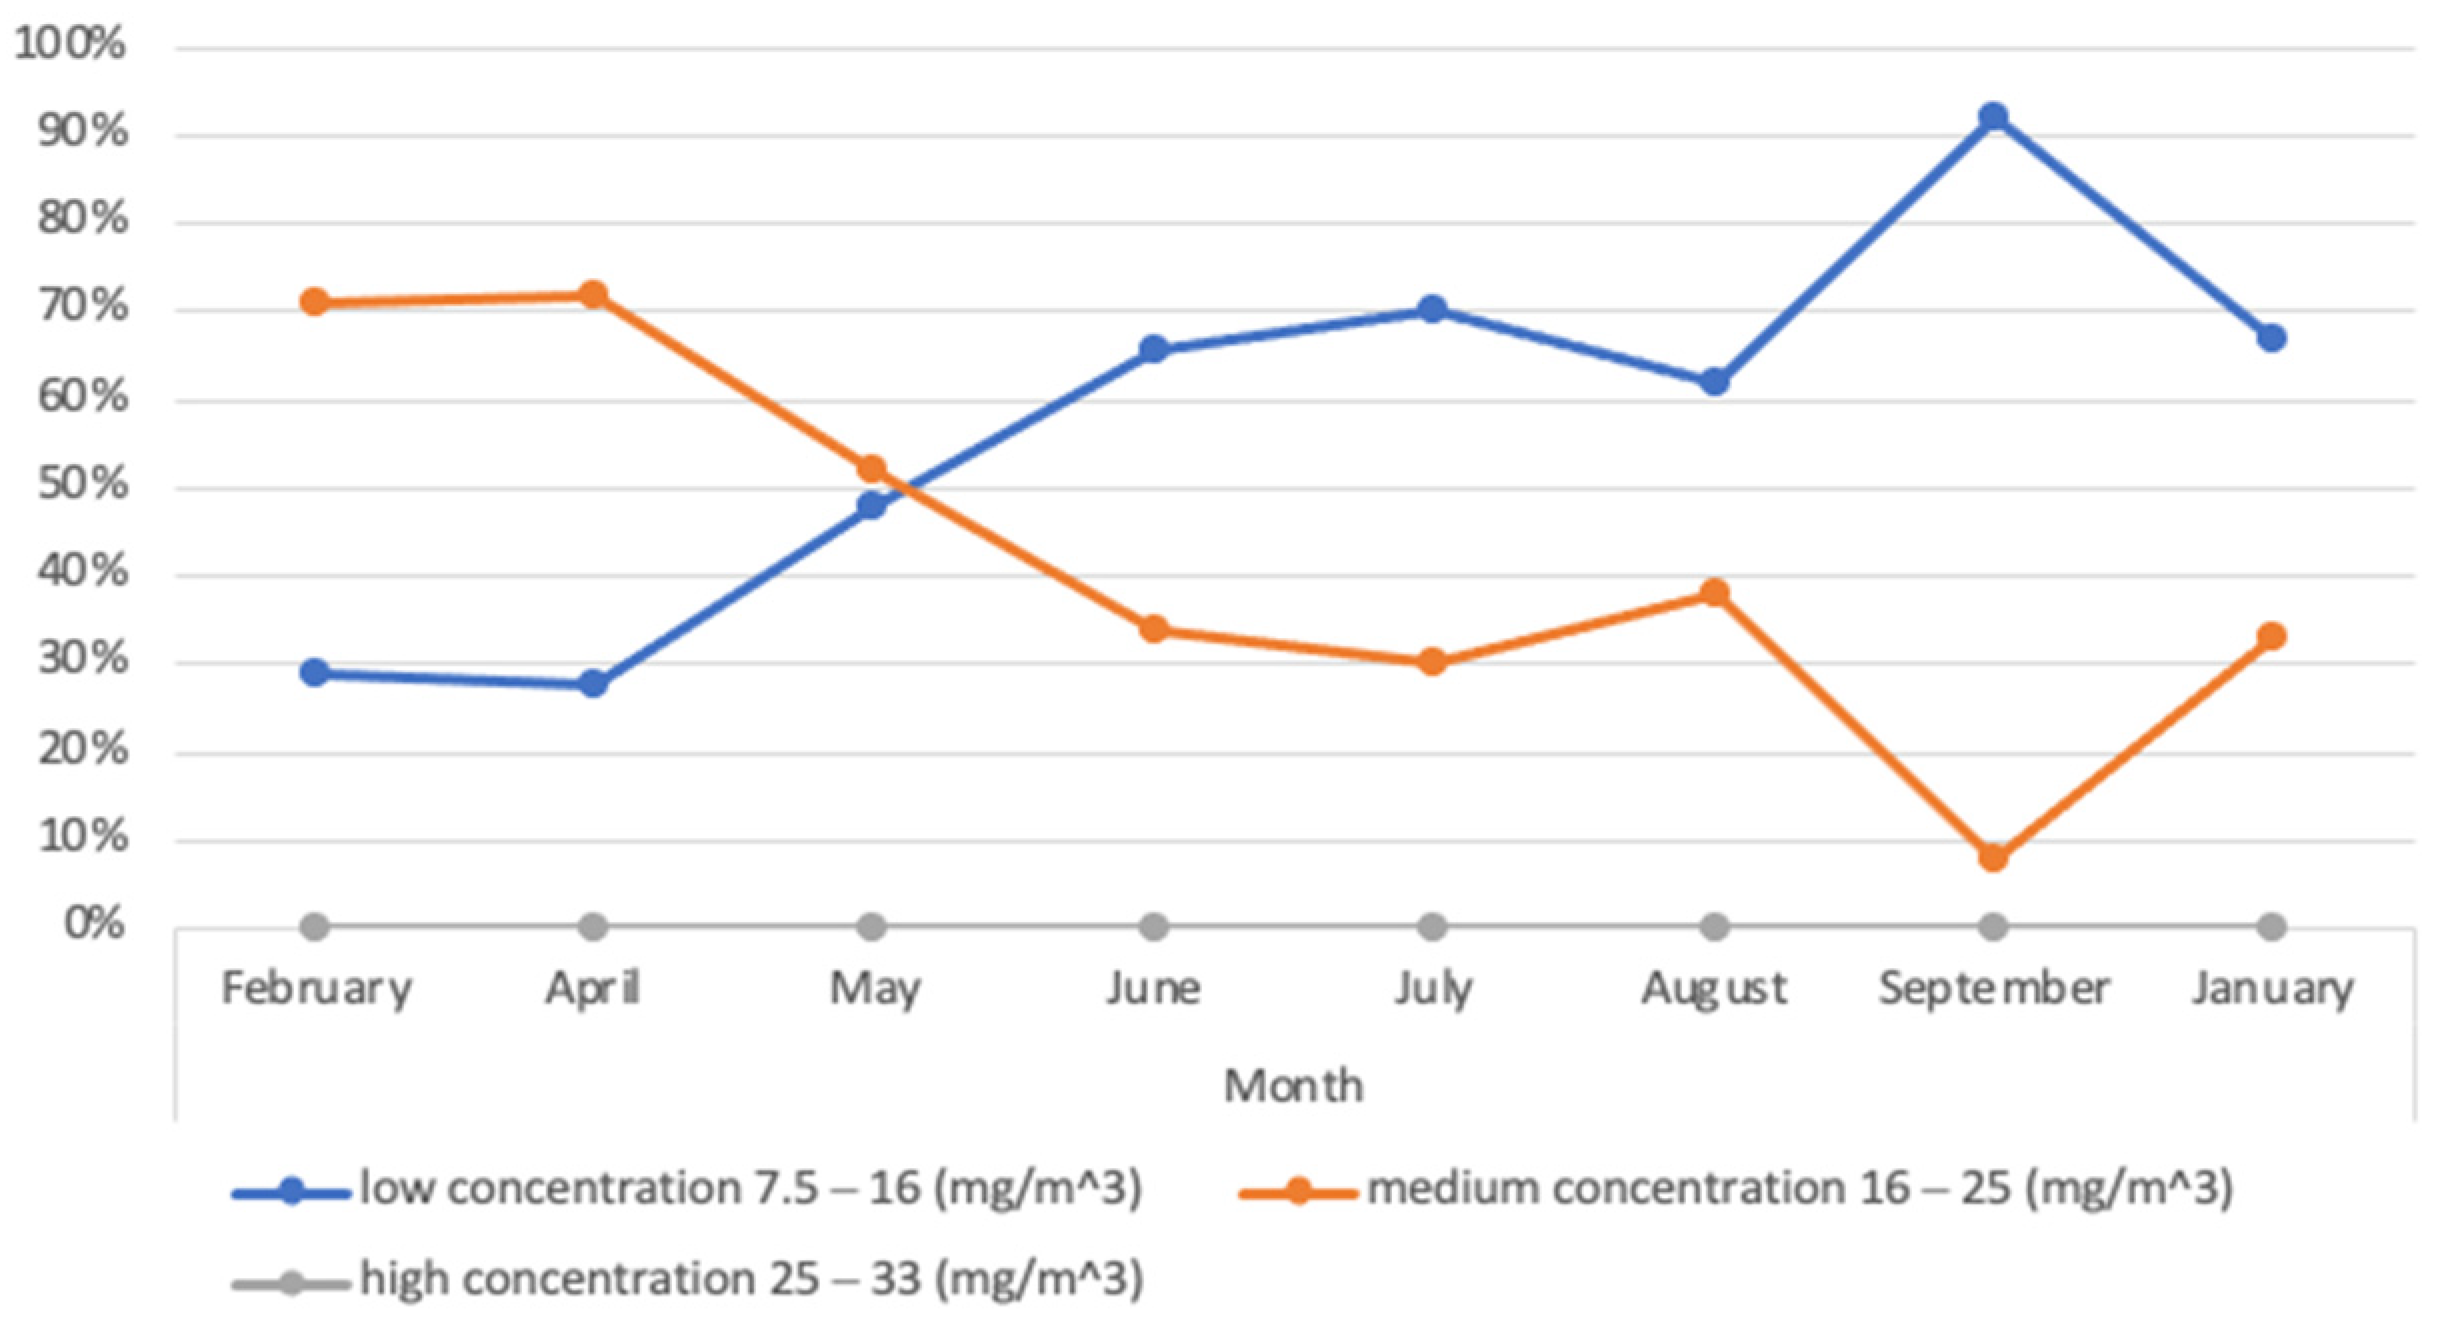
3.3.3. Milluni Chico Lagoon
The second monitored point was located in the Milluni Chico lagoon. According to the monitored parameters, point 2 is the most visually and analytically contaminated point. This is attributed to the mining activity around it, and the indicators of the presence of heavy metals corroborate it. The Milluni Chico lagoon has an acid character throughout the year without being affected by the time. It also has conductivities above 700 uS/cm, which suggests the presence of metal ions in the water. The lowest conductivities occur in the season with the most significant precipitation, which would present the dilution effect of pollutants. The concentration of metal ions (As, Zn, and Mn) is outside the permissible limits. Likewise, there is a decrease in turbidity in May, which is congruent with the decline in the average concentration of the Normalized Chlorophyll-A Index in Milluni Chico. Regarding the dissolved oxygen values, it can be said that they are acceptable, with a tendency to decrease from May when the dry season begins.
Figure 11 shows the concentrations of NDCI in the lagoon.
Figure 11 reveals that the Milluni Chico lagoon has a more significant amount of chlorophyll-a in medium concentration in February. This decreases throughout the year, with a minimum peak in September. Contrary to the low chlorophyll-a concentration, which has its most down season in February, it tends to rise throughout the year with a maximum growing peak in September. It denotes that the dynamics of organic pollutants in this lagoon are not related to the dry or wet season detected in Milluni.
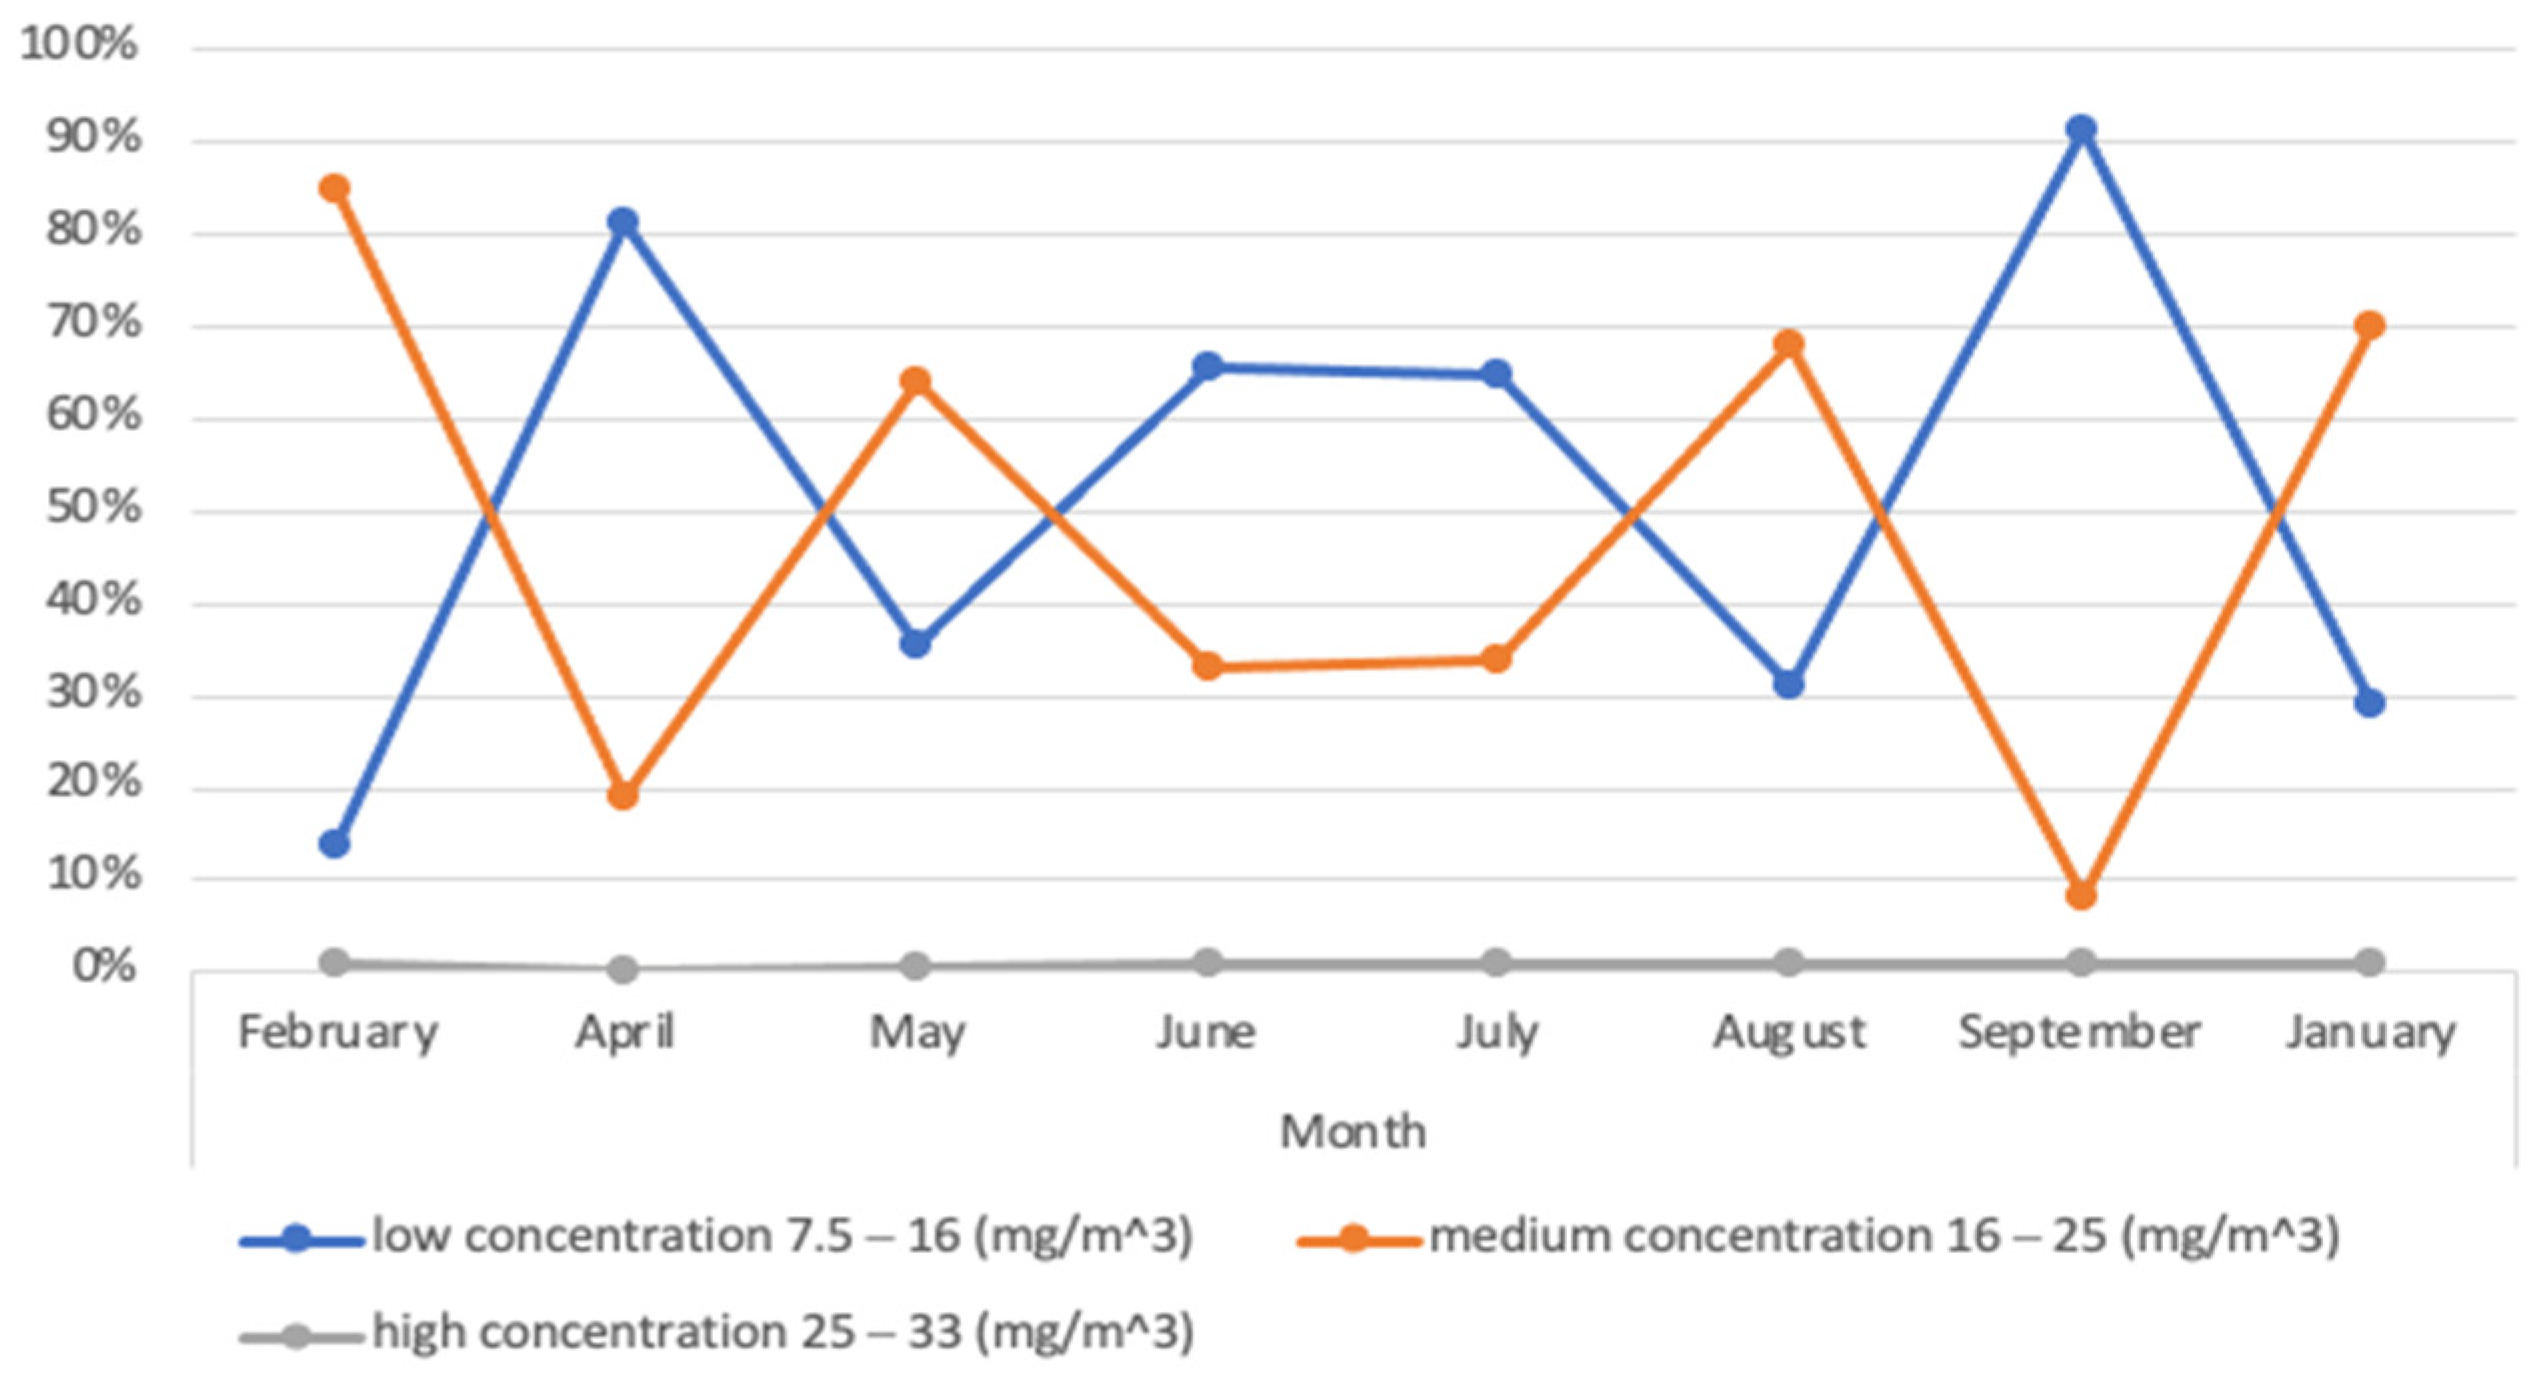
3.3.4. Milluni Grande Lagoon
The third monitored point is located in the water storage dam located in the Milluni Grande lagoon. The water at this point should be of high quality, considering that it comes from a natural glacier and is used for public supply. Milluni Grande has an acid character throughout the year without being affected by the wet or dry season. The conductivities are above 1000 uS/cm. Once again, the lowest conductivity occurs at the time of most significant precipitation, denoting the dilution effect of the pollutants present. This is corroborated with high conductivities during the dry season. Both the pH and the conductivity suggested the presence of metal ions in the water, which is confirmed by the concentrations of arsenic, zinc, and manganese outside the permissible limits. In this sense, it is verified that this water body would be negatively impacted by the mining in the area.
Regarding turbidity, it is observed that this decreases in the rainy season and increases from May, which exposes the effect of dilution of pollutants generated by the rise in water in the dam. The dissolved oxygen values at this point are acceptable, with a tendency to decrease from May when the dry season begins.
Figure 12 presents the concentrations of NDCI in the last lagoon.
Figure 12 shows that the low and medium concentrations of chlorophyll-a in Milluni Grande vary throughout the year without a direct relationship with the region’s dry or wet season. This could suggest that the factor influencing the low and medium concentrations of chlorophyll-a is independent of the Milluni season.
4. Discussion
Many previous studies have shown that mining is one of the activities with the most significant negative impact on the environment, especially on water. The ecological problem generated by unsustainable mining has been seen worldwide, but developing countries currently have the most significant vulnerabilities. This is due to many factors but in particular to the lack of resources to carry out complete controls and to be able to identify the sources and the degree of contamination.
Access to safe water is the current challenge for humanity, since it is directly linked to public health. This initial study exposes the water quality of the lagoons located in the upper part of the Milluni micro-basin. On the one hand, the first lagoon of the system (P1) does not present contamination according to international water quality standards, which implies that its water could be suitable for consumption after simple treatment. On the other hand, the Milluni Chico (P2) and Milluni Grande (P3) lagoons show alarming contamination. For P2 and P3, the measured pH values are around three and have high conductivities. In addition, toxic heavy metals were found for both points with values outside the permissible limits by the EPA and the WHO, exposing significant health risks if the water is used for public supply. The problem of water with compromised quality must be addressed in the first instance by reinforcing the monitoring of water bodies and subsequently seeking treatment alternatives to guarantee access to safe water for the population.
Although the traditional monitoring program designed for Milluni is functional and the results of its first year of implementation revealed the contamination of its lagoons, there are parameters within the permitted limits that are not a problem. However, over time, these parameters, heavy metals, could bioaccumulate and biomagnify within living organisms, leading to an ecological or public health disaster. Thus, this study exposes a future problem to be considered by decision-makers within water resources management.
5. Conclusions
The study presented the first approximation to the quality of surface water bodies in the upper part of the Milluni micro basin, which is the area affected by ancient and illegal mining. This is by correlating the results of the first year of the water quality monitoring program with satellite images obtained through remote sensing methodologies and programming on the “Google Earth Engine” platform. The four lagoons in the studied water system presented different qualities. Based on this, it can be seen that anthropogenic activities are not negatively impacting the first part, but they are affecting the second.
The part without contamination includes the first two lagoons, Pata Khota and Jhanco Khota. Still, as an important finding, the quality of the Pata Khota and Jhanko Khota lagoons do not have similar organic compositions (
Figure 8). This would mean that a control point should be added within the Jhanko Khota lagoon for future monitoring to obtain adequate control of its quality. As for the most polluted part of the system, it was observed that it is the Milluni Chico lagoon, and the Milluni Grande lagoon is receiving its effluents. This compromises the water quality inside the water storage dam located at the end of the Milluni Grande lagoon, presenting a risk to public health.
Finally, combining the remote sensing tool with traditional monitoring was a more robust and affordable indicator of water quality. It is possible to constantly monitor surface water bodies without requiring additional financial resources because several remote sensing methodologies use resources such as free software or platforms. In addition, it was seen that remote sensing served to observe the bodies of water in a given period in a global manner, reducing the risk of error when evaluating the quality of surface water bodies that depend on a single control point.
Future research related to the analysis of surface water quality should consider the application of contaminant remote sensing methodologies as a mechanism to validate their results. In addition, monitoring programs looking for optimization could incorporate remote sensing as was mentioned above; these methodologies would not represent extra costs for the program but would help to carry out a constant and global control of surface water bodies.
Author Contributions
Conceptualization, P.A.A.-T. and M.R.-R.; methodology, P.A.A.-T. and M.R.-R.; software, M.R.-R.; validation, P.A.A.-T. and M.R.-R.; formal analysis, P.A.A.-T. and M.R.-R.; investigation, P.A.A.-T. and M.R.-R.; resources, P.A.A.-T.; data curation, M.R.-R.; writing—original draft preparation, P.A.A.-T., M.R.-R. and V.G.L.-I.-F.; essay—review and editing, P.A.A.-T., M.R.-R. and V.G.L.-I.-F.; visualization, P.A.A.-T. and M.R.-R.; supervision, J.L.-G. and J.I.T.-L.; project administration, J.L.-G. and J.I.T.-L.; funding acquisition, J.I.T.-L. and P.A.A.-T. All authors have read and agreed to the published version of the manuscript.
Funding
This research was funded by The Universidad Católica Boliviana-Academic Unit of La Paz, and PROGRAMA ADSIDEO-2018 Development Cooperation Center of the Universitat Politècnica de València.
Institutional Review Board Statement
Not applicable.
Informed Consent Statement
Not applicable.
Data Availability Statement
Not applicable.
Acknowledgments
The research has been carried out with the support of the Center for Research in Water, Energy and Sustainability (CINAES) of the Environmental Engineering career of the Universidad Católica Boliviana—Sede LaPaz and The Project Management, Innovation and Sustainability Research Center (PRINS), Alcoy Campus, Universitat Politècnica de València.
Conflicts of Interest
The authors declare no conflict of interest.
References
- Yang, Z.; Zhou, Y.; Feng, Z.; Rui, X.; Zhang, T.; Zhang, Z. A review on reverse osmosis and nanofiltration membranes for water purification. Polymers 2019, 11, 1252. [Google Scholar] [CrossRef] [Green Version]
- Nilsson, A.E.; Avango, D.; Rosqvist, G. Social-ecological-technological systems consequences of mining: An analytical framework for more holistic impact assessments. Extra Ind. Soc. 2021, 8, 101011. [Google Scholar] [CrossRef]
- World Health Organization. Global Health Estimates. Deaths by Cause, Age, Sex, by Country and by Region, 2000–2019; World Health Organization: Geneva, Switzerland, 2019; Available online: https://www.who.int/data/global-health-estimates (accessed on 15 March 2022).
- United Nations. The General Assembly Adopts the 2030 Agenda for Sustainable Development. 2015. Available online: https://www.un.org/sustainabledevelopment/es/2015/09/la-asamblea-general-adopta-la-agenda-2030-para-el-desarrollo-sostenible/ (accessed on 15 March 2022).
- Wade, M.; O’Brien, G.C.; Wepener, V.; Jewitt, G. Risk assessment of water quantity and quality stressors to balance the use and protection of vulnerable water resources. Integr. Environ. Assess. Manag. 2021, 17, 110–130. [Google Scholar] [CrossRef] [PubMed]
- Ha, P.T.T.; Kokutse, N.; Duchesne, S.; Villeneuve, J.-P.; Bélanger, A.; Hien, H.N.; Toumbou, B.; Bach, D.N. Assessing and selecting interventions for river water quality improvement within the context of population growth and urbanization: A case study of the Cau River basin in Vietnam. Environ. Dev. Sustain. 2017, 19, 1701–1729. [Google Scholar] [CrossRef]
- Slaughter, A.; Hughes, D.; Retief, D.; Mantel, S. A management-oriented water quality model for data scarce catchments. Environ. Model. Softw. 2017, 97, 93–111. [Google Scholar] [CrossRef]
- Choque-Quispe, D.; Ligarda-Samanez, C.A.; Solano-Reynoso, A.M.; Ramos-Pacheco, B.S.; Quispe-Quispe, Y.; Choque-Quispe, Y.; Kari-Ferro, A. Water quality index in the high-Andean micro-basin of the Chumbao River, Andahuaylas, Apurímac, Peru. Tecnol. y Cienc. del Agua. 2021, 12, 37–73. [Google Scholar] [CrossRef]
- Michishita, R.; Jiang, Z.; Xu, B. Monitoring two decades of urbanization in the Poyang Lake area, China, through spectral unmixing. Remote Sens. Environ. 2012, 117, 3–18. [Google Scholar] [CrossRef]
- Boucher, J.; Weathers, K.C.; Norouzi, H.; Steele, B. Assessing the effectiveness of Landsat 8 chlorophyll a retrieval algorithms for regional freshwater monitoring. Ecol. Appl. 2018, 28, 1044–1054. [Google Scholar] [CrossRef] [PubMed] [Green Version]
- Xu, M.; Liu, H.; Beck, R.; Lekki, J.; Yang, B.; Shu, S.; Kang, E.L.; Anderson, R.; Johansen, R.; Emery, E.; et al. A spectral space partition guided ensemble method for retrieving chlorophyll-a concentration in inland waters from Sentinel-2A satellite imagery. J. Great Lakes Res. 2019, 45, 454–465. [Google Scholar] [CrossRef]
- Mishra, S.; Mishra, D.R. Normalized difference chlorophyll index: A novel model for remote estimation of chlorophyll-a concentration in turbid productive waters. Remote Sens. Environ. 2012, 117, 394–406. [Google Scholar] [CrossRef]
- Beck, R.; Zhan, S.; Liu, H.; Tong, S.; Yang, B.; Xu, M.; Ye, Z.; Huang, Y.; Shu, S.; Wu, Q.; et al. Comparison of satellite reflectance algorithms for estimating chlorophyll-a in a temperate reservoir using coincident hyperspectral aircraft imagery and dense coincident surface observations. Remote Sens. Environ. 2016, 178, 15–30. [Google Scholar] [CrossRef] [Green Version]
- Xiong, Y.; Ran, Y.; Zhao, S.; Zhao, H.; Tian, Q. Remotely assessing and monitoring coastal and inland water quality in China: Progress, challenges, and outlook. Crit. Rev. Environ. Sci. Technol. 2020, 50, 1266–1302. [Google Scholar] [CrossRef]
- Ortega, E.; Ramos, B.M.; Ezquerra, A.; Otero, I. Sistemas de Información Geográfica. Dextra Editorial. 2016. Available online: https://www.perlego.com/book/2051352/sistemas-de-informacin-geogrfica-pdf (accessed on 15 March 2022).
- Niura, M.M.; Ramos, O.E.; Quintanilla, J.E.; Garcia, M.E.; Blanco, E.J.; Flores, L. Evaluación regional de los recursos subsuperficiales de la subcuenca del Lago Poopó. Revista Boliviana de Química 2011, 28, 63–72. Available online: http://www.scielo.org.bo/scielo.php?script=sci_arttext&pid=S0250-54602011000200003&lng=es&tlng=es (accessed on 15 March 2022).
- Negewo, T.F.; Sarma, A.K. Estimation of water yield under baseline and future climate change scenarios in Genale Watershed, Genale Dawa River Basin, Ethiopia, using SWAT model. J. Hydrol. Eng.-ASCE 2021, 26, 05020051. [Google Scholar] [CrossRef]
- Syahrir, R.; Wall, F.; Diallo, P. Coping with sudden mine closure: The importance of resilient communities and good governance. Extr. Ind. Soc. 2021, 8, 101009. [Google Scholar] [CrossRef]
- Salvarredy-Aranguren, M.M.; Probst, A.; Roulet, M.; Isaure, M.-P. Contamination of surface waters by mining wastes in the Milluni Valley (Cordillera Real, Bolivia): Mineralogical and hydrological influences. Appl. Geochem. 2008, 23, 1299–1324. [Google Scholar] [CrossRef]
- Hilson, G. Pollution prevention and cleaner production in the mining industry: An analysis of current issues. J. Clean. Prod. 2000, 8, 119–126. [Google Scholar] [CrossRef]
- Sadiku, M.; Kadriu, S.; Kelmendi, M.; Latifi, L. Impact of Artana mine on heavy metal pollution of the marec river in Kosovo. Min. Miner. Depos. 2021, 15, 18–24. [Google Scholar] [CrossRef]
- Alvizuri Tintaya, P.A.; Villena Martínez, E.M.; Torregrosa López, J.I.; Lo Iacono Ferreira, V.G.; Lora Garcia, J. Design of a monitoring program with the application of Bolivian Standard NB/ISO 5667-4: A case study of Milluni, Bolivia. In Proceedings of the XXIV International Congress on Project Management and Engineering, Alcoy, Spain, 7–9 July 2020; Available online: http://dspace.aeipro.com/xmlui/handle/123456789/2499 (accessed on 15 March 2022).
- Google Earth Engine. Available online: https://earthengine.google.com/ (accessed on 15 March 2022).
- Ahlfeld, F.; Schneider-Scherbina, A. Los Yacimientos Minerales y de Hidrocarburos de Bolivia; Departamento Nacional de Geología, Ministerio de Minas y Petróleo: La Paz, Bolivia, 1964. Available online: https://www.si.edu/object/siris_sil_198136 (accessed on 15 March 2022).
- Iltis, A. Datos Sobre las Lagunas Altura de la Región de la Paz (Bolivie); ORSTOM: La Paz, Bolivia, 1988; 50p, Available online: http://horizon.documentation.ird.fr/exl-doc/pleins_textes/doc34-05/26148.pdf (accessed on 15 March 2022).
- Alvizuri Tintaya, P.A.; Torregrosa López, J.I.; Lo Iacono Ferreira, V.G.; Salinas Villafañe, O.R. Heavy metals problem in micro-basin that feeds a drinking water dam, Milluni–Bolivia case. In Proceedings of the XXIII International Congress on Project Management and Engineering, Málaga, Spain, 10–12 July 2019; Available online: http://dspace.aeipro.com/xmlui/handle/123456789/2396 (accessed on 15 March 2022).
- Norma Boliviana NB 512: Agua Potable—Requisitos; Ibnorca: La Paz, Bolivia, 2010; Available online: http://www.anesapa.org/data/files/NB512-AP_Requisitos.pdf (accessed on 15 March 2022).
- United Nations Environment Programme (UNEP); World Health Organization (WHO). Water Quality Monitoring—A Practical Guide to the Design and Implementation of Freshwater Quality Studies and Monitoring Programmes. Edited by Jamie Bartram and Richard Balance; Bartram, J., Ballance, R., Eds.; E & FN Spon: New York, NY, USA, 1996; ISBN 0 419 22320 7. Available online: https://www.who.int/water_sanitation_health/resourcesquality/waterqualmonitor.pdf (accessed on 15 March 2022).
- International Organization for Standardization. ISO 5667-1: Water Quality—Sampling—Part 1: Guidance on the Design of Sampling Programmes and Sampling Techniques; ISO: Geneva, Switzerland, 2006; Available online: https://www.iso.org/standard/72369.html (accessed on 15 March 2022).
- Molina Carpio, J.; Foronda, E.; Condori, E. Micro-regional water balance of Bolivia, first results. In Proceedings of the Congreso Boliviano de Ingeniería Civil, La Paz, Bolivia, 11–13 October 2004; Available online: https://www.researchgate.net/publication/280635583_Balance_hidrico_micro-regional_de_Bolivia_primeros_resultados_Micro-regional_Water_Balance_of_Bolivia_First_Results (accessed on 15 March 2022).
- Ministerio de Medio Ambiente y Agua—Viceministerio de Recursos Hídricos y Riego, 2016. Guía Metodológica para la Elaboración de Balances Hídricos Superficiales—Análisis de Variabilidad Climática de Oferta y Demanda Hídrica. Versión Resumida. Available online: https://www.researchgate.net/publication/318646276_Guia_metodologia_para_la_elaboracion_de_balances_hidricos_superficiales_version_resumida (accessed on 15 March 2022).
- SENAMHI. Base de Datos Meteorológico del Servicio Nacional de Meteorología e Hidrología-SISMET. Bolivia. 2021. Available online: http://senamhi.gob.bo/index.php/inicio (accessed on 15 March 2022).
- International Organization for Standardization. ISO 5667-4: Water Quality—Sampling—Part 4: Guidance on Sampling from Lakes, Natural and Man-Made; ISO: Geneva, Switzerland, 2016; Available online: https://www.iso.org/standard/55450.html (accessed on 15 March 2022).
Figure 1.
Distribution of the Milluni lagoons and location of monitored points. Source: Own elaboration, 2022.
Figure 1.
Distribution of the Milluni lagoons and location of monitored points. Source: Own elaboration, 2022.
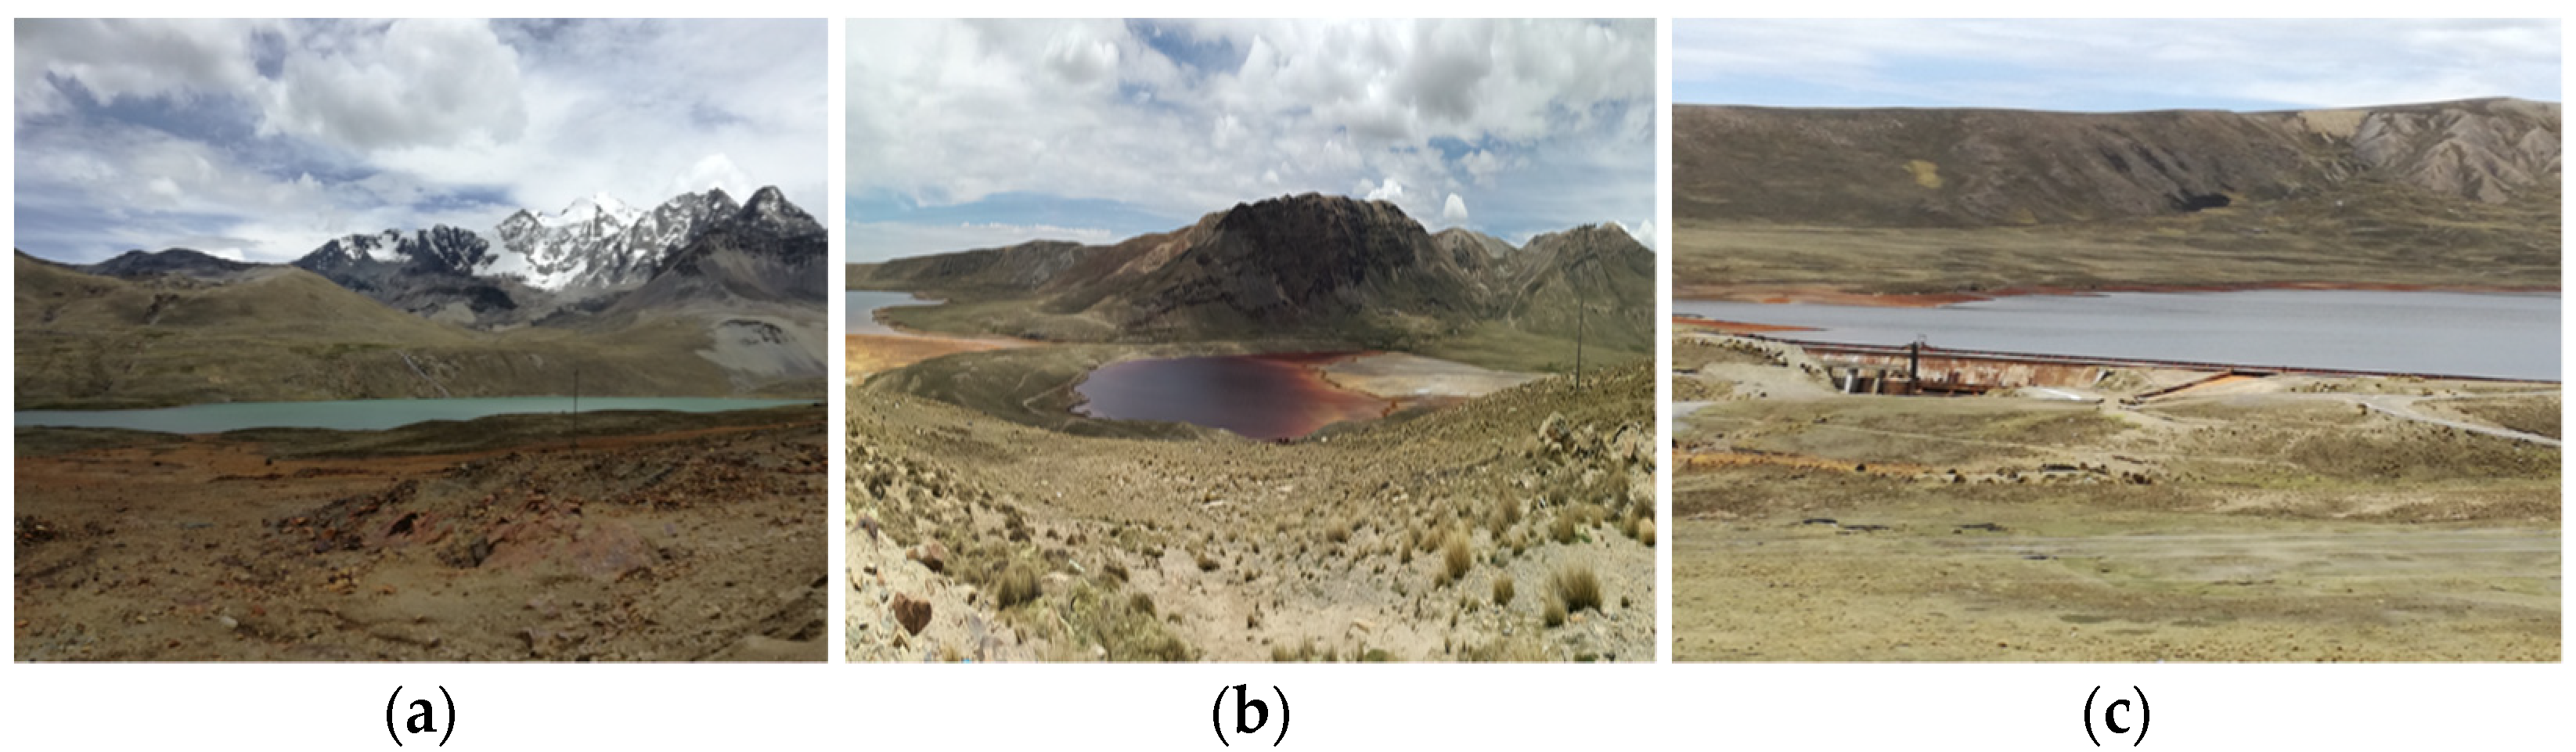
Figure 2.
Sampling points in Milluni. (a) Point 1: Pata Khota lagoon, beginning of the lagoon system; (b) Point 2: Laguna Mulluni Chico, seriously impacted by mining; (c) Point 3: Laguna Milluni Grande, where the water storage dam that supplies two cities in Bolivia is located.
Figure 2.
Sampling points in Milluni. (a) Point 1: Pata Khota lagoon, beginning of the lagoon system; (b) Point 2: Laguna Mulluni Chico, seriously impacted by mining; (c) Point 3: Laguna Milluni Grande, where the water storage dam that supplies two cities in Bolivia is located.
Figure 3.
The methodology applied in the study.
Figure 3.
The methodology applied in the study.
Figure 4.
Normalized Chlorophyll-a Index (NDCI) flow chart.
Figure 4.
Normalized Chlorophyll-a Index (NDCI) flow chart.
Figure 5.
Climatological analysis. Source: Own elaboration, 2022.
Figure 5.
Climatological analysis. Source: Own elaboration, 2022.
Figure 6.
Parameter values in situ. Source: Own elaboration, 2022.
Figure 6.
Parameter values in situ. Source: Own elaboration, 2022.
Figure 7.
Parameter values ex situ. Source: Own elaboration, 2022.
Figure 7.
Parameter values ex situ. Source: Own elaboration, 2022.
Figure 8.
Satellite views of the surface water bodies of Milluni. Source: Own elaboration, 2022.
Figure 8.
Satellite views of the surface water bodies of Milluni. Source: Own elaboration, 2022.
Figure 9.
NDCI concentrations in the Pata Khota lagoon. Source: Own elaboration, 2022.
Figure 9.
NDCI concentrations in the Pata Khota lagoon. Source: Own elaboration, 2022.
Figure 10.
NDCI concentrations in the Jhanko Khota lagoon. Source: Own elaboration, 2022.
Figure 10.
NDCI concentrations in the Jhanko Khota lagoon. Source: Own elaboration, 2022.
Figure 11.
NDCI concentrations in the Milluni Chico lagoon. Source: Own elaboration, 2022.
Figure 11.
NDCI concentrations in the Milluni Chico lagoon. Source: Own elaboration, 2022.
Figure 12.
NDCI concentrations in the Milluni Grande lagoon. Source: Own elaboration, 2022.
Figure 12.
NDCI concentrations in the Milluni Grande lagoon. Source: Own elaboration, 2022.
Table 1.
Average precipitation and evapotranspiration data from 1999 to 2018 for the Milluni area.
Table 1.
Average precipitation and evapotranspiration data from 1999 to 2018 for the Milluni area.
| Month | Total Precipitation
(mm) | Total Evapotranspiration (mm) | Mean Evapotranspiration (mm) |
|---|
| July | 7.54 | 61.62 | 30.81 |
| August | 12.10 | 72.26 | 36.13 |
| September | 25.16 | 78.05 | 39.03 |
| October | 42.92 | 93.12 | 46.56 |
| November | 41.09 | 98.06 | 49.03 |
| December | 94.67 | 100.49 | 50.24 |
| January | 128.06 | 92.43 | 46.22 |
| February | 109.71 | 79.00 | 39.50 |
| March | 83.67 | 81.25 | 40.63 |
| April | 37.92 | 71.17 | 35.59 |
| May | 13.95 | 66.55 | 33.27 |
| June | 9.52 | 58.44 | 29.22 |
| Publisher’s Note: MDPI stays neutral with regard to jurisdictional claims in published maps and institutional affiliations. |
© 2022 by the authors. Licensee MDPI, Basel, Switzerland. This article is an open access article distributed under the terms and conditions of the Creative Commons Attribution (CC BY) license (https://creativecommons.org/licenses/by/4.0/).


 ,
, 


