Article

Mineral Resources: Reserves, Peak Production and the Future

by
Lawrence D. Meinert
*,
Gilpin R. Robinson
and
Nedal T. Nassar
U.S. Geological Survey, 12201 Sunrise Valley Drive, MS 913, Reston, VA 20192, USA
*
Author to whom correspondence should be addressed.
Submission received: 22 December 2015 / Revised: 8 February 2016 / Accepted: 16 February 2016 / Published: 29 February 2016
(This article belongs to the Special Issue Consideration of Abiotic Natural Resources in Life Cycle Assessments)

Abstract

:
The adequacy of mineral resources in light of population growth and rising standards of living has been a concern since the time of Malthus (1798), but many studies erroneously forecast impending peak production or exhaustion because they confuse reserves with “all there is”. Reserves are formally defined as a subset of resources, and even current and potential resources are only a small subset of “all there is”. Peak production or exhaustion cannot be modeled accurately from reserves. Using copper as an example, identified resources are twice as large as the amount projected to be needed through 2050. Estimates of yet-to-be discovered copper resources are up to 40-times more than currently-identified resources, amounts that could last for many centuries. Thus, forecasts of imminent peak production due to resource exhaustion in the next 20–30 years are not valid. Short-term supply problems may arise, however, and supply-chain disruptions are possible at any time due to natural disasters (earthquakes, tsunamis, hurricanes) or political complications. Needed to resolve these problems are education and exploration technology development, access to prospective terrain, better recycling and better accounting of externalities associated with production (pollution, loss of ecosystem services and water and energy use).

1. Introduction

At least since the time of Malthus (1798) [1], there has been concern about the adequacy of resources to support a growing human population on planet Earth. In more recent times, there has been an ebb and flow between studies that predict the near-term exhaustion or peak production of resources [2,3,4,5,6,7,8,9,10,11,12,13] and those that are more optimistic [14,15,16,17,18,19,20]. The one thing that is common among every prediction about the exhaustion or production peak of resources by a particular date is that they have been wrong. This is well illustrated, but by no means proven or vindicated, by the famous bet between Julian Simon and Paul Erlich about the price of five benchmark metals, chromium, copper, nickel, tin and tungsten, ten years in the future [21]. Even though Dr. Erlich was quite confident that prices would have to be higher in the future due to resource scarcity, he lost that bet because prices were actually lower, both in real and inflation-adjusted dollars. However, had the bet been made at a different time, the outcome could have been the opposite of what transpired. Therefore, what is it that leads to such uncertainty about what seems to be a straightforward argument?
On the one hand, there is no disputing that Earth has a finite mass and if resources are consumed at some definable rate, then eventually they will be used up [22]. On the other hand, we have not yet run out of any mineral commodity, and exploration and technology have more than kept up with changing demands for mineral resources throughout human history. As was said by Sheikh Zaki Yamani, “The Stone Age did not end for lack of stone...” (quoted in [23]) How do we reconcile such contradictions?
Perhaps a useful analogy for understanding this seeming paradox between the unarguably finite amount of mineral resources on Earth and the continuing ability of society to meet its resource needs is the continuous increase in human performance in athletic endeavors, even though elementary logic dictates that it cannot continue forever. It is a demonstrable fact that new world records continue to be set in every athletic event despite the real limits to human achievement: humans will never be able to run faster than a rifle bullet, except in comic books and movies.
Although many sports analogies could be considered in this regard, running might be the most useful because the records are easily quantifiable and because most people have run at some point in their lives, even if not at a competitive level. A running event that illustrates this logic conundrum is the mile, because the 4-min benchmark was long considered unreachable. There are many excellent literary and historical accounts of the quest to break this once unbreakable mark [24]. That pace today would not even qualify for entry into the Olympics, and the current world record for the mile is 3:43.13, set in 1999 by Morocco’s Hicham El Guerrouj. However, any particular record is not the point. If a 4-min mile is not the limit, is 3:40, 3:30 or 3:00? History says that no record lasts forever, yet elementary physiology tells us that improvement cannot continue indefinitely. Therefore, although obviously this is not a perfect analogy for the ultimate limits to mineral resources, it does illustrate the difficulty in reconciling finite limits with the absence of evidence of reaching those limits. That is the central theme of the present paper.

2. Background

Before discussing a framework for thinking about limits to mineral resource availability and consequences of use, it is useful to first explore the important terms, reserves and resources [11]. These terms are poorly understood by many and widely misused, particularly in the well-known Limits to Growth study of Meadows et al. [2] and more recent incarnations [10,25,26]. Reserves have a defined meaning as codified by several widely-used standards, such as the Australian Joint Ore Reserves Committee (JORC) [27], the South African Mineral Resource Committee (SAMREC) [28] and Canada’s National Instrument 43-101 [29]. Furthermore, the Committee for Mineral Reserves International Reporting Standards (CRIRSCO) [30] has harmonized the various country-level codes into a common international reporting standard. A summary of various resource and reserve classifications is outlined in Table 1.
In simple terms, a reserve is a known quantity of a resource as established by drilling and sampling; it typically is expressed as X tons of material with an average grade of Y at a cutoff grade of Z. This results in a calculated amount of contained metal that potentially could be recovered, based on assumptions of cost, price and technology. Resource is a broader and more general term than reserve and includes identified material that may be less well characterized, possibly of lower grade and less certain to be economically recoverable. Resources can be converted to reserves by additional drilling or changes in economic factors, such as price or technology [40]. However, it is very important to understand that neither reserves nor resources are the same as “all there is”.
This is the fundamental flaw of many studies, such as Meadows et al. [2], that assumed reserves, or some multiplier thereof, were “all there is” and that by applying a given annual rate of consumption, one could model how long the resource would last before disaster ensued (a more detailed analysis is given by [19,41]). A little appreciated fact is that increasing world population and standards of living lead to more production, which, in turn, requires larger reserves to sustain that production; thus, world reserves of almost all commodities are larger now than they were 50 or 100 years ago [42]. This is because the time value of money makes it uneconomic to spend unlimited amounts to convert all identified or undiscovered resources into reserves. In practice, most companies do not drill out more than about 20 or 30 years’ worth of reserves, and some large mines have had ~20 years’ worth of reserves for more than a century as continuing exploration proves additional reserves. Thus, modeling of how long reserves might last is fraught with the same difficulty as modeling how long the food in one's refrigerator might last: even though you keep eating three meals a day, there is still food in the refrigerator.
It is worth repeating that reserves are an economically-defined quantity and never have and never will equate to “all there is”. In spite of this reality, a recent article went so far as to assert that the majority of Earth’s reserves have already been consumed: “80% of the world’s mercury reserves, 75% of its silver, tin, and lead, 70% of gold and zinc, and 50% of copper and manganese had already been processed through human products” [26] (p. 239), even though it is a simple fact that the world’s reserves of these elements continue to evolve with improved geological assurance, technological advances and economic conditions and are presently as large as they have ever been [43].
Another way of approaching this question of how long resources will last is the “peak” concept as applied to petroleum resources by M. K. Hubbert [13,44]. It is based on an empirical observation about U.S. oil fields that production follows a bell-shaped curve of a normal distribution, and thus, the peak of production occurs when roughly half of the resource has been extracted. Thus, changes in production are used to model the entire extractable resource. Such an approach is based on many assumptions, the most important of which are that prices and technology are relatively stable. Hubbert’s prediction that peak oil production for the conterminous United States would occur in the early 1970s was a reasonable extrapolation of trends leading up to the supposed “peak oil” and has been cited by many as proof that such production trend modeling is accurate [5,6,45]. However, the recent application of new and improved drilling technology (horizontal drilling and fracking) has shown that the assumptions of the Hubbert peak oil methodology were restricted to “conventional” petroleum production and have not accurately tracked the large increases in both production and reserves of petroleum and natural gas that have recently resulted from these new technologies (Figure 1) [46].
The point of the present paper is not to assess previous studies of resource adequacy, but rather to provide a conceptual framework for thinking about how resources, particularly mineral resources, are explored for, discovered and put into production in order to satisfy the continuing needs of society. An underlying concept is that mineral resources have been the foundation of civilization throughout history [12,48,49,50] and that the adequacy of such resources for future generations remains one of the central issues of our time [51,52]. Although many mineral resources could be used as examples, the below discussion will focus on copper, because it has been used throughout history; it is a major ingredient in modern construction and technology; its geologic occurrence is relatively well known; and it has a rich historical record of production data. In addition, there have been numerous studies [53,54] about copper, as well as recent predictions of “peak copper” occurring within the next 20–30 years [9,10,55].

3. Copper

Historic mine production has recovered more than 658 million metric tons (Mt) of copper (Cu) from 1700 to 2015 [43,56,57]. Of this total, over 45 percent has been produced during the past 20 years, and approximately 26 percent has been produced during the previous 10 years. In other words, roughly one quarter of all of the copper mined throughout human history has been produced in just the past 10 years (Figure 2). These percentages suggest that global copper production has doubled every 25 years in order to accommodate trends in global copper consumption.
A research group at Monash University in Australia analyzed current estimates of copper resources based on published company reports and tabulated a total of 1781 Mt of Cu contained within a total of 730 projects, with a further 80.4 Mt of Cu in China from an unknown number of deposits, yielding a world total of 1861 Mt of Cu [53]. This is very similar to a recent U.S. Geological Survey (USGS) estimate of identified Cu resources of 2100 Mt of Cu [54]. To reiterate a previous point, this 2100 Mt of Cu is the amount of identified resources, and further drilling or possible changes in prices/technology will almost certainly add to the total. However, neither reserves nor resources are “all there is”. Before addressing the questions of what is known about, and the potential adequacy of, “all there is”, it is useful to compare current estimates of reserves to current and projected rates of production.
Modeling based on identified resources has led some researchers to suggest that mine production of copper will peak and begin to decline within decades due to increasing demand and resource depletion [8,55]. Is this realistic? The U.S. Census Bureau estimates that world population will grow from 7.3 billion people in 2015 to 9.4 billion in 2050 [58]. At current rates of global per capita production of copper, estimated at about 2.6 kg/year in 2015, the production of primary (mine-produced) copper would grow to 24.2 Mt of copper in 2050 from the level of 18.7 Mt in 2015 [43].
However, assuming a global per capita production value of 2.6 kg/year does not take into account regional variations in per capita consumption and how they are changing due to changes in affluence or lifestyles. Nor does it take into account the increasing quantities of copper that will likely become available for recycling and thus offset the need for primary copper. Studies of various countries (e.g., [59,60,61,62]) show that per capita consumption of copper is related to the level of economic development. Per capita consumption of copper is relatively stable over time in high-GDP countries, such as the United States and Japan, at about 6 kg/year [63]. Very low levels of consumption occur in countries with low economic activity and low income levels, whereas increasing levels of per capita consumption are observed in rapidly developing countries, such as Indonesia and China [63].
Factoring in projected growth in population and global per capita GDP to 2050 provides a forecast of copper consumption that needs to be satisfied by mine production of 30.4 Mt of Cu. These projections indicate that between 750 and 990 Mt of primary copper will be required to satisfy projected global demand from 2012 to 2050. The projected range of estimated demand considers modest changes in the amount of copper recycling, which has increased in recent years [65]; but does not account for new technology-driven changes in demand patterns, substitution by alternative materials or other factors that could alter future demand growth for copper. To restate this, we can estimate amounts and project trends, but we cannot know the actual mix of mineral resources needed 30–50 years in the future any more than someone in 1970 could have predicted today’s high-tech need for a variety of specialty metals, such as rare-earth elements.
Using these assumptions and constraints, the current estimate of 2100 Mt of copper in identified resources in major copper deposits worldwide is about twice as much copper as is estimated to be needed through 2050. Even without considering the almost certain expansion of reserves that will take place with future exploration and drilling, this makes it very unlikely that copper production will peak by 2040 due to resource depletion (Figure 3), as predicted by the studies of [9,10,55].
Furthermore, because many of these studies dating back to Meadows et al. [2] confuse reserves with “all there is”, their conclusions about reserve exhaustion, whether substantiated or not, do not really address the underlying question of the adequacy of mineral resources for future generations. To best address this important question, we need to know future world demand (net of recycling) for minerals, estimate as well as we can the amount of identified resources and assess the location, quality, quantity and the environmental and economic aspects of the extraction of undiscovered resources. This is a daunting task that has never been seriously undertaken for any major commodity. The best effort for copper is a recently completed global assessment of the major sources of onshore world copper resources in two, but not all, of the most important types of copper-rich deposits by the U.S. Geological Survey (USGS) [54].
Before addressing the implications of that study for the questions of “peak copper” and the adequacy of copper resources for future generations, it is important to realize what is not included in that assessment. The USGS study focused mainly on deposits to a depth of one kilometer and did not include resources in the ocean basins that cover more than 75% of the Earth’s surface, nor the possibility for utilization of resources from space. Some studies have indicated that seafloor resources [66] may be as much or greater than onshore resources and others have proposed direct recovery of metals from seawater, which if economically viable, would likely eclipse all onshore resources [67]. Neither of these ideas about potential resources has been developed sufficiently to know if they are even possible, but their relevance to the present discussion is simply that it is not possible to predict the exhaustion of mineral resources when only considering part of the potential resource.
Also important is the fact that the USGS study was constrained to current prices and technology for considering what might be an economic mineral resource. If prices were 10-times higher or technology 10-times more efficient (both of which have taken place in the history of resource extraction [42]), then the assessed copper resources would be considerably higher than the presented estimates. Thus, the undiscovered copper resources estimated by Johnson et al. [54] are still a small subset of “all there is”, but at least this estimate is closer to an ultimate resource than the identified resources categorized by Mudd et al. [53] and similar studies.
The USGS global copper resource assessment [54] estimated that more than 3500 Mt of copper are present in undiscovered porphyry and sediment-hosted continental copper deposits; the majority of these resources are located in Asia, followed by the Americas. Of this 3500-Mt estimate of in-ground copper resources, approximately 2000 Mt of copper is estimated as economic to recover under current economic conditions and mining technology.
A significant fraction of these undiscovered resources is estimated to occur deep beneath covering rock and sediment and commonly in remote areas. These deposits will be difficult and time consuming to discover, and many potentially economic deposits in remote and deep settings may not be discovered and developed before 2050. An estimate of undiscovered resources that are most likely to be discovered and characterized by 2050 is approximately 1100 Mt of copper [68].
Using the production rates (16.9–30.4 Mt/y of copper) previously discussed for current reserves, the range of undiscovered copper resources by the USGS study of 1100–3500 Mt of copper (keeping in mind the previously discussed caveats about this being a minimum estimate) could last more than a century. This would be in addition to the currently identified resources, which by themselves are estimated to be twice the amount needed through 2050. Therefore, the combined total is likely to last at least through the end of this century and possibly the century after that.
Kesler and Wilkinson [69] used a different, largely hypothetical, approach to estimating world copper resources. Their tectonic diffusion model predicts world copper resources of 89 billion metric tons (Bt) of copper within mineable depths, an amount that would last for millennia. Thus, although it is true that copper is not an infinite resource on planet Earth, based on current knowledge, a sufficient amount exists to fulfill the needs of at least several generations.
Of course, copper, like any other mineral resource, is not really “consumed” in the same way that energy loses its ability to perform useful work when it is “consumed.” Thus, discussions of mineral resource exhaustion are implicitly referring to the lack of availability of resources in the ground and not their lack of availability in an absolute sense given that many metals are available for multiple cycles of use and re-use. Within this paradigm of ultimate resources, it is useful to discuss how much of a resource is currently in use, how much might be needed in the future to fulfill the services desired by an increasingly affluent global population and how much of what is in the ground can be put into use to satisfy these requirements [7,70,71].
Therefore, instead of worrying about reaching “peak” production or “exhausting” a resource, we should instead be more concerned about what we do with the resource after it has been extracted. Is it being used in dissipative applications [72]? How much is being “lost” (i.e., placed in a state where it is prohibitively difficult or costly to recover) at each life cycle stage? Further concerns are the externalities (pollution, loss of ecosystem services and water and energy use) associated with resource production. A full life cycle assessment and material flow accounting of mineral resources would be a more fruitful conversation than just peak production due to resource exhaustion.

4. The Future

All of the preceding discussion boils down to when, but not if, a given quantity of resource will be exhausted. However, this begs the question of, “what then?” This is not as dramatic as it may seem because the common analogy between resource exhaustion and falling off a cliff is not appropriate. Resource use does not proceed full bore until the last unit of an element is consumed and then disaster unfolds. Rather, resource use follows the basic laws of supply and demand. As resources are consumed, scarcity will drive prices up, which in turn will affect demand, consumption and production. To greatly simplify, if the equilibrium price of a commodity rises ten-fold, then this will both increase supply, because previously marginal or unknown deposits will be put into production, and decrease demand, because some uses of that commodity will no longer be economic, and either production will decrease, thrifting (reducing unit consumption) will occur or other materials will be substituted. This will gradually reduce the need for the commodity in question in the long term and bring production in line with the available reserves, even though short-term supply disruption or imbalance is possible. To return to an earlier analogy, “the Stone Age did not end because we ran out of stone”, we do not know which metals will be in demand 30–50 years from now; changes in technology and lifestyle may mean that society’s future needs are very different from today's.
This does not mean that we should be unconcerned about resource adequacy. We should. However, we should not confuse the adequacy of mineral resource supply with the actions needed to address the needs of future generations for mineral resources.
The main resource issue for the future likely will be the development of capacity to discover and produce additional resources. There may well be enough undiscovered copper to meet global needs for the foreseeable future, but rates of exploration, discovery success and mine development will need to increase to supply the needed copper resources. Cost-effective technology will need to be developed to discover additional mineral deposits in new, deeper and concealed settings and to extract and recover resources from earth materials, while minimizing environmental impact. This technology will only be effective if it can be applied to lands where new resources may be discovered and mines developed. Nature, not society, controls where mineral concentrations occur, but society determines whether to mine or not, and land access becomes more difficult as population increases.
As much as recycling [65] and substitution [73] will be part of the solution, they cannot by themselves solve the problem. Population growth and rising standards of living, combined with the sequestration of elements, like copper in buildings, cars, cell phones, etc., for periods of years to decades and, in some cases, centuries will require new primary supplies of mineral resources. The lead time from discovery to mine development can be 10–30 years. Extensive mineral exploration will be required to meet this future resource demand, because many of the undiscovered deposits will be harder to find and more costly to mine than near-surface deposits located in more accessible areas.
At a global level, it is not clear that society is making the investments in education, research and development to ensure that these mineral resources will be available for future generations [74]. The number of universities that teach and do research on mineral resources, mining engineering and metallurgy is decreasing rather than increasing, and this is paralleled by decreases in governmental funding to support geoscience research (Figure 4). National, state and provincial geological surveys and the knowledge infrastructure that they create, manage and publically provide are instrumental in the discovery process, particularly by conducting modern geologic mapping and related geochemical and geophysical surveys to identify favorable geologic environments likely to contain mineral resources. They also compile data on known deposits, conduct research into the processes that form mineral deposits, track mineral commodity production and use and update assessments to estimate the amounts, quality and location of future resources on local, national and global scales.
In most countries, exploration and discovery is done largely by private companies and individuals, building on, but independent of, the underlying research and data development of universities and governmental geological surveys. Some companies conduct their own research or fund others to do targeted research. However, private companies are particularly susceptible to economic cycles with a clear correlation between economic cycles and exploration expenditures (Figure 5). A downsized mineral industry during a low cycle may not be able to respond quickly to the next up cycle, thus resulting in short-term mismatches in supply and demand. For the past 10 years, greatly increased exploration expenditures do not appear to have resulted in proportional discovery success, a trend some attribute to exploration for increasingly deeper ore bodies that are undercover or in remote regions. Thus, adequate supplies of mineral resources for future generations should not be taken as a given. The need for mineral resources is clear, but the path to a sustainable future will reflect the distribution of materials in the Earth and ultimately will depend on the choices, innovation, policies and values of human society. This deserves serious thought.
Even with the problems identified above, the future is not grim. Discoveries continue to be made even in well-explored districts. Most exploration has been concentrated in the upper part of the upper kilometer of the Earth’s crust, even though economic deposits have been discovered down to three or more kilometers. Thus, deeper drilling combined with new exploration technology promises new discoveries, even in mature districts. We do not know what the limits to mineral resources might be, but we do know that we have not come close to reaching them yet.

Acknowledgments

We wish to acknowledge the many scientists of the USGS who have compiled over many decades the data that underlie this and most studies needing minerals information. We received thoughtful informal reviews from Nick Arndt, Dan Edelstein, Rich Goldfarb, Jane Hammarstrom, Simon Jowitt, Jon Price and Brian Skinner, as well as formal reviews by John DeYoung and Jeff Hedenquist. We thank all reviewers for their insights, but any shortcomings of the final manuscript are solely the responsibility of the authors.

Author Contributions

L. Meinert received the original invitation to write the paper and wrote the bulk of the text. G. Robinson wrote the analysis of the USGS study of undiscovered copper resources. N. Nassar wrote the sections dealing with recycling and substitution, as well as doing the analysis for and creating Figure 2.

Conflicts of Interest

The authors declare no conflict of interest.

Abbreviations

The following abbreviations are frequently used in this manuscript:
Bt
billion metric tons
CRIRSCO
Committee for Mineral Reserves International Reporting Standards
Cu
copper
GDP
gross domestic production
JORC
Australian Joint Ore Reserves Committee
Mt
million metric tons
SAMREC
South African Mineral Resource Committee
USGS
U.S. Geological Survey

References

  1. Malthus, T.R. An Essay on the Principle of Population; J. Johnson: London, UK, 1798. [Google Scholar]
  2. Meadows, D.H.; Meadows, D.L.; Randers, J.; Behrens, W.W. The Limits to Growth; Universe Books: New York, NY, USA, 1972. [Google Scholar]
  3. Gordon, R.; Koopmans, T.C.; Nordhaus, W.D.; Skinner, B.J. Toward a New Iron Age? Quantitative Modeling of Resource Exhaustion; Harvard University Press: Cambridge, MA, USA, 1987. [Google Scholar]
  4. Ayres, R.U. Cowboys, cornucopians and long-run sustainability. Ecol. Econ. 1993, 8, 189–207. [Google Scholar] [CrossRef]
  5. Deffeyes, K.S. Hubbert's Peak—The Impending World Oil Shortage; Princeton University Press: Princeton, NJ, USA, 2001. [Google Scholar]
  6. Deffeyes, K.S. Beyond Oil—The View from Hubbert's Peak; Farrar, Straus and Giroux: New York, NY, USA, 2005. [Google Scholar]
  7. Gordon, R.B.; Bertram, M.; Graedel, T.E. Metal stocks and sustainability. Proc. Natl. Acad. Sci. USA 2006, 103, 1209–1214. [Google Scholar] [CrossRef] [PubMed]
  8. Prior, T.; Giurco, D.; Mudd, G.; Mason, L.; Behrisch, J. Resource depletion, peak minerals and the implications for sustainable resource management. Glob. Environ. Chang. 2012, 22, 577–587. [Google Scholar] [CrossRef]
  9. Northey, S.; Mohr, S.; Mudd, G.; Weng, Z.; Giurco, D. Modelling future copper ore grade decline based on a detailed assessment of copper resources and mining. Resour. Conserv. Recycl. 2014, 83, 190–201. [Google Scholar] [CrossRef]
  10. Ragnarsdottir, K.V.; Sverdrup, H.U. Limits to growth revisited. Geoscientist 2015, 25, 10–16. [Google Scholar]
  11. Blondel, F.; Lasky, S.G. Mineral reserves and mineral resources. Econ. Geol. 1956, 51, 686–697. [Google Scholar] [CrossRef]
  12. U.S. President's Materials Policy Commission (The Paley Commission). Resources for Freedom—Foundations for Growth and Security; U.S. Government Printing Office: Washington, DC, USA, 1952; Volume I.
  13. Hubbert, M.K. Energy Resources. In Resources and Man; Cloud, P., Ed.; W.H. Freeman: San Francisco, CA, USA, 1969; pp. 157–239. [Google Scholar]
  14. DeYoung, J.H.J.; Singer, D.A. Physical Factors that Could Restrict Mineral Supply. In Economic Geology 75th Anniversary Volume, 1905–1980; Skinner, B.J., Ed.; Lancaster Press, Inc.: Lancaster, PA, USA, 1981; pp. 939–954. [Google Scholar]
  15. Simon, J.L. The Ultimate Resource 2; Princeton University Press: Princeton, NJ, USA, 1998. [Google Scholar]
  16. Lomborg, B. The Skeptical Environmentalist; Cambridge University Press: Cambridge, UK, 2001. [Google Scholar]
  17. Beckerman, W. A Poverty of Reason—Sustainable Development and Economic Growth; The Independent Institute: Oakland, CA, USA, 2003. [Google Scholar]
  18. Tilton, J.E. Depletion and the Long-Run Availability of Mineral Commodities. In Wealth Creation in the Minerals Industry: Integrating Science, Business, and Education; Special Publication, No. 12; Doggett, M.D., Parry, J.R., Eds.; Society of Economic Geologists, Inc.: Easton, MD, USA, 2006; pp. 61–70. [Google Scholar]
  19. Tilton, J.E. Is Mineral Depletion a Threat to Sustainable Mining? Available online: http://inside.mines.edu/UserFiles/File/economicsBusiness/Tilton/Sustainable_Mining_Paper.pdf (accessed on 23 February 2016).
  20. Strauss, S.D. Trouble in the Third Kingdom—Minerals industry in transition; Mining Journal Books: London, UK, 1986. [Google Scholar]
  21. Sabin, P. The Bet; Yale University Press: New Haven, CT, USA, 2013. [Google Scholar]
  22. Hewett, D.F. Cycles in Metal Production. In Transactions of the American Institute of Mining and Metallurgical Engineers Yearbook; American Institute of Mining and Metallurgical Engineers: Littleton, CO, USA, 1929; pp. 65–98. [Google Scholar]
  23. The Economist The end of the Oil Age. Available online: http://www.economist.com/node/2155717/print (accessed on 2 February 2016).
  24. Bryant, J. 3:59.4—The Quest to Break the 4 Minute Mile; Hutchinson: London, UK, 2005. [Google Scholar]
  25. Cohen, D. Earth audit. New Sci. 2007, 26, 34–41. [Google Scholar] [CrossRef]
  26. Sackett, P.D. Endangered Elements—Conserving the Building Blocks of Life. In Creating a Sustainable and Desirable Future; Costanza, R., Kubiszewski, I., Eds.; World Scientific Publishing Co.: Singapore, 2014; pp. 239–248. [Google Scholar]
  27. Joint Ore Reserves Committee (JORC). Australasian Code for Reporting of Exploration Results, Mineral Resources and ore Reserves (The JORC Code); Joint Ore Reserves Committee (JORC): Carlton South, Australia, 2012. [Google Scholar]
  28. South African Mineral Resource Committee (SAMREC). South African Code for Reporting of Mineral Resources and Mineral Reserves (The SAMREC Code); South African Institute of Mining and Metallurgy: Johannesburg, South Africa, 2000. [Google Scholar]
  29. CIM Standing Committee on Reserve Definitions. CIM Definition Standards on Mineral Resources and Mineral Reserves; The Canadian Institute of Mining, Metallurgy and Petroleum: Westmount, QC, Canada, 2004. [Google Scholar]
  30. CRIRSCO (The Committee for Mineral Reserves International Reporting Standards). International Reporting Template for the Public Reporting of Exploration Results, Mineral Resources and Mineral Reserves; CRIRSCO: London, UK, 2013. [Google Scholar]
  31. U.S. Bureau of Mines; U.S. Geological Survey. Principles of a Resource/Reserve Classification for Minerals; U.S. Geological Survey Circular 831: Reston, VA, USA, 1980.
  32. United Nations Economic Commission for Europe. Framework Classification for Fossil Energy and Mineral Resources; United Nations Economic Commission for Europe: Geneva, Switzerland, 2003. [Google Scholar]
  33. Institute of Mining Engineers of Chile (IIMCh). Code for the Certification of Exploration Prospects, Mineral Resources and Ore Reserves; Institute of Mining Engineers of Chile: Santiago, Chile, 2004. [Google Scholar]
  34. The State Bureau of Quality and Technical Supervision. Classification for Resources/Reserves of Solid Fuels and Mineral Commodities (National Standards GB/T17766–1999); Chinese Standard Publishing House: Beijing, China, 1999.
  35. Joint Committee of the Venture Capital Segment of the Lima Stock Exchange. Code for Reporting on Mineral Resources and Ore Reserves; Bolsa de Valores de Lima (Lima Stock Exchange): Lima, Peru, 2003. [Google Scholar]
  36. Diatchkov, S. Principles of classification of reserves and resources in the CIS countries. Min. Eng. 1994, 46, 214–217. [Google Scholar]
  37. Jakubiak, Z.; Smakowski, T. Classification of mineral reserves in former Comecon countries. Geol. Soc. Lond. Spec. Publ. 1994, 79, 17–28. [Google Scholar] [CrossRef]
  38. U.S. Securities and exchange commission. Industry Guide 7—Description of Property by Issuers Engaged or to Be Engaged in Significant Mining Operations; U.S. Securities and exchange commission: Washington, DC, USA, 2016. [Google Scholar]
  39. SEC Reserves Working Group of SME Resources and Reserves Committee. Recommendations concerning Estimation and Reporting of Mineral Resources and Mineral Reserves, Prepared for Submission to the United States Securities and Exchange Commission; The Society for Mining, Metallurgy and Exploration, Inc.: Engelwood, CO, USA, 2005. [Google Scholar]
  40. Doggett, M.D. Global Mineral Exploration and Production—The Impact of Technology. In Proceedings for a Workshop on Deposit Modeling, Mineral Resource Assessment, and Their Role in Sustainable Development; Briskey, J.A., Schultz, K.J., Eds.; U.S. Geological Survey: Reston, VA, USA, 2007; pp. 63–68. [Google Scholar]
  41. Tilton, J.E. Assessing the long-run availability of copper. Resour. Policy 2007, 32, 19–23. [Google Scholar] [CrossRef]
  42. Kelly, T.; Buckingham, D.; DiFrancesco, C.; Porter, K.; Goonan, T.; Sznopek, J.; Berry, C.; Crane, M. Historical Statistics for Mineral Commodities in the United States; Open-File Report 01–006; U.S. Geological Survey: Reston, VA, USA, 2005. [Google Scholar]
  43. U.S. Geological Survey. Mineral Commodity Summaries 2016; U.S. Geological Survey: Reston, VA, USA, 2016.
  44. Hubbert, M.K. Energy Resources—A Report to the Committee on Natural Resources; National Academy Press: Washington, DC, USA, 1962. [Google Scholar]
  45. Kerr, R.A. Peak oil production may already be here. Science 2011, 331, 1510–1511. [Google Scholar] [CrossRef] [PubMed]
  46. Harris, D.P. Conventional crude oil resources of the United States—Recent estimates, methods for estimation and policy considerations. Mater. Soc. 1977, 1, 263–286. [Google Scholar]
  47. U.S. Energy Information Administration (EIA). Petroleum and Other Liquids. Available online: http://www.eia.gov/petroleum/data.cfm#crude (accessed on 23 February 2016).
  48. Barnett, H.J.; Morse, C. Scarcity and Growth—The Economics of Natural Resource Availability; Resources for the Future: Washington, DC, USA, 1963. [Google Scholar]
  49. Smith, V.K. Scarcity and Growth—Reconsidered; Resources for the Future: Washington, DC, USA, 1979. [Google Scholar]
  50. Simpson, D.R.; Toman, M.A.; Ayres, R.U. Scarcity and Growth Revisted; Resources for the Future: Washington, DC, USA, 2005. [Google Scholar]
  51. Nickless, E.; Bloodworth, A.; Meinert, L.; Giurco, D.; Mohr, S.; Littleboy, A. Resourcing Future Generations White Paper—Mineral Resources and Future Supply; International Union of Geological Sciences: Paris, France, 2014. [Google Scholar]
  52. Graedel, T.E.; Harper, E.M.; Nassar, N.T.; Reck, B.K. On the materials basis of modern society. Proc. Natl. Acad. Sci. USA 2015, 112, 6295–6300. [Google Scholar] [CrossRef] [PubMed]
  53. Mudd, G.M.; Weng, Z.; Jowitt, S.M. Assessment of global Cu resource trends and endowments. Econ. Geol. 2013, 108, 1163–1183. [Google Scholar] [CrossRef]
  54. Johnson, K.M.; Hammarstrom, J.M.; Zientek, M.L.; Dicken, C.L. Estimate of Undiscovered Copper Resources of the World; U.S. Geological Survey: Reston, VA, USA, 2014. [Google Scholar]
  55. Kerr, R.A. The coming copper peak. Science 2014, 343, 722–724. [Google Scholar] [CrossRef] [PubMed]
  56. U.S. Geological Survey Copper Statistics. In Historical Statistics for Mineral and Material Commodities in the United States. Data Series 140; Kelly, T.D.; Matos, G.R. (Eds.) U.S. Geological Survey: Reston, VA, USA, 2014.
  57. Gordon, R.B. Production residues in copper technological cycles. Resour. Conserv. Recycl. 2002, 36, 87–106. [Google Scholar] [CrossRef]
  58. U.S. Census Bureau International Data Base. Available online www.census.gov/population/international/data/idb/informationGateway.php (accessed on 23 February 2016).
  59. Menzie, W.D.; DeYoung, J.H., Jr.; Steblez, W.G. Some Implications of Changing Patterns of Mineral Consumption; U.S. Geological Survey Open-File Report 03–382; U.S. Geological Survey: Reston, VA, USA, 2003. [Google Scholar]
  60. Graedel, T.E.; Cao, J. Metal spectra as indicators of development. Proc. Natl. Acad. Sci. 2010, 107, 20905–20910. [Google Scholar] [CrossRef] [PubMed]
  61. Graedel, T.E.; van Beers, D.; Bertram, M.; Fuse, K.; Gordon, R.B.; Gritsinin, A.; Kapur, A.; Klee, R.J.; Lifset, R.J.; Memon, L.; et al. Multilevel cycle of anthropogenic copper. Environ. Sci. Technol. 2004, 38, 1242–1252. [Google Scholar] [CrossRef] [PubMed]
  62. Kesler, S.E. Mineral supply and demand into the 21st century. In Proceedings for a Workshop on Deposit Modeling, Mineral Resource Assessment, and Their Role in Sustainable Development. Circular 1294; U.S. Geological Survey: Reston, VA, USA, 2007; pp. 55–62. [Google Scholar]
  63. International Copper Study Group. ICSG 2015 Statistical Yearbook; International Copper Study Group: Lisbon, Portugal, 2015. [Google Scholar]
  64. World Bank Open Data. Available online: http://data.worldbank.org/ (accessed on 23 February 2016).
  65. Graedel, T.E.; Allwood, J.; Birat, J.P.; Buchert, M.; Hagelüken, C.; Reck, B.K.; Sibley, S.F.; Sonnemann, G. What do we know about metal recycling rates? J. Ind. Ecol. 2011, 15, 355–366. [Google Scholar] [CrossRef]
  66. Hein, J.R.; Mizell, K.; Koschinsky, A.; Conrad, T.A. Deep-ocean mineral deposits as a source of critical metals for high- and green-technology applications—comparison with land-based resources. Ore Geol. Rev. 2013, 51, 1–14. [Google Scholar] [CrossRef]
  67. Cathles, L.M. A Path Forward. Available online: https://www.segweb.org/pdf/views/2010/08/SEG-Newsletter-Views-Lawrence-Cathles.pdf (accessed on 23 February 2016).
  68. Robinson, G.R. J.; Menzie, W.D. Economic Filters for Evaluating Porphyry Copper Deposit Resource Assessments Using Grade-Tonnage Deposit Models, with Examples from the U.S. Geological Survey Global Mineral Resource Assessment; U.S. Geological Survey Scientific Investigations Report 2010–5090–H; U.S. Geological Survey: Reston, VA, USA, 2012. [Google Scholar]
  69. Kesler, S.; Wilkinson, B.H. Earth's copper resources estimated from tectonic diffusion of porphyry copper deposits. Geology 2008, 36, 255–258. [Google Scholar] [CrossRef]
  70. Gerst, M.D.; Graedel, T.E. In-Use Stocks of Metals: Status and Implications. Environ. Sci. Technol. 2008, 42, 7038–7045. [Google Scholar] [CrossRef] [PubMed]
  71. Graedel, T.E.; Dubreuil, A.; Gerst, M.D.; Hashimoto, S.; Moriguchi, Y.; Müller, D.; Pena, C.; Rauch, J.; Sinkala, T.; Sonnemann, G. Metal Stocks in Society—Scientific Synthesis; United Nations Environment Programme: Paris, France, 2010. [Google Scholar]
  72. Ciacci, L.; Reck, B.K.; Nassar, N.T.; Graedel, T.E. Lost by design. Environ. Sci. Technol. 2015, 49, 9443–9451. [Google Scholar] [CrossRef] [PubMed]
  73. Nassar, N.T. Limitations to elemental substitution as exemplified by the platinum-group metals. Green Chem. 2015, 17, 2226–2235. [Google Scholar] [CrossRef]
  74. Vidal, O.; Goffé, B.; Arndt, N. Metals for a low-carbon society. Nat. Geosci. 2013, 6, 894–896. [Google Scholar] [CrossRef]
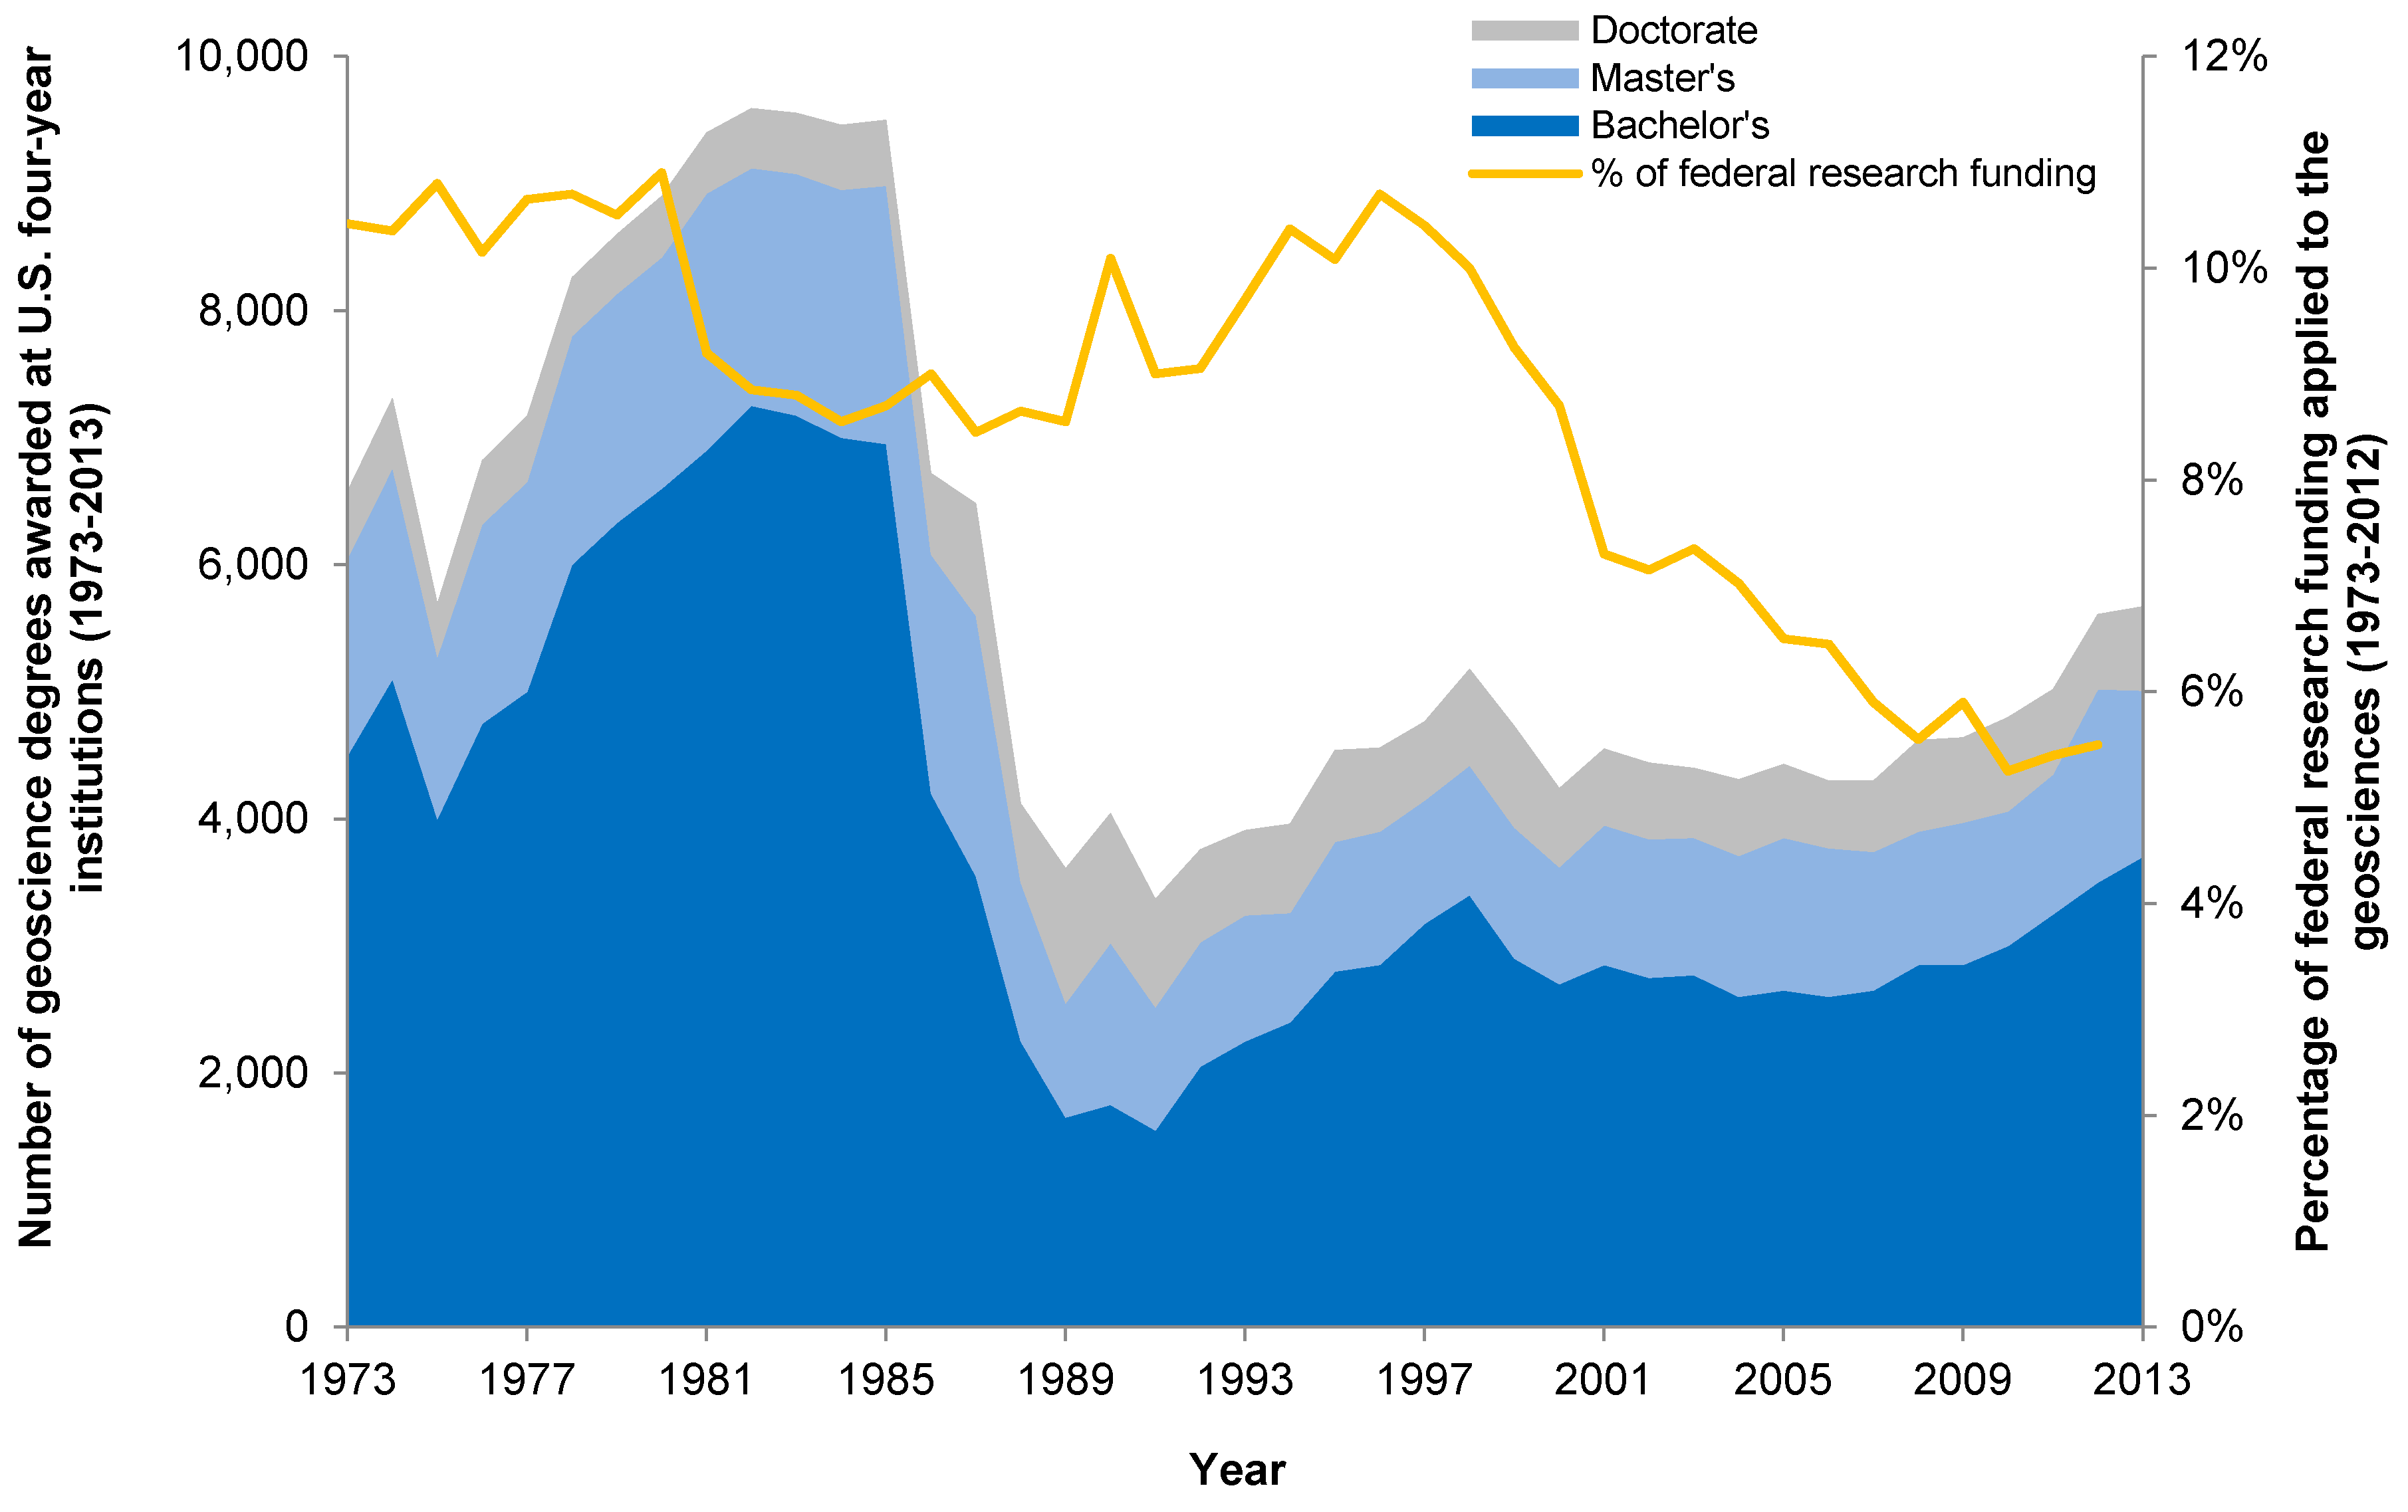
  75. Wilson, C. Status of the Geoscience Workforce 2014; American Geosciences Institute: Washington, DC, USA, 2014. [Google Scholar]
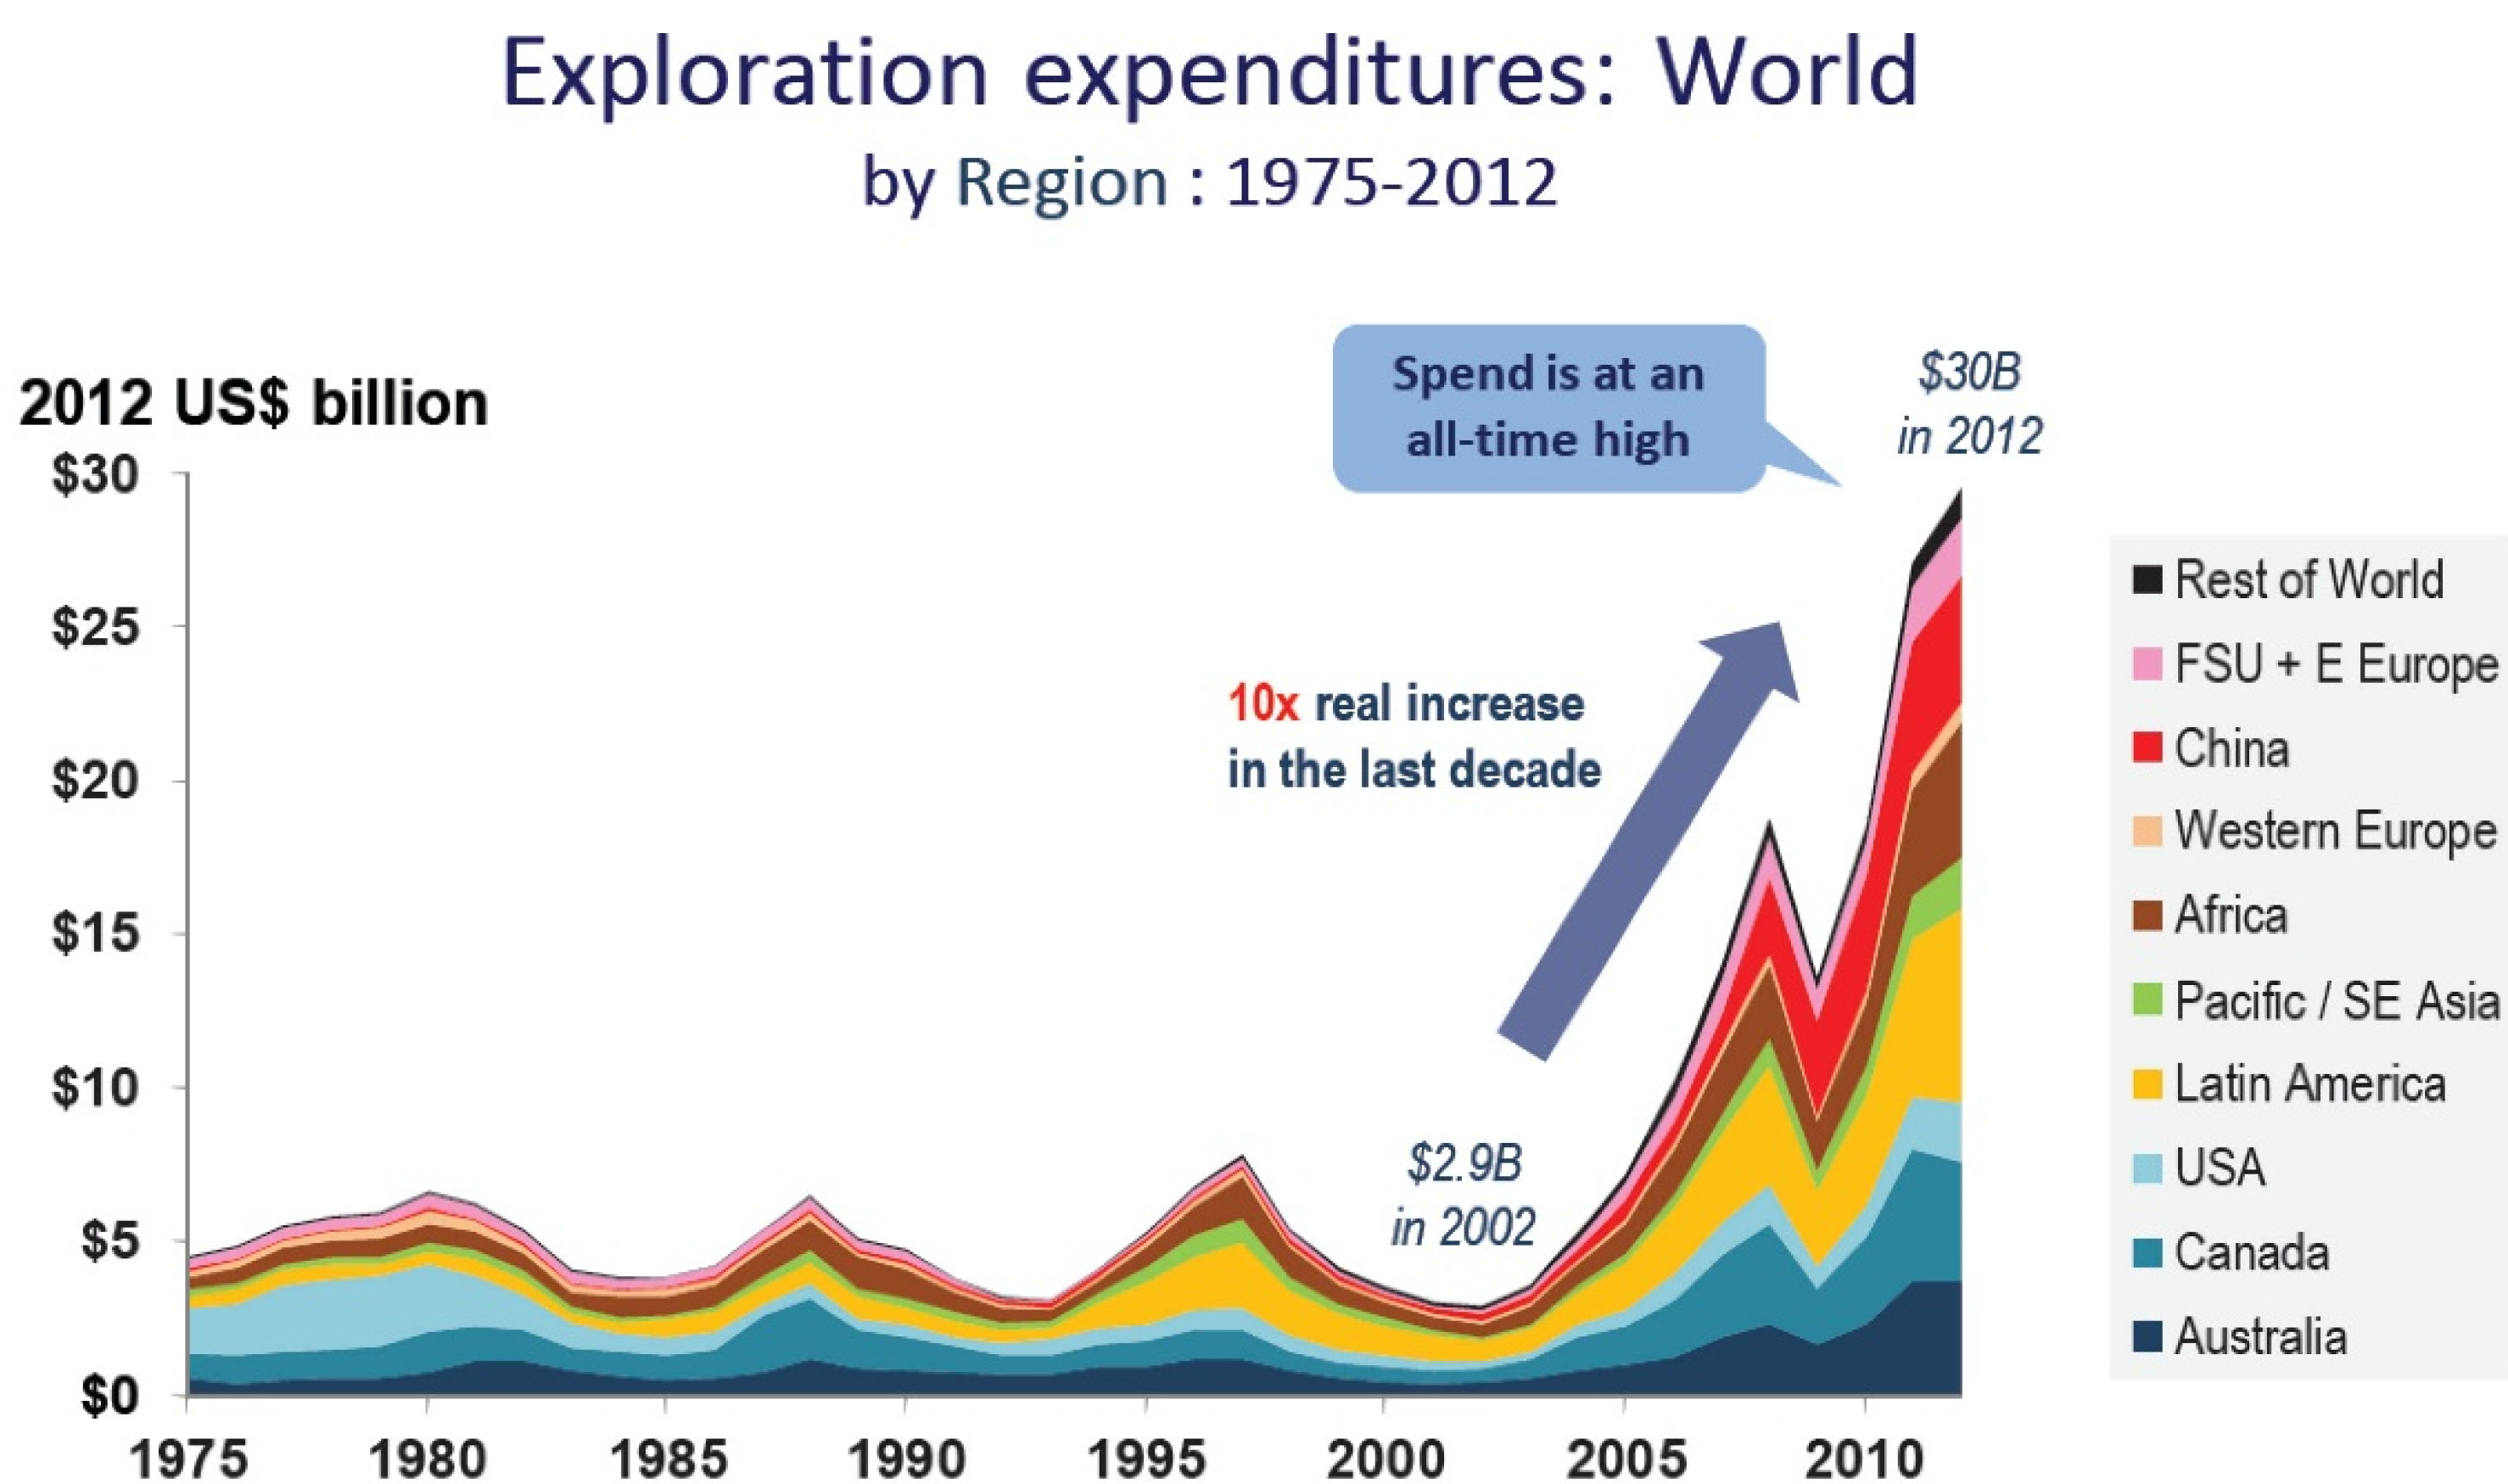
  76. Schodde, R.C. The Impact of Commodity Prices and Other Factors on the Level of Exploration; Centre for Exploration Targeting, University of Western Australia: Perth, Australia, 2013. [Google Scholar]
Figure 1. U.S. crude oil reserves and production showing apparent “peak oil” for conventional petroleum reserves in 1972 and growth in reserves in the past ~10 years as a result of the application of new drilling technology. U.S. barrels are equivalent to approximately 0.159 cubic meters. Data source: [47].
Resources 05 00014 g001
Figure 2. Trends in cumulative (A); annual (B); per capita (C); per constant 2005 US$ gross domestic production (GDP) (D); copper production on an absolute basis and normalized to one for values in year 1960 (E,F). Data sources: [56,57] for copper production; [58] for world population; [64] for GDP data. Data presented up to year 2015, except for those involving GDP for which the year 2014 is the most recently available.
Resources 05 00014 g002aResources 05 00014 g002b
Figure 3. World copper production: historical and projected based on the modeling in [9].
Resources 05 00014 g003
Figure 4. Geoscience degrees granted by year and U.S. Federal funding of geoscience as a percentage of total research spending. Copyright 2014 American Geosciences Institute and modified with their permission [75].
Resources 05 00014 g004
Figure 5. World exploration expenditure. Source: [76].
Resources 05 00014 g005
Table 1. Mineral resource and reserve classifications.
GuidelinesResource/Reserve Classification
U.S. Geological SurveyU.S. Bureau of Mines and U.S. Geological Survey, 1980, Principles of a resource/reserve classification for minerals: U.S. Geological Survey Circular 831, p. 5 [31]
InternationalCRIRSCO (the Committee for Mineral Reserves International Reporting Standards), a committee of the National Mineral Reserve Reporting Organizations of Australia, Canada, Chile, South Africa, USA, U.K./Ireland and Western Europe has prepared the CRIRSCO International Reporting Template drawing on CRIRSCO-style reporting standards, the JORC Code (Australasia), SAMREC Code (South Africa), Reporting Code (U.K./Ireland/Western Europe), Canadian Institute of Mining, Metallurgy, and Petroleum (CIM) Definition Standards and Guidelines (Canada), Society for Mining, Metallurgy, & Exploration (SME) Guide (USA) and Certification Code (Chile). (URL: http://www.crirsco.com) [30]
United NationsUnited Nations Economic Commission for Europe, 2003, Framework Classification for Fossil Energy and Mineral Resources: United Nations Economic Commission for Europe, Geneva [32]
AustraliaJoint Ore Reserves Committee of The Australasian Institute of Mining and Metallurgy, Australian Institute of Geoscientists and Minerals Council of Australia (JORC), 2004; Australasian Code for Reporting of Exploration Results, Mineral Resources and Ore Reserves: The Australasian Institute of Mining and Metallurgy [27]
CanadaCIM Standing Committee on Reserve Definitions, 2004, CIM Definition Standards on Mineral Resources and Mineral Reserves: The Canadian Institute of Mining, Metallurgy and Petroleum [29]
ChileInstitute of Mining Engineers of Chile (IIMCh), 2004; Code for the Certification of Exploration Prospects, Mineral Resources and Ore Reserves, 2004: Institute of Mining Engineers of Chile [33]
ChinaThe State Bureau of Quality and Technical Supervision, 1999 Classification for Resources/Reserves of Solid Fuels and Mineral Commodities (National Standards GB/T17766-1999): Beijing: Chinese Standard Publishing House [34]
PeruJoint Committee of the Venture Capital Segment of the Lima Stock Exchange, 2003, Code for Reporting on Mineral Resources and Ore Reserves: Bolsa de Valores de Lima (Lima Stock Exchange) [35]
South AfricaSouth African Mineral Resource Committee (SAMREC), 2000, South African Code for Reporting of Mineral Resources and Mineral Reserves (The SAMREC Code): South African Institute of Mining and Metallurgy [28]
Soviet Union, CIS, COMECON countriesDiatchkov, Sergei, 1994, Principles of classification of reserves and resources in the CIS countries: Mining Engineering, v. 46, No. 3, p. 214–217 [36]
Jakubiak, Z., and Smakowski, T., 1994, Classification of mineral reserves in former Comecon countries: Geological Society of London, Special Publications, v. 79, p. 17–28 [37]
United StatesLegally-required system for reporting reserves by publicly-traded companies Securities and Exchange Commission—Description of Property by Issuers Engaged or to Be Engaged in Significant Mining Operations Guide 7 [38]
Proposed classification
U.S. Securities and Exchange Commission (SEC) Reserves Working Group of SME Resources and Reserves Committee, 2005, Recommendations Concerning Estimation and Reporting of Mineral Resources and Mineral Reserves, Prepared for Submission to the United States Securities and Exchange Commission: The Society for Mining, Metallurgy and Exploration, Inc. [39]

