Article

Characterization of Grain Amaranth (Amaranthus spp.) Germplasm in South West Nigeria Using Morphological, Nutritional, and Random Amplified Polymorphic DNA (RAPD) Analysis

by
Pamela E. Akin-Idowu
1,
Michael A. Gbadegesin
2,
Uterdzua Orkpeh
3,*,
Dorcas O. Ibitoye
1,4 and
Oyeronke A. Odunola
2
1
Biotechnology Unit, National Horticultural Research Institute, P.M.B. 5432, Idi-Ishin, Ibadan 200272, Nigeria
2
Cancer Research and Molecular Biology Laboratories, Department of Biochemistry, College of Basic Medical Sciences, University of Ibadan, Ibadan 200284, Nigeria
3
Genetic Resources Unit, National Horticultural Research Institute, P.M.B. 5432, Idi-Ishin, Ibadan 200272, Nigeria
4
West Africa Center for Crop Improvement (WACCI), University of Ghana, Legon, Accra PMB 30 LG, Ghana
*
Author to whom correspondence should be addressed.
Submission received: 29 October 2015 / Revised: 6 January 2016 / Accepted: 18 January 2016 / Published: 26 January 2016

Abstract

:
Efficient utilization of plant genetic resources for nutrition and crop improvement requires systematic understanding of the important traits. Amaranthus species are distributed worldwide with an interesting diversity of landraces and cultivars whose leaves and seeds are consumed. Despite their potential to enhance food security and economic livelihoods, grain amaranth breeding to improve nutritional quality and adoption by farmers in sub-Saharan Africa is scanty. This study assessed the variation among 29 grain amaranth accessions using 27 phenotypic (10 morphological and 17 nutritional) characters and 16 random amplified polymorphic DNA (RAPD) primers. Multivariate analysis of phenotypic characters showed the first four principal components contributing 57.53% of observed variability, while cluster analysis yielded five groups at 87.5% similarity coefficient. RAPD primers generated a total of 193 amplicons with an average of 12.06 amplicons per primer, 81% of which were polymorphic. Genetic similarities based on Jaccard’s coefficient ranged from 0.61 to 0.88. The RAPD-based unweighted pair group method with arithmetic mean dendrogram grouped the accessions into nine clusters, with the same species clustering together. RAPD primers distinguished the accessions more effectively than phenotypic markers. Accessions in the different clusters as obtained can be exploited for heterotic gain in desired nutritional traits.

1. Introduction

Amaranthus L. is a genus in the family Amaranthaceae consisting of more than 60 species, including cultivated grain amaranth species (e.g., A. caudatus, A. cruentus, and A. hypochondriacus) and leaf vegetable types (e.g., A. hybridus and A. tricolor) [1,2]. They are relatively short-lived annuals that grow vigorously, are drought resistant and adapt readily to new environments [3]. The major centers of distribution are tropical America, India, China, Nepal, Italy, Greece, Africa, and Australia [4,5]. Amaranths are ancient crops with promising economic and nutritional value and have attracted increasing interest over recent decades [6,7,8]. Grain amaranth has been gaining worldwide acceptance as a crop rich in high-quality protein (13%–19% of dry weight) and its remarkable essential amino acid balance which is close to the optimum protein reference pattern in the human diet according to FAO/WHO requirements [9,10,11]. Grain amaranth is also an excellent source of minerals, vitamins A, C, and E [12,13,14]. Considering its agronomic and nutritional importance, amaranth has potential to broaden the food base in sub-Saharan Africa [15]; therefore, attention should be given to the cultivation, genetic improvement, and sustainable utilization of this promising crop in the region.
Amaranth is a self-pollinated crop, but wide variation in genotypes exists due to varying amounts of outcrossing and frequent interspecific and inter-varietal hybridization [1,16]. Amaranths also exhibit tremendous diversity related to their wide adaptability to different eco-geographic situations [17]. Genotype identification in amaranth had been a long term challenge [18] due to the close relationships that exists within the genus.
Knowledge of genetic diversity and trait variations in populations is useful in plant breeding and for developing ex situ conservation strategies of plant genetic resources [19,20,21]. Plant phenotype is commonly used for estimating genetic diversity as it provides a simple way of quantifying genotypic variation. However, the efficiency of estimating genetic differences using morphological traits is largely limited by uncontrollable environmental factors and distinctness. Molecular-based analyses overcome many limitations of morphological and biochemical trait-based procedures and have been used variously in determining genetic diversity [22,23]. Various types of molecular markers are utilized to evaluate DNA polymorphism. Random Amplified Polymorphic DNA (RAPD), a PCR (polymerase chain reaction)-based technique has considerable advantage for studying plant genome characterizations because it is simple, relatively inexpensive, utilizes arbitrary primers, and randomly samples a potentially large number of loci in a less complex pattern [1,24,25]. Even though RAPD is criticized for low reproducibility, this is overcome by optimization of the reaction and maintenance of stringent conditions [26,27]. RAPD analyses has been employed for several plant species in relation to development of genetic conservation and improvement strategies, including the study of genetic diversity, taxonomic delimitations, and evolutionary relationships in Amaranthus species [1,17,28,29].
Grain amaranth remains a largely underexploited crop for grain purposes in sub-Saharan Africa despite the potential as a hardy field crop with generally excellent nutritional qualities. However, research aimed at its genetic improvement and agronomic adoption in sub-Saharan Africa is almost non-existent. A number of accessions of amaranth have been introduced that have acclimatized well in the region, but evaluation of agronomic and nutritional traits in the peculiar agro-ecologies of the region has not been conducted. The availability of genetic variation among and within the different accessions for these traits provides great scope for crop improvement through selection and other breeding methods to develop desired genotypes. Thus, insight into the genetic variation within and among the available amaranth genotypes in relation to the morphological and nutritional traits as revealed by RAPD markers is necessary. Such empirical knowledge will facilitate strategic marker-assisted selection (MAS) breeding, as well as enhance effective genetic resources exploration, conservation, management, and utilization of Amaranthus species in future breeding programs.
The aim of this work was therefore to study the genetic variation observable in 29 Amaranthus accessions in the agro-ecology of South West Nigeria using phenotypic traits of agronomic and nutritional significance, and RAPD markers. The goal is to provide an insight for further utilization of RAPD markers to characterize and identify quantitative trait loci (QTLs) for agronomic and nutritional quality in amaranth genotypes bred for adoption in sub-Saharan agro-ecologies. Subsequently, RAPDs adjacent to important QTLs will be used in marker-assisted selection (MAS) of breeding lines.

2. Materials and Methods

2.1. Plant Material

Twenty nine grain amaranth accessions were used for this study. Twenty-seven accessions of A. caudatus, A. cruentus, A. hypochondriacus, and a number of hybrids were obtained from the United States Department of Agriculture Research Station (USDA/ARS) Plant Introduction Station at Ames, IA, USA. Two accessions of A. hybridus were obtained from the Genetic Resources Unit, National Horticultural Research Institute (NIHORT), Ibadan, Nigeria (Table 1).
Table 1. Accessions and passport data of Amaranthus used in this study.
Amaranthus SpeciesAccession NumberAccession IDOriginStem ColourInflorescence ColourSeed Colour
A. caudatusA1P1 490458BoliviaPink base to mid-stem and green mid-stem to tipGreenCream + black
A2PI 511679ArgentinaGreenGolden yellowCream
A3PI 553073USAPinkPinkPink
A4P1 642741BoliviaPink base to mid-stem and green mid-stem to tipGreenCream
A. cruentusA5PI 477913MexicoGreenGreenCream
A6PI 511719GuatemalaGreenGreen, Pink, Green with PinkCream
A7PI 515959USAGreenGreenCream
A8PI 538319USAGreenGreenCream
A9PI 590992ChinaWine, GreenWine, green, speckled pinkCream
A10P1 604666USAGreen, OrangeGreen, OrangeCream
A11PI 641047NigeriaPinkPinkCream
A12PI 641045NigeriaPinkPinkCream
Amaranthus HybridA13PI 538325USAPinkGreen, wineCream
A14PI 538326USAPinkGreen, wineCream
A15PI 538327USAGreenGreenCream
A16Ames 1974NigeriaGreen, PinkNormal green, with pink veins and marginBlack + Cream
A17Ames 2256NigeriaGreen, PinkNormal green, with pink veins and marginBlack + Cream
A18Ames 5644NigeriaPinkWineCream
A19Ames 5647NigeriaGreen, PinkNormal green, with pink veins and marginBlack + Cream
A. hypochondriacusA20PI 337611UgandaGreenGreenCream
A21PI 511731MexicoPinkGreenCream
A22PI 558499USAPinkWineCream
A23PI 590991ChinaPinkGreenGold
A24PI 615696IndiaGreenGreenCream
A25P1 619250USAPinkGreen, wineGold
A26PI 633596NepalPinkPinkCream
A27Ames 1972NigeriaGreenGreenCream
A. hybridusA28NH 84/444-4NigeriaPurpleGreenCream
A29NAC 3NigeriaGreenGreenCream

2.2. Phenotypic Characterization

Seeds were sown in heat-sterilized sandy loam in a protected nursery. At the 4–5 leaf stage, seedlings were transplanted to the experimental field of NIHORT, Ibadan. The experiment was a randomized complete block design with three replications. An experimental unit (plot) consisted of 10 individuals per accession planted in two rows 2 m long on 1 m-wide raised beds. Plants were spaced 50 cm apart between and within rows, with an inter-plot spacing of 1 m. Phenotypic traits were assessed on five randomly tagged plants in each plot. Phenotypic traits were, thus, assessed five times per accession per replicate giving a total of 15 observations of each accession. Cultural practices were as suggested by Van Sloten [30]. Neither chemicals nor fertilizers were used during the experiment. Weed control was by hand as and when due.
The morphological traits observed were plant height, number of leaves, number of branches per plant, stem diameter, leaf area, days to 50% flowering, grain yield, and 100-seed weight. Nutritional quality traits were determined by chemical analyses on seeds obtained at maturity, dried, and milled. Moisture, ash, starch, sugar, protein, crude fiber, and crude fat contents were determined according to the AOAC (Association of Official Agricultural Chemists) methods [31]. Minerals were determined according to Zarcinas et al. [32].
Phenotypic data were subjected to analysis of variance using the generalized linear model of SAS (Statistical Analysis System) [33]. Hierarchical cluster analysis was performed using SAS Procedure CLUSTER based on normalized Euclidean distance matrices and dendrogram was constructed by Procedure TREE. The Pearson-correlation coefficient was used to indicate the linear relationships among the traits. Principal component analysis (PCA) was computed from correlation matrices using SAS Procedure PRINCOMP in order to assess the patterns of phenotypic trait variation considering all 27 variables simultaneously.

2.3. Molecular Characterization

Total genomic DNA was isolated from fresh young leaves collected from a single plant for each of the 29 amaranth accessions using the cetyltrimethylammonium bromide (CTAB) method described by Doyle and Doyle [34]. The quality and quantity of the isolated DNA was checked using 0.8% agarose gel electrophoresis. DNA concentrations for polymerase chain reaction (PCR) amplification were estimated by comparing the band intensity of a sample with the band intensities of known dilutions that gave good amplifications. The dilutions were carried out by dissolving the genomic DNA in appropriate quantities of Tris(hydroxymethyl)aminomethane-ethylenediaminetetraacetic acid (Tris-EDTA) buffer (pH 8.0).
An initial analysis of individual plants from each accession was conducted with 40 arbitrary primers (Operon Technologies, Alameda, CA, USA). Out of the 40 random decamer primers screened for polymorphism, only 16 showed detectable distinct bands and were used for the study. DNA from the 29 accessions of amaranth was amplified in PCR using the selected primers. The PCR reaction contained 25 ng of genomic DNA, 1.5 mM of assay buffer, 0.5 mM each of 2′-deoxyadenosine-5′-triphosphate (dATP), 2′-deoxythymidine-5′-triphosphate (dTTP), 2′-deoxyguanosine-5′-triphosphate (dGTP), and 2′-deoxycytidine-5′-triphosphate (dCTP), 1.5 µM of primer, 0.25 mM MgCl2 and 0.03 units of Taq DNA polymerase. Amplifications were performed in a Peltier thermal cycler (PTC-200 DNA Engine, MJ Research, now Bio-Rad Laboratories, Inc., Hercules, CA, USA) programmed for an initial denaturation at 94 °C for 4 min, followed by 44 cycles of denaturation at 94 °C for 1 min, annealing at 37 °C for 1 min, 2 min extension at 72 °C and a final extension of 10 min at 72 °C, and then at 4 °C until storage. Amplified PCR products were electrophoresed on a 1.2% agarose gel in 1X Tris/Borate/EDTA (TBE) buffer at 100 volts for 2 h. The ethidium bromide-stained gels were documented using a gel documentation system (UVP Transilluminator M-20, Cambridge, UK). The reproducibility of the amplification products was checked twice for each polymorphic primer.
RAPD fragments with the same molecular weight and mobility were treated as identical bands, and scored for presence (1) or absence (0) across all accessions for each primer. The resulting banding matrix was subjected to cluster analysis. A pairwise genetic similarity matrix was constructed using the SIMQUAL module of SAS based on Jaccards’s coefficient [35]. Similarity coefficients were used to construct a dendrogram by the unweighted pair group method with arithmetic average (UPGMA). Sequential, hierarchical, and nested clustering (SHAN) was done using NTSYSpc version 2.1 [36]. Polymorphic information content (PIC) of the primers was determined from allele frequencies [37].

3. Results

3.1. Phenotypic Characterization

The summary of descriptive statistics for all the 27 quantitative traits is given in Table 2. There were significant differences (p < 0.05) among the amaranth accessions for morphological traits as some exhibited broad variability. High coefficient of variation was observed for leaf area (53.50%), number of leaves (39.70%), leaf width (30.80%), seed yield (26.40%), leaf length (22.40%), stem diameter (18.10%), and plant height (20.60%).
Table 2. Descriptive statistics of 27 quantitative traits of 29 accessions of amaranth.
TraitMeanLeast Significant Difference (LSD)Coefficient of Variation (CV%)MinMax
PH (cm)116.5439.2420.6060.00162.80
NB5.820.959.980.0013.19
NL103.7567.4439.7032.00185.50
SD (mm)18.225.3818.1012.6025.40
LL (cm)14.745.3922.407.5021.70
LW (cm)6.543.2930.802.7010.40
LA (cm2)54.0647.3053.5010.40113.50
DTF114.866.353.38102.67125.33
SY (g)95.5041.4226.4015.20209.94
100-SW (g)0.00670.00828.530.00360.0091
MC (g 100 g−1)10.280.412.317.4315.46
Sugar (g 100 g−1)1.620.166.220.373.10
Starch (g 100 g−1)32.670.520.9824.6348.89
Fat (g 100 g−1)6.800.322.901.4310.39
Ash (g 100 g−1)4.030.314.732.356.98
Protein (g 100 g−1)15.180.652.6211.7719.01
Crude Fiber (g 100 g−1)3.030.234.581.046.27
Al (mg kg−1)86.298.756.2117.24250.73
Fe (mg kg−1)128.4114.797.0561.66189.04
Zn (mg kg−1)49.374.635.7434.73100.07
Cu (mg kg−1)4.750.577.362.297.65
Mn (mg kg−1)101.743.702.2345.74213.73
Mg (mg kg−1)2125.1375.152.161582.112624.40
Ca (mg kg−1)1482.8687.253.60888.241980.32
K (mg kg−1)4870.41342.834.313157.0010346.60
P (mg kg−1)5162.41218.922.593531.007462.40
Se (mg kg−1)0.540.077.9001.73
Notes: PH = Plant height; NB = Number of branches; NL = Number of leaves; SD = Stem diameter; LL = Leaf length; LW = Leaf width; LA = Leaf area; DTF = Days to 50% flowering; SY = Seed yield; 100-SW = 100-seed weight; MC = moisture content.

3.2. Pearson Correlation Coefficient

Of all the correlation coefficients derived, 16 were positive and highly significant at p < 0.001 (Table 3). The highest correlation was between leaf width and leaf area (R = 0.97). Plant height correlated significantly (p < 0.001) with stem diameter, leaf area, and days to 50% flowering. Stem diameter correlated significantly (p < 0.001) with leaf area and days to 50% flowering. Seed yield exhibited significant (p < 0.01) and positive association with 100-seed weight (R = 0.62). Leaf area correlated significantly (p < 0.001) with days to 50% flowering (R = 0.69). Number of branches and number of leaves correlated negatively with most of the morphological traits.
Table 3. Pearson-correlation matrix of selected morphological characters of 29 Amaranth accessions.
CharacterPHNBNLSDLLLWLADTFSY
NB−0.451 *--------
NL−0.0070.128-------
SD0.703 ***−0.476 *0.002------
LL0.753 ***−0.566 *−0.2340.793 ***-----
LW0.651 ***−0.524 *−0.2960.661 ***0.918 ***----
LA0.712 ***−0.530 *−0.2070.740 ***0.960 ***0.973 ***---
DTF0.486 ***−0.467 *−0.1250.668 ***0.678 ***0.693 ***0.694 ***--
SY0.113 *−0.369 *−0.2300.2030.452 *0.512 *0.519 *0.208-
100-SW−0.146−0.034−0.100−0.0070.0770.1400.1650.0100.627 **
Notes: PH = Plant height, NB = Number of branches, NL = Number of leaves, SD = Stem diameter, LL = Leaf length, LW = Leaf width, LA = Leaf area, DTF = Days to 50% flowering, SY = Seed yield, 100-SW = 100-seed weight. * p < 0.05%, ** p < 0.01%, *** p < 0.001%.

3.3. Principal Component Analysis

The percentage of total variance that each phenotypic variable represents and the coefficients used in the weighted sum (loadings or eigenvectors) are presented in Table 4. The first four principal components (PCs) contributed 57.53% of the variability present among the 29 accessions for the 27 traits studied. PC1, accounting for 30.23% of the variation had leaf length, leaf area, leaf breadth, copper, plant height, stem diameter, and fat as the variables with the largest positive coefficient, while number of branches had high negative coefficient. PC2, accounting for an additional 11.87% of the total variation depicted primarily the patterns of variation in number of leaves, aluminum, iron, magnesium, phosphorus, and selenium. All variables except iron and aluminum contributed positively towards PC2. PC3 contributing 8.2% of the variability among the 29 accessions for the 27 traits had high positive coefficient of variates for crude fiber, while starch and sugar had high negative coefficients. PC4 having eigenvalue of 1.931 and contributing to 7.2% of the variability had high coefficient of variates observed for seed yield, 100-seed weight, moisture, ash, and calcium.
Table 4. Eigenvalues, proportion of variability and phenotypic traits contributing to first four principal components of Amaranthus species.
ItemPC1PC2PC3PC4
Eigen value8.16203.2072.2131.931
% variance0.30230.1190.0820.072
Cumulative variance0.30230.4210.5030.575
TraitCoefficient of Variates
Plant Height (cm)0.2620.0360.225−0.155
Number of Branches−0.224−0.1170.1450.071
Number of Leaves−0.0760.2980.1660.004
Stem Diameter (mm)0.2660.0750.232−0.172
Leaf Length (cm)0.321−0.0090.113−0.041
Leaf Breadth (cm)0.318−0.0320.028−0.020
Leaf Area (cm2)0.3260.0180.074−0.001
Days to 50% Flowering0.2370.0980.163−0.087
Seed Yield (g)0.181−0.103−0.2450.356
100-Seed Weight (g)0.040−0.125−0.2290.346
Moisture (g 100 g−1)0.073−0.186−0.010−0.374
Sugar (g 100 g−1)−0.062−0.043−0.414−0.212
Starch (g 100 g−1)−0.084−0.154−0.427−0.314
Fat (g 100 g−1)0.231−0.049−0.0310.064
Ash (g 100 g−1)−0.1970.0870.2360.381
Protein (g 100 g−1)0.1390.0530.0170.163
Crude Fiber (g 100 g−1)0.073−0.2080.276−0.044
Al (mg kg−1)−0.175−0.3060.1370.148
Fe (mg kg−1)0.055−0.4100.181−0.084
Zn (mg kg−1)0.219−0.083−0.0440.184
Cu (mg kg−1)0.2800.170−0.0640.042
Mn (mg kg−1)0.145−0.117−0.1730.178
Mg (mg kg−1)−0.1330.372−0.020−0.179
Ca (mg kg−1)0.0460.258−0.0350.290
K (mg kg−1)−0.1560.1570.0310.075
P (mg kg−1)−0.1680.2870.214−0.069
Se (mg kg−1)0.1280.3450.252−0.007

3.4. Cluster Analysis Based on Phenotypic Characters

Using the k-means non-hierarchical clustering, the amaranth accessions could be broadly divided into three groups at 85% similarity coefficient, and further into five clusters at 87.5% similarity coefficient as shown in the dendrogram (Figure 1). The mean values of accessions falling in each cluster are presented in Table 5. Cluster 1 included three accessions (A1, A3, and A21) having the highest mean values for moisture (12.37 g 100 g−1) and iron (164.94 mg·kg−1). In this group, mean values for seed weight, seed yield, protein, zinc, magnesium, and calcium were lowest. Additionally, the mean value for days to 50% flowering was highest, indicating late maturity. Cluster II comprised of ten accessions (A2, A20, A22, A24, A25, A26, A14, A15, A27, and A29) having high mean values for number of branches per plant (8.69), starch content (36.55 g 100 g−1) and lowest mean value for days to 50% flowering (110.36) indicating that they are early maturing. Cluster III comprising of 14 accessions (A4, A16, A19, A18, A13, A5, A17, A6, A7, A8, A9, A10, A12, and A28) had the highest mean values for protein (15.91%), selenium (0.76 mg·kg−1), and the lowest mean value for aluminum and iron. Cluster IV, having only one accession (A11) in its group, had the highest mean value for plant height (162.76 cm), stem diameter (23.86 cm), leaf length, leaf breadth, leaf area, seed yield, fat, crude fiber, zinc, copper, and manganese content. Accession A11 had the lowest mean value for number of branches, number of leaves, sugar, starch, ash, magnesium, potassium, and phosphorus. Cluster V, comprising only one accession (A23), was separated from other clusters owing to its high mean values for number of leaves per plant (171.95), 100-seed weight (0.0091 g), sugar, ash, aluminum, magnesium, calcium, potassium, and phosphorus. It had lowest mean values for plant height, stem diameter, leaf length, leaf breadth, leaf area, moisture, fat, fiber, and copper.
Figure 1. Dendrogram of 29 accessions of amaranth based on phenotypic data.
Resources 05 00006 g001
Table 5. Cluster analysis for 27 phenotypic traits in 29 accessions of amaranth.
TraitCluster (Number of Accessions)
I (3)II (10)III (14)IV (1)V (1)
Plant Height (cm)126.4497.56127.74162.7671.65
Branches Per Plant4.828.694.013.537.75
Leaves Per Plant121.1687.24109.1372.95171.95
Stem Diameter (cm)21.3815.1819.6423.8613.66
Leaf Length (cm)16.5312.0316.3121.587.46
Leaf Width (cm)7.045.317.349.942.74
Leaf Area (cm2)63.2033.9165.37113.4810.37
Days to 50% Flowering119.22110.36117.21116.67112
Seed Yield (g Per Plant)45.8584.96108.96158.8798.07
100-Seed Weight (g)0.00580.00680.00660.00770.0091
Moisture ( g 100 g−1)12.3711.1210.639.247.43
Sugar (g 100 g−1)1.851.691.550.732.07
Starch (g 100 g−1)30.8336.5531.0924.9829.36
Fat (g 100 g−1)5.716.047.5010.394.46
Ash (g 100 g−1)3.684.403.782.356.47
Protein (g 100 g−1)12.8814.9215.9115.7114.01
Crude fiber (g 100 g−1)3.103.402.704.412.38
Al (mg kg−1)95.32142.1968.2868.95173.67
Fe (mg kg−1)164.94146.87120.01152.93125.43
Zn (mg kg−1)38.4245.8955.30100.0742.11
Cu (mg kg−1)4.433.345.657.172.60
Mn (mg kg−1)71.49101.04123.82130.187.33
Mg (mg kg−1)2423.172023.692083.361619.52604.2
Ca (mg kg−1)1091.721303.721555.331263.101920.22
K (mg kg−1)5691.954832.064490.813157.010,346.58
P (mg kg−1)6111.034924.444965.053530.987462.41
Se (mg kg−1)0.240.190.7600

3.5. Molecular Characterization

Amplicons in the size range from ~298 to ~3054 bp were scored for an estimation of genetic similarities among the Amaranthus accessions. A total of 193 loci were generated (Table 6), of which 36 were monomorphic (18.65%), resulting in 81.35% polymorphism. An average of 12.06 loci per primer was produced, ranging from a minimum of seven loci using primer OPG-12 (Operon Technologies, Ebersberg, Germany) to a maximum of 16 loci using primer OPV-04 (Operon Technologies). The mean polymorphic information content (PIC) was 0.872, ranging from 0.739 to 0.923. The mean PIC score was greater than 0.872 for 68.75% of the RAPD primers. The lowest and the highest PIC values were recorded for primer OPG-12 and OPH-17 (Operon Technologies), respectively. The PIC value provides an estimate of the discriminatory power of a marker by taking into account not only the number of alleles at a locus but also the relative frequencies of these alleles. The extent of RAPD polymorphism can be observed among the amaranth accessions using primer OPT-08 (Operon Technologies, Figure 2).
The similarity matrix in Table 7 shows estimated genetic similarities among all the 29 accessions of amaranth based on the RAPD banding pattern. High correlations were observed as the similarity coefficients ranged from 0.61 to 0.89. The UPGMA dendrogram revealed two major clusters and nine sub-clusters (Figure 3). The dendrogram reflects that in spite of the apparent phenotypic similarities between some accessions, RAPD markers were able to detect sufficient polymorphisms to also distinguish them.
At 77.4% coefficient of similarity the dendrogram can be observed to have nine clusters. Accessions A28 and A29 appear to be genetically similar, clustering together at 89% similarity coefficient. These two accessions were obtained from NIHORT germplasm. Percentages of RAPD polymorphism were found to be 41.97%, 48.19%, 61.14%, 66.32% and 10.88% within accessions of A. caudatus, A. cruentus, A. hybrid, A. hypochondriacus, and A. hybridus, respectively (Table 8).
Table 6. RAPD Polymorphism among 29 accessions of amaranth.
PrimerSequence 5′-3′Total No. of FragmentsPolymorphic FragmentsPolymorphism (%)Polymorphic Information Content (PIC)
OPT-08AACGGCGACA121083.330.904
OPV-10GGACCTGCTG13861.540.909
OPB-17AGGGAACGAG1010100.000.893
OPQ-07CCCCGATGGT151173.330.901
OPV-9TGTACCCGTC121191.670.831
OPU-13GGCTGGTTCC12866.670.893
OPU-14TGGGTCCCTC141285.710.897
OPH-12ACGCGCATGT10660.000.857
OPH-17CACTCTCCTC141178.570.923
OPR-02CACAGCTGCC8450.000.797
OPI-09TGGAGAGCAG12975.000.883
OPV-19GGGTGTGCAG11981.820.896
OPG-12CAGCTCACGA7571.430.739
OPV-04CCCCTCACGA1616100.000.899
OPI-10ACAACGCGAG1212100.000.812
OPI-06AAGGCGGCAG1515100.000.913
Total-1931571279.0713.947
Mean-12.069.8179.940.872
Figure 2. RAPD profiles of 29 amaranth accessions using primer OPT-08 (Lane “M” is 1 kb ladder marker DNA. Lanes 1–29 are the amaranth accessions.
Resources 05 00006 g002
Figure 3. UPGMA-based dendrogram derived from RAPD analyses of 29 Amaranth accessions.
Resources 05 00006 g003
Table 7. Similarity matrix of 29 Amaranthus accessions based on Jaccard’s similarity coefficient.
A1A2A3A4A5A6A7A8A9A10A11A12A13A14A15A16A17A18A19A20A21A22A23A24A25A26A27A28A29
A11.00----------------------------
A20.751.00---------------------------
A30.790.721.00--------------------------
A40.850.700.831.00-------------------------
A50.660.830.700.701.00------------------------
A60.710.830.730.680.841.00-----------------------
A70.720.830.760.720.800.821.00----------------------
A80.690.810.730.720.790.790.841.00---------------------
A90.710.800.730.730.770.770.820.801.00--------------------
A100.740.840.750.700.790.780.830.810.871.00-------------------
A110.730.820.670.690.790.810.800.760.840.841.00------------------
A120.730.800.700.670.780.780.790.780.820.850.871.00-----------------
A130.740.730.760.740.720.740.720.710.750.740.720.781.00----------------
A140.690.680.770.700.670.690.690.650.720.690.660.700.811.00---------------
A150.760.730.750.780.680.690.700.680.760.720.710.680.820.821.00--------------
A160.720.710.730.750.700.720.720.730.750.740.730.720.680.670.681.00-------------
A170.680.750.660.670.690.750.740.700.750.730.740.690.670.650.650.831.00------------
A180.710.750.700.680.740.750.740.740.740.710.720.680.680.690.680.680.721.00-----------
A190.760.780.750.760.770.790.780.760.780.770.770.750.750.730.740.760.760.881.00----------
A200.700.700.740.710.670.680.730.690.730.740.700.700.740.680.740.640.660.740.781.00---------
A210.700.770.670.680.820.760.770.740.760.740.790.760.720.680.660.700.730.720.770.631.00--------
A220.740.670.700.730.680.690.680.690.730.740.750.780.780.690.750.670.650.670.730.780.651.00-------
A230.720.630.730.750.650.680.660.660.720.670.660.730.760.700.740.620.610.680.720.730.640.841.00------
A240.720.650.680.720.680.670.680.670.700.700.670.660.700.690.710.690.680.700.760.760.640.770.721.00-----
A250.680.620.700.660.650.690.680.650.660.670.660.660.730.630.680.680.690.650.700.770.650.780.690.771.00----
A260.740.710.700.740.740.740.690.700.750.700.750.730.730.670.700.740.750.720.770.780.680.820.720.800.821.00---
A270.720.690.710.690.690.700.670.620.700.700.690.690.770.710.720.630.640.680.710.750.650.780.790.680.690.731.00--
A280.730.770.720.740.730.740.770.730.810.760.760.760.750.700.720.730.740.720.750.700.780.690.690.720.670.750.721.00-
A290.730.750.690.730.730.680.740.740.780.750.750.770.730.690.700.700.730.700.760.690.780.690.680.700.650.760.720.891.00
Table 8. RAPD polymorphism of Amaranthus accessions at the intraspecific level detected with 16 primers.
SpeciesNo. of AccessionsNo. of Polymorphic FragmentsPolymorphism (%)
A. caudatus48141.97
A. cruentus89348.19
Amaranthus hybrid711861.14
A. hypochondriacus812866.32
A. hybridus22110.88
Mean5.888.245.7

4. Discussion and Conclusions

Grain cultivars of Amaranthus species are cultivated in many regions of the world for the seeds which are rich in protein, vitamins, and mineral components [9,11,14]. In recent years, a lot of emphasis has been made on expanding their cultivation; however, seed yields may be low when grown outside environments for which the particular genotype was bred. This could largely limit the crop’s use for subsistence, as well as commercial cultivation in less-than-optimum environments such as sub-Saharan Africa. In view of the enormous nutritional benefits of the crop, there is a definite need for its genetic improvement to develop high yielding varieties with high content of desired nutritional traits that are well adapted to the agro-ecological climates of sub-Saharan Africa. In the process of genetic improvement of any crop, genetic diversity among germplasm plays a major role, since it opens the way to determine the most divergent parents based on contribution of different qualitative and quantitative traits for utilization in breeding programs.
The traits investigated in this study are important, as they have direct and indirect effects on seed yield and its nutritional components. Studies on vegetable amaranth showed the presence of wide range of diversity in both agronomic and qualitative traits especially leaf and stem color [38,39]. Xiao et al. [39] further opined that stem and leaf colour were useful indices in the classification of vegetable amaranths. Wu et al. [38] in a study of 229 genotypes from 20 Amaranthus species observed wide variability which was useful in cultivar improvement for agronomic traits such as plant height, seed yield, stem, and leaf color among genotypes. Similarly in this study, characters such as plant height, stem diameter, number of leaves per plant, leaf area, and seed yield had high coefficients of variation indicating scope for improvement in these traits through selection to enhance the potentiality of seed yield and plant vigor. Results from traits, such as days to 50% flowering, moisture content, starch, fat, protein, magnesium, manganese, and phosphorus had low values of coefficient of variation, which implies that chances of getting substantial gains under selection are likely to be less for these traits. Additionally, the negative correlation between plant height and number of leaves and branches is an indication that most of the tall accessions have fewer numbers of leaves and branches.
In this study, the PCA showed that the first four PCs accounted for about 57.53% of the total variation encountered among the accessions taking into account all the 27 traits simultaneously. PC1 distinguished those accessions that gave high plant height, number of branches, stem diameter, leaf area, fat, zinc, and copper content. PC2 distinguished accessions having high values of number of leaves and most of the mineral contents (iron, aluminum, magnesium, potassium, selenium, phosphorus, and calcium). Although calcium content had some strength in PC2, it appeared more strongly in PC4. Selenium content was prominent in PC3, but appeared more strongly in PC2. This may be an indication that calcium and selenium are not strongly correlated with the rest of the traits and, hence, it could be possible to select for genotypes with high calcium and selenium content without necessarily affecting other economically important traits. PC3 distinguished accessions having high values of sugar, starch, crude fiber, and selenium content, while PC4 distinguished accessions having high seed yield, 100-seed weight, moisture, ash, protein, manganese, and calcium content. Protein has been reported to be a major contributing trait of PC2 in Amaranthus [2,40]; in this study protein is a major contributing trait of PC4.
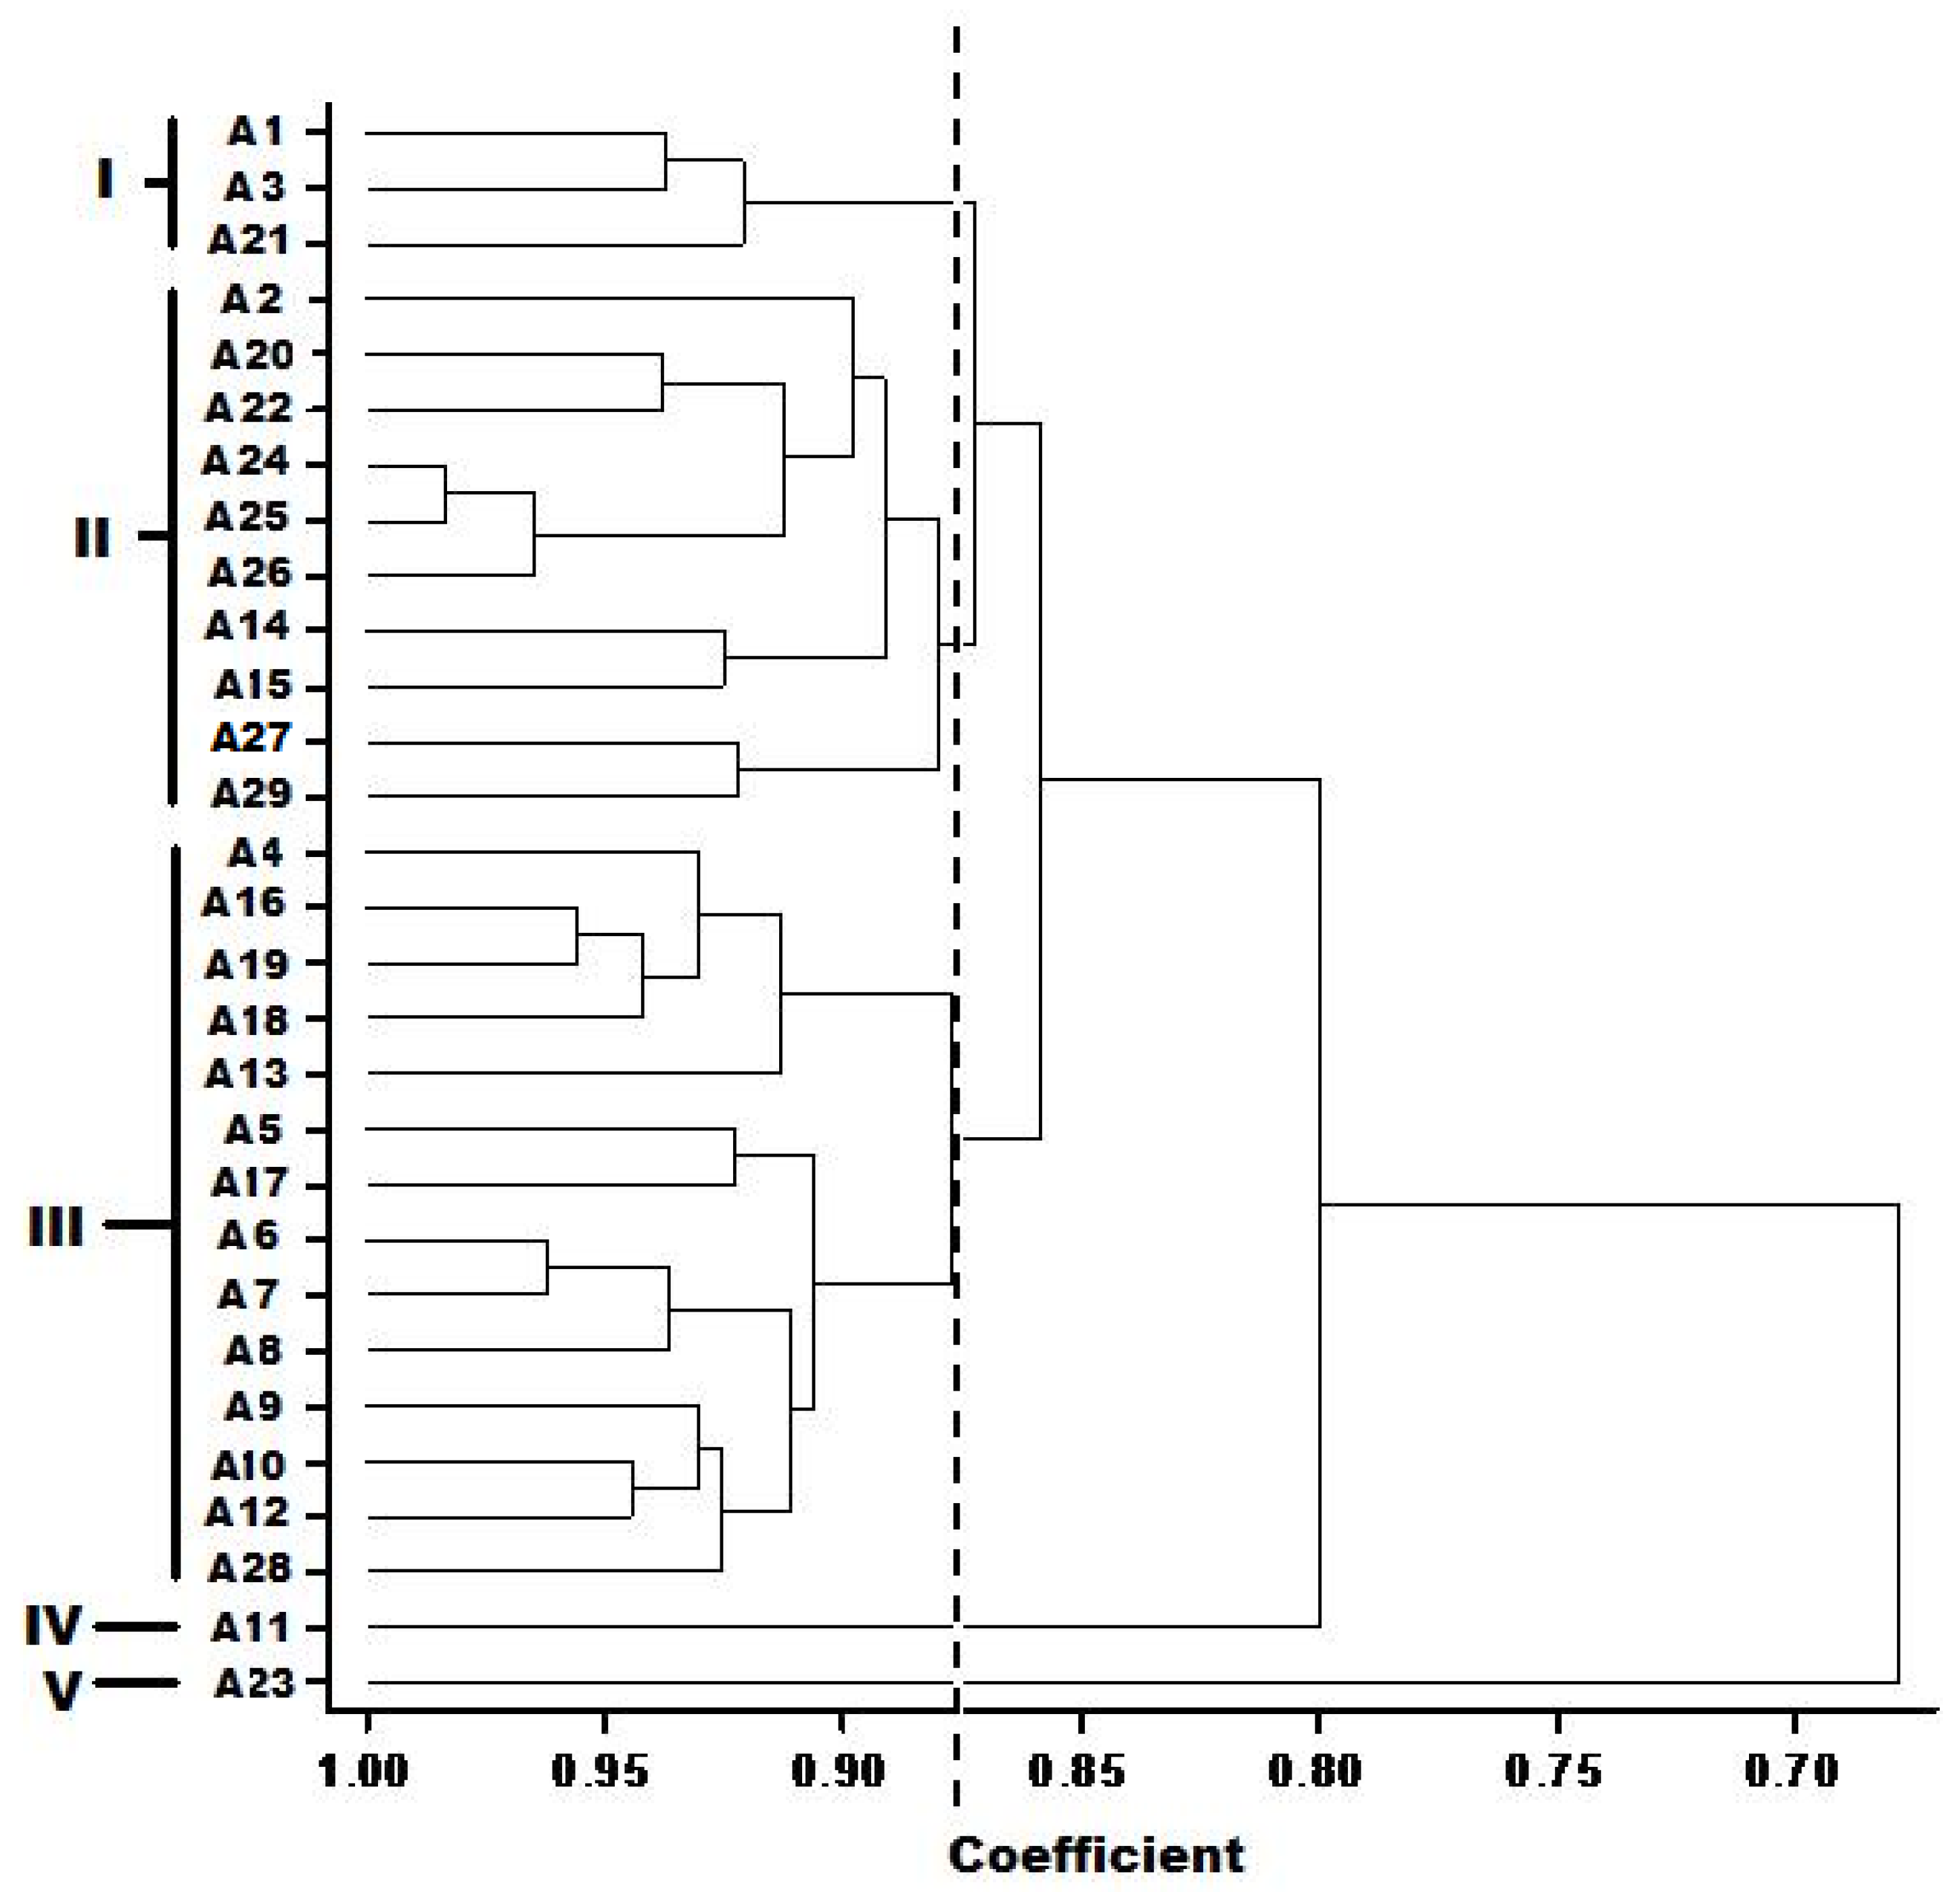
The germplasm under evaluation was grouped into five clusters on the basis of phehotypic traits. Accessions originating from the same region more or less clustered together in some cases, as was observed in Cluster III with accessions A16, A17, A18, and A19, which are from Oyo State in Nigeria. This may suggest that certain traits could be more confined to certain geographical regions than in others. Shukla et al. [2] reported a similar trend in strains of vegetable amaranth of the Tarai region and of the Himalayan region being segregated into same clusters. The clustering together of amaranth accessions from Oyo State of Nigeria indicates that they may be adapted to the agro-ecological conditions characteristic of the region. Accessions A5, A6, A7, A8, A9, A10, and A12 belonging to A. cruentus were also grouped together in cluster III. Thus, the Amaranthus hybrid aceessions and those of A. cruentus may be closely related in terms of phenotypic characteristics as they turned up together in cluster III having high protein and selenium contents. Accessions showing high mean performance for specific desired traits can be used as donor parents in hybridization for improving those traits in component breeding [41]. Cluster IV with only one accession, A11 (A. cruentus), was tall, thick stemmed, had high leaf area, seed yield, fat, and some microelements. Similarly, Cluster V also had only one accession, A23 (A. hypochondriacus), which had high leaf number, seed weight and most of the macroelements. These accessions can be considered as sources of genes for seed yield, plant vigor, and mineral elements in amaranth improvement programs. Ugborogho and Oyelana [42] observed in their investigations that many accessions of A. hybridus exist and they tend to vary in plant height, leaf, stem and seed inflorescence color, and grain yield. In this study, A. hybridus (A28 and A29) in Clusters II and III can be good sources of genes for starch, protein, and selenium content since they are high in these traits.
The result of cluster analysis is consistent with the results obtained through PCA, whereby the major differences between the clusters were attributed to the same traits that contributed most to PC1, PC2, and PC3. As similar result was observed in genotypic diversity studies on Ethiopian mustard [43], Amaranthus tricolor [2] and Amaranthus hybridus [44]. Findings from this study are in concordance with earlier reports that both PCA and cluster analysis can disclose complex relationships between taxa in a more understandable way and with equal effectiveness [45,46].
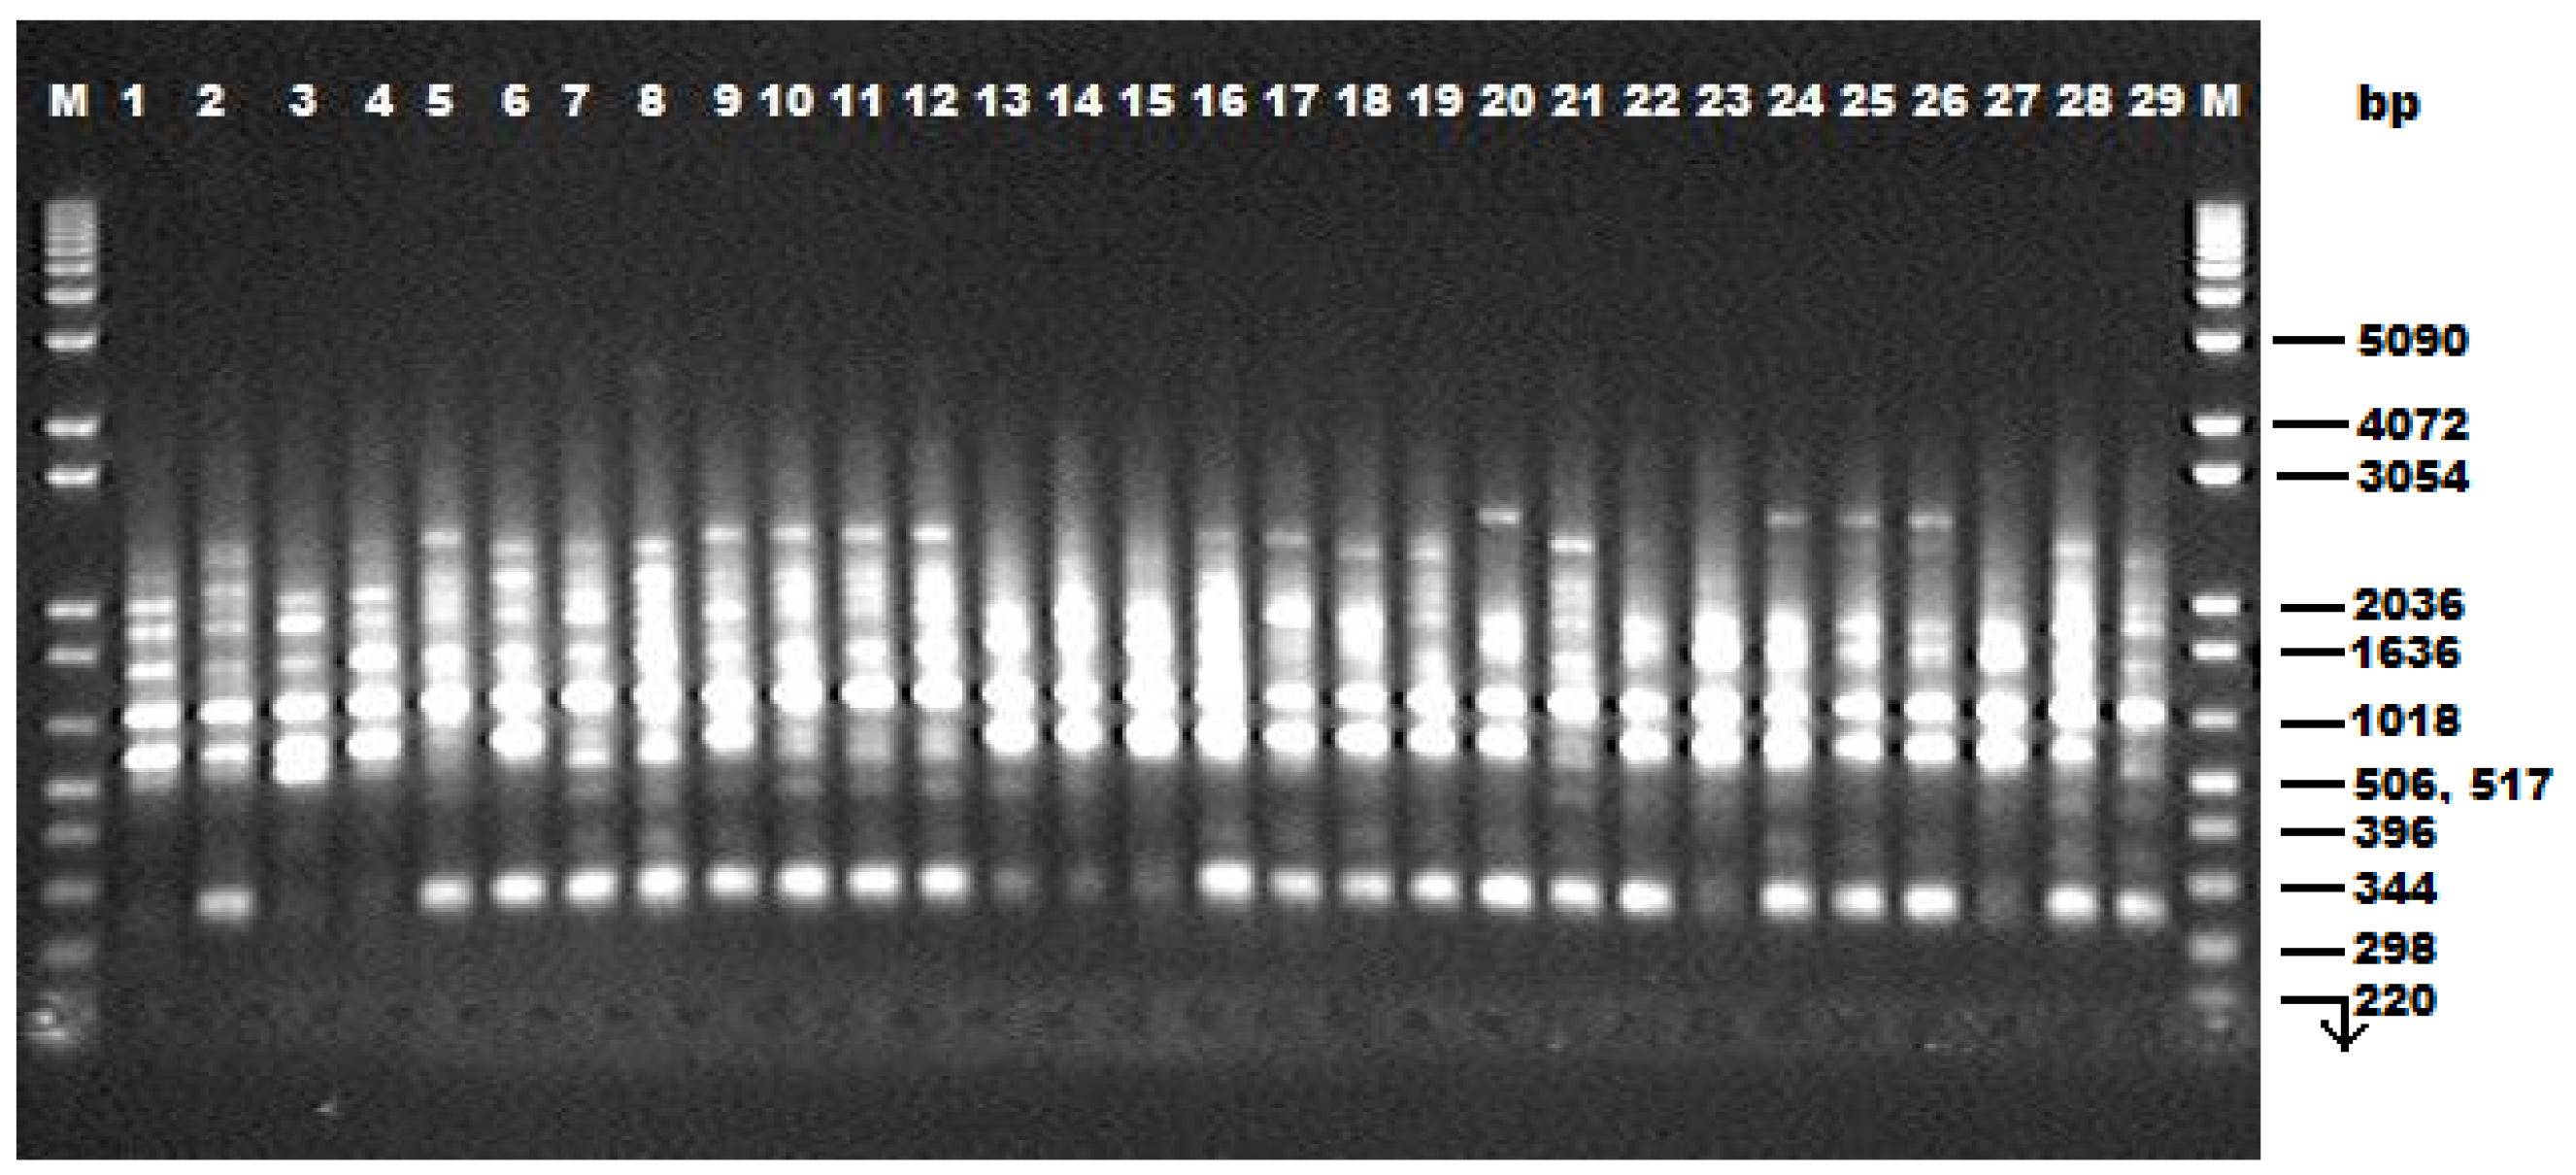
The amaranth germplasm collection was also assessed for diversity at DNA level. Only 16 of 40 RAPD primers screened gave amplification. These generated 193 fragments of which 157 were polymorphic (81%). Pejie et al. [47] reported that 150 polymorphic bands should make a reliable estimate of genetic similarities possible among genotypes within the same species. Hence, the number of polymorphic information produced by the 16 RAPD primers in this study can give an estimate of the genetic diversity in grain amaranth. The range of genetic diversity values broadly indicates the degree of heterogeneity or homogeneity in different accessions of the plant species [48]. Study on genetic diversity of 16 Butea monosperma accessions representing four agro-ecological zones from nine sub-climatic regions in India using 12 polymorphic RAPD primers generated a similarity matrix based on Jaccard’s coefficient ranging from 0.53 to 0.79. This low range of genetic diversity may imply conservation of germplasm and low level of heterogeneity [49]. In this study the 29 amaranth accessions which were of different geographical origins had genetic similarity coefficients of between 0.61 and 0.89. At the intraspecific level, percentage of RAPD polymorphism has previously been reported to be 22.5%, 18.3%, and 23.3% for A. hypochondriacus, A. caudatus, and A. cruentus [1]. Chan and Sun [29] reported a higher percentage of polymorphism in leafy amaranths at the intraspecific level than in grain amaranths. In this study, the high percentage of intraspecific polymorphism observed in A. hypochondriacus (66.32%) and in A. hybrid (61.14%) indicates that they both sustain greater genetic variation than the other amaranth species studied (
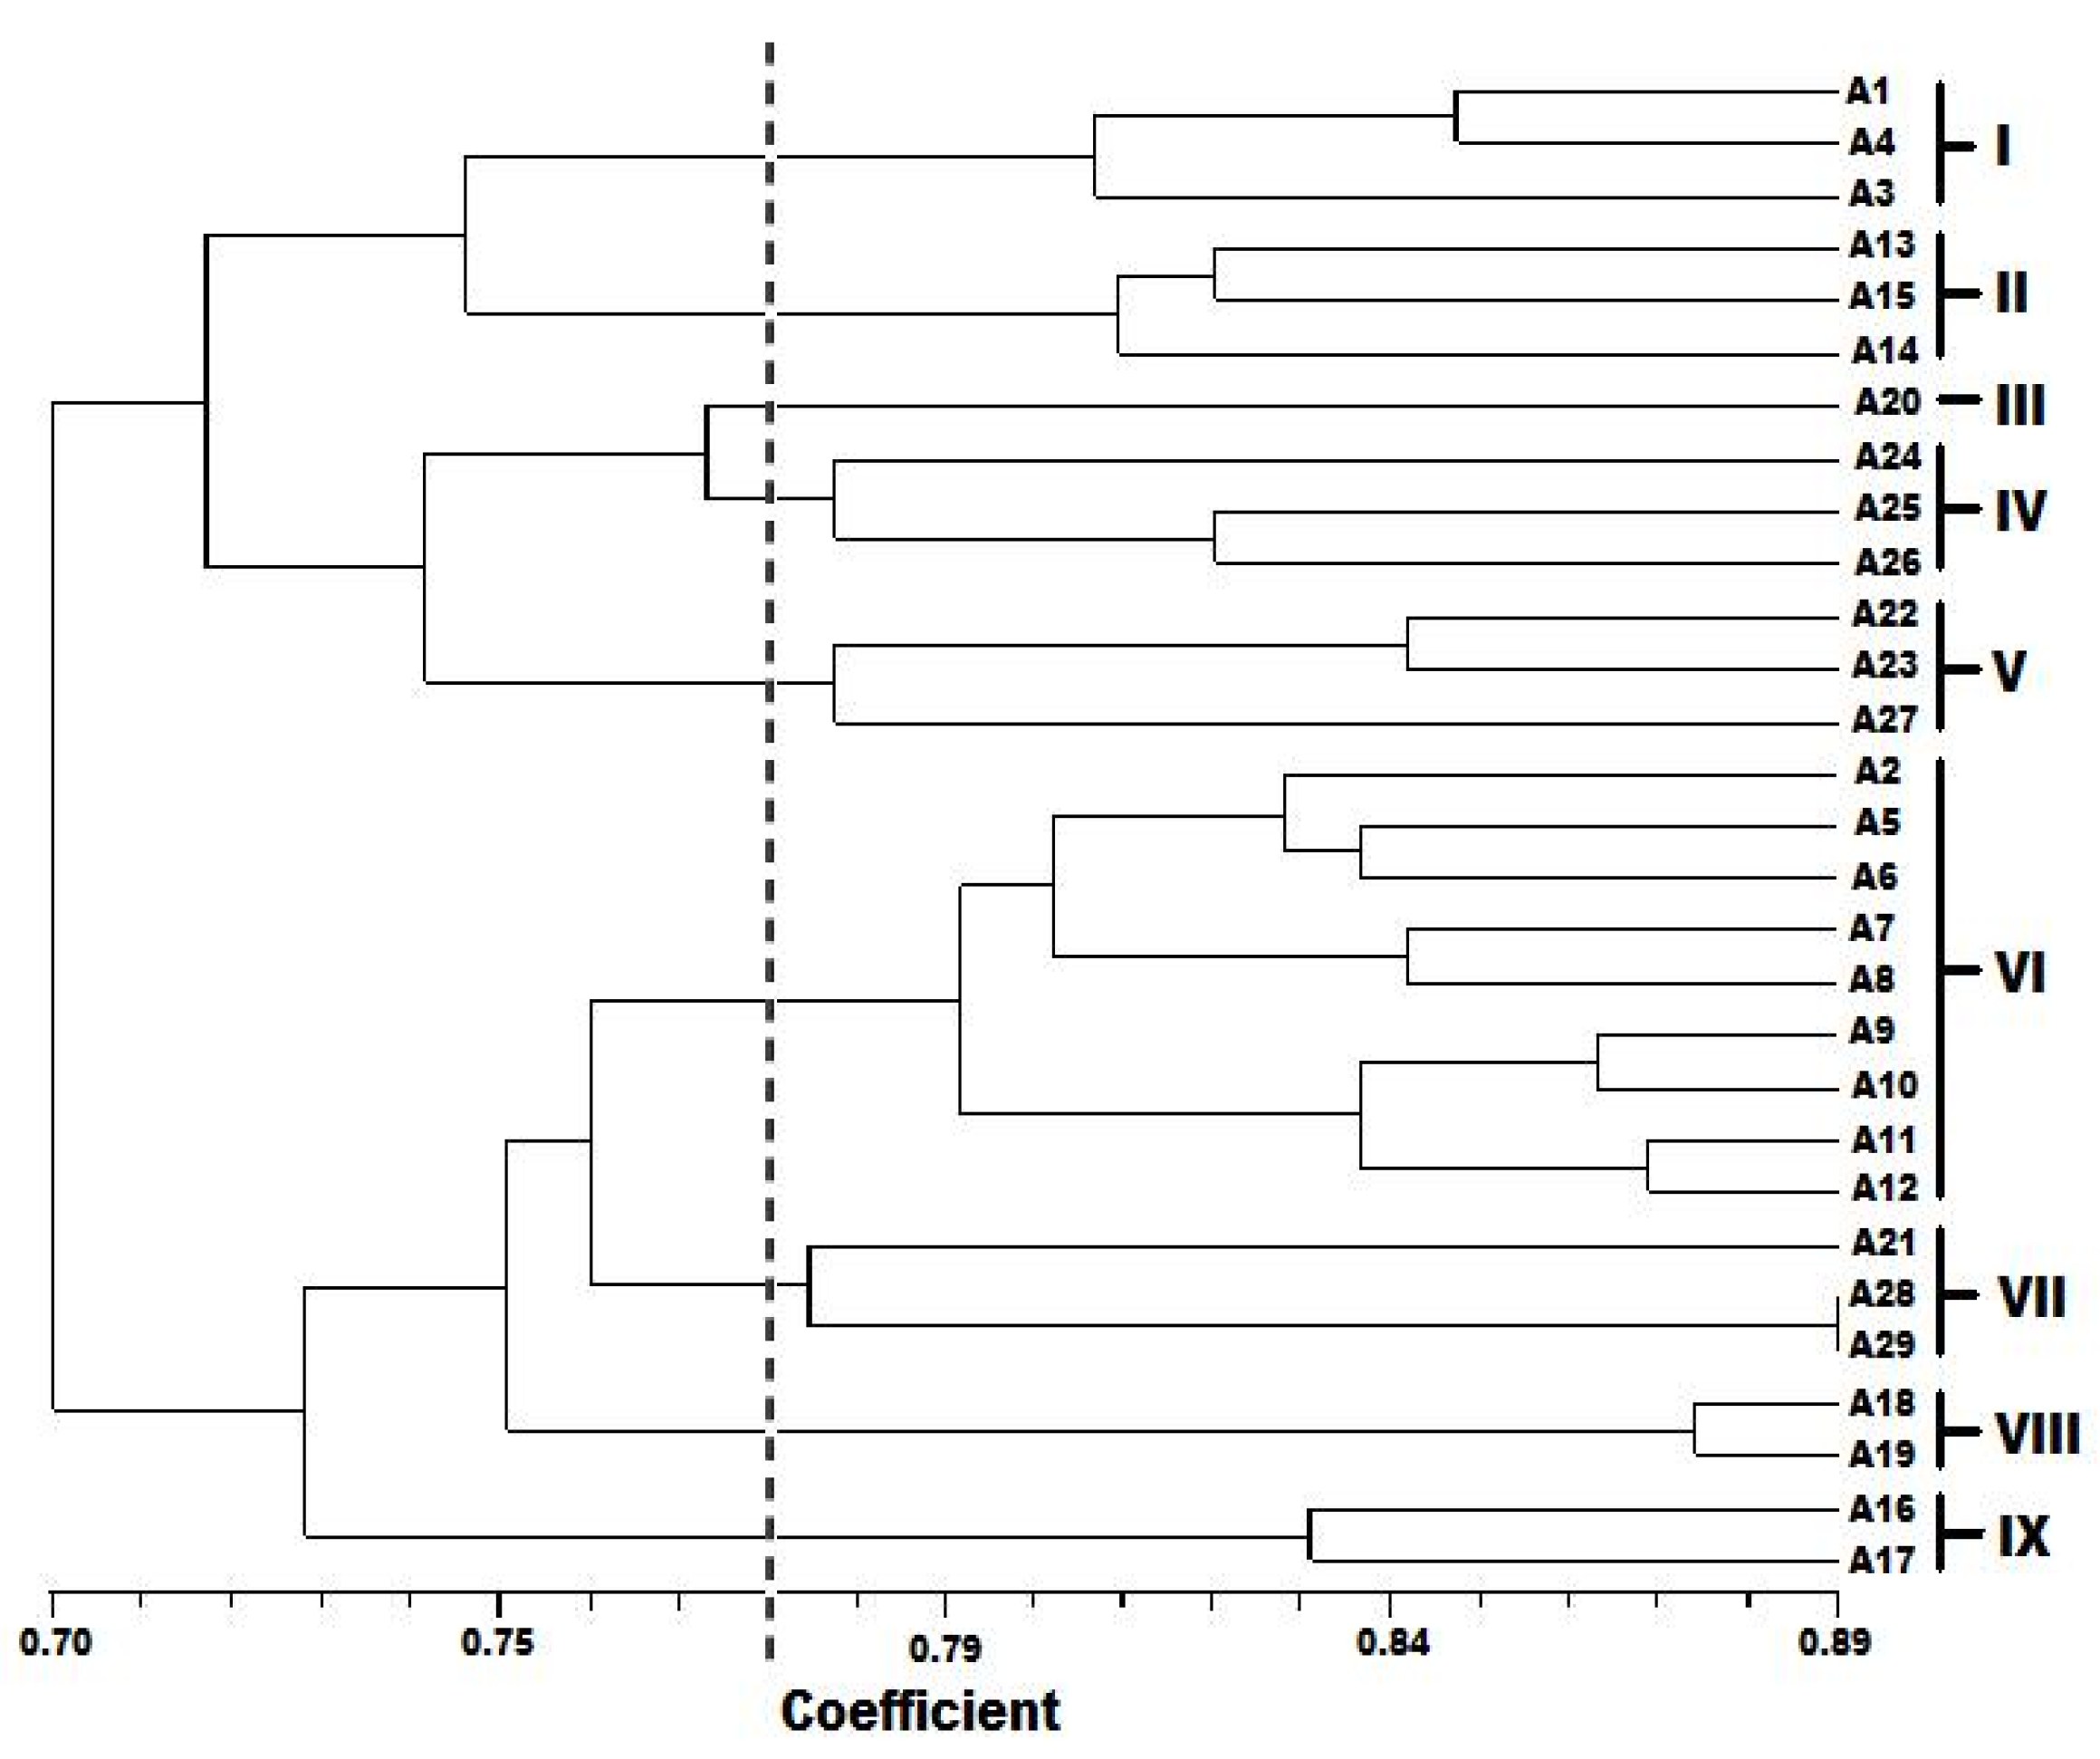
Table 7). Most populations of a species clustered together as observed in the dendrogram generated by UPGMA (Figure 3), except for accessions A2, A20, A21, and A27 which were found clustering with other species. It is plausible that the primers used in this study amplified mostly the conserved part of the genome, so they could not show any variation within a population. Of the 29 accessions analyzed, two accessions, A28 (NH84/444-4) and A29 (NHAC3) belonging to A. hybridus from Oyo, Nigeria; displayed the maximum genetic similarity with a 0.89 similarity coefficient value. It is also evident from the RAPD-based clustering that A. caudatus is closely related to A. hybrid and A. hypochondriacus. Similar results were also observed in previous RAPD based analyses on Amaranthus [1,29,50]. This study revealed low level of diversity as can be observed in the dendrogram showing about 70% similarity and 30% diversity in the accessions.
This study showed some extent of geographic cohesiveness, as observed in accessions A13, A14, and A15; A16 and A17; and A18 and A19. These clustered together in clusters II, IX, and VIII, respectively (Figure 3). Similar observations were made by Ray and Roy [1] when they noted similar geographic and ecological patterns in the distribution of genetic diversity among populations of Amaranthus species from the Indo-Gangetic plains. Other studies have showed little relationship [51], whereas some clearly demonstrated noticeable associations between population characteristics and the environment in which they occur [52].
The study of genetic diversity among populations of different phytogeographic regions is important, as survival, perpetuation, and continuance of a species to meet the demands of changing environments largely depends on the extent of variability available in its gene pool. Selection in genotypes amaranth species should be based mainly on some distinctive morphological characters, such as plant height, stem diameter, number of leaves, number of branches, leaf area, and seed yield. Accessions A11 (PI 641047), A23 (PI 590991) and A28 (NH 84/444-4), having high seed yield, protein, crude fiber, and essential minerals could serve as promising sources of genes for these nutrients in future hybridization work. The RAPD analysis clearly revealed genetic diversity among and within accessions of the species studied, showing that this DNA marker is a useful tool not only for assessing intraspecific variation, but also for subsequent characterization and identification of quantitative trait loci (QTLs) for agronomic and nutritional quality in amaranth genotypes specifically bred for sub-Saharan agro-ecologies.

Acknowledgments

The amaranth accessions were kindly supplied by the United States Department of Agriculture, Agricultural Research Station (USDA/ARS) at Ames, Iowa, USA. The authors are grateful to the management of NIHORT, Ibadan, Nigeria; for providing the facilities for this work.

Author Contributions

Pamela E. Akin-Idowu conceived, designed and performed the experiments. Michael A. Gbadegesin and Oyeronke A. Odunola contributed reagents and some facilities. Uterdzua Orkpeh and Dorcas O. Ibitoye raised the plants and collected morphological data. Pamela E. Akin-Idowu and Uterdzua Orkpeh analyzed the data and wrote the paper.

Conflict of Interest

The authors declare no conflict of interest.

References

  1. Ray, T.; Roy, S.C. Genetic diversity of Amaranthus species from the Indo-Gangetic Plains revealed by RAPD analysis leading to the development of Ecotype-Specific SCAR marker. J. Hered. 2009, 100, 338–347. [Google Scholar] [CrossRef] [PubMed]
  2. Shukla, S.; Bhargava, A.; Chatterjee, A.; Pandey, A.C.; Mishra, B.K. Diversity in phenotypic and nutritional traits in vegetable amaranth (Amaranthus tricolor) a nutritionally underutilized crop. J. Sci. Food Agric. 2010, 90, 139–144. [Google Scholar] [CrossRef] [PubMed]
  3. Norman, J.C. Tropical Vegetable Crops; Stockwell: Ilfracombe, UK, 1992; pp. 52–77. [Google Scholar]
  4. Stallknecht, G.F.; Schulz-Schaeffer, J.R. Amaranth Rediscovered. In New Crops; Janick, J., Simon, J.E., Eds.; Wiley: New York, NY, USA, 1993; pp. 211–218. [Google Scholar]
  5. Randle, A.B. The Classification of Flowering Plants; Cambridge University Press: Cambridge, UK, 1959; pp. 102–105. [Google Scholar]
  6. Queiroz, Y.S.; Manólio Soares, R.A.; Capriles, V.D.; Torres, E.A.; Areas, J.A. Effect of processing on the antioxidant activity of amaranth grain. Arch. Latinoam. Nutr. 2009, 59, 419–424. [Google Scholar] [PubMed]
  7. National Research Council (NRC). Lost Crops of Africa. Volume II, Vegetables; National Academy Press: Washington, DC, USA, 2008. [Google Scholar]
  8. National Academy of Science (NAS). Amaranth: Modern Prospects for an Ancient Crop; National Academy Press: Washington, DC, USA, 1984. [Google Scholar]
  9. Akin-Idowu, P.E.; Odunola, O.A.; Gbadegesin, M.A.; Oke, A.; Orkpeh, U. Assessment of the protein quality of twenty nine grain amaranth (Amaranthus spp. L.) accessions using amino acid analysis and one-dimensional electrophoresis. Afr. J. Biotech. 2013, 12, 1802–1810. [Google Scholar]
  10. Mlakar, G.S.; Turinek, M.; Jakop, M.; Bavec, M.; Bavec, F. Grain amaranth as an alternative and perspective crop in temperate climate. Revija Geogr. J. Geogr. 2010, 5, 135–145. [Google Scholar]
  11. Becker, R.; Wheeler, E.L.; Lorenz, K.; Stafford, A.E.; Grosjean, O.K.; Betschart, A.A.; Saunder, R.M. A compositional study of amaranth grain. J. Food Sci. 1981, 46, 1175–1180. [Google Scholar] [CrossRef]
  12. Muyonga, J.H.; Nabakabya, D.; Nakimbugwe, D.N.; Masinde, D. Efforts to promote amaranth production and consumption in Uganda to fight malnutrition. In Using Food Science and Technology to Improve Nutrition and Promote National Development; Robertson, G.L., Lupien, J.R., Eds.; International Union of Food Science and Technology: Oakville, ON, Canada, 2008; Chapter 8. [Google Scholar]
  13. Escudero, N.L.; Albarracin, G.; Fernández, S.; de Arellano, L.M.; Mucciarelli, S. Nutrient and antinutrient composition of Amaranthus muricatus. Plant. Foods Hum. Nutr. 1999, 54, 327–336. [Google Scholar] [CrossRef] [PubMed]
  14. Bressani, R.; Gonzales, J.M.; Zuniga, J.; Brauner, M.; Elias, L.G. Yield, selected chemical composition and nutritive value of 14 selections of amaranth grain representing four species. J. Sci. Food Agric. 1987, 38, 347–356. [Google Scholar] [CrossRef]
  15. Neluheni, K.; Du Plooy, C.P.; Mayaba, N. Yield Response of Leafy Amaranths to Different Irrigation Regimes. In Proceedings of the 8th African Crop Science Society Conference, El-Minia, Egypt, 27–31 October 2007; Volume 8, pp. 1619–1623.
  16. Mosyakin, S.L.; Robertson, K.R. New infrageneric taxa and combination in Amaranthus. (Amaranthaceae). Ann. Bot. Fenn. 1996, 33, 275–281. [Google Scholar]
  17. Lee, J.R.; Hong, G.Y.; Dixit, A.; Chung, J.W.; Ma, K.H.; Lee, J.H.; Kang, H.K.; Cho, Y.H.; Gwag, J.G.; Park, Y.J. Characterization of microsatellite loci developed for Amaranthus hypochondriacus and their cross-amplification in wild species. Conserv. Genet. 2008, 9, 243–246. [Google Scholar] [CrossRef]
  18. Wax, L.M. Pigweeds of the midwest—Distribution, importance, and management. Proc. Iowa Integr. Crop. Manag. Conf. 1995, 7, 239–242. [Google Scholar]
  19. Bartish, I.V.; Garkava, L.P.; Rumpunen, K.; Nybom, H. Phylogenetic relationships and differentiation among and within populations of Chaenomeles Lindl. (Rosaceae) estimated with RAPDs and isozymes. Theor. Appl. Genet. 2000, 101, 554–563. [Google Scholar] [CrossRef]
  20. Engles, J.M.M.; Rao, V.R.; Brown, A.H.D.; Jackson, M.T. Managing Plant Genetic Diversity; CABI Publishing: Oxford, UK, 2002; p. 487. [Google Scholar]
  21. Perez-Gonzalez, S. The importance of germplasm preservation and use for temperate zone fruit production in the tropics and subtropics. Acta Hort. ISHS 2001, 565, 25–32. [Google Scholar]
  22. Gilbert, J.E.; Lewis, R.V.; Wilkinson, M.J.; Caligari, P.D.S. Developing an appropriate strategy to assess genetic variability in germplasm collection. Theor. Appl. Genet. 1999, 98, 1125–1131. [Google Scholar] [CrossRef]
  23. Duran, C.; Appleby, N.; Edwards, D.; Batley, J. Molecular genetic markers: Discovery, applications, data storage and visualisation. Curr. Bioinform. 2009, 4, 6–27. [Google Scholar] [CrossRef]
  24. Das, M.; Bhattacharya, S.; Pal, A. Generation and characterization of SCARs by cloning and sequencing of RAPD products: A strategy for species specific marker development in bamboo. Ann. Bot. 2005, 95, 835–841. [Google Scholar] [CrossRef] [PubMed]
  25. Rana, T.S.; Narzary, D.; Ohri, D. Genetic diversity and relationships among some wild and cultivated species of Chenopodium L. (Amaranthaceae) using RAPD and DAMD methods. Curr. Sci. 2010, 98, 840–846. [Google Scholar]
  26. Hansen, M.; Hallden, C.; Sall, T. Error rates and polymorphism frequencies for three RAPD protocols. Plant. Mol. Biol. Rep. 1998, 16, 139–146. [Google Scholar] [CrossRef]
  27. Virk, P.S.; Zhu, J.; Newbury, H.J.; Bryan, G.J.; Jackson, M.T.; Ford-Lloyd, B.V. Effectiveness of different classes of molecular markers for classifying and revealing variations in rice (Oryza sativa) germplasm. Euphytica 2000, 112, 275–284. [Google Scholar] [CrossRef]
  28. Popa, G.; Cornea, C.P.; Ciuca, M.; Babeanu, N.; Popa, O.; Marin, D. Studies on genetic diversity in Amaranthus species using the RAPD markers. Tom. XVII 2010, 2, 280–285. [Google Scholar]
  29. Chan, K.F.; Sun, M. Genetic diversity and relationships detected by isozyme and RAPD analysis of crop and wild species of Amaranthus. Theor. Appl. Genet. 1997, 95, 865–873. [Google Scholar]
  30. Van Sloten, D.H. Genetic Resources of Amaranths: A Global Plan of Action; International Board for Plant Genetic Resources: Rome, Italy, 1981. [Google Scholar]
  31. Association of Official Agricultural Chemists (AOAC). Official Methods of Analysis, 15th ed.; AOAC: Washington, DC, USA, 1990. [Google Scholar]
  32. Zarcinas, B.A.; Cartwright, B.; Spouncer, L.R. Nitric acid digestion and multi-element analysis of plant material by inductively coupled plasma spectrometry. Commun. Soil Sci. Plant. Anal. 1987, 18, 131–146. [Google Scholar] [CrossRef]
  33. Statistical Analysis System (SAS); Version 9.1; SAS Institute Inc.: Cary, NC, USA, 2003.
  34. Doyle, J.J.; Doyle, J.L. Isolation of plant DNA from fresh tissue. Focus 1990, 12, 13–15. [Google Scholar]
  35. Jaccard, P. Nouvelles researches surla distribution florale. Bull. Soc. Vaud Sci. Nat. 1908, 44, 223–270. [Google Scholar]
  36. Rohlf, F.J. Numerical Taxonomy and Multivariate Analysis System; Version 2.11; Applied Biostatistics Inc.: New York, NY, USA, 2000. [Google Scholar]
  37. Nei, M. Analysis of gene diversity in subdivided populations. Proc. Natl. Acad. Sci. USA 1973, 70, 3321–3323. [Google Scholar] [CrossRef] [PubMed]
  38. Wu, H.; Sun, M.; Yue, S.; Sun, H.; Cai, Y.; Huang, R.; Brenner, D.; Corke, H. Field evaluation of an Amaranthus genetic resource collection in China. Gen. Res. Crop. Evol. 2000, 47, 43–53. [Google Scholar] [CrossRef]
  39. Xiao, S.G.; Liu, Y.; Song, Y.G. Classification of vegetable amaranth variety resources. J. Hum. Agric. Univ. 2000, 25, 274–277. [Google Scholar]
  40. Alba, E.; Polignano, G.B.; Notarnicola, L. Yield stability in a set of amaranth entries in southern Italy. Ital. J. Agron. 1996, 1, 65–71. [Google Scholar]
  41. Shukla, S.; Bhargava, A.; Chatterjee, A.; Srivastava Singh, S.P. Genotypic variability in vegetable amaranth (Amaranthus tricolor L.) for foliage yield and its contributing traits over successive cuttings and years. Euphytica 2006, 151, 103–110. [Google Scholar] [CrossRef]
  42. Ugborogho, R.E.; Oyelana, A.C. Flora biology of six taxa of Amaranthus L. (Amaranthaceae) in Nigeria. J. Agric. Sci. Technol. 1993, 3, 61–67. [Google Scholar]
  43. Alemayehu, N.; Becker, H. Genotypic diversity and patterns of variation in a germplasm material of Ethiopian mustard (Brassica carinata A. Braun). Genet. Resour. Crop. Evol. 2002, 49, 573–582. [Google Scholar] [CrossRef]
  44. Oboh, B. Multivariate Analysis of the diversity among some Nigerian accessions of Amaranthus hybridus. Int. J. Plant. Breed. Genet. 2007, 1, 89–94. [Google Scholar]
  45. Rezai, A.; Frey, K.J. Multivariate analysis of variation among wild oat accessions—Seed traits. Euphytica 1990, 49, 111–119. [Google Scholar] [CrossRef]
  46. Abede, D.; Bjornstad, A. Genetic diversity of Ethiopian barleys in relation to geographical regions, altitude range and agro-ecological zones as an aid to germplasm collection and conservation strategy. Hereditas 1996, 124, 17–29. [Google Scholar]
  47. Pejie, I.; Ajmone-Marsan, P.; Morgante, M.; Kozumplick, V.; Castiglioni, P.; Taramino, G.; Motto, M. Comparative analysis of genetic similarity among maize inbred lines detected by RFLPs, RAPDs, SSRs and AFLPs. Theor. Appl. Genet. 1998, 97, 1248–1255. [Google Scholar]
  48. Goswami, M.; Ranade, S.A. Analysis of variations in RAPD profile among accessions of Prosopis. J. Genet. 1999, 78, 141–146. [Google Scholar] [CrossRef]
  49. Vaishali, K.S.; Sharma, V. RAPD based assessment of genetic diversity of Butea monosperma from different agro-ecological regions of India. Indian J. Biotech. 2008, 7, 320–327. [Google Scholar]
  50. Transue, D.K.; Fairbanks, D.J.; Robinson, L.R.; Anderson, W.R. Species identification by RAPD analysis of grain amaranth genetic resources. Crop. Sci. 1994, 34, 1385–1389. [Google Scholar] [CrossRef]
  51. Hadian, J.; Tabatabaei, S.M.F.; Naghavi, M.R.; Jamzad, Z.; Ramak-Masoumi, T. Genetic diversity of Iranian accessions of Satureja. hortensis L. based on horticultural traits and RAPD markers. Sci. Hortic. 2008, 115, 196–202. [Google Scholar] [CrossRef]
  52. Ge, X.J.; Yu, Y.; Zhao, N.X.; Chen, H.S.; Qi, W.Q. Genetic variation in the endangered Inner Mongolia endemic shrub Tetraena mongolica Maxim (Zygophyllaceae). Biol. Conserv. 2003, 111, 427–434. [Google Scholar] [CrossRef]

