Article

Dynamic Ecocentric Assessment Combining Emergy and Data Envelopment Analysis: Application to Wind Farms

by
Mario Martín-Gamboa
and
Diego Iribarren
*,†
Systems Analysis Unit, Instituto IMDEA Energía, Av. Ramón de la Sagra 3, Móstoles E-28935, Spain
*
Author to whom correspondence should be addressed.
These authors contributed equally to this work.
Submission received: 3 December 2015 / Revised: 14 January 2016 / Accepted: 21 January 2016 / Published: 29 January 2016
(This article belongs to the Special Issue Consideration of Abiotic Natural Resources in Life Cycle Assessments)

Abstract

:
Most of current life-cycle approaches show an anthropocentric standpoint for the evaluation of human-dominated activities. However, this perspective is insufficient when it comes to assessing the contribution of natural resources to production processes. In this respect, emergy analysis evaluates human-driven systems from a donor-side perspective, accounting for the environmental effort performed to make the resources available. This article presents a novel methodological framework, which combines emergy analysis and dynamic Data Envelopment Analysis (DEA) for the ecocentric assessment of multiple resembling entities over an extended period of time. The use of this approach is shown through a case study of wind energy farms. Furthermore, the results obtained are compared with those of previous studies from two different angles. On the one hand, a comparison with results from anthropocentric approaches (combined life cycle assessment and DEA) is drawn. On the other hand, results from similar ecocentric approaches, but without a dynamic model, are also subject to comparison. The combined use of emergy analysis and dynamic DEA is found to be a valid methodological framework for the computation of resource efficiency and the valuation of ecosystem services. It complements traditional anthropocentric assessments while appropriately including relevant time effects.

Graphical Abstract

1. Introduction

The current level of extraction of primary resources—around 60 billion tons per year globally—is not sustainable [1]. Moreover, the global consumption of natural resources for the production of goods and services is expected to increase significantly in next decades [1,2]. Fundamental changes and policy measures are therefore required in order to promote a shift in production processes, supply-chain management and consumption patterns [2,3,4]. In this sense, a dematerialization strategy should be followed, i.e., decoupling natural resource use from economic growth and social prosperity [1,2]. This calls for a sustainable and efficient use of resources, security in the supply of raw materials and reduction in life-cycle environmental impacts. Furthermore, within this context, novel methodological frameworks for assessing systems performance are needed to ensure the rational use of natural resources [4].
Life-cycle methodologies are one of the main instruments for the comprehensive evaluation of supply-chains and product systems due to its holistic nature [5]. However, most of current life-cycle approaches show an anthropocentric standpoint for the evaluation of human-dominated activities, generally disregarding flows beyond the present state of a resource in the current ecosphere [6,7]. Moreover, the evaluation of resource criticality within the life cycle assessment (LCA) methodology remains underdeveloped [8]. Hence, LCA alone is insufficient when it comes to assessing flawlessly the contribution of natural resources to product systems. In this respect, emergy analysis evaluates human-driven systems from a donor-side perspective, accounting for the environmental effort performed to make the resources available [9,10].
Emergy estimates the solar energy previously provided to generate a product [11,12]. It is interpreted as the memory of the geobiosphere exergy provision related to economic systems through the use of natural resources [13,14]. Thus, emergy analysis complements LCA by providing a donor-side perspective, a unified measure of the provision of environmental support, and an indication of the work of the environment that would be needed to replace what is consumed [9,10]. LCA and emergy analysis have been applied jointly to a number of case studies, e.g., within the primary [15], building [16] and energy [6,7,17] sectors.
When assessing multiple homogeneous entities involving a number of inputs and outputs, another suitable tool for combination with emergy analysis is data envelopment analysis (DEA), which is a linear programming methodology to measure the relative efficiency of multiple “decision making units” (DMUs, i.e., the homogeneous entities under assessment) [18]. In this respect, Iribarren et al. [10] proposed the combined use of emergy and DEA—the Em + DEA method—to enhance benchmarking processes in terms of environmental sustainability, offering an ecocentric life-cycle perspective.
In case of systems with significant time variability, the use of the Em + DEA method—and, in general, of the currently available life-cycle approaches coupled with DEA [19]—provides a static picture of the “historical” use of natural resources. To deal with this flaw, dynamic (time-dependent) DEA models might be used [20]. This article presents a novel methodological framework combining emergy analysis and dynamic DEA—the Em + DynDEA method hereinafter—for the ecocentric assessment of multiple resembling entities over an extended period of time. The feasibility of this novel approach is shown through a case study of wind farms. Furthermore, the results obtained are compared with those of previous studies from two different angles. On the one hand, a comparison with results from anthropocentric approaches (combined LCA and DEA) is drawn. On the other hand, results from similar ecocentric approaches, but without a dynamic model, are also subject to comparison.

2. Material and Methods

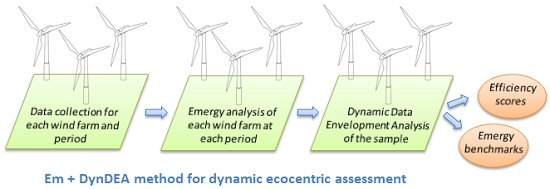
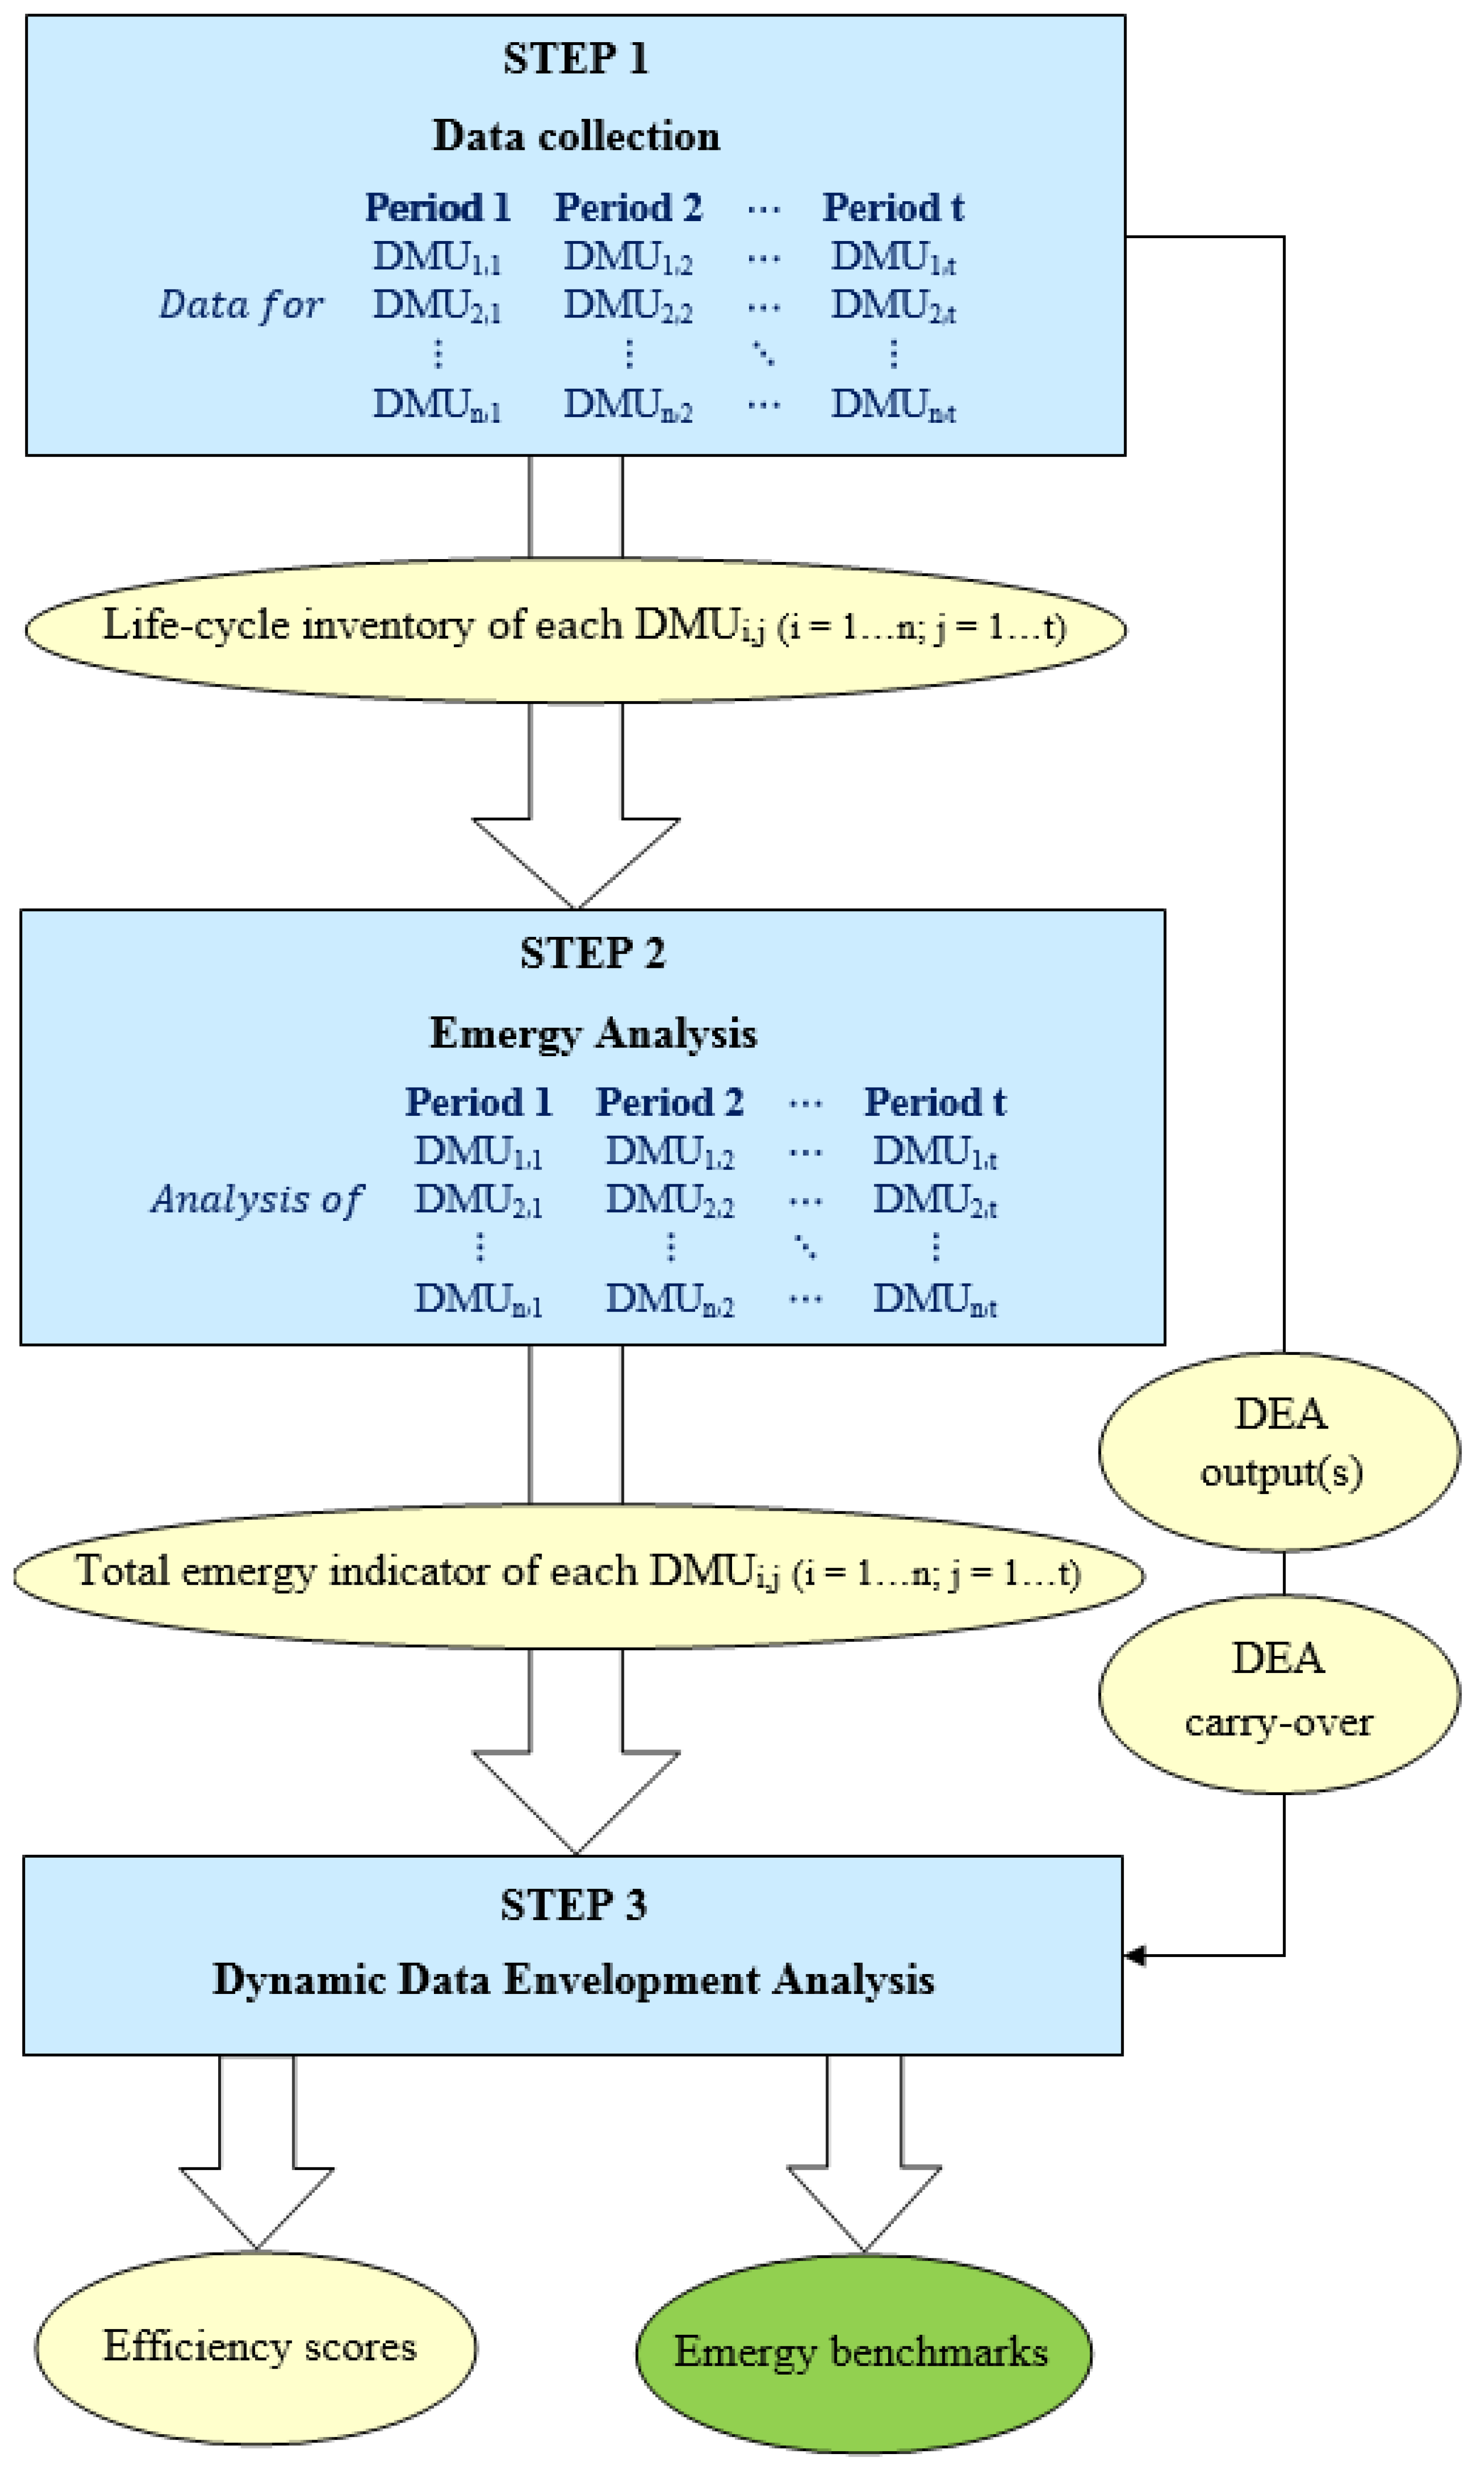
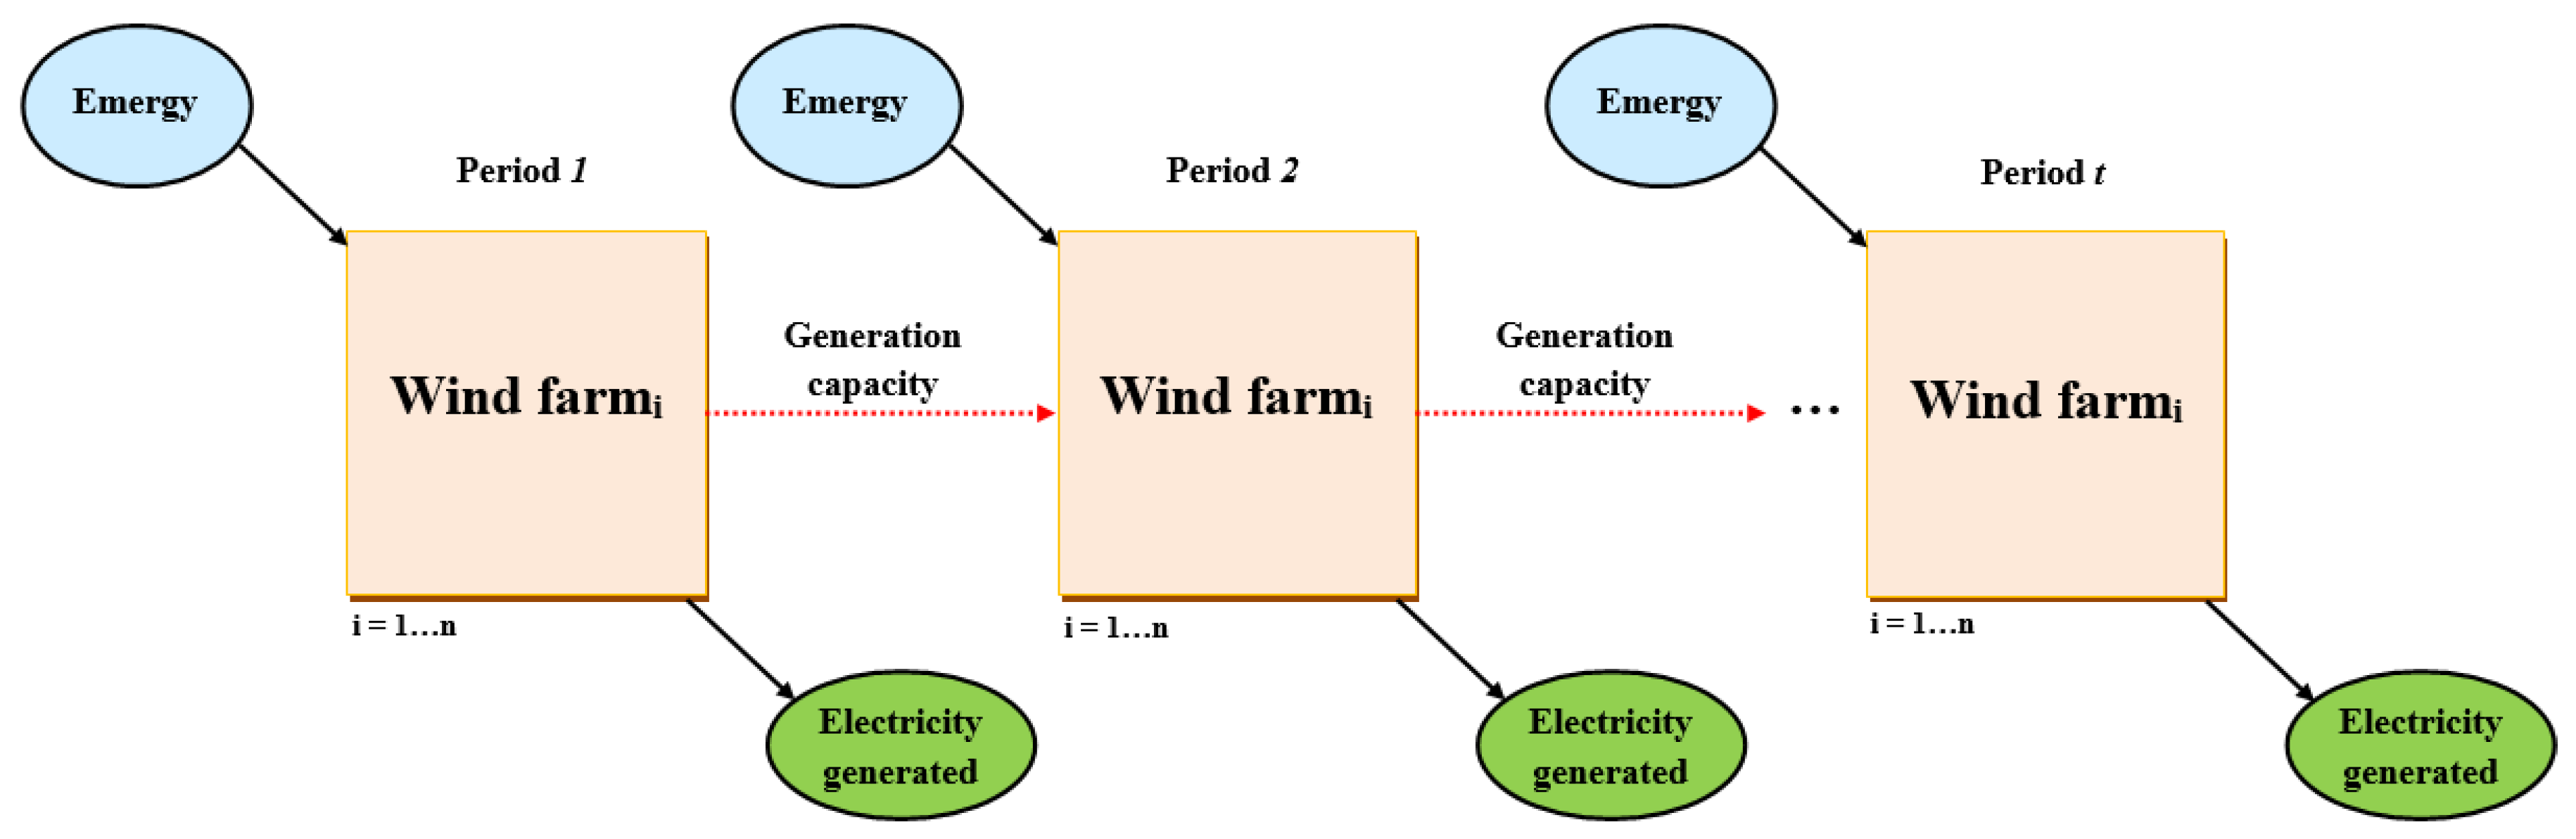
2.1. Em + DynDEA Method

The goal of the study is to extend the applicability of the available Em + DEA method [10] to time-dependent systems by using a dynamic DEA model. The resultant Em + DynDEA method is outlined in Figure 1. Three key steps are included: (i) data collection, (ii) emergy analysis, and (iii) dynamic DEA.
The first step focuses on the preparation of the life-cycle inventory (LCI) of each individual DMU for each individual period. In the second step, these LCIs are used to carry out the emergy analysis of each DMU for each period by using the SCALE software developed by Marvuglia et al. [21]. In this study, the total value of emergy (in seMJ, i.e., million solar emjoules) is considered, which is calculated as the sum of the seven resource categories computed with SCALE (viz., fossil resources, metal ores, mineral resources, nuclear resources, renewable energy resources, water resources, and land resources). It should be noted that the use of the SCALE software involves an appropriate consideration of the emergy algebra rules [21], thus distinguishing itself from other attempts that define solar energy demand indicators based on the use of characterization factors suitable for implementation into LCA software [22].
Figure 1. Representation of the Em + DynDEA method.
Resources 05 00008 g001
The final step of the Em + DynDEA method provides relative efficiency scores (Φ) and emergy benchmarks (i.e., target values for efficient performance) through dynamic DEA of the whole sample of n DMUs over t periods. At each period j, each DMU i has its respective inputs and outputs along with a carry-over (link) that connects two consecutive periods. In the Em + DynDEA method, the total emergy value is used as the DEA input. The DEA matrix is completed by including the output(s) to which the inputs refer, as well as the carry-over that links the next period j+1. Carry-overs are usually classified into four categories: desirable (good) link; undesirable (bad) link; discretionary (free) link; and non-discretionary (fixed) link [20]. Once the DEA matrix is ready, key features must be selected regarding the DEA model, which includes the type of carry-over, the orientation of the model and the display of the production possibility set [10]. When compared to other alternatives for efficiency computation, the use of DEA benefits from advantages mainly associated with the definition of the production possibility set and, subsequently, of the efficient frontier, making DEA also a powerful methodology for the benchmarking of performance indicators [18,19]. When using dynamic DEA under time-dependent situations, additional benefits are associated with the use of time-series data and the carry-over [20]. The need for both inventory data and carry-over data may give rise to potential links to other analytical methods such as (time-dependent) material flow analysis [23].
When solving the dynamic DEA model, efficiency scores are provided for each DMU and period (Φi,j), in addition to the overall efficiency of each DMU (Φi, average of the t efficiency scores of DMU i). The relative efficiency scores lead to distinguish between efficient (Φ = 1) and inefficient (Φ < 1) entities within a certain number of periods. Moreover, target emergy values are provided as the desired benchmarks to turn inefficient entities into efficient DMUs.

2.2. Definition of the Case Study

The feasibility of the Em + DynDEA method is shown through a case study of wind farms (WFs). Wind power is selected as case study because it shows time variability and it is a key power generation option in a wide range of countries [24,25]. A sample of 16 WFs located in Spain (regions of Castile-La Mancha and Andalusia) is used in the current study as homogeneous entities (DMUs). The analysis is carried out on an annual basis for a time frame of five years, from 2007 to 2011, a key period for wind power growth in Spain [26].
Table 1 presents the evolution of wind power generation over 2007–2011 for the evaluated sample. These data are retrieved from the annual statistics published in the Spanish Ministry of Industry, Energy and Tourism database [27]. During this period, the average production of the whole set of WFs was 85.55 GWh·y−1. Additionally, the installed capacity and the average wind speed ranged from 30 to 50 MW and from 5.5 to 10.5 m·s−1, respectively. The installed capacity (also reported in Table 1) was unintentionally constant for the specific sample under study.
Table 1. Electricity produced by the wind farms over 2007–2011 (GWh) and installed capacity (MW).
Wind Farm CodeYear 2007Year 2008Year 2009Year 2010Year 2011Installed Capacity
WF191.88102.0191.63101.93109.2544.80
WF281.6093.3691.2682.2789.9833.40
WF3109.29128.76124.62123.29107.2250.00
WF493.30100.3999.8596.6183.9249.50
WF5102.29113.0099.91100.8691.7149.50
WF698.5194.4195.7194.7883.8449.30
WF722.0990.2676.7573.3079.8948.00
WF889.61100.8998.6594.0880.9845.05
WF983.2292.0393.9888.0174.3041.65
WF1076.4184.9171.0673.9877.4542.00
WF1177.9888.8486.2683.8073.6737.60
WF1282.2190.8390.1984.0177.8337.40
WF1386.8991.7185.4881.4184.6936.96
WF1462.7771.0070.6869.4468.5431.45
WF1560.7665.0462.6461.1553.6331.02
WF1666.3061.8374.3571.2359.7430.00
Figure 2 illustrates the structure of the dynamic DEA study of WFs. This analysis involves 16 WFs (n = 16) over 5 years (t = 5). For each of the years, each WF encompasses one input (total emergy) and one output (electricity production). The choice of total emergy as an input provides an exhaustive evaluation of actual resource use, integrating all the information on primary material consumption into a single input. This consumption is associated mainly with the central element of a WF, the wind turbine, which includes four main components (concrete foundations, tower, nacelle, and rotor) and a large number of subcomponents and electrical constituents [28]. The preparation of the LCI of each WF—as required for the emergy analysis—includes all these items. Further details about the definition of wind farms as DMUs can be found in Iribarren et al. [10,28].
Finally, a link between years is used to connect the activity of the WFs and take into account efficiency changes. The choice of the carry-over(s) ultimately depends on the needs of the analyst for the specific case study addressed. Examples of different types of appropriate links reflecting actual characteristics of carry-over activities can be found in the scientific literature [20]. For the case study of wind farms, as shown in Figure 2, generation capacity is selected as a discretionary (free) carry-over. This type of free link has an indirect effect on the efficiency score due to the continuity condition between two consecutive periods, implicit condition in the formulation of the dynamic DEA model [20]. Since the value of the free link can be increased or decreased from the observed one, the link deviation from the current value is calculated as a slack variable [20].
Figure 2. Key components of the dynamic DEA study of wind farms.
Resources 05 00008 g002

3. Results and Discussion

3.1. Application of the Em + DynDEA Method

Table 2 presents the main average inventory data for the set of DMUs over the period 2007–2011. The structure of the inventory is in accordance with previous studies [10,28]. This average inventory shows the convenience of carrying out individual analyses in order to avoid misleading result interpretation owing to relevant standard deviations. These deviations are due to both time and DMU variations. The use of the average inventory in Table 2 is therefore avoided [10]. Instead, the individual LCI of each WF for each period is used according to the proposed Em + DynDEA method. Foreground data acquisition is based on Iribarren et al. [28], while inventory data for background processes are taken from the ecoinvent database [29] and air emissions from diesel combustion are estimated using data from the European Environment Agency (EEA) [30].
Each individual LCI is implemented into SimaPro (PRé Consultants, Amersfoort, The Netherlands) [31] and, subsequently, SCALE [21] in order to perform emergy computation. The total emergy value of each WF for each period is obtained by adding the corresponding emergy results of the seven resource categories [21]. The total emergy values are then implemented into the DEA matrix (Table 3) as a DEA input.
Table 2. Average inventory data of the sample of wind farms (values per MWh of generated power).
InputsUnitsAverage ± Standard Deviation
From Nature
Landm2a4.24 ± 1.60
Kinetic energy (converted)MWh1.08 ± 0.00
From the Technosphere
Concrete (foundations)kg19.30 ± 11.63
Iron (foundations)kg0.69 ± 0.42
Steel (foundations)kg0.41 ± 0.25
Steel (tower)kg3.33 ± 1.82
Paint (tower)g44.97 ± 24.6
Iron (nacelle)kg0.51 ± 0.31
Steel (nacelle)kg0.49 ± 0.31
Silica (nacelle)g9.49 ± 5.71
Copper (nacelle)kg0.10 ± 0.06
Plastic (nacelle)g13.79 ± 8.30
Aluminum (nacelle)g4.96 ± 2.99
Fiberglass (nacelle)g22.06 ± 13.29
Epoxy resin (nacelle)g33.08 ± 19.92
Epoxy resin (rotor)kg0.31 ± 0.33
Fiberglass (rotor)kg0.15 ± 0.07
Iron (rotor)kg0.38 ± 0.23
Lubricating oilg16.85 ± 6.70
Diesel, combustedg44.15 ± 44.17
OutputsUnitsAverage ± Standard Deviation
Products
ElectricityMWh1.00 ± 0.00
Waste to treatment
Waste to recyclingkg6.60 ± 3.83
Waste to incinerationkg0.47 ± 0.23
Table 3. DEA matrix for the Em + DynDEA study (values per MWh of generated power).
Wind FarmYear 2007Year 2008Year 2009Year 2010Year 2011
CodeEICCOEICCOEICCOEICCOEICCO
WF11.54 × 1080.491.39 × 1080.441.55 × 1080.491.40 × 1080.441.31 × 1080.41
WF22.00 × 1080.411.75 × 1080.361.79 × 1080.371.98 × 1080.411.82 × 1080.37
WF31.18 × 1080.461.01 × 1080.391.05 × 1080.401.06 × 1080.411.21 × 1080.47
WF43.29 × 1080.533.06 × 1080.493.07 × 1080.503.17 × 1080.513.65 × 1080.59
WF51.72 × 1080.481.57 × 1080.441.76 × 1080.501.75 × 1080.491.92 × 1080.54
WF62.50 × 1080.502.60 × 1080.522.57 × 1080.522.59 × 1080.522.92 × 1080.59
WF71.20 × 1092.172.97 × 1080.533.48 × 1080.633.64 × 1080.653.35 × 1080.60
WF82.51 × 1080.502.23 × 1080.452.28 × 1080.462.39 × 1080.482.77 × 1080.56
WF92.50 × 1080.502.27 × 1080.452.22 × 1080.442.37 × 1080.472.79 × 1080.56
WF101.42 × 1080.551.28 × 1080.491.52 × 1080.591.47 × 1080.571.40 × 1080.54
WF112.99 × 1080.482.63 × 1080.422.71 × 1080.442.78 × 1080.453.16 × 1080.51
WF122.26 × 1080.452.06 × 1080.412.07 × 1080.412.22 × 1080.452.39 × 1080.48
WF132.64 × 1080.432.51 × 1080.402.68 × 1080.432.82 × 1080.452.71 × 1080.44
WF142.56 × 1080.502.27 × 1080.442.28 × 1080.442.32 × 1080.452.35 × 1080.46
WF153.16 × 1080.512.96 × 1080.483.07 × 1080.503.14 × 1080.513.57 × 1080.58
WF161.26 × 1080.451.34 × 1080.491.13 × 1080.401.17 × 1080.421.39 × 1080.50
Notes: EI: emergy input (seMJ·y−1·MWh−1); CCO: capacity carry-over (kW·MWh−1).
The DEA matrix presented in Table 3 undergoes dynamic DEA. The selected model is a dynamic input-oriented slacks-based measure of efficiency model with constant returns to scale (DSBM-I-CRS model) [20]. This model is an extension of the slacks-based measure framework proposed by Tone [32] and Pastor et al. [33]. The choice of the key features of the model (non-radial metrics, input orientation and constant returns to scale) is based on previous DEA studies of wind farms [10,28]. Thus, the study focuses on the reduction of the emergy input while maintaining the observed output level. This is in line with the final goal of minimizing resource consumption. Finally, regarding the selected carry-over, the stability over time observed for the generation capacity supports its use as a carry-over, performing the continuity condition between consecutive periods in the dynamic model [20]. The suitability of generation capacity as a discretionary (free) link is in agreement with other DEA studies in the scientific literature [34].
The relative efficiency of each WF for each period, as well as the overall relative efficiency of each WF, is calculated by implementing the DEA matrix in DEA-Solver Pro (Saitech, Holmdel, NJ, USA) [35]. The same relevance is considered for the five individual periods (2007, 2008, 2009, 2010 and 2011). Table 4 shows the individual and overall efficiency scores of the assessed WFs. According to the overall scores, only 1 (WF3) out of 16 WFs is found to be efficient through the entire time frame (i.e., overall Φ = 100%). In terms of individual periods, 2011 is—on average—the year with higher efficiency, arising as the only period with two efficient entities: WF1 and WF3. Regarding inefficient entities, more than half of the WFs present scores below 50%. Although the calculation of emergy benchmarks (i.e., target emergy values) is feasible, it is out of the scope of the present study.
Table 4. Individual and overall efficiency scores (%) of the sample of wind farms.
DMU CodeΦ Year 2007Φ Year 2008Φ Year 2009Φ Year 2010Φ Year 2011Overall Φ
WF181.8582.0181.9581.86100.0085.83
WF259.2859.5059.4459.4471.3861.81
WF3100.00100.00100.00100.00100.00100.00
WF436.0536.2436.1836.1636.0836.14
WF568.6868.9268.8668.8768.8568.84
WF647.4647.6947.5847.5847.5847.58
WF734.3034.1434.0334.0237.4834.79
WF847.2247.4347.3747.3547.2847.33
WF947.3647.5847.5247.5047.4347.48
WF1083.3383.5683.6183.5987.8584.39
WF1139.6539.8539.7939.7839.6539.74
WF1252.3052.5352.4652.4452.3252.41
WF1344.8445.0644.9544.9544.8344.93
WF1446.2646.4846.4246.4154.8948.09
WF1537.4737.6637.5937.5837.5237.56
WF1694.2194.8294.2794.3494.5594.44

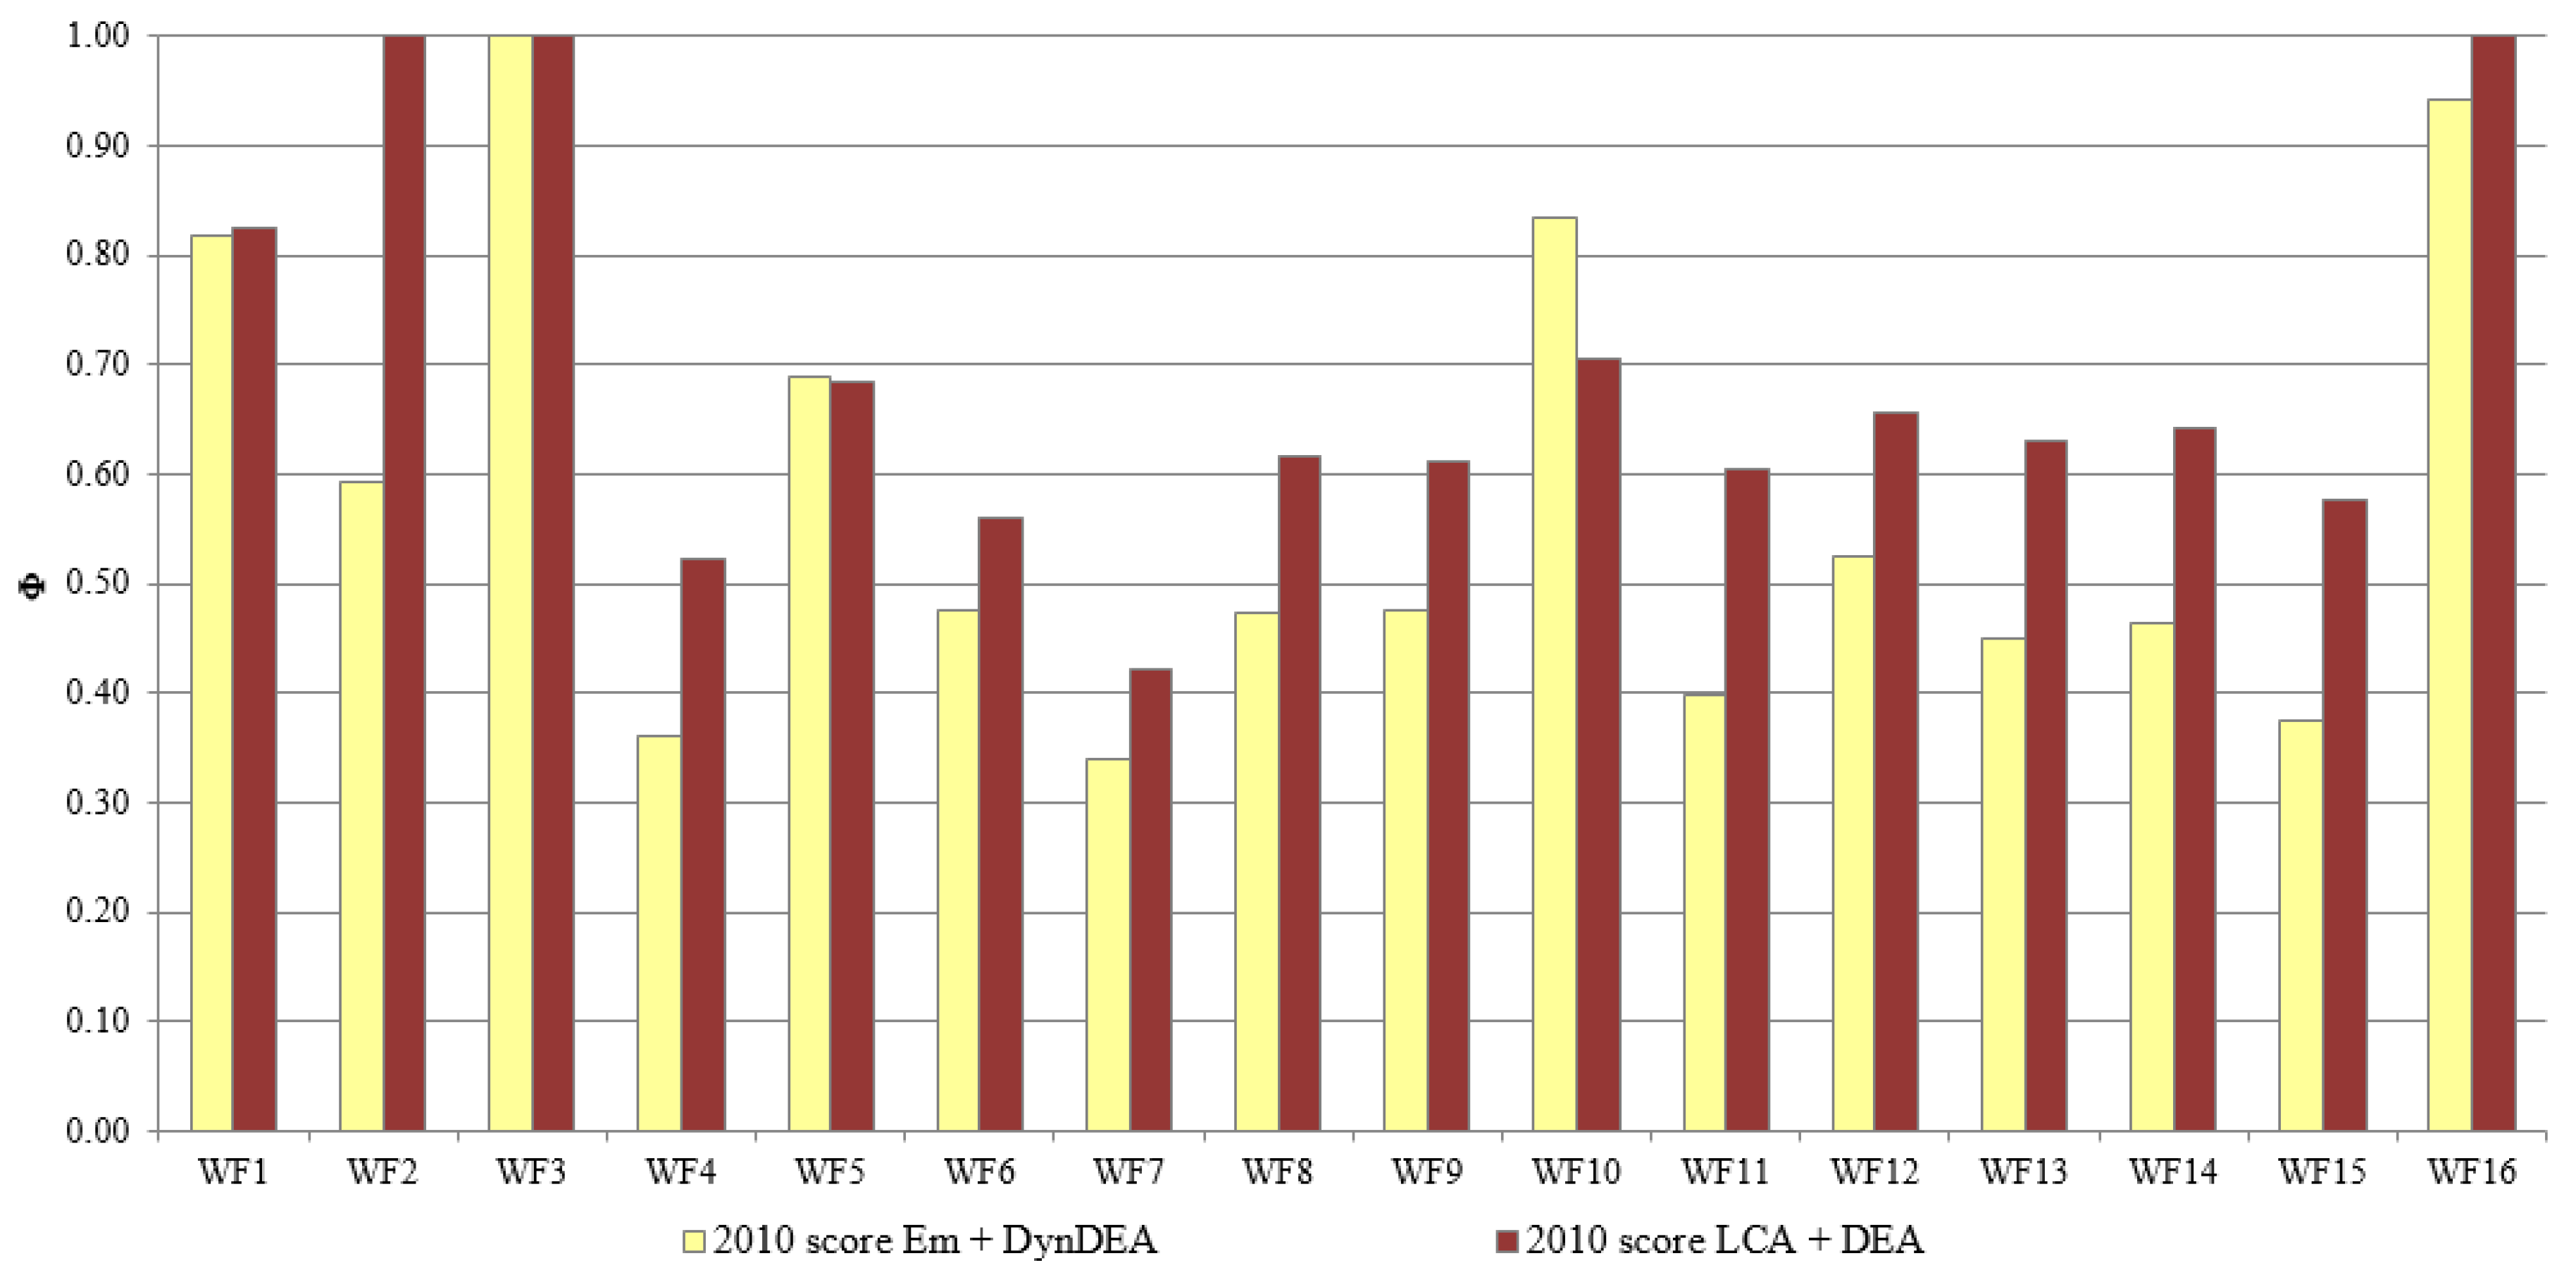
3.2. Comparison of Ecocentric and Anthropocentric Approaches

A comparison between the efficiency scores calculated for a given period through the ecocentric Em + DynDEA method and those calculated through the anthropocentric LCA + DEA method for the same sample of wind farms is carried out in this section. The LCA + DEA efficiency scores are computed for the reference year 2010 as explained in Iribarren et al. [28], but using the reduced sample of WFs considered in the present article. These LCA + DEA efficiency scores are calculated through the five-step LCA + DEA method [28] and, therefore, characterize the operational performance of the evaluated WFs following an anthropocentric perspective [19]. Because the comparison is limited to efficiency scores, thus excluding the benchmarking of operational and environmental targets, the choice of the life cycle impact assessment method does not affect the results presented in this section.
Figure 3 shows the comparison between Em + DynDEA and LCA + DEA scores for the year 2010. As it can be observed, 3 entities (WF2, WF3 and WF16) are found to operate efficiently when using the anthropocentric (and static) approach, whereas the ecocentric (and dynamic) approach leads to identify only one efficient entity (WF3). In particular, WF2 constitutes a singular case since it is deemed efficient according to the LCA + DEA method, but significantly inefficient (Φ = 0.59) according to the Em + DynDEA method. Moreover, 75% of the WFs present efficiency scores above 0.6 when using the anthropocentric approach, while more than half of the WFs present scores below 0.5 when using the ecocentric method. According to other authors [20], the overestimation of efficiency scores in separate models (i.e., models with no linkage between consecutive periods) is a common result since these models measure each term efficiency as completely independent, while dynamic models provide stable scores reflecting the continuity of links between periods. Hence, differences between Em + DynDEA and LCA + DEA results are associated with both the ecocentric/anthropocentric nature of the inputs (emergy versus operational inputs) and the dynamic/static character of the method. Nevertheless, it should be noted that Em + DynDEA and LCA + DEA are not seen as irreconcilable methods but as complementary approaches to enrich decision-making processes.
Figure 3. Comparison of the efficiency scores from ecocentric and anthropocentric approaches.
Resources 05 00008 g003

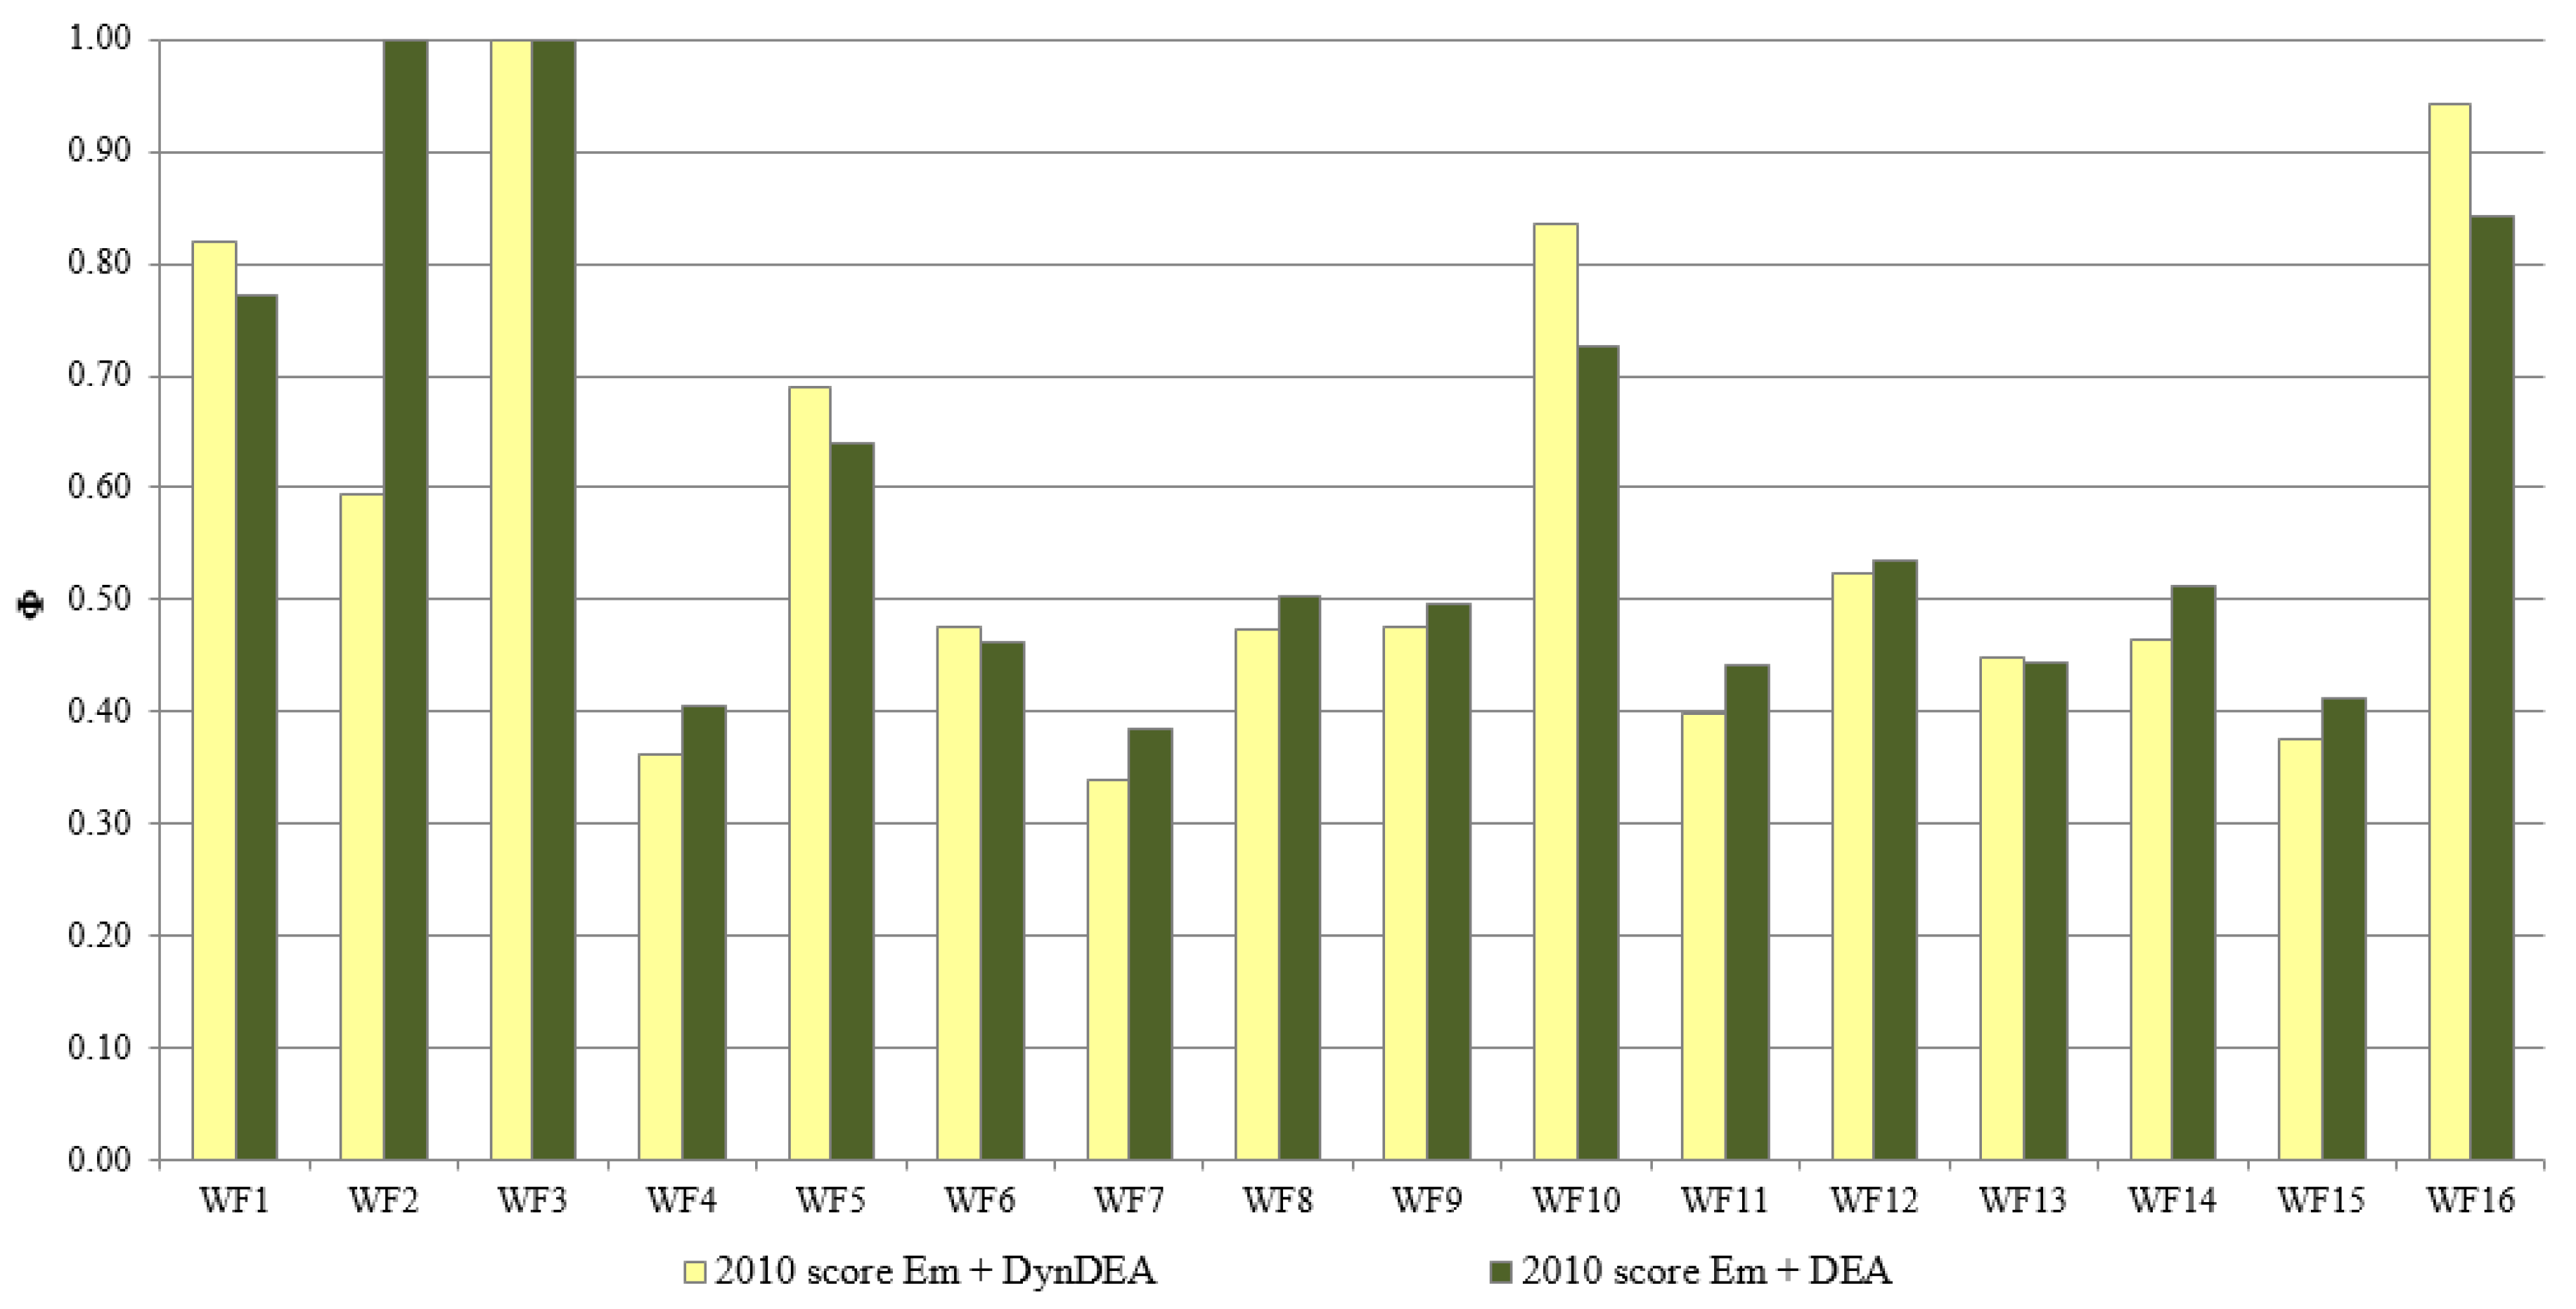
3.3. Comparison of Dynamic and Static Ecocentric Approaches

A comparison between the efficiency scores calculated for a given period through the dynamic Em + DynDEA method and those calculated through the static Em + DEA method for the same sample of wind farms is also carried out. The Em + DEA efficiency scores are computed for the reference year (2010) as detailed in Iribarren et al. [10], but using the reduced sample of WFs considered in the present work.
Figure 4 shows the comparison between the Em + DynDEA and Em + DEA scores for the year 2010. As it can be observed in this figure, the use of the static approach leads to identify WF2 and WF3 as efficient entities, while the dynamic approach leads to only one efficient DMU (WF3). Even though the efficiency scores are generally similar for both ecocentric approaches, the choice of a static/dynamic approach is likely to affect the identification of efficient entities (e.g., WF2) as well as the ranking of DMUs (e.g., WF10). Because emergy values are used as inputs in both approaches, the singularities found in the comparison are associated with the inclusion of the carry-over [20] and the different structure of the DEA matrix [10]. In this sense, the Em + DynDEA method should be understood as an enhancement of the Em + DEA method when evaluating entities with significant time variability.
Figure 4. Comparison of the efficiency scores from dynamic and static ecocentric approaches.
Resources 05 00008 g004

4. Conclusions

When dealing with multiple similar entities, the use of emergy analysis as a life-cycle approach in combination with DEA facilitates a thorough evaluation and benchmarking of the environmental effort made by the biosphere to replace the resources consumed. In particular, when the entities under assessment involve relevant time variations, the combination of emergy analysis with dynamic DEA is concluded to be feasible. Under these circumstances, the use of this novel dynamic ecocentric approach—the Em + DynDEA method—is recommended, rather than the use of static ecocentric approaches. This should be understood as a helpful complement to anthropocentric approaches in order to enrich decision-making processes. As shown through the case study of wind farms, the combined use of emergy analysis and dynamic DEA succeeds in computing resource efficiency for the valuation of ecosystem services, thus complementing anthropocentric assessments while appropriately including relevant time effects.

Acknowledgments

All work presented in this article is part of the internal research activity at the Instituto IMDEA Energía (Spain).

Author Contributions

Both Mario Martín-Gamboa and Diego Iribarren contributed equally to the development of the Em + DynDEA method and its application to wind farms.

Conflicts of Interest

The authors declare no conflict of interest.

References

  1. Bliesner, A.; Liedtke, C.; Welfens, M.J.; Baedeker, C.; Hasselkuß, M.; Rohn, H. “Norm-oriented interpretation learning” and resource use: The concept of “open-didactic exploration” as a contribution to raising awareness of a responsible resource use. Resources 2014, 3, 1–30. [Google Scholar] [CrossRef]
  2. Liedtke, C.; Bienge, K.; Wiesen, K.; Teubler, J.; Greiff, K.; Lettenmeier, M.; Rohn, H. Resource use in the production and consumption system—The MIPS approach. Resources 2014, 3, 544–574. [Google Scholar] [CrossRef]
  3. Bahn-Walkowiak, B.; Steger, S. Resource targets in Europe and worldwide: An overview. Resources 2015, 4, 597–620. [Google Scholar] [CrossRef]
  4. Huysman, S.; Sala, S.; Mancini, L.; Ardente, F.; Alvarenga, R.A.F.; De Meester, S.; Mathieux, F.; Dewulf, J. Toward a systematized framework for resource efficiency indicators. Resour. Conserv. Recy. 2015, 95, 68–76. [Google Scholar] [CrossRef] [Green Version]
  5. Hagelaar, G.J.L.F.; van der Vorst, J.G.A.J. Environmental supply chain management: Using life cycle assessment to structure supply chains. Int. Food Agribus. Manage. Rev. 2001, 4, 399–412. [Google Scholar] [CrossRef]
  6. Buonocore, E.; Vanoli, L.; Carotenuto, A.; Ulgiati, S. Integrating life cycle assessment and emergy synthesis for the evaluation of a dry steam geothermal power plan in Italy. Energy 2015, 86, 476–487. [Google Scholar] [CrossRef]
  7. Neri, E.; Rugani, B.; Benetto, E.; Bastianoni, S. Emergy evaluation vs. life cycle-based embodied energy (solar, tidal and geothermal) of wood biomass resources. Ecol. Indic. 2014, 36, 419–430. [Google Scholar] [CrossRef]
  8. Sonnemann, G.; Gemechu, E.D.; Adibi, N.; De Bruille, V.; Bulle, C. From a critical review to a conceptual framework for integrating the criticality of resources into life cycle sustainability assessment. J. Clean Prod. 2015, 94, 20–34. [Google Scholar] [CrossRef]
  9. Raugei, M.; Rugani, B.; Benetto, E.; Ingwersen, W.W. Integrating emergy into LCA: Potential added value and lingering obstacles. Ecol. Model. 2014, 271, 4–9. [Google Scholar] [CrossRef]
  10. Iribarren, D.; Vázquez-Rowe, I.; Rugani, B.; Benetto, E. On the feasibility of using emergy analysis as a source of benchmarking criteria through data envelopment analysis: A case study for wind energy. Energy 2014, 67, 527–537. [Google Scholar] [CrossRef]
  11. Odum, H.T. Self-organization, transformity, and information. Science 1988, 242, 1132–1139. [Google Scholar] [CrossRef] [PubMed]
  12. Odum, H.T. Environmental Accounting: Emergy and Environmental Decision Making; John Wiley & Sons: New York, NY, USA, 1996. [Google Scholar]
  13. Sciubba, E.; Ulgiati, S. Emergy and exergy analyses: Complementary methods or irreducible ideological options? Energy 2005, 30, 1953–1988. [Google Scholar] [CrossRef]
  14. Raugei, M. Emergy indicators applied to human economic systems—A word of caution. Ecol. Model. 2011, 222, 3821–3822. [Google Scholar] [CrossRef]
  15. Pizzigallo, A.C.I.; Granai, C.; Borsa, S. The joint use of LCA and emergy evaluation for the analysis of two Italian wine farms. J. Environ. Manage. 2008, 86, 396–406. [Google Scholar] [CrossRef] [PubMed]
  16. Reza, B.; Sadiq, R.; Hewage, K. Emergy-based life cycle assessment (Em-LCA) of multi-unit and single-family residential buildings in Canada. Int. J. Sust. Built Environ. 2014, 3, 207–224. [Google Scholar] [CrossRef]
  17. Brown, M.T.; Raugei, M.; Ulgiati, S. On boundaries and ‘investments’ in emergy synthesis and LCA: A case study on thermal vs. photovoltaic electricity. Ecol. Indic. 2012, 15, 227–235. [Google Scholar] [CrossRef]
  18. Cooper, W.W.; Seiford, L.M.; Tone, K. Data Envelopment Analysis: A Comprehensive Text with Models, Applications, References and DEA-Solver Software; Springer: New York, NY, USA, 2007. [Google Scholar]
  19. Vázquez-Rowe, I.; Iribarren, D. Review of life-cycle approaches coupled with data envelopment analysis: Launching the CFP + DEA method for energy policy making. Sci. World J. 2015, 2015. [Google Scholar] [CrossRef] [PubMed]
  20. Tone, K.; Tsutsui, M. Dynamic DEA: A slacks-based measure approach. Omega 2010, 38, 145–156. [Google Scholar] [CrossRef]
  21. Marvuglia, A.; Benetto, E.; Rios, G.; Rugani, B. SCALE: Software for calculating emergy based on life cycle inventories. Ecol. Model. 2013, 248, 80–91. [Google Scholar] [CrossRef]
  22. Rugani, B.; Huijbregts, M.A.J.; Mutel, C.; Bastianoni, S.; Hellweg, S. Solar energy demand (SED) of commodity life cycles. Environ. Sci. Technol. 2011, 45, 5426–5433. [Google Scholar] [CrossRef] [PubMed]
  23. Zhou, Y.; Yang, N.; Hu, S. Industrial metabolism of PVC in China: A dynamic material flow analysis. Resour. Conserv. Recy. 2013, 73, 33–40. [Google Scholar] [CrossRef]
  24. Kumar, Y.; Ringenberg, J.; Depuru, S.S.; Devabhaktuni, V.K.; Lee, J.W.; Nikolaidis, E.; Andersen, B.; Afjeh, A. Wind energy: Trends and enabling technologies. Renew. Sust. Energ. Rev. 2016, 53, 209–224. [Google Scholar] [CrossRef]
  25. Kaplan, Y.A. Overview of wind energy in the world and assessment of current wind energy policies in Turkey. Renew. Sust. Energ. Rev. 2015, 43, 562–568. [Google Scholar] [CrossRef]
  26. Macroeconomic Study on the Impact of Wind Energy in Spain; Spanish Wind Energy Association; AEE: Madrid, Spain, 2011.
  27. Spanish Ministry of Industry, Energy and Tourism. Available online: http://www.minetur.gob.es (accessed on 3 December 2015).
  28. Iribarren, D.; Martín-Gamboa, M.; Dufour, J. Environmental benchmarking of wind farms according to their operational performance. Energy 2013, 61, 589–597. [Google Scholar] [CrossRef]
  29. Frischknecht, R.; Jungbluth, N.; Althaus, H.J.; Doka, G.; Heck, T.; Hellweg, S.; Hischier, R.; Nemecek, T.; Rebitzer, G.; Spielmann, M.; et al. Overview and Methodology; Ecoinvent Report No. 1; Swiss Centre for Life Cycle Inventories: Dübendorf, Switzerland, 2007. [Google Scholar]
  30. European Environment Agency. EMEP/EEA Air Pollutant Emission Inventory Guide Book 2009; EEA: Copenhagen, Denmark, 2009. [Google Scholar]
  31. Goedkoop, M.; Oele, M.; Leijting, J.; Ponsioen, T.; Meijer, E. Introduction to LCA with SimaPro; PRé Consultants: Amersfoort, the Netherlands, 2013. [Google Scholar]
  32. Tone, K. A slacks-based measure of efficiency in data envelopment analysis. Eur. J. Oper. Res. 2001, 130, 498–509. [Google Scholar] [CrossRef]
  33. Pastor, J.T.; Ruiz, J.L.; Sirvent, I. An enhanced DEA Russell graph efficiency measure. Eur. J. Oper. Res. 1999, 115, 596–607. [Google Scholar] [CrossRef]
  34. Tone, K.; Tsutsui, M. Dynamic DEA with network structure: A slacks-based measure approach. Omega 2014, 42, 124–131. [Google Scholar] [CrossRef]
  35. Saitech, Data Envelopment Analysis Software. Available online: http://www.saitech-inc.com/Products/Prod-DSP.asp (accessed on 3 December 2015).

