1. Introduction
The production and consumption of electricity is a key factor for economic growth and its demand notes an upward trend. At the same time, it is considered among the most polluting activities, having a great impact on the natural and human environment (pollution, greenhouse effect, climate change). RES have been introduced as a counterproposal against the polluting conventional energy production.
Despite the fact that RES are committed to clean energy without the harmful effects of pollution, they still have an adverse environmental impact, which should be taken into consideration for an integrated and sustainable spatial-energy design.
The present paper focuses on Wind Energy (WE) as it has gained a leading role in energy production industry internationally. In Greece, according to current legislation, WE participates in the mix of RES of the national target “20-20-20”, having a percentage of more than 50%.
The aim of siting policy should be the formulation of a clear framework of spatial criteria, allowing both the emergence of viable RES installations and the harmonious integration of them into the natural and human environment locally. At the same time, it should look forward to achieving the energy targets that have been set at a national and European level. The legislative framework for RES siting in Greece has been lately reformed in order to address the main development barriers arising due to bureaucratic constraints, lengthy licensing procedures and deficiencies of the national spatial planning [
1]. It consists mainly of two Laws: “Special Framework for Spatial Planning and Sustainable Development for RES" (SFSPSD-RES) in 2008 and Law 3851/2010 "Accelerating the development of Renewable Energy to address climate change and other provisions [...]" in 2010. WF siting policies have to take into consideration all vulnerable ecosystems and land-uses of potential conflict [
2]. However, the existing framework provides mapping of the Wind Priority Areas (WPA), based on the existing wind energy potential which is high at mountains and ridges, without showing installation exclusion areas or areas of special protection. It should be noted that 95% of the existing WFs in Greece are located in forested areas [
3]. Thereby, the mapping does not exclude the protected areas.
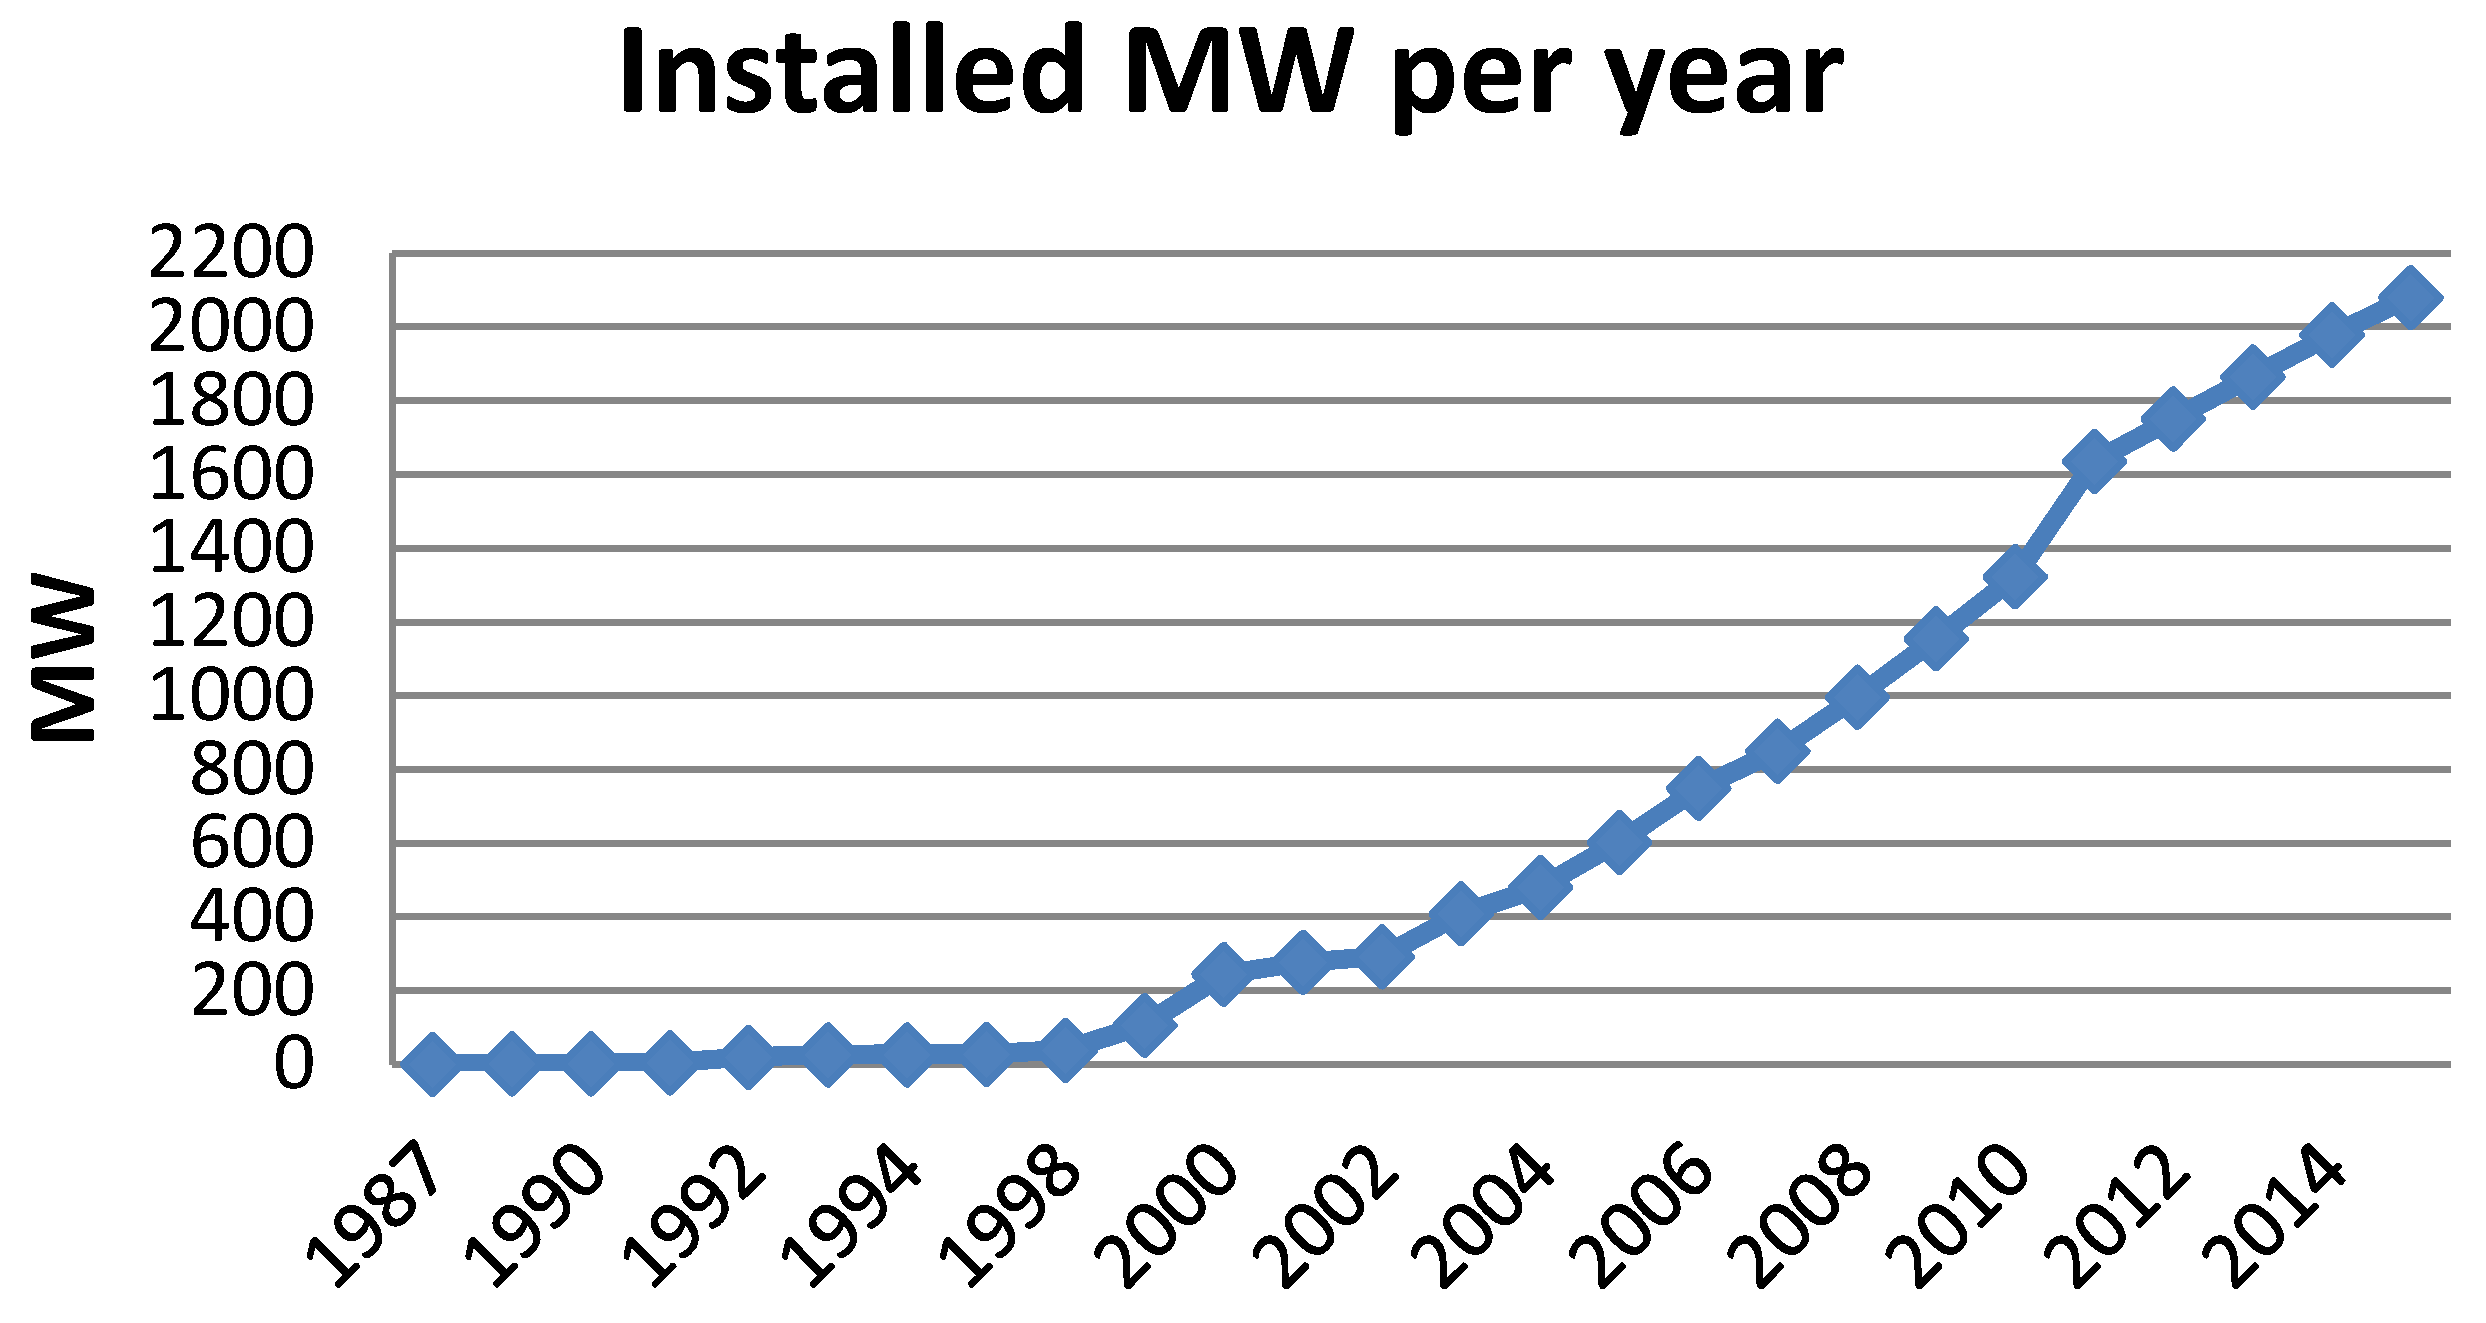
The WF development in Greece has been effectively started since 2001 and the liberalization of the electricity market. During the years 2010–2011, despite the severe economic crisis, there was a rapid investment growth as demonstrated in
Chart 1. This could partly be attributed to the aforementioned reform of the legal framework. It should also be mentioned that according to Kambezidis et al. [
4], there is a tendency for new developments to be placed in the mainland, not the non-interconnected island, as units of the mainland run up to 79.6% in 2005 and 87.1% in 2010 of total RES units.
There is great research effort on the development of WF siting methodology, which is presented and discussed in depth in
Section 3. The vast majority of them are oriented to techno economic issues, such as the maximization of WE potential exploitation. On the other hand, there is a lack of studies addressing the minimization of the environmental damage of WF installation.
The main objective of the study is the development of a methodological framework for WF siting, focusing on the environmental protection. More specifically, the aim of the method is to identify the environmentally optimal locations for WF installation. There is special consideration to the particular characteristics of insular areas in order to supplement the existing legislation on WF siting. The methodology formed could be used by the competent authorities as an auxiliary tool for the assessment of the numerous installation applications that have already been submitted to the Regulatory Authority for Energy (RAE), as it is applicable throughout the Greek territory.
The method is experimentally applied in the group of the Dodecanese Islands. The area has been selected mainly because of its fragmented insular nature, as it is a group of islands that is remote, and not interconnected to the energy grid of the mainland [
6]. Additionally, there is an increased difficulty in WF siting policy making because of the intense tourism taking place.
2. Islands’ Energy Challenges
The present section briefly discusses the major energy challenges islands face for a better understanding of the broader issue of energy planning for insular areas nationally and internationally. Globally, islands occupy 1/6 of the earth’s surface and accommodate 10% of its population [
7]. Remote islands require special care, regarding the energy planning. Therefore, there are a great number of cooperation programs referring to the islands at international, EU and local levels [
8,
9,
10,
11,
12]. The EU also has ambitious plans such as the “Pact of Islands” and “Towards 100% Renewable Energy for Small Islands”, which promote the fulfillment of European objectives by 2020 and the energy autonomy of islands [
13,
14].
The major concern is that non-interconnected islands use imported oil or similar fuels, which are both polluting and expensive sources of energy [
15]. Mondol and Koumpetsos [
1] name as additional problems economically challenging conventional energy production, the failure of base load due to the small size of power plants, the rapid growth of consumption rate and the seasonal demand, caused by tourism. Because of the intense annual seasonality of the energy consumption, the installed power plants are proportionally much larger in order to cover demand peaks.
2.1. RES Integration Increase
Beyond the economic dimension of the problem, a large number of studies propose increased RES penetration in the micro-energy network of islands, in order to reduce the environmental impacts of petroleum combustion. Interconnected islands have the privilege of being part of a large power grid which allows them have a 100% renewable energy production. Similar studies have been conducted for Samsoe Island, Denmark [
16], Pellworm Island, Germany [
17] and Fox Island, United States [
18].
Non-interconnected islands face the difficulties of small energy networks, which are the low frequency and voltage [
19]. At the same time, RES do not provide sustained energy supply as they depend on the changing climatic conditions such as sunshine and wind. Penetration limitations are due to the technical minimum operation of thermal power plants, the network stability and reliability issues.
Studies on island electricity networks powered by conventional power production give a 25%–35% maximum RES penetration [
19,
20,
21]. Neves et al. [
21] argue that the optimum application of a hybrid system for islands of more than 5000 inhabitants is the combination of diesel engines, wind turbines and photovoltaic systems. Similar studies have been conducted for a great number of islands, including the Maldives [
22] and Kutubdia Island Bangladesh [
23].
The only way to achieve greater RES penetration rates in the energy network is to store energy. There are three main types of energy storage: batteries [
24,
25], pumped storage [
26,
27] and hydrogen storage [
28,
29,
30,
31]. The advantages and disadvantages of each one need to be studied in association with the possibilities and limitations of installation areas.
Finally, "smart grids" is another powerful tool for the integration and penetration increase of RES in the electricity generation system. It is the cutting-edge technology for the reliable integration and efficient control of multiple power units of the same distribution electricity network. The tool is designed to reduce transmission losses, to optimize the energy capacity of the network and facilitate the integration of renewable energy [
32].
2.2. Energy Interconnection
According to the international bibliography, island interconnection to the electricity network of the mainland is the proposed solution wherever possible. Unfortunately, in Greece, the application of it is complicated because of the great number and the scattered nature of islands, especially in the Aegean Sea. Technically, it is possible to interconnect even the most remote group of islands. According to Κaramanou et al. [
33], the criterion whether to develop the interconnection or not is the investment viability. The condition for a sustainable investment is the electricity production and distribution expenses in the mainland to be less expensive than the insular ones, including interconnection costs. In addition, the possibility of RES development at local level as well as the technical advantages of the new system, including reliability and quality of provision, are taken into consideration.
The last few years, the scientific community shows an increasing concern about the issue of island electricity interconnection to the mainland [
6,
33,
34,
35,
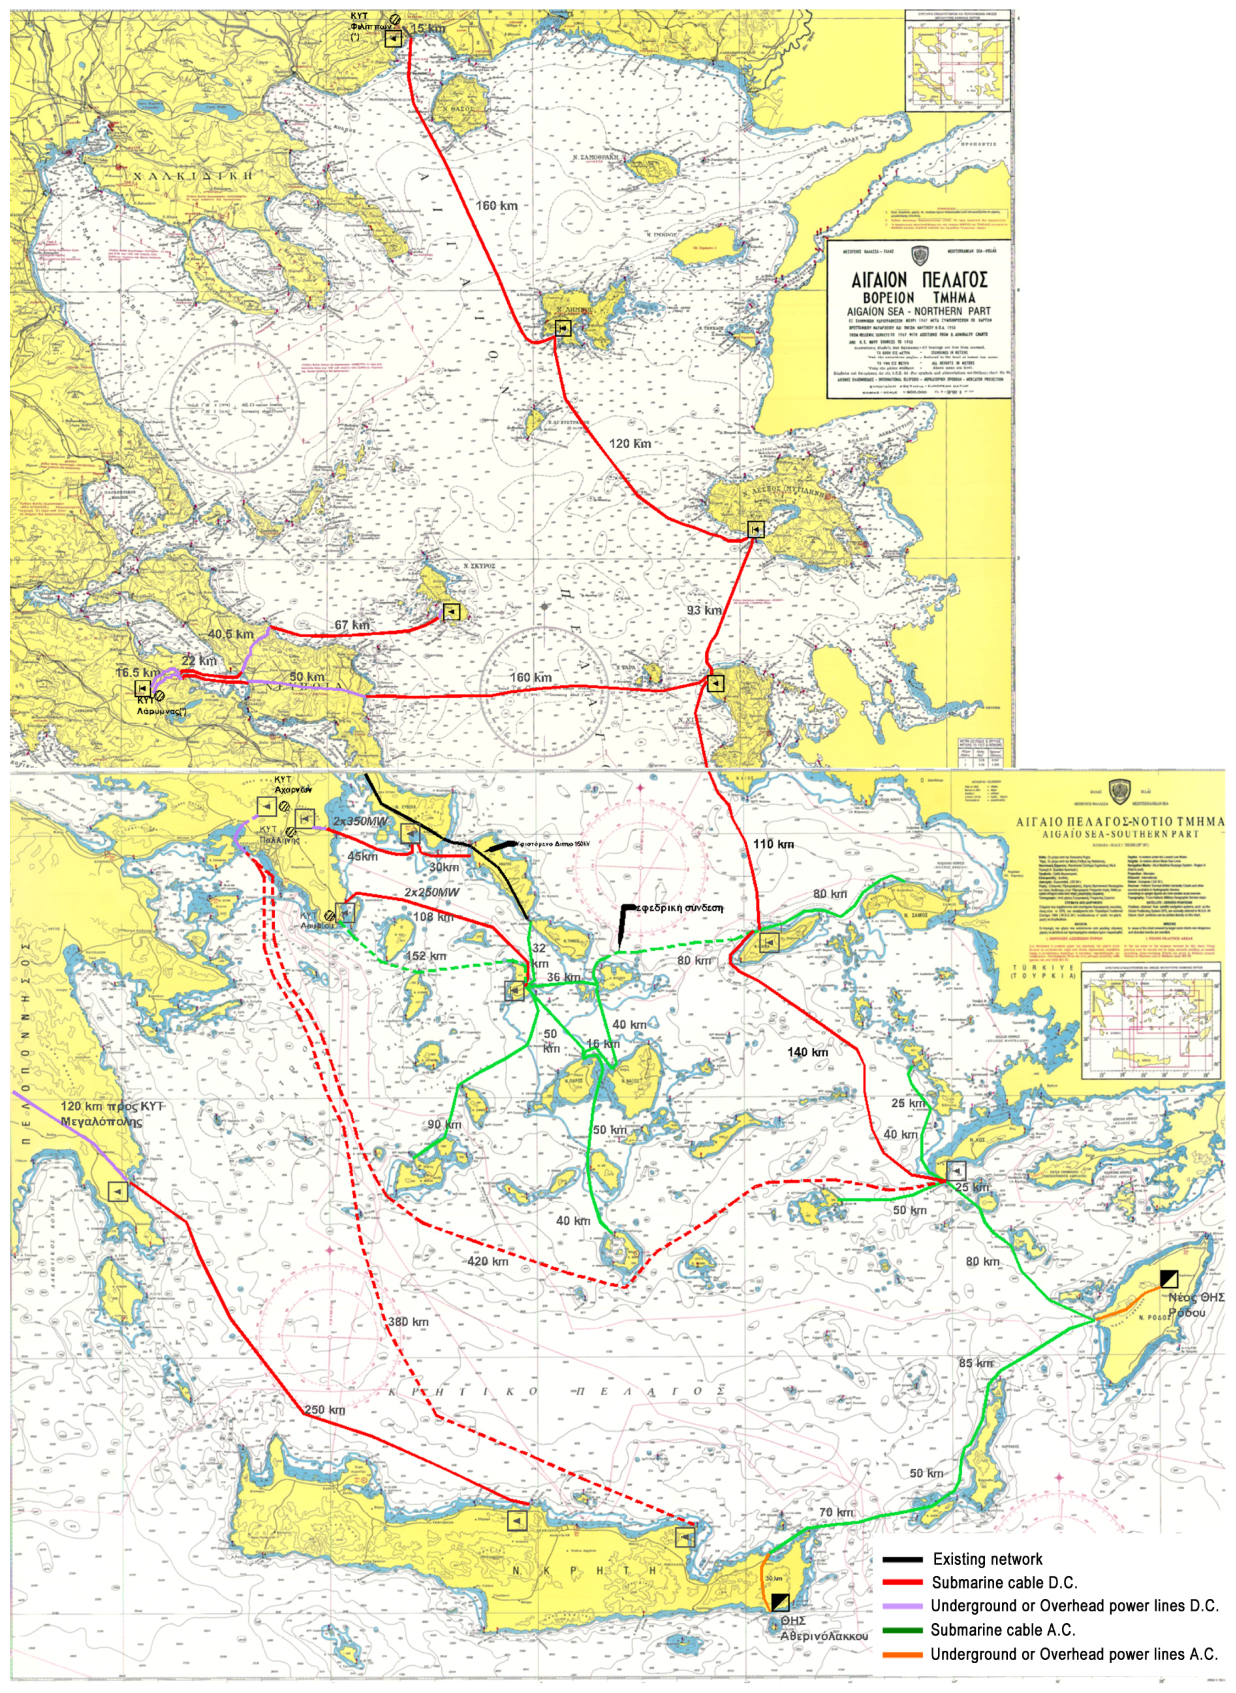
36]. There are also numerous studies, undertaken by the Public Power Corporation (PPC), the RAE and academic institutions. More specifically, in 1988, PPC had conducted a study on the interconnection of Crete Island with the electricity network of the mainland and in 1989, a study on the interconnection of Cyclades. National Technical University of Athens had also conducted a number of studies for the interconnection of Cyclades in 2004–2005 [
37] and the entire Aegean Sea, including Crete [
38]. All interconnection proposals for the Aegean Islands are illustrated in
Figure 1.
Similar studies have been carried out by individuals who are willing to bear the cost of islands interconnection to the electricity grid of the mainland, in order to install large farms in island regions, especially in the Cyclades and the North Aegean Sea. Those studies, both at international [
18] and national level [
40], suggest extensive RES installations, way larger than the local energy demand.
It is worth mentioning that the issue of island interconnection came back to the fore in the 1990s because of the exploitability of high potential renewables (wind, solar) islands have. In the Aegean Sea alone, there is an enormous number of MWs of wind power installation applications waiting for approval.
2.3. Siting Policy on Greek Islands
In Greece, there is an institutional gap regarding WF siting on islands. The legal framework addresses the mainland and the island the same way, thus not taking into account the specificities of insular areas, which occupy a large spatial proportion of the country. The only parameter that changes is the maximum wind turbine density per km2, which is slightly smaller than the rest of the country. For non-interconnected islands, the installed capacity of wind power stations should not exceed twice the peak level of demand, as stipulated in the medium-long term (ten years) plan.
Despite the fact that there are a significant number of studies concerning WF siting on islands since 1998 [
40,
41,
42,
43], there is not use any special provision for these areas. Most of the times, they simply apply the existing insufficient legislation.
3. Methodology
3.1. A Review
It was during early 2000s when the first wind farm siting studies took place [
39,
40]. They were limited to the delimitation of exclusion zones around urban areas, historic sites and water bodies, in order to protect sensitive areas from wind farm development. These criteria were used in order simple exclusion maps to be formed.
In the following years, with more detailed datasets, spatial assessment developed acquiring its current form of spatial multi-criteria evaluation [
41,
44,
45,
46,
47,
48,
49,
50,
51,
52,
53,
54]. This process has two types of quantifiable parameters, constraints and criteria. Constrains are based on Boolean criteria (0–1) and thereby exclude areas. Similarly, criteria get satisfaction degrees for all geographical areas. Removing exclusion areas, the criteria used define suitability areas, which take continuous values between one (1) and zero (0). The individual satisfaction degrees of each criterion are aggregated, using multi-criteria decision methods (MCDM).
There are several weighted summation procedures commonly used: the Linear Weighting Average (LWA), the Ordered Weighted Average (OWA) and the Analytical Hierarchy Process (AHP). Baban and Parry [
44] used the LWA method to work on wind turbines siting in Britain, Hansen [
45] to locate suitable areas for wind turbines siting at Northern Jutland and Denmark and Rodman and Meentmeyer [
46] to work on wind turbine placement in Northern California. Yonca et al. [
47] applied the OWA process to evaluate wind energy systems for spatial planning in western Turkey. AHP has been used by Bennui et al. [
48] for site evaluation of wind farm installation in Thailand and Tegou et al. [
41] in Lesvos Island, Greece.
Al-Yahyai et al. [
49] combined OWA and AHP for result aggregation of different criteria to assess land suitability for wind farm siting in Oman. AHP and OWA do not operate at the same level [
50] as AHP creates a hierarchical model using weighted linear combination [
51], while OWA operators make series of local aggregations [
52]. According to Yager and Kelman [
53], together they create a powerful MCDM tool for spatial decision problems.
There are also different decision making methods, based on a spatial cost-revenue optimization. Haaren and Fthenakis [
54] have applied such a process on wind farm site selection in New York.
3.2. Methodology Used
Wind farm siting is a multi-criteria decision making problem. The selection is made by a number of alternative locations in accordance with a set of selection criteria. All available options include a degree of uncertainty as to the overall efficiency degree in various areas such as economic, technical, environmental and social [
55]. The optimum choice is made based on the level of criteria satisfaction and the degree of optimism or pessimism of the decision maker. The AHP, firstly introduced by Saaty [
51], is a popular and flexible method as it allows decision-makers to structure a complex problem in a hierarchical way.
The method will be integrated into the Geographic Informational System (GIS) environment. GIS has emerged as an important tool for planning and spatial management. The reason is that it includes decision making processes for multi-criteria problems [
56]. Therefore, it does not only serve for data management and the visualization of results but also for the evaluation of alternatives, based on spatial criteria [
57]. Thus, a really powerful tool is formed that can manage complex geospatial data, integrating stakeholders’ preference into the decision-making process [
58].
For the needs of the study, satellite remote sensing images and data analysis methods will be employed. Earth observation satellites carry sensors that record representations, in different regions of the spectrum (channels) of electromagnetic radiation, which are either absorbed or reflected by earth surface, depending on the wavelength. The above technique is used to record vegetation density of the study area, using mathematical formulas between channels of a remote-sensing imaging.
However strong the method is, WF siting is a spatial issue having social, cultural, political and other aspects, which are hard to quantify in order to be part of the process. The method is designed to be used as a first-level assessment tool, not a final one. Hence, in order the final decision to be made, in situ inspections have to be occurred.
The process is presented at
Section 4, accompanied by the necessary data and tools used. Results are presented and discussed in
Section 5. The final section ties up the key points of the study.
3.2.1. The AHP Method
It has already been mentioned that the AHP belongs to the MCDM and is prevalent in sustainable energy planning. The process starts by identifying the important parameters for the decision making process. The AHP creates a hierarchical structure consisting of successive levels, starting from the overall objective, criteria and sub-criteria, and ending on the alternatives given.
The method employs a pair-wise comparison measurement mode to quantify the importance of each criterion or sub-criterion, using a nine point internal scale. The comparison matrix created shows the relative importance of one criterion over another. For criteria i, j and k, relative weights are consistent only when Τ
ik = T
ij × T
jk. The weight of each criterion and the total Consistency Ration (CR) are calculated, composing the pairwise comparison data [
51].
3.2.2. Software and Data
The proposed methodology was performed in the ArcMap 10.1 GIS environment, where a number of data were selected and processed, after being transformed to raster datasets. The satellite data used came from the satellite Landsat 8. The data cell size of Landsat 8 is 30 × 30 m, the size adopted for all raster datasets used. Satellite images are processed through ER Mapper 7.0 software, which offers capabilities for enhancing, visualizing and processing surface interpretations in order to extract the quantitative information needed.
4. Case Study: The Dodecanese Islands
4.1. Area of Study
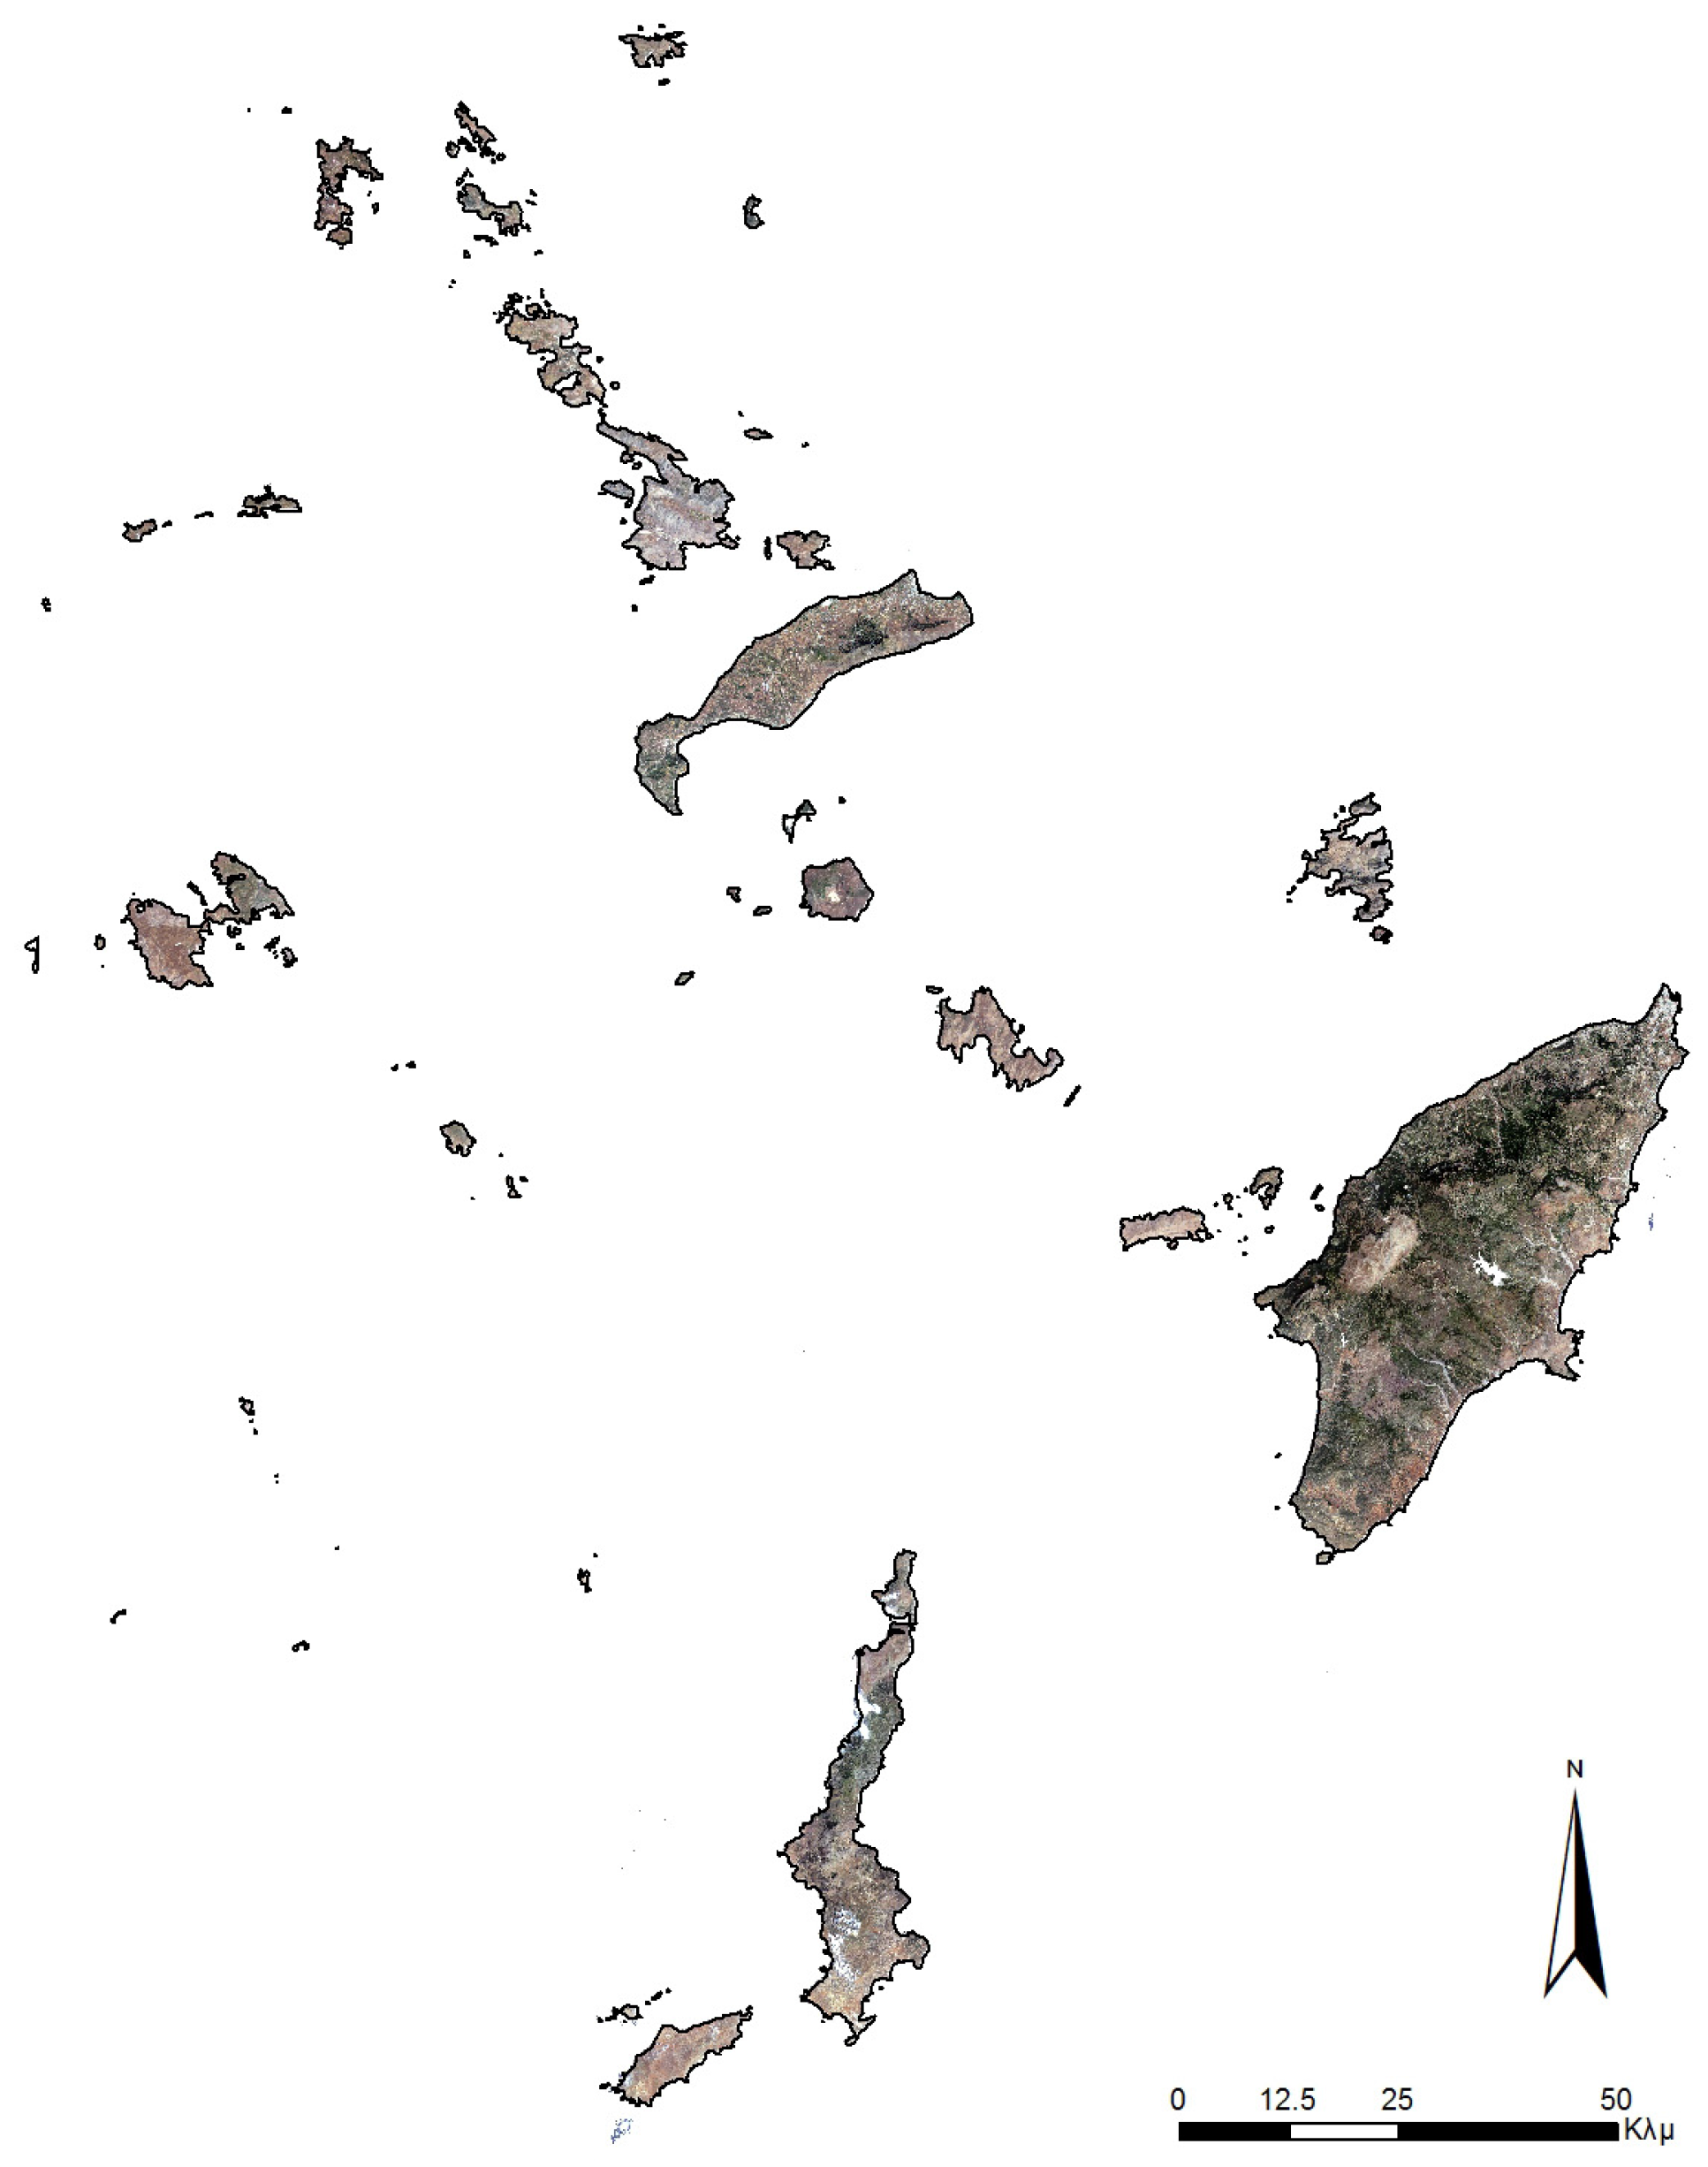
The Dodecanese are located at the southeast of the Aegean Sea, as seen in
Figure 2, which is the farthest frontier of Southeastern Europe. It is a group of 27 inhabited and numerous uninhabited islands and they occupy an area of 2714 km
2. They operate as a number of small or medium size isolated electric systems, which serve the needs of a single island or a group of islands. Today, there are 11 autonomous electric systems (AES), consisting mainly of oil units as well as other types of thermal stations.
Unfortunately, there is no short or medium term prospect of electricity network interconnection to the mainland. According to the Hellenic Transmission System Operator [
39], there are two probable scenarios: either a straight interconnection to the mainland or an interconnection through Crete.
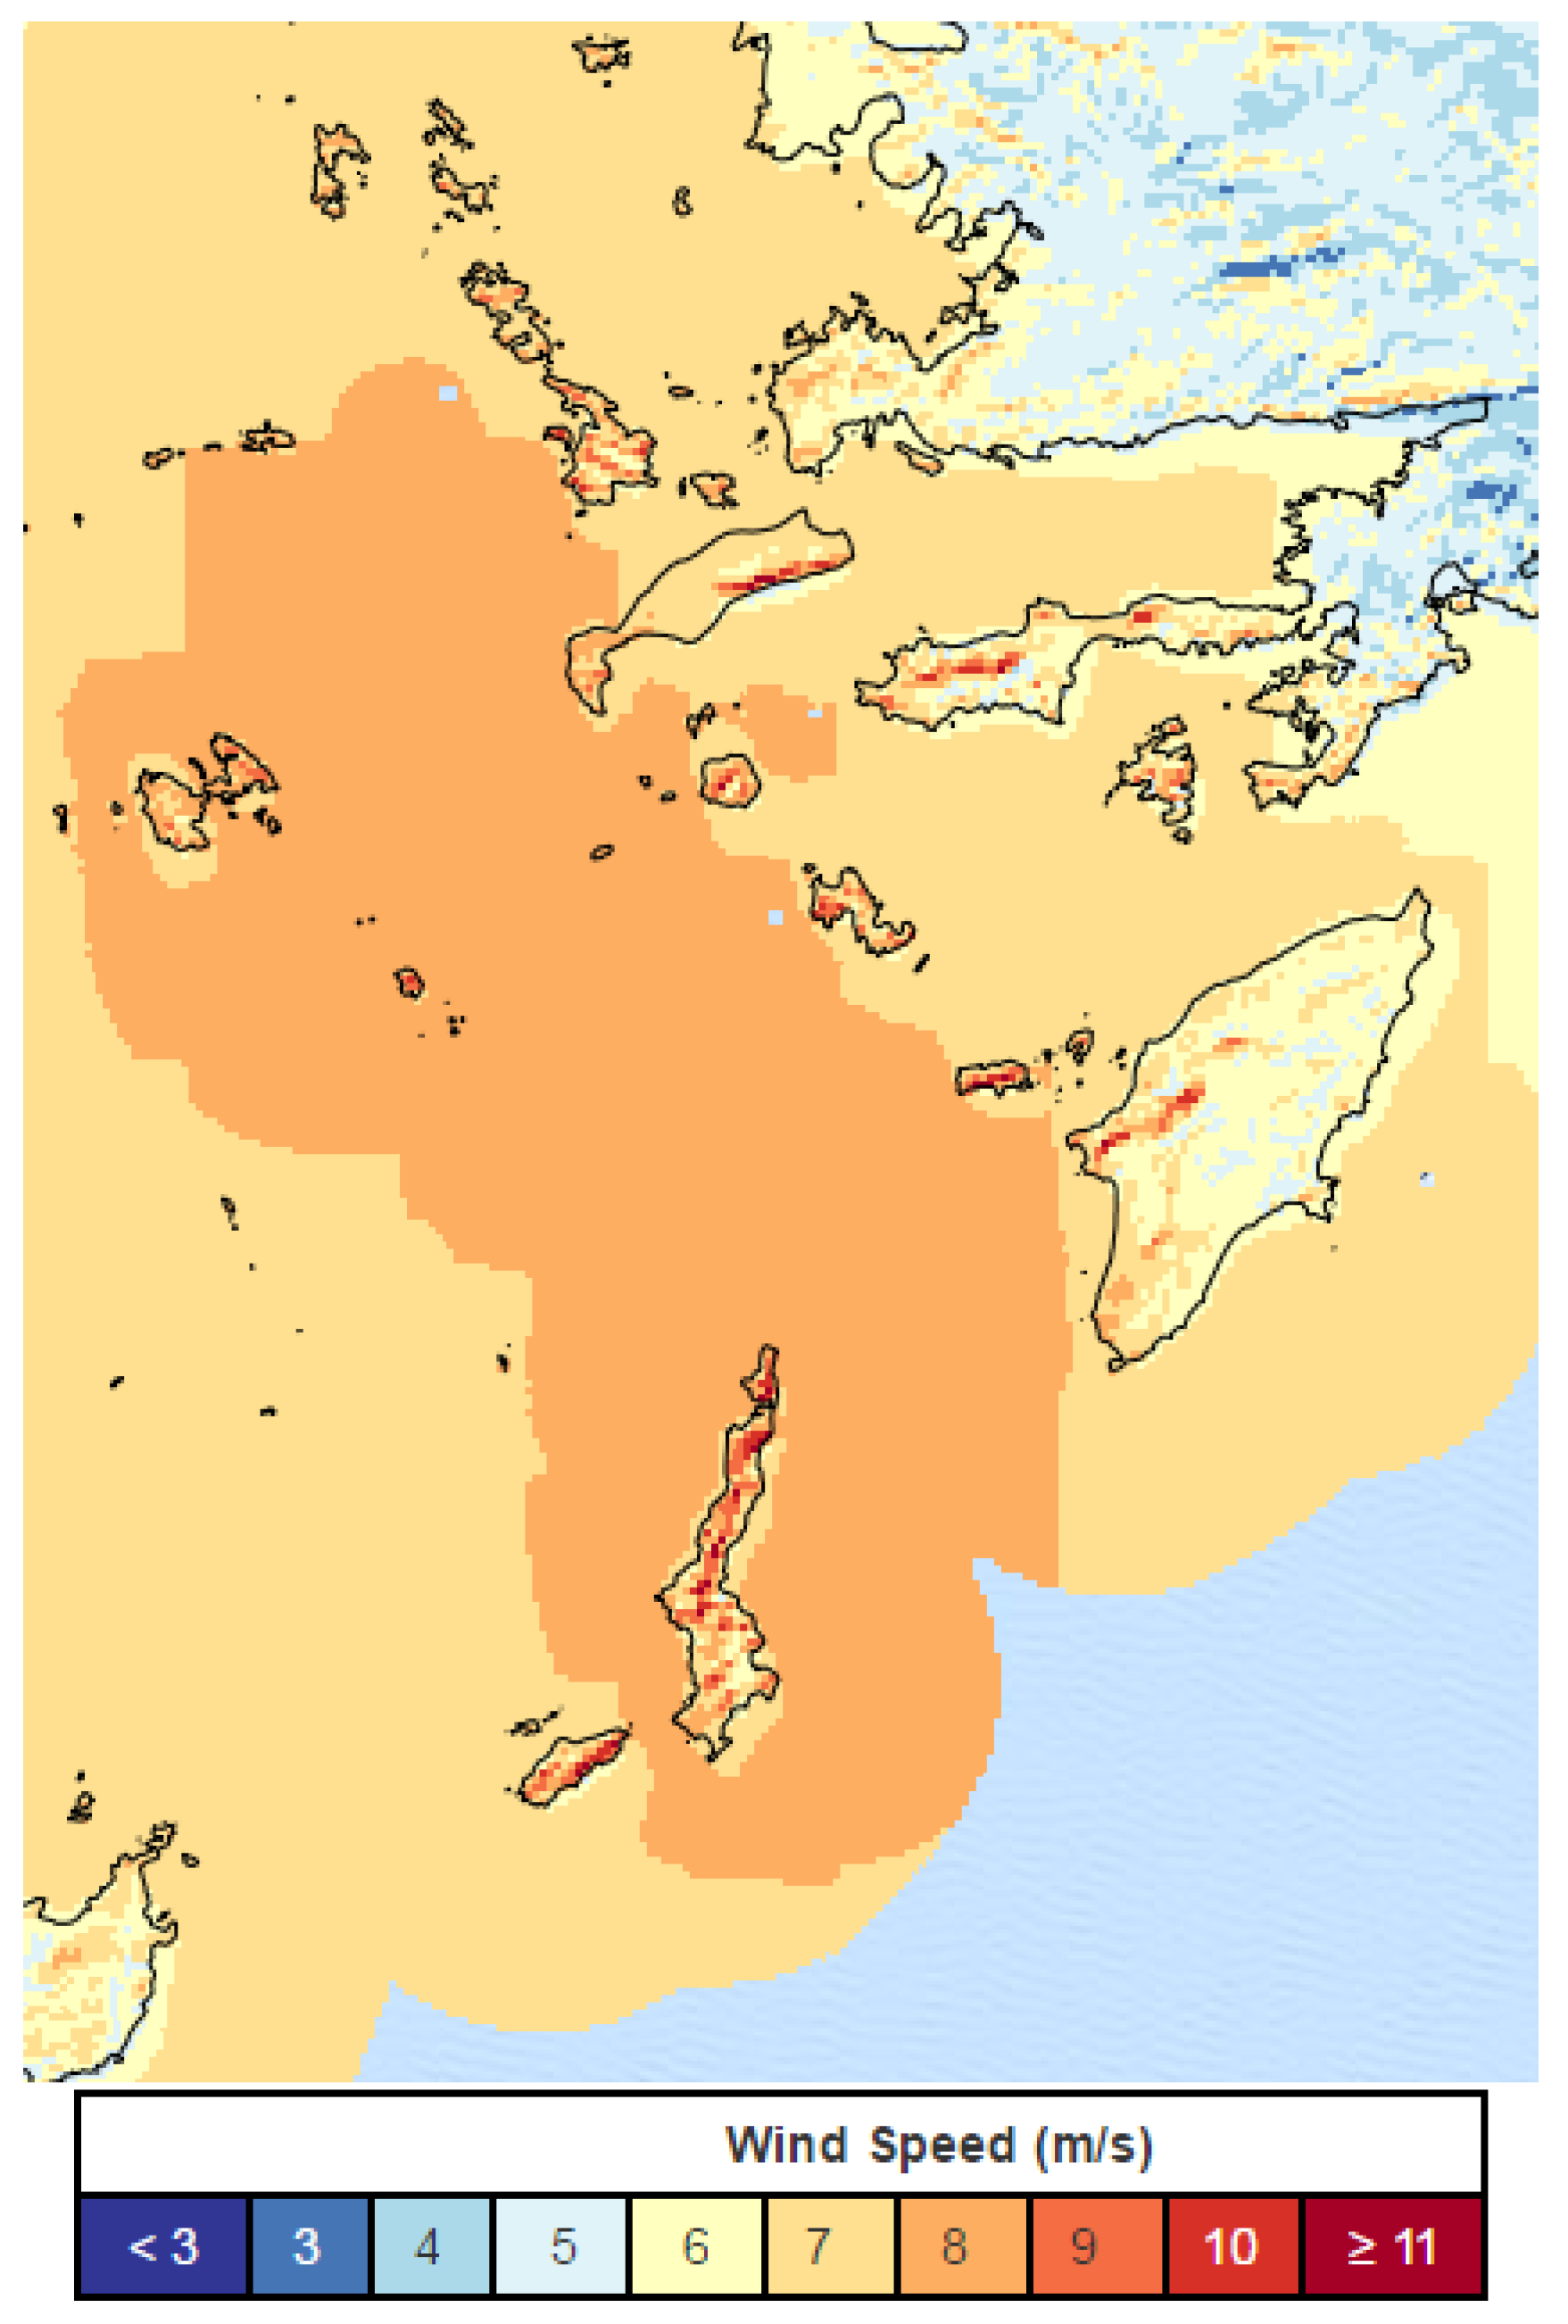
The Dodecanese Islands have great potential for solar and wind energy. Nisyros Island has a quite remarkable geothermal potential (high enthalpy geothermal fields). The study of the Centre for Renewable Energy Sources and Saving [
59] on the wind potential of the country has demonstrated that most the Dodecanese Islands show more than 7 m/s average wind speed.
Figure 3 is a mesoscale map of the aggregated mean wind energy of the area, measured 100 m above sea level.
Nevertheless, RES exploitation for electricity production has started 10 years earlier. Today, the installed capacity of WFs reaches 14% of the total and is concentrated at Rhodes, Kos and Karpathos Islands (
Table 1), while the produced energy of them does not exceed the average of 9% of the yearly energy production of the area.
According to National Action Plan for RES, the total installed capacity of WFs in Greece should be 7.5 GW by 2020. Correspondingly, the Dodecanese that consume 2.15% of the total energy consumption of the country and have 66.78 MW already installed WFs, approximately need another 161.25 MW.
4.2. The Process, Step-by-Step
The overall goal is to determine the suitability of wind farm potential locations, considering a set of attributes. These attributes are of a technical, environmental, economic, social and cultural nature and correspond to constraints and criteria of the decision making problem. Constraints are based on a true/false relation, which means that an area is either included or excluded. Criteria get continuous values to express the suitability degree of an area to each alternative. An overall suitability index is calculated for every location, based on criteria weights. Finally, the overall map is produced, combining the exclusion map with the evaluation map.
4.2.1. Constraints
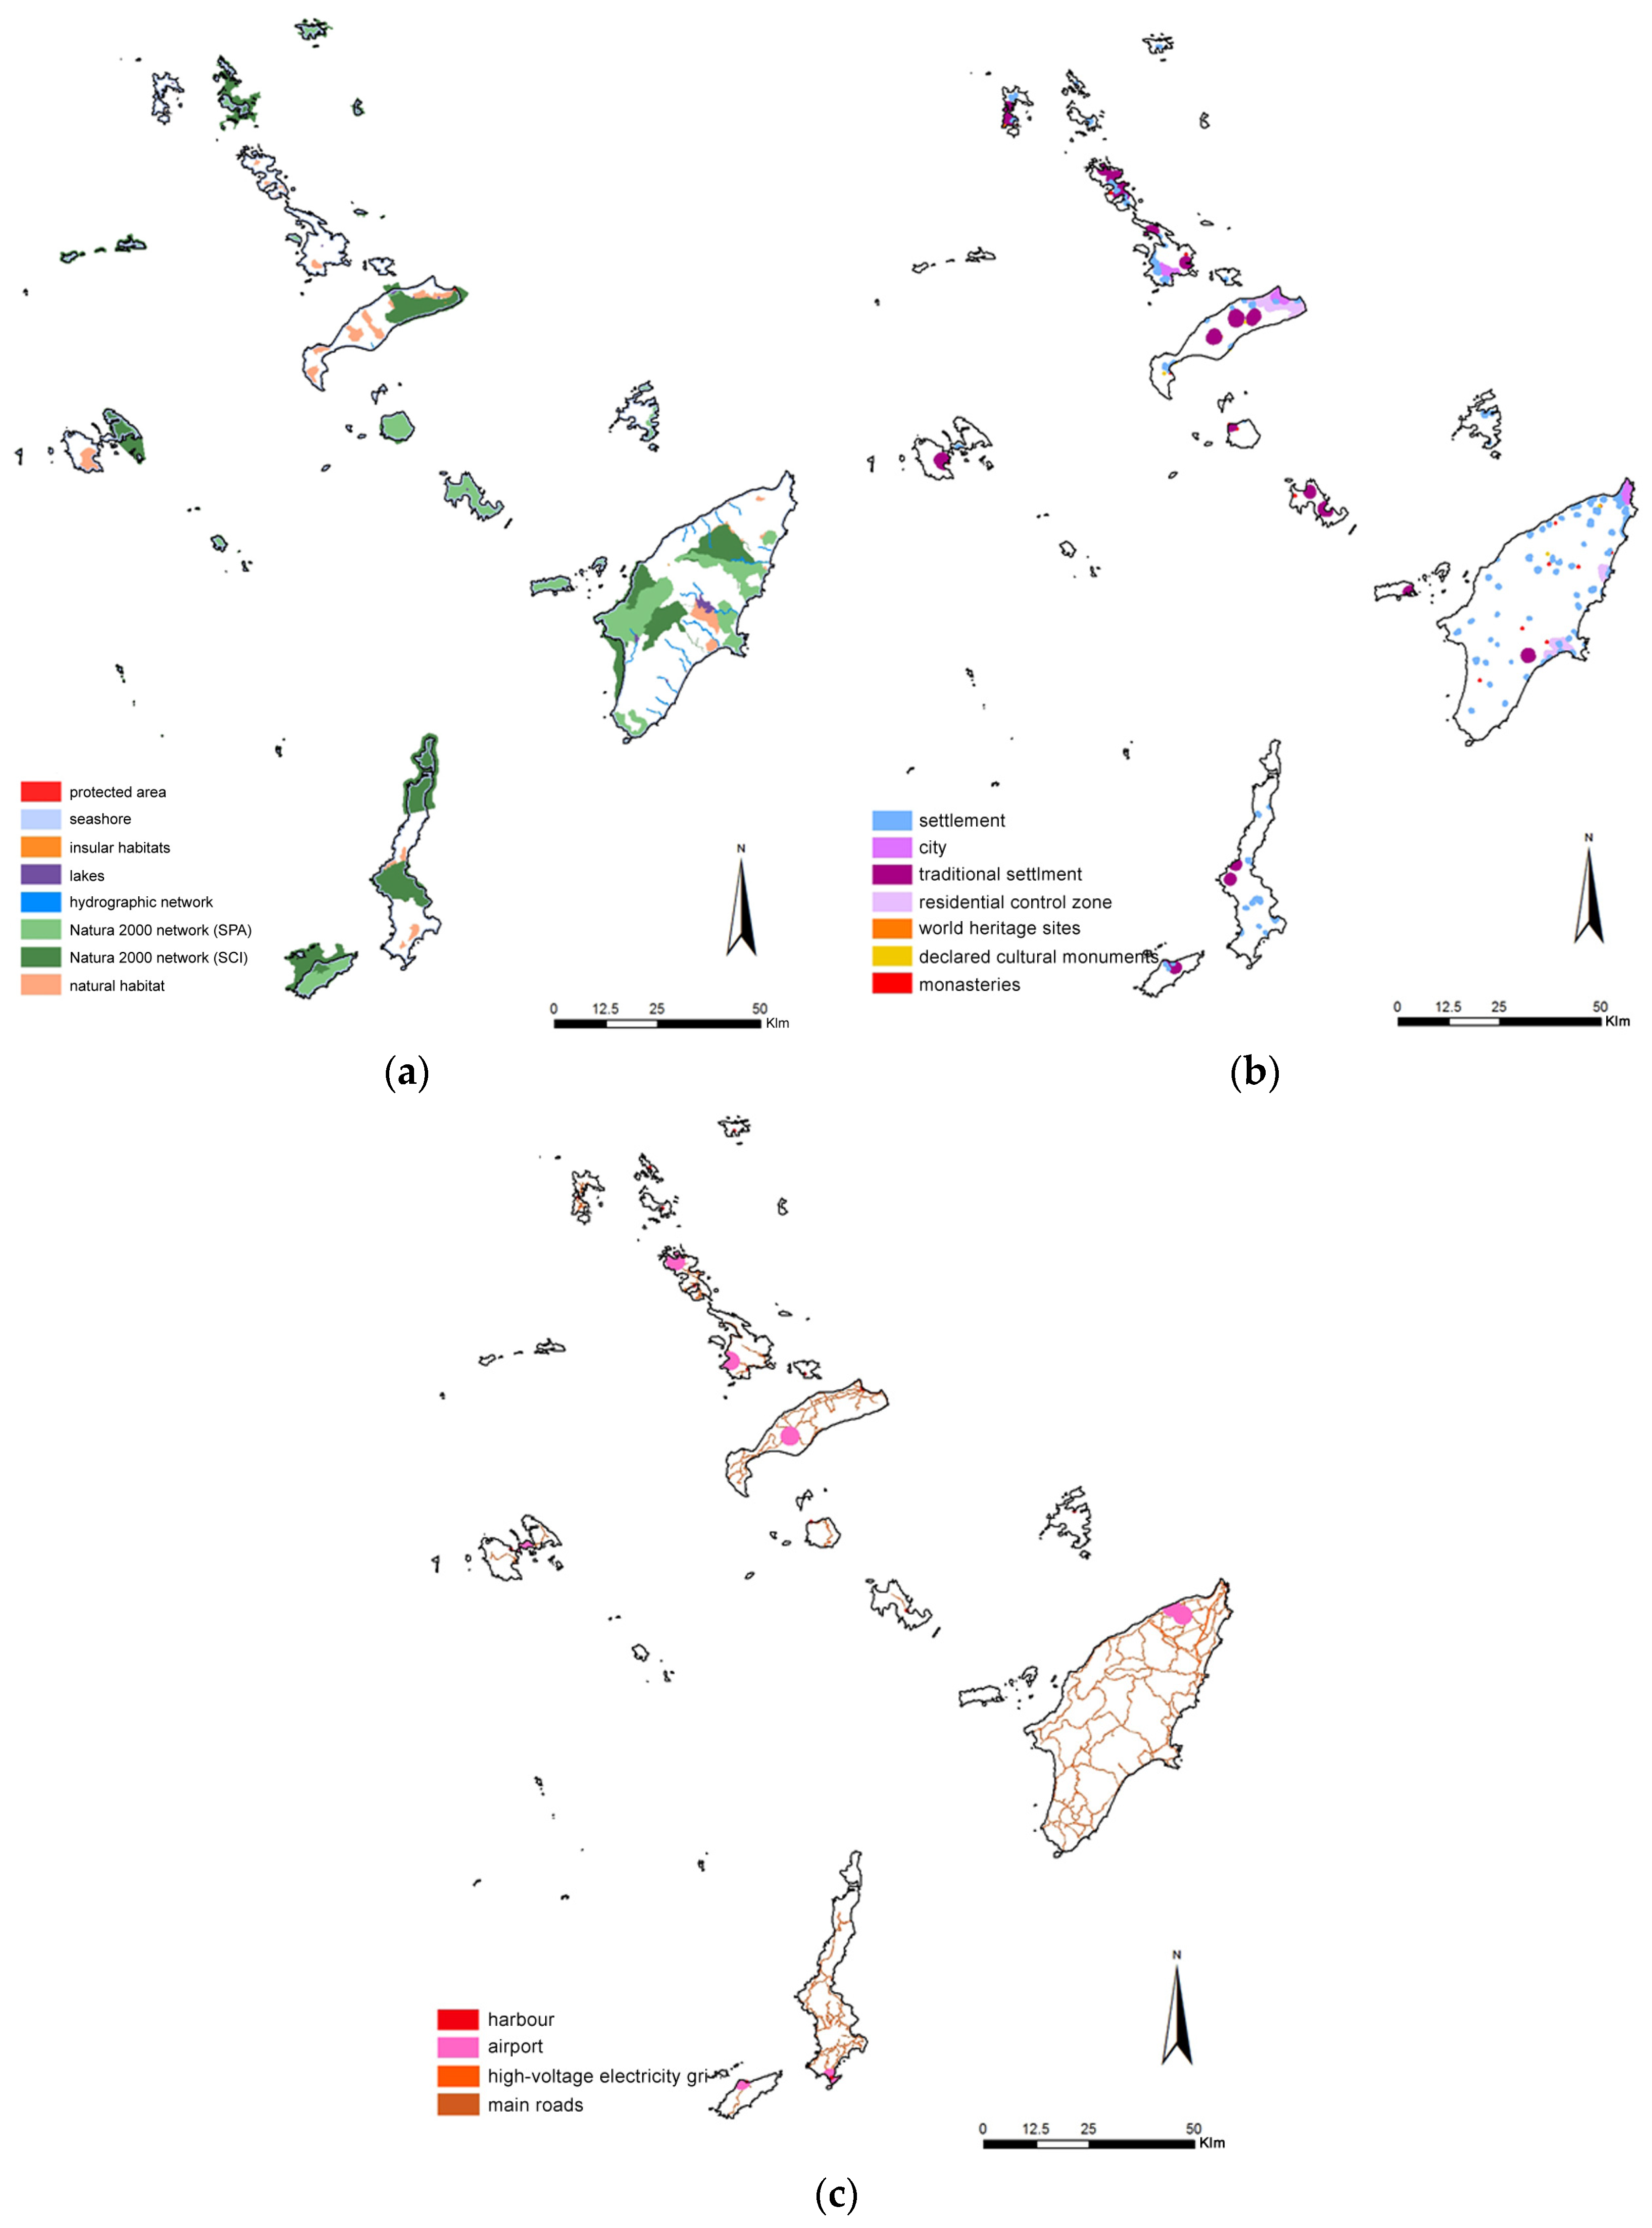
At the present study, both constraints (exclusion areas) and criteria are based on the existing legal and institutional framework and on the literature review, concerning the impact of wind farms on the natural and human environment. More specifically, the additional restrictions are the exclusion of all Natura 2000 areas, both SCI and SPA, as well as a 500 m buffer zone of the seashore. According to EU Habitats Directive, a plan or project having significant negative effect on a Natura 2000 site is granted only if there is no other feasible alternative. For the case of WF developments, there are considered to be enough locations available in order to avoid their installation into a Natura 2000 area.
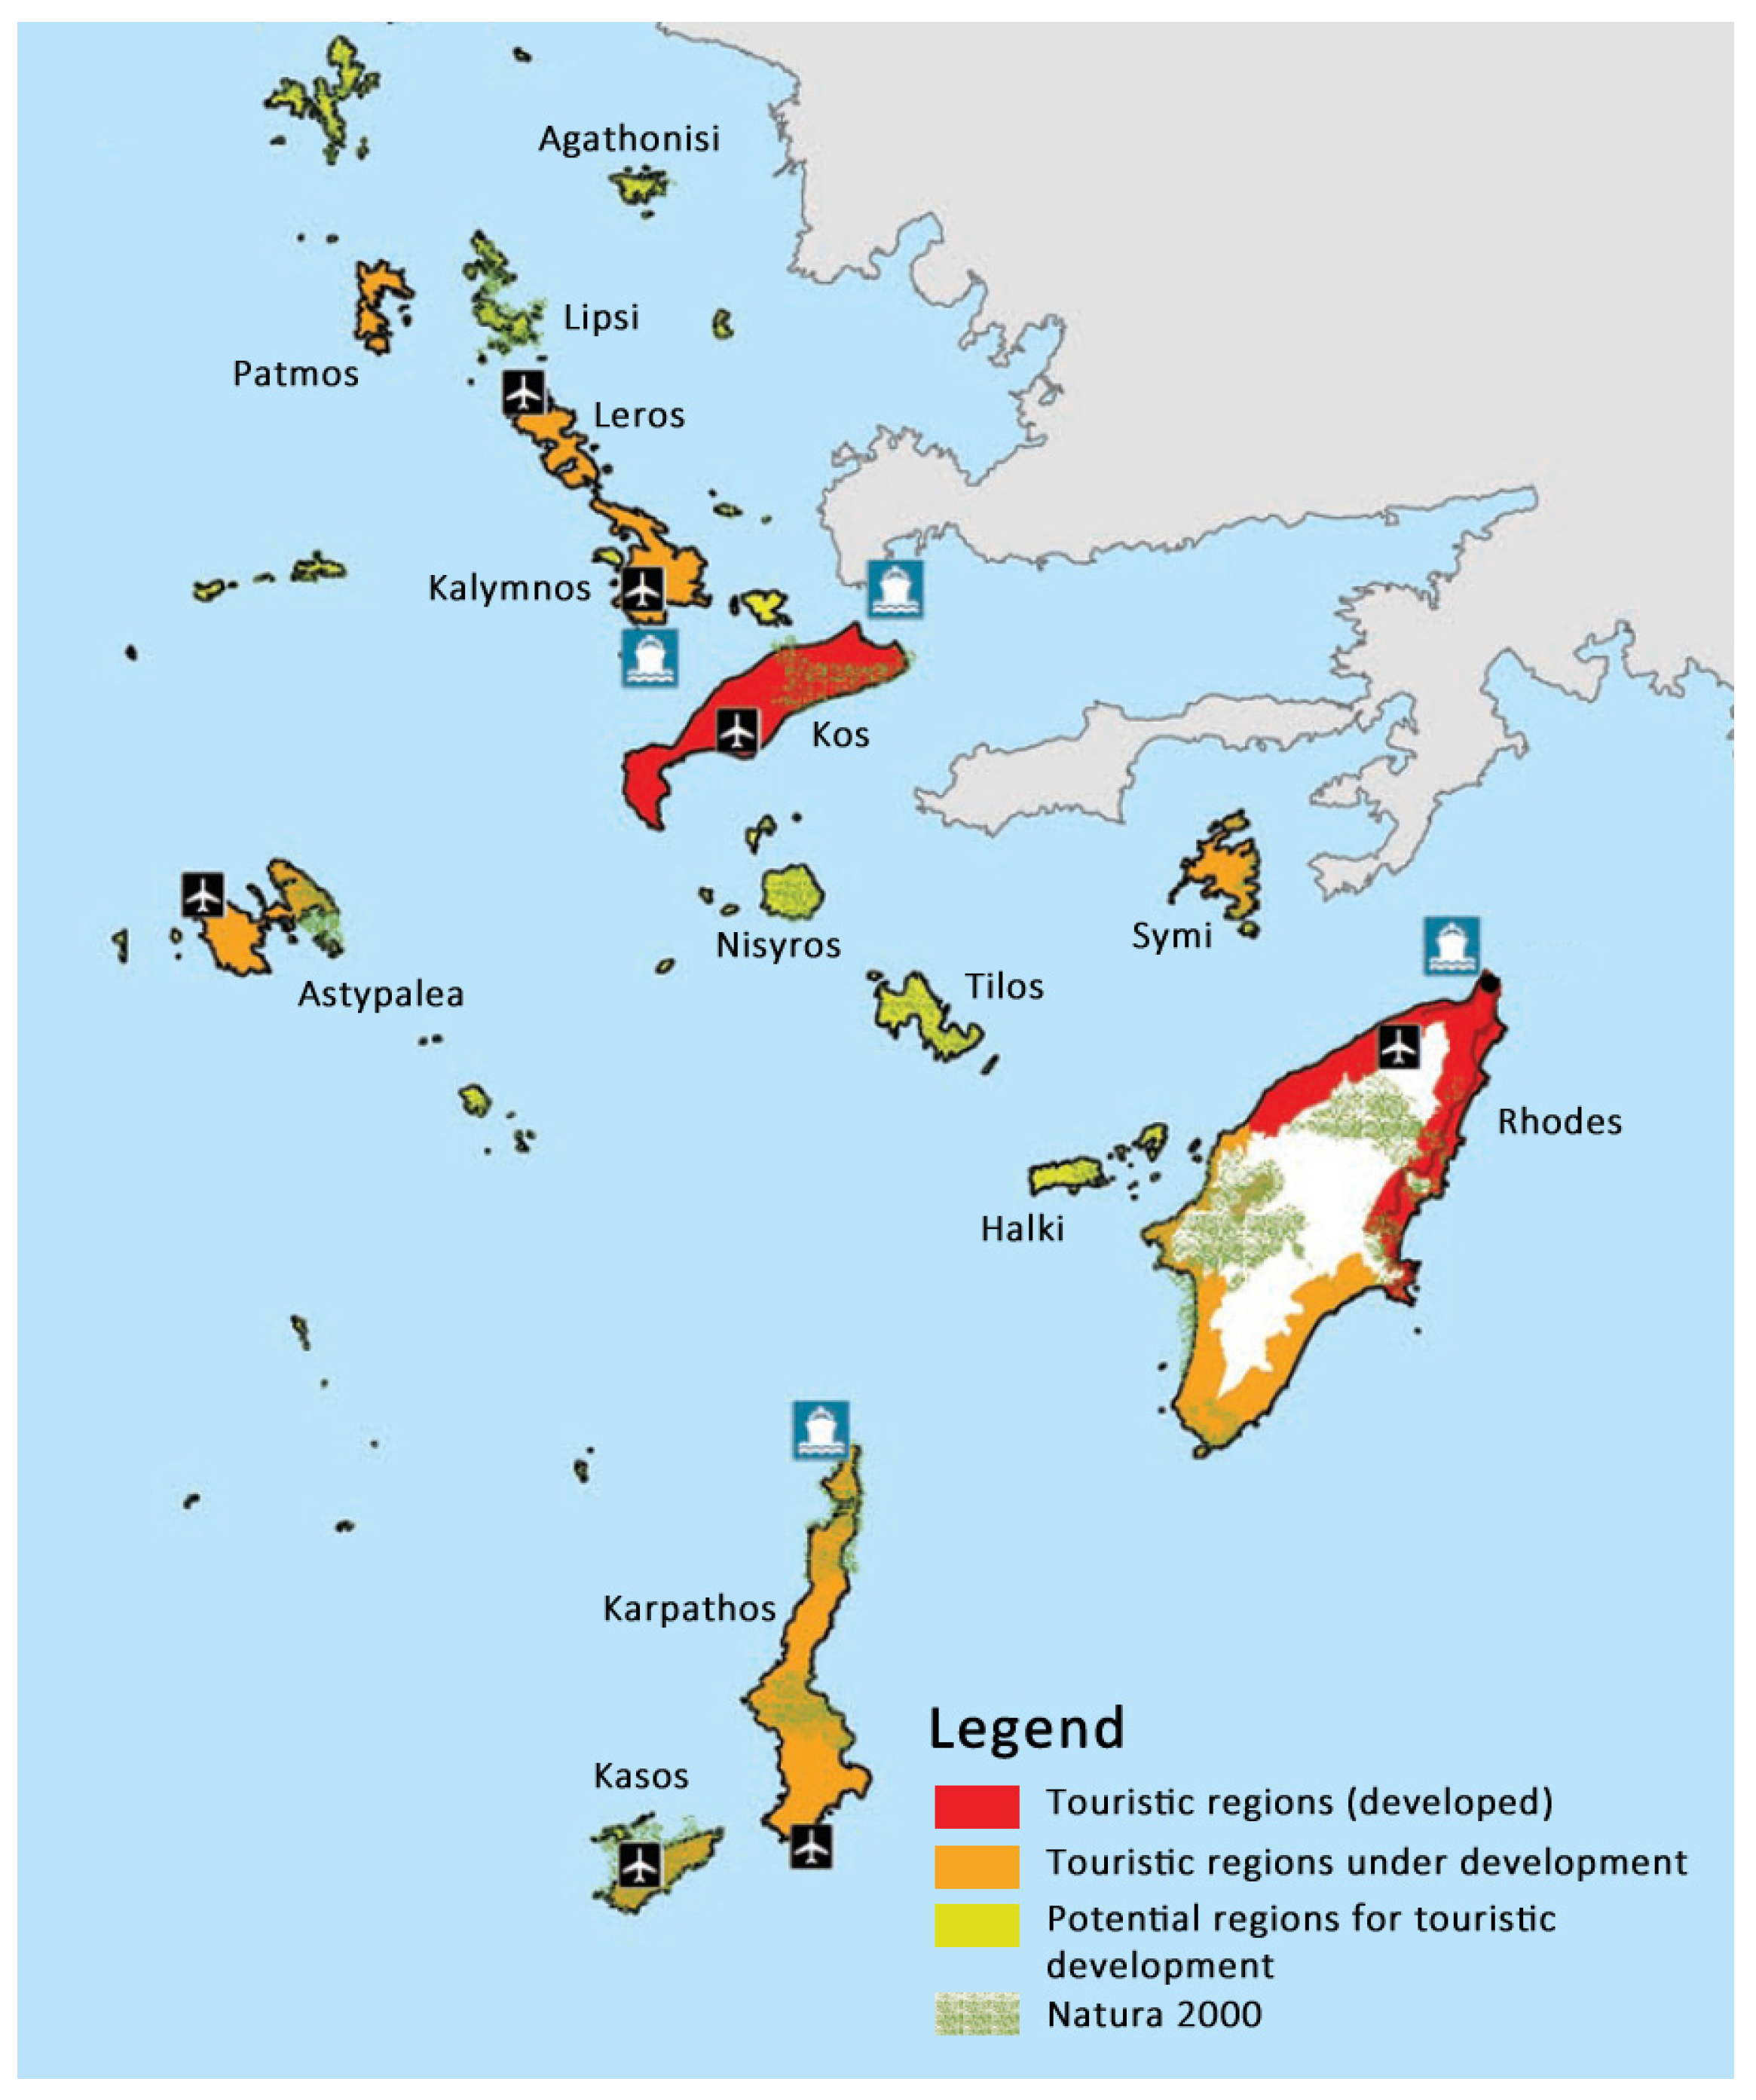
SFSPSD-RES designates as exclusion areas only the coasts included in the bathing water quality monitoring program. However, according to the Special Framework for spatial planning and sustainable development of tourism [
63], the vast majority of seashores of the Dodecanese are categorised either as developed touristic areas (red colour) or as developing (orange colours), because of the intense touristic activity, as seen in
Figure 4. An additional exclusion zone of 500 m was added in order to bridge the mismatch between legislation and actual needs of touristic areas.
For a more efficient surveillance and imaging, restrictions are presented in three groups which are associated with environmental, land use and proximity to infrastructure topics and are depicted in
Figure 4.
Table 2 defines exclusion zones and the minimum distances required and
Figure 5 illustrates them.
Figure 6 is the binary exclusion map produced by the aggregation process of all
Table 2 areas.
4.2.2. Evaluation Criteria
The next step is the determination of the evaluation criteria for suitability assessment of land in Dodecanese Islands. The evaluation criteria were selected on the basis of environmental protection and based on legislation and a literature review. There are five criteria within four categories: environmental, economic, technical and social, as shown in
Table 3. The layers of evaluation criteria need to be standardized, using a 0 to 10 scale. It should be mentioned that the wind potential, despite the fact that it is one of the most important criteria for the location selection process, it hasn’t been included in the present methodology for two main reasons. The first one is that the scope of the present venture is to create the methodological framework for the evaluation of WF installation applications submitted, aiming at the environmental protection, not to identify the optimal installation locations in terms of comparative advantage in wind energy. The second one is the absence of reliable wind potential measurements at the Dodecanese Islands.
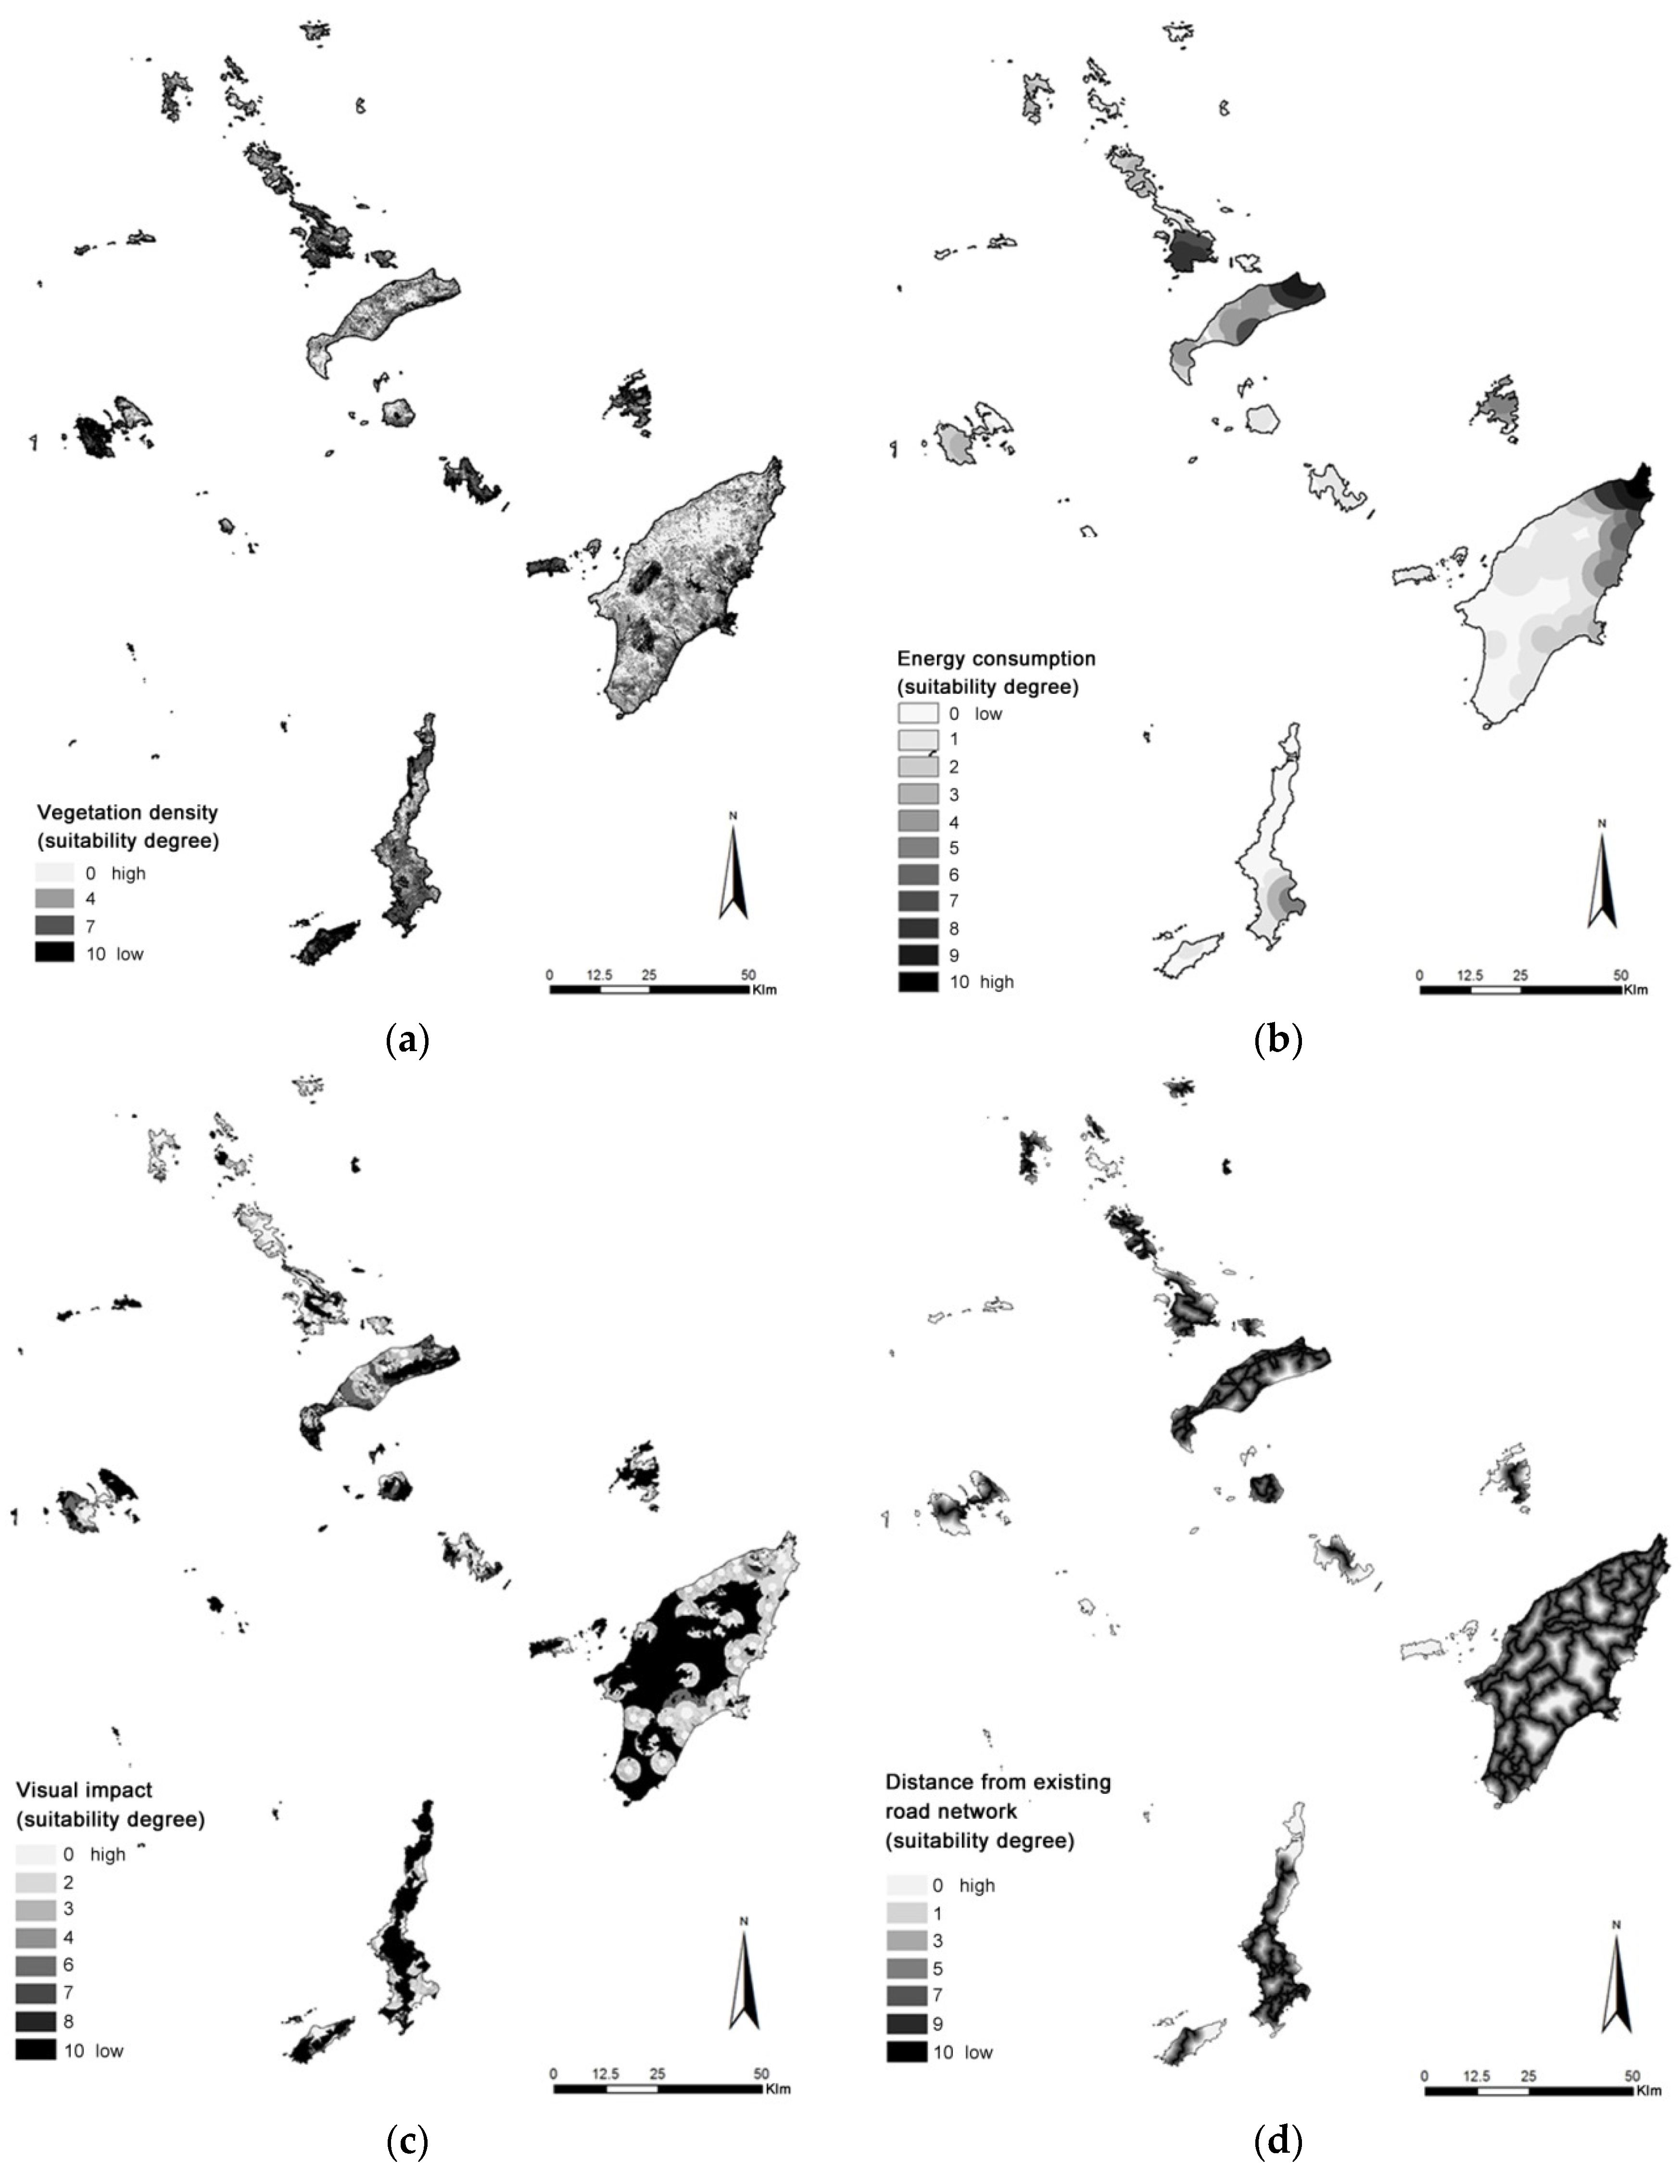
Vegetation Density
The protection of greenery is of particular importance because of the fact that WFs are allowed to be installed into forests and reforested areas. At the same time, green areas need to be protected from deforestation occurring during the construction period of a wind farm. In order to estimate vegetation density, Landsat 8 OLI satellite imagery were used, acquired during July 2014. The specific summer period is ideal for the study of vegetation density as most plants are in full leaf while low vegetation, which grows during spring and leads to abnormally high prices of vegetation index, has already wilted. The widely used Normalized Difference Vegetation Index (NDVI) has been used for vegetation density estimation, which is calculated by the following equation:
Red is the red band and NIR is the near infrared band of Landsat 8 OLI sensor. The land NDVI values ranged from 0.03 to 0.37. Based on the Landsat 8 OLI NDVI values, four categories were defined: dense, medium, sparse and no vegetation (
Table 4). Due to lack of ground truth, these categories have been defined after thorough interpretation of recent high resolution satellite imagery (Google maps) and comparison of the interpreted vegetation densities with the NDVI values in GIS environment. The dense category (NDVI > 0.25) mainly contains dense forests and dense sclerophyllous vegetation, the medium category (0.20 < NDVI < 0.25) represents sparser trees and bushes, the sparse category (0.15 < NDVI < 0.20) mostly contains sparse low vegetation (phrygana) and the no vegetation category (NDVI < 0.15) represents either impervious areas or natural areas that are not covered by vegetation.
Energy Consumption
Energy production and consumption are considered to be two spatially independent processes. Nevertheless, the proximity of production and consumption reduces not only energy losses caused by the electric power distribution but also spatio-social inequalities. In this proceeding, as regards the criterion of electricity consumption, the fitness grade is determined by proximity to areas of high energy demand. Suitability degree of power consumption is higher closer to areas of high energy demand.
Results were presented in
Table 5, after being reclassified from 0 to 10, making use of Natural Jenks sorting method, whereby class boundaries were placed at relatively large differences of data values.
Visual Impact
Despite the fact that social aspects are outside the scope of the present study, visual impact is defined as an evaluation criterion because of its environmental implications (landscape deterioration).
Kokologos et al. [
68] claim that the most popular method for visual impact calculation is the Spanish evaluation method [
69], followed by the multi-criteria method, the zone determination method and the realistic 3D simulation method. The common factors taken into consideration are the number of installed wind turbines, the distance from points of interest and the number of residents and houses of a settlement located at a given distance from wind turbines, having visual contact with them. Viewshed Analysis of GIS is a useful tool for visual impact calculation. Using a terrain model, it defines all visible areas from a point of interest [
70].
The method used in this study takes two parameters into account: the number of points of interest that a specific area is visible from and the buffer zones provided by SFSPSD-RES for each category of points of interest. According to Greek legislation, points of interest are the monuments, the settlements and the ports. The number of visible points of interest that came as a result from Viewshed Analysis function has been classified in three categories, using the Natural Jenks sorting method, as seen in
Table 6.
Distance from the Existing Road Network
As noted, in most cases, wind farm construction involves road opening of several kilometers that causes deforestation, disruption of habitats and wildlife crossing, urban sprawl and increased cost and transport of construction materials over long distances, which increases the emitted pollutants. Therefore, the construction of wind farms close to the existing road network is more preferable.
Baban and Parry [
44] consider 0.1 to 9.0 km as an acceptable distance, while Azizi et al. [
71] limit it to 4.5 km and Tegou et al. [
41] to 2.5 km, giving a range from 100% to 0% criterion satisfaction degree. Considering the special characteristics of the Dodecanese,
Table 7 provides the selected categories. The map of
Figure 7d is calculated by means of Euclidean (linear) distance.
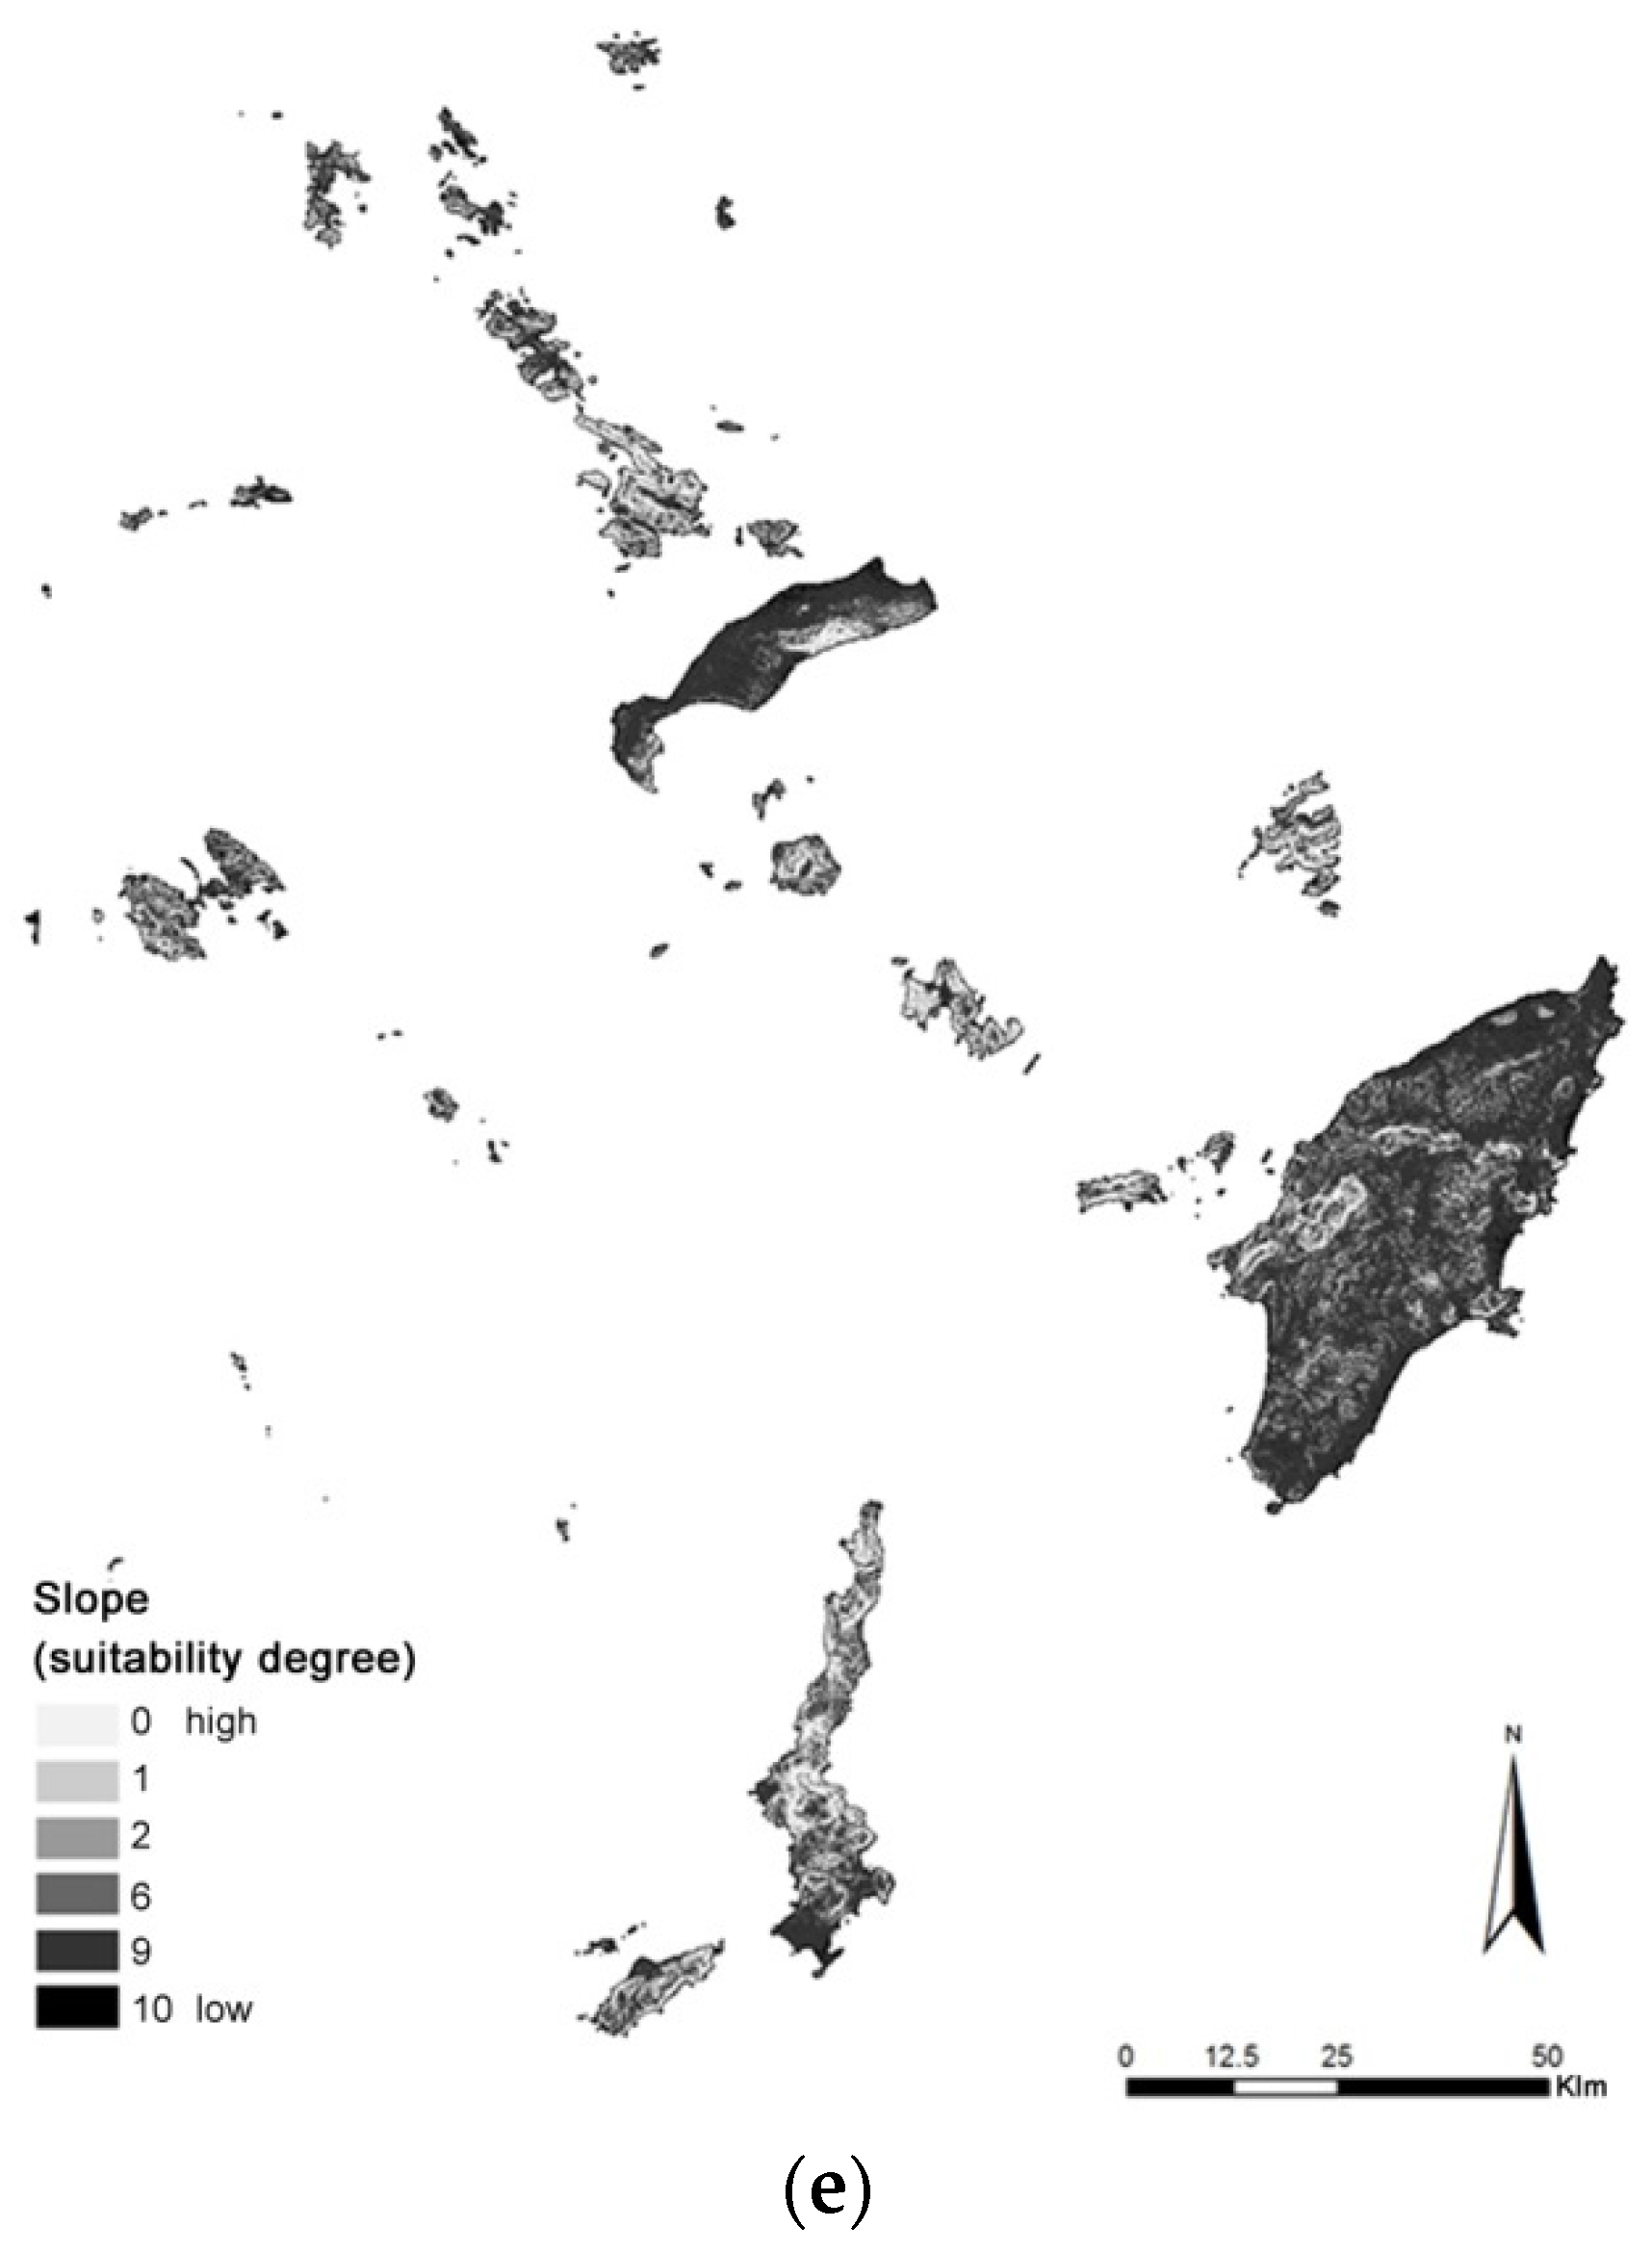
Slope
Slope is a commonly used technical criterion as the installation of wind turbines on a land of steep slopes either increases manufacturing costs or is impossible. Azizi et al. [
71] exclude areas of more than 45% slope, while Tegou et al. [
41] those of more than 25% and Baban and Parry [
44] lower the limit to 20%. The present study excludes all areas of more than 25% slope.
Table 8 shows the classification used. Results are mapped in
Figure 7e.
4.2.3. Estimation of Weights
AHP employs a pair-wise comparison method to assess criteria relative importance and calculate their weights, using the matrix of
Table 9. Decision makers have an effect on results as they provide the grades of the comparison. For the needs of the study, the authors provided the weighting used, which is considered to serve the environmental protection. The distance from the road network has been set as the most important criterion, since it involves extended installation works and a great number of environmental consequences. Vegetation density ranks second as there is no constrain for deforestation prevention, which is a common wind farm installation consequence. Energy consumption criterion is considered to be of medium significance as it is related to energy loss. Land slope is a less important criterion as it is connected mainly with cost increase rather than the environmental degradation. Finally, visual impact is the least important criterion.
4.2.4. Suitability Map
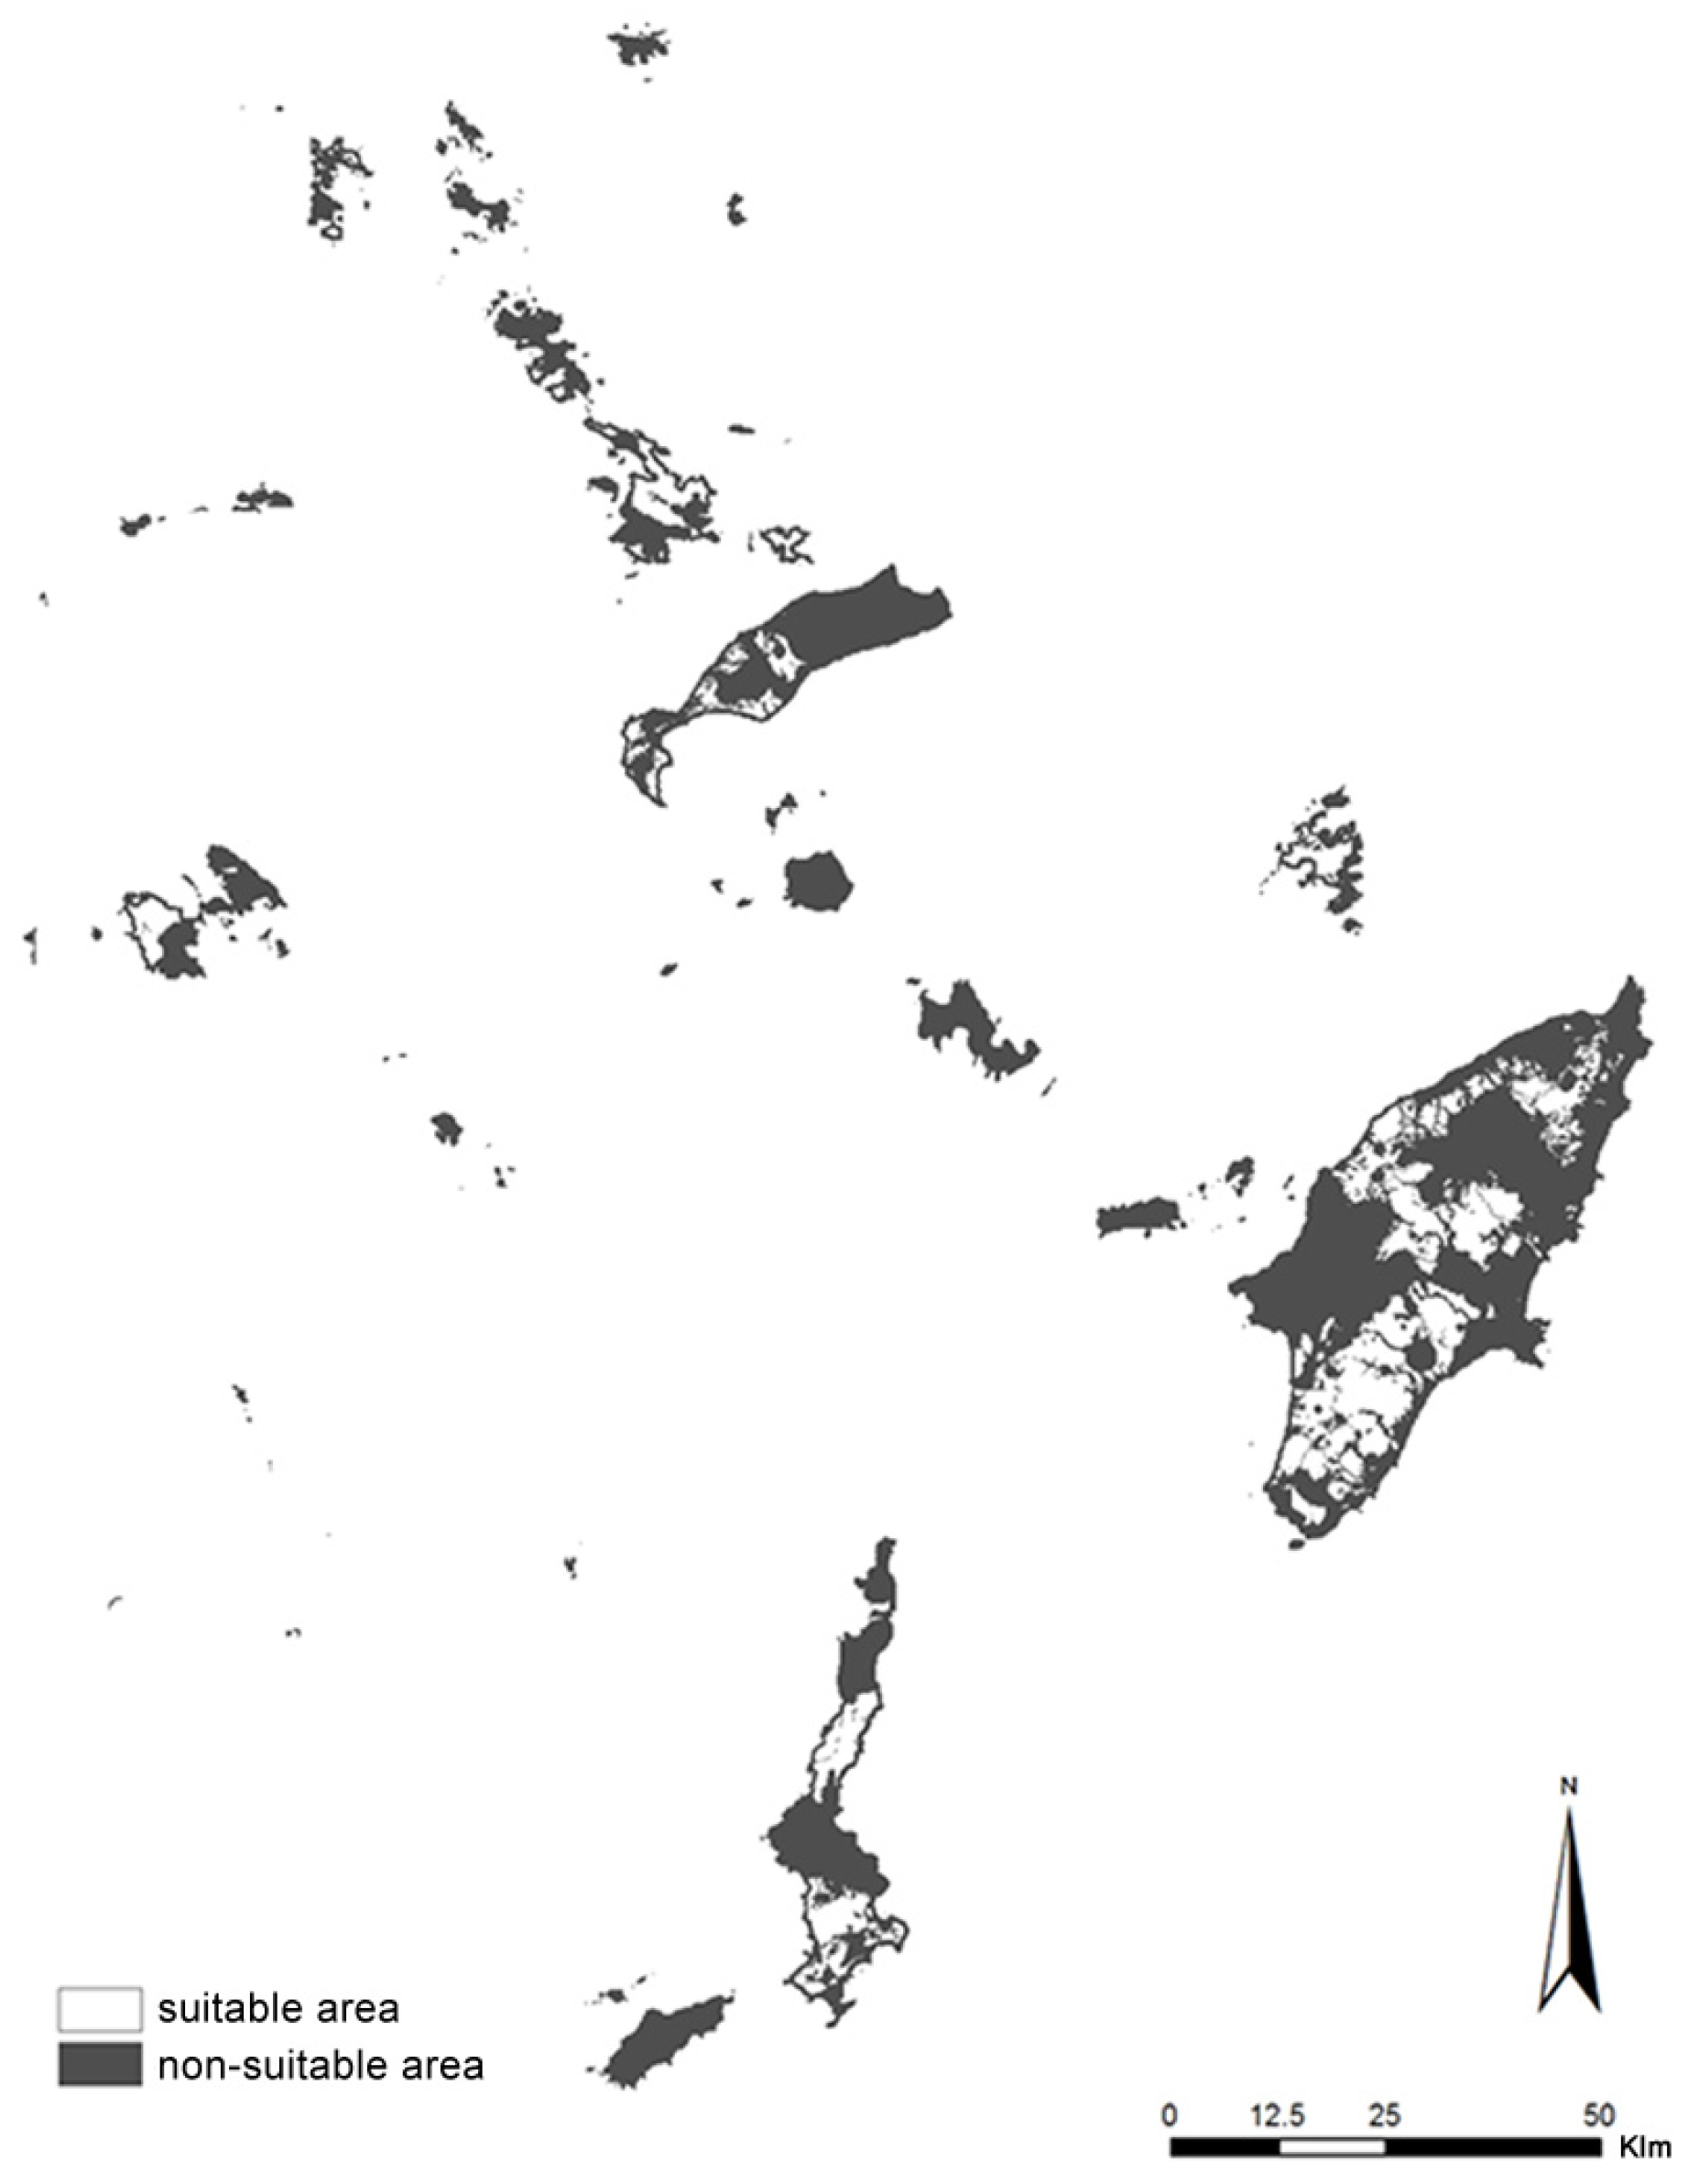
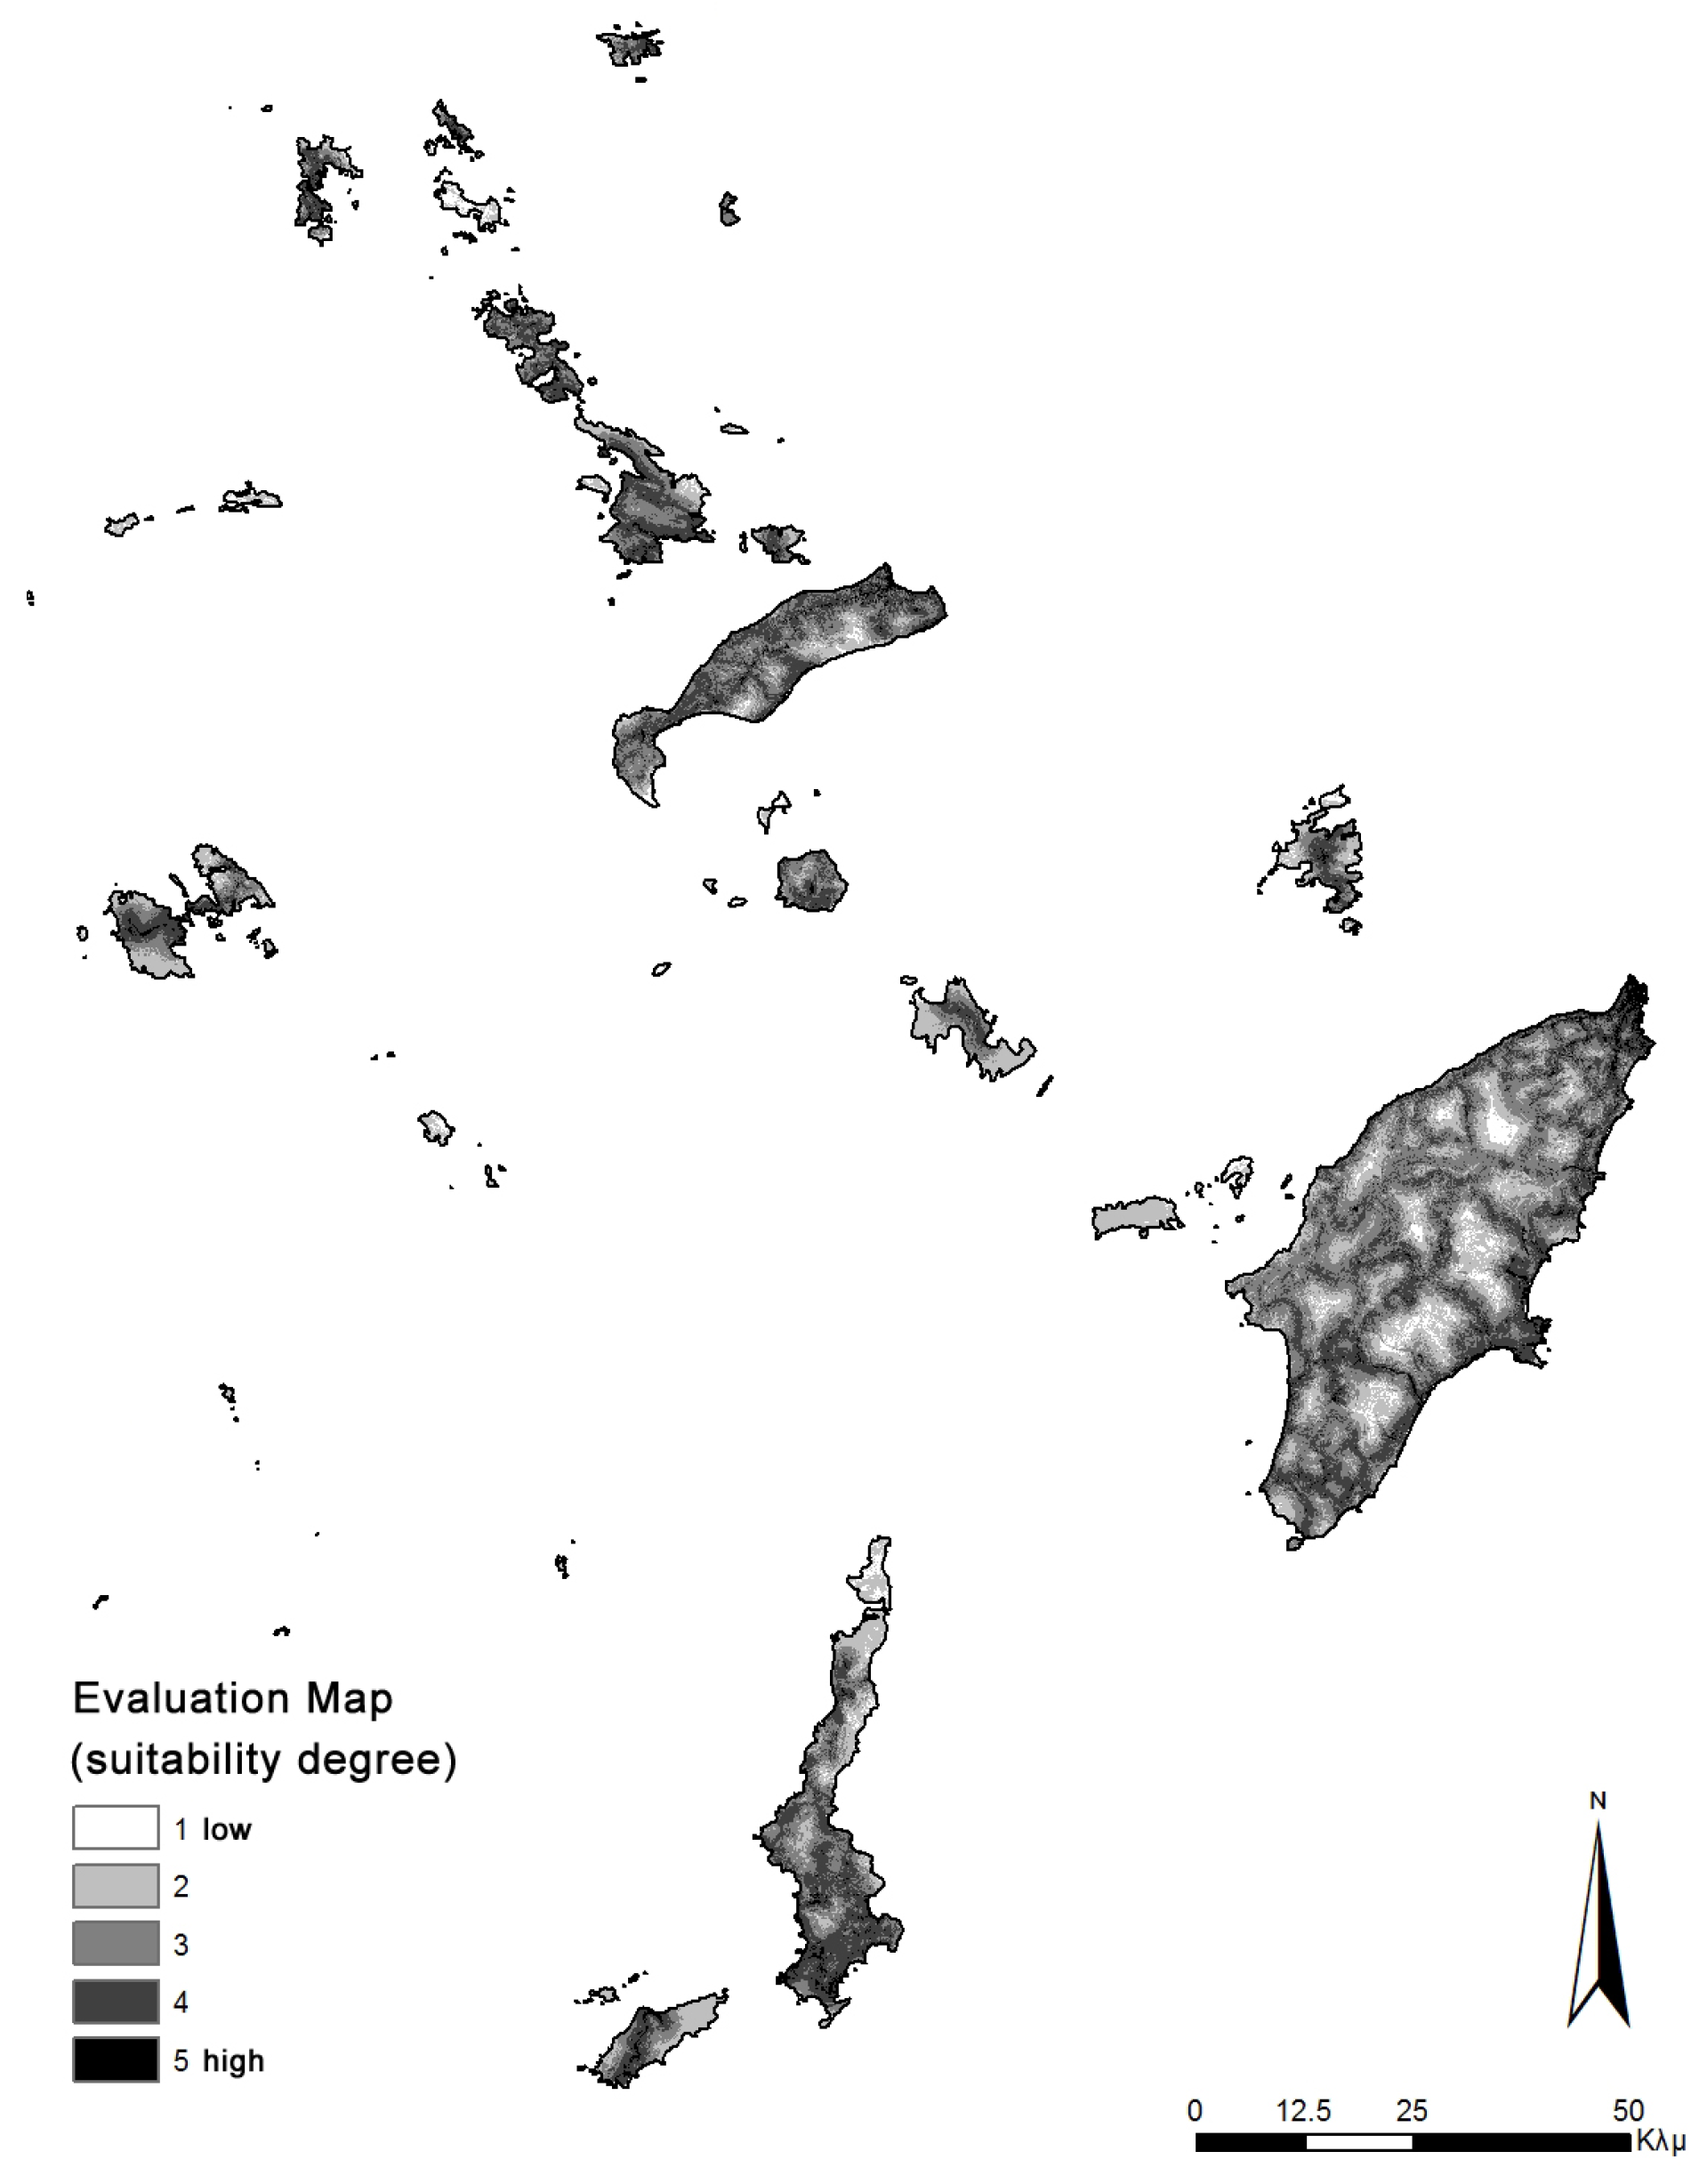
The weighted sum aggregation function has been used to produce the overall land suitability degree. The evaluation map of
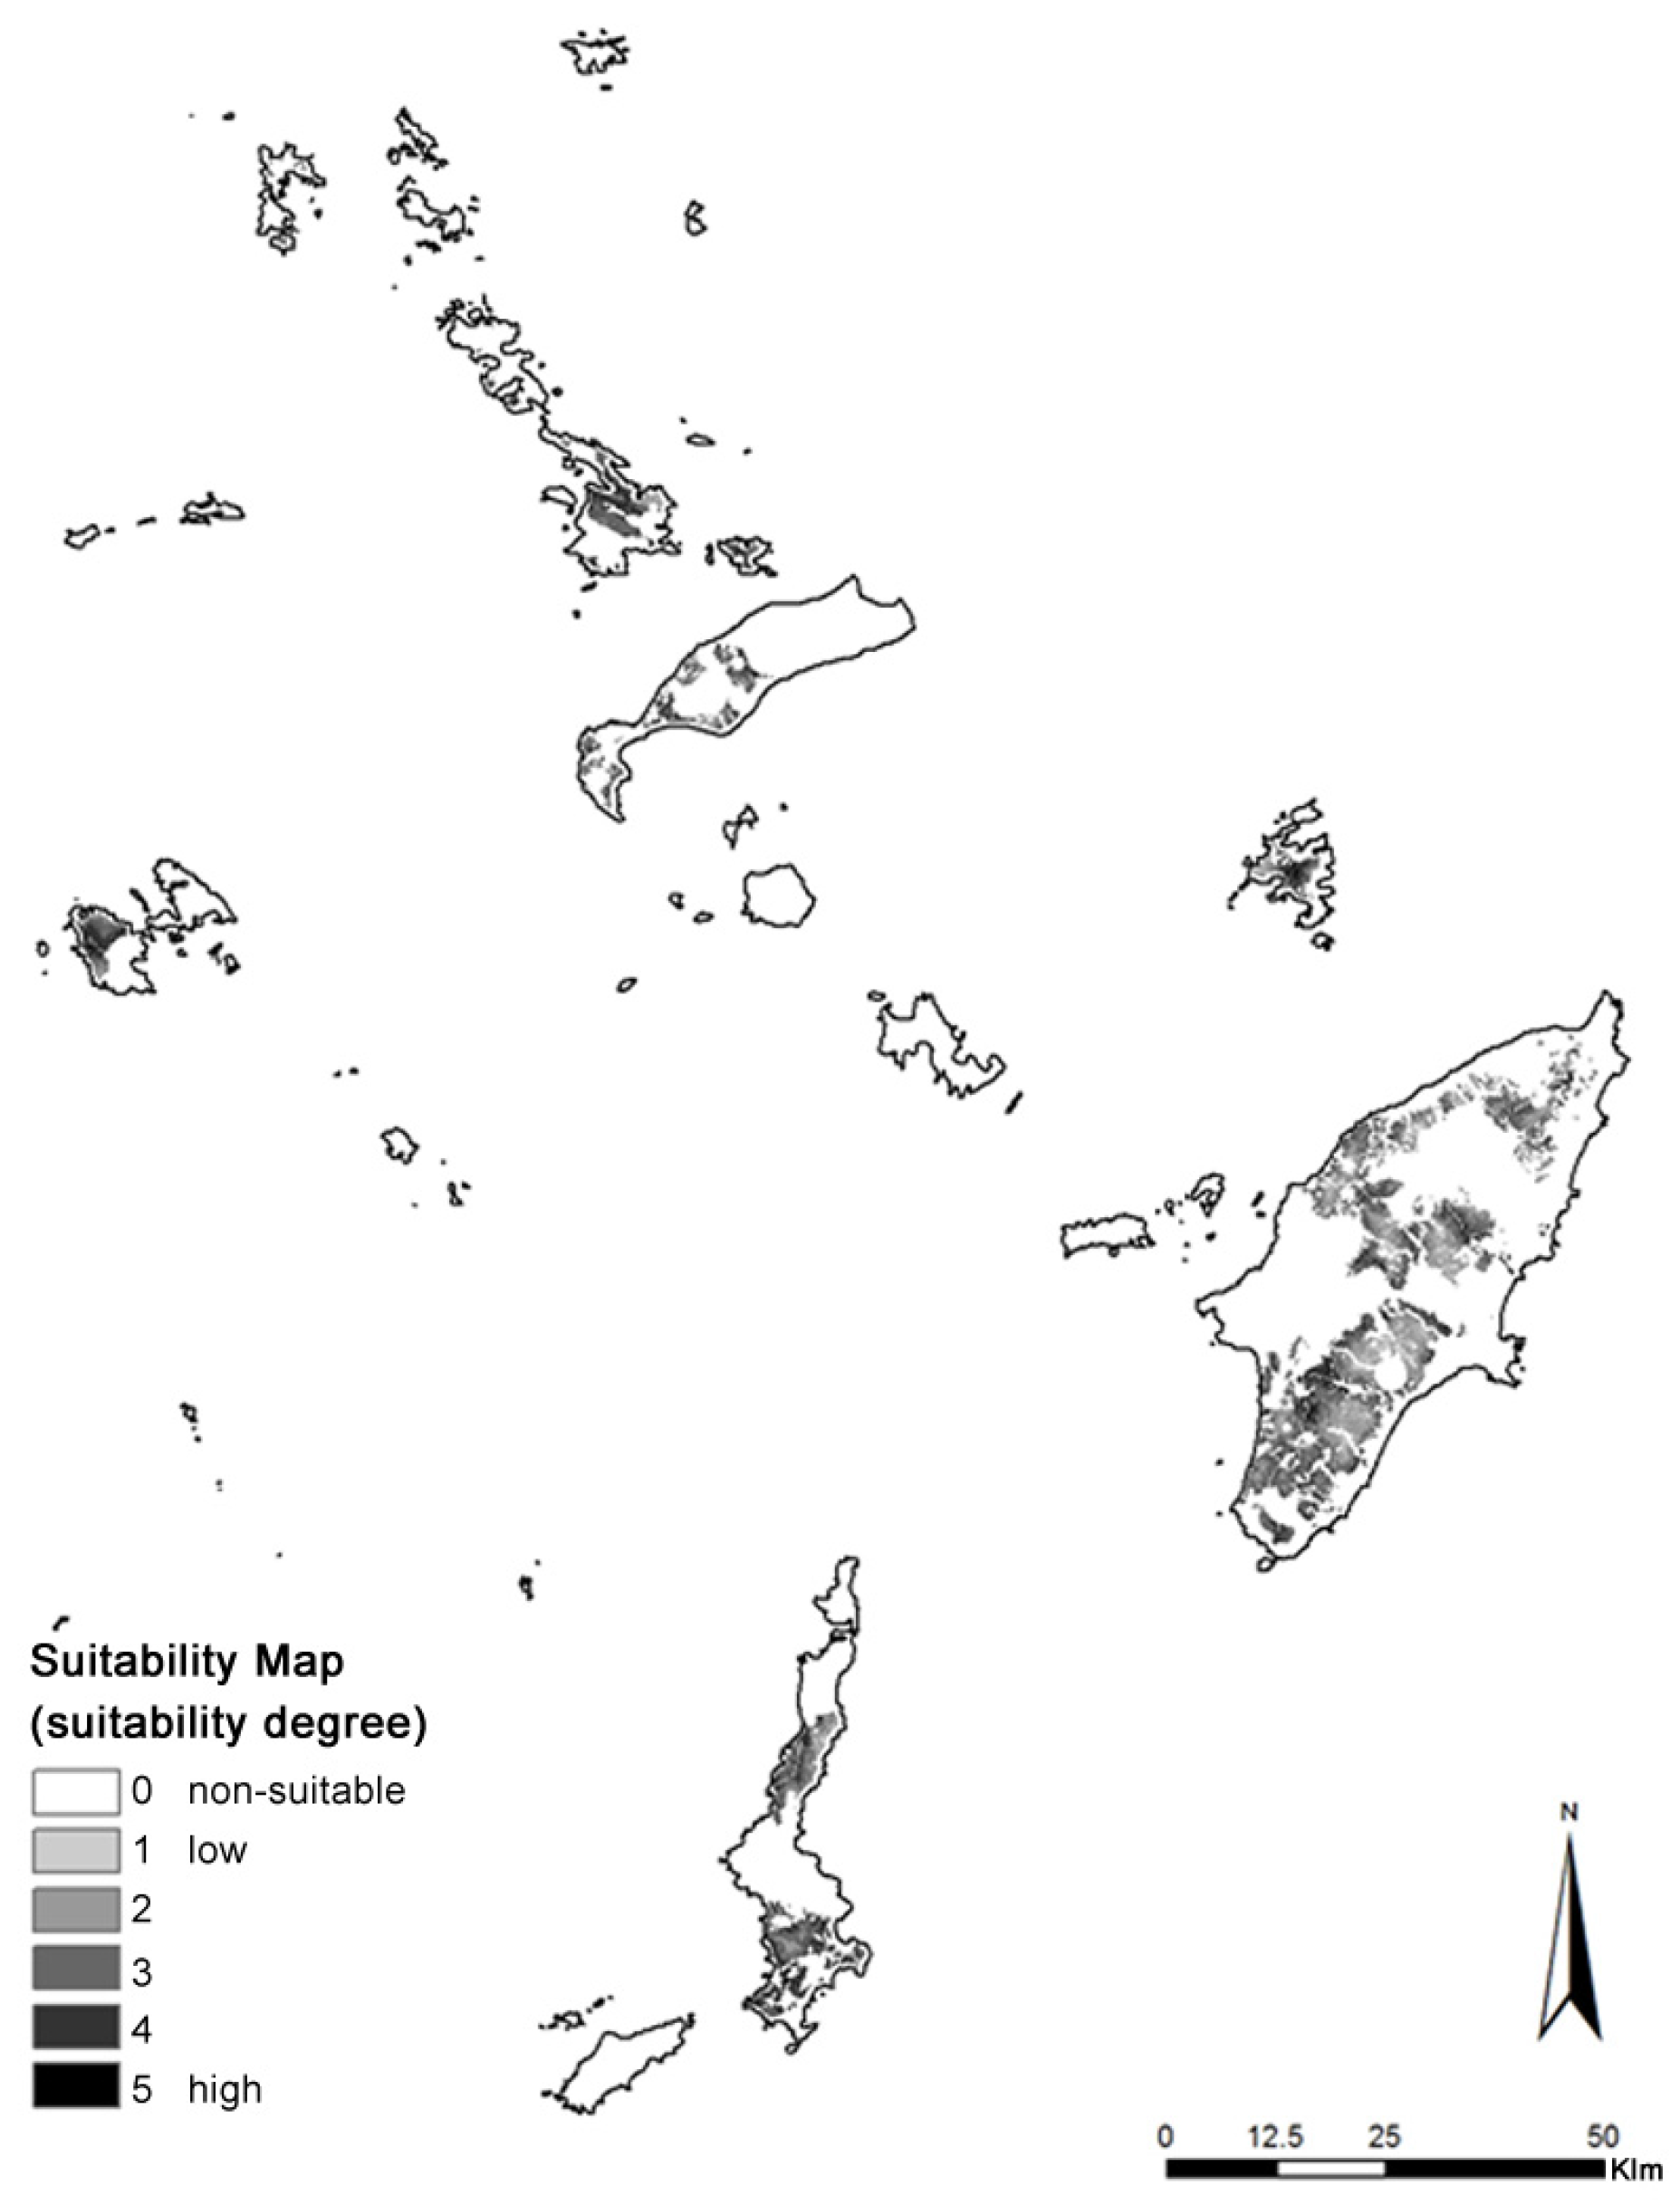
Figure 8 is the outcome of the reclassification process of results into five categories. Removing the exclusion areas of the first step the final suitability map of
Figure 9 is derived. A percentage of 23.4% of the Dodecanese area is suitable for wind farm installation. Some 7.5% of them belong to the two lower-ranked sites, while the two best-ranked categories represent 5.7% of the whole area.
4.2.5. Sensitivity Analysis
Sensitivity analysis is the most prevalent process used to assess results [
41,
71,
72]. The aim is to get an indication of the level of importance of each criterion to the decision making process. The way is to modify criteria weights and observe distribution variation of the number of pixels of suitability categories.
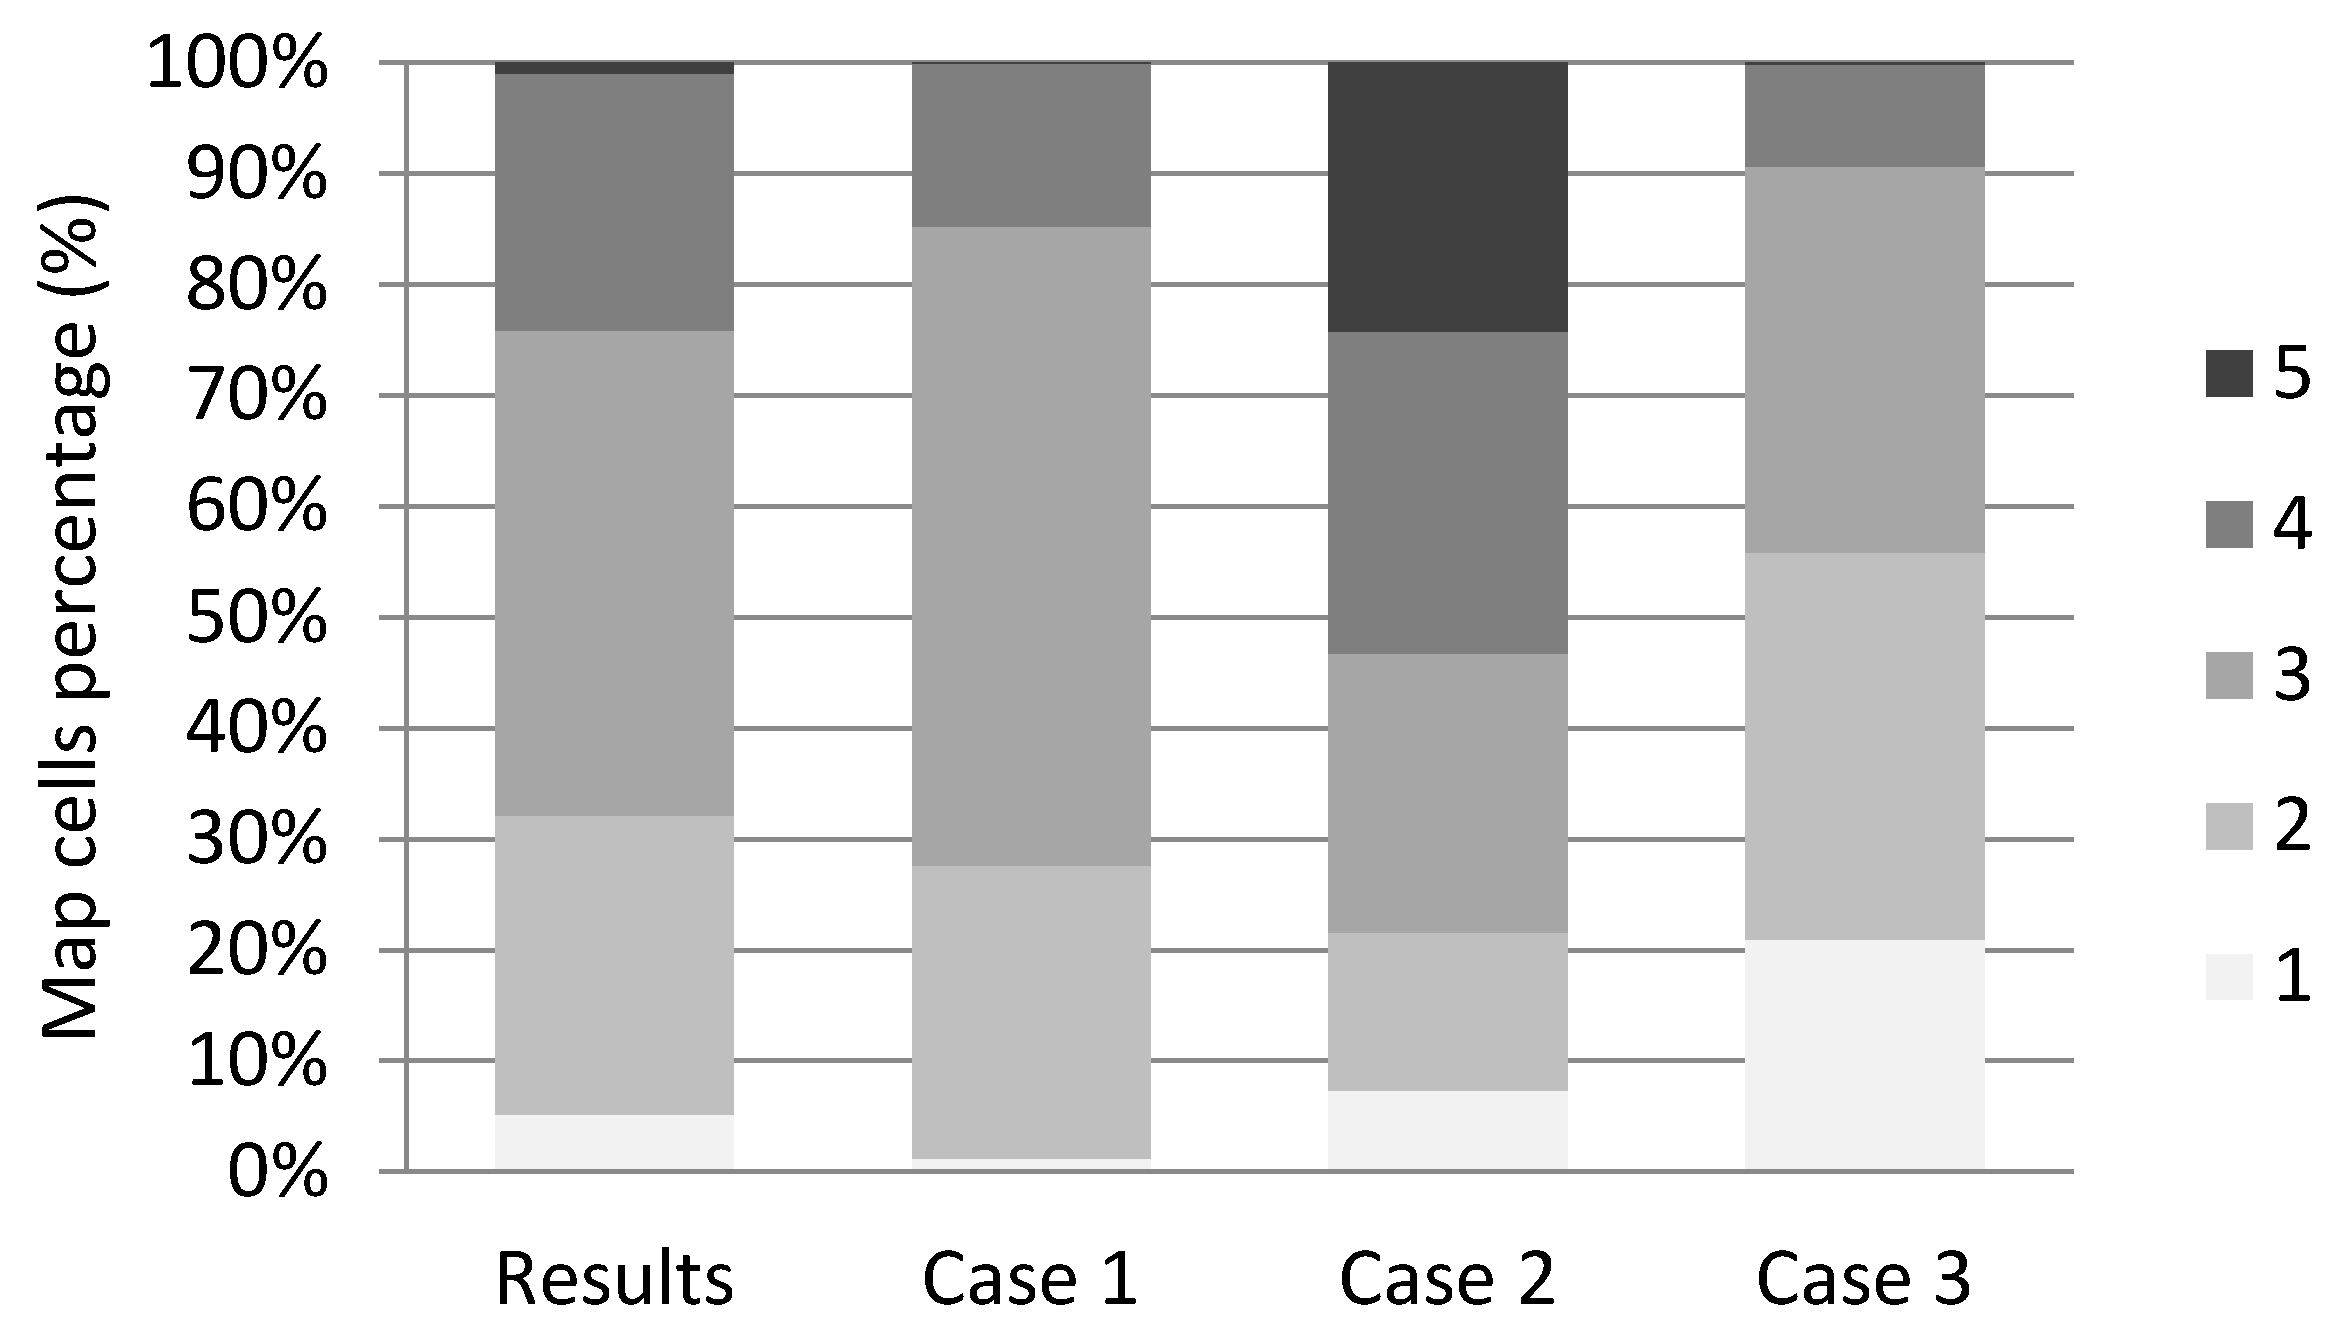
The study will examine three cases. In the first case, all criteria have the same weight. In the second one, zero weights are assigned to environmental criteria (vegetation density and energy consumption), while in the third one, zero weights are given to economic criteria (distance from the existing road network).
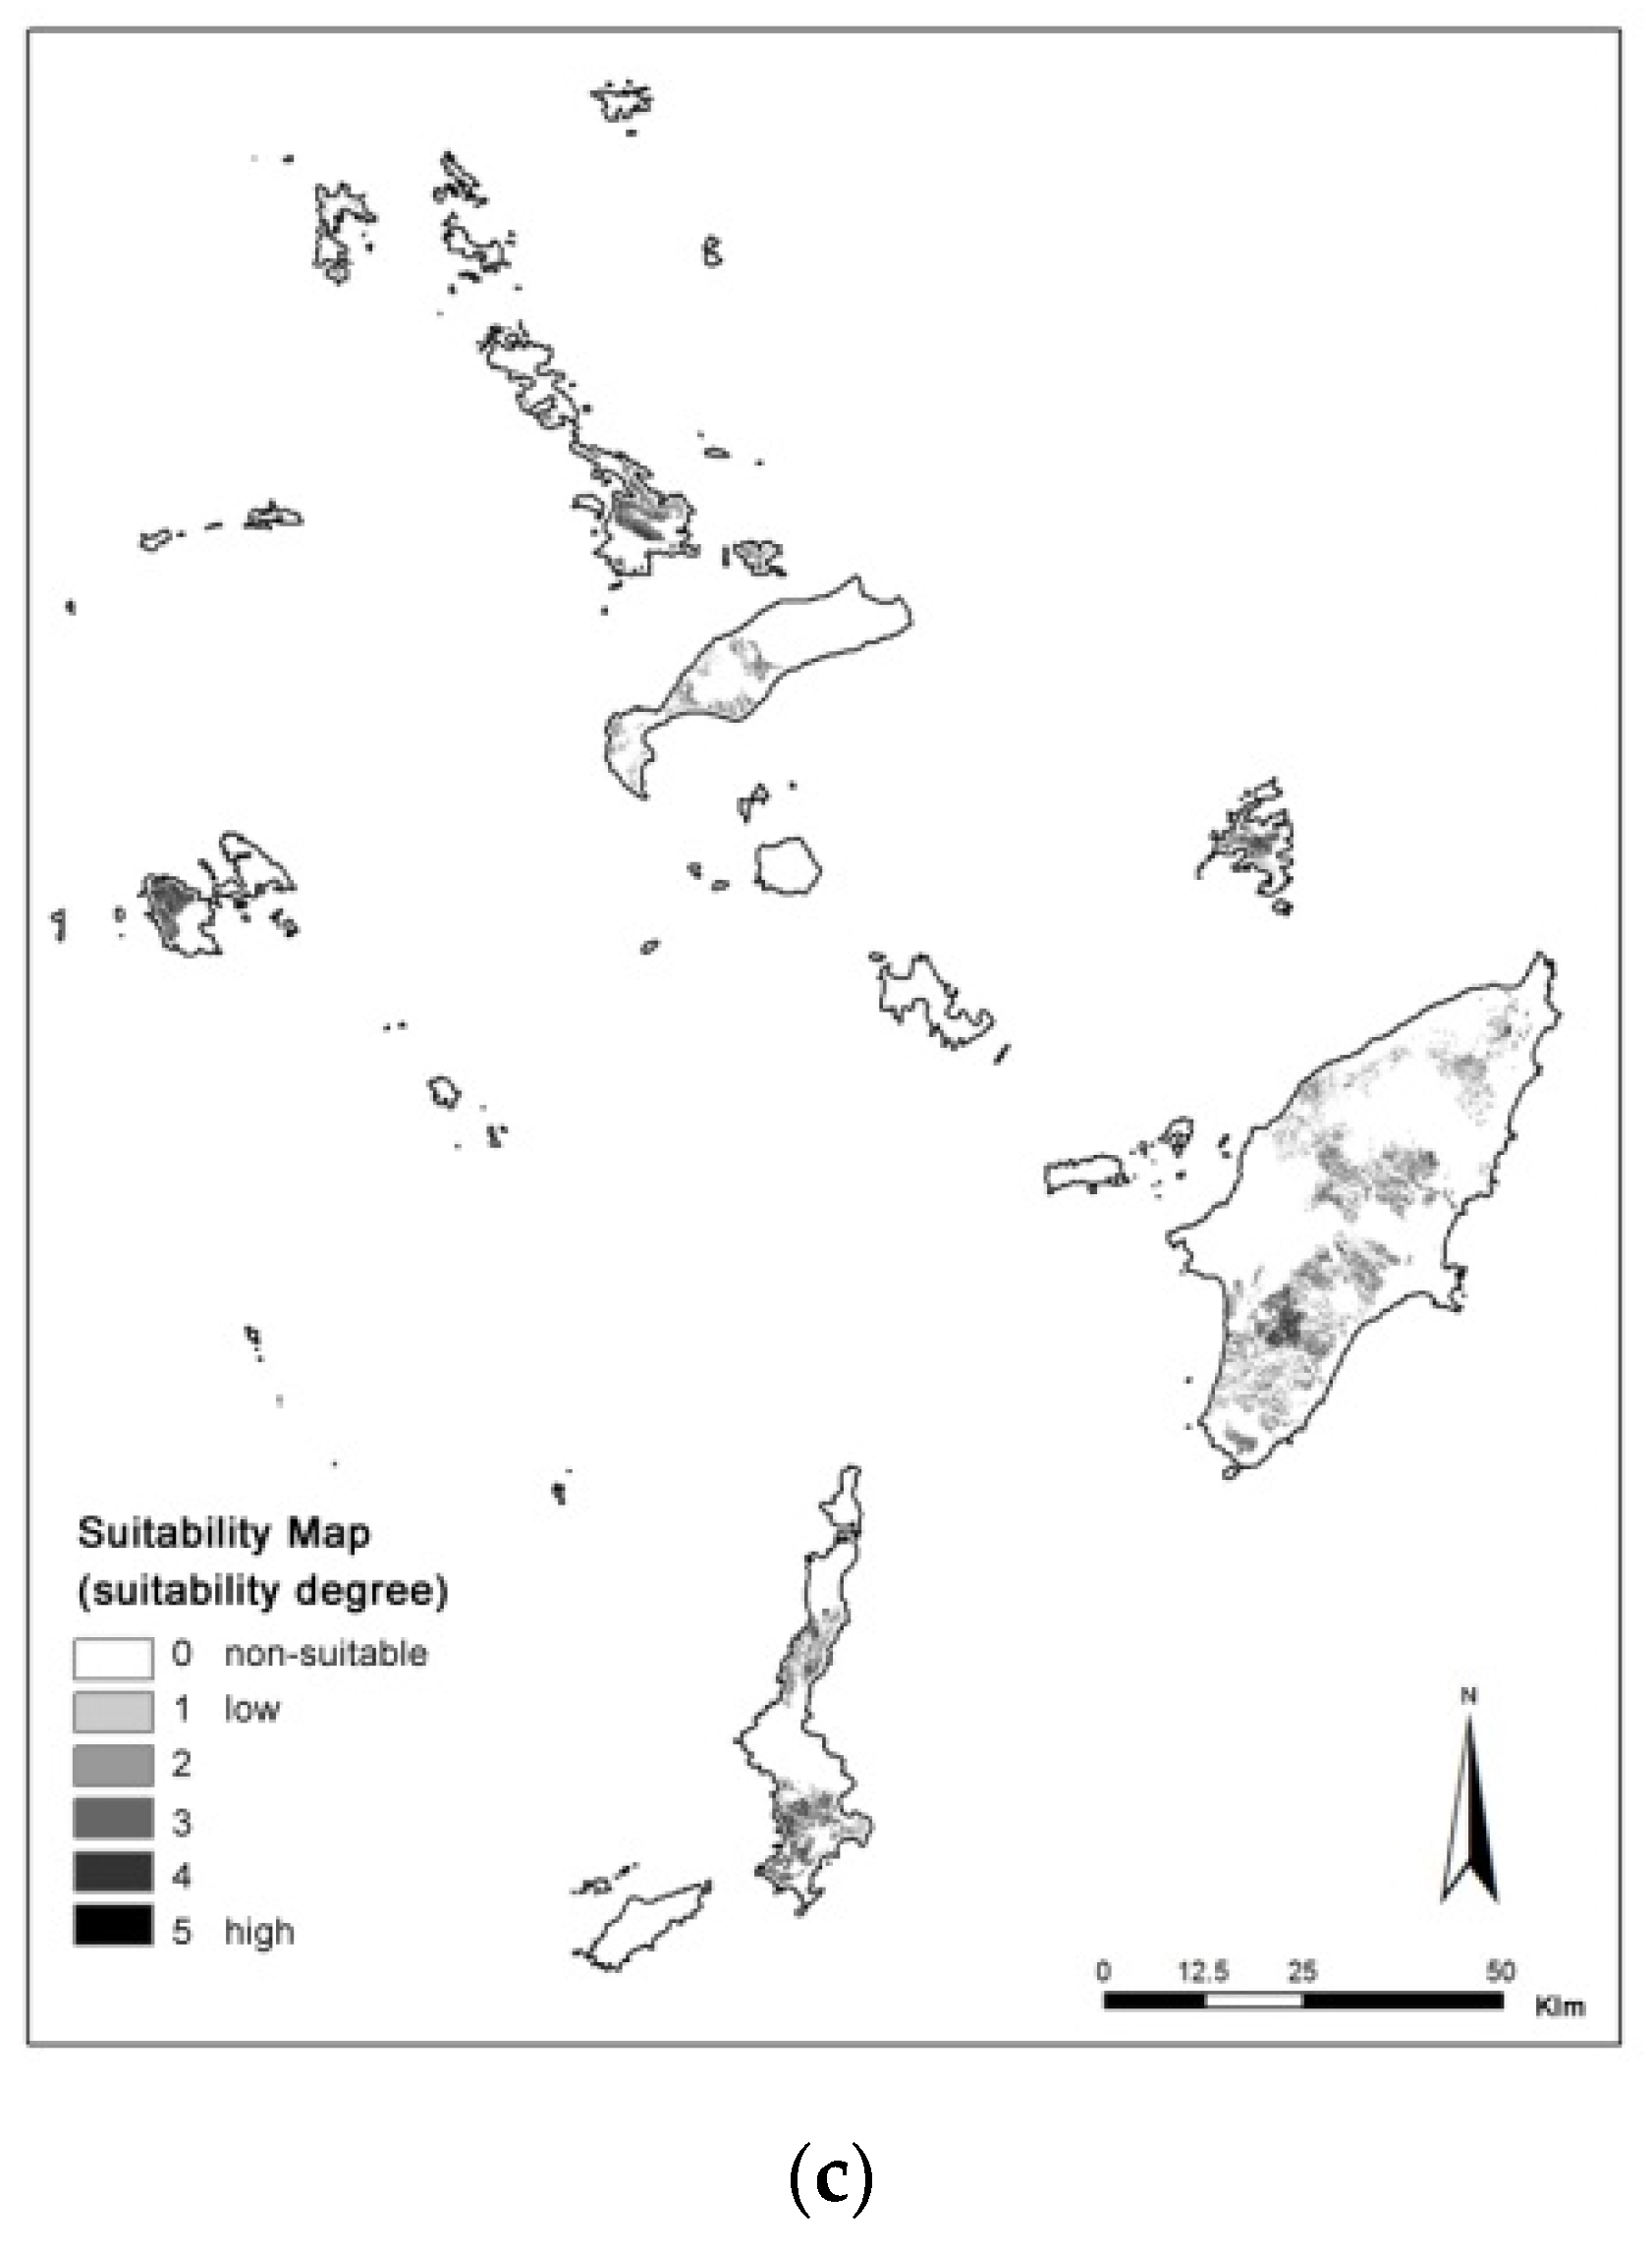
Chart 2 and
Figure 10 present the results of the three cases, in comparison with those of the main process. The constant change of pixel allocation at each category implies that results are sensitive to criteria that have been set and all criteria are influential in the evaluation process.
5. Discussion
Taking a deeper look at the evaluation map of
Figure 8, the spatial pattern of the outcome strongly reflects the influence of the two highly weighted criteria. The distance from road network criterion has created a “distance decay” effect, where the most suitable areas are located closer to the road. The grey pallet of the rest of the area is similar to the vegetation density map with the addition of three dark areas around Rhodos, Kos and Kalymnos cities, as a result of the energy consumption map influence. The impact of the rest criteria is not expected to be obvious.
The overlapping process for the production of the overall suitability map revealed that around 23.4% of the land is suitable for WF siting. That was expected as the process has adopted numerous constraints, such as the exclusion of all Natura 2000 areas and the 500 m seashore buffer zone. However, there is still a remarkable rate of the total area of the Dodecanese. The vast majority of these areas are located on the islands of Rhodes, Karpathos, Kos, Kalymnos and Astypalea, thus there are islands which are completely excluded, such as Tilos, Nisyros, Kasos, Lipsi and Halki.
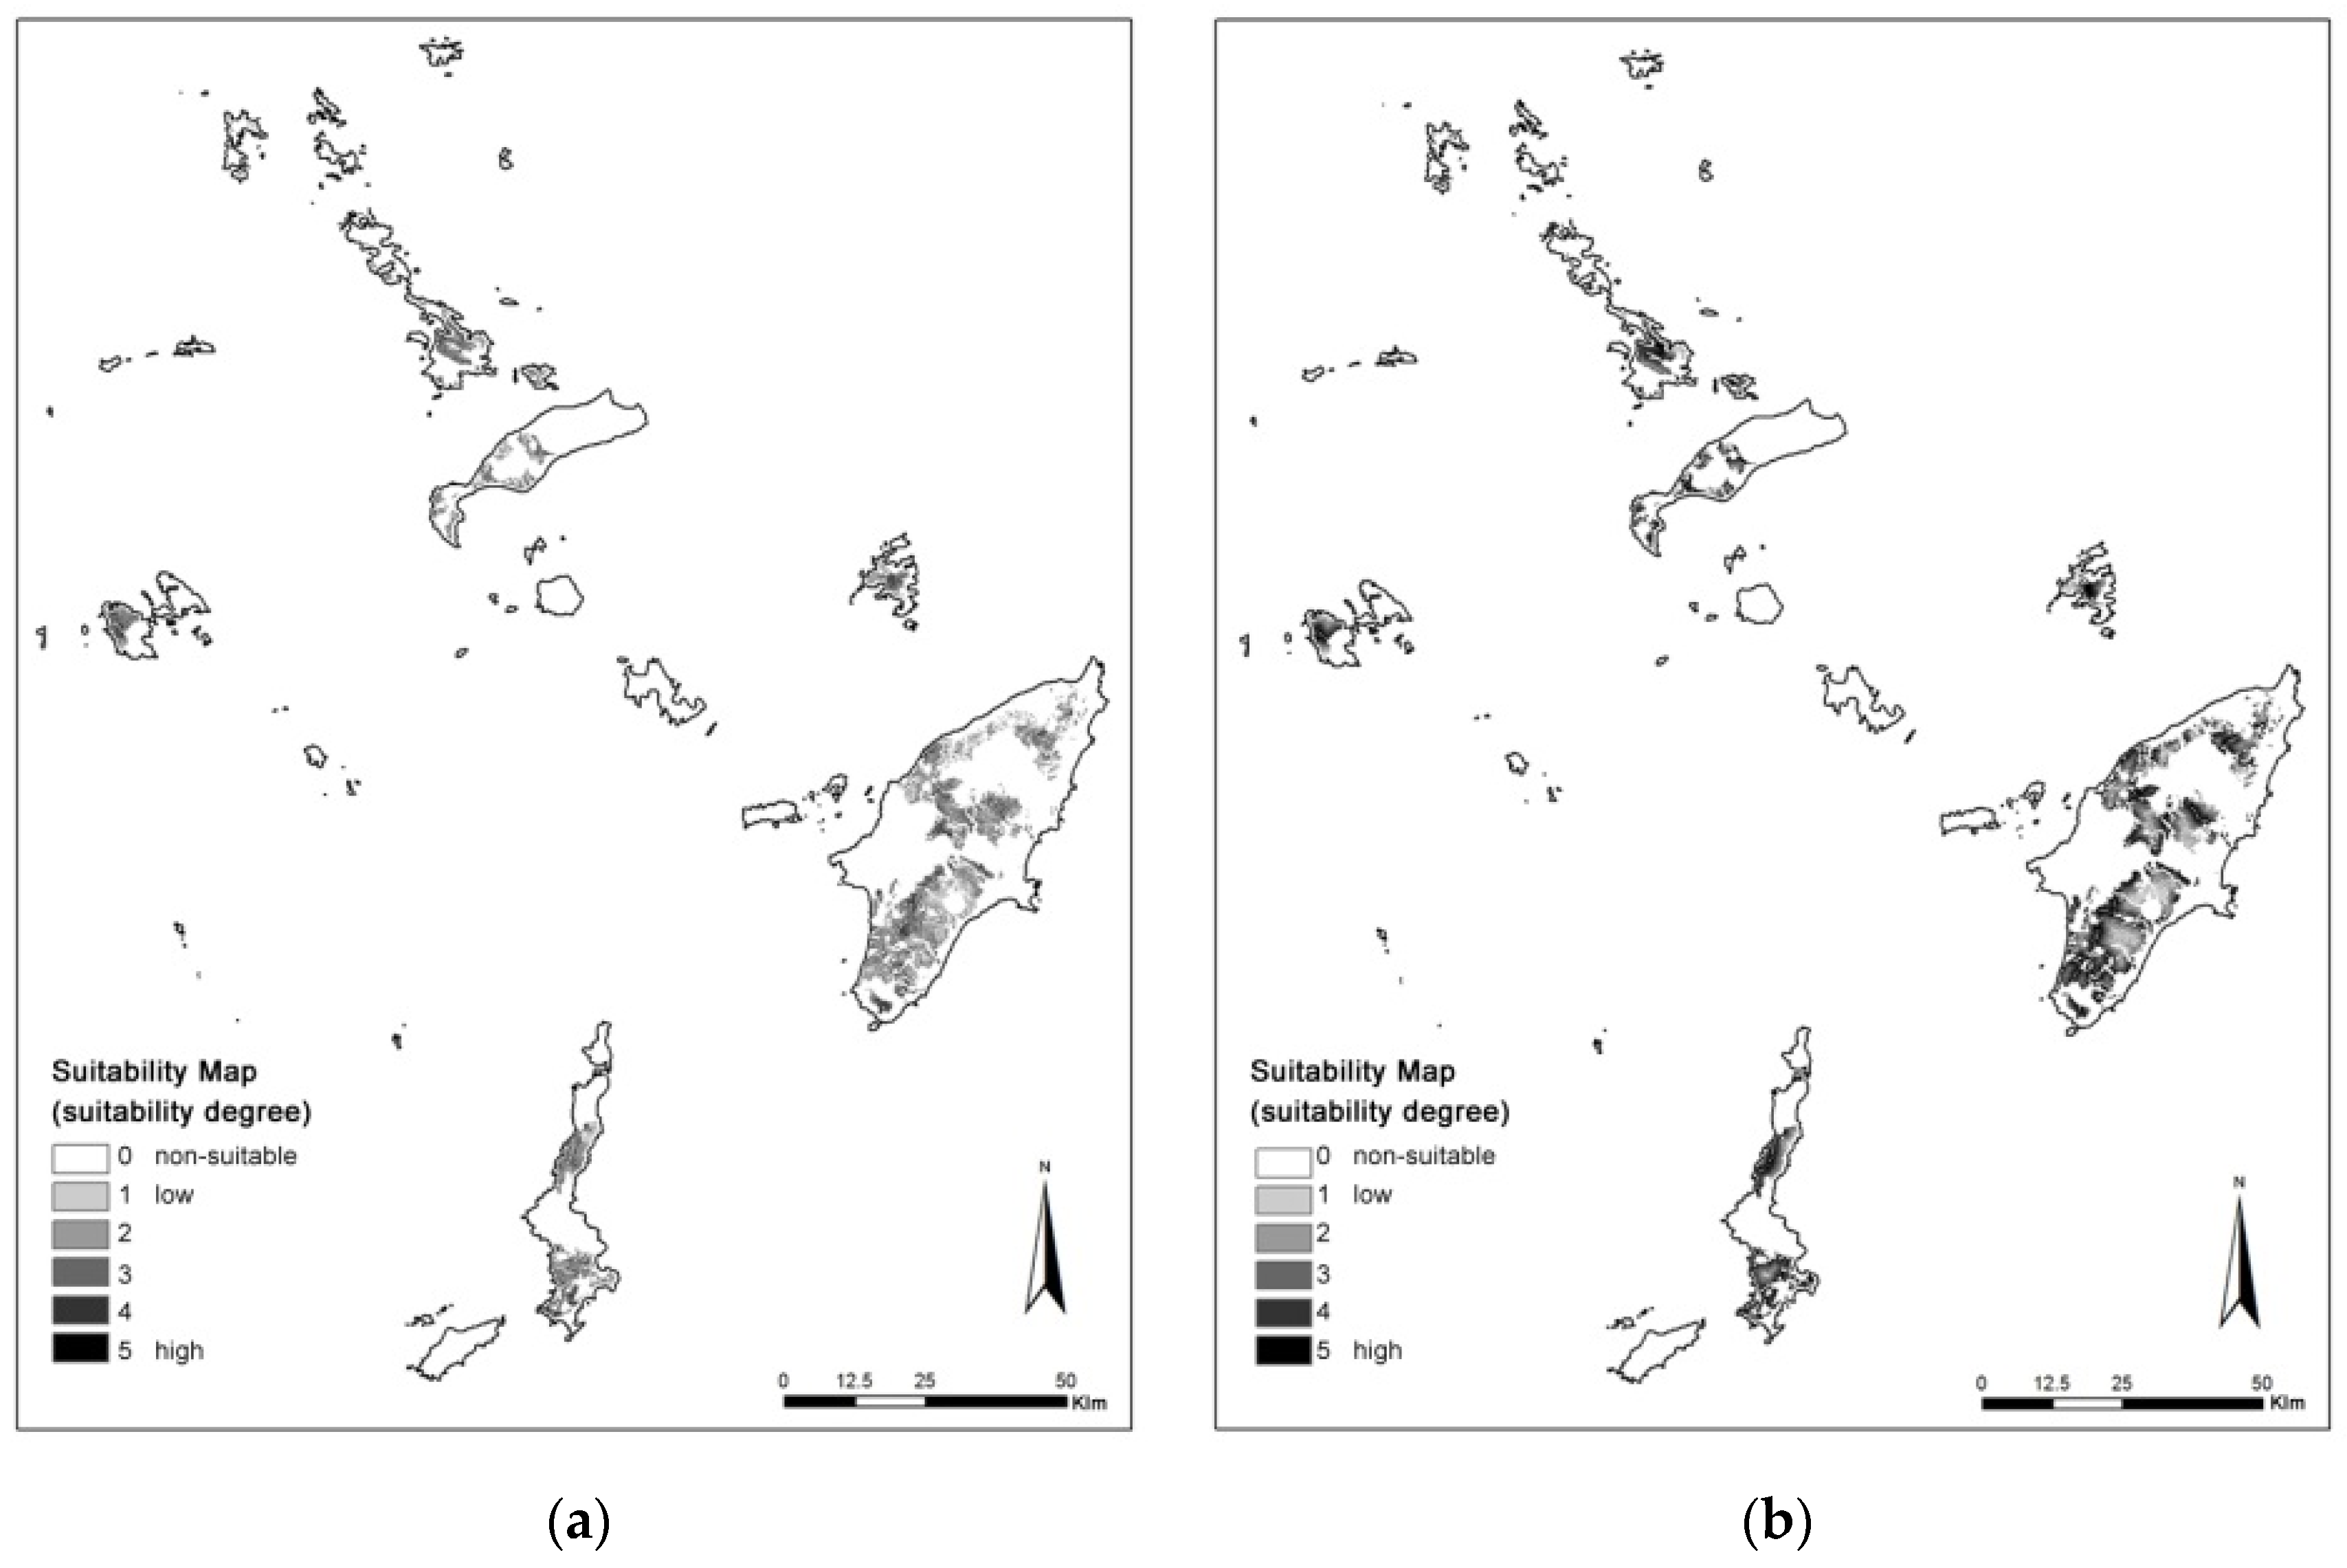
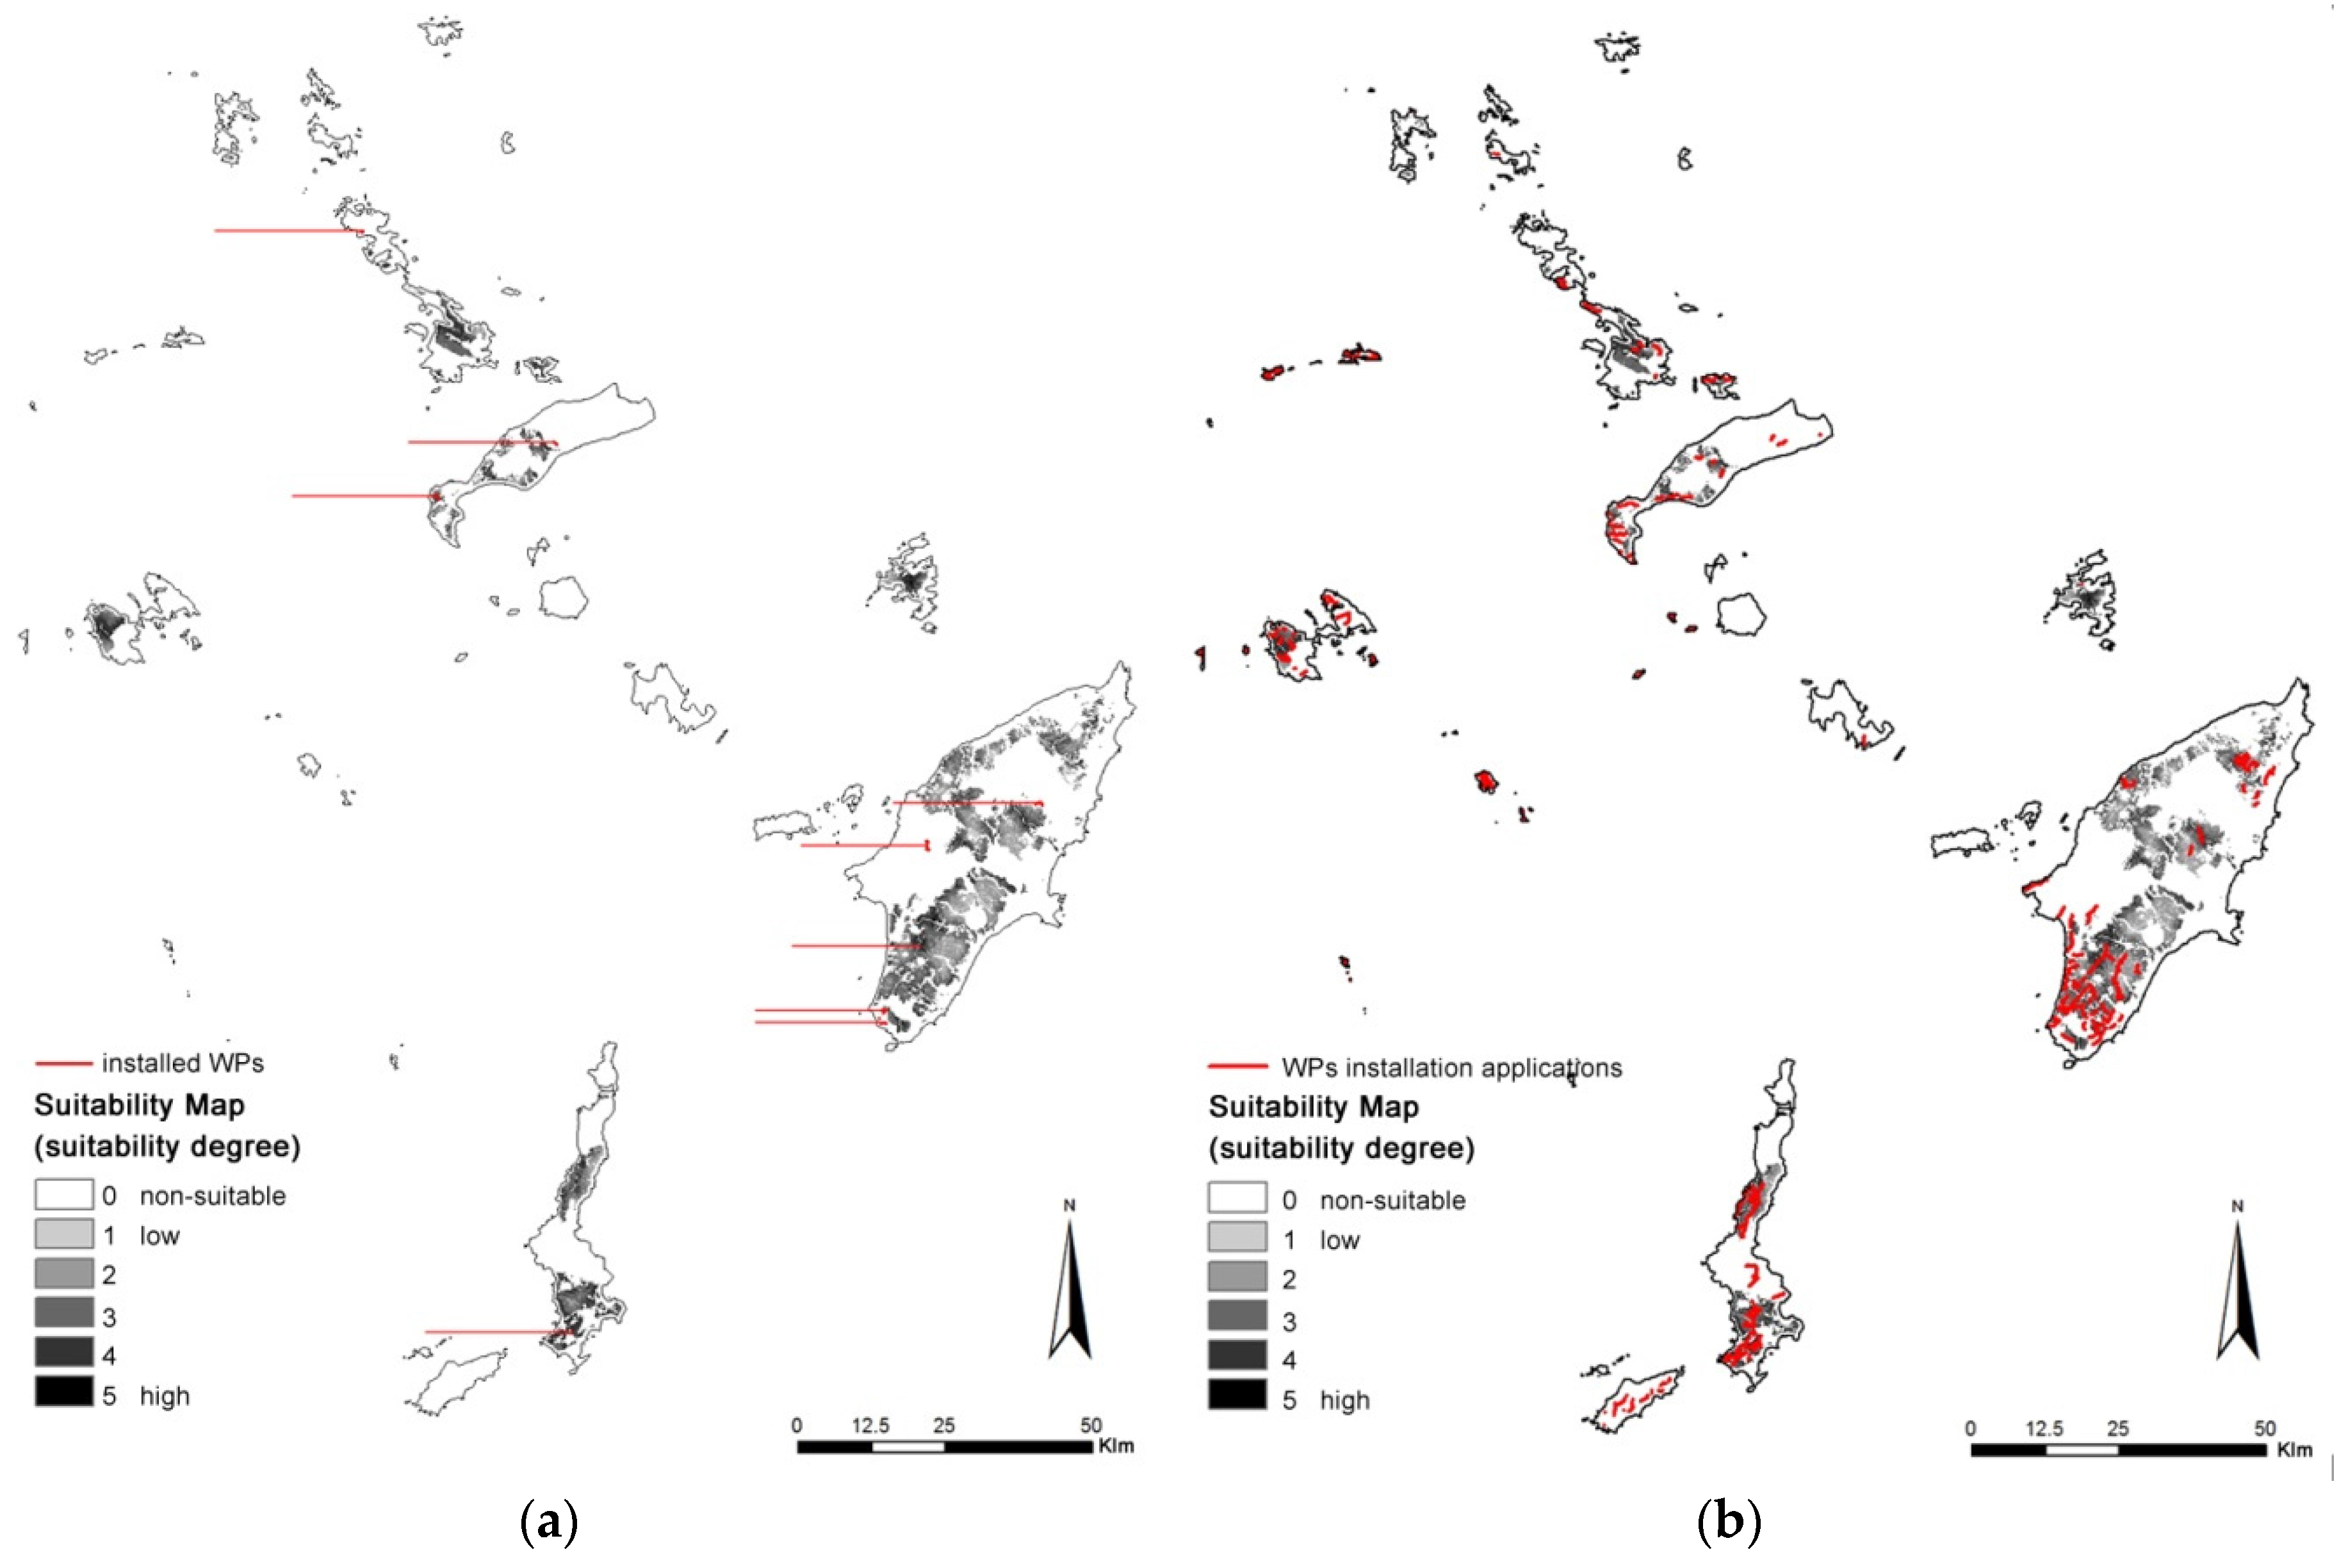
The juxtaposition of existing WFs over the suitability map of
Figure 9 is presented in
Figure 11a, in order their siting to be assessed. It is evident that a great number of the installed WFs are within exclusion areas (SPA-Natura 2000 and seashore), fact that illustrates the lack of environmental protection principles incorporation into the licensing process. It can be assumed that WF siting is driven by other incentives such as the maximization of high wind potential exploitation or the application of the technically optimal solution. Developers and competent authorities make a barren interpretation and enforcement of sitting legislation without any further assessment of the optimal location.
The aforementioned argument is further enhanced by
Figure 11b, which shows the WF siting applications that have been lodged for the Dodecanese Islands. The majority of applications regard the southern areas, where the wind potential is high. Kasos Island is part of Natura 2000 (SPA) network, which is considered to be an exclusion area at the present study. Nevertheless, a significant number of applications fall within this area. In contrast, for Karpathos Island, which is part of Natura 2000 (SCI) network, all applications are inside suitable areas.
6. Conclusions
The present study reports on the development of a methodological framework for WF site selection focusing on the environmental protection. It is based on the current legislation while incorporating environmental challenges coming out of equivalent scientific research and the international literature. Additionally, the special characteristics of the insular areas are taken into consideration as the Greek territory contains a large number of islands.
The objective of the study is to find environmentally suitable sites for wind farm installation, taking into account a number of constraints and emerging criteria. The pair-wise comparison method (AHP) is utilized to assign weights to the evaluation criteria. The method is hosted in a GIS environment in order the spatial dimension of the problem to emerge and the overall suitability map to be produced. A pioneering use of remote sensing techniques takes place, where satellite data are processed for the location and classification of vegetation density in order to be used as a land suitability evaluation criterion.
The proposed modelling as well as the selection and use of the evaluation criteria to classify land suitability in terms of environmental protection, in conjunction with the constraints imposed by legislation or emerge by research, under a multi-criteria decision making and spatial analysis framework is the main innovation of the study.
The method is experimentally applied on the group of the Dodecanese Islands. The area has been selected mainly because of its fragmented insular nature, as it is a remoted, non-interconnected to the energy grid of the mainland, group of islands. Additionally, there is an increased difficulty in WF siting policy making because of the intense tourism that takes place.
The major result is that, despite the adoption of numerous constraints, there is still a 23.4% suitable for WF siting, while highly suitable areas have 5f.7% land coverage. An initial comparison of the existing and proposed WF installation locations with the overall suitability map highlights the environmental assessment lack of the siting process under the current legislation
The proposed methodology can be a powerful tool by the competent authorities for the evaluation of WFs installation applications submitted to the competent body, RAE.
Acknowledgments
The authors wish to thank the (Greek) State Scholarships Foundation - Scholarships of Excellence for postgraduate studies in Greece: IKY-SIEMENS Program, for the financial support provided to M. Panagiotidou.
Author Contributions
Maria Panagiotidou is the main author and was responsible for the literature review, the methodology created and the data analysis presented in this paper. George Xydis and Christopher Koroneos were scientific collaborators who guided the work of this paper and suggested critical amendments. They also contributed revisions of the original text provided by the main author. Christopher Koroneos is the professor guiding the present group of researchers and provided feedback on the assumptions, methods and conclusions of the paper.
Conflicts of Interest
The authors declare no conflict of interest. The funding sponsors had no role in the design of the study; in the collection, analyses, or interpretation of data; in the writing of the manuscript, and in the decision to publish the results.
Abbreviations
| RES: | Renewable Energy Sources |
| WF: | Wind Farm |
| WE: | Wind Energy |
| RES SFSPSD-RES: | Special Framework for Spatial Planning and Sustainable Development for Renewable Energy Sources |
| WPA: | Wind Priority Areas |
| RAE: | Regulatory Authority for Energy |
| PPC: | Regulatory Authority for Energy |
| MCDM: | Multi-Criteria Decision Methods |
| LWA: | Linear Weighting Average |
| OWA: | Ordered Weighted Average |
| AHP: | Analytical Hierarchy Process |
| GIS: | Geographic Informational System |
| CR: | Consistency Ration |
| AES: | Autonomous Electric Systems |
| NDVI: | Normalized Difference Vegetation Index |
References
- Mondol, J.; Koumpetsos, N. Overview of challenges, prospects, environmental impacts and policies for renewable energy and sustainable development in Greece. Renew. Sustain. Energy Rev. 2013, 23, 431–442. [Google Scholar] [CrossRef]
- Chamber of Environment and Sustainability. Critical Sustainability Analysis of SFSPSD-RES. Athens, 2008. Available online: http://www.environ-sustain.gr/ (accessed on 9 September 2014).
- Greek Wind Energy Association. Renewable Energy Sources as an essential tool for environmental protection: Application and interpretation issues of environmental and forest legislation. Athens, 2010. Available online: http://eletaen.gr/απε-περιβαλλοντική-προστασία/ (accessed on 9 September 2014).
- Kambezidis, H.; Kasselouri, B.; Konidari, P. Evaluating policy options for increasing the RES-E penetration in Greece. Energy Policy 2011, 39, 5388–5398. [Google Scholar] [CrossRef]
- Greek Wind Energy Association. Statistics of the Wind Energy for year 2015. Athens, 2016. Available online: http://eletaen.gr/η-στατιστική-της-αιολικής-ενέργειας-γ-3/ (accessed on 1 January 2016).
- Georgiou, P.; Mavrotas, G.; Diakoulaki, D. The effect of islands’ interconnection to the mainland system on the development of renewable energy sources in the Greek power sector. Renew. Sustain. Energy Rev. 2011, 15, 2607–2620. [Google Scholar] [CrossRef]
- Island Studies. A World of Islands: An Island Studies Reader; Agenda Academic & Institute of Island Studies: Malta, PE, Canada, 2007. [Google Scholar]
- Small Island Developing States. Division for Sustainable Development, Department of Economic and Social Affairs, United Nations Secretariat Building, New York, 2014. Available online: http://www.sidsnet.org/ (accessed on 24 October 2016).
- Global Island Partnership. glispa GmbH, Berlin, 2013. Available online: http://www.glispa.com/ (accessed on 24 October 2016).
- Energy Development in Island Nations. Available online: http://www.edinenergy.org/ (accessed on 24 November 2016).
- European Islands Network on Energy and Environment. Available online: http://www.islenet.net/ (accessed on 24 November 2016).
- Green islands Azores. 2010. Available online: http://www.green-islands-azores.uac.pt/ (accessed on 24 November 2016).
- Pact of Islands. 2010. Available online: http://www.islepact.eu/ (accessed on 24 November 2016).
- Instituto Superior Tecnico. 100% RES—A challenge for island sustainable development. Instituto Superior Tecnico, Lisbon, 2005. Available online: http://www.unescocan.org/pdf/100RES.pdf (accessed on 24 November 2016).
- Gori, F.; Ludovisi, D.; Cerritelli, P. Forecast of oil price and consumption in the short term under three scenarios: Parabolic, linear and chaotic behaviour. Energy 2007, 32, 1291–1296. [Google Scholar] [CrossRef]
- Gipe, P. Samsø: Denmark’s Renewable Energy Island. Wind-Works.org. February 2006. Available online: http://www.wind-works.org/cms/index.php?id=61&tx_ttnews%5Btt_news%5D=509&cHash=35eee78d717826e522532cf952e2137e (accessed on 21 November 2016).
- International Study of RE-Regions. Pellworm Island, Germany. Available online: http://reregions.blogspot.pt/2010/03/pellworm-island.html (accessed on 24 November 2016).
- Dua, M.; Manwell, J.; McGowan, J. Utility scale wind turbines on a grid-connected island: A feasibility study. Renew. Energy 2008, 33, 712–719. [Google Scholar] [CrossRef]
- Notton, G.; Stoyanov, L.; Ezzat, M.; Lararov, V.; Diaf, S.; Cristofari, C. Integration Limit of Renewable Energy Systems in Small Electrical Grid. Energy Procedia 2011, 6, 651–665. [Google Scholar] [CrossRef]
- Papathanassiou, S.; Boulaxis, N. Power limitations and energy yield evaluation for wind farms operating in island systems. Renew. Energy 2006, 31, 457–479. [Google Scholar] [CrossRef]
- Neves, D.; Silva, C.; Connors, S. Design and implementation of hybrid renewable energy systems on micro-communities: A review on case studies. Renew. Sustain. Energy Rev. 2014, 31, 935–946. [Google Scholar] [CrossRef]
- Van Alphen, K.; van Sark, W.; Hekkert, M. Renewable energy technologies in the Maldives-determining the potential. Renew. Sustain. Energy Rev. 2007, 11, 1650–1674. [Google Scholar] [CrossRef]
- Nandi, S.; Ghosh, H. Techno-economic alanalysis of off-grid hybrid systems at Kutubdia Island, Bangladesh. Energy Policy 2010, 38, 976–980. [Google Scholar] [CrossRef]
- Krumdieck, S.; Hamm, A. Strategic analysis methodology for energy systems with remote island case study. Energy Policy 2009, 37, 3301–3313. [Google Scholar] [CrossRef]
- Diaf, S.; Belhamel, M.; Haddadi, M.; Louche, A. Technical and economic assessment of hybrid photovoltaic/wind system with battery storage in Corsica Island. Energy Policy 2008, 36, 743–754. [Google Scholar] [CrossRef]
- Bueno, C.; Carta, J. Wind powered pumped hydro storage systems, a means of increasing the penetration of renewable energy in the Canary Islands. Renew. Sustain. Energy Rev. 2006, 10, 312–340. [Google Scholar] [CrossRef]
- Segurado, R.; Krajacic, G.; Duic, N.; Alves, L. Increasing the penetration of renewable energy resources in, S. Vicente, Cape Verde. Appl. Energy 2011, 88, 466–472. [Google Scholar] [CrossRef] [Green Version]
- Duic, N.; Carvalho, M. Increasing renewable energy sources in island energy supply: Case study Porto Santo. Renew. Sustain. Energy Rev. 2004, 8, 383–399. [Google Scholar] [CrossRef]
- Parissis, O.S.; Zoulias, E.; Stamatakis, E.; Sioulas, K.; Alves, L.; Martins, R.; Tsikalakisc, A.; Hatziargyriouc, N.; Caralisc, G.; Zervos, A. Integration of wind and hydrogen technologies in the power system of Corvo Island, Azores: A cost-benefit analysis. Int. J. Hydrog. Energy 2011, 36, 8143–8151. [Google Scholar] [CrossRef]
- Matera, V.; Sapienza, C.; Andaloro, L.; Dispensa, G.; Ferraro, M.; Antonucci, V. An integrated approach to hydrogen economy in Sicilian Islands. Int. J. Hydrog. Energy 2009, 34, 7009–7014. [Google Scholar] [CrossRef]
- Ulleberg, Ø.; Nakken, T.; Eté, A. The wind/hydrogen demonstration system at Utsira in Norway: Evaluation of system performance using operational data and updated hydrogen energy system modelling tools. Int. J. Hydrog. Energy 2010, 35, 1841–1852. [Google Scholar] [CrossRef]
- Reddy, K.; Kumar, M.; Mallick, T.; Sharon, H.; Lokeswaran, S. A review of Integration, Control, Communication and Metering (ICCM) of renewable energy based smart grid. Renew. Sustain. Energy Rev. 2014, 38, 180–192. [Google Scholar] [CrossRef]
- Κaramanou, E.; Papathanassiou, S.; Papadopoulos, M. Planning the Interconnection of islands to the Mainland Grid via Submarine Cables. In Proceedings of the MedPower Conference, Thessaloniki, Greece, 2–5 November 2008.
- Boulaxis, N.; Papathanassiou, S.; Papadopoulos, M. Interconnection of the Cyclades islands with the mainland system to increase wind power penetration. In Proceedings of the Greek CIGRE Session 02, Athens, Greece, 11–12 April 2002.
- Papadopoulos, M.; Boulaxis, N.; Tsilis, M.; Papathanasiou, S. Interconnection of the Cycladic Islands to the Mainland Grid. In Proceedings of the 5th WSEAS International Conference on Power Systems and Electromagnetic Compatibility, Corfu, Greece, 23–25 August 2005; pp. 429–435.
- Papadopoulos, M.; Boulaxis, N.; Tsili, M.; Papathanassiou, S. Increased wind energy exploitation via interconnection of Aegean Islands to the mainland grid. In Proceedings of the CIRED’07, Vienna, Italy, 21–24 May 2007.
- National Technical University of Athens. Preliminary Study of the Cyclades Interconnection with Mainland Electricity System. Athens: Electrical and Computer Engineering Department–Electric Power Sector. March 2004. Available online: http://www.rae.gr/old/cases/C11/index.html (accessed on 28 November 2014).
- National Technical University of Athens. Strategic study of the interconnection of autonomous island power systems: Final report. Athens: Institute of Communication and Computer Systems. December 2006. Available online: http://www.rae.gr/old/cases/C19/ (accessed on 28 November 2014).
- Hellinic Transmission System Operator. Interconnections Study of the Aegean Islands to the mainland energy system-Phase I-General Design. 2010. Available online: http://www.desmie.gr/fileadmin/user_upload/Files/study/AIGAIA_DIASYNDESI_FASI_A_PERILIPSI.pdf (accessed on 8 February 2014).
- Xydis, G. A techno-economic and spatial analysis for the optimal planning of wind energy in Kythira Island, Greece. Int. J. Prod. Econ. 2013, 146, 440–452. [Google Scholar] [CrossRef] [Green Version]
- Tegou, L.; Polatidis, H.; Haralambopoulos, D. Environmental management framework for wind farm siting: Methodology and case study. J. Environ. Manag. 2010, 91, 2134–2147. [Google Scholar] [CrossRef] [PubMed]
- Tsoutsos, T.; Tsitoura, I.; Kokologos, D.; Kalaitzakis, K. Sustainable siting process in large wind farms case study in Crete. Renew. Energy 2015, 75, 474–480. [Google Scholar] [CrossRef]
- Voivondas, D.; Assimakopoulos, D.; Mourelatos, A. Evaluation of renewable energy potential using GIS decision support system. Renew. Energy 1998, 3, 333–344. [Google Scholar] [CrossRef]
- Baban, S.; Parry, T. Developing and applying a GIS-assisted approach to locating wind farms in the UK. Renew. Energy 2001, 24, 59–71. [Google Scholar] [CrossRef]
- Hansen, S. GIS-based Multi-Criteria Analysis of Wind Farm Development. In Proceedings of the Scan GIS’2005, Stockholm, Sweden, 13–15 June 2005.
- Rodman, L.; Meentemeyer, R. A geographic analysis of wind turbine placement in Northern California. Energy Policy 2006, 34, 2137–2149. [Google Scholar] [CrossRef]
- Yonca, N.; Kentel, E.; Duzgun, S. GIS-based environmental assessment of wind energy systems for spatial planning: A case study from Western Turkey. Renew. Sustain. Energy Rev. 2010, 14, 364–373. [Google Scholar]
- Bennui, A.; Rattanamanee, P.; Puetpaiboon, U.; Phukpattaranont, P.; Chetpattananondh, K. Site selection for large wind turbine using GIS. In Proceedings of the PSU-UNS International Conference on Engineering and Environment (ICEE’07), Phuket, Thailand, 10–12 May 2007.
- Al-Yahyai, S.; Charabi, Y.; Gastli, A.; Al-Badi, A. Wind farm land suitability indexing using multi-criteria analysis. Renew. Energy 2012, 44, 80–87. [Google Scholar] [CrossRef]
- Boroushaki, S.; Malczewski, J. Implementing an extension of the analytical hierarchy process using ordered weighted averaging operators with fuzzy quantifiers in ArcGIS. Comput. Geosci. 2008, 34, 399–410. [Google Scholar] [CrossRef]
- Saaty, T. How to make a decision: The Analytic Hierarchy Process. Eur. J. Oper. Res. 1990, 48, 9–26. [Google Scholar] [CrossRef]
- Yager, R. On ordered weighted averaging aggregation operators in multi-criteria decision making. IEEE T. Syst. Sci. Cyb. 1988, 18, 183–190. [Google Scholar] [CrossRef]
- Yager, R.; Kelman, A. An extension of the analytical hierarchy process using OWA operators. J. Intell. Fuzzy Syst. 1999, 7, 401–417. [Google Scholar]
- Haaren, R.; Fthenakis, V. GIS-based wind farm site selection using spatial multi-criteria analysis (SMCA): Evaluating the case for New York State. Renew. Sustain. Energy Rev. 2011, 15, 3332–3340. [Google Scholar] [CrossRef]
- Ranyard, R.; Crozier, R.; Svenson, O. Decision Making: Cognitive Models and Explanations; Routledge: London, UK, 1997. [Google Scholar]
- Malczewski, J. A GIS-based approach to multiple criteria group decision making. Int. J. Geogr. Inf. Syst. 1996, 10, 955–971. [Google Scholar] [CrossRef]
- Latinopoulos, D.; Kechagia, K. A GIS-based multi-criteria evaluation for wind farm site selection. A regional scale application in Greece. Renew. Energy 2015, 78, 550–560. [Google Scholar] [CrossRef]
- Rodriguez-Bachiller, A.; Glasson, J. Expert Systems and Geographical Information Systems for Impact Assessment; CRC Press–Taylor & Francis Group: New York, NY, USA, 2003. [Google Scholar]
- Centre for Renewable Energy Sources and Saving. Thematic Maps for the assessment of the technical and financial exploitable wind energy potential in Greece. CRES, 2001. Available online: http://www.cres.gr/kape/datainfo/maps.htm (accessed on 2 November 2014).
- DTU Department of Wind Energy. Global Wind Atlas. Available online: http://www.globalwindatlas.com/map.html (accessed on 28 March 2016).
- Reppas, A. Installed Power in the Dodecanese. Hellenic Electricity Distribution Network Operator SA, Department of Islands’ Management, Sector of Development and Production Management, Athens, Greece. 2015; Unpublished work. [Google Scholar]
- Kaousis, K. Installed capacity of wind farms in the Dodecanese. Hellenic Electricity Distribution Network Operator SA, Department of Islands’ Management, Sector of Energy Control Systems Operation, Athens, Greece. 2015; Unpublished work. [Google Scholar]
- Tourism-SFSPSD. Special Framework for Spatial Planning and Sustainable Development of Tourism; Ministry of Energy, Environment and Climate Change: Athens, Greece, 2013. [Google Scholar]
- Open Government Data. Available online: http://geodata.gov.gr/geodata/ (accessed on 21 April 2015).
- Commercial and Industrial Chamber of Dodecanese. Shops, industrial units/crafts and mines Dodecanese. 2014; Unpublished work. [Google Scholar]
- Ministry of Reconstruction of Production, Environment and Energy. Available online: http://www.ypeka.gr/ (accessed on 21 April 2015).
- Ministry of Culture, Education and Religious Affairs Energy. Available online: http://odysseus.culture.gr/a/map/gmap.jsp (accessed on 21 April 2015).
- Kokologos, D.; Tsitoura, I.; Kouloumpis, V.; Tsoutsos, T. Visual impact assessment method for wind parks: A case study in Crete. Land Use Policy 2014, 39, 110–120. [Google Scholar] [CrossRef]
- Hurtado, J.P.; Fernandez, J.; Parrondo, J.L.; Blanco, E. Spanish method of visual impact evaluation in wind farms. Renew. Sustain. Energy Rev. 2003, 8, 483–491. [Google Scholar] [CrossRef]
- Möller, B. Changing wind-power landscapes: regional assessment of visual impact on land use and population in Northern Jutland, Denmark. Appl. Energy 2006, 83, 477–494. [Google Scholar] [CrossRef]
- Azizi, A.; Jafari, H.R.; Parsa, V.A. Land suitability assessment for wind power plant site selection using ANP-DEMATEL in a GIS environment: Case study of Ardabil province, Iran. Environ. Monit. Assess. 2014, 10, 6695–6709. [Google Scholar] [CrossRef] [PubMed]
- Cavallaro, F.; Ciraolo, L. A multicriteria approach to evaluate wind energy plants on an Italian island. Energy Policy 2005, 33, 235–244. [Google Scholar] [CrossRef]
© 2016 by the authors; licensee MDPI, Basel, Switzerland. This article is an open access article distributed under the terms and conditions of the Creative Commons Attribution (CC-BY) license (http://creativecommons.org/licenses/by/4.0/).


