1. Introduction
In order to produce agricultural products, a piece of land is needed to plant the crops, nutrients, and water are needed to let them grow, and work is needed to plant, manage, and harvest them. These are the main agricultural inputs: land, water, nutrients, and work. Work can be either human labour, delivered by livestock, or by machinery. Pimentel and Pimentel [
1] analyse and compare the use of agricultural inputs among global extremes of agricultural production systems. They cover extensive systems with almost no external energy inputs (such as machinery and fertilizers) to intensive, highly-mechanized systems. Pimentel and Pimentel [
1] show strong differences in human labour requirements per kilogram of crop produced because of the replacement of human labour with machinery in highly-mechanized systems. In this paper, we build on this analysis by linking food consumption patterns with farm labour inputs of contrasting production systems.
By doing so, we complement a line of research that has emerged in the last years, studying the impact of both production and consumption of food on the use of agricultural resources, such as land [
2], water [
3], and nitrogen [
4,
5,
6]. These studies show the impact of diets on the agricultural resource requirements and typically show how many resources are needed to produce the food consumed by one person in a year. The food in the diet is traced back to the agricultural production in order to link it with the amount of resources that were used to produce it.
The studies have shown that, in general, affluent diets require larger amounts of agricultural resources than basic diets. However, in some cases, the type of production system can overrule the type of diet. For example, the very basic diet of Middle Africa, relying largely on staple crops, requires a similar amount of arable land than the very affluent consumption patterns of Western Europe [
2]. The reason is that the food of Middle Africa is produced in low crop yields systems and the food of Western Europe is produced in high crop yield systems. The methodology of these studies make it possible to combine both the differences in production and in diets throughout the world to assess the impact on the use of agricultural resources.
In this paper, we focus on analysing how farm labour requirements for the food consumed by one person changes as farming intensifies and diets become more affluent. Large global differences exist among food production systems in relation to labour requirements. The whole spectrum covers from low input systems, relying exclusively on labour by hand or by draft animals, to high-input systems where the production is highly mechanized [
1]. Additionally, diets differ greatly throughout the world in respect the consumption of staple and affluent food products [
7]. In order to provide an international comparison of the farm labour for food, we select four different scenarios representing the global extremes of diets and production systems. Our main research question is: How much farm labour is needed for the production of our food consumption, and what is the role of dietary patterns in the observed differences? Answering this question will give insights into, for instance, what extent the effect of mechanization decreasing farm labour demand is potentially offset by more resource-intensive diets.
2. Materials and Methods
Studies on the use of agricultural resources for food [
2,
3,
5,
6] often combine food consumption data (in kg/cap/year) with food production data (resources/kg food) to calculate the resource use per capita. In this paper, we follow a similar methodology in which the production data is the hours of farm labour needed to produce a kilogram of food. Thus, we define the
farm labour for food as the amount of human working hours needed in agriculture (crops and livestock) to produce the food that a person consumes in a year. The starting point is the food consumed per capita, which is linked to the agricultural labour required to produce the given amount of food.
We included labour for production up to the farm gate, i.e., planting, harvesting, weeding, and livestock management. The data was gathered from different sources that calculate all of the human labour required for each crop and livestock product at the farm scale (see
Table 1,
Table 2 and
Table 3). We calculated the farm labour for food for four scenarios. Each of the four scenarios is a combination of a production system and a diet to illustrate the global differences of consumption and production of food. Scenario 1 represents an affluent diet produced in a non-mechanized system, scenario 2 an affluent diet produced in a mechanized system, scenario 3 a basic diet produced in a non-mechanized system, and scenario 4 a basic diet produced in a mechanized system.
The average per capita food supply of Western Europe in 2010 was used for the affluent diet scenario, and the one of Middle Africa in 2010 was used as the basic diet. The food consumption data were gathered from the FAO statistics [
11]. The FAO [
11] gives food supply data for 92 food items. In order to identify the impact of the production and consumption data in the farm labour for food, simplification of the diet is needed. We grouped these food items into 12 categories, the food items in each food category have comparable agricultural labour requirements. The food categories are: cereals, roots, pulses, vegetable oils, vegetables, fruits, alcoholic beverages, milk, eggs, beef, pork, and chicken. Sugars are not included in the calculations since no data was available for the production of sugar crops in non-mechanized systems. Stimulants, such as coffee, tea, and cocoa are not included in the farm labour for food, but it is discussed in
Section 3.4.
The data sources of the production data of the vegetable products are indicated in
Table 1. The underlying studies quantify the amount of labour (in hours or days) in the agricultural field to produce a certain amount of crop, and indicate the obtained crop yields. The labour hours for the vegetable products produced in non-mechanized systems was gathered from [
8]. The data is given in days of work per hectare, we assumed that each working day includes 8 hours. By combining these data, we calculated the required hours of farm labour per kg of crop (see Equation (1)). Each food category of the diet is represented by one crop. In addition to human labour, the mechanized system uses mainly machinery for all of the tasks: ploughing, planting, weeding, and harvesting. The non-mechanized system uses draft animal power mainly for ploughing, and the rest is done only by human labour.
The following equations summarize our approach to calculate the hours of farm labour for food. The underlying values are presented in
Table 2 and
Table 4.
The labour needed for the production of the animal products includes: the labour to produce the feed as well as the labour for animal management (see Equation (2)). To calculate the labour to produce the feed, we assumed that one type of crop was used as feed for all the animal products. We selected maize as the feed for both the mechanized and the non-mechanized systems. We then multiplied the hours required to produce one kg of maize by an efficiency factor (
Table 2) for each animal product to calculate the hours per kilogram of meat, milk, or eggs (
Table 3). The conversion efficiency factors for livestock products were obtained from [
12] (Appendix 1). We used the global average data of an industrial system. For the non-mechanized system, only chicken was produced with off-farm feed (see details below). Therefore, the conversion efficiency factors (
Table 2) were used for all animal products of the mechanized systems and for chicken meat of the non-mechanized systems.
Large-scale intensive farms were used as examples of the farm labour for livestock maintenance in a mechanized system. Data were obtained from KWIN (Quantitative Information on Livestock Keeping) [
13]. This book provides overviews on what is needed to run an average farm in the Netherlands (machinery, livestock feed, labour, investments, energy etc.) for various types of livestock. The data that we used were the number of animal places that a farmer can manage in their farm and the life time of the animals before slaughter (
Table 3). We assumed that each farmer works 2000 hours per year. We used data on meat production per animal from the FAO statistics [
11], and data on milk and eggs production from KWIN [
13]. We combine these data to calculate the hrs/kg of animal product of maintenance labour in the farm (
Table 4).
Smallholders livestock systems were used as examples of the farm labour for livestock maintenance in a non-mechanized system. The choice of the production system to illustrate these non-mechanized systems was more difficult than the choice for the mechanized system, which are well documented. Large variety exists in small livestock production systems throughout the world. It is difficult to identify an example of production system for all animal products with the same degree of labour efficiency. We have chosen case studies of smallholders’ producers in different parts of the world. The number of hours of labour for livestock production in these systems is not as clear as for the intensive systems because these farmers usually do mix systems of producing other food crops or doing non-agricultural activities to earn extra income. Additionally, the labour is shared within the household and sometimes women’s and children’s labour are not fully quantified. However, we have chosen some studies that have calculated, based on surveys and interviews, the amount of labour needed exclusively for the livestock production in smallholder systems. These case studies illustrate a general picture of the labour needed in small scale non-mechanized systems which show large differences in comparison with the large scale mechanized systems (
Table 3 and
Table 4). We briefly describe these studies below.
For beef, we used data from smallholders in Eastern Amazon, Brazil [
14]. The smallholders have pastures for the cattle in combination with mixed systems of cassava, maize, pepper, and others. The cattle are fed only by pastures; no off-farm feed is used. On average, one farm has 14.7 hectares of pastures for 8.3 cows of 450 kg of life weight each. The labour required is an average 12 days of work per hectare, which includes planting, weeding, fencing, cutting down secondary vegetation, and animal care. We assumed a bull lives two years, and a dressing factor of the bull of 0.6 [
18], so each bull produces 270 kg of carcass meat.
For chicken meat and eggs, we used data from smallholders in the semi-arid region of Zimbabwe [
15]. These households have a mixed system of maize, cotton, sunflower, and a vegetable garden in addition to the chickens, and some of them also have cattle and small ruminants. The households have in average 17 chicken, and almost all farms supplemented the chicken with feed. Labour for chicken demanded the least time of the household duties and it was carried out all year. Muchadeyi [
15] show that, on average, one person spends one hour per day for managing the chickens, including penning the chickens at night, releasing them in the morning, and feeding them. We assumed two systems: one smallholder producing chicken meat and another producing eggs. For the chicken meat, we assumed a lifespan of two months, so each household produced 102 chicken per year on average, and each chicken produces 1.2 kg of meat (average data for Zimbabwe in 2010 from the FAO [
11]). For eggs, we assumed that the 17 chicken are hens that each produce 5 kg of eggs per year (yield data for Zimbabwe in 2010 from the FAO [
11]).
For pork, we used data from smallholders in the mountain area of Northeast India [
16]. These households also have mixed farming systems. On average, one household has two pigs which are kept in the backyard of the house. Most households practice stall feeding and not scavenging. The household produced the feed by cooking kitchen wastes, crop residues and plants collected from the forest or nearby areas. The pigs are fed twice a day. The live weight at 12 months is in average 65 kg per pig. We assume a dressing factor of 0.8 [
18] and after 12 months the pigs are slaughtered, so one pig produces 52 kg of meat per year. Kumaresan et al. [
16] do not give a number in the hours of labour needed for these activities, so we assumed one hour per day is needed all year long.
For milk, we used data from small-scale extensive systems in Bangladesh [
17]. On average, the households have two cows in a mixed farming system including rice production with 0.5 hectares of land for grazing and also perform off-farm activities. The farmers practice a “cut and carry feeding system” [
17] and, in addition to using their own land, they use public land for periodic grazing. Family labour is the only labour involved in managing the cows which involve 2163 hours per year per household, and each cow produces 721 kg of milk [
17].
Based on the data described above, we calculated the amount of farm labour needed to produce a kilogram of meat, milk and eggs. The results are shown in
Table 4.
After discussing the differences among production systems, we discuss the differences in diets. To do this, we used calories per person per day as the unit of measure, which is commonly used to describe nutritional differences. However, the data on diets that we used to calculate the farm labour for food is in kilograms per person per year. The data in both units (kilograms and kilocalories) were obtained from [
11].
Finally, we calculated the farm labour for food by combining the data of production (hrs/kg) and consumption (kg/cap/year) of all food categories to calculate the agricultural hours of labour needed per person (hrs/cap) for the four scenarios (see Equations (1) and (2)). The data is shown in
Table 4. The consumption data of vegetable oils and alcoholic beverages was converted into its crop equivalent following the methodology of Kastner and Nonhebel [
19]. We assumed that beer provides for the consumption of alcoholic beverages and soybean oil for the consumption of the vegetable oils.
3. Results
3.1. Labour Hours Per Kilogram of Food
The mechanized and non-mechanized systems differ widely, in both output per unit of land (crop yield) and labour input per unit of land, so the differences in hours worked per kg of food should be analysed considering both factors. In general, mechanized systems use less hrs/ha and obtain higher crop yields, which result in much lower hrs/kg than the non-mechanized systems. The lower labour per hectare is related to the machinery used in comparison with non-mechanized systems. The higher crop yields are not related to the machinery but with the use of other inputs, such as fertilizers and pesticides.
Differences exist among the type of crops. Potatoes result in the largest difference in hrs/ton: the value for the non-mechanized system is about 800 times the one of the mechanized system. In this case, the hours per hectare are about 50 times higher in the non-mechanized system, and the crop yield is about 15 times higher in the mechanized system. Differing by a factor of 250–350, cereals and oil crops show the largest difference in terms of field labour per unit area. However, for cereals the difference between crop yields is less pronounced with a factor 2. As a result, the difference relative between the systems in hrs/kg is less than the one for potatoes. With a factor of about 100, fruits and vegetables show the smallest difference in terms of farm labour input per unit product comparing the non-mechanized to the mechanized system. The reason is different for each food categories. For vegetables, the labour in the field (hrs/ha) is relatively different (factor: 30) but the crop yields are very similar. For fruits, both systems show very similar labour in the field (hrs/ha), but the crop yield is very different (factor: 60).
Similar to the vegetable products, the animal products show a strong difference in the hrs/kg between the mechanized and the non-mechanized system. Farm labour requirements in smallholder systems are 600–1500 times those in industrial systems for chicken, pork, milk, and eggs; for beef the factor is lower, with a value of about 50. The large-scale farms have high labour efficiency because of two main reasons. First, a very large number of animals are managed by only one farmer. For chicken and pork, the difference higher than a factor 1000, for beef and milk it is “only” a factor of 50 and 100, respectively (
Table 3). Second, the amount of meat or milk produced per animal is larger in industrial systems (
Table 3).
The relation between the farm labour for the feed and for the animal management in the farm is different between the mechanized and non-mechanized system. For the large-scale farms, the labour for the feed (in hrs/kg) is higher than the farm labour for management in the livestock farms. The opposite holds for the smallholder livestock.
The labour efficiency is different in the large-scale farms for the different products. Eggs and chicken require the least farm labour per kilogram produced: 0.0015 hrs/kg and 0.0019 hrs/kg, respectively. Pork (0.003 hrs/kg) and milk (0.005 hrs/kg) follow. Beef is the least labour efficient with 0.03 hrs/kg for two main reasons: first, the lifespan is longer for cattle than for pigs and chicken. Second, the average stock size per farm for cattle is smaller than for pigs and chicken.
The labour efficiency among the animal products in the smallholder system shows a different pattern: eggs are the least efficient followed by pork, chicken, milk, and beef. However, the data for these systems were gathered from different sources, countries, and production systems. Therefore, the difference in hrs/kg among the animal products in the non-mechanized systems may not be due to the type of product but by the type of production system. However, as additional analysis shows, this limitation of the data does not alter our results on the general differences between mechanized and non-mechanized systems (see
Supplementary Materials).
3.2. Food Consumption Patterns
The basic diet and the affluent diet differ in both the amounts of calories consumed and the composition of the products (
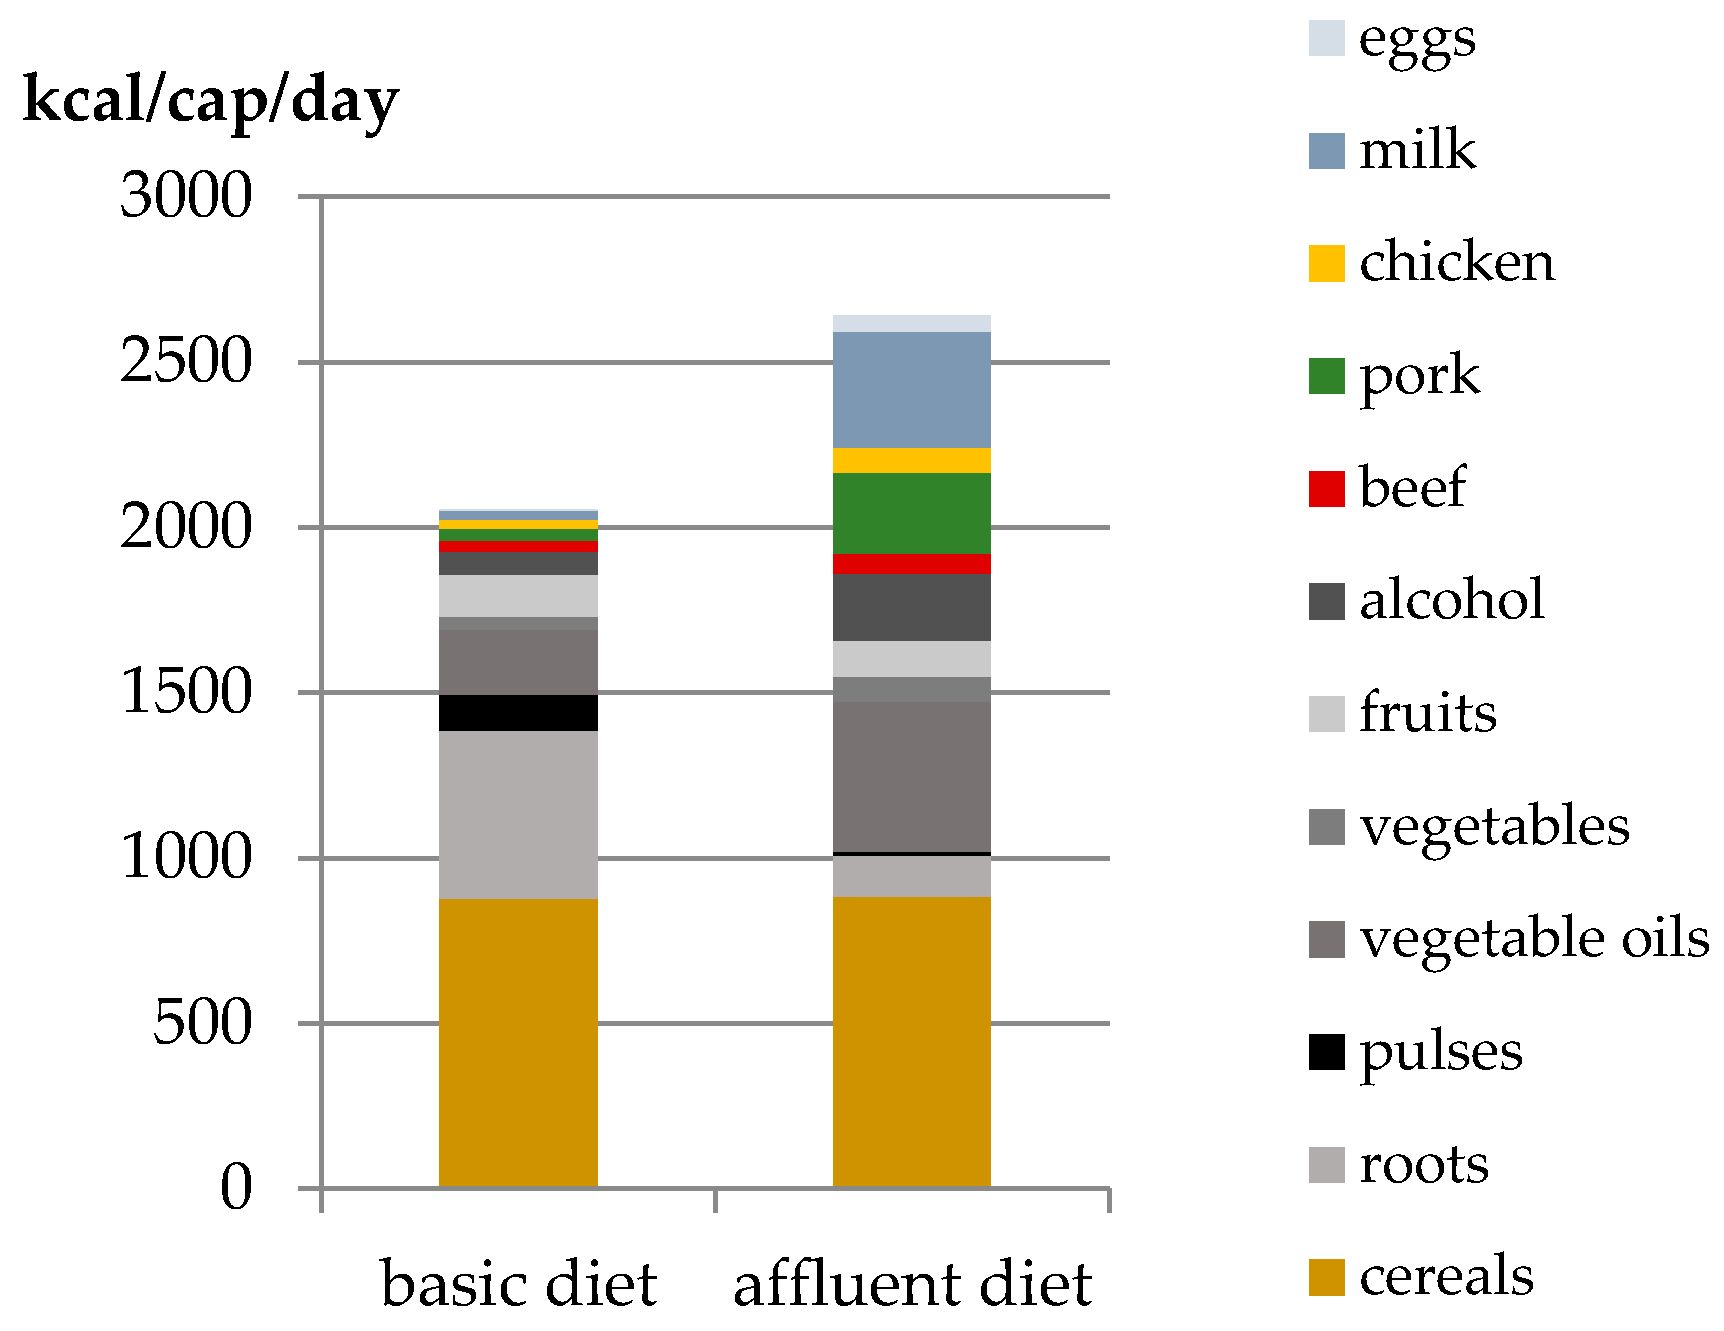
Figure 1). The total caloric availability of the affluent diet is 500 kcal/cap/day higher than the one of the basic diet. The largest difference originates from the amount of animal products in the diets. For the affluent diet, 30% of the calories are of animal origin and for the basic diet this value is only 6%. The number of calories for vegetable products is relatively similar, around 1900 kcal/dap/day each. However, the composition differs: in the basic diet, cereals, roots, and pulses account for 80% of the calories; and in the affluent diet, these food categories only account for 50%.
3.3. Farm Labour for Food
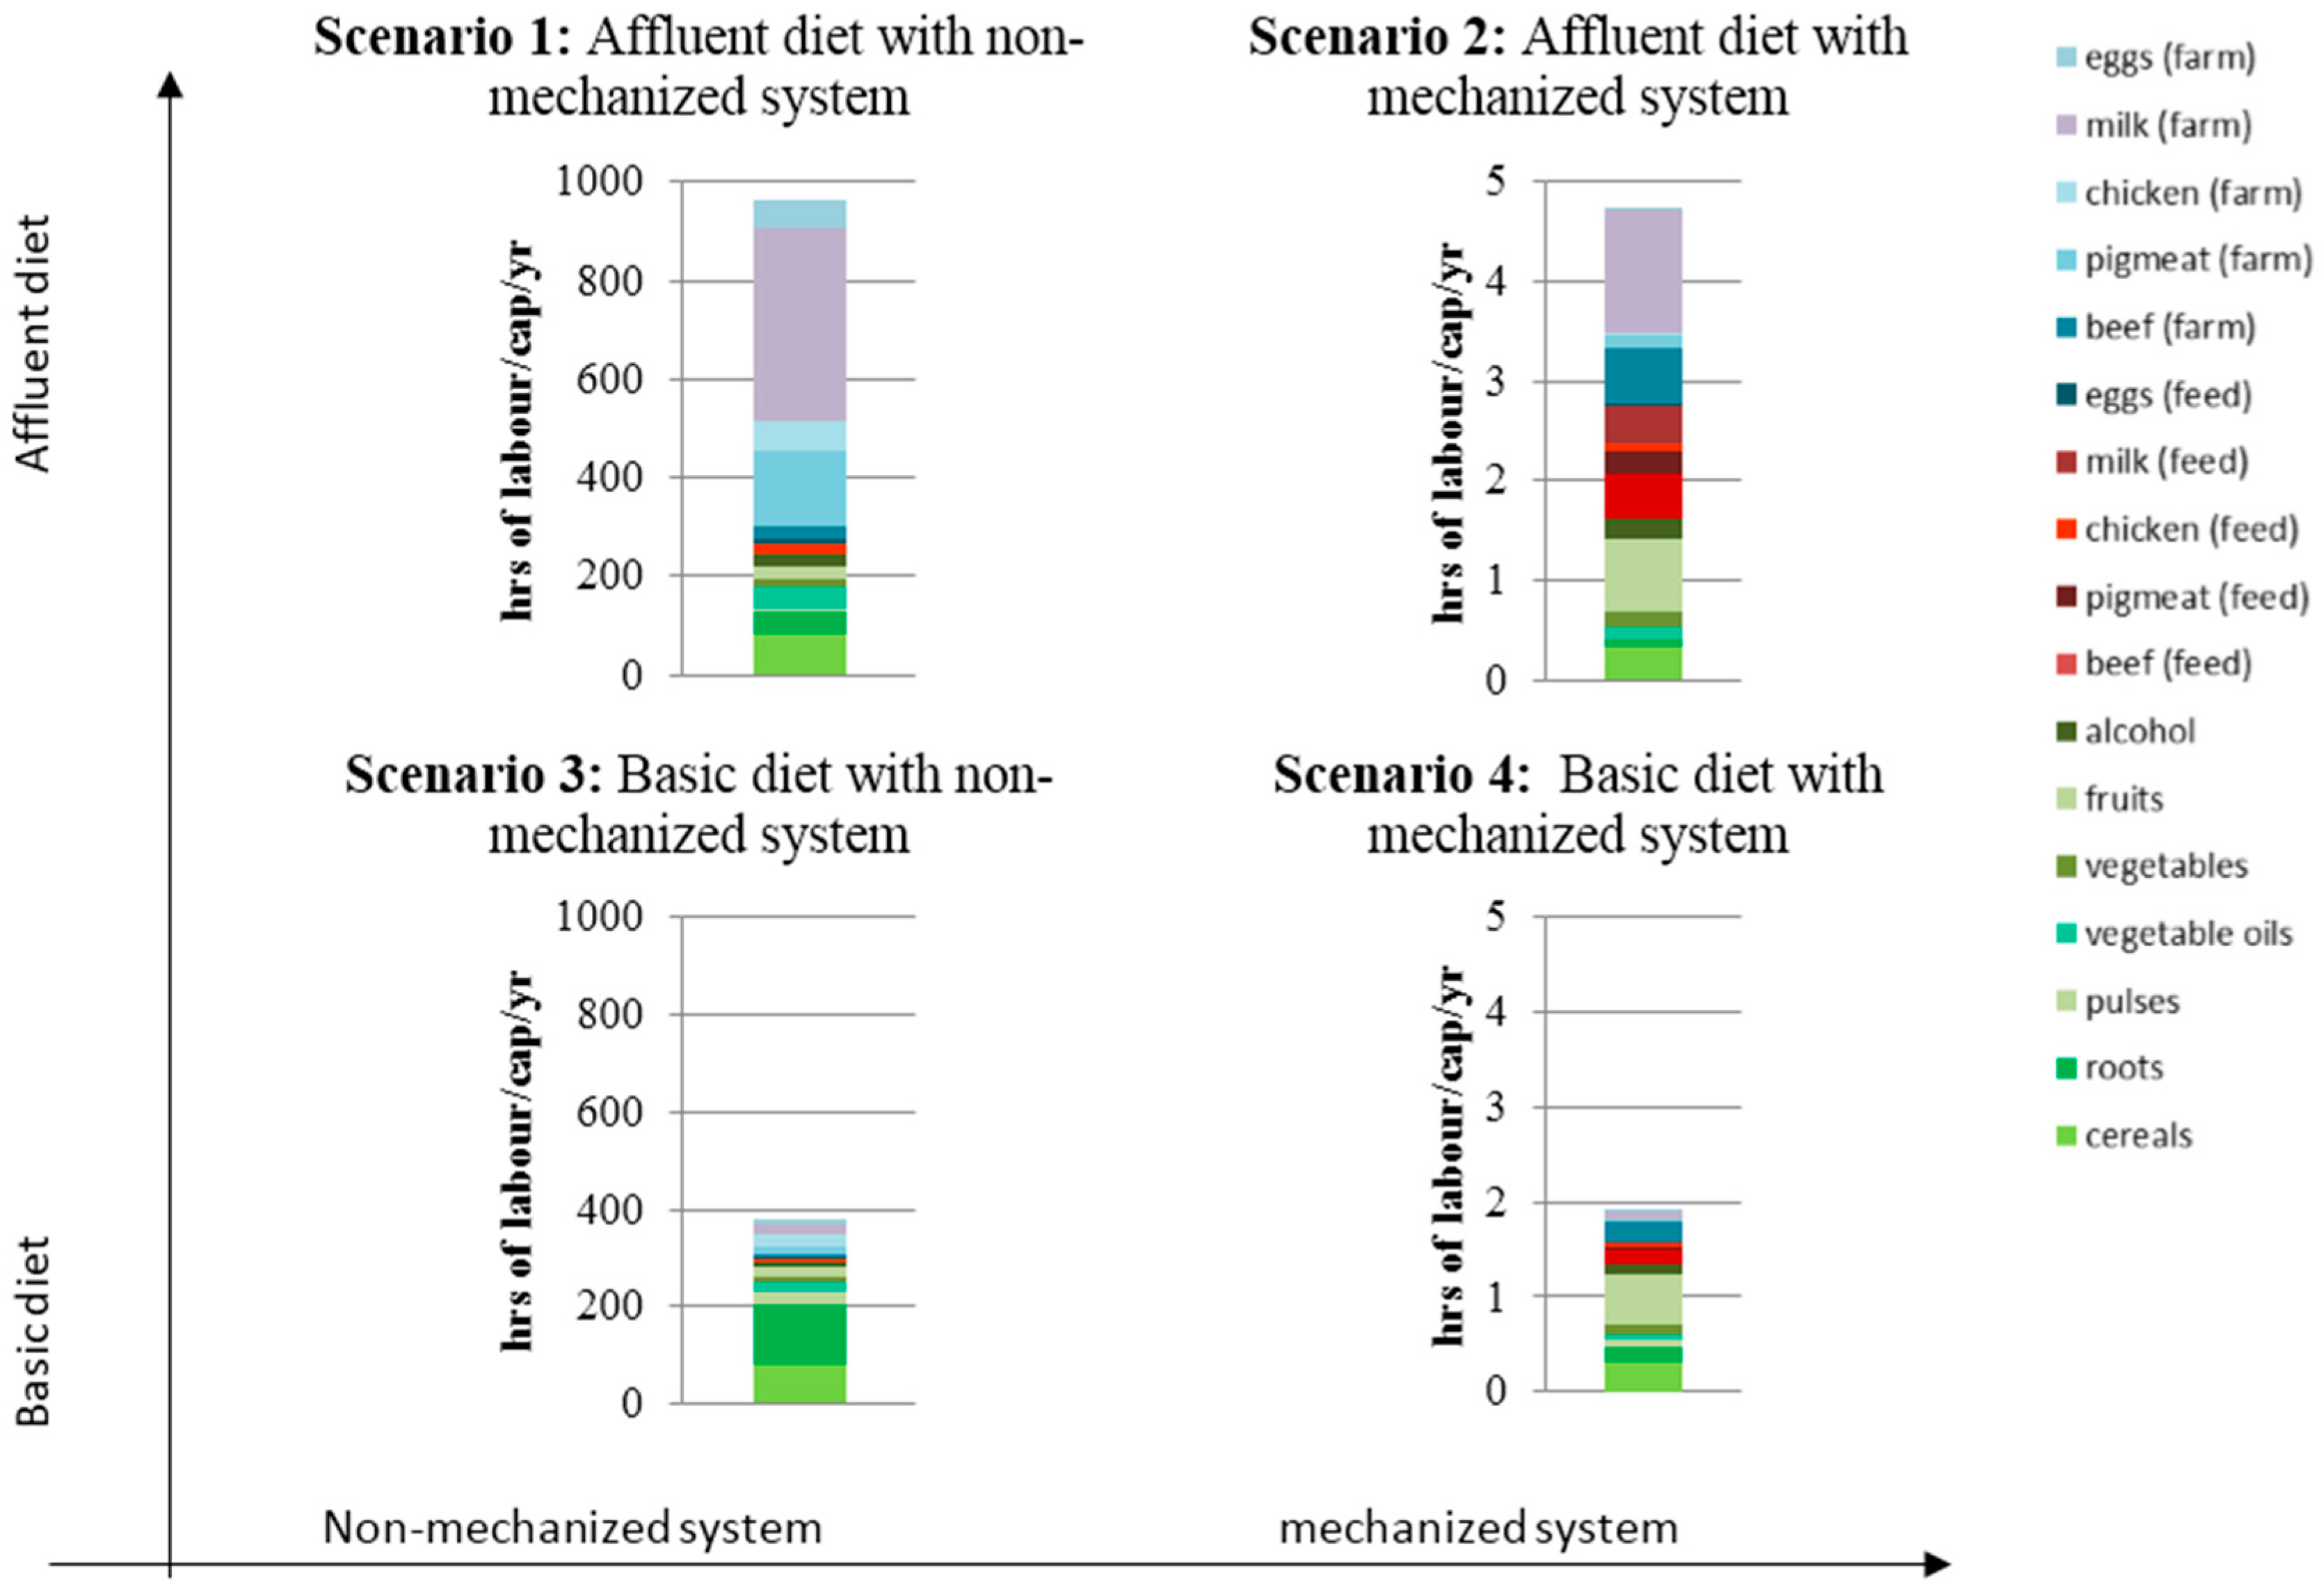
Figure 2 shows the farm labour requirements for food for the four scenarios. The values of this figure represent the time (in hours) of farm labour required to provide for the prevailing dietary patterns; results are broken down into food categories, distinguishing labour required on the livestock farm and on the crop fields producing the feed. The figure shows the strong differences in land requirements among the four scenarios. Scenario 1: 963 hrs/cap/year; scenario 2: 4.7 hrs/cap/year; scenario 3: 375 hrs/cap/year; and scenario 4: 1.9 hrs/cap/year.
The small number of hours needed to produce the food of a person in a mechanized system is striking. Less than five hours of farm labour for an affluent diet and only two hours for a basic diet are needed to produce the food that a person consumes throughout a whole year.
As the difference in the production system has the strongest impact on the farm labour requirements, in the non-mechanized system the picture is very different (note that the scale is 200 times different in scenarios 1 and 3 than in scenario 2 and 4): here, a basic diet requires about 350 hrs to supply a year worth of food supply. The affluent value is higher by a factor of over two compared to this, revealing the impact of dietary patterns.
Not only are the number of hours different among the four scenarios, but also the composition of the hours of labour in relation to the food categories. For basic diets, most of the labour is for the production of the vegetable products: 60% in a mechanized system and 80% in a non-mechanized system. The reason is mainly the low consumption of animal products in comparison with the affluent diet. In contrast, for the affluent diet, less than 30% of the labour is for vegetable products.
Looking in detail to the food categories we have identified the following. The labour for vegetable products produced in non-mechanized systems is more diversified among the different food categories. In contrast, the labour in mechanized systems for the vegetable products is mainly for fruits and cereals. The share of labour for animal products in the total diet is similar for both systems, but the composition differs. In non-mechanized systems (almost) all the labour is on the farm producing the animal products. In the mechanized system, only one fourth to one fifth of the labour is the livestock farms, while the rest is related to the production of feed on different farms.
3.4. Impact of Food Imports on the Farm Labour for Food
The labour required for the production of stimulants, such as coffee, was not included in the analysis. Other studies have shown that the use of resources for stimulants are relevant in relation to the rest of the food categories in the diet [
2,
3]. The largest per capita consumers of coffee are people living in industrial countries in Northern and Western Europe and North America [
11]. These countries import all their coffee consumption [
11]. In contrast, the major coffee producers are developing countries, such as Brazil, Vietnam, Indonesia, Colombia, and Ethiopia (according to the average national production data in 2012 [
11]). Therefore, the discussion of labour for coffee has to be seen in relation to the impact of food imports. Other affluent food products are also commonly imported by the consuming nations. For instance, Northern Europe imports most of their consumption of fruits (data from 2010 [
11]). So, in these cases, the farm labour for fruits and coffee should be discussed in relation to the impact of mixing food products produced with different degrees of mechanization in the overall numbers of farm labour for food consumption.
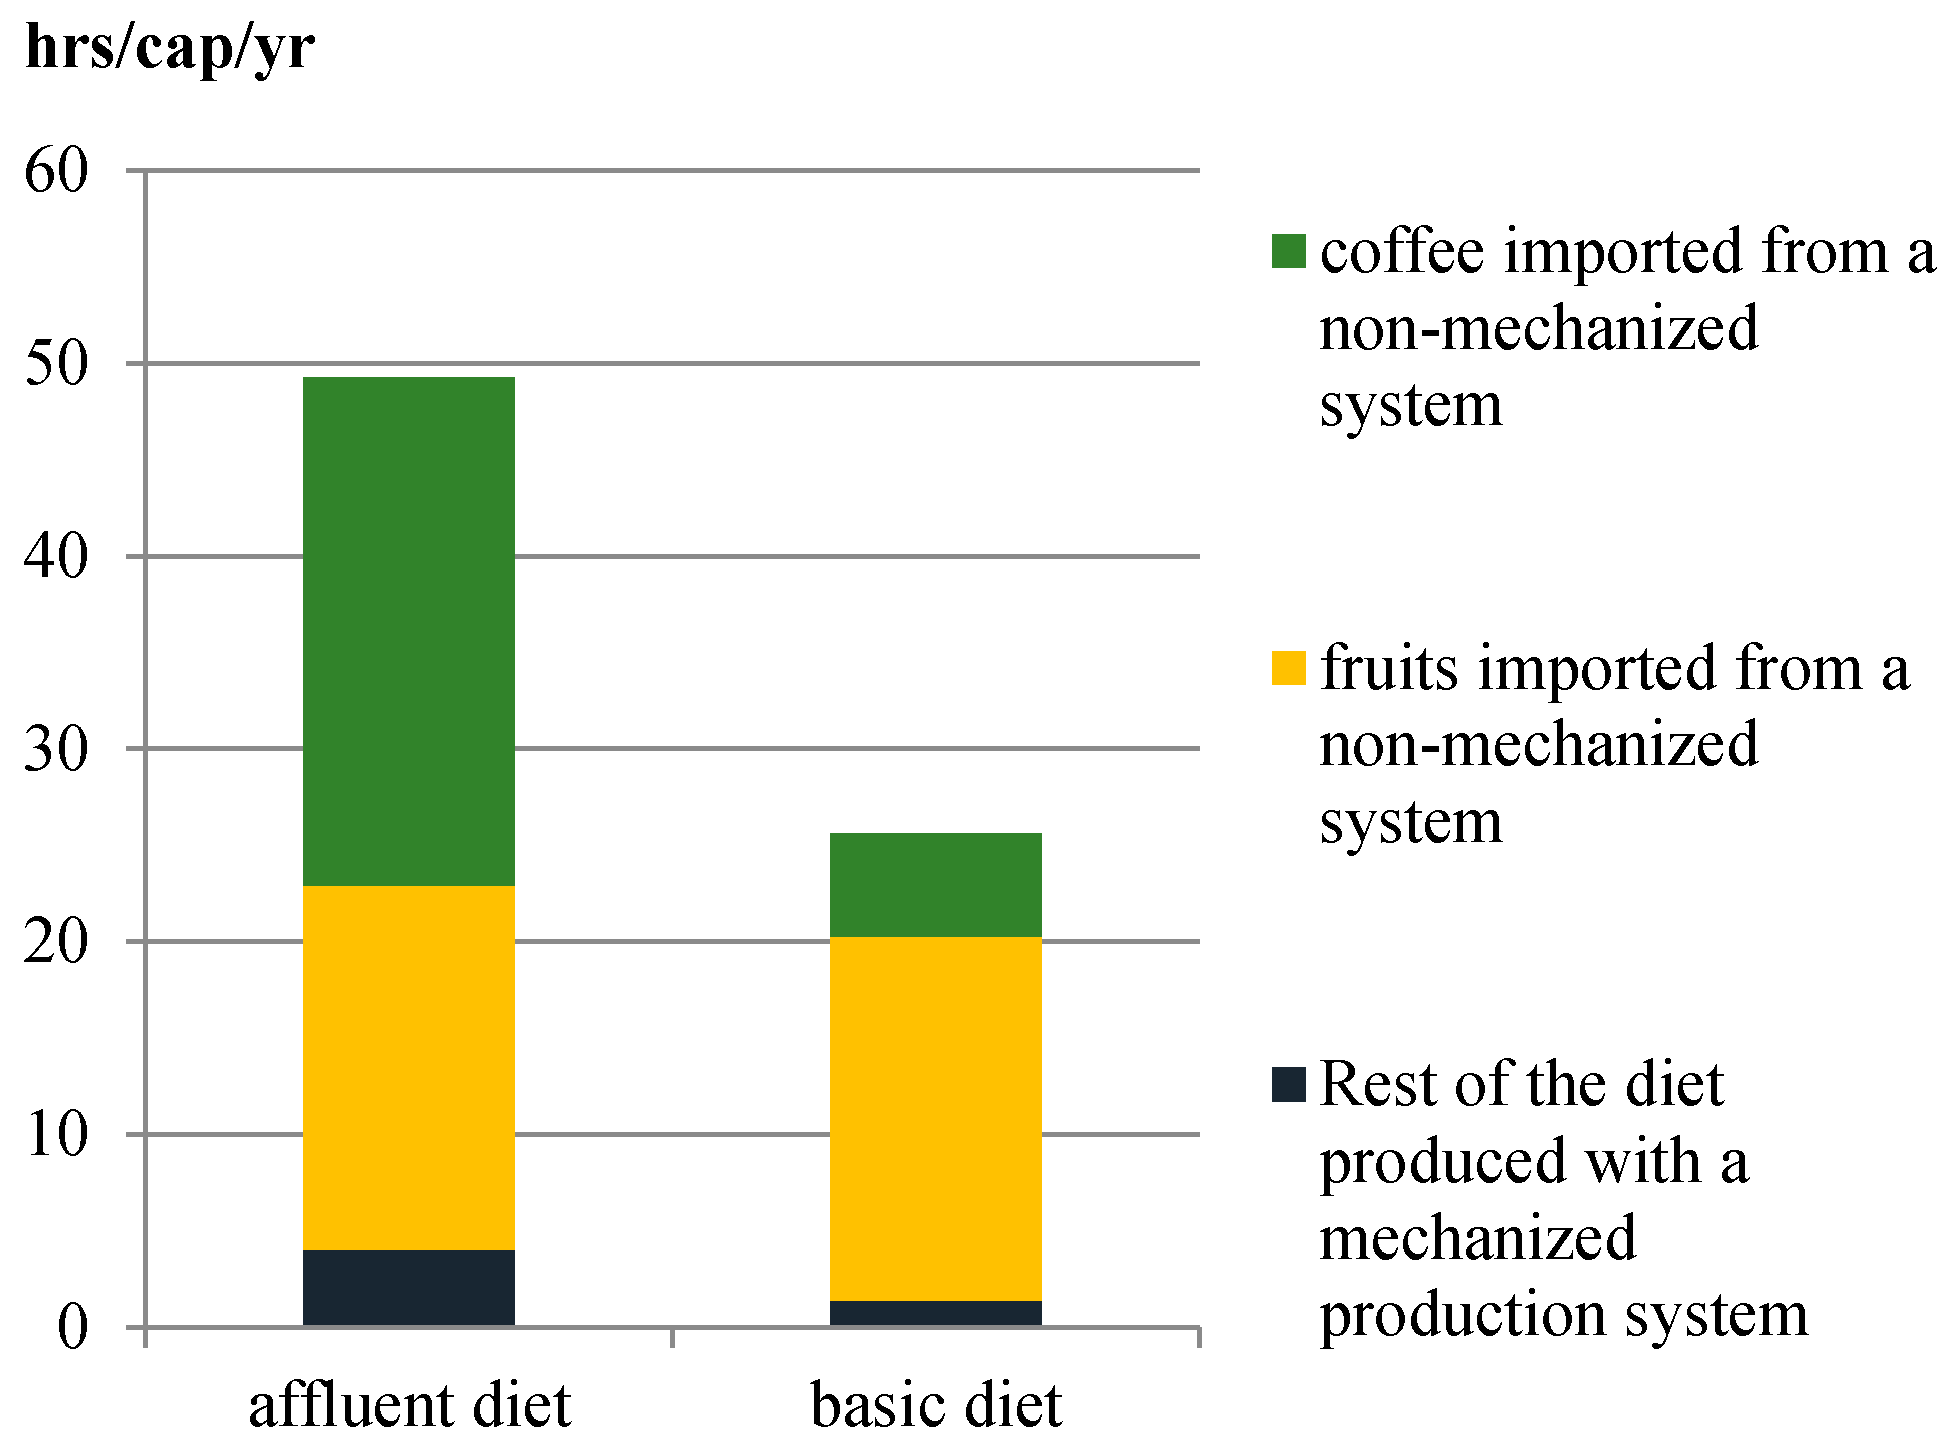
In
Figure 3, we show the calculations of the farm labour for food for an affluent and a basic diet for which all food products are produced in a mechanized system except for fruits and coffee which are imported from a non-mechanized system. For fruits, we used the production data of [
8] which was the example of a non-mechanized system for scenarios 1 and 3 (see
Table 4 for the production data). For coffee, we used the data of a case study in Indonesia [
20] (
Table 5).
Bubidarsono et al. [
20] calculate the hours of labour needed for several coffee production systems in the Lampung province of Sumatra in Indonesia. Most coffee production systems in this area require around 200 days of work per hectare per year. With this data and the crop yield data [
11], we calculated the hours needed per kilogram of coffee produced (see
Table 5): 3 hrs/kg. This value is large in comparison with the other vegetable food categories produced in a mechanized system shown in
Table 4. As a result, even a low consumption of coffee results in a relatively large need for labour in comparison with the other food categories.
Figure 3 shows the farm labour for food for an affluent and a basic diet produced in a mechanized system, with the exception of coffee and fruits, which are produced in a non-mechanized system. Coffee and fruits imported from a non-mechanized system play a major role in the farm labour for food since it overrules the labour for the other food products produced in a mechanized system. For example, the affluent diet produced with a mechanized system requires 4.7 hrs/cap, but by adding the labour for coffee and fruits from a non-mechanized system, then the whole farm labour for food is as high as 50 hrs/cap.


