Developing Adequate Communication of Waste Footprints of Products for a Circular Economy—A Stakeholder Consultation


1
IPD Integrated Product Development, ITM School of Industrial Engineering and Management, KTH Royal Institute of Technology Stockholm. Brinellvägen 83, 100 44 Stockholm, Sweden
2
IVL Swedish Environmental Research Institute. Valhallavägen 81, 114 27 Stockholm, Sweden
*
Author to whom correspondence should be addressed.
Resources 2018, 7(4), 78; https://0-doi-org.brum.beds.ac.uk/10.3390/resources7040078
Submission received: 13 September 2018
/
Revised: 11 November 2018
/
Accepted: 22 November 2018
/
Published: 26 November 2018
(This article belongs to the Collection Management, Environment, Energy and Sustainability under a Circular Economy)
Abstract
:Relatively few consumers are conscious of the waste generated in the course of producing the goods that they consume, although most are aware of the amount of waste they dispose of. This article reports on a small-scale survey (N = 28) among stakeholders aimed at developing adequate communication of preconsumer waste footprints of consumer goods in the context of the circular economy. Life cycle assessment (LCA) practitioners and consumers assessed five methodological details of an approach for calculating and communicating a product waste footprint (PWF). Most of the respondents expressed that the guidelines described in the proposed PWF methodology are good enough for the purposes of differentiating waste and byproducts, and defining which material flow shall be accounted for. Some LCA practitioners declared that the proposed streamlined method may not be adequate for conveying the environmental significance of waste types. The respondents also expressed that the PWF concept would be primarily useful and/or needed for consumers and government, and in the contexts of improving environmental awareness of consumers, environmental policy making, visualizing waste flows in a circular economy, and improving resource efficiency in industry, and less useful/needed in a business-to-business context. The PWF has been successfully used by diverse stakeholder groups in Sweden mostly to promote sustainable production and consumption across society. A notable example is the ‘invisible waste’ (#invisiblewaste) campaign of the Swedish Waste Management Association (Avfall Sverige). The concerns of the LCA experts have therefore not held true. The symbolic power and parsimony of the PWF concept appears to be effective in sensitizing consumers towards waste issues so that circular economy strategies beyond recycling are possible to be fully realized.
1. Introduction
The disclosure of environmental information at several system levels (product, company, city, region, country, humanity) for different stakeholders (final consumers, policy makers, business, academia) is an important area of sustainability. Ecological footprint [1], carbon footprint [2], water footprint [3], energy footprint [4], nitrogen footprint [5], chemical footprint [6], and material footprint [7,8] are examples of footprint-based indicators commonly used to measure environmental emissions, resource use, and other impacts. Each of these indicators discloses one layer of information about the full disturbance of anthropogenic activities on the natural environment at different system levels, for different purposes, uses, and users.
Recently, with the recent action plan for a circular economy (CE) by the European Commission, as well as several other initiatives around the globe, there has been an exponential interest on CE initiatives branded under the CE tag in business [9], popularized by the Ellen MacArthur Foundation [10]. Although recycling has been practiced for generations, the CE initiative has succeeded in engaging business and governments in the endeavour of increasing waste recycling rates [11].
However, beyond recycling [9], the CE has been adopted by business rarely and only fragmentally [12]. In fact, recycling is only one strategy of the CE. Longevity and repair are major strategies in reducing the need for extraction and must come before the recycling strategy [13]. Furthermore, postconsumer waste is only a small fraction of the total waste generated to produce the goods we consume and upstream wastes are rarely outlined. Depending on the type of consumer good, the waste generated along its supply chain can be from 0.5-fold (food products) to 1000-fold (electronic products) higher than its weight [14]. Without information about the total waste caused by producing consumer goods, companies, policy makers, and consumers have no solid basis to move beyond recycling thinking.
In order to address this knowledge gap, a simplified metric based on life cycle thinking to calculate types and quantities of waste generated to produce consumer goods was proposed by the authors and tested for 11 generic products. The purpose of this indicator is to increase the environmental awareness of consumers beyond postconsumer waste recycling. The results were published initially in a popular science report (e.g., see [15]) and received immense attention from a large suite of media, including Swedish television and in printed and online news channels (see a list in the Supplementary Material S1). This coverage of our earlier results strengthens our view that this information (which we consider to be not well known) is of interest to many stakeholder groups and is important to highlight outside the scientific community.
However, some points of caution can be seen in this simplified metric from a rigid life cycle assessment (LCA) perspective. It appears, therefore, that a divergence of the type of information consumers require and the indicators used and provided by LCA calculations exists, identifying a salient need to extend studies of the relevance of waste information to address requirements across stakeholder groups.
The aim of the present study is to therefore highlight the role of developing an approach to reach a wider audience to communicate the waste footprint and the divergence of uptake, understanding, and practicality between different stakeholder groups, in the context of the circular economy.
2. Materials and Methods
2.1. The Product Waste Footprint Approach
The original PWF approach consisted of several iterative steps. First, components and material composition of a given product/good are defined. LCA datasets containing information about waste generation (i.e., types and quantities of waste flows, material input flows, and electricity inputs) are collected for each material and component. The material input flows are handled in order to add the contribution of waste generated upstream in the value chain in the subsequent steps; the waste generated by producing the electricity is integrated in the model. A cut-off criterion of 10% of the weight of the material inputs (exclusion of maximum 10% of mass) may be reasonable to be applied to reduce complexity. This process of identifying datasets and gathering data shall be repeated for upstream processes in the value chain until extraction of the materials. The waste flows are aggregated into total waste from main unit processes (for example, for beef, these are feed production, farm management, and slaughterhouse). Finally, a matrix composed of the waste output flows and each respective process is composed.
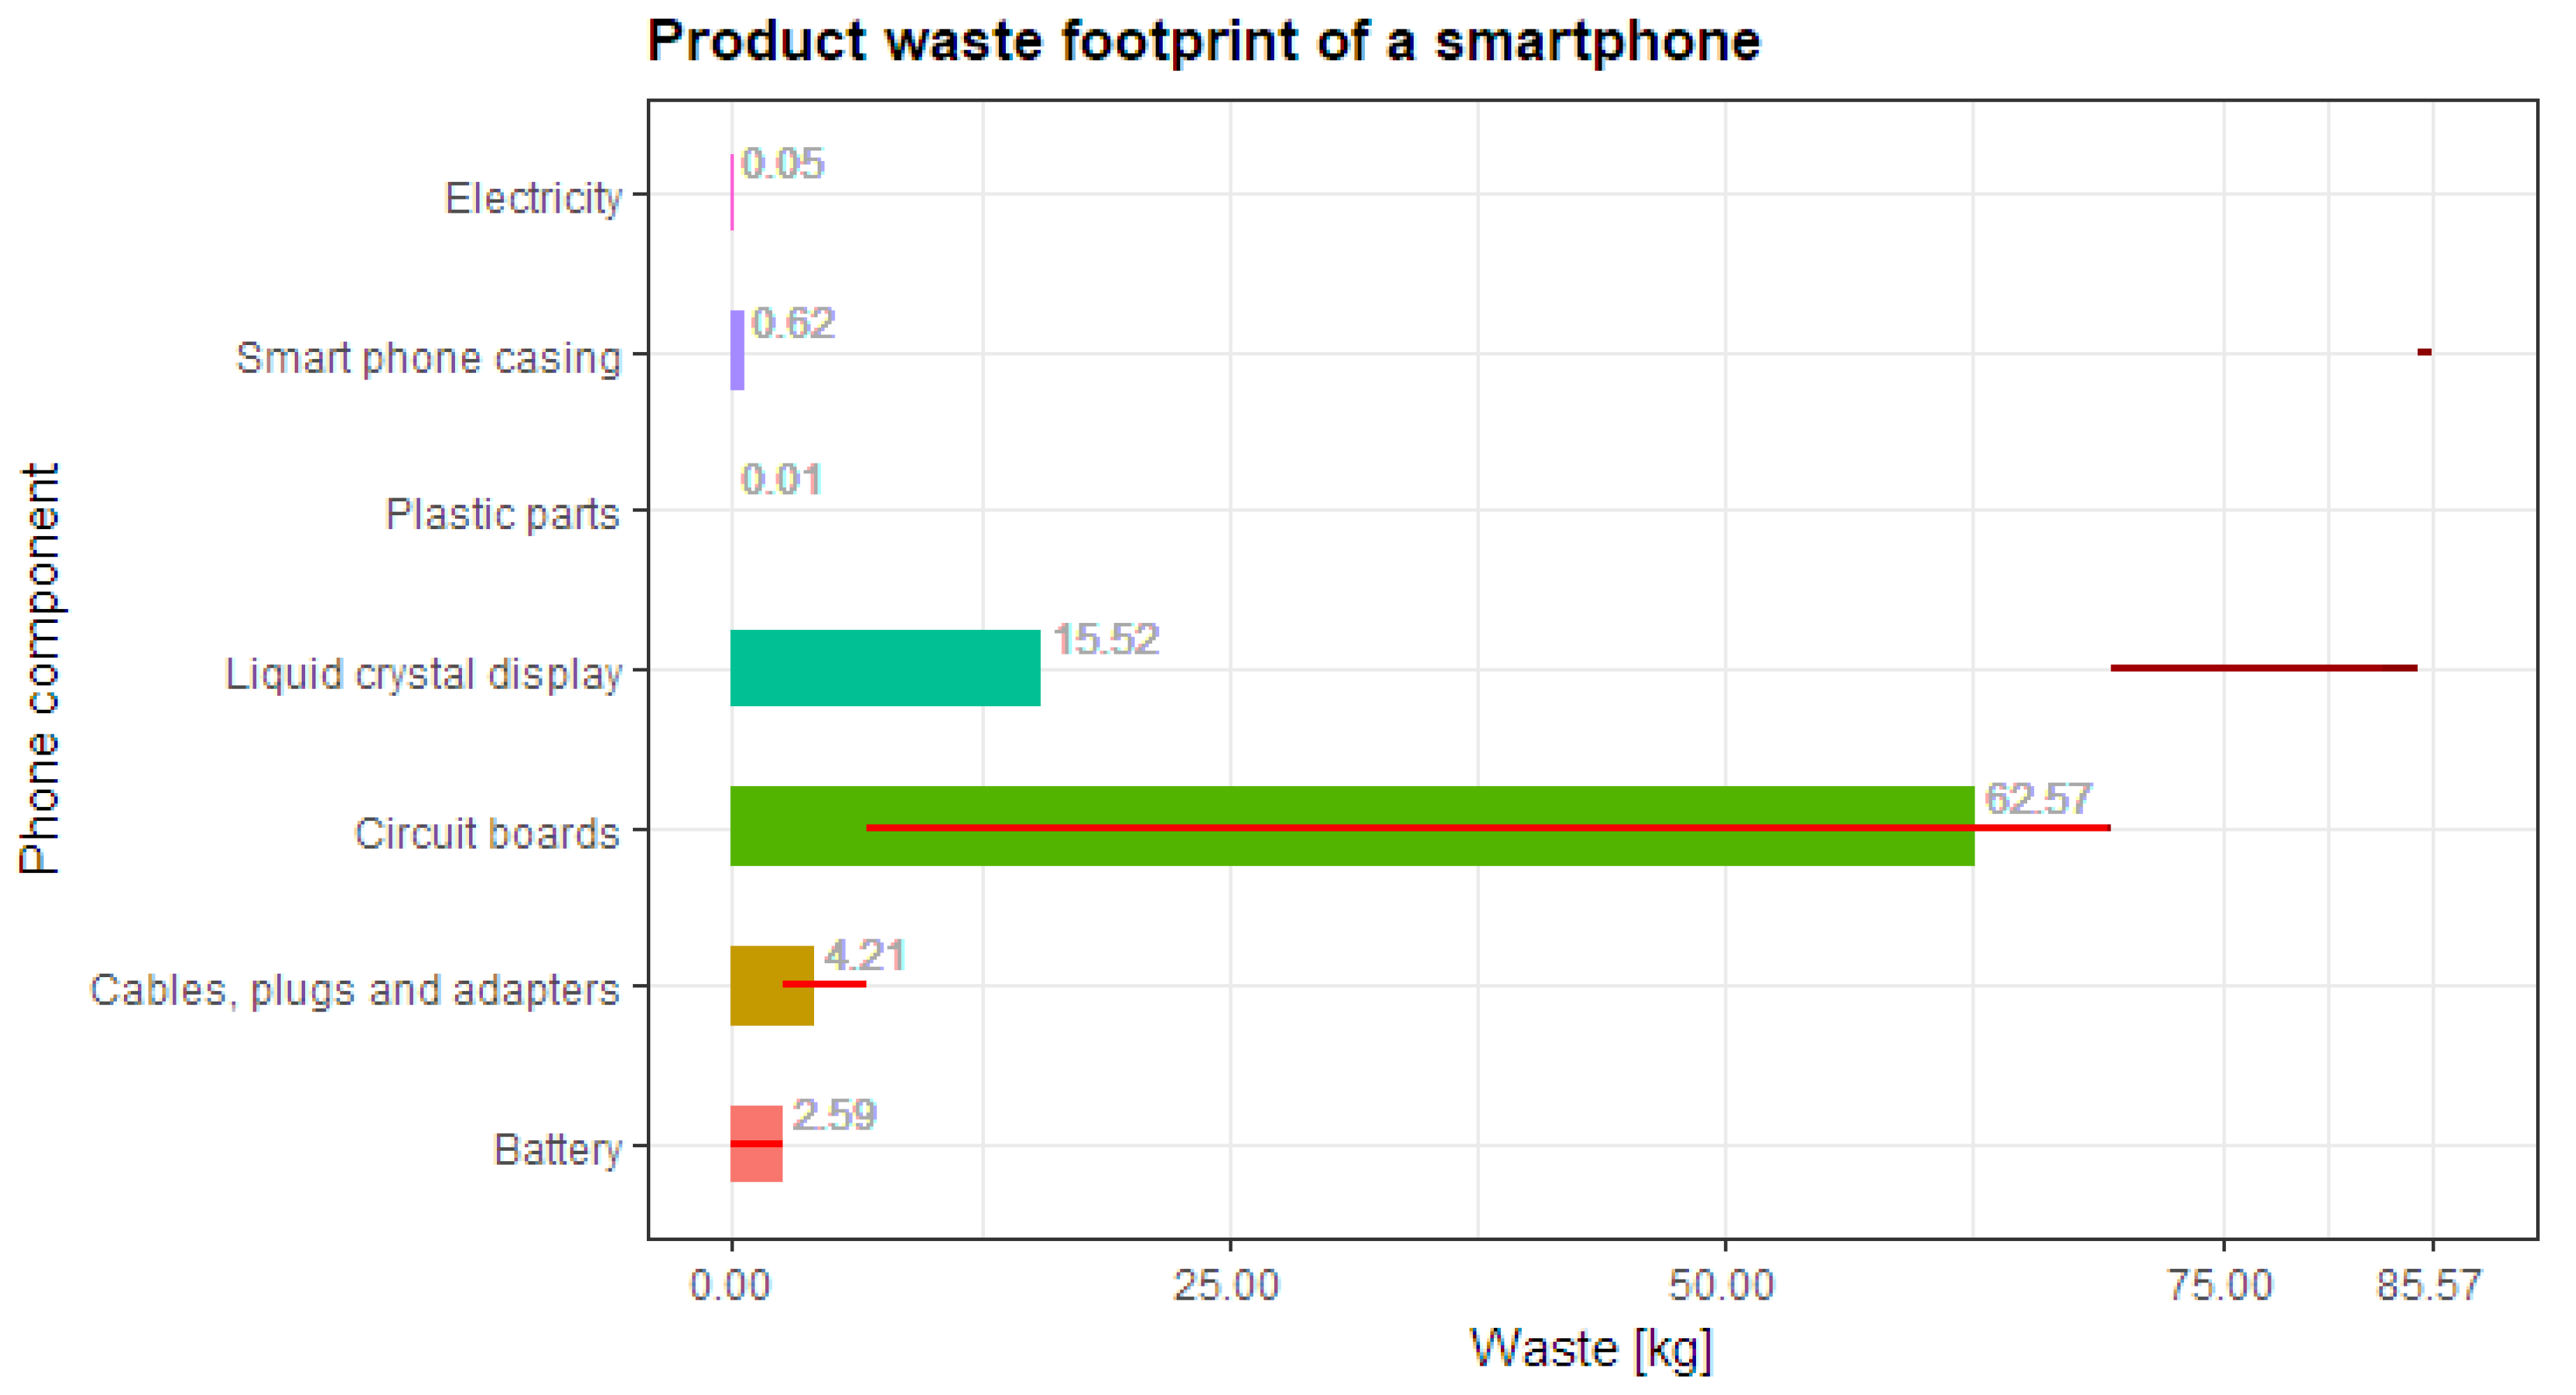
Figure 1 shows the result of the PWF calculation for a generic smartphone (see detailed quantities in the Supplementary Material S2). The full details of the PWF approach and application in 10 consumer goods can be seen in Laurenti et al [14].
2.2. Further Developing the Previous Approach
A prominent metric method commonly used by companies and researchers to investigate environmental consequences of products, services, and technologies is the life cycle assessment (LCA) method [16]. In LCA practice, data about waste/residue outputs, presented in the material balance calculation between elementary inputs from nature and elementary outputs to nature, are aggregated to different environmental impacts (e.g., global warming, acidification, eutrophication, cumulative) or left out of the assessment step if there are no relevant characterisation factors. Consequently, although LCA accounts for waste outputs, they are often not reported or analysed separately within the assessment or interpretation stages [17]. Therefore, the LCA method is not directly suitable to measure waste flows and results from applications are rather complex to interpret for consumers [18].
We want to call the attention of the international LCA community to the need of devoting more efforts towards ways to communicate complex LCA results to consumers, and to the need for a methodology to visualize types and quantities of waste occurring in supply chains. Evidently, several concerns related to the PWF concept can be raised from a strict LCA perspective as it is a simplified metric. In this paper, the following concerns regarding the PWF were addressed: How do we differentiate between waste and byproduct? How do we define the waste to be accounted? Where is the environmental impact part? Should the environmental significance of the different types of wastes be explicitly expressed and communicated simply? Is this metric useful/needed? For whom and for what purpose?
2.3. Methodological Details Investigated
The concerns from an LCA viewpoint were translated into five methodological details (MDs) which encompassed the effectiveness, usefulness, and adequacy of the method to address different details. These included the following:
- MD1—Effectiveness for differentiating between waste and byproduct (effectiveness was regarded as the ability to produce the intended results).
- MD2—Effectiveness for defining which waste should be accounted.
- MD3—Adequacy for communicating the environmental pressure from a waste generation perspective (adequacy was regarded as the quality of being good enough for a particular purpose).
- MD4—Usefulness of, or need for, a PWF metric for different stakeholder groups.
- ○
- Consumer
- ○
- Industry
- ○
- University/research institute
- ○
- Government
- MD5—Usefulness of, or need for, a PWF metric for different contexts.
- ○
- Improving environmental awareness of consumers
- ○
- Environmental policy making
- ○
- Business-to-business
- ○
- Visualizing waste flows in a circular economy
- ○
- Improving resource efficiency in industry
The stakeholder groups of MD4 and the contexts of MD5 were predefined based on the results of the initial report [15].
Based on the input from the MDs identified above and a literature review of relevant and associated standards, footprinting methods, waste directives, and waste classification, the PWF methodology was revised. The literature and documents consulted to revise the methodology included:
2.4. Screening Opinions of Stakeholders to Further Develop the Method
In order to develop the PWF method further, a small-scale study online survey was developed. The survey questionnaire addressed the five methodological details (MDs) outlined previously. It was comprised of five sections:
- General questions—name, contact details, organisation type, field of activity;
- Subjectivity of waste (MD1–2);
- Indicators for communicating results (MD3);
- Usefulness of a product waste footprint (MD4–5);
- Further participation–interest in revising the draft text of the PWF approach.
The questions presented a ‘multiple choice’ approach, requesting opinions on a graduated 5-point scale representing the level of expected effectiveness or adequacy of the respective part of the framework and usefulness/need of a product waste footprint metric for several stakeholder groups and contexts. Respondents were requested to express their opinion on the graduated scale, and were also given the opportunity to include open comments for clarification. ‘I don’t know’ options were possible to be chosen as well. The estimated time to complete the survey was 15–20 minutes. Additionally, respondents had the option to indicate interest in revising the full preliminary version of the framework document. The full questionnaire can be found in the Supplementary Material S3.
We launched the online public consultation from April 2017 until the middle of May 2017. Using an online questionnaire, the consultation offered an opportunity to all interested parties to express their views and give their opinion on the proposed methodology. The target audience was the general public (consumers), academic community, industry, and consultants. Suggestions for improvement gathered in the open consultation served as inputs for consolidating the development of the PWF methodology.
Invitations to answer the questionnaire were also sent to an LCA email list (this is a subscription-based email list, managed by PRé-consultants, with over 2500 users worldwide, for discussing issues related to LCA and related sustainability issues; on a regular basis, LCA experts and practitioners make important contributions regarding methodology, the sharing of data, and important events in the LCA community) to reach the academic community which works with tools and modeling of LCA impacts, shared in relevant LinkedIn groups and shared in Facebook thematic groups (e.g., International Society for Industrial Ecology).
The responses were analysed (1) qualitatively by reading written comments and drawing inferences to the developing PWF approach; and (2) statistically by categorising respondents and responses, calculating percentages of responses, and drawing inferences to the developing PWF approach.
3. Results
In total, 312 individuals accessed the questionnaire through invitation link. From these 312 individuals, and assuming that a person accessed or responded to the online questionnaire only once, 257 individuals accessed the questionnaire but did not start responding; 28 completed the questionnaire fully (which denotes a low response rate). Seven respondents identified as general public (consumers), 2 from consultant company, 5 from industry, 4 from research institute, and 10 from university.
As previously stated, the last section of the online questionnaire inquired about interest of further participation. Ten respondents showed interest in revising the full draft version of the PWF. After contacting them by email, four of the respondents (one from research institute and three from university) were interviewed through video-conferencing and three respondents (one consultant and one researcher) provided written additional comments on the draft PWF methodology.
3.1. Effectiveness and Adequacy of the Methodology
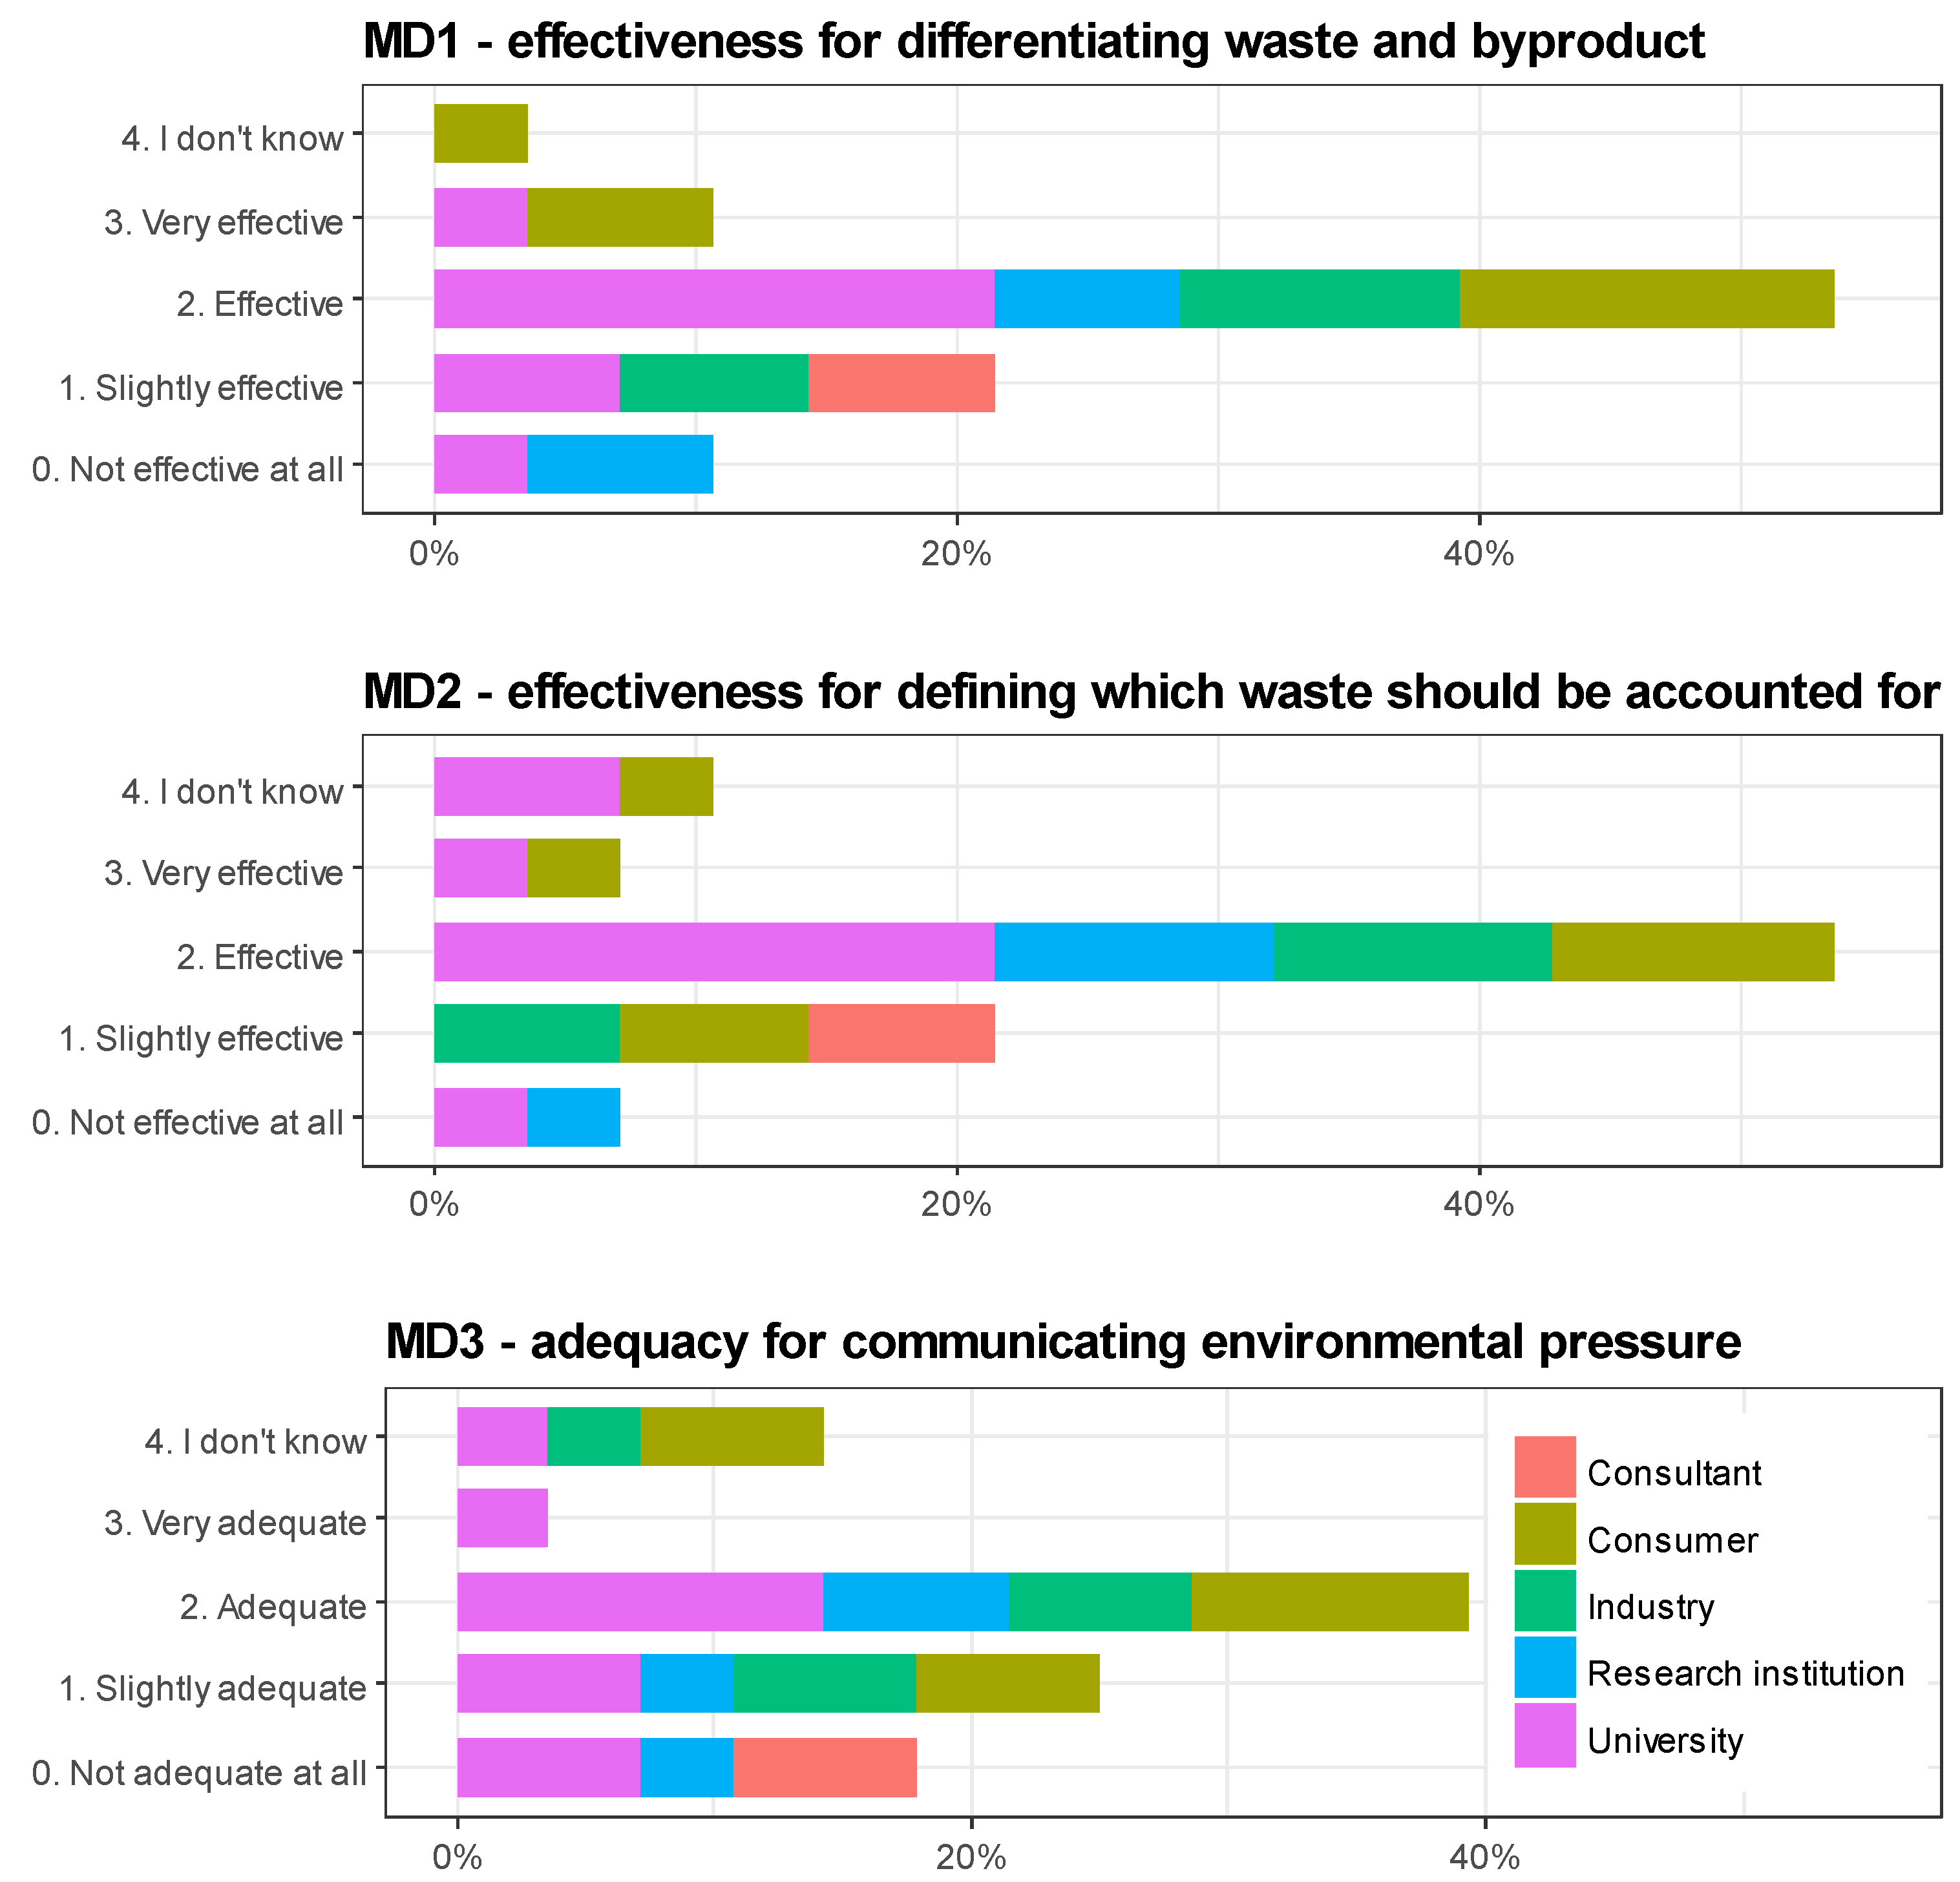
The explanation and guidance given in the draft methodology for MD1 differentiating waste and byproduct(s) and MD2 defining which waste should be accounted for in product waste footprint studies were evaluated for respondents as satisfactorily effective; see Figure 2. There was also a clear indication that what was proposed for MD3 (i.e., communication of the environmental pressure from a waste generation perspective) was insufficiently adequate. Thus, for MD1 and MD2, the final text of the proposed methodology was kept as the draft text, and for MD3, marginally changed. Figure 2 shows the detailed percentages of the evaluation of these three specific points of the draft methodology by the stakeholder groups consultant, consumer, industry, research institution, and university.
3.2. Usefulness and Purpose of the Metric
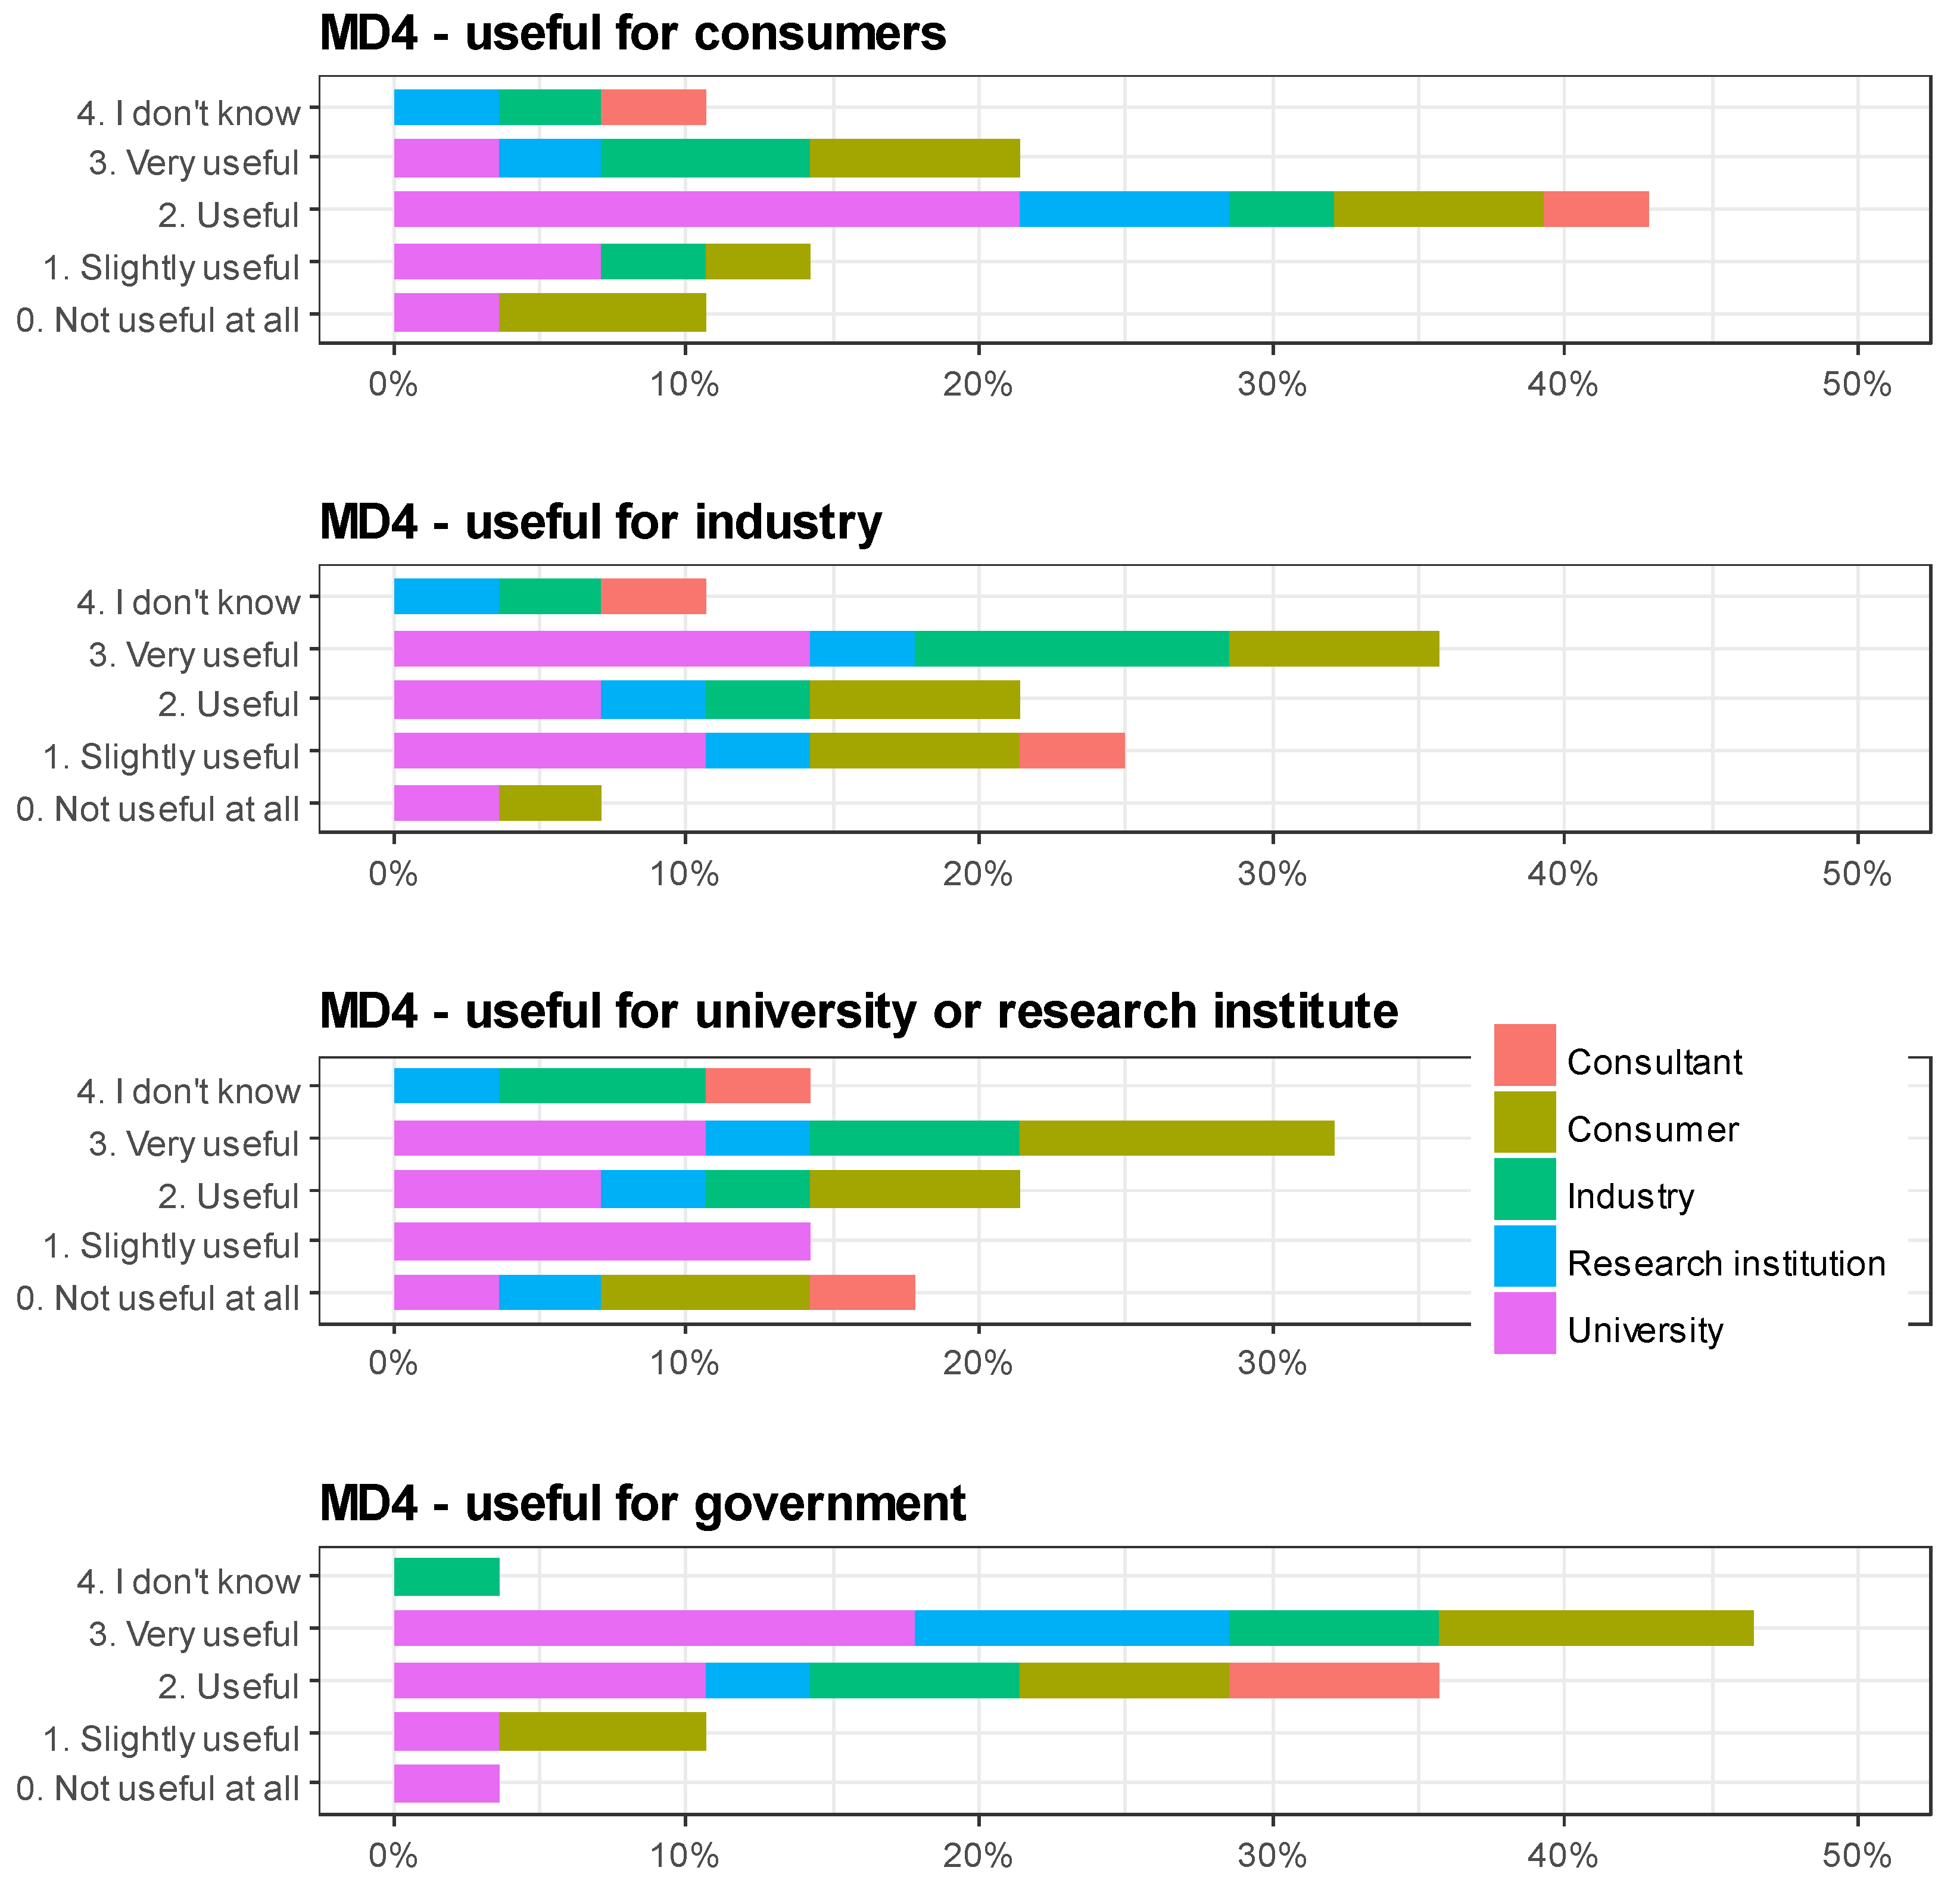
Regarding the usefulness or need of the PWF for stakeholder groups (MD4), responses pointed out that such product waste footprint metrics would be predominantly useful/needed for (1) consumers and (4) government, and less useful/needed for (2) industry and (3) university/research institution; see Figure 3, illustrating divergent view of the usefulness.
Roughly 64% of the respondents recorded that the metric would be very useful or useful, with responses that it is very useful (21%) or useful (43%) for consumers, primarily expressed by university, research, and industry stakeholders. A total of 25% of respondents found it slightly useful (14%) or not useful (11%).
The majority of respondents, roughly 82%, responded that the metric would be very useful/needed (46%) or useful (36%) for governments (encompassing nearly all stakeholder group opinions), with the rest expressing it was slightly useful (11%) or not useful (2%).
Over half, 56%, of respondents found that the metric would be very useful (35%) or useful (21%) for industry, while 33% of stakeholders indicated that the metric would be slightly useful/needed (26%) or not useful/needed at all (7%) for industry.
For the usefulness for university/research institutions, over half of the respondents suggested that it would be useful, with 32% suggesting the metric would be very useful, 22% that it would be useful. Roughly 14% suggested it would be slightly useful, and 18% responded that it would not be useful.
Figure 3 shows the detailed percentages and how each respondent group reported. See also Figure 4 for a further exemplification of how the results can be useful in different contexts.
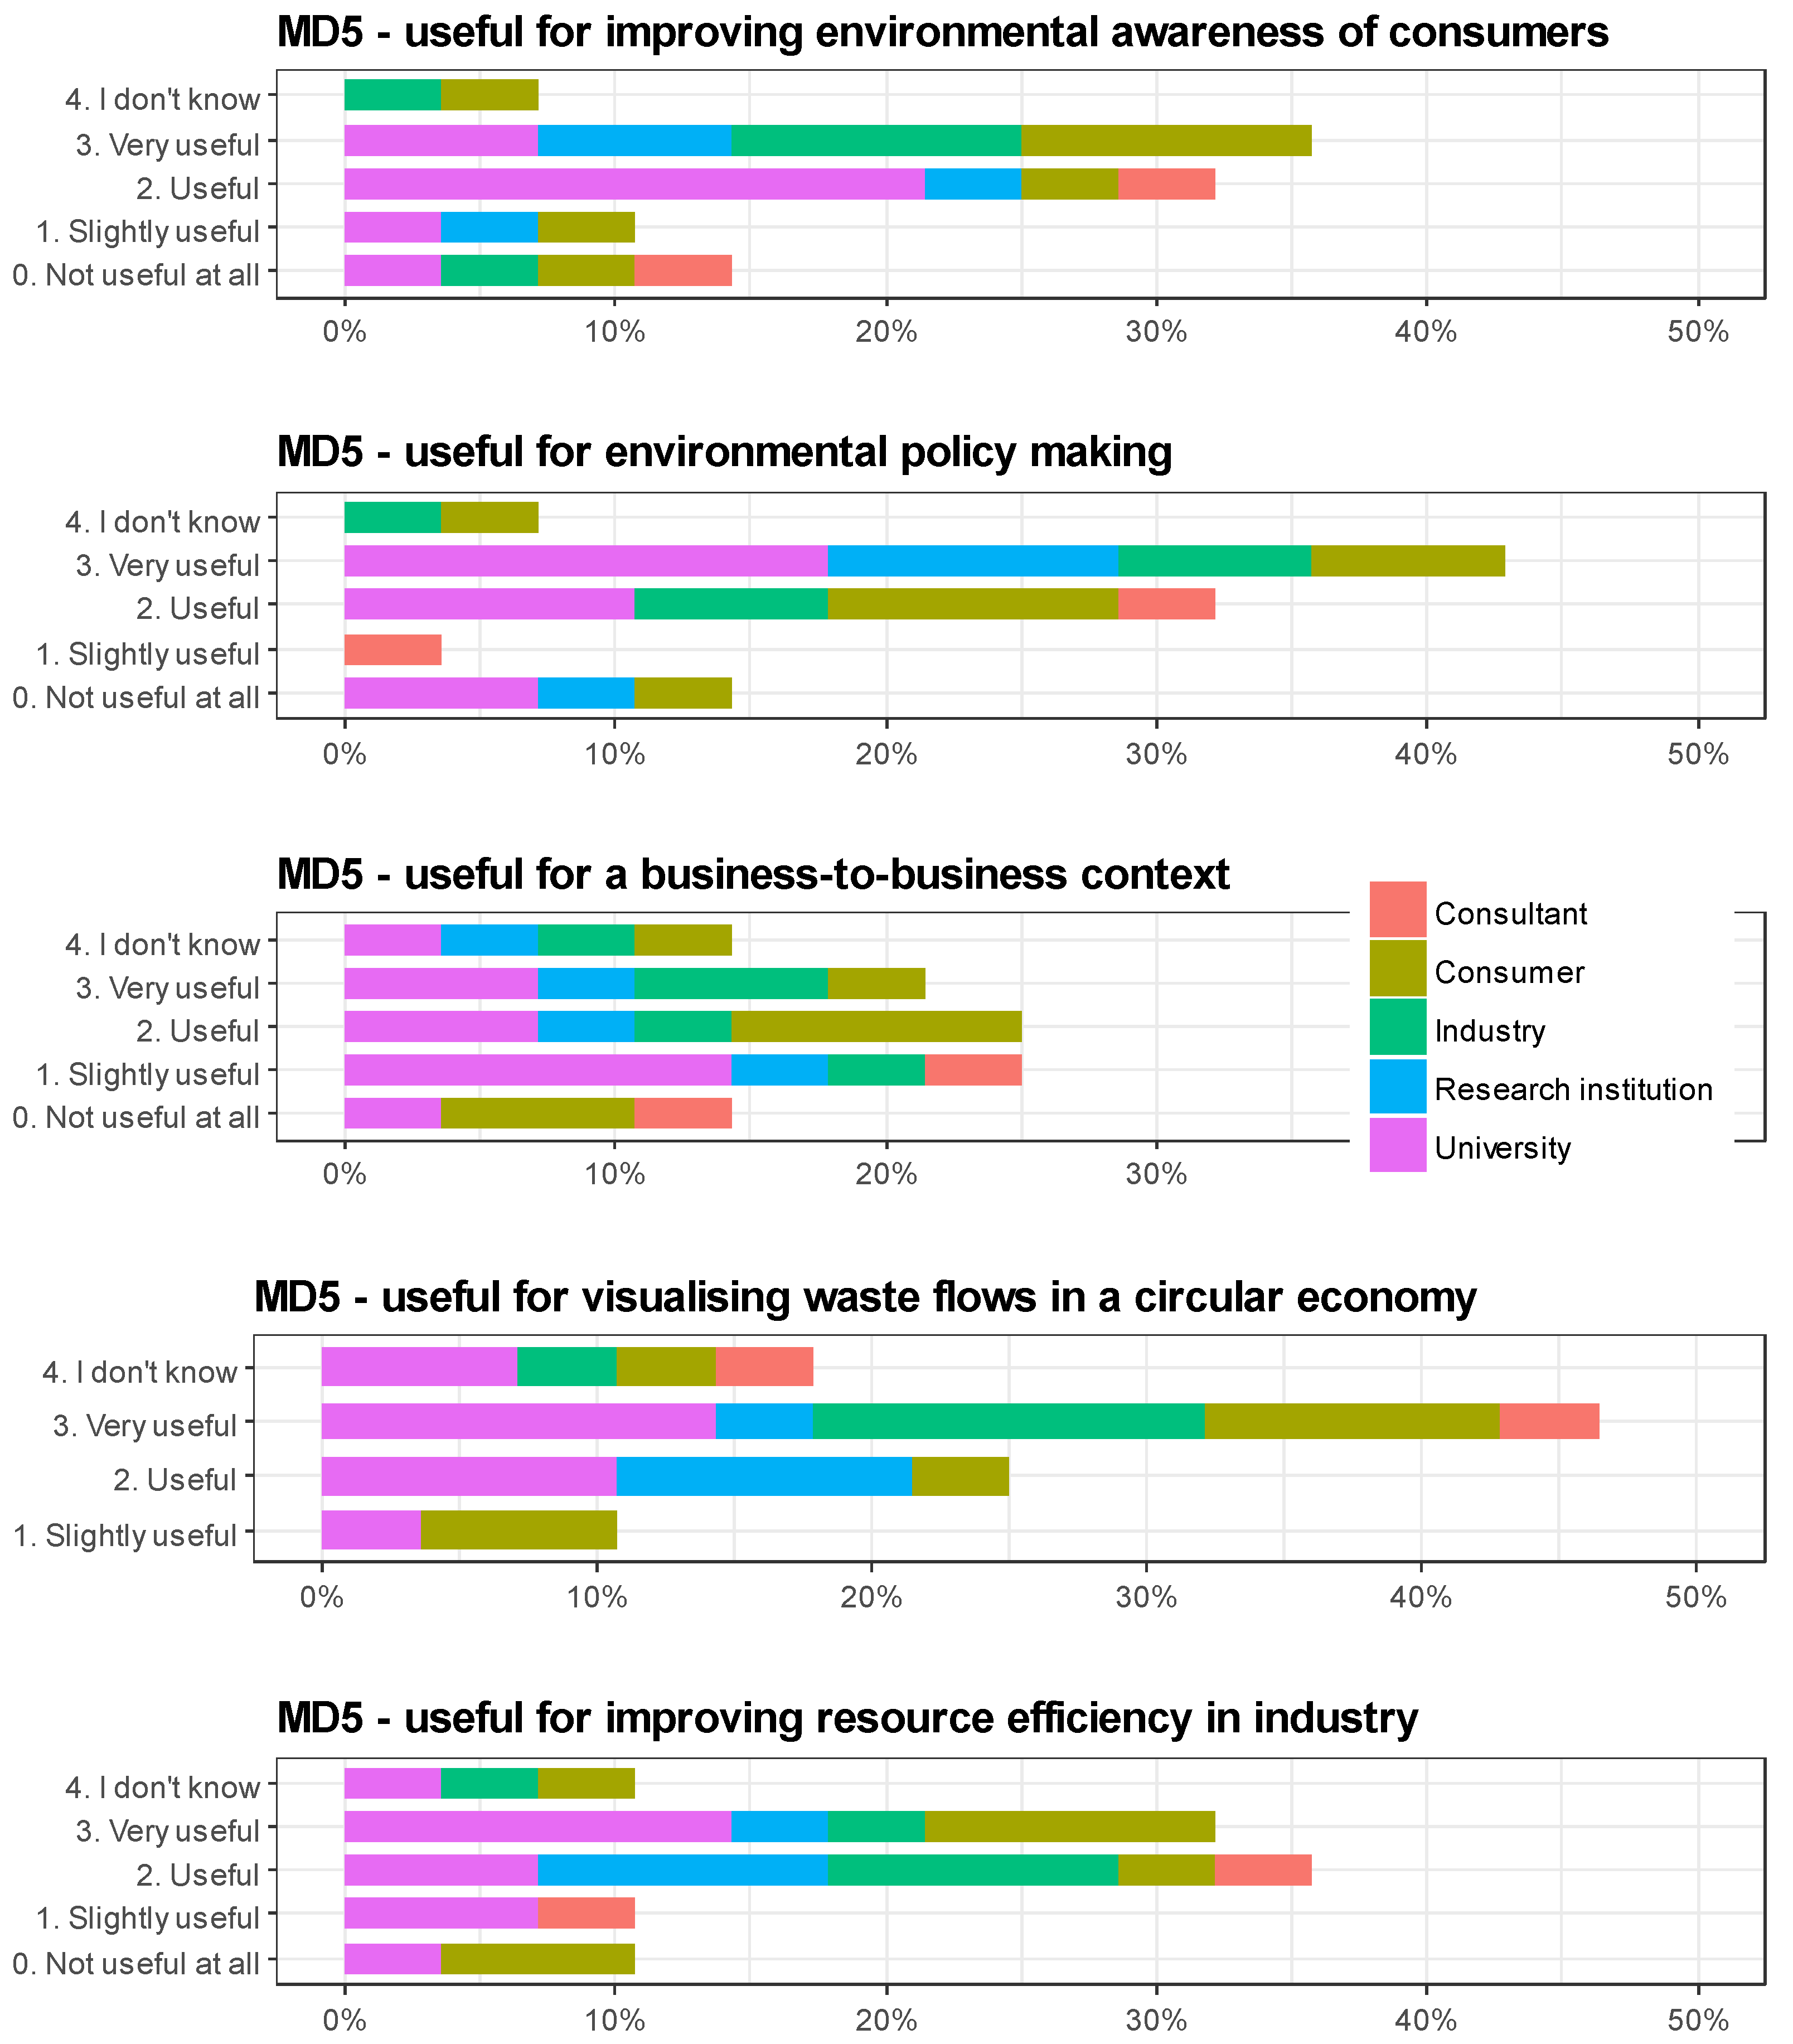
Concerning purpose of the PWF for different contexts (MD5), respondents specified that a waste footprint metric for products would be mainly useful/needed in contexts of (a) improving environmental awareness of consumers, (b) environmental policy making, (c) visualising waste flows in a circular economy, and (d) improving resource efficiency in industry; and doubtfully useful/needed in a (e) business-to-business context. Detailed percentages are shown in Figure 4.
3.3. List of Changes
The three specific points of the draft methodology (MD1 effectiveness for differentiating waste and byproduct; MD2 effectiveness for defining which waste should be accounted for in product waste footprint studies; MD3 adequacy for communicating the environmental pressure from a waste generation perspective) were amended.
Although MD1 and MD2 were highlighted as efficient in the closed questions, the draft guidelines were determined to be too complex in the open comments and revision. Therefore, these guidelines were simplified.
Regarding MD3, respondents objected to a classification of low/high risk to environment and human health. Some argued that this risk classification is not understandable, it could leave too much space for subjectivity, thus misleading results, and the classification was too simplistic and hard to define. Others argued that what matters is the environmental impact and that a proper environmental impact assessment needs to be done.
The qualitative classification according to the environmental significance of waste types was therefore removed from the methodology. The proposal of categorizing waste according to subsequent use (recycling, incineration, composting, backfilling, landfilling) was kept, however.
As the result of an iterative process, the methodological choices adopted to specify which material flows leaving the product system to be analysed shall be accounted for in the PWF calculation were based on:
- the waste framework directive of the European Commission (the European Parliament, the Council of the European Union, 2008);
- the interpretative communication on waste and byproducts of the European Commission [28]; and
- the inputs collected from LCA and waste management experts during the open consultation.
The final version of the PWF methodology and the anonymized raw results of the open consultation can be found in the Supplementary Material S4 and Supplementary Material S5, respectively.
4. Discussion
4.1. Potential Risks and Weaknesses
During the open consultation, some LCA experts roundly condemned the PWF metric. Their main concern was how the PWF information could be potentially misused by companies for image branding and deceiving consumers. Selected criticisms collected during personal communication and social media (LinkedIn groups) are shown below:
- There is a risk of it becoming a marketing tool for greenwash—companies with low-volume toxic wastes may use it to compete with companies producing large volumes of totally benign waste. A similar problem is observed on the metric of food miles, where low food miles from an overland transporter (with high relative production impact) are compared often misleadingly with large food miles by ship (with a tiny relative production impact) [29].
- From an impact assessment perspective, it is the impacts resulting from the net flows of waste after all reuse/recycling/incineration that matter. For instance, in LCAs concerned with buildings and infrastructure, wastes and their disposal are nearly always small issues relative to all the implications of energy use, even though the physical quantities may be large. This is because the wastes are benign and energy is the largest hotspot.
- In sectors where the wastes have a large impact, it is due to their toxicity, not their quantity, and it is the product of impact factor (toxicity) x quantity (mass) and the receiving environment that then is of concern.
- Waste by itself does not have any environmental impacts; emissions and other environmental exchanges do. So, it is not how much waste is generated, but what happens with it. A small quantity of toxic wastes is far more environmentally damaging than a large mass of inert waste. Hence a "waste footprint" seems to be a step backwards rather than forward in the environmental assessment of products. A lot of waste mass can be avoided staying away from products that have a lot of mining in their value chain to avoid high quantities of tailings, but is that really what consumers should worry about?
4.2. Opportunities
4.2.1. Increasing Environmental Awareness of Consumers
Other LCA experts expressed, less harshly, words of caution and also recognised the need for translating complex environmental information into something simple enough that consumers can understand, relate to, and be sensible to. The challenge of any endeavour in this direction seems to lie in how to provide such simplified metrics that deliver meaningful outcomes (not misleading) for consumers. We found a divergence in the relevance of environmental information between the academic community and consumers. The depiction of such information, and its use by consumers, is important to steer towards more sustainable consumption, while providing relevant and graspable information to influence decisions [30,31,32].
4.2.2. Visualizing Waste Flows in a Circular Economy
A significant number of LCA experts recognised that the exercise of identifying waste flows in extended supply chains is particularly important in the context of a circular economy where waste types and quantities need to be visualised and progress measured. Accordingly, in the context of the circular economy, identifying point sources and quantities of waste and categorising them according to their subsequent use may be as important as assessing their potential environmental impact.
4.2.3. Expanding the Scope
In life cycle terms, limiting the scope of the PWF concept at the production stage (postproduction waste) and not including disposal (consumption) may skew the results. For instance, a highly efficient production process can create a product that is 100% nonrecyclable which can claim a low- to zero-waste footprint, but in reality is not circular, which may be implied from a zero-waste footprint.
Therefore, as with carbon emissions, it is important to address whether there is a need or potential to create Scope I (production), II (production & use), III (production, use, and disposal) type footprints to minimise confusion and misleading end users.
4.2.4. Addressing the Concerns of LCA Experts
Further studies could examine if the PWF is a good proxy of life cycle environmental impact categories (e.g., human health, extinction of species) in specific categories of product or manufacturing process. The relationship between PWF results and environmental impacts can be systematically quantified by using LCA databases (e.g., Ecoinvent) for quantifying PWFs and environmental impacts associated with a large amount of types of products and manufacturing processes. This knowledge of the relationships between both sets of indicators and categories would clarify the extent to which the PWF may serve as a proxy for damage to humans and the environment, addressing the concerns of the LCA experts.
4.2.5. How Has the Indicator Been Used So Far?
From a strict LC perspective, the concerns of LCA experts are understandable. However, looking at the PWF with such a strict lens, one may miss the point and disregard many opportunities that the metric could bring about. For example, it is often overlooked by LCA experts what type of product/environmental-related information and at which level of aggregation can contribute to orienting consumers’ behavior towards more environmentally friendly consumption practices. The PWF concept may be enough to make most of the ordinary consumers at least aware of the link between consumption and waste generation. This was our initial hypothesis when we first designed the PWF concept in 2015. Our hypothesis has been proven to hold true in Sweden. Furthermore, as the waste may occur in regions other than Europe, typical European characterization factors for the different impact categories may not fully review the regional implications the waste produced to develop products and may need to be expanded in such studies (e.g., see a discussion in [33]).
A search in Google with the keywords ‘avfallsfotavtryck’ (waste footprint in Swedish) and ‘IVL’ (Swedish Environmental Research Institute)—both keywords refer to the popular science report in Swedish [15]—performed on 11 May 2018, returned 574 results. Screening the results, we found that our estimations about how much waste is produced to produce the products we consume have been used by consumers to discourage consumption on Black Friday [34], by Swedish municipalities in environmental campaigns to encourage reuse and longer life time of products and to increase environmental awareness about source separation and recycling [35,36,37,38,39], by entrepreneurs to promote ecological products [40], by sustainability professionals [41] and private waste management companies to promote environmental awareness [42,43], as well as to discourage consumption during Christmas [44], and by the Swedish Waste Management Association (Avfall Sverige) to increase consumer and producer environmental awareness and promote a more sustainable consumption, in a campaign called #invisiblewaste [45].
The target group of the ‘invisible waste’ campaign is primarily Swedish decision makers and opinion makers. According to Avfall Sverige, the goal of the campaign is to start a discussion with decision makers about the large amount of waste that occurs in the production of products but which is invisible to the consumer. Avfall Sverige also wants to influence those who design and manufacture products to reduce the amount of waste and increase the possibilities of reuse, repair, and eventually recycling. Designers and manufacturers obviously have a major responsibility, but responsibility lies with Sweden's decision makers, which, by introducing policy instruments, can favor more circular production and encourage reuse. Avfall Sverige has sent out a small box that resembles a classical package of a smartphone directly to a number of selected politicians, government officials, and opinion polls, with the following note inside:
“We are talking about something that is invisible. About the waste that the consumer rarely sees, but that occurs throughout the production process of products. Imagine that this box had contained a mobile phone. It weighs about 200 grams. But the waste footprint is significantly larger. It generates a total of 86 kilos of waste when a single mobile phone is produced. Just as an example. We want to visualise the invisible waste and we need your help! Contact us so we say how! Read more on prataosynligtavfall.se”
These innovative ways in which the PWF concept has been applied indicate a massive interest of stakeholders across society in the PWF concept.
5. Conclusions
A methodological framework for the quantification and communication of the waste footprint of a product was proposed in previous research. The methodological approach was comprised of a stepwise approach and a set of guidelines. This article reported on the results of an initial open online consultation concerning specific points of the methodological approach and the usefulness and purpose.
Most of the respondents of the online survey expressed that the guidelines described in the methodology are effective for MD1 differentiating waste and byproduct (tacking the subjectivity of waste) and MD2 defining which material flow shall be accounted for as waste in PWF quantifications. Part of the respondents found these draft guidelines, which were based the Interpretative Communication on waste and byproducts of the European Commission, to be too complex for the exercise of accounting for wastes, and, hence, not sufficiently adequate for the PWF methodology. Furthermore, some responses from prominent LCA experts and practitioners affirmed that qualitatively attributing environment significance to different types of wastes may not be adequate.
The LCA experts were (understandably) reluctant to accept simplistic attempts to communicate complex environmental information. The reasons for their (reasonable) hesitancy may lie in the rationale that (1) simpler metrics inherently carry limitations of some sort; (2) there has been a proliferation of simple environmental metrics that lack scientific stringency; (3) these limitations may leave space for misuse by industry, greenwashing for consumers, lead to claims of superior products, and mislead advice for sustainable conduct/consumption.
Nevertheless, there was a clear indication from the stakeholder consultation that a PWF metric would be useful or needed for consumers and government, and in contexts of improving environmental awareness of consumers, environmental policy making, visualising waste flows in a circular economy, and improving resource efficiency in industry, and less useful or needed in a business-to-business context. The results of the screening survey and the way in which the PWF concept has been used in Sweden corroborate to and give evidence of a growing demand and interest of stakeholders across society for simpler indicators, rather than complex LCA results for disclosing product-related environmental information. The PWF has been successfully used by diverse stakeholder groups in Sweden mostly to promote sustainable production and consumption across society. A notable example is the ‘invisible waste’ (#invisiblewaste) campaign of the Swedish Waste Management Association (Avfall Sverige). The concerns of the LCA experts have therefore not held true.
Evidently, more attention needs to be given to (1) what the needs of consumers from different income levels are and (2) how consumers may or may not use product-related environmental information.
Whether the LCA community, especially those involved in method development, should devote efforts to address the consumer demand for simple indicators of product-related environmental information and how the LCA community could constructively contribute to initiatives that advance the frontier of this field forward are unresolved questions needing attention.
Consumers have limited means to be sensible about how, why, and to what extent their consumption contributes to environmental degradation, due mainly to the temporal and spatial separation of extraction of materials, production, and consumption. Accordingly, setting an adequate level of trade-off between complexity and simplicity, when conveying information about environmental impacts occurring distant in time and geographical location from the point of consumption, is a highlighted area needing further consideration. The PWF metric and the open consultation carried out in this project were attempts to find this fundamental balance in the context of the upcoming circular economy.
Supplementary Materials
The following are available online at https://0-www-mdpi-com.brum.beds.ac.uk/2079-9276/7/4/78/s1: Supplementary Material S1: List of online news that published the results of the calculations of the PWF study (Laurenti and Stenmarck, 2015); Supplementary Material S2: waste types and quantities of the PWF of a generic smartphone; Supplementary Material S3: Questionnaire used in the open consultation; Supplementary Material S4: Final version of the PWF methodology; Supplementary Material S5: Raw results of the open consultation—anonymized.
Author Contributions
Conceptualization, R.L.; Methodology, R.L., M.M., and Å.S.; Formal Analysis, R.L., M.M., and Å.S.; Investigation, R.L. and M.M.; Resources, Å.S.; Data Curation, R.L.; Writing—Original Draft Preparation, R.L.; Writing—Review & Editing, M.M. and Å.S.; Visualization, R.L.; Project Administration, R.L.; Funding Acquisition, R.L. and Å.S.
Funding
The conceptualization of the PWF was jointly funded by Avfall Sverige (Swedish Waste Management and Recycling Association) and the IVL Foundation. The open consultation project was financed by ÅForsk Foundation grant number 16-426.
Acknowledgments
We are thankful to respondents of the online open consultation. We are also grateful to Ann Van der Linden and Katrien Boonen from Vito, Ioannis Bakas from Copenhagen Resource Institute, Mervyn Jones from Sustainable Global Resources, and Jutta Nuortila-Jokinen, Mika Horttanainen, and Risto Soukka from Lappeenranta University of Technology for providing feedback on the text of the draft PWF methodology.
Conflicts of Interest
The authors declare no conflict of interest.
References
- Wackernagel, M.; Rees, W. Our Ecological Footprint-Reducing Human Impact on the Earth; New Society Publishers: Gabriola Island, BC, Canada, 1998; ISBN 086571312X. [Google Scholar]
- Wiedmann, T.; Minx, J. A definition of ‘carbon footprint’. In Ecological Economics Research Trends; Pertsova, C.C., Ed.; Nova Science Publishers: New York, NY, USA, 2007. [Google Scholar]
- Hoekstra, A.Y.; Mekonnen, M.M. The water footprint of humanity. Proc. Natl. Acad. Sci. USA 2012, 109, 3232–3237. [Google Scholar] [CrossRef] [PubMed] [Green Version]
- Ferng, J.J. Toward a scenario analysis framework for energy footprints. Ecol. Econ. 2002, 40, 53–69. [Google Scholar] [CrossRef]
- Leach, A.M.; Galloway, J.N.; Bleeker, A.; Erisman, J.W.; Kohn, R.; Kitzes, J. A nitrogen footprint model to help consumers understand their role in nitrogen losses to the environment. Environ. Dev. 2012, 1, 40–66. [Google Scholar] [CrossRef]
- Serenella, S.; Malgorzata, G. Chemical footprint: A methodological framework for bridging life cycle assessment and planetary boundaries for chemical pollution. Integr. Environ. Assess. Manag. 2013, 9, 623–632. [Google Scholar] [CrossRef]
- Stefan, B.; Helmut, S.; Stephan, M. Rationale for and Interpretation of Economy-Wide Materials Flow Analysis and Derived Indicators. J. Ind. Ecol. 2008, 7, 43–64. [Google Scholar] [CrossRef]
- Wiedmann, T.O.; Schandl, H.; Lenzen, M.; Moran, D.; Suh, S.; West, J.; Kanemoto, K. The material footprint of nations. Proc. Natl. Acad. Sci. USA 2015, 112, 6271–6276. [Google Scholar] [CrossRef] [PubMed]
- Bocken, N.M.P.; Ritala, P.; Huotari, P. The Circular Economy: Exploring the Introduction of the Concept Among S&P 500 Firms. J. Ind. Ecol. 2017, 21, 487–490. [Google Scholar] [CrossRef]
- Lazarevic, D.; Valve, H. Narrating expectations for the circular economy: Towards a common and contested European transition. Energy Res. Soc. Sci. 2017, 31, 60–69. [Google Scholar] [CrossRef]
- Alexandre, T.; Stefan, P.; Stefano, M.; Jannick, S.; Jacob, F.; Richard, W.; Arnold, T. Solid Waste and the Circular Economy: A Global Analysis of Waste Treatment and Waste Footprints. J. Ind. Ecol. 2017, 21, 628–640. [Google Scholar] [CrossRef]
- Ritzén, S.; Sandström, G.Ö. Barriers to the Circular Economy—Integration of Perspectives and Domains. Procedia CIRP 2017, 64, 7–12. [Google Scholar] [CrossRef]
- Laurenti, R.; Sinha, R.; Singh, J.; Frostell, B. Some pervasive challenges to sustainability by design of electronic products—A conceptual discussion. J. Clean. Prod. 2015, 108, 281–288. [Google Scholar] [CrossRef]
- Laurenti, R.; Moberg, Å.; Stenmarck, Å. Calculating the pre-consumer waste footprint: A screening study of 10 selected products. Waste Manag. Res. 2017, 35, 65–78. [Google Scholar] [CrossRef] [PubMed]
- Laurenti, R.; Stenmarck, Å. Produkters Totala Avfall—En Studie om Avfallsfotavtryck Och Klimatkostnad; IVL Swedish Environmental Research Institute: Stockholm, Sweden, 2015. (In Swedish) [Google Scholar]
- Lavers, A.; Kalmykova, Y.; Rosado, L.; Oliveira, F.; Laurenti, R. Selecting representative products for quantifying environmental impacts of consumption in urban areas. J. Clean. Prod. 2017, 162, 34–44. [Google Scholar] [CrossRef]
- Suh, S.; Huppes, G. Methods for life cycle inventory of a product. J. Clean. Prod. 2005, 13, 687–697. [Google Scholar] [CrossRef]
- Steinmann, Z.J.N.; Schipper, A.M.; Hauck, M.; Giljum, S.; Wernet, G.; Huijbregts, M.A.J. Resource Footprints are Good Proxies of Environmental Damage. Environ. Sci. Technol. 2017, 51, 6360–6366. [Google Scholar] [CrossRef] [PubMed]
- ISO. ISO 14040:2006. Environmental Management—Life Cycle Assessment—Requirements and Guidelines; ISO: Geneva, Switzerland, 2006. [Google Scholar]
- ISO. ISO 14040:2006. Environmental Management—Life Cycle Assessment—Principles and Framework; ISO: Geneva, Switzerland, 2006. [Google Scholar]
- ISO. ISO/TS 14067:2013 Greenhouse Gases–Carbon Footprint of Products—Requirements and Guidelines for Quantification and Communication; ISO: Geneva, Switzerland, 2013. [Google Scholar]
- Hoekstra, A.Y.; Chapagain, A.K.; Aldaya, M.M.; Mekonnen, M.M. The Water Footprint assessment Manual: Setting the Global Standard; Water Footprint Network: London, UK, 2011. [Google Scholar]
- European Parliament. DIRECTIVE 2008/98/EC OF THE EUROPEAN PARLIAMENT AND OF THE COUNCIL of 19 November 2008 on waste and repealing certain Directives (Text with EEA relevance). Off. J. Eur. Union. 2014. Available online: https://eur-lex.europa.eu/legal-content/EN/TXT/HTML/?uri=CELEX:32008L0098&from=EN (accessed on 5 June 2018).
- European Parliament. DIRECTIVE 2006/21/EC OF THE EUROPEAN PARLIAMENT AND OF THE COUNCIL of 15 March 2006 on the management of waste from extractive industries and amending Directive 2004/35/EC. Available online: https://eur-lex.europa.eu/legal-content/EN/TXT/HTML/?uri=CELEX:32006L0021&from=EN (accessed on 5 June 2018).
- European Commission List of Wastes. COMMISSION DECISION of 18 December 2014 amending Decision 2000/532/EC on the list of waste pursuant to Directive 2008/98/EC of the European Parliament and of the Council. Off. J. Eur. Union. 2014. Available online: https://eur-lex.europa.eu/legal-content/EN/TXT/HTML/?uri=CELEX:32014D0955&from=EN (accessed on 5 June 2018).
- European Commission. EWC-STAT 4 European Waste Classification for Statistics, version 4. Commission Regulation (EU) No 849/2010 of 27 September 2010 amending Regulation (EC) No 2150/2002 of the European Parliament and of the Council on waste statistics. Off. J. Eur. Union. 2010. Available online: https://ec.europa.eu/eurostat/documents/342366/351806/Guidance-on-EWCStat-categories-2010.pdf/0e7cd3fc-c05c-47a7-818f-1c2421e55604 (accessed on 5 June 2018).
- EPD. General Programme Instructions for the International EPD® System, 2.5 ed.; EPD: New York, NY, USA, 2015. Available online: https://www.environdec.com/contentassets/95ee9211a9614f1faa7461ff32cecc91/general-programme-instructions-version-2.5.pdf (accessed on 23 November 2018).
- European Commission. Communication from the Commission to the Council and the European Parliament on the Interpretative Communication on waste and by-products; Brussels, 2007. Available online: https://eur-lex.europa.eu/legal-content/EN/TXT/HTML/?uri=CELEX:52007DC0059&from=EN (accessed on 5 June 2018).
- Coley, D.; Howard, M.; Winter, M. Local food, food miles and carbon emissions: A comparison of farm shop and mass distribution approaches. Food Policy 2009, 34, 150–155. [Google Scholar] [CrossRef]
- West, S.E.; Owen, A.; Axelsson, K.; West, D.C. Evaluating the use of a carbon footprint calculator: Communicating impacts of consumption at household level and exploring mitigation options. J. Ind. Ecol. 2015, 20, 396–409. [Google Scholar] [CrossRef]
- Moser, S.C. Communicating climate change: History, challenges, process and future directions. Wiley Interdiscip. Rev. Clim. Chang. 2009, 1, 31–53. [Google Scholar] [CrossRef]
- Frostell, B.M.; Sinha, R.; Assefa, G.; Olsson, L.E. Modeling both direct and indirect environmental load of purchase decisions: A web-based tool addressing household metabolism. Environ. Model. Softw. 2015, 71, 138–147. [Google Scholar] [CrossRef]
- Lazarevic, D.; Martin, M. Life cycle assessments, carbon footprints and carbon visions: Analysing environmental systems analyses of transportation biofuels in Sweden. J. Clean. Prod. 2016, 137, 249–257. [Google Scholar] [CrossRef]
- Tekniskaverken. Black Friday. Available online: https://www.instagram.com/p/Bb32fqWhlZ6/ (accessed on 11 May 2018).
- Knivsta municipality. Källsortering och återvinning. Available online: http://www.knivsta.se/sv-SE/Bygga-bo-och-miljo/Avfall-och-atervinning/Kallsortering%20atervinning (accessed on 11 May 2018).
- Mullsjö municipality. Månadens miljötips–Maj. Available online: http://www.mullsjo.se/Start-Mullsjo-Kommun/Nyheter/Manadens-miljotips---Maj1/ (accessed on 23 November 2018).
- Gothenburg municipality. Förebygg avfall på kontoret: vägledning. Available online: https://goteborg.se/wps/wcm/connect/2a8df754-e5ff-4213-91c1-8721f3f2c2de/F%C3%B6rebygg+avfall+p%C3%A5+kontoret+v%C3%A4gledning_II.pdf?MOD=AJPERES (accessed on 11 May 2018).
- Ystads municipality. Information från Ystads: Kommun. Available online: https://www.arvidsjaur.se/globalassets/kommun/protokoll/kommunstyrelsen/2016/ks2016-02-09.pdf (accessed on 11 May 2018).
- Arvidsjaurs municipality. Sammanträdesprotokoll. Available online: https://www.arvidsjaur.se/globalassets/kommun/protokoll/kommunstyrelsen/2016/ks2016-02-09.pdf (accessed on 11 May 2018).
- Naturens syster. Avfallsfotavtryck är bra att känna till. Available online: http://www.naturenssyster.se/avfallsfotavtryck-ar-bra-att-kanna-till/ (accessed on 11 May 2018).
- Dennis Nyström. Ska du inte byta telefon…? Available online: http://dennisnystrom.se/?p=378 (accessed on 11 May 2018).
- SYSAV. Priset för prylarna. Available online: https://www.sysav.se/Privat/Miljotips/miljon-koper-inte-det/ (accessed on 11 May 2018).
- Cirkulera. Vad lämnar du för avtryck? Available online: http://www.e-magin.se/paper/5tsdm7k7/paper/1#/paper/5tsdm7k7/1 (accessed on 23 November 2018).
- SRV. Vad ger julklappen fr avfallsfotavtryck? Available online: https://www.srvatervinning.se/Global/Dokument/Mitt%20SRV/2015/Mitt%20SRV_nr3_2015_webb.pdf (accessed on 11 May 2018).
- Avfall Sverige. Invisible waste. Available online: https://www.avfallsverige.se/invisiblewaste/ (accessed on 11 May 2018).
Figure 1.
Estimation of the PWF of a smartphone (85 kg). The wider bars represent the amount of waste generated to produce the different components of a smartphone; the thinner bars show the respective increase in the cumulative amount.
Figure 1.
Estimation of the PWF of a smartphone (85 kg). The wider bars represent the amount of waste generated to produce the different components of a smartphone; the thinner bars show the respective increase in the cumulative amount.

Figure 2.
Stakeholders’ responses regarding: Effectiveness of the methodology for differentiating waste and byproduct; effectiveness of the methodology for defining which waste should be accounted for in product waste footprint calculations; adequacy of the indicators proposed for communicating the environmental pressure of the analysed product from a waste generation perspective. The percentages are based on the answers of 28 respondents; about 3.5% difference refers to only one response difference.

Figure 3.
Responses regarding how useful/needed a product waste footprint metric is for different stakeholder groups (consumer, industry, university/research institute, government). The percentages are based on the answers of 28 respondents; about 3.5% difference refers to only one response difference.

Figure 4.
Distribution of responses regarding how useful/needed a product waste footprint metric would be in the different contexts (improving environmental awareness of consumers, environmental policy making, business-to-business, visualising waste flows in a circular economy, improving resource efficiency in industry). The percentages are based on the answers of 28 respondents; about 3.5% difference refers to only one response difference.

© 2018 by the authors. Licensee MDPI, Basel, Switzerland. This article is an open access article distributed under the terms and conditions of the Creative Commons Attribution (CC BY) license (http://creativecommons.org/licenses/by/4.0/).
Share and Cite
MDPI and ACS Style
Laurenti, R.; Martin, M.; Stenmarck, Å. Developing Adequate Communication of Waste Footprints of Products for a Circular Economy—A Stakeholder Consultation. Resources 2018, 7, 78. https://0-doi-org.brum.beds.ac.uk/10.3390/resources7040078
AMA Style
Laurenti R, Martin M, Stenmarck Å. Developing Adequate Communication of Waste Footprints of Products for a Circular Economy—A Stakeholder Consultation. Resources. 2018; 7(4):78. https://0-doi-org.brum.beds.ac.uk/10.3390/resources7040078
Chicago/Turabian StyleLaurenti, Rafael, Michael Martin, and Åsa Stenmarck. 2018. "Developing Adequate Communication of Waste Footprints of Products for a Circular Economy—A Stakeholder Consultation" Resources 7, no. 4: 78. https://0-doi-org.brum.beds.ac.uk/10.3390/resources7040078
Note that from the first issue of 2016, this journal uses article numbers instead of page numbers. See further details here.