Clean Energy Sources: Insights from Russia
by
 , ,
, ,
Elizaveta Gavrikova
1, 
Yegor Burda
1,*,
Vladimir Gavrikov
2,
Ruslan Sharafutdinov
2,
Irina Volkova
1,
Marina Rubleva
2 and
Daria Polosukhina
2 1
Department of General and Strategic Management, National Research University Higher School of Economics, 101000 Moscow, Russia
2
Institute of Ecology and Geography, Siberian Federal University, pr. Svobodny, 79, 660041 Krasnoyarsk, Russia
*
Author to whom correspondence should be addressed.
Resources 2019, 8(2), 84; https://0-doi-org.brum.beds.ac.uk/10.3390/resources8020084
Submission received: 1 April 2019
/
Revised: 22 April 2019
/
Accepted: 23 April 2019
/
Published: 1 May 2019
(This article belongs to the Collection Management, Environment, Energy and Sustainability under a Circular Economy)
Abstract
:The paper is devoted to the assessment of the prospects of implementing clean energy sources in Russia, where the current energy policy goal is to increase the role of renewable and clean energy sources. The research is based on data from the Krasnoyarsk Region as one of the largest territories but also as a representative model of Russia. The aim of the study is to identify where and which renewable energy source (solar, wind, hydro and nuclear) has the highest potential. The novelty of our research lies in its holistic nature: authors consider both geographical and technical potential for renewable energy sources development as well as prospective demand for such resources, while previous research is mostly focused on specific aspects of renewable energy development. We also consider the level of air pollution as an important factor for the development of renewable energy sources. The results of the study show that there is a strong potential for clean energy sources in the Krasnoyarsk Region. The resulting matrix identifies the potential of energy sources across all the municipal entities and also indicates whether the source of energy is primary or supplemental and where several sources may be implemented in cooperation.
1. Introduction
Climate change, and the problem of CO2 emissions specifically, force government bodies to apply policies, aimed at diminishing the negative impact of the energy sector on the environment. This may be executed in two major forms: either through the overall decrease of demand (increasing energy efficiency), or through the shift towards more sustainable renewable energy sources (RES) [1]. The first is usually rather difficult in emerging economies due to the increasing commercial demand and extensive character of industrialization [1]. Moreover, demand grows with the increase in population and global economic growth [2,3,4,5], while the development of RES seems to be a promising stream [6].
However, the introduction of RES usually faces two major barriers: higher costs of energy compared to the conventional energy sources [7] and uncertainty of generation potential (as natural resources are stochastic in their nature) [8]. In addition, while the high costs of renewable energy are a technological issue that will be solved in the nearest future [9], assessment of their potential requires a more focused approach as it is highly dependent on specific conditions of a given region.
There is a substantial number of papers aimed at the assessment of the potential of RES on a given territory: theoretical (rough estimation of the total energy that can be potentially harvested from a given territory—without consideration of geographical and technical limitations) [10,11,12,13,14,15,16,17,18]; geographical (inclusion of the land restrictions to the calculation of RES potential) [19,20,21,22,23,24,25]; technical (assessment of the energy that can be potentially harvested from a given area within the existing technological restrictions) [11,12,13,14,19,20,26,27]; and economical (assessment of economical rationality for RES usage at a given territory in comparison to alternative electricity supply mechanisms) [11,12,19].
However, researchers usually omit the demand side of the issue—to our best knowledge the current body of research does not fully consider the availability of demand for RES at a given territory. Most of papers are largely focused on the analysis of the potential for the development of renewables. For instance, the work by Prajapati [10], which includes the GIS-based assessment of the hydropower potential of Karnali basin, despite providing strong results (the proposed model was valid with Nash efficiency of 61.7–82.02%) that were similar to other studies of the observed basin, is devoted to the assessment of the hydro resources and is not taking into account the demand side.
Papers by Suri et al. [16], Yuksek et al. [17], Angelis-Dimakis et al. [12], Mondal and Denich [13], Ozturk et al. [18] and Kucukali and Baris [26] while providing a profound analysis of RES potential from the supply side, face similar limitations, determined by one-side assessment of such potential. It is worth noting that the last two papers partially consider the demand side of RES potential through the inclusion of the existing forecasts of macro demand for hydropower energy from major industries of the observed countries.
Paper by Nguyen [15] used a similar GIS-based approach for the assessment of wind potential of Vietnam, but in contrast to former studies, it considers population density of the observed territory—the assessment partially includes the demand-side of RES potential. At the same time, this study did not take into account other types of demand (for instance, industrial) and is also focused on one renewable source of energy.
Another study by Grigoras et al. [11] tackled the issue of assessing the renewables potential of Romania on the basis of existing database of distribution and transmission companies. This research takes into account both technical parameters of the network (voltage level) and the renewable source (its type, installed capacity and geographical position). Though the study was performed on a macro-level—the authors assess the total technical potential of the country without a detailed assessment for various zones and types of renewable energy sources.
Study by Farooq and Kumar [19] provided a detailed analysis of supply-side potential for RES development: authors take into account the availability of rooftops for PV installation. However, the overall demand for electricity from RES is not fully incorporated into their research. Similar approach was used in the research by Yue and Wang [27], which also included the criteria of RES exploration: specific local conditions, natural restrictions, ecological environment of a particular area. However, authors mostly focus on economic potential for the consumption of RES. An interesting approach was used in the paper by Hubert and Vidalenc [20], where authors make an adjustment for the social acceptance when assessing the potential of RES development—with the breakdown by the type of renewable source. However, this parameter may be subjective to each of the respondents and probably other parameters have to be taken into account in further studies.
Russian research on the assessment of renewables potential faces similar limitations. First of all, it is worth noting that the overall number of papers on this topic is rather small. At the same time, existing research is mostly devoted to the macro-assessment of RES potential and the overview of its development in Russia [28,29,30] or to the assessment of natural potential of specific renewable resources [29,31]. For instance, study by Molodtsov [28] provides an interesting insight on where each type of renewable may be the most attractive, but it is of conceptual nature and may not be used as a ground for particular actions. Another research by Chrepovitsyn and Tcvetkov [29] provides an estimation of the overall availability of renewables in Russia, based both upon the existing statistics and observations. However, this paper is largely devoted to the assessment of the overall attractiveness of various RES and is not case-specific. A study by Daus et al. [31] provides a detailed assessment of solar potential in Southern Federal District of Russia but does not imply concrete actions based on the results. At the same time, all of the mentioned papers do not devote enough attention to the demand side of the RES potential.
The present research will include geographical and technical potential assessment of RES (in terms of classification provided by Izadyar et al. [32]) within each of the examined municipal entities, considering both the supply and demand for these resources. This paper will examine the potential for the deployment of renewable energy sources in Krasnoyarsk Region, while previous studies are largely devoted to southern and western regions of Russia. Hence the authors make an attempt to expand the existing body of knowledge through considering a specific case of a region and the employment of a holistic approach in contrast to the previous research, which is mostly focused on specific aspects of renewable energy development.
The development of the society is to a significant degree dependent on a reliable and continuous energy supply [33], while the depletion of fossil fuels coupled with pollution caused by electricity generation facilities urge the transition to renewable energy (most frequently solar, wind, hydro and geothermal) as well as clean fuel technologies [34]. In the pursue of economic and technical efficiency the implementation of renewable energy sources has to be carefully evaluated in relation to exhaustible resources [33,35,36].
The energy system in Russia is huge in its geographical magnitude and regionally very diverse. Up to 68% of electricity generation comes from burning fossil fuels. This determines a high rate of resources depletion as well as local and global environmental risks [37]. The power system is represented by two main constituents: the United Power Grid that covers most of the country’s territory and several isolated power systems which provide electricity to remote areas [38]. Diesel power plants are the main source of electricity generation in isolated power systems, while diesel is normally imported from other regions and it leads to high costs of energy and environmental damage. At the same time, combined solutions are gradually implemented (e.g., wind-diesel power plants) [39]. Also, the Russian government included the goal to increase the share of renewable energy sources in its Energy Strategy, so that 5% of the total energy consumption has to come from renewable energy sources by the year 2030 [40]. Wind, solar and hydro energy seem to be the most promising sources of renewable energy in Russia [37]. According to the International Renewable Energy Agency (IRENA) report the main drivers for implementing renewables in Russia are as follows [41]:
- Economic growth and creation of new jobs
- Science and technology development
- Environmental improvement
- Energy supply for isolated power systems
In the same report IRENA estimated that the share of renewables could possibly reach 11% by 2030. In this view the implementation of renewable energy sources in Russia presents a way to diminish environmental damage as well as ensure societal well-being, especially in remote and thinly populated areas. However, private investments and governmental funding attraction is an especially difficult task due to the lack of technical and economical evidence supporting new renewable energy projects [37]. Thus, more research has to be done to accelerate the process of implementing cleaner and renewable energy sources in Russia.
Within our research we will focus on the estimation of the potential of developing clean energy sources (mainly solar, wind and hydro) in Krasnoyarsk Region (or Krasnoyarsk Krai), which pertains to the Siberian Federal District. Within the present study a municipal entity, depending on its geographic characteristics, provides a “natural niche” for the most suitable for its territory energy sources. To match natural niches with existing and potential demand we calculated population density (demographic data was collected across 44 municipal entities of the region) and also considered the level of industrialization in each municipal entity (production volume of industrial facilities). Since the region is highly industrialized, we also considered large-scale hydro power stations as an important source of energy (natural preconditions were also taken into account and would be discussed in later sections).
Due to the finite uranium resources, nuclear power does not pertain to the most commonly accepted renewable energy sources. The question whether it is a “clean” or “green” energy source remains because of certain environmental issues, safety concerns and the problem of radioactive waste isolation [42]. However, considering the development and deployment of new nuclear generation technologies (primarily fast-neutron reactors, waste recycling and higher safety systems) nuclear power has a significant potential in creating clean energy systems through its high efficiency (capacity factor up to 86% [43]), commitment both to greenhouse gas reduction and biodiversity conservation. There is a substantial evidence in favor of nuclear power being an important constituent element of a viable and sustainable energy mix of the future [44,45,46,47,48,49]. Therefore, within our study we are going to consider nuclear power as a cleaner alternative to hydrocarbon fuels in case if other sources are insufficient for satisfying existing or potential demand. The existence of a natural niche for its development in the Krasnoyarsk Region would be discussed in later sections.
Thus, we arrive at four basic clean energy sources relevant for development in the region: solar, wind, hydro and nuclear. All the mentioned above sources of energy have to be implemented in such way that allows for their cooperation in order to create a sustainable and reliable energy mix (one source of energy has to be supplemented by others where applicable). Such approach corresponds to the current body of research.
The main aim of the present study is to deepen the understanding of where and what renewable energy sources may be implemented in the Krasnoyarsk Region by comparing the natural potential (mapping results and natural niches) of the territory with population density in different municipal entities and considering the level of industrialization of each entity. We also cover the issues of air pollution, primarily the emissions of carbon dioxide and sulfur oxide (which are most commonly associated with burning fossil fuels). A quick analysis method for measuring the potential of developing cleaner energy sources is applied through combining geographical and demographical data. We provide a resulting matrix indicating what precise energy sources have the highest potential for implementing as a primary or supplemental source of energy in each of the 44 municipal entities of the Krasnoyarsk Region.
The rest of the paper is structured as follows. In Section 2 we provide rationale for the applied methods, present our research design, and describe the materials. We then proceed to the description of our results and develop the resulting matrix indicating the potential of developing RES in the Krasnoyarsk region across all municipal entities. After that we provide a discussion concerning the contributions, implications and limitations of our research.
2. Materials and Methods
2.1. Research Design
The novelty of our study lies in its holistic nature as distinguished from other specifically focused studies. Municipal entities of a region are complex multifaceted socioeconomic systems described by different aspects. Analysis of these systems is possible only in the presence of sufficient statistical data provided by government bodies and specific data collected within previous research devoted to certain aspects of the municipal entities. That is why the choice of the method for the present research, having in view the aim of the study, was narrowed to the data available. In the authors’ opinion, the suggested research design is optimal, taking into account this limitation. Materials for the present study were collected from several sources:
- Data regarding the potential of implementing clean and renewable energy sources (solar, wind, hydro and nuclear) in the Krasnoyarsk Region (sources of information are described in further sections)
- Demographic and industrialization data collected from open sources (official statistics)
- Data regarding emissions (carbon dioxide and sulfur oxide) was collected from open sources (official statistics)
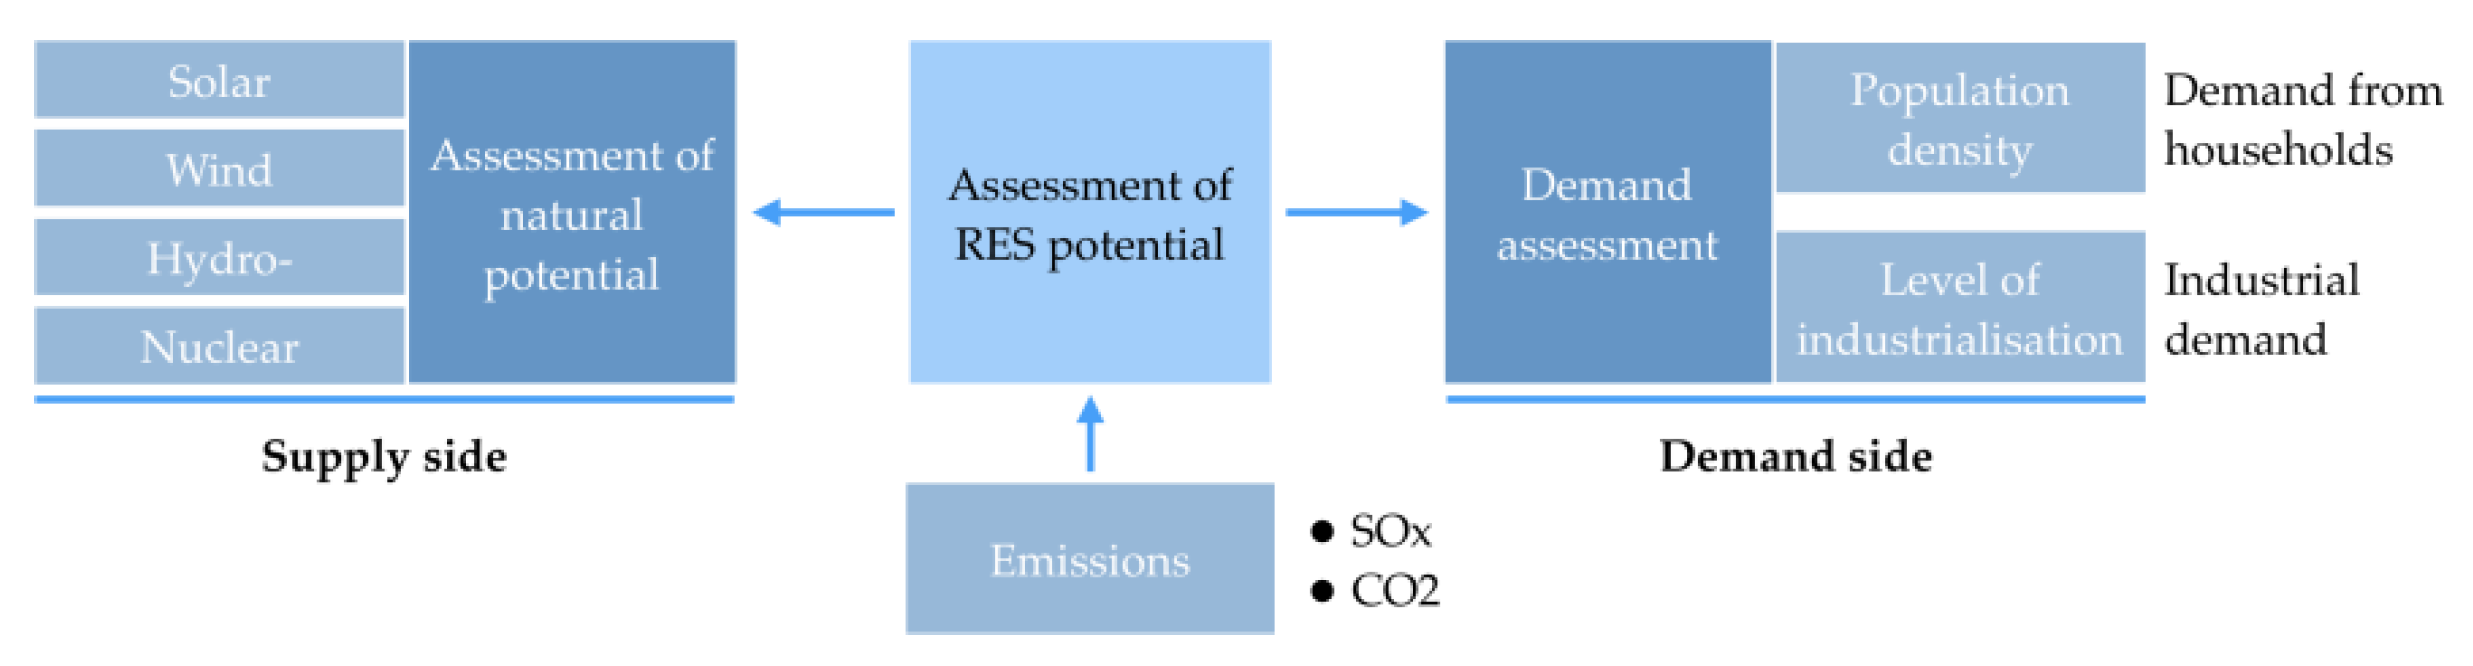
As it was mentioned before, we focus on the assessment of renewable energy potential of the Krasnoyarsk Region from both supply and demand side (Figure 1).
By supply we mean the existence of natural niches for the development of renewables. In our study, we expand previous research devoted to mapping solar, wind, micro hydro and biomass potential in Krasnoyarsk Region [50]. By demand we mean the level of industrialization of a given territory (which represents the industrial consumers of energy) and its population density (which allows indirectly evaluating the demand for energy from households). Among the four types of “clean” energy sources—solar, wind, hydro, and nuclear—the last two conventional sources allow for creating an optimal energy portfolio and support a basic demand for energy (mostly created by the industry).
2.2. The energy Sector of Krasnoyarsk Region
Expanding from the Arctic Ocean up to the Sayan Mountains, Krasnoyarsk Region is one of the largest territories in Russia (13% of the total area) and from its geographical standpoint, the region may be seen as a representative model of Russia. Table 1 provides characteristics of the region with the particular emphasis on the structure of its power industry, which is currently typical for the eastern part of Russia and mostly based on coal-fired and hydro power generation.
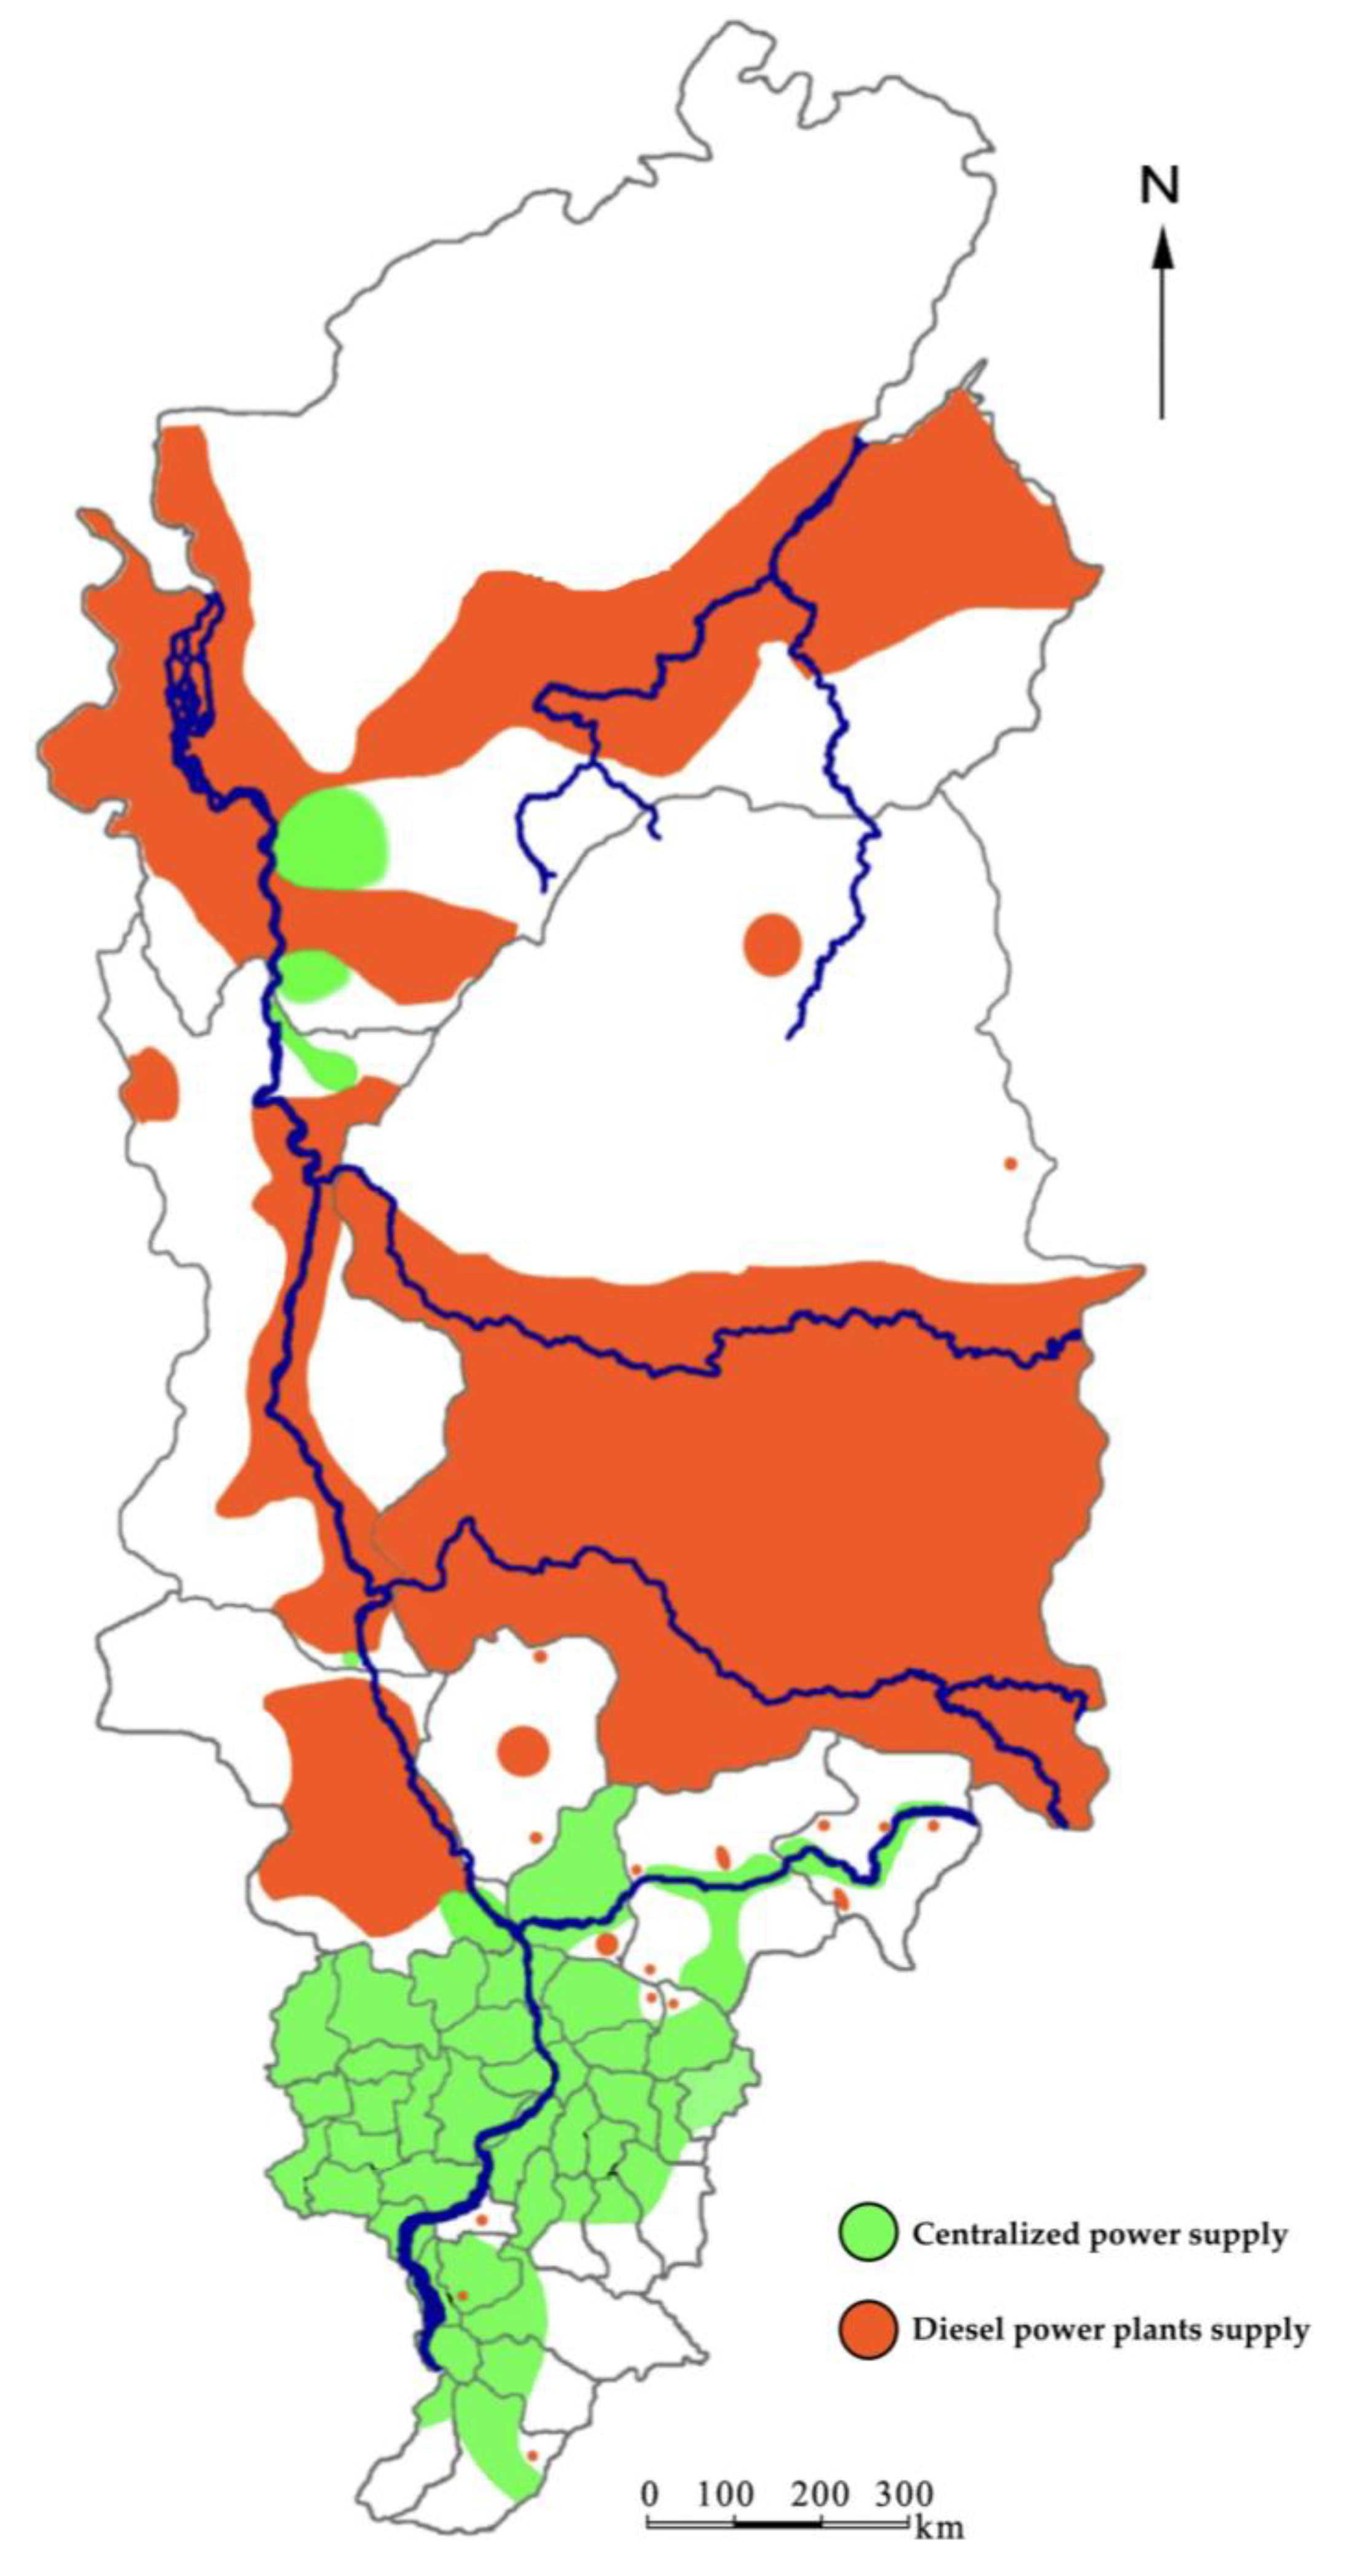
The power sector in general is of mixed type: most of the municipal entities are connected to the United Power Grid of Russia, while remote areas are isolated. Figure 2 shows both the territories with centralized and decentralized power supply. In thinly populated remote areas power energy is generated by diesel plants. The Norilsk-Taimyr energy region (where industrial plants of JSC MMC Nornickel are concentrated) is also isolated from the United Power Grid and supplied with energy by the Norilsk-Taimyr energy company [52].
The Kansk-Achinsk coal basin situated in the region ranks as the second in significance within the country—its proven reserves account for 40.7% of total national reserves. Coal production in the region accounts for 11% of total national production. The share of coal-fired power generation accounts for 43–45% [53].
At the same time, environmental concerns are high [54,55]. Russian Ministry of Natural Resources [56] estimated that during the period 2011–2016 the overall emissions of CO2 in Krasnoyarsk Region increased by 46%.
According to the International Energy Agency (IEA) the carbon intensity of the Russian economy (carbon dioxide emissions per GDP) in 2011 was about 60% higher than the average measured in IEA member countries [57], which is supported by 2015 research [58]. Previous research and environmental monitoring show that in 2015 the following populated territories: Achinsk, Kansk, Krasnoyarsk, Lesosibirsk, Minusinsk, Nazarovo and Norilsk appear to be the most polluted areas in Krasnoyarsk Region, with air pollution being one of the major issues [59].
Environmental concerns coupled with low efficiency of coal generation (about 35% according to a 2018 report [60]) urge to implement cleaner sources of energy. Thus, in further sections we briefly cover the issue of air pollution in Krasnoyarsk Region (mainly carbon dioxide and sulfur oxide) as an additional factor for the development of RES.
One evident alternative is presented by natural gas [61], especially considering that gas production in the region is growing [53]. While there are plans for developing natural gas infrastructure in the Krasnoyarsk Region announced by PJSC (Public Joint Stock Company) Gazprom [62] (Russian largest company engaged in extraction, production, transportation and sales of natural gas), there is still no noticeable progress (according to an official statement from June, 2018 [63] the project of the gasification program is still being prepared by corresponding regional authorities). However, it is important to mention that there is evidence indicating that the implementation of natural gas as a source of energy has also an adverse effect on the ecosystem due to methane leakages [64,65,66,67,68]. This fact decreases the attractiveness of this source of energy. Due to these reasons we do not refer to natural gas as a cleaner alternative within our study.
2.3. Socioeconomic Data
Population density is one of the main factors that determine energy consumption patterns [69,70,71,72,73]. Population density for all the 44 municipal entities was calculated dividing population (people) by area of the municipal entity (km2) with the use of official data on land area [74] and population data collected from the Federal Statistics Service [75]. All data refers to the year 2017.
We divided population density into three groups: high (>6 people/km2), medium (2–6 people/km2) and low (<2 people/km2) levels.
Level of industrialization was estimated through the calculation of production volume in 2017 (in monetary terms, in Russian rubles further referred as RUR) in three major sectors of economy: mining operations, manufacturing and energy sector [76]. We divided the municipal entities into three groups: high (>10,000 m RUR), medium (2000–10,000 m RUR), and low level of industrialization (<2000 m RUR).
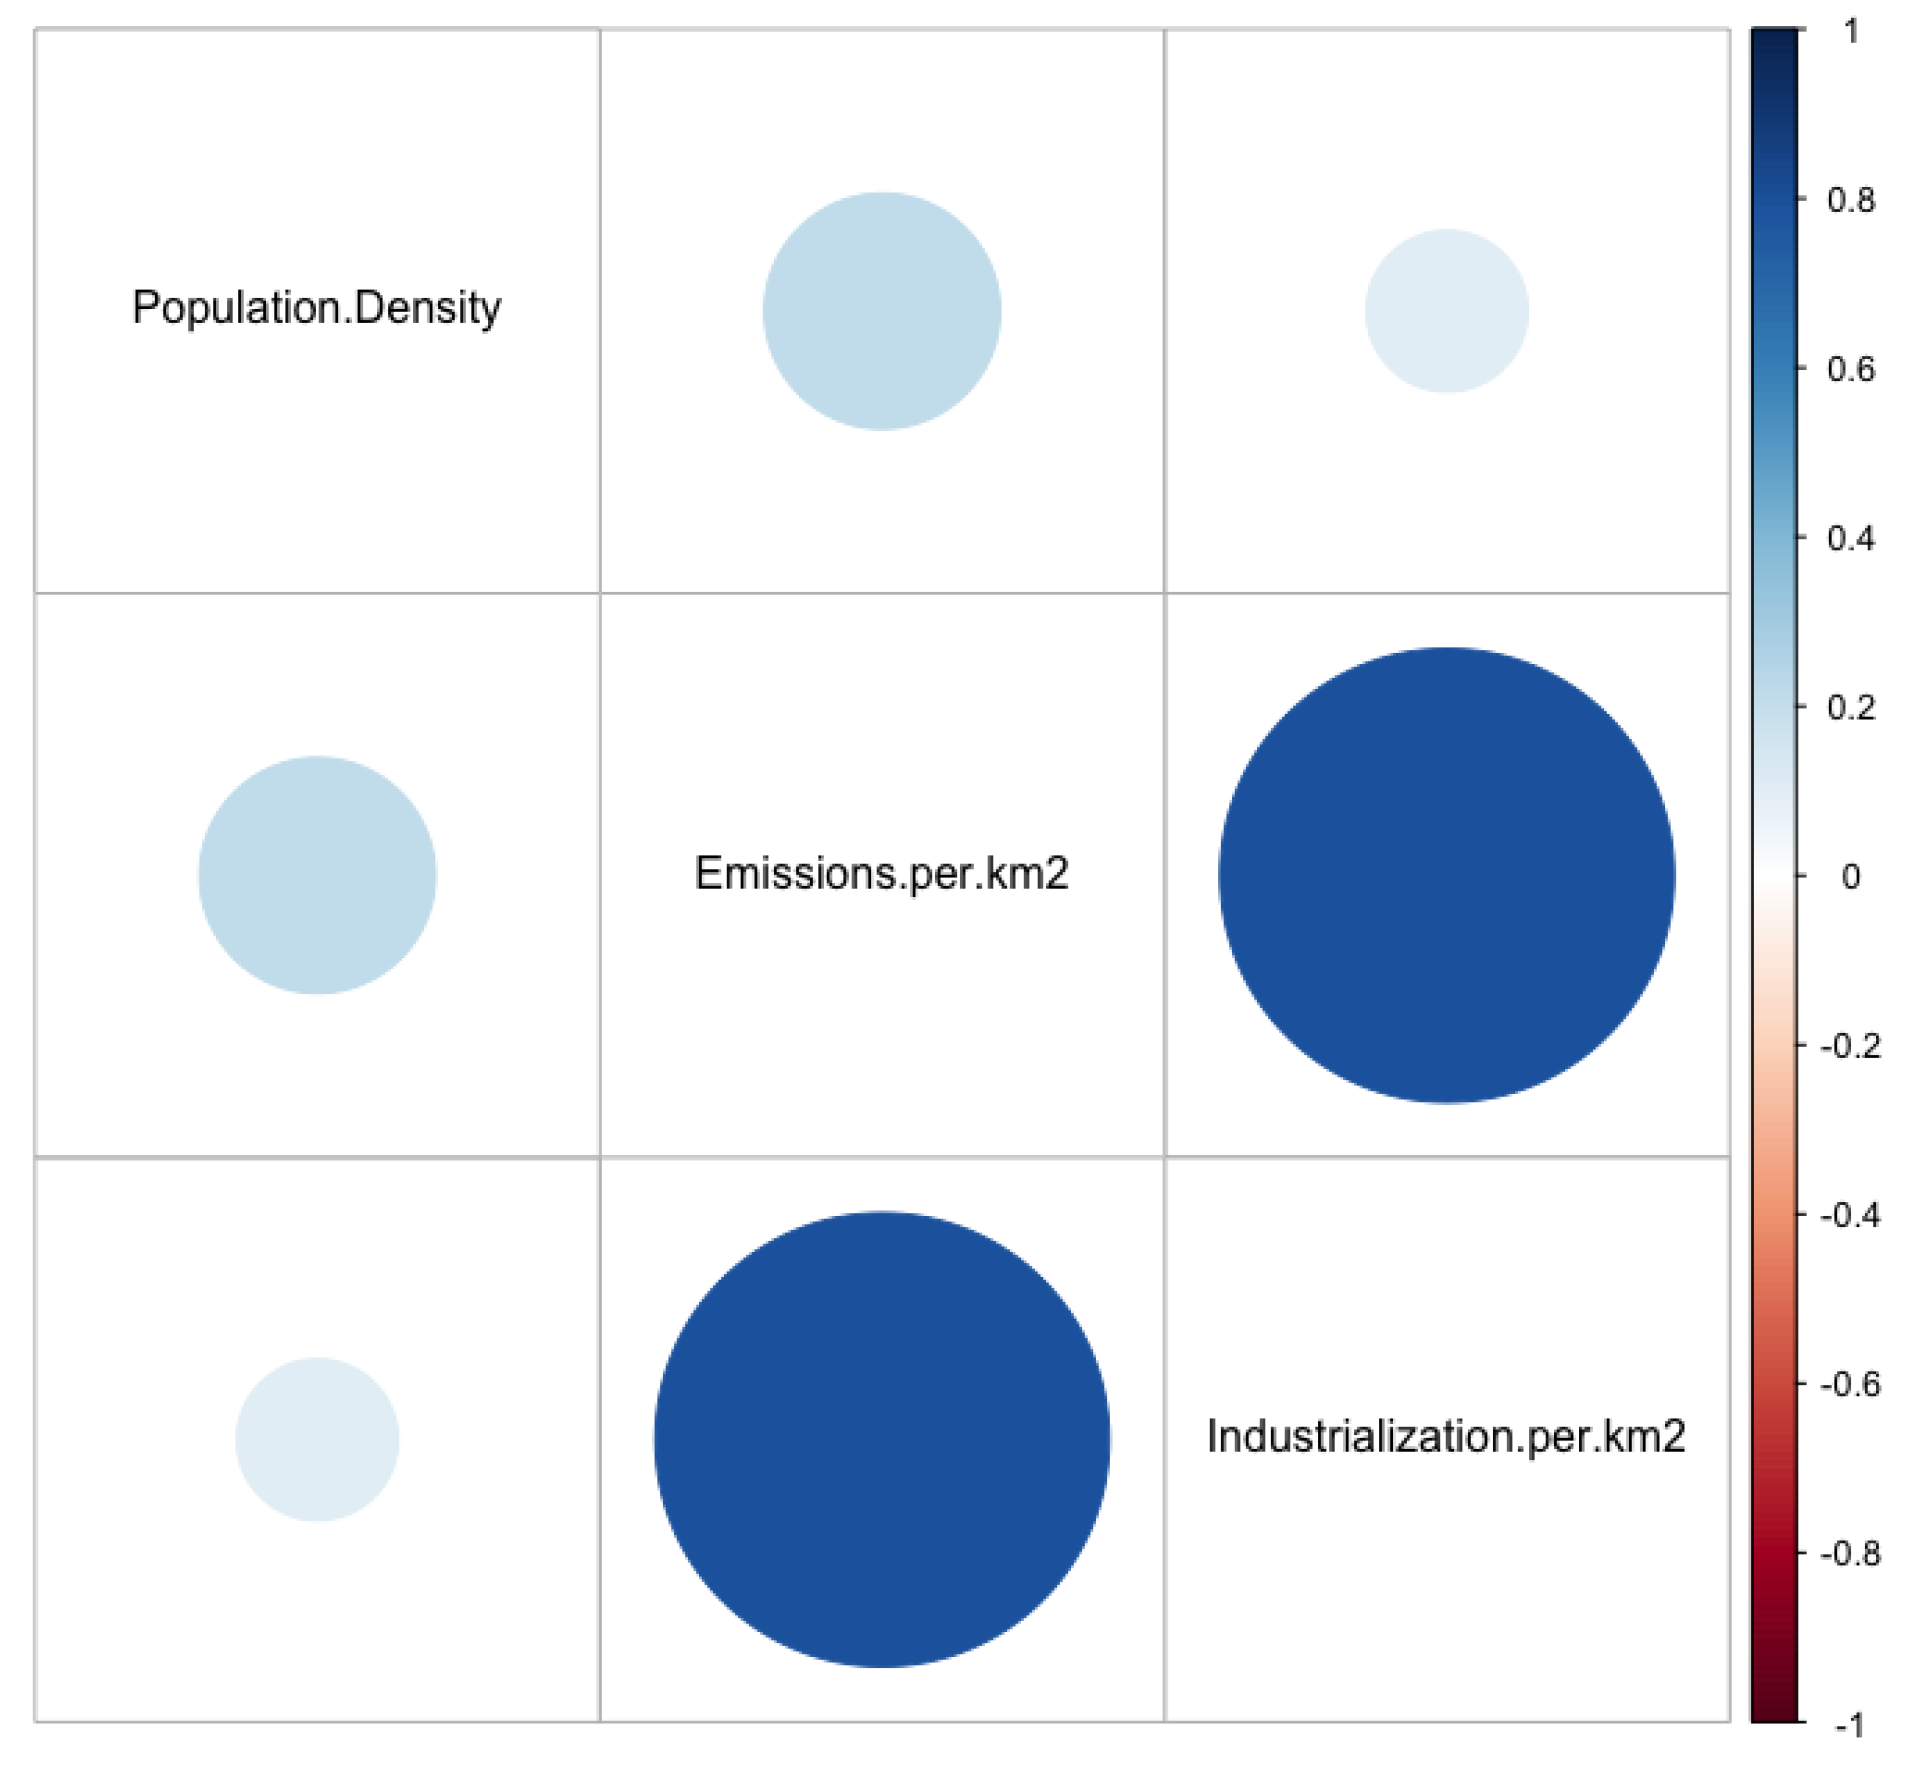
As it was previously mentioned, high environmental concerns are one of the main reasons for the deployment of cleaner energy sources in the region. Thus, within our research we considered the emissions level within the municipal entities of Krasnoyarsk Region as a rationale for developing RES [56,77]. We mainly focused on the emissions of sulfur oxide and carbon dioxide as most commonly associated with burning fossil fuels According to our calculations, there is a high positive correlation with the level of industrialization among the observed entities (Pearson correlation coefficient = 0.8 with p-value < 0.05), ass seen in Figure 3.
2.4. Mapping of Solar and Wind Power Potential
The mapping is based both on the data collected by the authors of the present study and on the results of the research, carried out by a group of researchers of the Siberian Federal University in 2013. Their project was devoted to the technical and economic potential of different renewable energy sources in the Krasnoyarsk Region [50]. Among other goals, the project group evaluated the potential of solar and wind power energy implementation in the region and developed maps reflecting which municipal entities have the highest and the lowest potential for developing either solar or wind power stations.
There are natural cycles that determine the volatility of wind and solar power capacity, while the measurements were carried out in 2013. However, because RES projects imply long investment cycles the average annual values are of importance. Also, the potential of a renewable source can be determined only approximately [2]. This means that the results of the mapping can be applied to the current research.
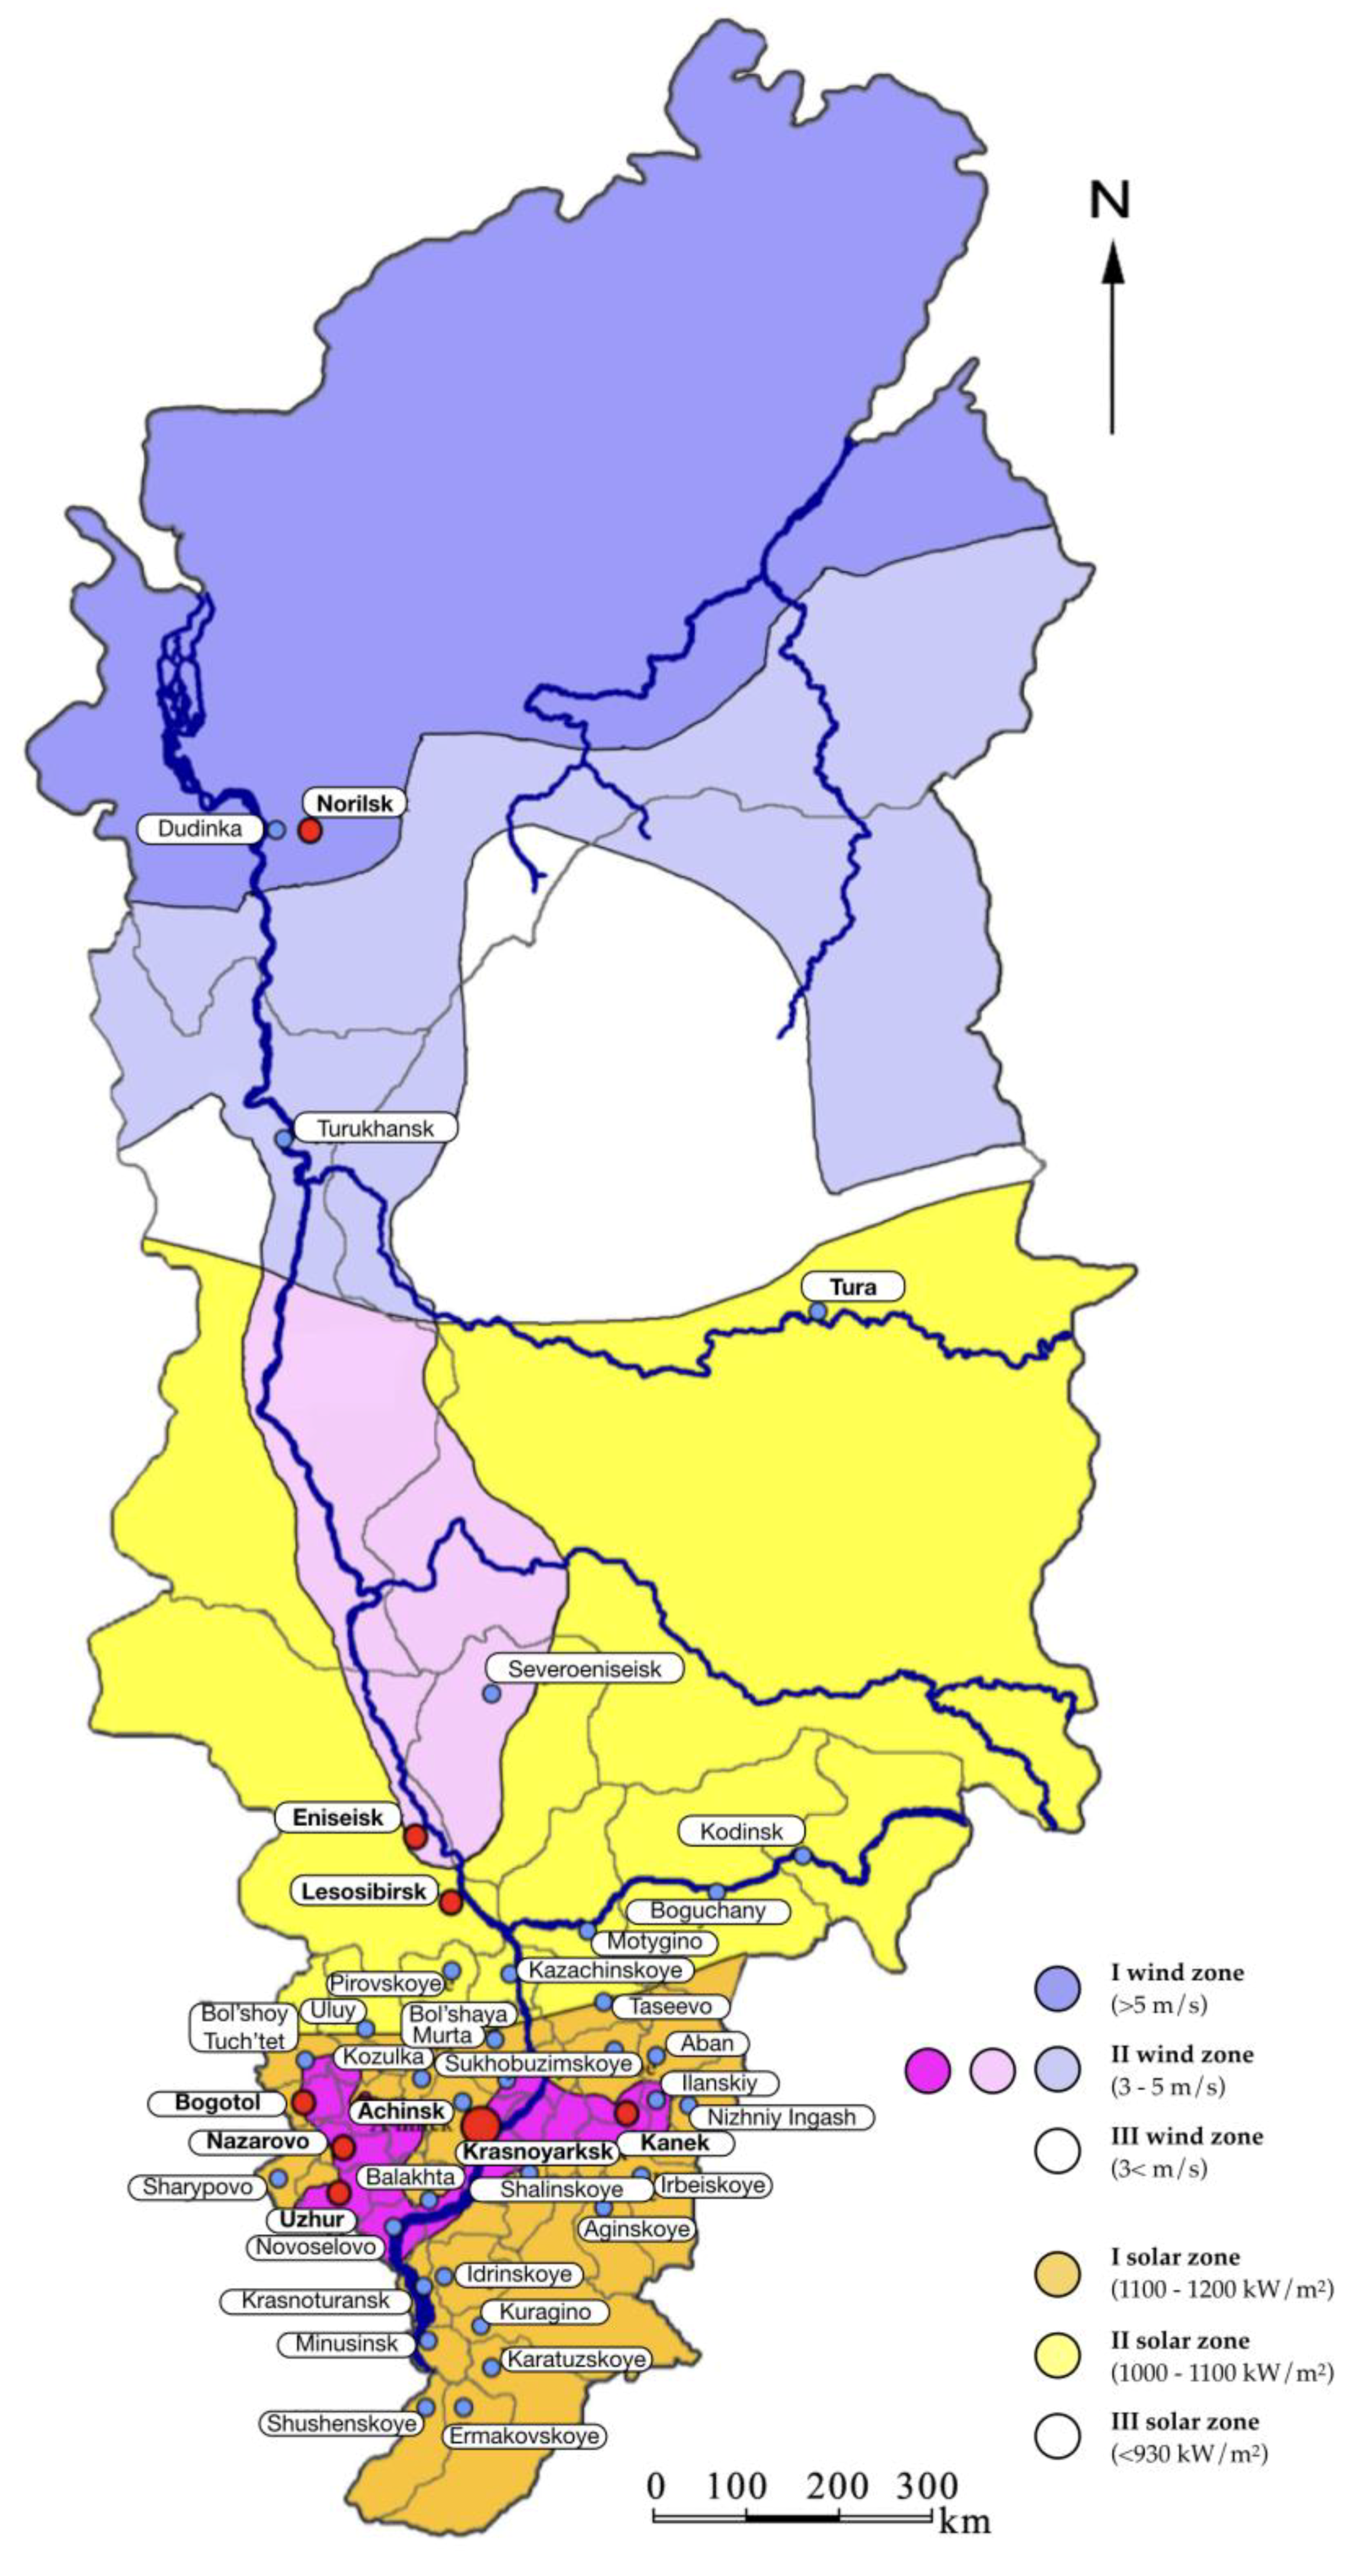
By measuring solar insolation and calculating average annual irradiance in kilowatt per square meter (kW/m2) the researchers identified three zones: with the most, least and medium solar potential. By measuring an average annual wind speed in meters per second (m/s) they also identified three zones: with the most, least and medium wind potential. Both solar and wind potential are shown in Figure 4.
2.5. Mapping of Hydropower Potential
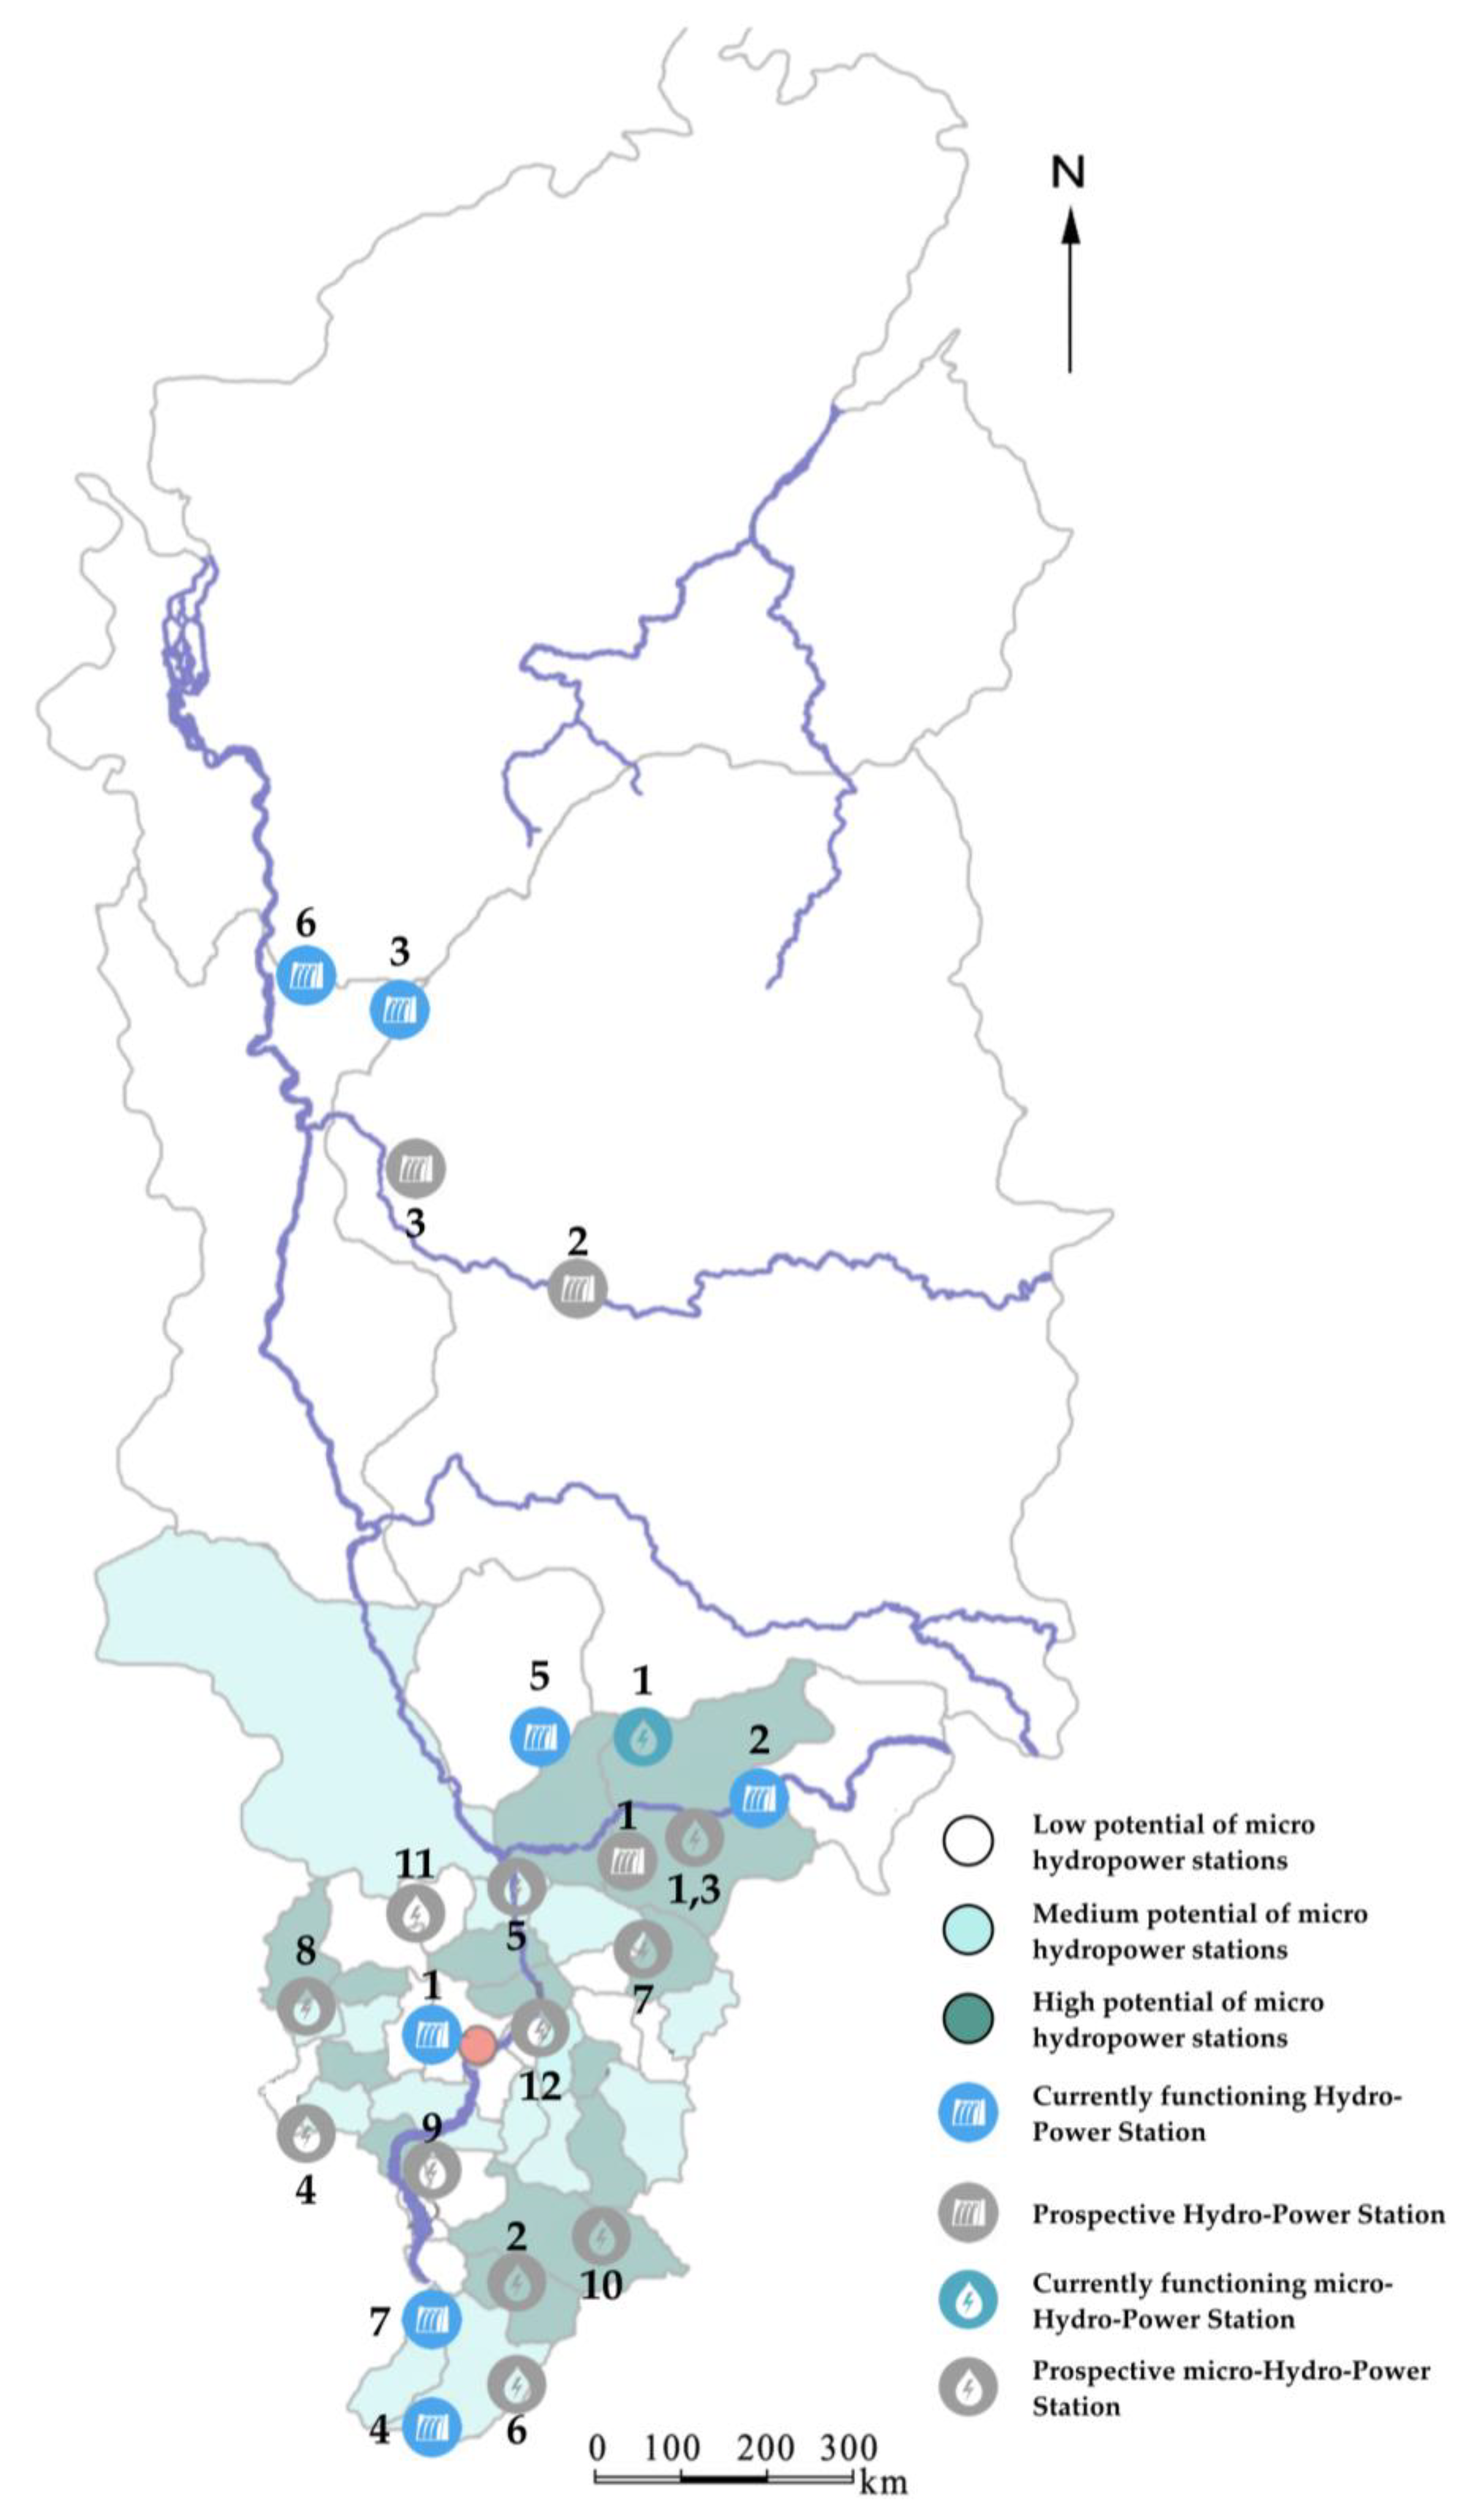
The reason for hydropower inclusion was the abundance of hydropower resources in Russia [79] (according to the International Hydropower Association [80] Russia ranks as the second country after China in undeveloped hydropower resources) as well as the highest importance of this source of energy in Siberia (up to 47% of total capacity [81]). Currently (Figure 5), six hydropower stations function in Krasnoyarsk Region (Krasnoyarskaya, Boguchanskaya, Kureiskaya, Mainskaya, Enashiminskaya and Ust-Khantaiskaya). Enashiminskaya micro hydro station supplies several settlements in Severoeniseiskiy municipal entity. Sayano–Shushenskaya hydropower station also forms a part of the regional energy system, while it is located on the borderline between the Krasnoyarsk Region and the Republic of Khakassia.
There are several other natural preconditions for the further development of hydropower energy in the Krasnoyarsk Region. According to the General Scheme of Developing Power Energy Facilities [82] Motyginskaya hydropower station has to be constructed in the Krasnoyarsk Region. The project is to be realized by JSC RusHydro, however, there is no progress since 2009 [83].
Another project of JSC RusHydro, Evenkiyskaya (or Turukhanskaya) hydropower station, is withheld since 2010 due to serious environmental concerns [84], while there is a strong natural potential for the project [85]. The future of the Nizhne-Kureiskaya hydropower station project is also uncertain as the company responsible for the project (a subsidiary of JSC RusHydro) changed its name and business profile (it’s an energy sales company at the moment [86]). According to previous research Krasnoyarsk Region has also a noticeable potential of developing micro hydro power stations due to the abundance of minor rivers with sufficient capacity [50].
Based on these facts we regard power stations in design stage and those possible to construct on minor rivers as prospective for the region as shown in Figure 5. The map includes an array of currently functioning and potential generation objects with the following numbering:
- Currently functioning hydro power stations: (1) Krasnoyarskaya; (2) Boguchanskaya; (3) Kureiskaya; (4) Mainskaya; (5) Enashiminskaya; (6) Ust-Khantaiskaya; (7) Sayano–Shushenskaya;
- Potential hydro power stations: (1) Motyginskaya; (2) Evenkiyskaya (or Turukhanskaya); (3) Nizhne-Kureiskaya;
- Municipal entities with the potential for the development of micro hydro power stations: (1) Motyginskiy; (2) Kuraginskiy; (3) Boguchanskiy; (4) Nazarovskiy; (5) Bolʹshemurtinskiy; (6) Karatuzskiy; (7) Abanskiy; (8) Tiukhtetskiy; (9) Novoselovskiy; (10) Sayanskiy; (11) Bolʹsheuluĭskiy; (12) Sukhobuzimskiy.
2.6. Mapping of Nuclear Power Potential
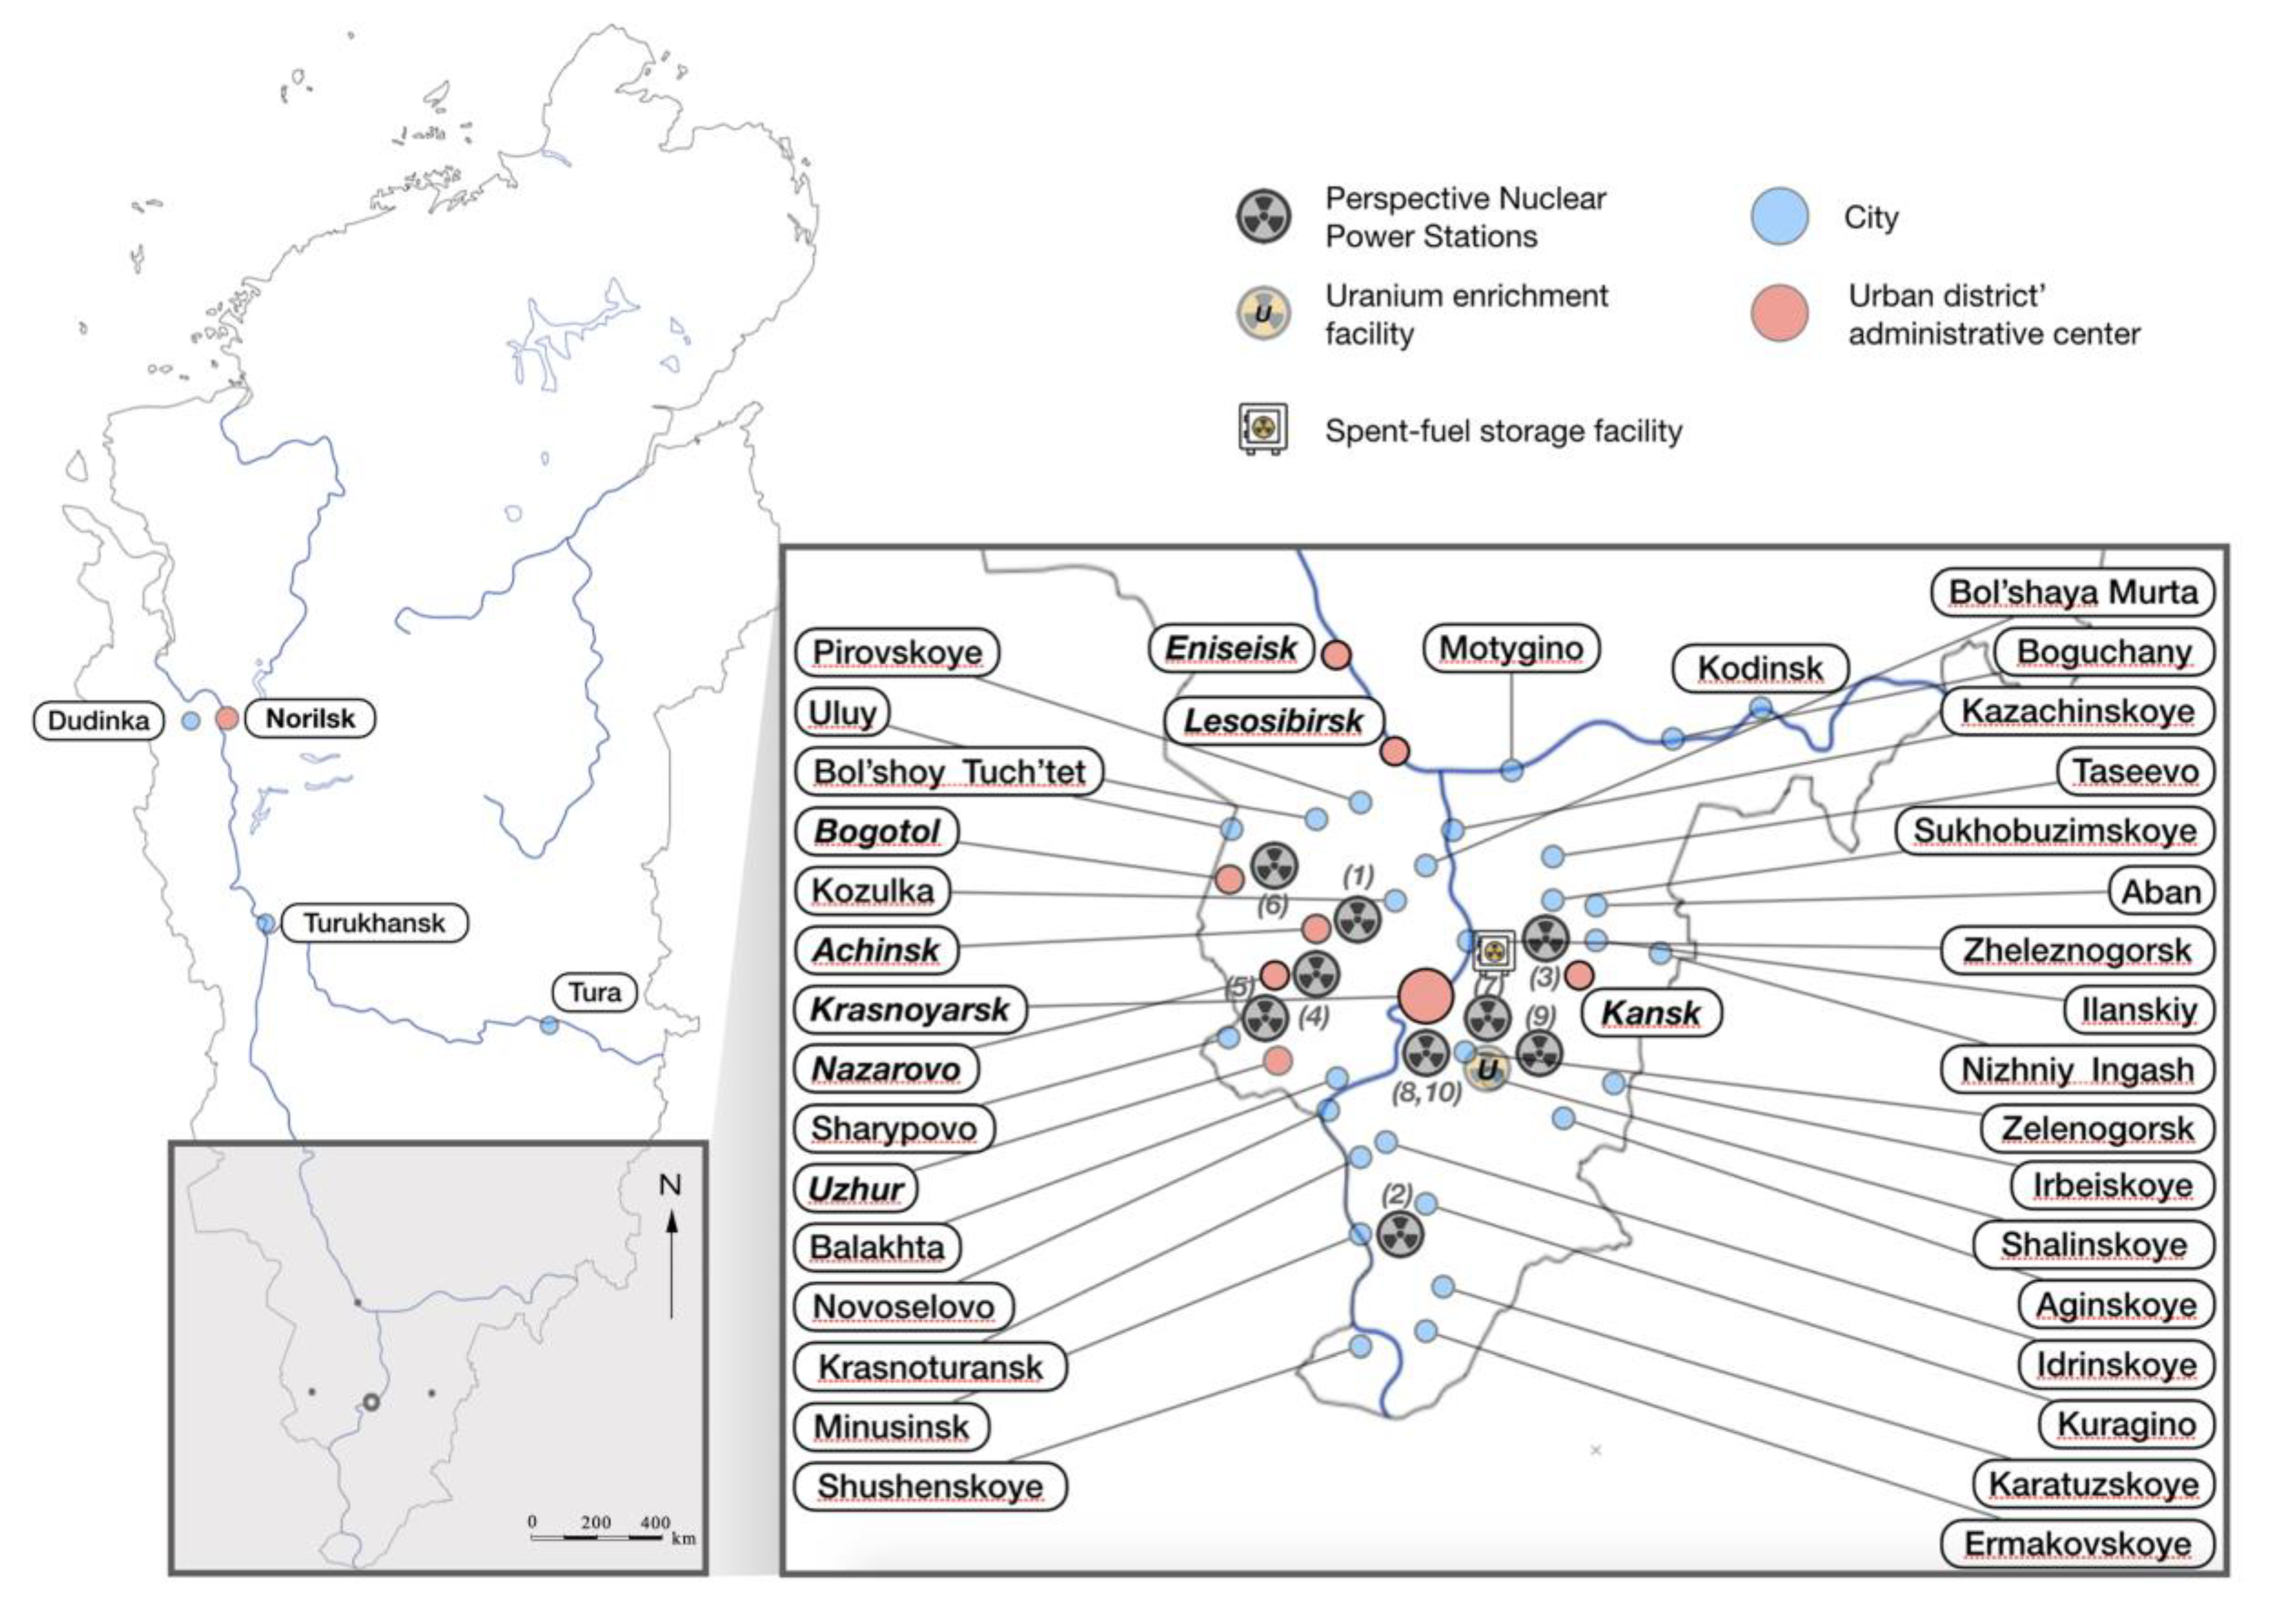
As it was mentioned before, it is still highly debatable whether nuclear power may be considered to be a “green” or “renewable” source of energy; however, we decided to include it as one of the alternatives for several reasons. First of all, both a uranium enrichment facility [87] and a spent-fuel storage facility [88] are located in the Krasnoyarsk Region (Figure 6). Secondly, Krasnoyarsk Region can be characterized as a territory with a high industrial potential [89] (and corresponding power energy demand) with developed oil and gas, power and mechanical engineering, timber, metal-working and mining industrial facilities. Also, metallurgy is a significant source of the regional industrial potential due to the abundance of non-ferrous metal ores. Mutually, these factors create a natural niche for developing high capacity nuclear power stations in the region, precisely in those municipal entities, where the demand of large-scale industries cannot be satisfied (partially or entirely) with hydropower (within this study, we do not consider fossil fuels as an alternative in such cases as we focus on cleaner alternatives).
We assumed that nuclear power stations have the highest potential in densely populated and industrialized territories (supplemental to other sources of energy). The map includes an array of municipal entities with the potential for the development of nuclear power stations with the following numbering: (1) Achinskiy; (2) Minusinskiy; (3) Kanskiy; (4) Nazarovskiy; (5) Sharypovskiy; (6) Bogotolʹskiy; (7) Uiarskiy; (8) Berezovskiy; (9) Rybinskiy; (10) Taimyrskiy municipal region.
3. Results
While the results of the mapping described above in some way illustrate the possible directions for renewable energy development, we suppose that it is essential to consider the potential demand through adding to the analysis population density and level of industrialization across all the municipal entities (Table 2).
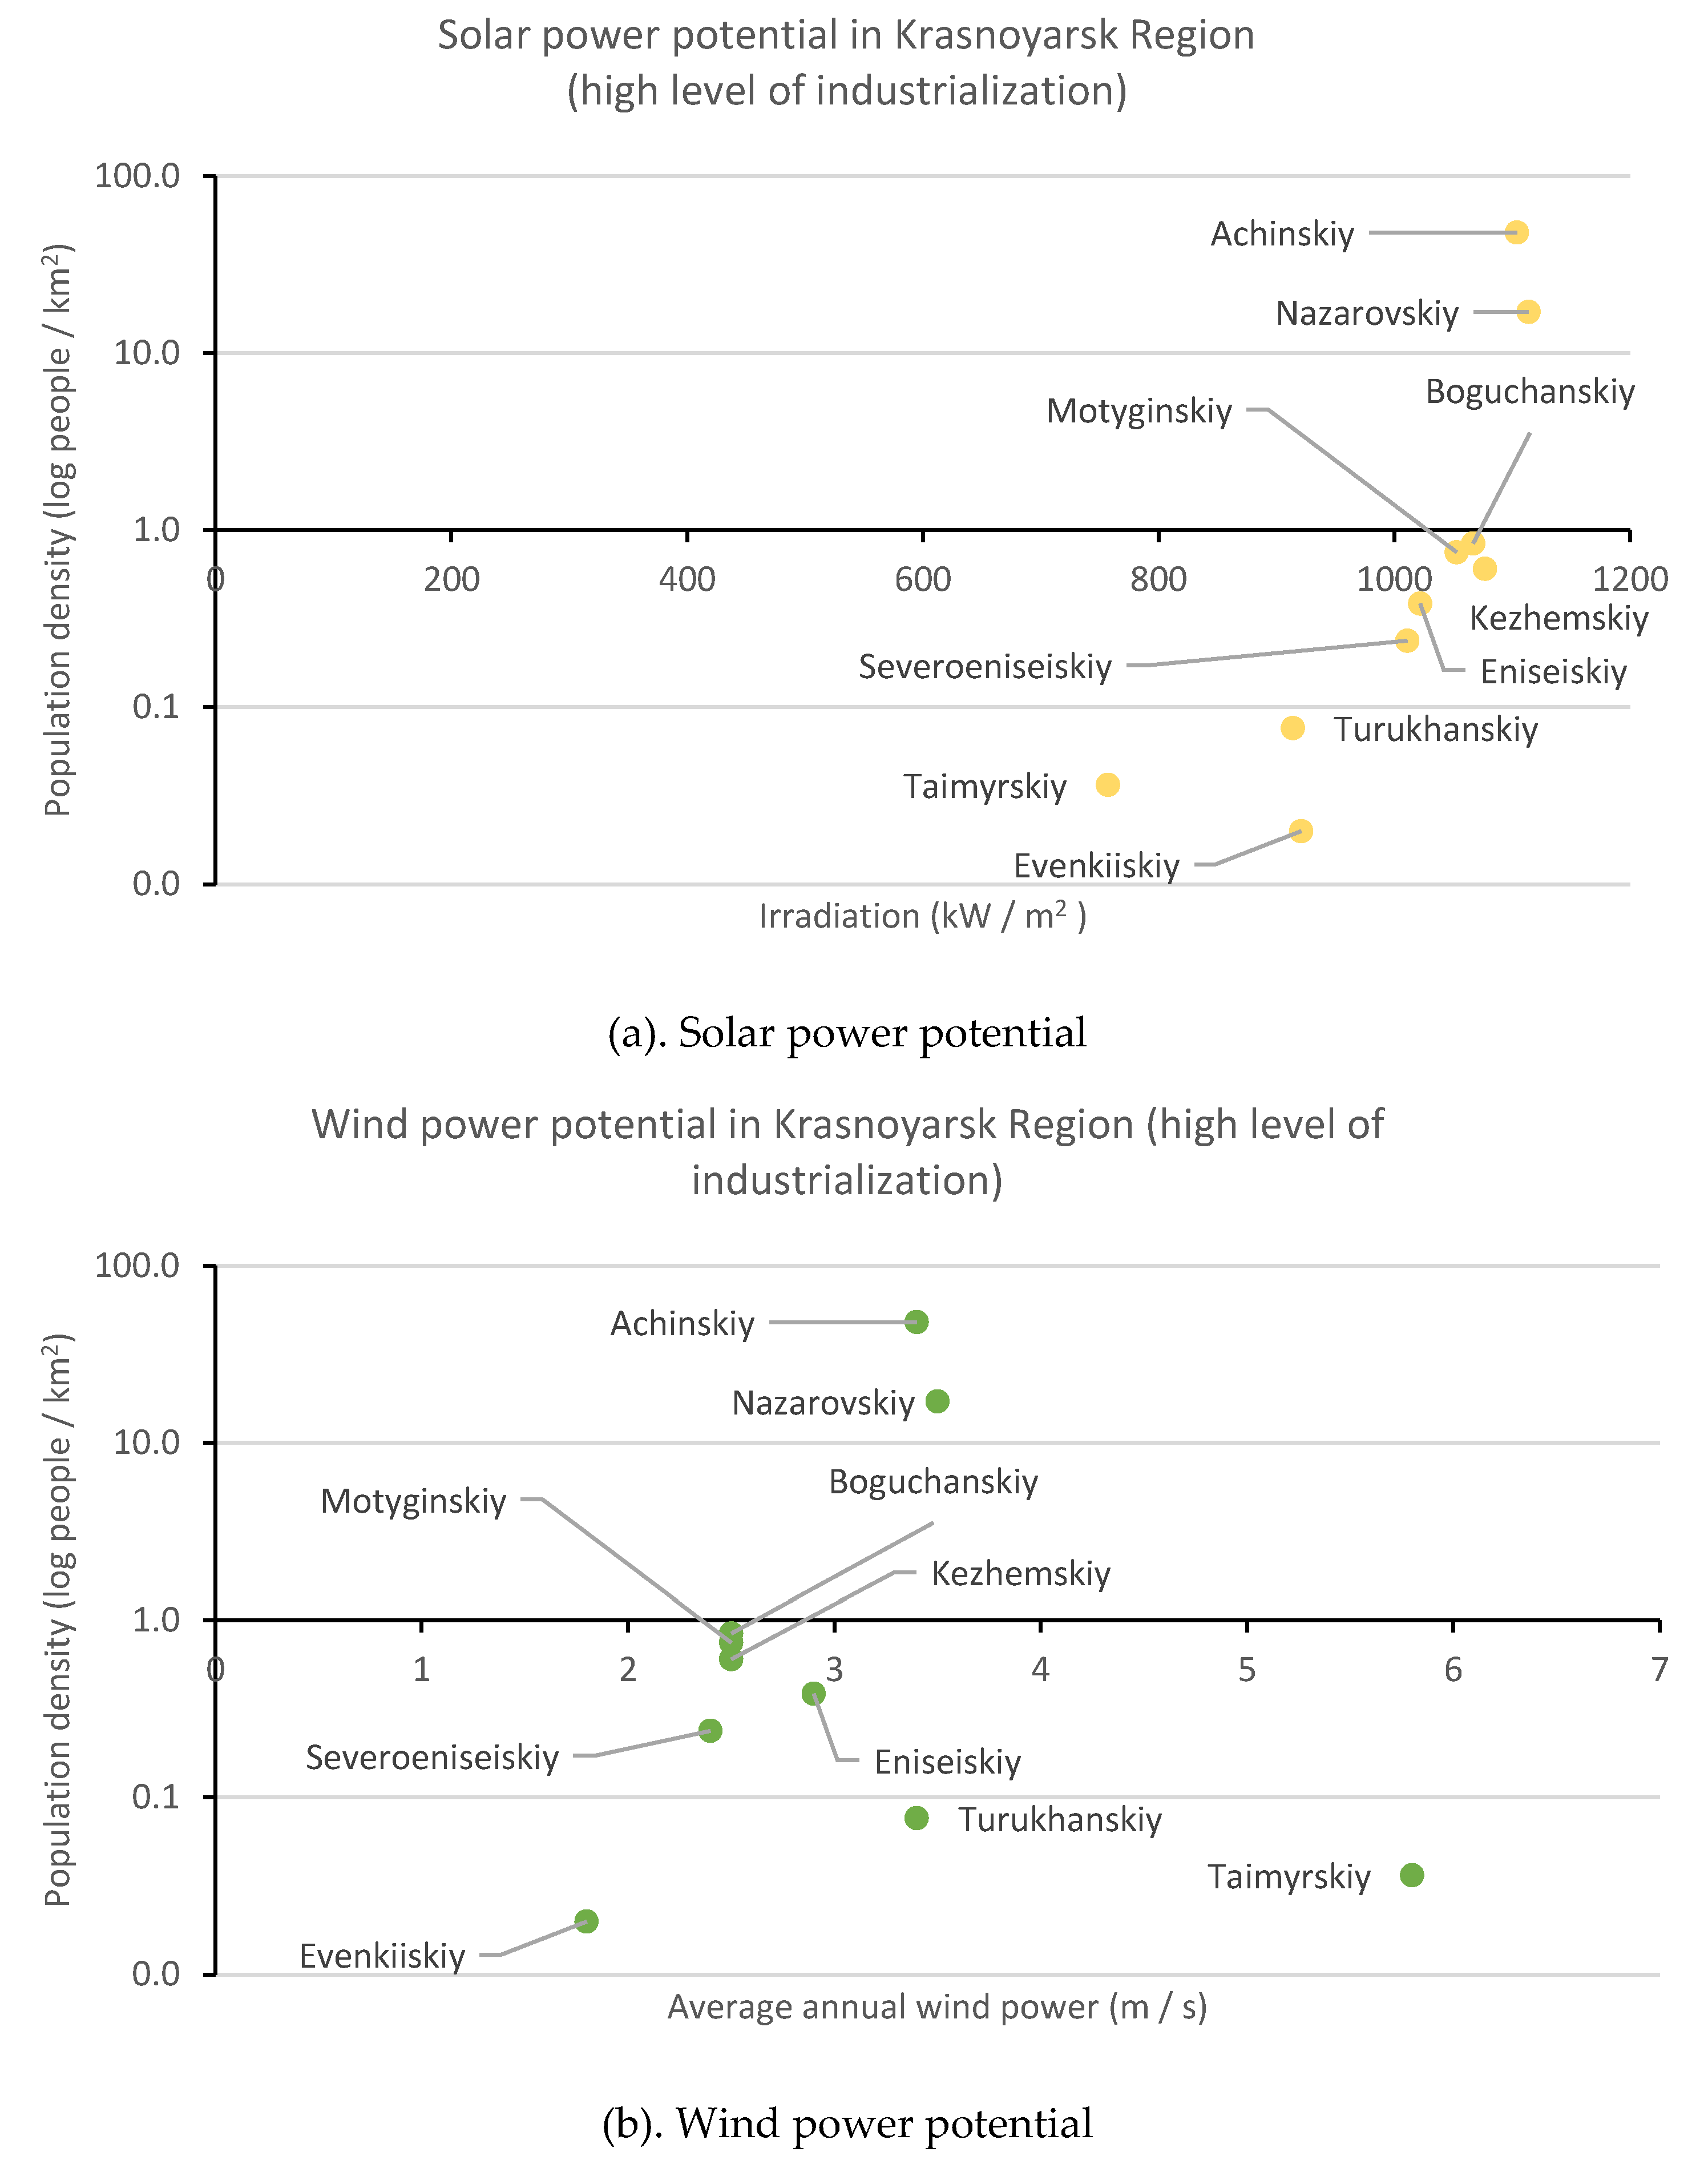
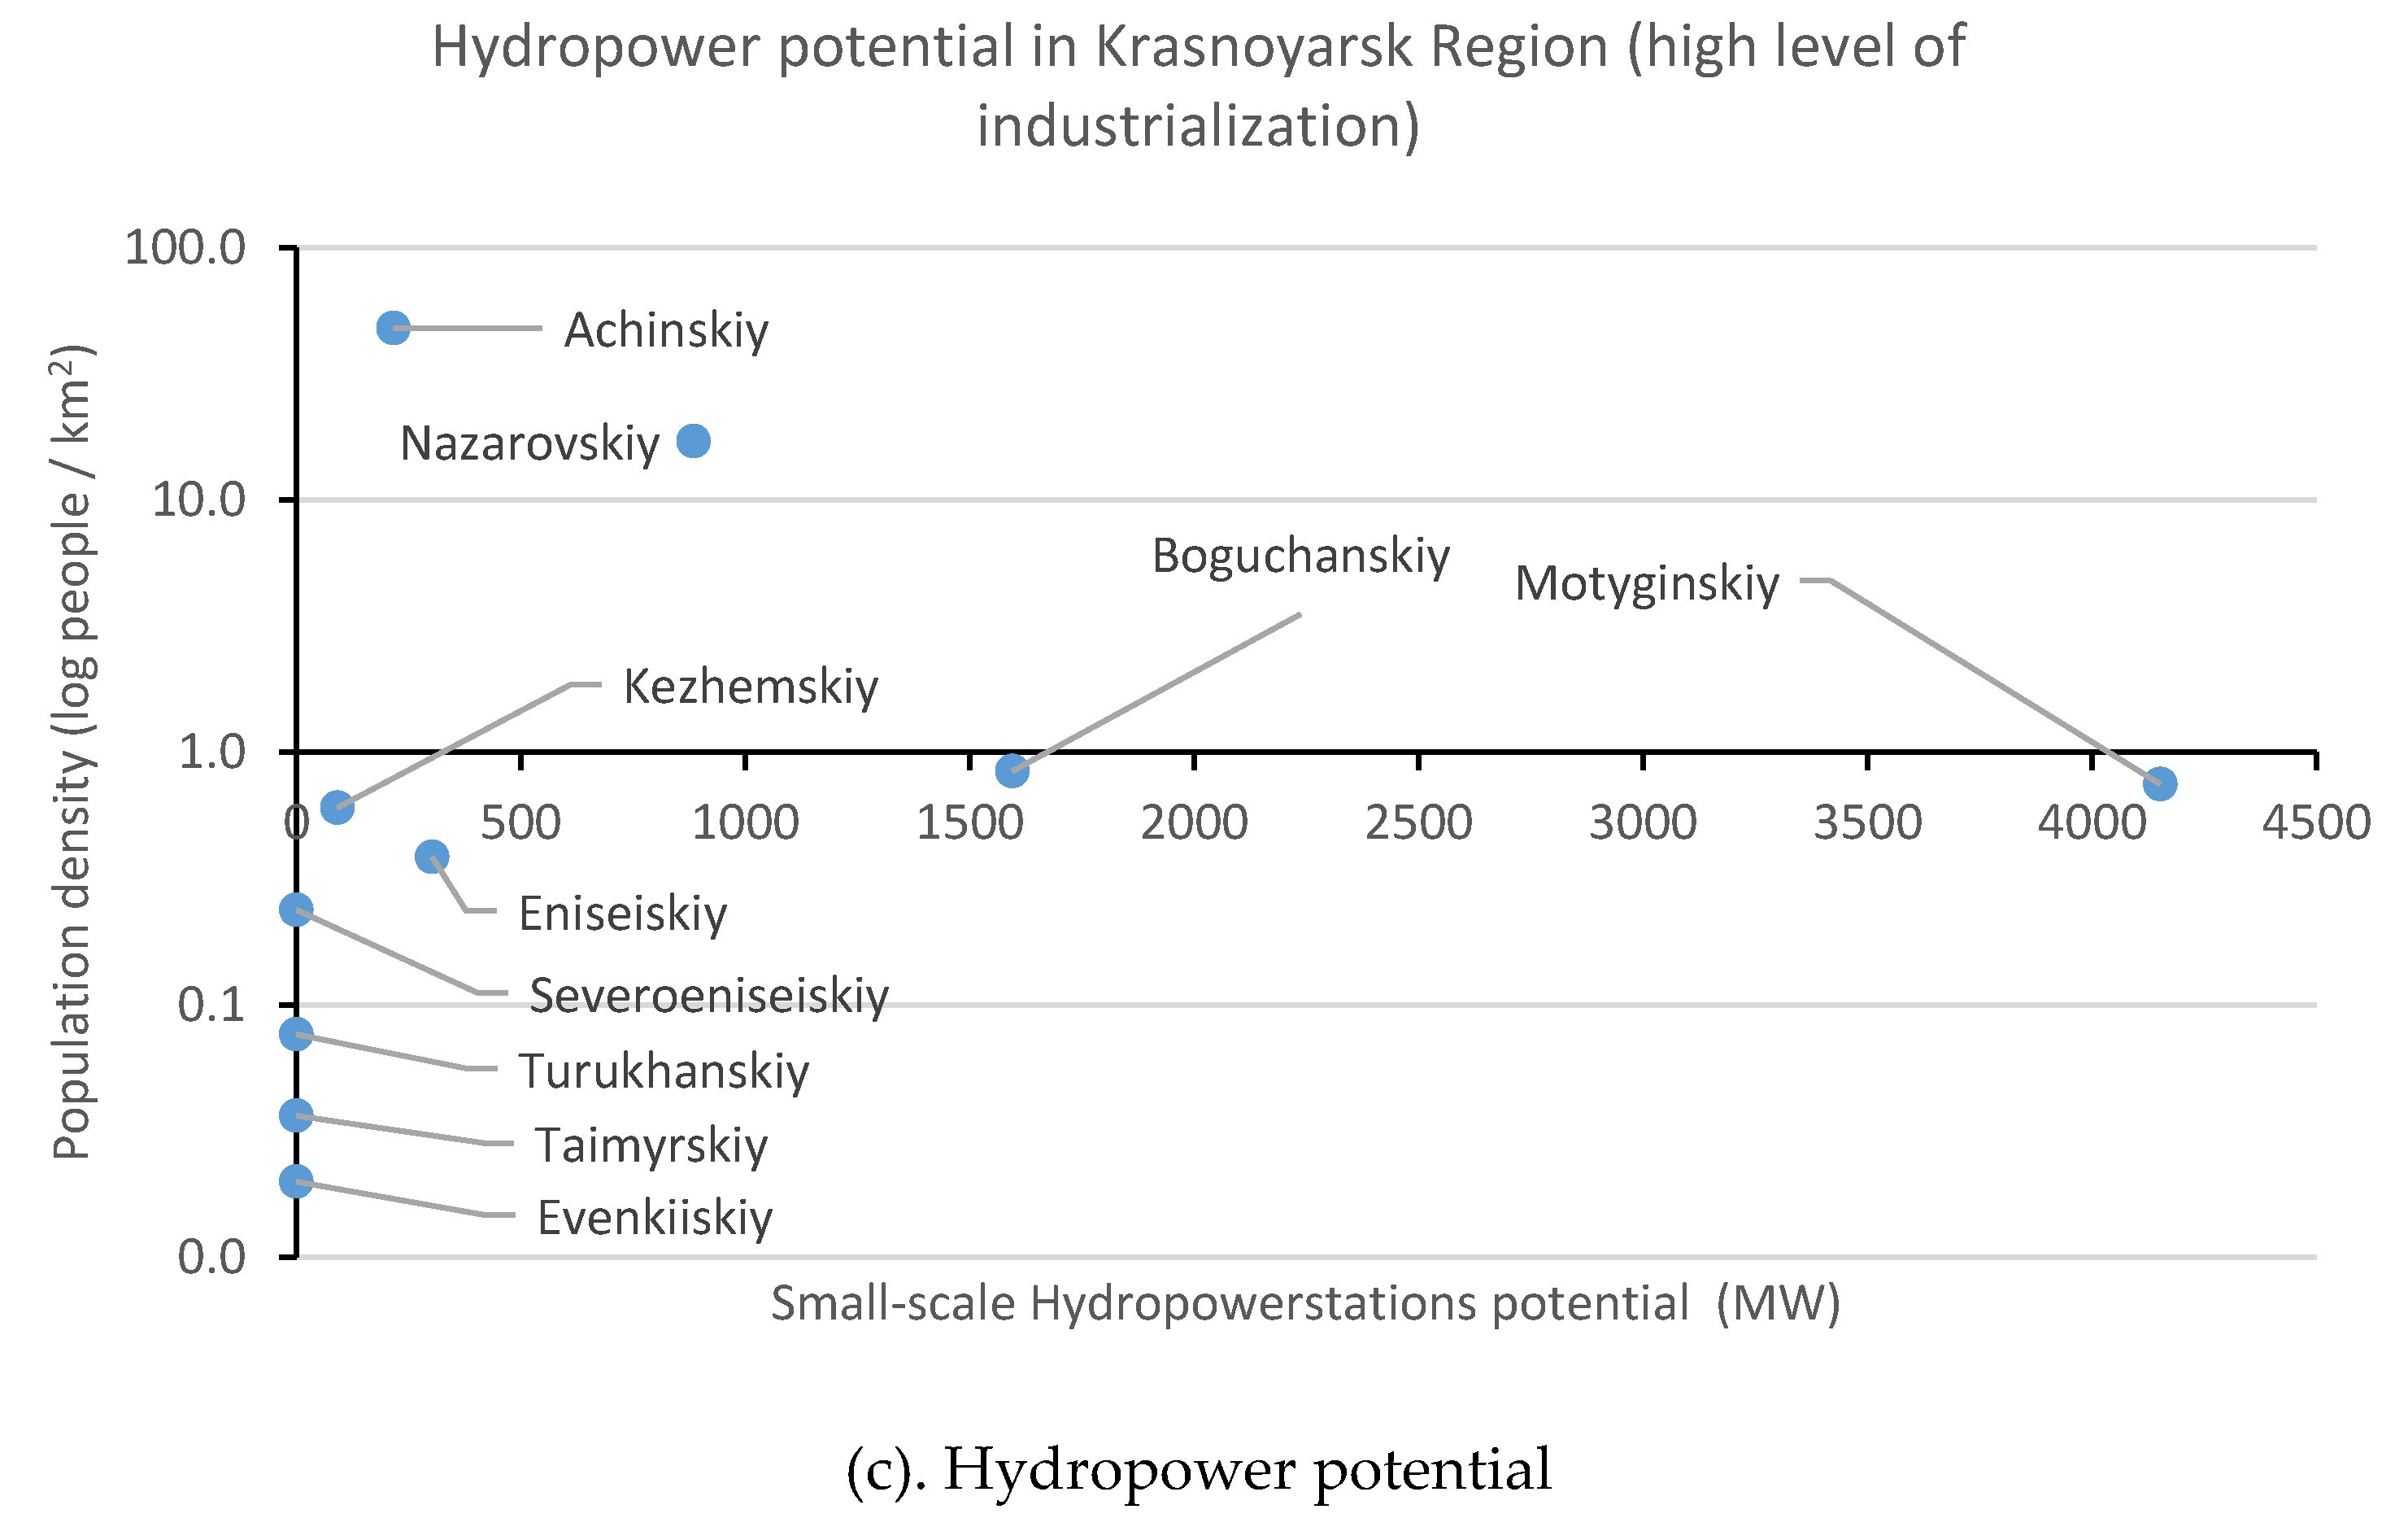
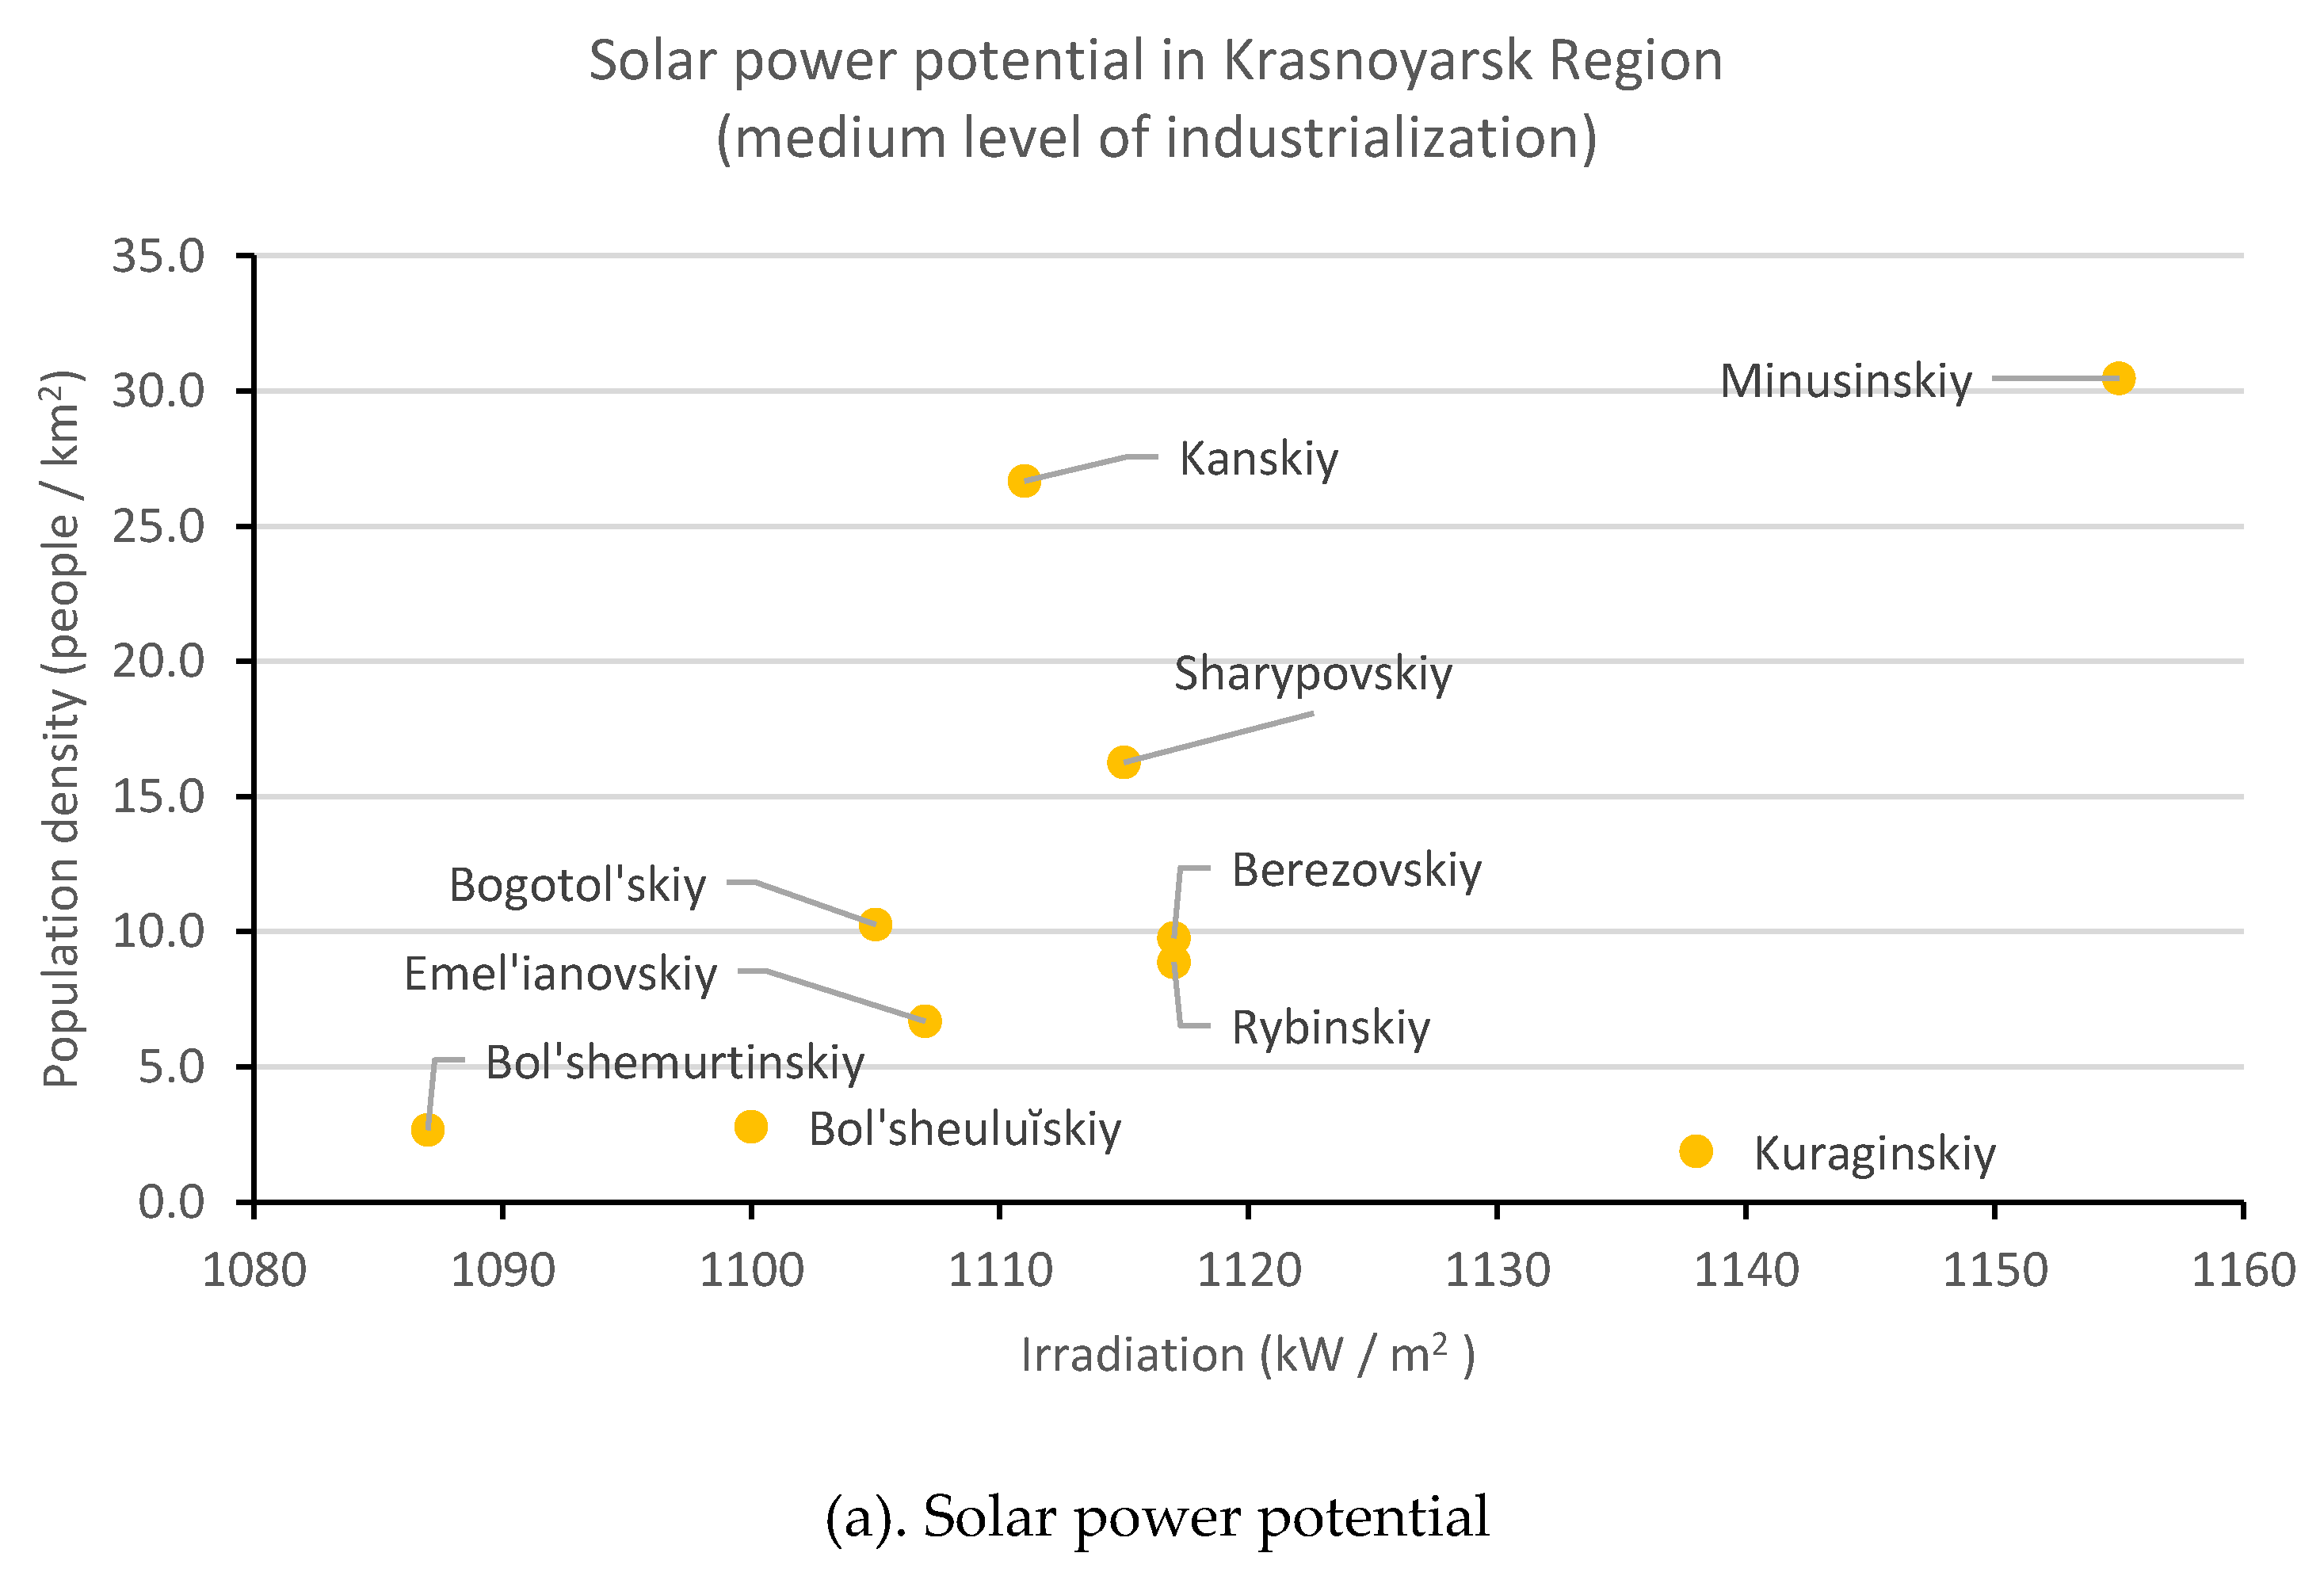
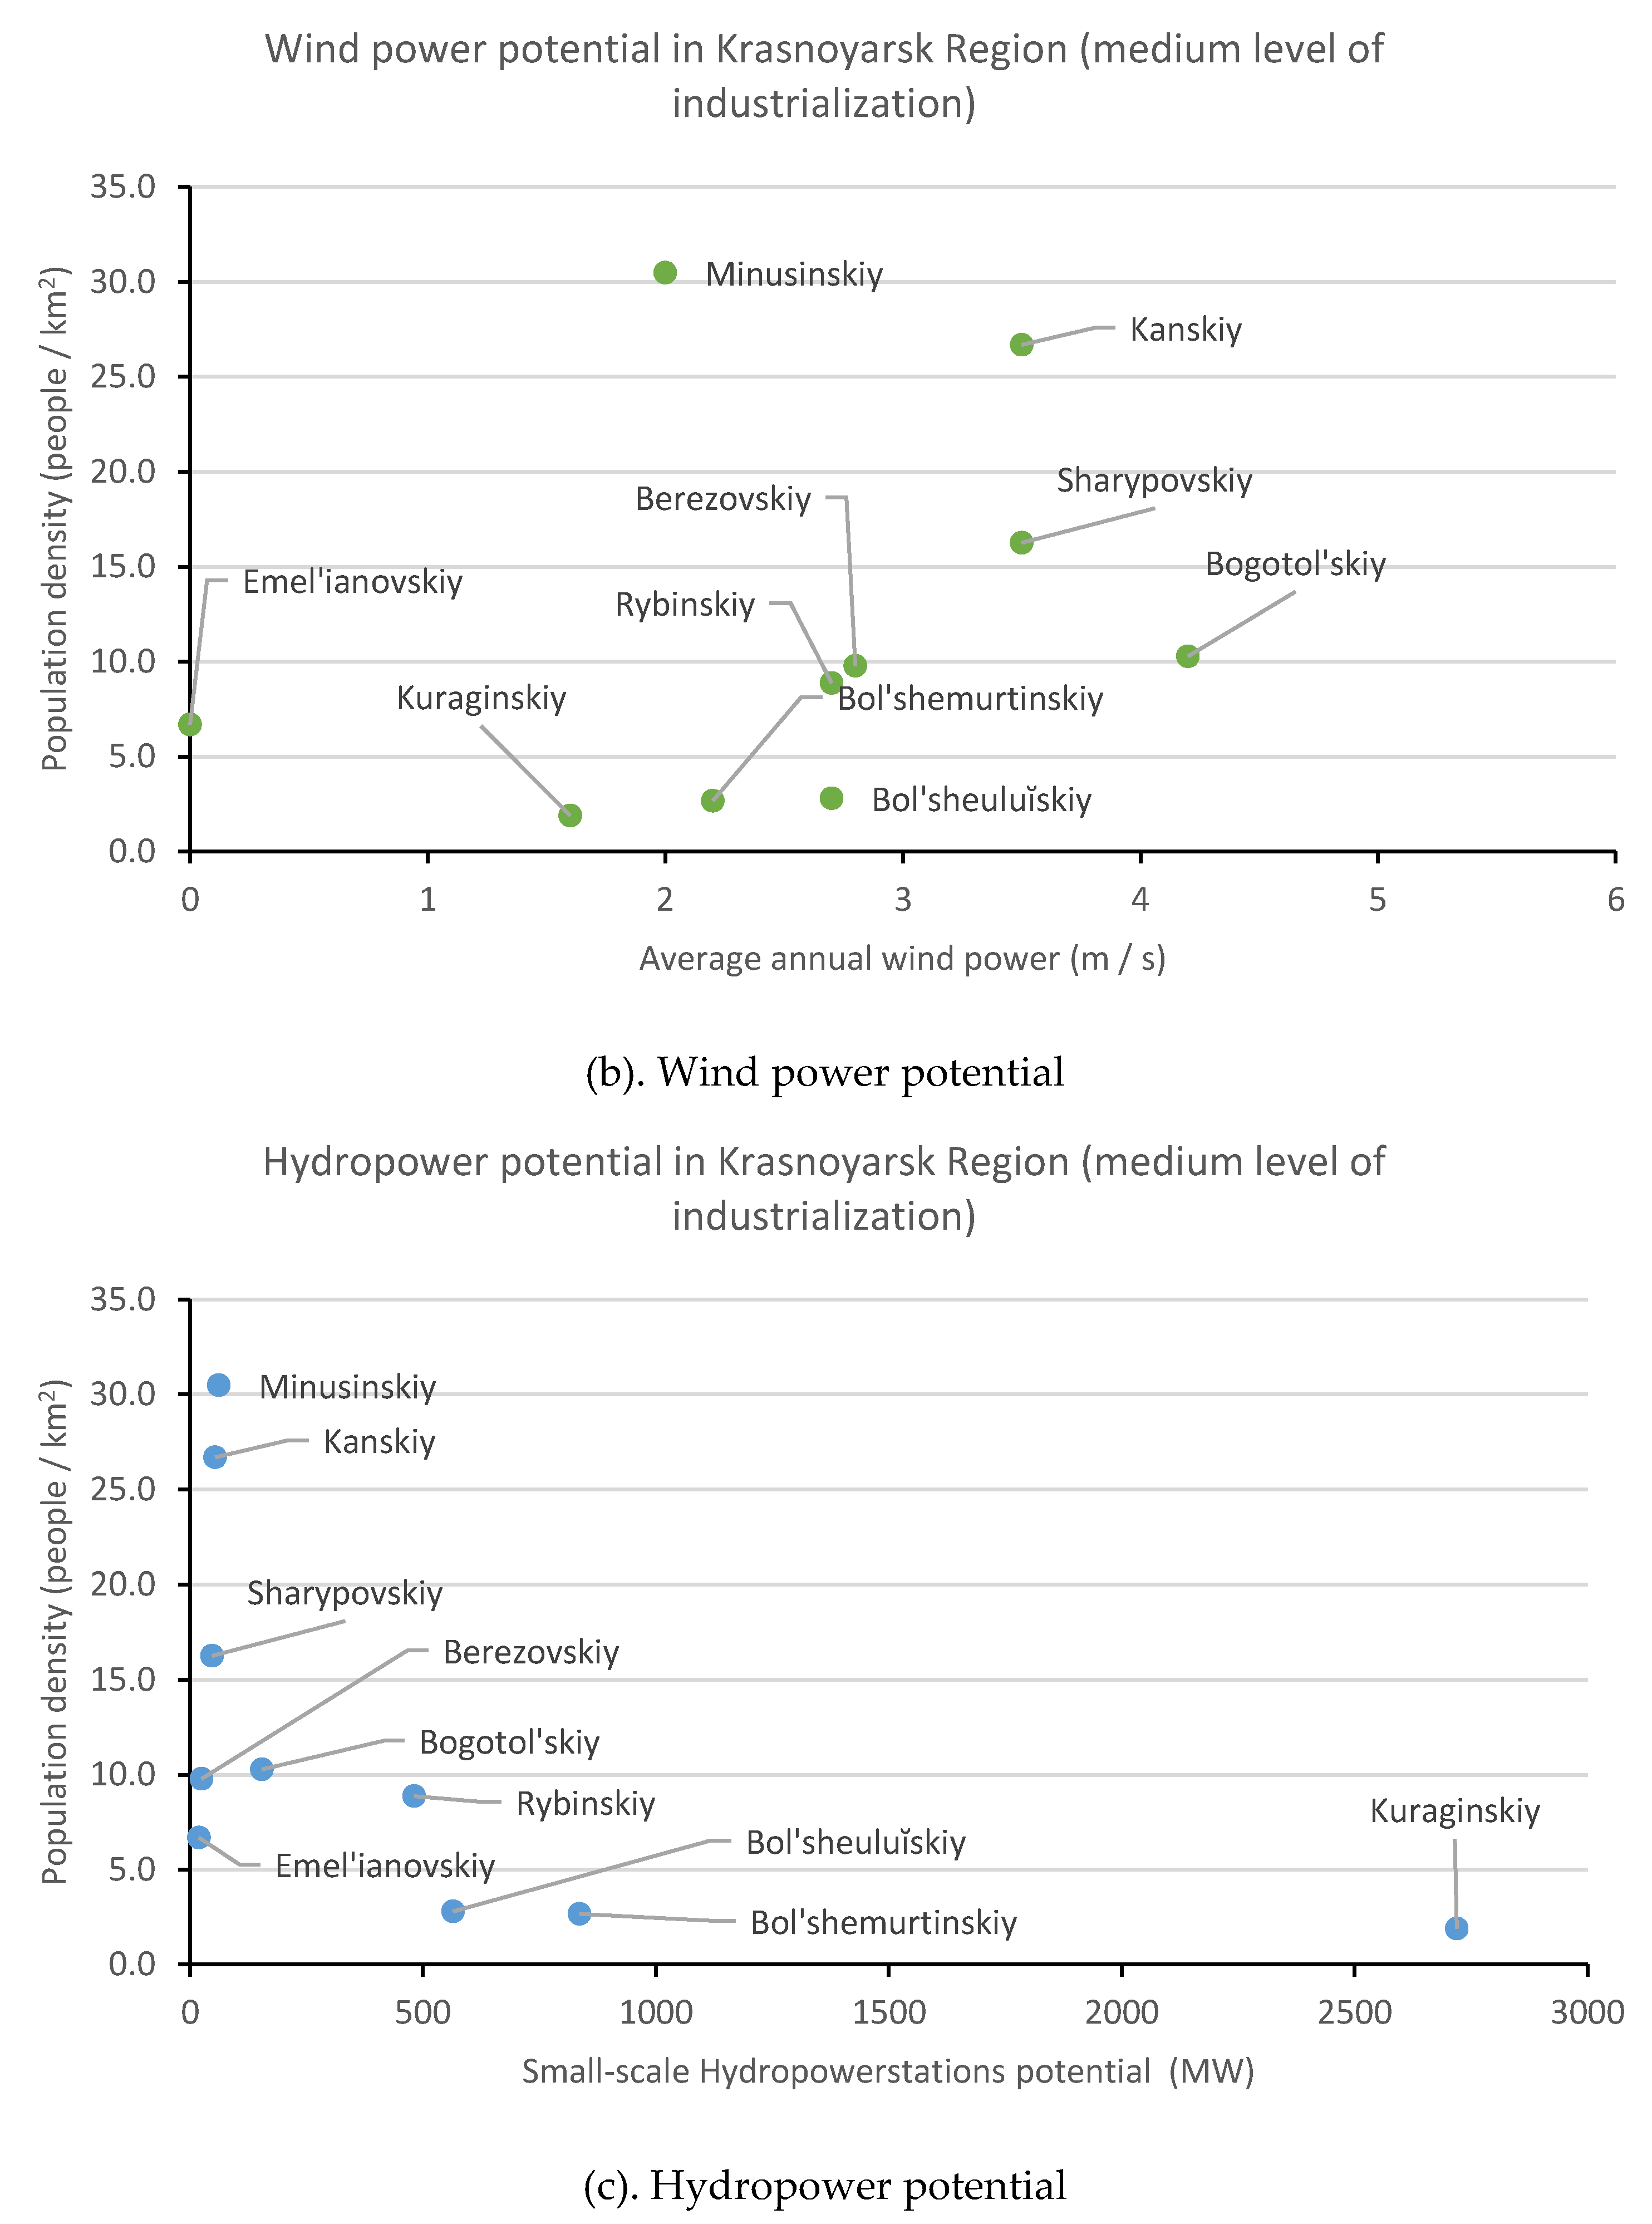
Further assessment of RES development in Krasnoyarsk Region will be conducted within the previously outlined groups: high, medium and low levels of industrialization (Figure 7, Figure 8 and Figure 9). Within each of these groups we determine the potential of RES by two measures:
- X-axis—potential of a source (solar: average annual irradiance (kW/m2); wind: average annual wind speed (m/s); small-scale hydro potential (MW))
Then, we supplement the results with data regarding full scale hydropower potential and nuclear power potential and design the resulting matrix.
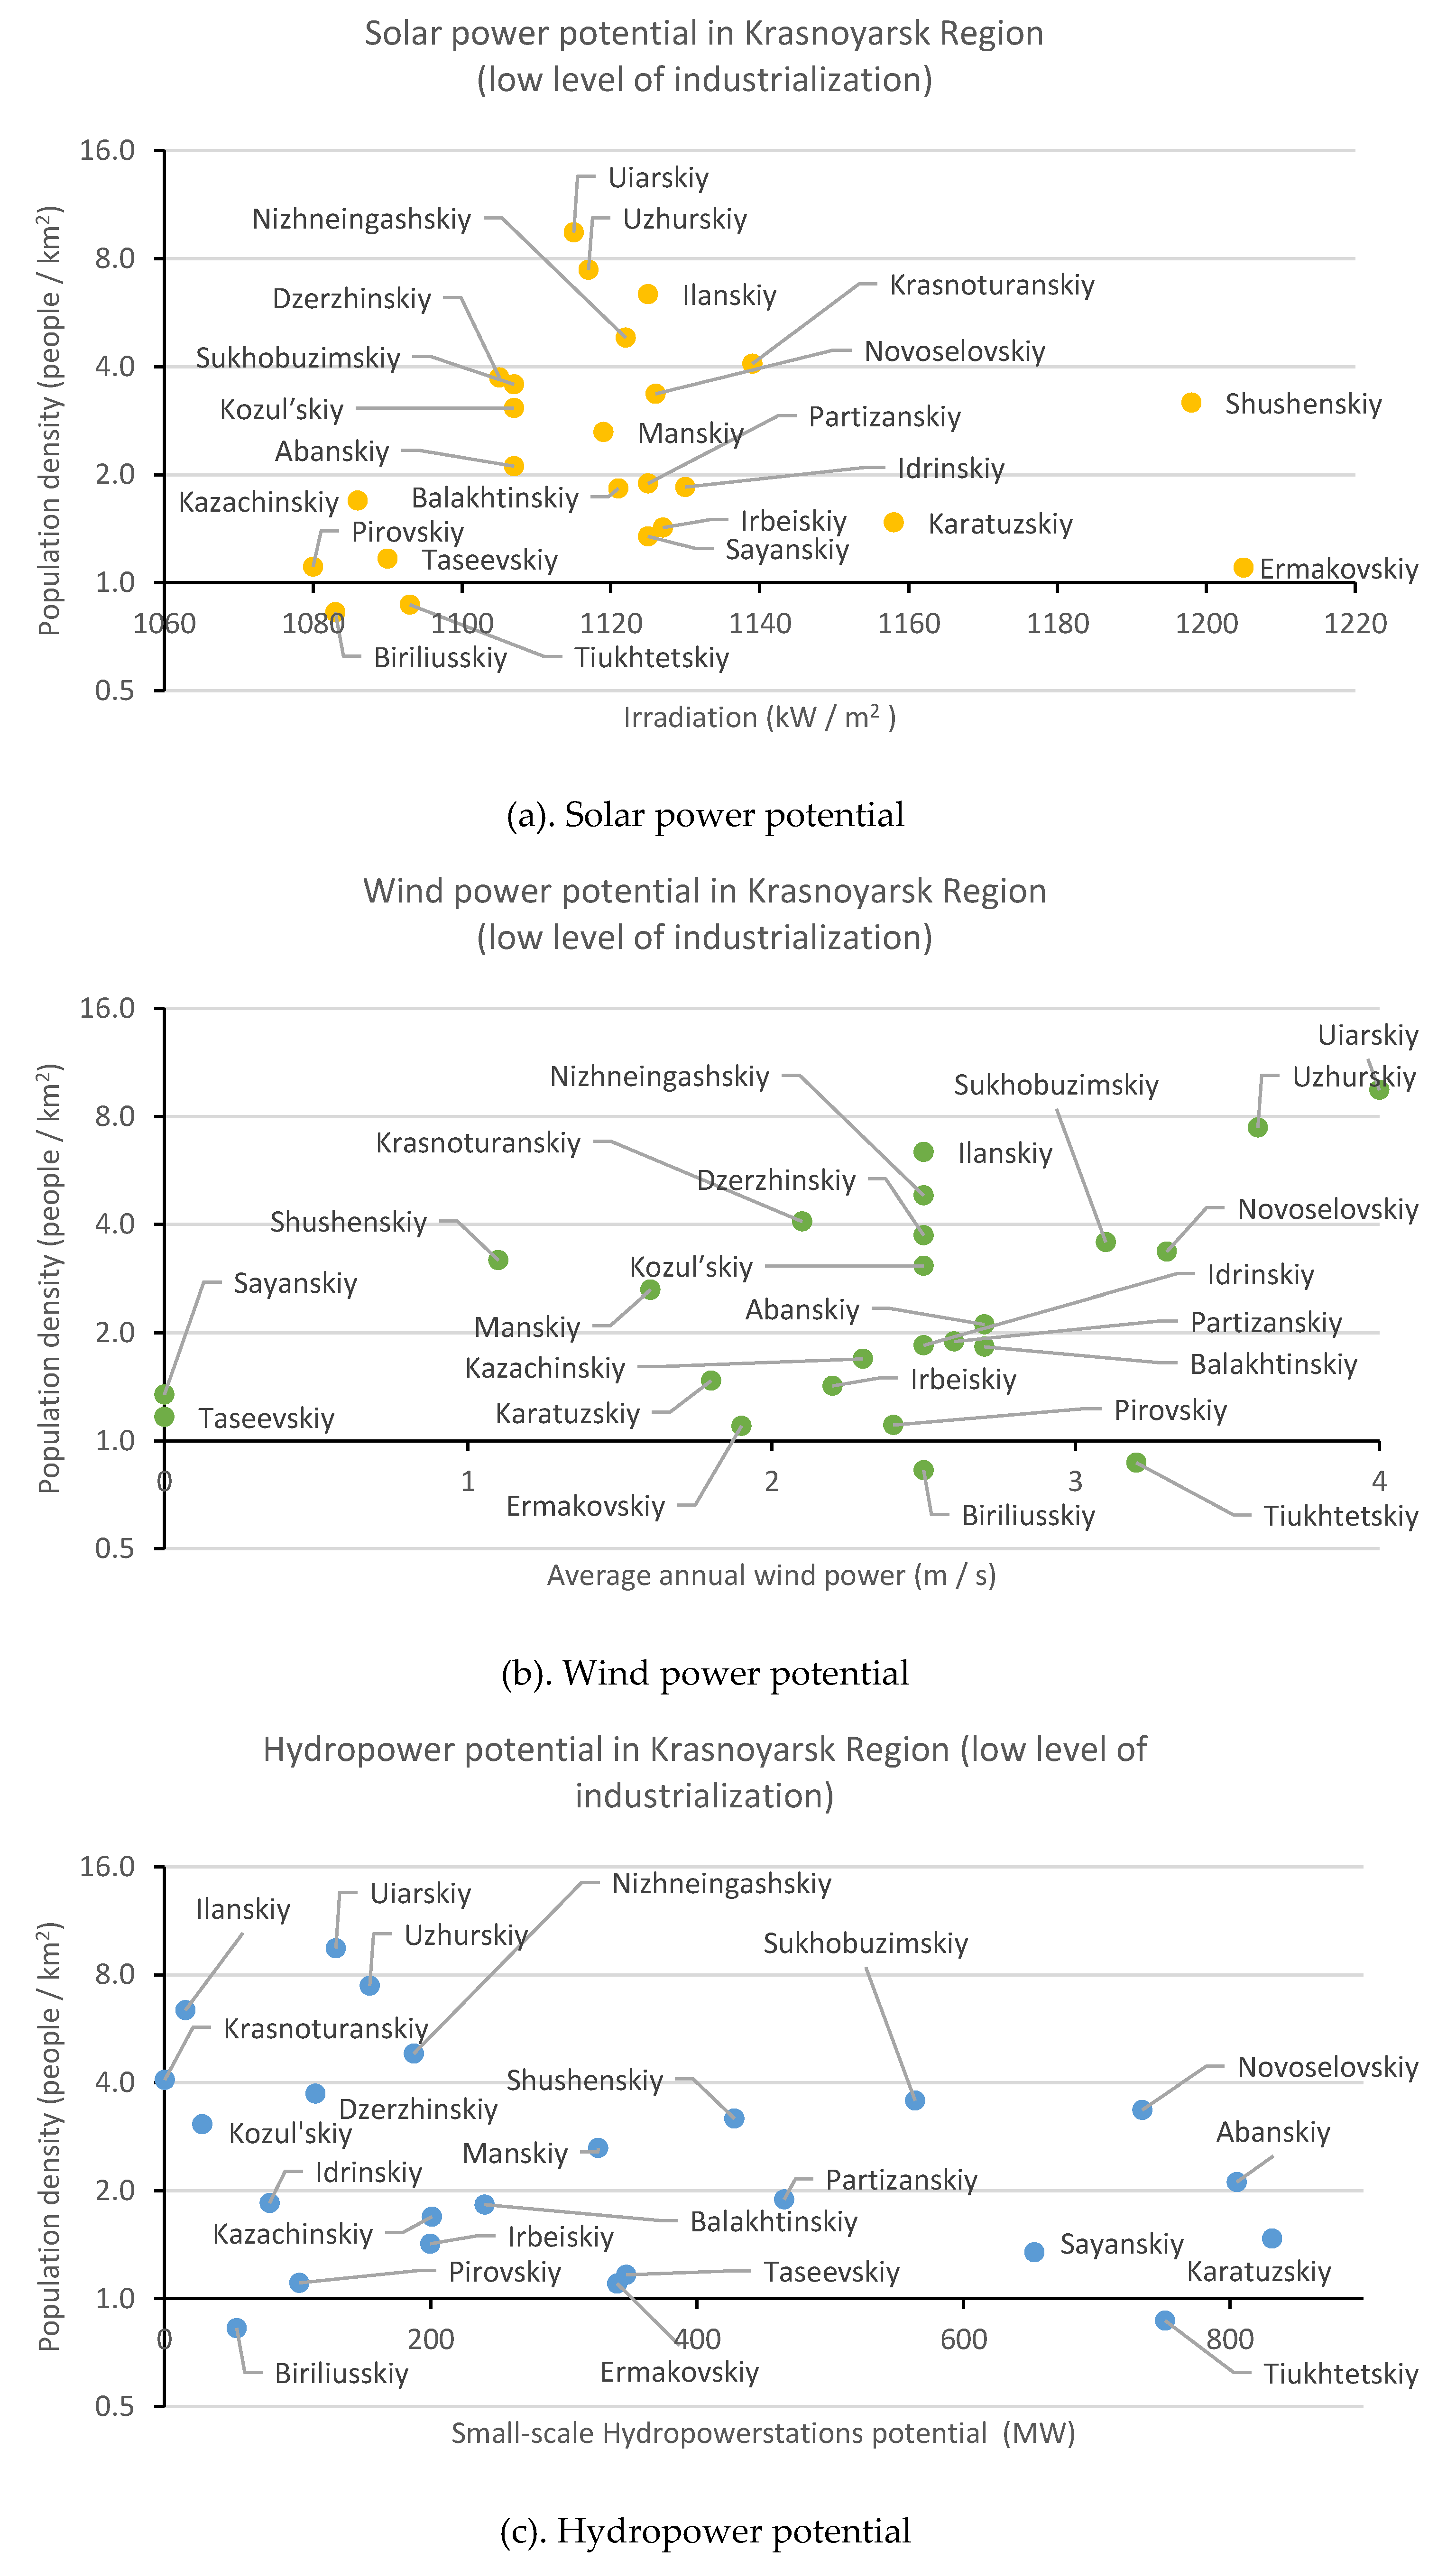
A combination of data regarding the potential of renewables (Figure 7, Figure 8 and Figure 9), as well as the current and potential generating facilities in the observed municipal entities, allows for the identification of those, mostly suitable for the development of RES (Figure 10).
The green zone of the matrix includes municipal entities that are suitable for the development of renewables as a primary source of energy: there is no heavy industry, while there are natural niches for the development of various renewables. Renewable energy sources have a high scalability potential; thus, they can be adapted to varying population density levels in the outlined entities. As we can see from the matrix, solar power seems to be a promising source in the vast majority of entities, but its maximum potential may be used in Sukhobuzimskiy, Shushenskiy, Nizhneingashskiy, Krasnoturanskiy, Kozulʹskiy, Manskiy, Dzerzhinskiy, Novoselovskiy, Abanskiy, Balakhtinskiy, Karatuzskiy, Sayanskiy, Irbeiskiy, Idrinskiy, Partizanskiy, Uzhurskiy, Uiarskiy and Ilanskiy territories. Wind resources are rather scarce in this group of entities and may be considered to be a supplemental source. Hydropower is present in selected areas, situated near the existing rivers of the region. Nuclear power does not have a significant potential in this group of areas.
The blue zone includes municipal entities, where renewables may be implemented as a complementary energy source, because of industrial demand for a reliable and stable energy supply from conventional generating facilities. Nevertheless, big natural niches of solar energy seem to be a promising avenue for the diversification of the existing single-source portfolio. Here RES can be also considered to be a solution for the environmental issues (this group of entities includes some of the most polluted ones) and can have a supplementary role for the existing conventional energy sources. It is also worth noting the noticeable importance of nuclear power—both higher population density and concentration of industrial facilities create sufficient demand.
The grey zone indicates the area least suitable for the RES—high level of industrialization does not allow for the development of nonconventional generation while low level of population density does not create enough demand from households. Moreover, existing natural niches are insufficient to fulfill the existing requirements of the industry located in the municipal entities from this group. Due to the high levels of air pollution in the entities within the grey zone, combined solutions for exploiting both the conventional and renewable energy sources have to be designed. For instance, wind has a high potential in Taimyrskiy municipal entity, which means that wind power stations can be constructed to diversify the energy portfolio of the territory. Motyginskiy, Boguchanskiy, Severoeniseiskiy, Eniseiskiy municipal entities have medium solar and hydropower potential; thus, solar and small-scale hydro stations can add up to the energy mix of these territories. The grey zone also comprises most of the northern territories of the Krasnoyarsk Region that are isolated from the United Power Grid; thus, the introduction of RES would provide these thinly populated territories with access to a more reliable, clean and cost-efficient energy supply if combined with the existing diesel power-stations.
The matrix outlines the structure of the possible energy mix in the observed municipal entities: whether renewables have the potential to become the primary or supplementary source of energy on a particular territory. This is particularly useful in the context that modern energy systems should be able to provide both flexibility and reliability. This is achievable through the simultaneous exploitation of different renewable energy sources within a hybrid system [90] as former are stochastic in their nature [8]. The results also indicate the following:
- Solar power has the highest potential to be implemented in the majority of thinly populated municipal entities of the Krasnoyarsk Region as a primary source of energy;
- Wind power has a potential to be implemented mostly as a supplemental source of energy in industrialized municipal entities;
- Nuclear power development may be considered in densely populated and industrialized municipal entities (in case if there would be no conflict with hydro);
- There are four municipal entities (Sukhobuzimskiy, Novoselovskiy, Uiarskiy and Tiukhtetskiy), where all three purely renewable (solar, wind and micro hydro) sources of energy may be implemented (upon the condition of no conflict among them);
Five municipal entities (Evenkiiskiy, Kezhemskiy, Biriliusskiy, Turukhanskiy, Pirovskiy) have the lowest potential of implementing clean energy sources.
4. Discussion
Generally, the obtained results clearly identify possible investment patterns as well as regional energy policy directions. While Krasnoyarsk Region seems to be a territory with a northern climate, the results revealed the actual potential of solar power in the region, which combined with other renewable sources of energy relevant to each municipal entity, outlines a solution for thinly populated, agricultural and remote areas. Both solar and wind power appear to be promising supplemental sources of energy for industrialized territories.
As for primary energy sources required for adequate industry development, there is a noticeable natural niche for hydro power in the region, especially in case if the withheld projects would be carried out (upon the condition of overcoming environmental concerns). There is also a significant potential to develop micro hydro power stations.
Thus, the resulting matrix identifies the potential of an energy source across all the municipal entities and outlines the structure of the possible energy mix in each entity. Our results indicate whether a definite source of energy is primary or supplemental and where several sources may be implemented in cooperation to ensure flexibility and reliability of the energy system. The novelty of our research lies in its holistic nature as distinguished from focused studies; thus, the results have a wide application in the view of energy transition in the Krasnoyarsk region.
Energy transition and its temporal dynamics is determined by different forces: a natural change in technology, a change in consumer demand or the introduction of incentives from government [91]. The introduction of renewables in many cases is impeded by social, technological, cultural, political and regulatory aspects concerning electricity use and supply [92]. The Russian government is developing new environmental policies and programmes with corresponding funding. The development of cleaner energy sources that were identified within the matrix in Figure 10 in the southern agricultural part of the Krasnoyarsk region may be encouraged through participating in these programmes.
The government is also planning to assign greenhouse gas limits in the nearest future (Krasnoyarsk is chosen as one of pilot territories to test the new policy) [93]. The northern industrial area in Norilsk-Taimyr industrial region may benefit from investing in cleaner energy sources (especially in wind energy as our results show) to decrease carbon emissions and also to decrease equity and corporate risks (for example, partners form countries with strict environmental limitations may reconsider partnerships). In this view, other large regional enterprises, such as LLC Siberian Generating Company, can potentially benefit in mid-term perspective from investing in cleaner energy sources.
Apart from quotas, new pricing policies and introducing feed-in tariffs, a transparent mechanism of public private partnership should provide incentives for investing in cleaner energy sources. In addition, ageing infrastructure (especially coal-fired power stations) and air pollution in the Krasnoyarsk region force the energy transition. Without introducing alternative to coal energy sources urban growth will contribute to further air pollution and environmental damage in the region. Aggravation of the ecological situation is expected even at the current levels of coal combustion due to climatic changes, such as the negative influence of the Siberian High on the scattering of contaminants [94].
Our results clearly show that there are alternatives for most of the municipal entities represented by either renewable (solar, wind and hydro) or nuclear power. Moreover, our results imply that apart from decarbonization and reducing environmental impact the introduction of cleaner energy sources in isolated territories has a potential for cost reduction due to the substitution of diesel power plants.
The obtained results provide practical guidance for regional policymakers who have on their agenda high levels of air pollution, dependence on coal-fired power stations and the necessity to provide a reliable supply of energy to remote areas. Also, the current investment passport of the region may be complemented with the matrix in order to attract private investors.
Within the existing studies on the implementation of RES, our research relates to those that are devoted to the assessment of renewable energy sources potential (both in terms of availability of different sources and appropriateness of their implementation) [13,19,95,96,97,98,99,100,101,102,103,104,105,106,107,108]. This group of studies may be considered to be a first step that allows understanding whether it is worth considering the implementation of RES at a given territory. Basing on the results of this stage it is then possible to define the portfolio of energy sources and solve the issues of interoperability between the conventional and renewable energy sources in a reliable and safely manner [109,110,111,112]. After that the questions of practical implementation (e.g., from the technical and economic points of view) and support from the government take their place [113,114,115,116]. Finally, the issues of the overall assessment of the success of decarbonization of the economy are considered in the literature [70,117,118,119].
Our research has a few possible limitations. First of all, the resulting matrix demonstrates the general picture and in each individual case a comprehensive analysis is required. Due to geographical reasons it should be understood that some renewable energy sources, especially solar power, have to be backed up by other sources of energy (in some regions solar power is relevant only from April to August, southward there are regions, where solar power is relevant from March to September, and only in several southern regions it is relevant throughout the whole year). In case if high capacity power stations are unavailable for some municipal entity (in isolated power systems), solar-diesel, solar-wind and wind-diesel options have to be implemented. The viability of the projects depends heavily on the possibility to attract significant investments for each project.
However, to the best of the authors knowledge this is the first attempt to measure the potential of clean energy sources in the Krasnoyarsk Region not only from technical (existing natural niches) or economic (payback periods of individual projects) points of view, but taking into consideration demographic factors, the presence of concentrated demand (heavy industry in the case of Krasnoyarsk Region) and the ecological situation (specifically air pollution) within the observed territories.
At the same time, there are several questions that need to be covered within the future research. First of all, it is crucial to address the issue of balancing distributed energy sources [8]. This may require restructuring the existing coordination mechanisms within the energy system, which was initially created based on predictable behavior of energy sources. Secondly, while implementing renewable energy sources seems to be a positive change, it is crucially to assess the system effects of such actions and calculate their long-term effect. For instance, the LEAP model [120] may be taken as a basis of such calculations. It may be worth taking into account a broader array of factors – economic and social factors, and their future dynamics as well. In addition, finally, while it is out of the scope of our research, in future the assessment of RES implementation may also require the calculations of their life-cycle effect within the given location [105,121]. The decisions of RES development should include both the effective management of available resources, minimization of the overall environmental impact and consideration of the local situation within the electricity sector [105].
Author Contributions
conceptualization, V.G., R.S. and I.V.; formal analysis and investigation, E.G. and Y.B.; data curation, M.R. and D.P.; writing—original draft preparation, E.G. and Y.B.; writing—review and editing, V.G., R.S. and I.V.; visualization, Y.B.; supervision, I.V.; funding acquisition, V.G. and I.V.
Funding
This research was funded by Russian Foundation for Basic Research, Government of Krasnoyarsk Territory, Krasnoyarsk Regional Fund of Science, to the research project: “Prognosis of region-specific responses of Siberian mountain forests to global environmental changes and of the landscape development trajectories for mitigation of environmental risks and an effective long-term planning in various economic sectors”, grant number 18-45-240001, and by Russian Foundation for Basic Research to the research project: “Lateholocene dynamics of Asia boreal forests at the background of changing geochemistry and climatic conditions”, grant number 19-05-00091.
Acknowledgments
This research was supported by the Basic Research Program of the National Research University Higher School of Economics in 2018 under the project no. 5 “Cooperation mechanisms of participants in smart grids. Practicing implementation of the results of fundamental research in the sphere of economy of Russian cities and agglomeration”. The authors acknowledge the contribution of Rosatom Public Council which supported us within the “Green Square” program.
Conflicts of Interest
The authors declare no conflict of interest.
References
- McKinsey. Global Energy Perspective 2019; McKinsey Solutions Sprl: New York, NY, USA, 2019. [Google Scholar]
- Clairand, J.-M.; Rodríguez-García, J.; Álvarez-Bel, C. Electric Vehicle Charging Strategy for Isolated Systems with High Penetration of Renewable Generation. Energies 2018, 11, 3188. [Google Scholar] [CrossRef]
- Labatt, S.; White, R. Carbon Finance: The Financial Implications of Climate Change; Wiley: Hoboken, NJ, USA, 2007; ISBN 0471794678. [Google Scholar]
- Geng, Z.; Conejo, A.J.; Chen, Q.; Xia, Q.; Kang, C. Electricity production scheduling under uncertainty: Max social welfare vs. min emission vs. max renewable production. Appl. Energy 2017, 193, 540–549. [Google Scholar] [CrossRef]
- Cucchiella, F.; D’Adamo, I.; Gastaldi, M. Future Trajectories of Renewable Energy Consumption in the European Union. Resources 2018, 7, 10. [Google Scholar] [CrossRef]
- Bocken, N.M.P.; Ritala, P.; Huotari, P. The Circular Economy: Exploring the Introduction of the Concept Among S&P 500 Firms. J. Ind. Ecol. 2017, 21, 487–490. [Google Scholar]
- IRENA. Renewable Power Generation Costs in 2017; IRENA: Abu Dhabi, United Arab Emirates, 2018. [Google Scholar]
- Osório, G.J.; Shafie-Khah, M.; Lotfi, M.; Ferreira-Silva, B.J.M.; Catalão, J.P.S. Demand-Side management of smart distribution grids incorporating renewable energy sources. Energies 2019, 12, 143. [Google Scholar] [CrossRef]
- IRENA. Electricity Storage and Renewables: Costs and Markets to 2030; IRENA: Abu Dhabi, United Arab Emirates, 2017. [Google Scholar]
- Prajapati, R.N. Delineation of Run of River Hydropower Potential of Karnali Basin- Nepal Using GIS and HEC-HMS. Eur. J. Adv. Eng. Technol. 2015, 2, 50–54. [Google Scholar]
- Grigoras, G.; Scarlatache, F. An assessment of the renewable energy potential using a clustering based data mining method. Case study in Romania. Energy 2015, 81, 416–429. [Google Scholar] [CrossRef]
- Angelis-Dimakis, A.; Biberacher, M.; Dominguez, J.; Fiorese, G.; Gadocha, S.; Gnansounou, E.; Guariso, G.; Kartalidis, A.; Panichelli, L.; Pinedo, I.; et al. Methods and tools to evaluate the availability of renewable energy sources. Renew. Sustain. Energy Rev. 2011, 15, 1182–1200. [Google Scholar] [CrossRef]
- Mondal, M.A.H.; Denich, M. Assessment of renewable energy resources potential for electricity generation in Bangladesh. Renew. Sustain. Energy Rev. 2010, 14, 2401–2413. [Google Scholar] [CrossRef]
- Ozturk, M.; Bezir, N.C.; Ozek, N. Hydropower-water and renewable energy in Turkey: Sources and policy. Renew. Sustain. Energy Rev. 2009, 13, 605–615. [Google Scholar] [CrossRef]
- Nguyen, K.Q. Wind energy in Vietnam: Resource assessment, development status and future implications. Energy Policy 2007, 35, 1405–1413. [Google Scholar] [CrossRef]
- Šúri, M.; Huld, T.A.; Dunlop, E.D.; Ossenbrink, H.A. Potential of solar electricity generation in the European Union member states and candidate countries. Sol. Energy 2007, 81, 1295–1305. [Google Scholar] [CrossRef]
- Yuksek, O.; Komurcu, M.I.; Yuksel, I.; Kaygusuz, K. The role of hydropower in meeting Turkey’s electric energy demand. Energy Policy 2006, 34, 3093–3103. [Google Scholar] [CrossRef]
- Kemal Ozturk, H.; Yilanci, A.; Atalay, O. Past, present and future status of electricity in Turkey and the share of energy sources. Renew. Sustain. Energy Rev. 2007, 11, 183–209. [Google Scholar] [CrossRef]
- Farooq, M.K.; Kumar, S. An assessment of renewable energy potential for electricity generation in Pakistan. Renew. Sustain. Energy Rev. 2013, 20, 240–254. [Google Scholar] [CrossRef]
- Hubert, T.; Vidalenc, E. Renewable electricity potentials in France: A long term Perspective. Energy Procedia 2012, 20, 247–257. [Google Scholar] [CrossRef]
- Verbruggen, A.; Fischedick, M.; Moomaw, W.; Weir, T.; Nadaï, A.; Nilsson, L.J.; Nyboer, J.; Sathaye, J. Renewable energy costs, potentials, barriers: Conceptual issues. Energy Policy 2010, 38, 850–861. [Google Scholar] [CrossRef]
- Fthenakis, V.; Mason, J.E.; Zweibel, K. The technical, geographical, and economic feasibility for solar energy to supply the energy needs of the US. Energy Policy 2009, 37, 387–399. [Google Scholar] [CrossRef]
- Hoogwijk, M.; Graus, W. Global Potential of Renewable Energy Sources: A literature Assessment. Background Report Prepared by Order of REN21; Ecofys: Utrecht, Netherlands, 2008. [Google Scholar]
- De Vries, B.J.M.; van Vuuren, D.P.; Hoogwijk, M.M. Renewable energy sources: Their global potential for the first-half of the 21st century at a global level: An integrated approach. Energy Policy 2007, 35, 2590–2610. [Google Scholar] [CrossRef]
- Hoogwijk, M.M. On the Global and Regional Potential of Renewable Energy Sources; Proefschrift Universiteit Utrecht: Utrecht, Netherlands, 2004; ISBN 9039336407. [Google Scholar]
- Kucukali, S.; Baris, K. Assessment of small hydropower (SHP) development in Turkey: Laws, regulations and EU policy perspective. Energy Policy 2009, 37, 3872–3879. [Google Scholar] [CrossRef]
- Yue, C.D.; Wang, S.S. GIS-based evaluation of multifarious local renewable energy sources: A case study of the Chigu area of southwestern Taiwan. Energy Policy 2006, 34, 730–742. [Google Scholar] [CrossRef]
- Molodtsov, S. Current State and Prospects of Renewable Energy Technology in Russia. In Renewable Energies for Central Asia Countries: Economic, Environmental and Social Impacts; Springer: New York, NY, USA, 2006; pp. 123–129. [Google Scholar]
- Cherepovitsyn, A.; Tcvetkov, P. Overview of the prospects for developing a renewable energy in Russia. In Proceedings of the 2017 International Conference on Green Energy and Applications (ICGEA 2017), Singapore, 25–27 March 2017; pp. 113–117. [Google Scholar]
- Amerkanov, R.; Kirichenko, E.; Armaganyan, E.; Dvorniy, V. Problems of Renewable Energy Sources Application. Tech. Opponent 2018, 46, 46–53. [Google Scholar]
- Daus, Y.V.; Kharchenko, V.V.; Yudaev, I.V. Evaluation of solar radiation intensity for the territory of the Southern Federal District of Russia when designing microgrids based on renewable energy sources. Appl. Sol. Energy 2016, 52, 151–156. [Google Scholar] [CrossRef]
- Izadyar, N.; Ong, H.C.; Chong, W.T.; Leong, K.Y. Resource assessment of the renewable energy potential for a remote area: A review. Renew. Sustain. Energy Rev. 2016, 62, 908–923. [Google Scholar] [CrossRef]
- Stougie, L.; Tsalidis, G.; van der Kooi, H.J.; Korevaar, G. Environmental, economic and exergetic sustainability assessment of power generation from fossil and renewable energy sources. Renew. Energy 2018, 128, 520–528. [Google Scholar] [CrossRef]
- Ellabban, O.; Abu-Rub, H.; Blaabjerg, F. Renewable energy resources: Current status, future prospects and their enabling technology. Renew. Sustain. Energy Rev. 2014, 39, 748–764. [Google Scholar] [CrossRef]
- Greiner, A.; Grüne, L.; Semmler, W. Economic growth and the transition from non-renewable to renewable energy. Environ. Dev. Econ. 2014, 19, 417–439. [Google Scholar] [CrossRef]
- Connolly, D.; Lund, H.; Mathiesen, B.V. Smart Energy Europe: The technical and economic impact of one potential 100% renewable energy scenario for the European Union. Renew. Sustain. Energy Rev. 2016, 60, 1634–1653. [Google Scholar] [CrossRef]
- Ermolenko, B.V.; Ermolenko, G.V.; Fetisova, Y.A.; Proskuryakova, L.N. Wind and solar PV technical potentials: Measurement methodology and assessments for Russia. Energy 2017, 137, 1001–1012. [Google Scholar] [CrossRef]
- Lombardi, P.; Sokolnikova, T.; Suslov, K.; Voropai, N.; Styczynski, Z.A. Isolated power system in Russia: A chance for renewable energies? Renew. Energy 2016, 90, 532–541. [Google Scholar] [CrossRef]
- Elistratov, V.; Kudryasheva, I. Methodology for parameters selection and evaluation the effectiveness of decentralized energy supply systems based on renewable energy sources. ARPN J. Eng. Appl. Sci. 2016, 11, 3509–3512. [Google Scholar]
- IREA. Renewable Energy Prospects for the Russian Federation; IRENA: Abu Dhabi, United Arab Emirates, 2017. [Google Scholar]
- IRENA. China 13th Renewable Energy Development Five Year Plan (2016–2020). Available online: https://www.iea.org/policiesandmeasures/pams/china/name-161254-en.php?s=dHlwZT1yZSZzdGF0dXM9T2s,&return=PG5hdiBpZD0iYnJlYWRjcnVtYiI-PGEgaHJlZj0iLyI-SG9tZTwvYT4gJnJhcXVvOyA8YSBocmVmPSIvcG9saWNpZXNhbmRtZWFzdXJlcy8iPlBvbGljaWVzIGFuZCBNZWFzdXJlczwvYT4gJnJhcXV (accessed on 28 August 2018).
- Brook, B.W.; Bradshaw, C.J.A. Key role for nuclear energy in global biodiversity conservation. Conserv. Biol. 2015, 29, 702–712. [Google Scholar] [CrossRef] [PubMed]
- Dincer, I.; Acar, C. A review on clean energy solutions for better sustainability. Int. J. Energy Res. 2015, 39, 585–606. [Google Scholar] [CrossRef]
- Gasparatos, A.; Doll, C.N.H.; Esteban, M.; Ahmed, A.; Olang, T.A. Renewable energy and biodiversity: Implications for transitioning to a Green Economy. Renew. Sustain. Energy Rev. 2017, 70, 161–184. [Google Scholar] [CrossRef]
- Heard, B.P.; Brook, B.W.; Wigley, T.M.L.; Bradshaw, C.J.A. Supplementary material: Burden of proof: A comprehensive review of the feasibility of 100% renewable-electricity systems. Renew. Sustain. Energy Rev. 2017, 76, 1122–1133. [Google Scholar] [CrossRef]
- Hong, S.; Bradshaw, C.J.A.; Brook, B.W. Global zero-carbon energy pathways using viable mixes of nuclear and renewables. Appl. Energy 2015, 143, 451–459. [Google Scholar] [CrossRef]
- Santanglei, A.; Toivonen, T.; Pouzols, F.M.; Pogson, M.; Hastings, A.; Smith, P.; Moilanen, A. Global change synergies and trade-offs between renewable energy and biodiversity. GCB Bioenergy 2016, 8, 941–951. [Google Scholar] [CrossRef]
- Bilgili, M.; Ozbek, A.; Sahin, B.; Kahraman, A. An overview of renewable electric power capacity and progress in new technologies in the world. Renew. Sustain. Energy Rev. 2015, 49, 323–334. [Google Scholar] [CrossRef]
- Garcia-Diaz, B.L.; Olson, L.; Martinez-Rodriguez, M.; Fuentes, R.; Colon-Mercado, H.; Gray, J. High temperature electrochemical engineering and clean energy systems. J. S. C. Acad. Sci. 2016, 14, 4. [Google Scholar]
- Krasnoyarsk Region Housing and Public Utilities Investments to the Renewable Energy. Available online: http://gkh24.ru/pages/view/61 (accessed on 25 August 2018). (In Russian).
- Krasnoyarsk Region Official Web-site. Available online: http://www.krskstate.ru/about (accessed on 25 August 2018). (In Russian).
- Russian Ministry of Energy. Major Characteristics of Russian Power Sector. Available online: https://minenergo.gov.ru/node/532 (accessed on 25 August 2018). (In Russian)
- Analytical Center for the Government of the Russian Federation. Russian Energy 2015; Analytical Center for the Government of the Russian Federation: Moscow, Russia, 2015.
- Koptseva, N.; Sitnikova, A. Environmental Management in Central Siberia (Based on Analysis of the Krasnoyarsk Territory). IOP Conf. Ser. Earth Environ. Sci. 2018, 164, 012020. [Google Scholar] [CrossRef]
- Gorbacheva, N.V.; Sovacool, B.K. Pain without gain? Reviewing the risks and rewards of investing in Russian coal-fired electricity. Appl. Energy 2015, 154, 970–986. [Google Scholar] [CrossRef]
- Ministry of Natural Resources of Russian Federation. Report on the Environmental Condition and Control in Russian Federation in 2016; Ministry of Natural Resources of Russian Federation: Moscow, Russia, 2017.
- IEA. Russia 2014. Energy Policies beyond IEA Countries; IEA: Paris, France, 2014. [Google Scholar]
- Huang, K.; Fu, J.S.; Prikhodko, V.Y.; Storey, J.M.; Romanov, A.; Hodson, E.L.; Cresko, J.; Morozova, I.; Ignatieva, Y.; Cabaniss, J. Russian anthropogenic black carbon: Emission reconstruction and arctic black carbon simulation. J. Geophys. Res. 2015, 120, 306–333. [Google Scholar] [CrossRef]
- Klimatskaya, L. Chemical pollution of environment in the cities of Central Siberia: Risk for the health of the population. Med. Środowiskowa Environ. Med. 2015, 18, 12–17. [Google Scholar]
- The Institute of Natural Monopolies. Research Relevancy and Perspectives of Coal Generation Facilities’ Modernization. Available online: http://www.ipem.ru/research/power/power_presentations/172.html (accessed on 25 August 2018). (In Russian).
- President of Russia. Meeting on the Environmental Situation in the Krasnoyarsk Territory. Available online: http://en.kremlin.ru/events/president/news/56816 (accessed on 25 August 2018). (In Russian).
- Gazrom. Over 28,000 Kilometers of Gas Pipelines Built by Gazprom under Gasification Program Since 2005. Gazrom, 29 November 2017. [Google Scholar]
- Krasnoyarsk Region Official Web-Site. Krasnoyarsk Region Started the Development of Gasification Program for Housing and Utility Sector. Available online: http://www.krskstate.ru/press/news/0/news/88437 (accessed on 25 August 2018). (In Russian).
- Wigley, T.M.L. Coal to gas: The influence of methane leakage. Clim. Chang. 2011, 108, 601–608. [Google Scholar] [CrossRef]
- Hayhoe, K.; Kheshgi, H.S.; Jain, A.K.; Wuebbles, D.J. Substitution of natural gas for coal: Climatic effects of utility sector emissions. Clim. Chang. 2002, 54, 107–139. [Google Scholar] [CrossRef]
- Alvarez, R.A.; Pacala, S.W.; Winebrake, J.J.; Chameides, W.L.; Hamburg, S.P. Greater focus needed on methane leakage from natural gas infrastructure. Proc. Natl. Acad. Sci. USA 2012, 109, 6435–6440. [Google Scholar] [CrossRef]
- Howarth, R.W. A bridge to nowhere: Methane emissions and the greenhouse gas footprint of natural gas. Energy Sci. Eng. 2014, 2, 47–60. [Google Scholar] [CrossRef]
- Zhang, X.; Myhrvold, N.P.; Caldeira, K. Key factors for assessing climate benefits of natural gas versus coal electricity generation. Environ. Res. Lett. 2014, 9, 114022. [Google Scholar] [CrossRef]
- Ohlan, R. The impact of population density, energy consumption, economic growth and trade openness on CO2 emissions in India. Nat. Hazards 2015, 79, 1409–1428. [Google Scholar] [CrossRef]
- Liu, Y.; Zhou, Y.; Wu, W. Assessing the impact of population, income and technology on energy consumption and industrial pollutant emissions in China. Appl. Energy 2015, 155, 904–917. [Google Scholar] [CrossRef]
- Liddle, B. Impact of population, age structure, and urbanization on carbon emissions/energy consumption: Evidence from macro-level, cross-country analyses. Popul. Environ. 2014, 35, 286–304. [Google Scholar] [CrossRef]
- Shahbaz, M.; Loganathan, N.; Sbia, R.; Afza, T. The effect of urbanization, affluence and trade openness on energy consumption: A time series analysis in Malaysia. Renew. Sustain. Energy Rev. 2015, 47, 683–693. [Google Scholar] [CrossRef]
- Saidi, K.; Hammami, S. The impact of CO2 emissions and economic growth on energy consumption in 58 countries. Energy Rep. 2015, 1, 62–70. [Google Scholar] [CrossRef]
- Krasnoyarsk Region Official Web-site. Municipal Entities of Krasnoyarsk Region. Available online: http://www.krskstate.ru/about/kray/mun (accessed on 25 August 2018). (In Russian).
- Krasstat. Krasnoyarsk Regional Statistical Annual Report 2018. Section 25.1 “Population Density”; Krasstat: Krasnoyarsk, Russia, 2018. [Google Scholar]
- Krasstat. Krasnoyarsk Regional Statistical Annual Report 2018. Section 25.14 “Volume of Shipped Goods of Own Production, Insource Performed Works and Services by Actual Types of Economic Activity”; Krasstat: Krasnoyarsk, Russia, 2018. [Google Scholar]
- Federal Service for Hydrometeorology and Environmental Monitoring. List of the Cities with the Highest Air Pollution Level; Federal Service for Hydrometeorology and Environmental Monitoring: Moscow, Russia, 2017.
- Krasstat. Krasnoyarskstat Database for Indicators of Municipal Entities of Krasnoyarks Region. Available online: http://www.krasstat.gks.ru/wps/wcm/connect/rosstat_ts/krasstat/ru/municipal_statistics /krsnMstat/ (accessed on 25 August 2018). (In Russian).
- World Energy Council. World Energy Resources Hydropower 2016; World Energy Council: London, UK, 2016. [Google Scholar]
- International Hydropower Association. Russia Statistics. Available online: https://www.hydropower.org/country-profiles/russia (accessed on 25 August 2018). (In Russian).
- Sidorenko, A. Priorities and Pathways in Services Reform—Part II; Findlay, C., Ed.; University of Adelaide: Adelaide, Australia, 2013. [Google Scholar]
- Government of the Russian Federation. Decree from June 9, 2017 #1209-r; Government of the Russian Federation: Moscow, Russia, 2017.
- LLC Geola. Motyginskaya Hydro Power Station on the River Angara Feasibility Study; LLC Geola: Krasnoyarsk, Russia, 2009. [Google Scholar]
- Anaya, J. Report of the Special Rapporteur on the Situation of Human Rights and Fundamental Freedoms of Indigenous People; UN Human Rights Council: Geneva, Switzerland, 2010. [Google Scholar]
- Rushydro Turuhanskaya Hydro Power Station. Available online: http://www.lhp.rushydro.ru/company/objectsmap/5744.html (accessed on 25 August 2018). (In Russian).
- Rushydro Nizhne-Kureiskaya Hydro Power Station. Available online: http://www.rushydro.ru/nkges/ (accessed on 25 August 2018). (In Russian).
- JSC «PA ECP» The Joint Stock Company “Production Association “Electrochemical Plant”. Available online: http://www.ecp.ru/eng/ (accessed on 25 August 2018). (In Russian).
- Federal Nuclear Organization Federal State Unitary Enterprise “Mining and Chemical Combine”. Available online: https://sibghk.ru (accessed on 25 August 2018). (In Russian).
- Vasileva, Z.; Likhacheva, T.; Globa, S. The Industrial Development Strategy of Krasnoyarsk Krai: Challenges and Actors of Development. J. Sib. Fed. Univ. Humanit. Soc. Sci. 2016, 11, 2582–2591. [Google Scholar] [CrossRef]
- Deshmukh, M.; Deshmukh, S. Modeling of hybrid renewable energy systems. Renew. Sustain. Energy Rev. 2008, 12, 235–249. [Google Scholar] [CrossRef]
- Sovacool, B.K. How long will it take? Conceptualizing the temporal dynamics of energy transitions. Energy Res. Soc. Sci. 2016, 13, 202–215. [Google Scholar] [CrossRef]
- Sovacool, B.K. Rejecting renewables: The socio-technical impediments to renewable electricity in the United States. Energy Policy 2009, 37, 4500–4513. [Google Scholar] [CrossRef]
- Russian Gazette. The draft law on quotas of emissions to the atmosphere has been submitted to the government. Available online: https://rg.ru/2019/02/22/zakonoproekt-o-kvotirovanii-vybrosov-v-atmosferu-vnesen-v-pravitelstvo.html (accessed on 25 August 2018). (In Russian).
- Jeong, J.H.; Ou, T.; Linderholm, H.W.; Kim, B.M.; Kim, S.J.; Kug, J.S.; Chen, D. Recent recovery of the Siberian High intensity. J. Geophys. Res. Atmos. 2011, 116. [Google Scholar] [CrossRef]
- Mas’ud, A.A.; Wirba, A.V.; Muhammad-Sukki, F.; Mas’ud, I.A.; Munir, A.B.; Yunus, N.M. An assessment of renewable energy readiness in Africa: Case study of Nigeria and Cameroon. Renew. Sustain. Energy Rev. 2015, 51, 775–784. [Google Scholar] [CrossRef]
- Abdullah, A.; Wagner, N.; Gielen, D.; Griffiths, S.; Reinisch, H.; McQueen, D.; Sgouridis, S.; Saygin, D. RE-mapping the UAE’s energy transition: An economy-wide assessment of renewable energy options and their policy implications. Renew. Sustain. Energy Rev. 2016, 55, 1180–1186. [Google Scholar]
- Tucho, G.T.; Weesie, P.D.M.; Nonhebel, S. Assessment of renewable energy resources potential for large scale and standalone applications in Ethiopia. Renew. Sustain. Energy Rev. 2014, 40, 422–431. [Google Scholar] [CrossRef]
- Anagreh, Y.; Bataineh, A. Renewable energy potential assessment in Jordan. Renew. Sustain. Energy Rev. 2011, 15, 2232–2239. [Google Scholar] [CrossRef]
- Anagreh, Y.; Bataineh, A.; Al-Odat, M. Assessment of renewable energy potential, at Aqaba in Jordan. Renew. Sustain. Energy Rev. 2010, 14, 1347–1351. [Google Scholar] [CrossRef]
- Al-Badi, A.H.; Malik, A.; Gastli, A. Assessment of renewable energy resources potential in Oman and identification of barrier to their significant utilization. Renew. Sustain. Energy Rev. 2009, 13, 2734–2739. [Google Scholar] [CrossRef]
- Jeong, J.S.; Ramírez-Gómez, Á. Optimizing the location of a biomass plant with a fuzzy-DEcision-MAking Trial and Evaluation Laboratory (F-DEMATEL) and multi-criteria spatial decision assessment for renewable energy management and long-term sustainability. J. Clean. Prod. 2018, 182, 509–520. [Google Scholar] [CrossRef]
- Padrón, I.; Avila, D.; Marichal, G.N.; Rodríguez, J.A. Assessment of Hybrid Renewable Energy Systems to supplied energy to Autonomous Desalination Systems in two islands of the Canary Archipelago. Renew. Sustain. Energy Rev. 2019, 101, 221–230. [Google Scholar] [CrossRef]
- Stambouli, A.B. Algerian renewable energy assessment: The challenge of sustainability. Energy Policy 2011, 39, 4507–4519. [Google Scholar] [CrossRef]
- Parker, N.; Williams, R.; Dominguez-Faus, R.; Scheitrum, D. Renewable natural gas in California: An assessment of the technical and economic potential. Energy Policy 2017, 11, 235–245. [Google Scholar] [CrossRef]
- Góralczyk, M. Life-cycle assessment in the renewable energy sector. Appl. Energy 2003, 75, 205–211. [Google Scholar] [CrossRef]
- Chakma, S.; Vaishya, R.C.; Yadav, A.K.; Pooja. Assessment of renewable energy potential in India: A review. In Proceedings of the 2011 International Conference and Utility Exhibition on Power and Energy Systems: Issues and Prospects for Asia (ICUE 2011), Pattaya City, Thailand, 28–30 September 2011. [Google Scholar]
- Winkler, H. Renewable energy policy in South Africa: Policy options for renewable electricity. Energy Policy 2005, 33, 27–38. [Google Scholar] [CrossRef]
- Elsner, P. Continental-scale assessment of the African offshore wind energy potential: Spatial analysis of an under-appreciated renewable energy resource. Renew. Sustain. Energy Rev. 2019, 104, 394–407. [Google Scholar] [CrossRef]
- Adefarati, T.; Bansal, R.C. Reliability and economic assessment of a microgrid power system with the integration of renewable energy resources. Appl. Energy 2017, 206, 911–933. [Google Scholar] [CrossRef]
- Orehounig, K.; Evins, R.; Dorer, V.; Carmeliet, J. Assessment of renewable energy integration for a village using the energy hub concept. Energy Procedia 2014, 57, 940–949. [Google Scholar] [CrossRef]
- Krupenev, D. Assessment of Power System Adequacy with Renewable Energy Sources and Energy Storage Systems. E3S Web Conf. 2018, 58, 01012. [Google Scholar] [CrossRef]
- Chaiamarit, K.; Nuchprayoon, S. Impact assessment of renewable generation on electricity demand characteristics. Renew. Sustain. Energy Rev. 2014, 39, 995–1004. [Google Scholar] [CrossRef]
- Shi, X.; Liu, X.; Yao, L. Assessment of instruments in facilitating investment in off-grid renewable energy projects. Energy Policy 2016, 95, 437–446. [Google Scholar] [CrossRef]
- Lyu, X.; Shi, A. Research on the renewable energy industry financing efficiency assessment and mode selection. Sustainability 2018, 10, 222. [Google Scholar] [CrossRef]
- Nasirov, S.; Silva, C.; Agostini, C.A. Assessment of barriers and opportunities for renewable energy development in Chile. Energy Sources Part B Econ. Plan. Policy 2016, 11, 150–156. [Google Scholar] [CrossRef]
- Sait, M.; Chigbu, U.; Hamiduddin, I.; de Vries, W. Renewable Energy as an Underutilised Resource in Cities: Germany’s ‘Energiewende’ and Lessons for Post-Brexit Cities in the United Kingdom. Resources 2018, 8, 7. [Google Scholar] [CrossRef]
- Shen, Y.C.; Lin, G.T.R.; Li, K.P.; Yuan, B.J.C. An assessment of exploiting renewable energy sources with concerns of policy and technology. Energy Policy 2010, 38, 4604–4616. [Google Scholar] [CrossRef]
- Nasirov, S.; Agostini, C.A.; Silva, C. An assessment of the implementation of renewable energy sources in the light of concerns over Chilean policy objectives. Energy Sources Part B Econ. Plan. Policy 2017, 12, 715–721. [Google Scholar] [CrossRef]
- Schwanitz, V.J.; Wierling, A.; Shah, P. Assessing the impact of renewable energy on regional sustainability—A comparative study of Sogn og Fjordane (Norway) and Okinawa (Japan). Sustainability 2017, 9, 1969. [Google Scholar] [CrossRef]
- Wei, Y.; Wu, G.; Fan, Y.; Liu, L. Progress in energy complex system modelling and analysis. Int. J. Glob. Energy Issues 2006, 25, 109–128. [Google Scholar] [CrossRef]
- Pehnt, M. Dynamic life cycle assessment (LCA) of renewable energy technologies. Renew. Energy 2006, 31, 55–71. [Google Scholar] [CrossRef]
Figure 1.
Research design.

Figure 2.
Mapping of Krasnoyarsk Region according to the structure of power supply in 2013 (adopted from [50]).
Figure 2.
Mapping of Krasnoyarsk Region according to the structure of power supply in 2013 (adopted from [50]).

Figure 3.
Correlation between population density, emissions, and industrialization within the municipal entities of Krasnoyarsk Region in 2017 (calculated by authors with the use of [78]).
Figure 3.
Correlation between population density, emissions, and industrialization within the municipal entities of Krasnoyarsk Region in 2017 (calculated by authors with the use of [78]).

Figure 4.
Mapping of the solar and wind potential in Krasnoyarsk Region in 2013 (adopted from [50]).
Figure 4.
Mapping of the solar and wind potential in Krasnoyarsk Region in 2013 (adopted from [50]).

Figure 5.
Mapping of hydropower potential in Krasnoyarsk Region in 2013 (adopted from [50] and extended by authors).
Figure 5.
Mapping of hydropower potential in Krasnoyarsk Region in 2013 (adopted from [50] and extended by authors).

Figure 6.
Mapping of nuclear power potential in Krasnoyarsk Region (compiled by authors based on calculated population density and level of industrialization in 2017).
Figure 6.
Mapping of nuclear power potential in Krasnoyarsk Region (compiled by authors based on calculated population density and level of industrialization in 2017).

Figure 7.
Assessment of RES potential within municipal entities with high level of industrialization (developed by authors): (a) solar power potential; (b) wind power potential; (c) hydropower potential.
Figure 7.
Assessment of RES potential within municipal entities with high level of industrialization (developed by authors): (a) solar power potential; (b) wind power potential; (c) hydropower potential.


Figure 8.
Assessment of RES potential within municipal entities with medium level of industrialization (developed by authors): (a) solar power potential; (b) wind power potential; (c) hydropower potential.
Figure 8.
Assessment of RES potential within municipal entities with medium level of industrialization (developed by authors): (a) solar power potential; (b) wind power potential; (c) hydropower potential.


Figure 9.
Assessment of RES potential within municipal entities with low level of industrialization (developed by authors): (a) solar power potential; (b) wind power potential; (c) hydropower potential.
Figure 9.
Assessment of RES potential within municipal entities with low level of industrialization (developed by authors): (a) solar power potential; (b) wind power potential; (c) hydropower potential.

Figure 10.
Potential development of energy sources within the municipal entities of the Krasnoyarsk Region—developed by authors (municipal entities with the largest volume of carbon dioxide and sulfur oxide emissions per capita were indicated with bold font).
Figure 10.
Potential development of energy sources within the municipal entities of the Krasnoyarsk Region—developed by authors (municipal entities with the largest volume of carbon dioxide and sulfur oxide emissions per capita were indicated with bold font).


Table 1.
Characteristics of Krasnoyarsk Region (2018) [51].
Table 1.
Characteristics of Krasnoyarsk Region (2018) [51].
| Indicator | Value |
|---|---|
| General Data | |
| Geographical coordinates | 64.2480° N, 95.1104° E Krasnoyarsk Region (lake Vivi) is a geographical center of Russia |
| The most northerly point | Cape Cheluskin (77.43° N, 104.18° E) |
| The most southerly point | Border of Tyva Republic—located in mountains, no locality bound (51.46° N, 92.4° E) |
| Climate type | 3 climatic zones: arctic, subarctic, temperate Continental with extreme temperature fluctuations throughout the year |
| Average annual rainfall (mm) | 465 |
| Annual temperature | Average = + 1.2 °C Average min = – 16.0 °C (January) Average max = + 18.7 °C (July) |
| Population | Overall population = 2.9 mm Population density = 1.21 people/km2 Urbanization = 77% |
| Energy sector | |
| Installed capacity (MW) | Сoal-fired power generation = 8089 MW Hydro power stations = 10,038 |
Table 2.
Population density and industrialization level across municipal entities of Krasnoyarsk Region in 2017 (calculated by authors from [74,75,76]).
| Municipal Entity | Population Density (people/km2) | Level of Industrialization (m RUR) | Municipal Entity | Population Density (people/km2) | Level of Industrialization (m RUR) |
|---|---|---|---|---|---|
| Achinskiy | 48.742 | 36522.5 | Abanskiy | 2.142 | 5.1 |
| Minusinskiy | 30.464 | 6575.6 | Partizanskiy | 1.929 | 0 |
| Kanskiy | 27.706 | 3759.3 | Kuraginskiy | 1.901 | 2362.7 |
| Nazarovskiy | 17.340 | 15416.3 | Idrinskiy | 1.898 | 0.1 |
| Sharypovskiy | 16.330 | 9564.3 | Balakhtinskiy | 1.870 | 176 |
| Bogotolʹskiy | 10.251 | 3155.5 | Kazachinskiy | 1.741 | 7.4 |
| Uiarskiy | 9.629 | 4422.5 | Karatuzskiy | 1.487 | 81.9 |
| Berezovskiy | 9.353 | 1385.9 | Irbeiskiy | 1.447 | 8.8 |
| Rybinskiy | 8.915 | 7113.6 | Sayanskiy | 1.371 | 34.7 |
| Uzhurskiy | 7.495 | 1545 | Taseevskiy | 1.198 | 0 |
| Emelʹianovskiy | 6.472 | 2065.9 | Pirovskiy | 1.128 | 0 |
| Ilanskiy | 6.439 | 279.2 | Ermakovskiy | 1.117 | 0 |
| Nizhneingashskiy | 4.914 | 1191.6 | Tiukhtetskiy | 0.881 | 0 |
| Krasnoturanskiy | 4.103 | 215.8 | Biriliusskiy | 0.843 | 20922.1 |
| Dzerzhinskiy | 3.744 | 55.5 | Boguchanskiy | 0.840 | 0 |
| Sukhobuzimskiy | 3.573 | 1795.3 | Motyginskiy | 0.830 | 36019.7 |
| Novoselovskiy | 3.416 | 54.8 | Kezhemskiy | 0.616 | 17612.2 |
| Shushenskiy | 3.182 | 1346.3 | Eniseiskiy | 0.390 | 11814.2 |
| Kozulʹskiy | 3.066 | 136.6 | Severoeniseiskiy | 0.259 | 20751.8 |
| Bolʹsheuluĭskiy | 2.984 | 9109.3 | Turukhanskiy | 0.079 | 388835 |
| Bolʹshemurtinskiy | 2.672 | 5317.8 | Taimyrskiy municipal region | 0.037 | 76734.7 |
| Manskiy | 2.665 | 93.7 | Evenkiiskiy municipal region | 0.020 | 19544.9 |
Note: 0 means absence of data in official statistics.
© 2019 by the authors. Licensee MDPI, Basel, Switzerland. This article is an open access article distributed under the terms and conditions of the Creative Commons Attribution (CC BY) license (http://creativecommons.org/licenses/by/4.0/).
Share and Cite
MDPI and ACS Style
Gavrikova, E.; Burda, Y.; Gavrikov, V.; Sharafutdinov, R.; Volkova, I.; Rubleva, M.; Polosukhina, D. Clean Energy Sources: Insights from Russia. Resources 2019, 8, 84. https://0-doi-org.brum.beds.ac.uk/10.3390/resources8020084
AMA Style
Gavrikova E, Burda Y, Gavrikov V, Sharafutdinov R, Volkova I, Rubleva M, Polosukhina D. Clean Energy Sources: Insights from Russia. Resources. 2019; 8(2):84. https://0-doi-org.brum.beds.ac.uk/10.3390/resources8020084
Chicago/Turabian StyleGavrikova, Elizaveta, Yegor Burda, Vladimir Gavrikov, Ruslan Sharafutdinov, Irina Volkova, Marina Rubleva, and Daria Polosukhina. 2019. "Clean Energy Sources: Insights from Russia" Resources 8, no. 2: 84. https://0-doi-org.brum.beds.ac.uk/10.3390/resources8020084
Note that from the first issue of 2016, this journal uses article numbers instead of page numbers. See further details here.