An Analysis of Operational Efficiencies in the Waste-to-Energy (WTE) Plants of Kaohsiung Municipality (Taiwan)

Graduate Institute of Bioresources, National Pingtung University of Science and Technology, Pingtung 912, Taiwan
Resources 2019, 8(3), 125; https://0-doi-org.brum.beds.ac.uk/10.3390/resources8030125
Submission received: 4 June 2019
/
Revised: 4 July 2019
/
Accepted: 4 July 2019
/
Published: 10 July 2019
(This article belongs to the Collection Management, Environment, Energy and Sustainability under a Circular Economy)
Abstract
:As the second-largest city in Taiwan, the Kaohsiung municipality has faced serious environmental loadings in recent decades. Among them, waste management is a key issue because of large amount of urban and industrial waste produced daily. In this regard, waste-to-energy (WTE) systems adopting the best available control technology for air pollution is a win-win approach because it also generates electricity to mitigate the dependence on imported fossil fuels and the greenhouse gas emissions incidentally. In this work, the updated status of municipal solid waste (MSW) and WTE plants in Kaohsiung were analyzed to get the crux based on the official database. Using the operational data on the WTE plants over recent years (2003–2018), the analysis of operational efficiencies for the four WTE plants in Kaohsiung was addressed in the paper. It showed that their operational efficiencies, ranging from 0.287 to 0.568 kW-h/kg, indicated an approximate “bathtub curve” pattern. In addition, analyzing the project for revamping the Gangshan WTE plant showed a significant progress in operational efficiencies with a significant increase from 0.506 kW-h/kg in 2016 to 0.587 kW-h/kg in 2018. Finally, some recommendations on technological measures and regulatory incentives for upgrading the operational efficiencies of existing WTE plants were addressed in the work.
1. Introduction
1.1. Brief Description of Kaohsiung Municipality
Taiwan, geographically located in the southeastern rim of Asia, faces the Pacific Ocean in the east and the Taiwan Strait in the west. This subtropical island country has a high population density (about 606 people/km2) based on its total area of ca. 36,000 km2 and approximately 23.6 million people by the end of 2018. To upgrade the administrative effectiveness, the Kaohsiung city merged with the Kaohsiung County to form a larger special municipality on Dec. 25, 2010. As the second-largest city of this island country, the Kaohsiung municipality (hereinafter referred to as Kaohsiung) is in southern Taiwan, thus having a warm climate with mean temperatures between 20 and 29 °C. It is one of six special municipalities, which were officially authorized by the Taiwan government. In brief, the features of this municipality at the end of 2018 are as follows:
- -
- Population: Approx. 2.8 million
- -
- Area: 2948 km2 (Urban area: 363 km2)
- -
- No. of district: 38
- -
- Electricity consumption
- -
- Residence/commercial sectors: 7,182,654 MW-h
- -
- Non-residence/commercial (industrial) sector: 23,772,151 MW-h
- -
- Total: 30,954,805 MW-h
- -
- Co-ordinates: 120°10′29″~121°02′55″ East longitude/22°28′32″~23°28′17″ North latitude
1.2. Waste-to-Energy (WTE) Plants in Kaohsiung
Kaohsiung has been an industrial city for a long time, known for steel-making, shipbuilding, petrochemical complex, and other processing, and high-tech industries. With rapid industrialization and economic development since the late 1970s, increasing environmental loadings have already led to serious environmental scenarios as a result of illegal dumping and non-sanitary landfilling by industrial waste and municipal solid waste (MSW). Therefore, the central governed authority (i.e., Environmental Protection Administrations, EPA) jointed with local governments to promulgate an integrated waste management system and granted constructing waste incineration plants during the late 1990s [1]. Up to now, 4 large-scale MSW/non-hazardous industrial waste (NHIW) incineration plants in Kaohsiung were operated to generate electricity by the combined heat and power (CHP) system. It should be noted that this municipality has the most large-scale incinerators in Taiwan, accounting for one sixth (4/24). Regarding these waste-to-energy (WTE) plants, their total design capacities and installed power generation capacities amount to 5400 metric tons (MT) per day and 135 megawatts (MW), respectively. Table 1 summarizes the information about the four WTE plants in Kaohsiung [2,3].
1.3. Status of Renewable Energy in Taiwan
Based on the definition of biomass energy by the governing law “Renewable Energy Development Act” passed in 2009 [4], biomass energy refers to the energy generated by direct use or treatment of agricultural/forestry residues, biogas, and domestic organic waste. Herein, domestic organic waste could include domestic general waste (i.e., MSW) and general industrial waste (i.e., NHIW) without synthetic plastics/rubbers incinerated due to reuse and recycling. According to official statistics in 2017 [5], the imported energy in Taiwan accounted for 143.6 million kiloliters of oil equivalent (KLOEs), or 97.98% of total energy supply. In other words, the indigenous energy, mostly from renewable energy (about 90%), only contributed to 2.02% of total energy supply, or 3.0 million KLOEs. By classifying them with the forms of renewable energy, their contributions are given below: hydro power 0.36%, solar photovoltaic (PV) and wind power 0.22%, solar thermal heat 0.08%, and WTE 1.15%. It showed that the largest proportion of renewable energy supply in Taiwan was from biomass energy [5]. In fact, the combustible proportions in the MSW and general industrial waste was almost entirely incinerated at special WTE plants, which further generated electricity via CHP system without district heating and cooling (DHC) [6]. As compared to the burning of fossil fuels (i.e., coal) in the traditional power plants, the benefits of WTE plants can be connected with lower emissions of air pollutants, including greenhouse gases (GHG) and ambient air pollutants (i.e., particulate, sulfur oxides) [7,8]. More importantly, the WTE system, adopting the best available control technology for toxic air pollutants (e.g., dioxins and mercury), has been identified as a mature and simple technology in comparison with other waste management methods [9].
1.4. Objectives of This Paper
As mentioned above, Taiwan is a country with a serious lack of natural resources, actively pursuing a low-carbon society with industrial development of renewable and green energy since 2000 [10]. In addition, the WTE plant is economically feasible with medium payback period and high net present value mainly due to the significant gains from sales of electricity in some Asian countries such as Thailand [11], Malaysia [12], and China [13]. To reduce GHG emissions effectively, the Kaohsiung city government is now promulgating an ordinance for collecting a climate change adaption fee from mass GHG emission industries. The local government also encouraged an integrated waste management (IWM) system for upgrading the operational efficiencies of WTE plants because they faced getting old and reducing energy efficiency after over 15 years of operation, as shown in Table 1. On the other hand, for the purposes of resolving the problem of general (non-hazardous) industrial waste treatment caused by lack of appropriate incineration facilities, the combustible portion of general industrial waste can be permitted by local governments to incinerate MSW since 2000 [8]. In the literature, a minority of the research has revealed the operational efficiency for power generation in the WTE plant. In the studies by Tsai [8] and Chen et al. [14], it showed that the energy efficiencies of MSW incineration plants in Taiwan were relatively low in recent years. Herein, the energy efficiency was defined as the ratio of electricity generation (output) to the waste incinerated (input). Grosso et al. [15] and Perkoulidis et al. [16] adopted the R1 formula to evaluate the efficiency of energy recovery from waste in European countries. Takaoka et al. [17] investigated the power generation efficiencies of WTE plants in Japan, showing a possibility of more than 20% with capacity of 300 tons/day, but the present efficiency is only 12%. However, until recently, the analysis of operational efficiency for WTE plants using the operations research approach was less discussed in the literature. Therefore, the objectives of this paper were to update the status of MSW and WTE plants in Kaohsiung. Using the operational data on the WTE plants, the preliminary analysis of operational efficiencies for the four WTE plants using the “bathtub” theory was addressed in the paper. Finally, an engineering project for upgrading the operational efficiency for one of the WTE plants was briefly presented to gain the significant improvements in the operation efficiency between the years 2016 and 2018.
2. Statistical Data and Methods
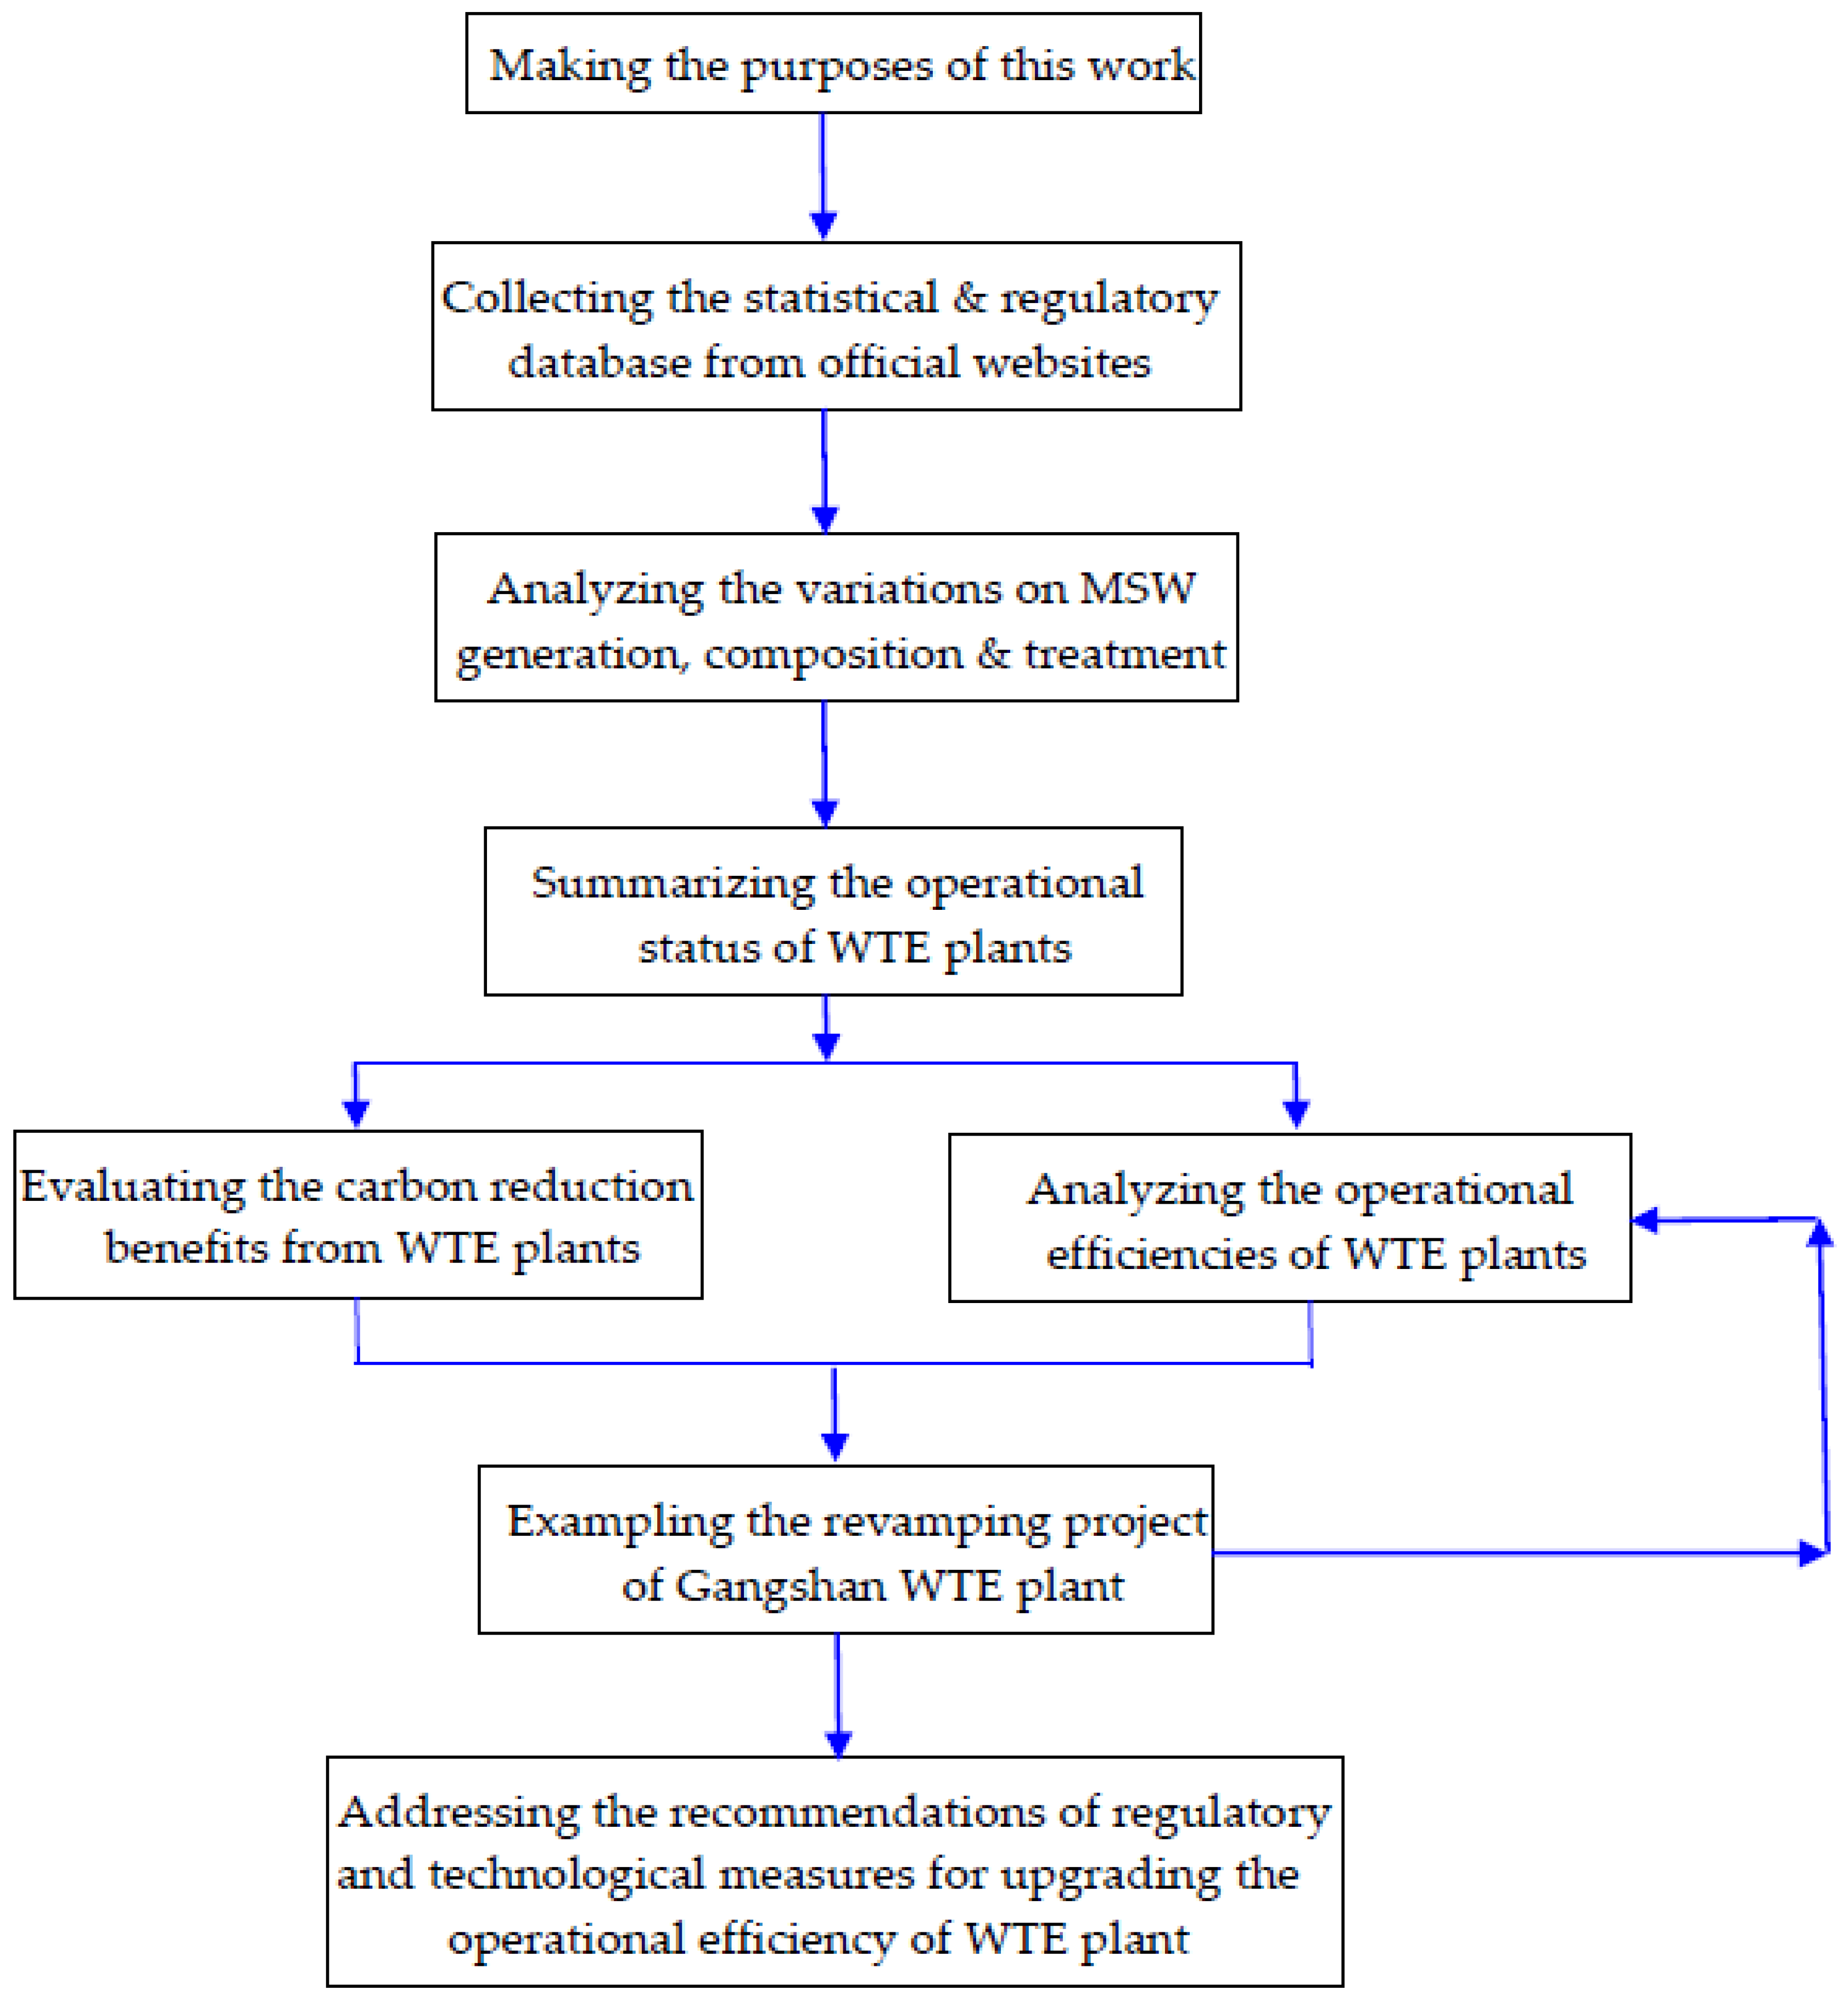
Figure 1 depicts a descriptive flowchart for the major steps of the proposed methodology in this work. To update the status of WTE plants and further analyze its carbon reduction benefit and operational efficiency in Kaohsiung, the main aim of this work was to present the variations of MSW generation, composition, treatment, and the operational status of WTE plants in recent years. The statistical data and methods adopted by this work were briefly summarized below.
- Activities of waste management and WTE plant (energy sector)The updated data on the statistics and status of waste management and WTE plants in Kaohsiung were obtained from the official statistical database [18], which was compiled by the EPA.
- Preliminary benefit analysis of WTE plantThe author analyzed the preliminary GHG mitigation benefits of WTP in Kaohsiung, which were based on the Tier 2 method developed by the Intergovernmental Panel on Climate Change (IPCC) [19]. In this method, the regional activity data and the GHG mitigation/emission factors were revealed by the official statistical database and the Taiwan Power Company (one of the state-owned companies), respectively [18,20].
- Regulatory and technological measures for upgrading the operational efficiency of WTE plant
3. Results and Discussion
3.1. Generation and Compositions of MSW in Kaohsiung
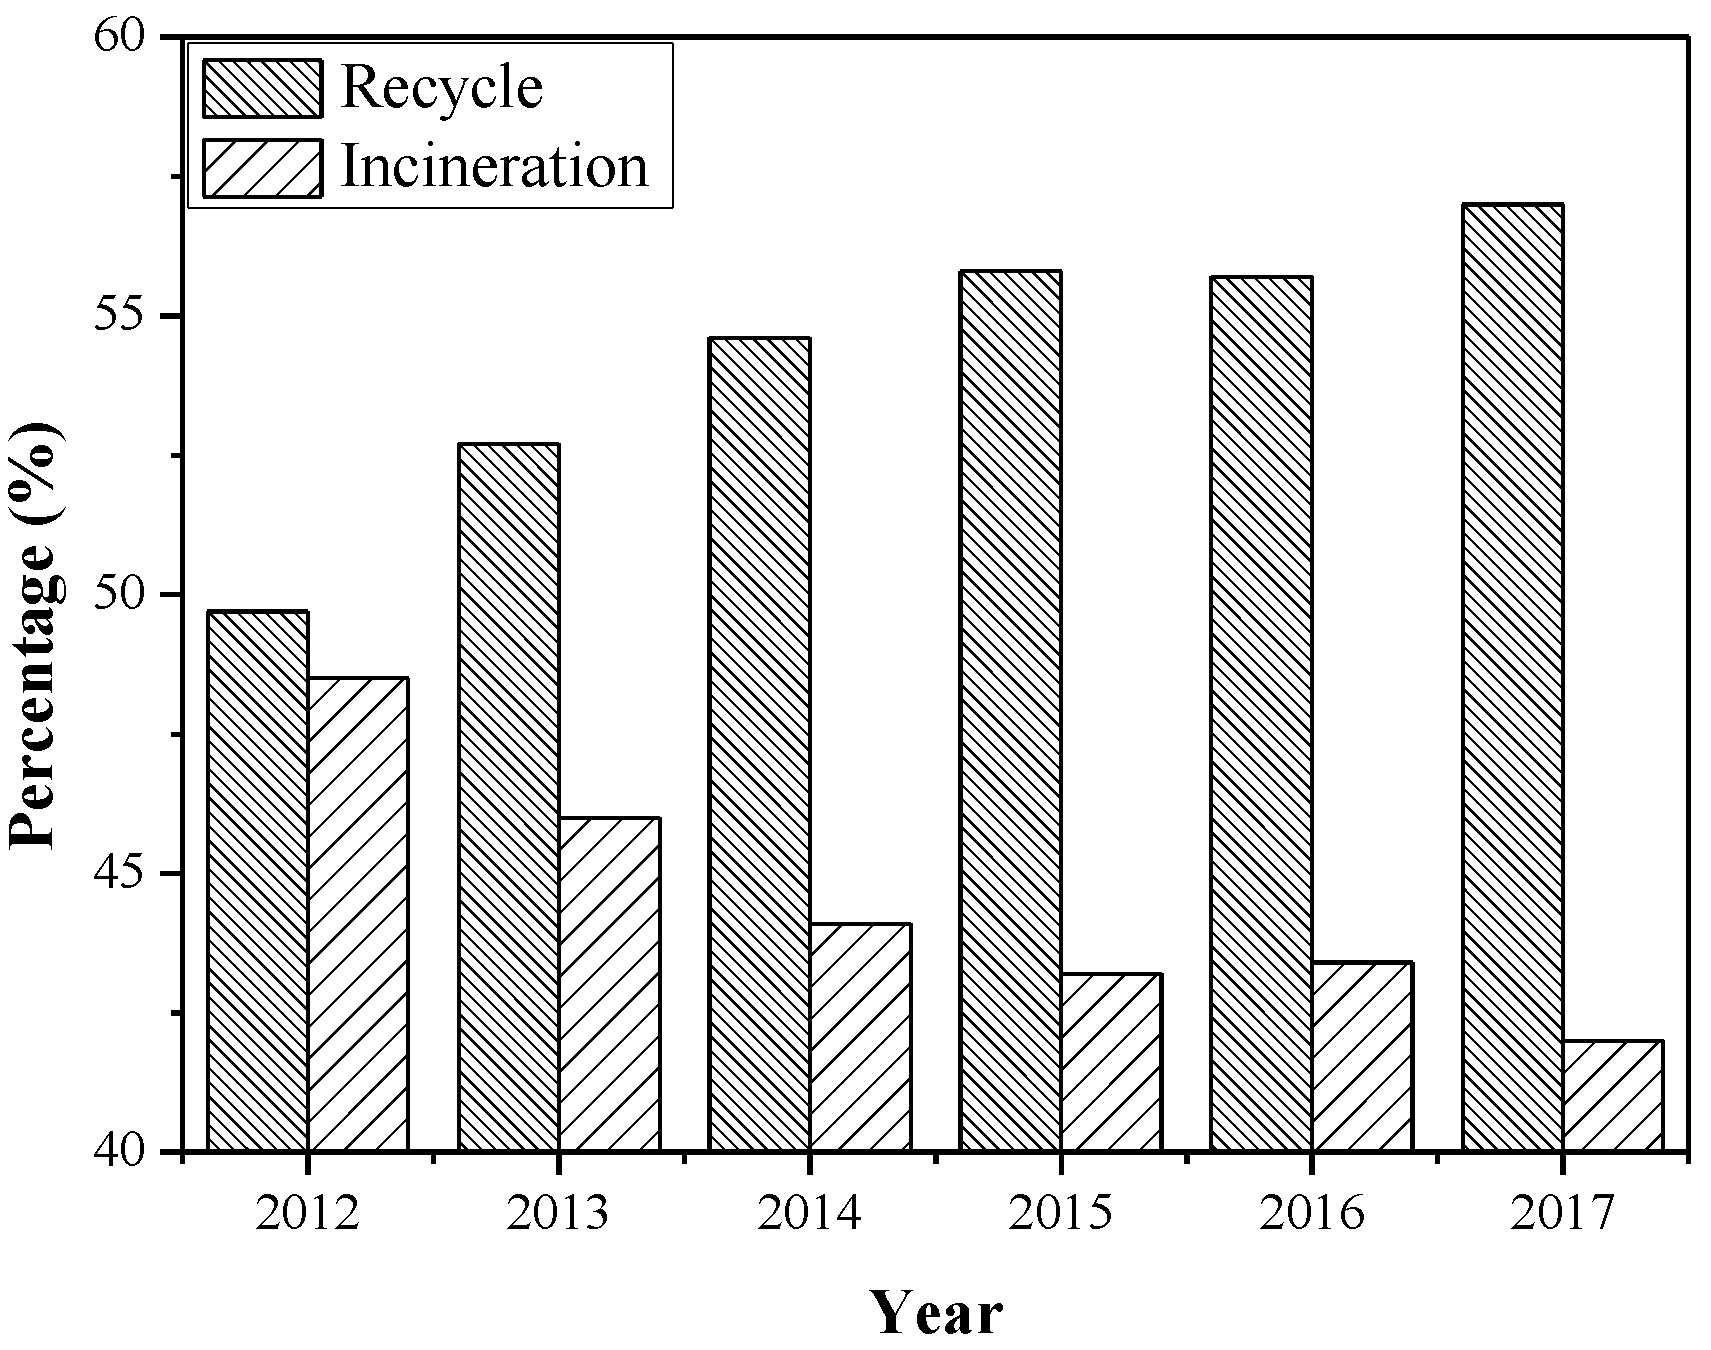
According to the Waste Management Act (known as the Waste Disposal Act”, recently revised on June 14, 2017) in Taiwan [22], waste is basically defined as any movable solid or liquid substance or object which is discarded because it is of no economic or market value. Furthermore, waste is divided into general waste and industrial waste. The former is closely associated with urban waste or MSW, but it also includes waste generated from non-processing (or service) activities in the industrial and commercial sectors. The latter includes general (non-hazardous) industrial waste and hazardous industrial waste. On the other hand, general waste can be categorized into recycled general waste (including bulk waste, food waste, and recyclable waste), hazardous general waste, and other general waste. Table 2 lists the statistics on the generation amount of MSW and its treatment in Kaohsiung in recent years (2012–2017) [18]. It showed that the variation trend was stable in connection with population and economic growth stagnation, and waste reduction and recycling promotion in the past two decades. In parallel, the volume of MSW generated per capita per day indicated about a 7% reduction rate during this period, declining from 0.982 in 2012 to 0.911 kg/capita-day in 2017. The data on the MSW generated per capita per day in Kaohsiung were relatively large when compared with those in Taiwan (i.e., 0.869 and 0.915 kg/capita-day in 2012 and 2017, respectively) [18]. Under the MSW recycling promotion by the EPA, Kaohsiung has reached a recycling rate of 57.05% in 2017, a slight improvement from 49.67% in 2012 (seen in Figure 2). By contrast, the waste incineration rate indicated a decreasing trend from 48.47% in 2012 to 42.04% in 2017.
The compositions of MSW are related to the urbanization, city size, population density, and living standard. In Kaohsiung, the physical compositions (combustibles and incombustibles) during the years 2012–2017 are listed in Table 3 [18]. The average proportions of combustibles and incombustibles (composed by iron, non-iron metals, glasses, ceramics, and other inert materials) accounted for about 98 wt. % and 2 wt. %, respectively. The compositions of combustibles on the wet basis included paper (28.67–40.80%), textiles (2.19–3.50%), garden/trimmings (0.85–3.97%), food waste (32.16–52.09%), plastics (12.39–20.16%), and leather/rubber (0.07–1.00%). As classified by the analysis, Table 4 further lists the average compositions of MSW in Kaohsiung during the same years [18]. It showed that the variation on the proximate compositions (i.e., moisture, ash, and combustibles) during this period was not great. On an average, the percentages of moisture, ash, and combustibles were 52.6, 5.6, and 41.9 wt. %, respectively. Regarding the energy potential of MSW in Kaohsiung during recent years, Table 4 also listed some chemical properties, including elemental analysis and calorific value analyses [18]. Herein, the elemental analysis meant that compositions, including carbon (C), hydrogen (H), oxygen (O), nitrogen (N) sulfur (S), and chlorine (Cl). The calorific value analyses included the measurements of lower heating value (LHV) and higher heating value (HHV). The main difference between LHV and HHV is heat recovery from the latent heat of vaporization of water during the combustion. The data in Table 4 shows the typical values of MSW [18]; that is, C 22.64 wt. %, H 3.39 wt. %, O 14.95 wt. %, N 0.62 wt. %, S 0.11 wt. % and Cl 0.17 wt. % on average. More significantly, the data on the combustible components in MSW were consistent with their calorific values. For instance, the percentages of combustibles in 2014 and 2016 were 49.51 and 32.07 wt. %, thus resulting in the consistent data of lower heating value (LHV) on 9.57 and 6.22 MJ/kg, respectively. Similarly, the higher energy contents of paper and plastics will give a significant influence on the overall calorific value of MSW [23]. Therefore, the MSW in 2014 contained higher contents of paper and plastics (58.95 wt. %, listed in Table 3) as compared to those of MSW in 2016 (41.06 wt. %). On the other hand, the high proportions of food waste (32–52 wt. %, seen in Table 3) will result in incineration difficulties due to high moisture content and low calorific value if it was fed into WTE plants without pre-separation or recycling.
3.2. Operational Status of WTE Plants in Kaohsiung
In the 1980s, urban waste management in Taiwan focused on sanitary landfills because this option was cost-effective (partly recovered from income by installing landfill gas-to-power systems) and was easy to implement in a short period. However, it could encounter some drawbacks, including secondary pollution problems (i.e., water/air pollution, and soil contamination) and limited land resources [24,25]. Therefore, most people in Taiwan objected to landfills because of the nuisance issues and environmental concerns. In the early 1990s, the Taiwan government subsidized local governments for the construction of large-scale MSW incineration (i.e., WTE) plants to resolve large amounts of urban waste produced. Although WTE plants also produced environmental concerns (especially in toxic air pollutants), this waste treatment option can manage mass MSW and recover energy (electricity) from CHP systems. Meanwhile, central and local governments have promoted resource recycling and zero-waste policies by compulsion under waste management regulation systems [26,27]. Under the background of waste management evolution, the Kaohsiung city government began to build WTE plants in the mid-1990s. As described in Table 1, there are four WTE plants in Kaohsiung, which are named Renwu, Gangshan, Central District, and Southern District WTE plant.
Table 5 listed the operational status of four WTE plants in recent years (2016–2018) [18]. According to the data in 2018, the total amount of power sold to the Taiwan Power Co. (the only state-owned power enterprise in Taiwan) accounted for 545,379 MW-h, which contributed to about 1.8% of total electricity consumption in Kaohsiung (i.e., 30,954 GW-h). It can be obviously seen that the operational performance of Central District WTE plant (the first MSW incineration plant in Kaohsiung) was lower than the other three WTE plants based on the percentage of power sold and operation hour. This could be attributed to the waste type fed (only for general waste, lower calorific value) and the core facilities being older. On the other hand, the Gangshan WTE plant indicated a significant reduction in its operational performance in 2017. As a successful case study, the next section will describe a revamping project for upgrading the operational efficiency of Gangshan WTE plant [21].
Based on the above-mentioned performance of four WTE plants in Kaohsiung, the Tier 2 method developed by the IPCC was further used to estimate the equivalent CO2 emission mitigation from the WTE systems for electricity generation [19]. Using the updated data on the total amount of power sold in 2018 (i.e., 545,379 MW-h) and the average default value 0.55 kg CO2/kW-h [20], the equivalent mitigation of CO2 (Gg) was thus estimated below:
In addition, the total amount of waste-to-power sold in 2018 (i.e., 545,379 MW-h) for four WTE plants can supply equivalently to 83,430 households based on an average 6537 kW-h electricity consumption per year [28].
Equivalent CO2 mitigation: 545,379 MW-h × 0.55 kg CO2/kW-h × 103 kW-h/MW-h× 10−6 Gg·kg−1
≈ 300 Gg CO2.
≈ 300 Gg CO2.
3.3. Analysis of Operational Efficiencies of WTE Plants in Kaohsiung
According to the Waste Framework Directive in Europe, which came into force on December 12th 2018, the most commonly used method was to be based on the ratio of total electricity generation to total energy input (derived from the calorific values of incinerated waste and auxiliary fuel added) [8,14]. However, it is difficult to obtain actual energy input, mainly due to the fluctuated characteristics of the incinerated waste fed. In this work, the author adopted an alternative criterion due to its difficulty in calculating them and making a comparison. The criterion can be simply presented as follows:
where OE is defined as the operational efficiency of WTE plant, P represents the total electricity generation, W is the quantity of waste incinerated. Table 6 lists the operational efficiencies of four WTE plants in Kaohsiung during the years 2002–2018. As seen in Table 6, there were four important features concerning the aspects of WTE plants, which were addressed as follows:
OE = P/W
- -
- On average, the order for the Operational efficiency (OE) values of four WTE plants during the years 2003–2018 were given below: Central District, Southern District, Gangshan, and Renwu WTE plant, corresponding to 0.287, 0.465, 0.542, and 0.568 kW-h/kg, respectively. In brief, the overall power generation rate was calculated to be about 0.5 kW-h/kg, showing that the results were similar to those reported in a typical WTE plant ranging from 0.3 to 0.7 kW-h/kg [23,29].
- -
- Although the operational efficiencies for these WTE plants rely on the plant scale, steam parameters, steam use efficiency, and MSW characterization (e.g., calorific value), they were consistent with their operational performance including operation hour and power-sold percentage (Table 5). To upgrade the performance of WTE plant, some biological residues (e.g., food-processing sewage sludge) can be fed to be co-incinerated with MSW because they contained lots of biological components [30].
- -
- Due to the waste type fed (only for general waste) and the core facilities being older, the operational efficiency of Central District WTE plant (the first MSW incineration plant in Kaohsiung) ranked last.
- -
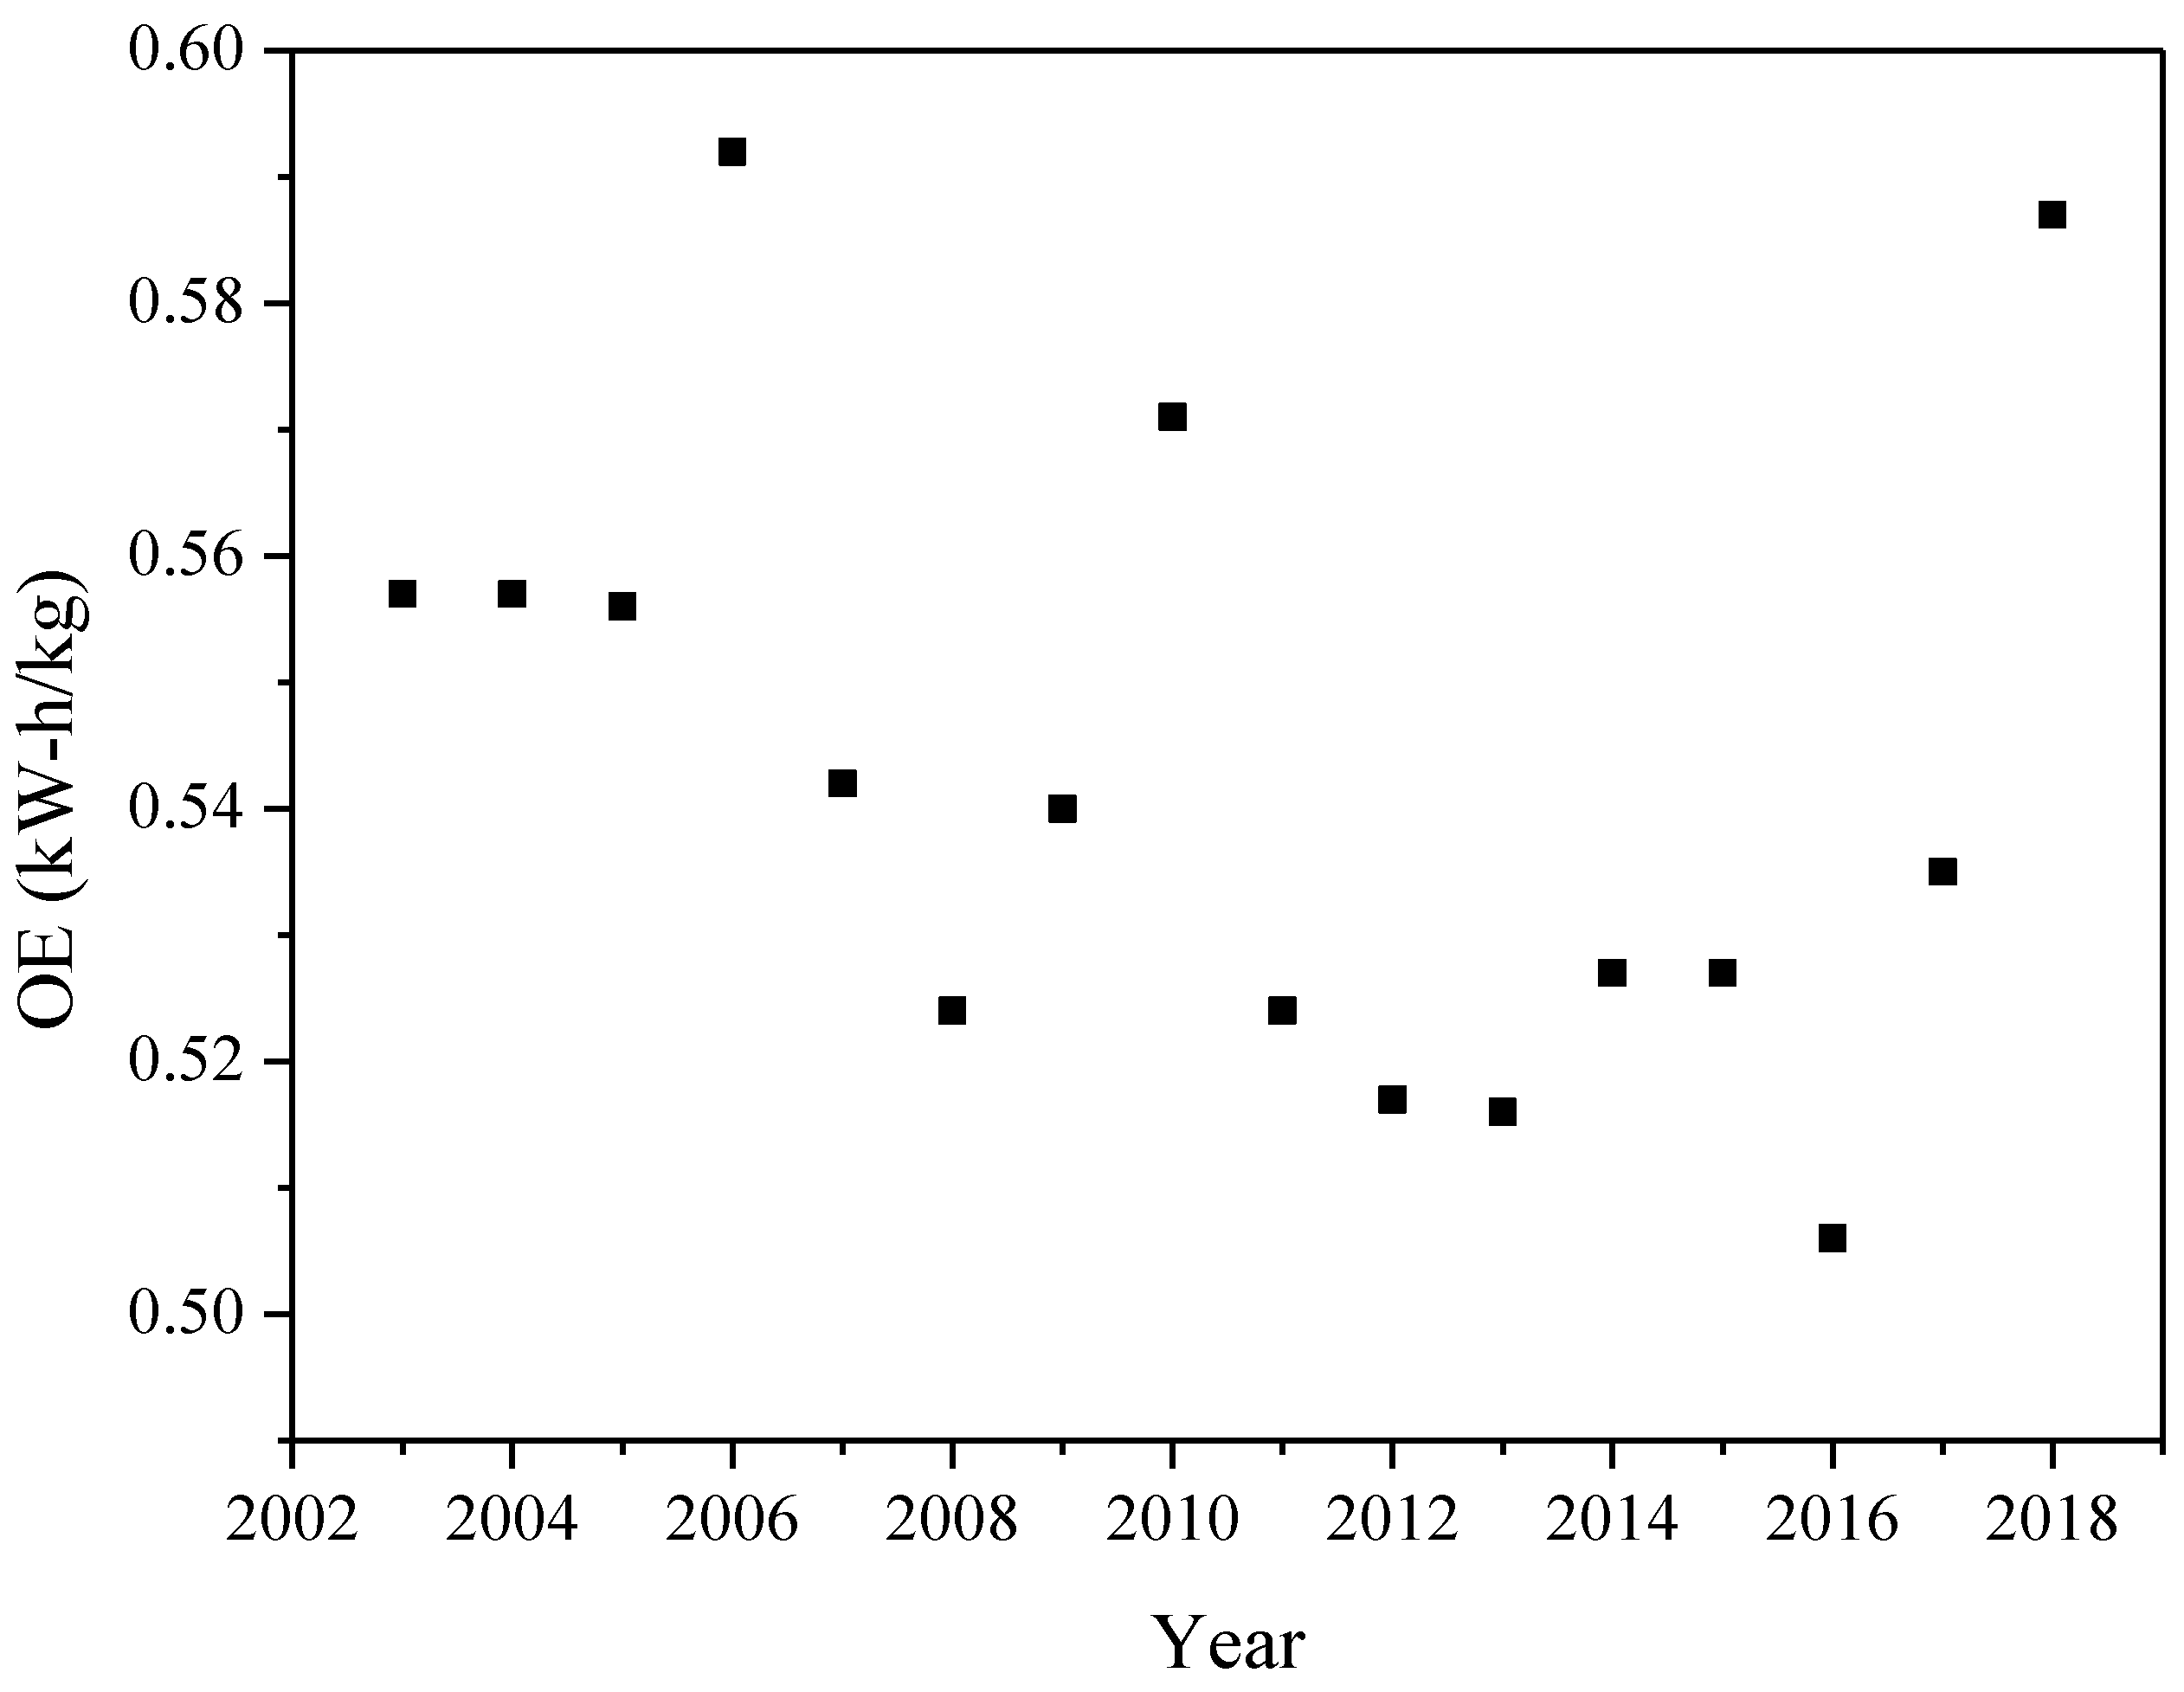
- The OE values of WTE plants indicated an approximate “bathtub curve” pattern (seen in Figure 3 for the Gangshan WTE plant), which was widely used in the reliability analysis [31]. In the “bathtub curve” theory, the hazard profile of a system or facility (or product) may comprise three periods. In the first part (early failure), it indicates a decreasing failure rate due to the improper design, installation errors, unfamiliar operations, and unstable system integration. The failure rate is relatively high, but rapidly declines as the defects and errors are corrected, discarded, or identified. In the second part (random failure), the failure rate is relatively low and maintains stability. The period of this stage depends on the system/product complexity, operation time, and maintenance frequency. In the third part (wear-out failure), the system/product starts facing its lifetime when the failure rate inevitably increases due to aging and wearing-out. Similarly, the operational efficiency of a commercial WTE plant in early life is relatively high, but will gradually decline due to the mechanical behaviors in the mass-burning incineration plant. With the operation and maintenance (O&M) experiences accumulated, the operational efficiency could be maintained at a slowly decreasing trend for a period of time. Eventually, the WTE plant must be stopped operating for revamping. During the revamping project, it included main equipment (e.g., heat exchange tubes in the boilers) upgrading and O&M improvement. As listed in Table 6, the OE values of WTE plants during the years 2016–2018 indicated an upward trend due to the revamping projects described in the next section.
3.4. Revamping of Gangshan WTE Plant for Upgrading Operational Efficiency
As summarized in Table 1, the Gangshan WTE plant covers an area of 7.24 hectares and has been in operation since 2001. This plant incinerated both MSW and NHIW over the past 15 years. However, the plant’s machine or equipment was getting old. Consequently, unscheduled shutdown has occurred frequently in recent years. For instance, the boilers have deteriorated with broken tubes, sinters on the wall, and exhaust gas flue leaking. More importantly, this failure has affected revenue gain due to low operation (incineration) rate and poor operational efficiency. In a previous study [20], the energy efficiency of the Taiwan’s WTE plants during the period of 2008–2012 based on the ratio of electricity generation to waste-derived fuel (i.e., MSW incinerated; supposing no auxiliary fuel added) input were relatively low with an average value of 16.2%. To improve its energy recovery from the incineration operation, the first project of revamping an MSW incineration plant in Taiwan, a subsidiary of the engineering consultant co., was mostly performed in the second half of 2017. As a result, the plant availability rate significantly increased to nearly 100%. Meanwhile, the daily waste incineration capacity has increased by nearly 300 tons as compared to the initial period of the project. These improvements were reflected in the operational efficiencies of 2017 and 2018, as listed in Table 6. Based on the data in Table 4 and Table 6, the energy efficiencies in 2018 reached about 25%, which meant a 60% increase compared to the previous year (2017). The following descriptions will summarize the engineering and O&M technologies to improve the plant’s boilers and other utilities [21].
- Life cycle management of boiler tubes and anti-corrosion technologyMore than 50% of the total amount of the waste incinerated in the Gangshan WTE plant was non-hazardous industrial waste. Thus, the temperatures in the boilers may exceed 1100°C because the calorific value of industrial waste was always high. More seriously, the industrial waste often contained chlorine-containing materials (e.g., polyvinyl chloride), thus causing a serious corrosion due to high concentrations of hydrogen chloride in the exhaust gas [32]. In 2016, the water wall tube and superheated tube breakages led to unscheduled shutdown over 20 times. It is obvious that addressing the tube breakages will be the key point to the success of the revamping work. The revamping team conducted the measurements of the thickness of each section of the boilers’ tubes, analyzed the tubes’ thinning rate and life cycle, developed tube replacement and management plans, and further introduced highly corrosion-resistant welding tubes. These engineering technologies have solved the breakage problem in the boilers’ tubes and prolonged their operational lifetimes.
- Boiler bottom anti-sintering technologyAnother issue was that the sinters on the grate would cause boilers to shut down in the Gangshan WTE plant. Before the revamping work started, the Gangshan plant had to shut down roughly once every two weeks to remove the sinters, thus reducing the plant’s availability rate and the amount of waste incinerated. The revamping team applied its own developed patented technology (Taiwan Patent No.: M424465; Title: A Device for Inhibiting the Formation of Sinters in the Incinerator) to adjust and set up an anti-sintering device. Since 2018, there has been no boiler shutdown due to the sinters on the grate.
4. Conclusions and Recommendations
As the second-largest city in Taiwan, the Kaohsiung municipality has the most state-owned WTE plants, including the Renwu, Gangshan, Central District, and Southern District WTE plant. Their total design treatment capacities and installed power generation capacities amount to 5400 metric tons per day (equivalent to 1,971,000 tons/year) and 135 MW, respectively. However, the actual treatment amounts in 2018 only reached an incineration rate of 65.9% (1,298,730 tons). Based on the ratio of total electricity generation to total waste energy input, the average power efficiency was close to 20%. Obviously, they faced aging and reduced operational efficiency after over 15 years of operation. Based on the performance analysis in this work, the data on the amount of power generated per waste incinerated (kW-h/kg) during the years 2003–2018 indicated considerable differences between the four WTE plants. On average, the operational efficiencies are 0.568, 0.542, 0.287, and 0.465 kW-h/kg for Renwu, Gangshan, Central District, and Southern District WTE plant, respectively. These performance values were comparable with those of WTE plants (i.e., 0.3–0.7 kW-h/kg) in other countries. On the other hand, the operational efficiencies of WTE plants indicated an approximate “bathtub curve” pattern. It is still necessary to analyze the interactions between O&M, design capacity, and waste fed for each WTE plant. Furthermore, a successful engineering project for revamping Gangshan WTE plant in 2017 was addressed. By comparing with the data in 2016 and 2018, the plant availability rate increased from 73% to 100% based on increasing waste treatment capacity with about 50,000 tons. Meanwhile, the operational efficiency increased from 0.506 to 0.587 kW-h/kg, thus generating 52 GW-h electricity additionally.
Under the development frameworks of the renewable energy and circular economy in Taiwan, some technological measures and regulatory incentives for upgrading the operational efficiencies and availability rates of WTE plants are in progress. Some of them can be adopted by the WTE plants in Kaohsiung. They included the following items:
- -
- Enhancing waste heat recovery from WTE plants by the DHC system.
- -
- Increasing the calorific value of incinerated waste by feeding biological waste with higher energy contents (e.g., waste cooking oils and woody/lignocellulosic residues).
- -
- Building biogas-to-power plants by the anaerobic digestion (AD) process for treating food waste (kitchen waste), and other biodegradable and wet residues.
- -
- Renewing the existing WTE plants by revamping hardware units (e.g., steam boiler, blower) and pipelines, and new materials with anti-corrosion and heat-insulation (reducing radiation heat loss).
- -
- Pretreating fed waste by shredding and sorting to increase the energy input (calorific value increased) and prolong operational lifetime.
Funding
This research received no external funding.
Conflicts of Interest
The author declares no conflict of interest.
References
- Tsai, W.T.; Kuo, K.C. An analysis of power generation from municipal solid waste (MSW) incineration plants in Taiwan. Energy 2010, 35, 4824–4830. [Google Scholar]
- Environmental Protection Bureau (Kaohsiung City Government, Taiwan). Available online: https://www.ksepb.gov.tw/WebSite/English (accessed on 12 April 2019).
- Refuse Incineration Plant Management System (Environmental Protection Administration, Taiwan). Available online: https://swims.epa.gov.tw/index.aspx (accessed on 12 April 2019).
- Laws and Regulation (Bureau of Energy, Ministry of Economic Affairs, Taiwan). Available online: https://law.moj.gov.tw/Eng/LawClass/LawAll.aspx?PCODE=J0130032 (accessed on 24 June 2019).
- Ministry of Economic Affairs (MOEA). Energy Statistics Handbook-2017; MOEA: Taipei, Taiwan, 2018. [Google Scholar]
- Turner, W.D. Cogeneration. In Handbook of Energy Efficiency and Renewable Energy; Kreith, F., Goswami, D.Y., Eds.; CRC Press: Boca Raton, FL, USA, 2007; pp. 17:1–17:41. [Google Scholar]
- Ryu, C.; Shin, D. Combined heat and power from municipal solid waste: Current status and issues in South Korea. Energies 2013, 6, 45–57. [Google Scholar]
- Tsai, W.T. Analysis of municipal solid waste incineration plants for promoting power generation efficiency in Taiwan. J. Mater. Cycles Waste Manag. 2016, 18, 393–398. [Google Scholar]
- Albores, P.; Petridis, K.; Dey, P.K. Analysing efficiency of waste to energy systems: Using data envelopment analysis in municipal solid waste management. Procedia Environ. Sci. 2016, 35, 265–278. [Google Scholar]
- Tsai, W.T.; Chou, Y.H. Overview of environmental impacts, prospects and policies for renewable energy in Taiwan. Renew. Sustain. Energy Rev. 2005, 9, 119–147. [Google Scholar]
- Udomsri, S.; Martin, A.R.; Fransson, T.H. Economic assessment and energy model scenarios of municipal solid waste incineration and gas turbine hybrid dual-fueled cycles in Thailand. Waste Manag. 2010, 30, 1414–1422. [Google Scholar]
- Tan, S.T.; Ho, W.S.; Hashim, H.; Lee, C.T.; Taib, M.R.; Ho, C.S. Energy, economic and environmental (3E) analysis of waste-to-energy (WTE) strategies for municipal solid waste (MSW) management in Malaysia. Energy Convers. Manag. 2015, 102, 111–120. [Google Scholar]
- Zhao, X.G.; Jiang, G.W.; Li, A.; Wang, L. Economic analysis of waste-to-energy industry in China. Waste Manag. 2016, 48, 604–618. [Google Scholar]
- Chen, Y.C.; Wang, C.T. Municipal solid waste (MSW) incineration’s potential contribution to electricity production and economic revenue in Taiwan. J. Taiwan Energy 2017, 4, 93–106. [Google Scholar]
- Grosso, M.; Motta, A.; Rigamonti, L. Efficiency of energy recovery from waste incineration, in the light of the new Waste Framework Directive. Waste Manag. 2010, 30, 1238–1243. [Google Scholar]
- Perkoulidis, G.; Kasampalis, T.; Karagiannidis, L.; Moussiopoulos, N. Development of waste-to-energy plants database for evaluating the efficiency of energy recovery from waste in Europe. Waste Biomass Valor. 2015, 6, 983–988. [Google Scholar]
- Takaoka, M.; Takeda, N.; Yamagata, N.; Masuda, T. Current status of waste to power generation in Japan and resulting reduction of carbon dioxide emissions. J. Mater. Cycles Waste Manag. 2011, 13, 198–205. [Google Scholar]
- Environmental Protection Administration (EPA). Yearbook of Environmental Protection Statistics 2017; EPA: Taipei, Taiwan, 2018. [Google Scholar]
- Intergovernmental Panel on Climate Change (IPCC). 2006 IPCC Guidelines for National Greenhouse Gas Inventories; Institute for Global Environmental Strategies: Hayama, Japan, 2006. [Google Scholar]
- Tsai, W.T. Promoting the circular economy via waste-to-power (WTP) in Taiwan. Resources 2019, 8, 95. [Google Scholar] [CrossRef]
- Completed Taiwan’s First Energy-from-Waste (EfW) Plant Revamping Work: Gangshan Incineration Plant. Available online: http://www.ctci.com.tw/e-newsletter/EN/456/discover-reliable/article-01.html (accessed on 25 June 2019).
- Laws and Regulation (Environmental Protection Administration, Taiwan). Available online: https://oaout.epa.gov.tw/law/EngLawQuery.aspx (accessed on 24 June 2019).
- Tchobanoglous, G.; Kreith, F. Handbook of Solid Waste Management, 2nd ed.; McGraw-Hill: New York, NY, USA, 2002. [Google Scholar]
- Rhyner, C.R.; Schwartz, L.J.; Wenger, R.B.; Kohrell, M.G. Waste Management and Resource Recovery; CRC Press: Boca Raton, FL, USA, 1995. [Google Scholar]
- Vongdala, N.; Tran, H.D.; Xuan, T.D.; Teschke, R.; Khanh, T.D. Heavy metal accumulation in water, soil, and plants of municipal solid waste landfill in Vientiane, Laos. Int. J. Environ. Res. Public Health 2019, 16, 22. [Google Scholar] [CrossRef]
- Tsai, W.T.; Chou, Y.H.; Lin, C.M.; Hsu, H.C.; Lin, K.Y.; Chiu, C.S. Perspectives on resource recycling from municipal solid waste in Taiwan. Resour. Policy 2007, 32, 69–79. [Google Scholar]
- Young, C.Y.; Ni, S.P.; Fan, K.S. Working towards a zero waste environment in Taiwan. Waste Manag. Res. 2010, 28, 236–244. [Google Scholar]
- Lin, S.C.; Lin, A. The residential sector electricity use research in Taiwan (in Chinese). J. Taiwan Energy 2017, 4, 285–302. [Google Scholar]
- Johnke, B. Current situation of waste incineration and energy recovery in Germany. In Recovering Energy from Waste: Various Aspects; Grover, V.I., Grover, V.K., Hogland, W., Eds.; Science Publishers: Plymouth, UK, 2002; pp. 195–200. [Google Scholar]
- Tsai, W.T.; Lee, M.K.; Chang, J.H.; Su, T.Y.; Chang, Y.M. Characterization of bio-oil from induction-heating pyrolysis of food-processing sewage sludges using chromatographic analysis. Bioresour. Technol. 2009, 100, 2650–2654. [Google Scholar]
- Smith, D.J. Reliability, Maintainability and Risk: Practical Methods for Engineers, 9nd ed.; Butterworth-Heinemann: Oxford, UK, 2017. [Google Scholar]
- Muller, D.; Wollmer, S.; Aßbichler, D.; Murer, M.J.; Heuss-Aßbichler, S.; Rieger, K.; Hill, H.; Hartel, C.; Masset, P.J. High temperature corrosion studies of a zirconia coating: Implications for waste-to-energy (WTE) plants. Coatings 2016, 6, 36. [Google Scholar] [CrossRef]
Figure 1.
A flowchart for the major steps of the proposed methodology in this work.

Figure 2.
The variations on MSW management in Kaohsiung during the period of 2012–2017.

Figure 3.
The variations on operational efficiency (OE) of Gangshan WTE plant.


Table 1.
Summary of four WTE plants in Kaohsiung. 1
| Item | WTE Plant | |||
|---|---|---|---|---|
| Renwu | Gangshan | Central District | Southern District | |
| Area (ha) | 12.93 | 7.24 | 4.50 | 14.87 |
| Operation started | Dec. 1, 2000 | Jul. 19, 2001 | Sep. 1 1999 | Jan. 20, 2000 |
| Operation mode | Private-operate | Private-operate | State-operate | State-operate |
| Design capacity (MT/day) | 1350 | 1350 | 900 | 1800 |
| Design power generated (MW) | 36.5 | 38.0 | 25.5 | 45.0 |
| Design heating value (kcal/kg) 3 | 2400 | 2500 | 1900 | 2500 |
| Furnace number | 3 | 3 | 3 | 4 |
| Incinerator type | Martin (Germany) | Takuma (Japan) | DBA (Germany) | Martin (Germany) |
| Waste type incinerated | MSW/NHIW 2 | MSW/NHIW | MSW | MSW/NHIW |
Table 2.
Generation amount of municipal solid waste (MSW) and its ways of treatment in Kaohsiung. 1
| Year | MSW Recycled | Incineration | Sanitary Landfill | Sum | |||
|---|---|---|---|---|---|---|---|
| Bulk Waste | Food Waste 2 | Recyclable Waste 3 | Total | ||||
| 2012 | 5362 | 80,522 | 408,128 | 494,012 | 482,137 | 18,534 | 994,684 |
| 2013 | 7211 | 90,809 | 404,315 | 502,335 | 439,049 | 12,203 | 953,586 |
| 2014 | 8692 | 95,824 | 410,115 | 514,631 | 415,244 | 12,112 | 941,987 |
| 2015 | 4187 | 95,775 | 415,291 | 515,253 | 399,421 | 9324 | 923,999 |
| 2016 | 4698 | 88,745 | 406,667 | 500,110 | 389,254 | 8343 | 897,707 |
| 2017 | 3540 | 89,536 | 435,677 | 528,753 | 389,658 | 8438 | 926,848 |
1 Source [18]; unit: metric ton. 2 For composting and pig feed. 3 Including, paper, plastics, metals, and so on.
Table 3.
Physical compositions of municipal solid waste (MSW) in Kaohsiung. 1
| Year | Combustibles (wt. %, Wet Basis) | Incombustibles 2 (wt. %) | ||||||
|---|---|---|---|---|---|---|---|---|
| Papers | Textiles | Garden Trimmings | Food Waste | Plastics | Leather and Rubber | Others | ||
| 2012 | 37.18 | 2.44 | 3.97 | 36.88 | 17.26 | 0.45 | 0.20 | 1.62 |
| 2013 | 35.61 | 3.50 | 2.55 | 34.66 | 20.16 | 1.00 | 0.09 | 2.45 |
| 2014 | 40.80 | 2.40 | 2.82 | 32.16 | 18.15 | 0.74 | 0.06 | 2.88 |
| 2015 | 36.84 | 2.49 | 1.24 | 41.67 | 15.78 | 0.07 | 0.42 | 1.49 |
| 2016 | 28.67 | 2.19 | 0.85 | 52.09 | 12.39 | 0.15 | 1.49 | 2.20 |
| 2017 | 36.55 | 3.02 | 1.32 | 39.19 | 16.74 | 0.19 | 0.83 | 2.16 |
1 Source [18]. 2 Including iron, non-iron metals, glass, and other incombustibles.
Table 4.
Chemical compositions and calorific values of municipal solid waste (MSW) in Kaohsiung. 1
| Year | Combustibles (wt. %) | Moisture (wt. %) | Ash (wt. %) | LHV 2 (MJ/kg) | HHV 3 (MJ/kg) | ||||||
|---|---|---|---|---|---|---|---|---|---|---|---|
| Carbon | Hydrogen | Oxygen | Nitrogen | Sulfur | Chlorine | Total | |||||
| 2012 | 20.63 | 2.04 | 15.90 | 0.99 | 0.09 | 0.32 | 40.27 | 54.76 | 4.97 | 6.96 | 8.80 |
| 2013 | 26.02 | 6.03 | 14.11 | 0.80 | 0.08 | 0.29 | 47.31 | 46.85 | 5.84 | 8.46 | 11.00 |
| 2014 | 25.71 | 3.10 | 19.77 | 0.76 | 0.02 | 0.17 | 49.51 | 44.78 | 5.71 | 9.57 | 11.39 |
| 2015 | 22.01 | 2.86 | 14.31 | 0.34 | 0.15 | 0.04 | 39.71 | 55.14 | 5.16 | 7.67 | 9.70 |
| 2016 | 17.89 | 2.63 | 10.81 | 0.46 | 0.14 | 0.14 | 32.07 | 61.90 | 6.04 | 6.22 | 8.37 |
| 2017 | 23.61 | 3.65 | 14.77 | 0.34 | 0.15 | 0.08 | 42.60 | 51.34 | 6.07 | 8.96 | 11.08 |
1 Source [18]. 2 Lower heating value (wet basis). 3 Higher heating value (wet basis).
Table 5.
Operational performance of four WTE plants in Kaohsiung during the years 2016–2018. 1
| Item | Renwu | Gangshan | Central District | Southern District | ||||||||
|---|---|---|---|---|---|---|---|---|---|---|---|---|
| 2016 | 2017 | 2018 | 2016 | 2017 | 2018 | 2016 | 2017 | 2018 | 2016 | 2017 | 2018 | |
| Bottom ash generated (MT) | 73,659 | 73,659 | 82,370 | 34,952 | 34,952 | 59,762 | 25,992 | 25,992 | 23,388 | 62,344 | 62,344 | 58,659 |
| Fly ash generated (MT) | 21,883 | 21,883 | 21,007 | 14,800 | 14,800 | 20,157 | 11,487 | 11,487 | 9443 | 26,662 | 26,662 | 24,724 |
| Power generated (MW-h) | 252,167 | 252,167 | 248,364 | 120,868 | 120,868 | 196,255 | 70,203 | 70,203 | 59,17 | 188,58 | 188,585 | 200,052 |
| Power sold (MW-h) | 204,420 | 204,420 | 200,802 | 83,581 | 83,581 | 151,648 | 46,064 | 46,064 | 39.890 | 141,049 | 141,049 | 153,039 |
| Power-sold percentage (%) | 81.07 | 81.07 | 80.85 | 69.15 | 69.15 | 77.27 | 65.62 | 65.62 | 67.41 | 74.79 | 74.79 | 76.50 |
| Power-sold income (NT$ × 106) | 363 | 363 | 378 | 139 | 139 | 292 | 90 | 90 | 68 | 229 | 229 | 278 |
| Operation hour (hr) | 23,220 | 23,641 | 23,297 | 21,735 | 18,665 | 22,940 | 18,682 | 20,160 | 16,237 | 21,950 | 21,938 | 23,203 |
| Shut-down hour (hr) | 3232 | 2639 | 2983 | 4617 | 7615 | 3340 | 7670 | 6120 | 10,043 | 13,186 | 13,102 | 11,837 |
1 Source [18].
Table 6.
Analysis of operational efficiencies of four WTE plants in Kaohsiung during the years 2003–2018. 1.
Table 6.
Analysis of operational efficiencies of four WTE plants in Kaohsiung during the years 2003–2018. 1.
| Year | Renwu | Gangshan | Central District | Southern District | ||||||||
|---|---|---|---|---|---|---|---|---|---|---|---|---|
| P 2 (MW-h) | W 3 (MT) | OE 4 (kW-h/kg) | P (MW-h) | W (MT) | OE 4 (kW-h/kg) | P (MW-h) | W (MT) | OE 4 (kW-h/kg) | P (MW-h) | W (MT) | OE 4 (kW-h/kg) | |
| 2003 | 182,830 | 338,023 | 0.541 | 204,286 | 366,980 | 0.557 | 78,148 | 245,923 | 0.321 | 192,737 | 390,853 | 0.493 |
| 2004 | 230,417 | 388,599 | 0.593 | 184,212 | 330,881 | 0.557 | 57,104 | 242,063 | 0.236 | 237,043 | 453,593 | 0.523 |
| 2005 | 217,143 | 367,572 | 0.591 | 186,497 | 335,542 | 0.556 | 88,435 | 241,812 | 0.366 | 221,907 | 448,080 | 0.495 |
| 2006 | 215,311 | 380,822 | 0.565 | 161,981 | 273,450 | 0.592 | 81,572 | 220,307 | 0.370 | 184,037 | 367,154 | 0.501 |
| 2007 | 233,786 | 422,434 | 0.553 | 166,487 | 307,171 | 0.542 | 68,617 | 215,197 | 0.319 | 167,153 | 369,294 | 0.453 |
| 2008 | 207,232 | 378,263 | 0.548 | 157,734 | 301,236 | 0.524 | 69,331 | 205,197 | 0.338 | 145,704 | 323,197 | 0.451 |
| 2009 | 182,946 | 349,248 | 0.524 | 162,161 | 300,474 | 0.540 | 67,193 | 203,473 | 0.330 | 119,558 | 297,373 | 0.402 |
| 2010 | 244,507 | 441,411 | 0.554 | 175,749 | 307,783 | 0.571 | 9474 | 96,669 | 0.098 | 153,592 | 373,227 | 0.412 |
| 2011 | 238,520 | 443,461 | 0.538 | 171,632 | 327,320 | 0.524 | 39,191 | 158,602 | 0.247 | 151,709 | 343,000 | 0.442 |
| 2012 | 234,038 | 434,467 | 0.539 | 179,161 | 346,538 | 0.517 | 56,673 | 177,793 | 0.319 | 149,427 | 348,476 | 0.429 |
| 2013 | 220,241 | 391,344 | 0.563 | 162,330 | 314,713 | 0.516 | 44,411 | 178,042 | 0.249 | 166,415 | 405,396 | 0.410 |
| 2014 | 249,593 | 425,680 | 0.586 | 157,508 | 295,494 | 0.527 | 59,408 | 196,790 | 0.302 | 163,994 | 367,981 | 0.446 |
| 2015 | 250,237 | 424,347 | 0.590 | 170,132 | 322,822 | 0.527 | 46,300 | 202,816 | 0.228 | 195,290 | 430,310 | 0.454 |
| 2016 | 243,776 | 421,507 | 0.578 | 143,972 | 284,293 | 0.506 | 51,821 | 213,473 | 0.243 | 178,085 | 374,989 | 0.475 |
| 2017 | 252,167 | 420,963 | 0.599 | 120,868 | 225,867 | 0.535 | 70,203 | 224,688 | 0.312 | 188,585 | 364,932 | 0.517 |
| 2018 | 248,364 | 398,870 | 0.623 | 196,255 | 334,157 | 0.587 | 59,172 | 188,568 | 0.314 | 200,052 | 377,135 | 0.530 |
1 Source [18]. 2 Total electricity generated. 3 Total amount of waste incinerated. 4 Operational efficiency (OE) was based on the ratio of total generated electricity to total incinerated waste.
© 2019 by the author. Licensee MDPI, Basel, Switzerland. This article is an open access article distributed under the terms and conditions of the Creative Commons Attribution (CC BY) license (http://creativecommons.org/licenses/by/4.0/).
Share and Cite
MDPI and ACS Style
Tsai, W.-T. An Analysis of Operational Efficiencies in the Waste-to-Energy (WTE) Plants of Kaohsiung Municipality (Taiwan). Resources 2019, 8, 125. https://0-doi-org.brum.beds.ac.uk/10.3390/resources8030125
AMA Style
Tsai W-T. An Analysis of Operational Efficiencies in the Waste-to-Energy (WTE) Plants of Kaohsiung Municipality (Taiwan). Resources. 2019; 8(3):125. https://0-doi-org.brum.beds.ac.uk/10.3390/resources8030125
Chicago/Turabian StyleTsai, Wen-Tien. 2019. "An Analysis of Operational Efficiencies in the Waste-to-Energy (WTE) Plants of Kaohsiung Municipality (Taiwan)" Resources 8, no. 3: 125. https://0-doi-org.brum.beds.ac.uk/10.3390/resources8030125
Note that from the first issue of 2016, this journal uses article numbers instead of page numbers. See further details here.