Article

Rill Erosion and Soil Quality in Forest and Deforested Ecosystems with Different Morphological Characteristics

by
Misagh Parhizkar
1,*,
Mahmood Shabanpour
1,
Demetrio Antonio Zema
2 and
Manuel Esteban Lucas-Borja
3
1
Soil Science Department, Faculty of Agricultural Sciences, University of Guilan, Rasht 41635-1314, Iran
2
Department AGRARIA, Mediterranean University of Reggio Calabria, Loc. Feo di Vito, I-89122 Reggio Calabria, Italy
3
Escuela Técnica Superior Ingenieros Agrónomos y Montes, Universidad de Castilla-La Mancha, Campus Universitario, E-02071 Albacete, Spain
*
Author to whom correspondence should be addressed.
Submission received: 23 September 2020 / Revised: 29 October 2020 / Accepted: 31 October 2020 / Published: 5 November 2020

Abstract

:
Rill detachment capacity is a key parameter in concentrated flow erosion. Rill erosion generally turns into gully erosion with severe environmental impacts. Changes in land use and human activities can have heavy effects in rill formation, particularly in forests subject to deforestation; soil morphology plays a significant role in these effects. However, literature reports few studies about rill detachment rates and their implications on soil quality in forest and deforested soils with different morphological characteristics. To fill these gaps, this study has evaluated the rill detachment capacity (Dc) and the main soil quality indicators in three areas (upper, middle and lower slope) of forest and deforested (for 10 years) hillslopes exposed to the north and south in Northern Iran. The variations of Dc have been measured on soil samples under laboratory conditions through a flume experiment at three slope gradients (12 to 19%) and five flow rates (0.22 to 0.67 L m−1 s−1) with four replications. The large and significant (p < 0.05) difference (about 70%) detected for Dc between forest and deforested hillslopes was associated to the higher organic matter content of forest areas; as a consequence, these areas also showed higher aggregate stability, porosity, root weight density, microbial respiration and available water. In the deforested hillslopes exposed to the south, the soil erodibility was higher by 12% compared to those exposed to the north. The differences in the monitored soil quality indicators were instead less noticeable and not always significant (p < 0.05). Conversely, Dc did not significantly change (p < 0.05) among the upper, middle and lower hillslope areas investigated in this study. Simple but accurate models to predict the rill detachment capacity, erodibility and critical shear stress of soils from indicators of soil quality or the unit stream power using regression equations are suggested. Overall, the results can support land planners in prioritizing the actions for soil conservation in deforested hillslopes exposed to the south as well as in the extensive application of the proposed equations in erosion prediction models.

1. Introduction

The forest resources play a fundamental role in the survival of the entire planet. However, both forest plants and soils are subject to several degradation factors [1] due to natural and anthropogenic processes (e.g., climate change, erosion, deforestation, wildfire, urbanization) [2]. In particular, the conservation of forest soil quality is vital to allow ecosystem functions, such as wood production, C sequestration and land conservation [3,4].
In forests with high to medium steep hillslopes, erosion may be one of the most serious threats to soil quality. Soil erosion determines heavy on-site (e.g., loss of agricultural soil, decline of soil fertility) and off-site (e.g., burial of infrastructures, pollutant transport) impacts [5,6]. These negative effects can be aggravated by soil management practices and land use changes. Inappropriate soil management, such as the continuous mechanical tillage, may increase the erosion rates [7] and deteriorate the soil quality by degrading their properties [8,9,10]. The land use changes, such as the intensification of agricultural cultivation, farmland abandonment and deforestation [9,11] may expose the soil to rainfall erosivity, determining high runoff and soil erosion rates.
In the overall erosion process a key role is played by soil detachment due to the concentrated flow [12,13,14]. Soil detachment due to rill erosion (henceforth “rill detachment”) is the most important erosive process on steep slopes [15,16]. Rills, which are the shallowest form of linear erosion, generally turn into gullies. It has been reported that linear erosion accounts for 10–94% of catchment sediment exports by water [17]. Gully erosion results in irreversible losses of fertile land, which often have severe environmental, economic and social consequences [18].
The maximum value of the rill detachment (“rill detachment capacity”) [19] has been evaluated under different flow conditions and soil surface characteristics in the past decades both in laboratory and field experiments [20,21,22]. Moreover, several studies have shown that rill detachment significantly influences important physical, chemical and biological properties of soil [20,22,23], which are commonly used as indicators of soil quality [9,24], such as the root weight density, texture [25,26,27], bulk density, aggregate stability and organic matter content [22,28]. In addition to these properties, other morphological factors, such as the slope gradient, position and aspect of hillslopes, can influence the spatial variability of soil characteristics [29,30] and therefore may affect its erodibility [8,22,31]. It is thus evident that many soil parameters must be considered when it is necessary to evaluate the erodibility.
Changes in land use affect soil erodibility and rill formation, particularly in very delicate ecosystems, such as forests and woodlands. Under these land uses, human activities (e.g., deforestation and forest conversion into agricultural activities) may aggravate the susceptibility to soil erosion, and lead to rill and gully formation. Few studies have evaluated the effects of land use changes and, specifically, of human activities on rill erodibility in forest soils [26,27]. According to Zhang et al. [26,32], the detachment rate of agricultural soil was 2-fold to 13-fold the soil erodibility in grassland, shrubland and wasteland; these authors have not focused on forestland. The soil detachment capacity of cropland due to overland flow was 7 to 45 times higher compared to orchards, shrubland, woodland, grassland and wasteland [31]. More recently, Parhizkar et al. [27] showed that the rill detachment capacity of cropland was two-fold, four-fold and six-fold greater than in grassland, woodland and forestland, respectively; the reduced rill detachment capacity in forest areas was the consequence of the more developed vegetation cover and structure. This was confirmed by Hao et al. [33], who showed that root functional traits of vegetation improve several physical properties of soil and particularly rill detachment capacity. The length of rills and gullies progressively increases from forest to settlement through grassland and cropland [34].
In addition to land use changes and human activities, soil morphology plays a key role in concentrated flow erosion [34]. According to Dube et al. [34], despite their widespread occurrence, variations of concentrated flow erosion with soil morphology and properties have received limited attention. Moreover, the literature about rill detachment capacity and its effects on soil properties in hillslopes with different morphology and management is not only scarce, but the results of the few available studies are also contrasting. For example, with regard the hillslope position (upper, middle and lower part), Khormali et al. [8] showed that the upper positions of deforested areas are more sensitive to erosion, since in these positions almost two-thirds of the organic matter is depleted and infiltration is lower; however, these authors did not explore soil detachment capacity. Conversely, Wang et al. [22] found that soil detachment capacity is significantly higher on lower positions (on average, by about 70% compared to upslope areas) [22]. Again, Wang et al. [22] and Zhang et al. [26] found that the rill detachment capacity increases with the slope by an exponential law. Moreover, very few studies have explored the relations between the rill detachment capacity and the changes in physico-chemical and biological properties. Li et al. [28] demonstrated that the variability of rill detachment capacity under different land uses in soils of the Loess Plateau (China) is positively related to the silt content (r > 0.44), and inversely related (|r| < −0.24) to the sand content, cohesion, water stable aggregate, aggregate median diameter, organic matter and root density. However, although from this study it was evident that land use and soil types had significant effects on erodibility, the effects of soil morphology (e.g., aspect, slope, position) and forest activities (e.g., deforestation or lack of management) on soil detachment capacity as well as on soil quality have not been evaluated. Evidently, more research is needed to identify which morphological factors (e.g., hillslope aspects and positions) trigger rill erosion and soil quality degradation both in forest and deforested environments; moreover, reliable models to predict the soil detachment capacity from simple input parameters may support the actions of land managers to control erosion in forest and deforested ecosystems. To fill these gaps, this study aims at estimating the variability of rill detachment capacity and the associated changes in soil quality indicators in forest and deforested hillslopes with different morphological characteristics in Northern Iran. The forest hillslopes of these areas are a representative case study, because deforestation and inappropriate management have been very intense for many years [35,36]. Several factors, including urbanization, expansion of arable land and intensive practices, have reduced forest cover and soil quality, increasing soil erosion and degrading its quality [9,10,27,37]. Samples of soils were collected in forest and deforested hillslopes with different aspects (north and south) and positions (upper, middle and lower slope); the rill detachment capacity was measured on these samples using a laboratory flume at different water flow rates and soil slopes. Moreover, the main physico-chemical and biological properties of the soil samples were determined and related to the measured rill detachment capacity.
Overall, this study is useful to verify (i) whether the aspect and slope have significant effects on rill detachment capacity in forest and deforested hillslopes and (ii) which soil properties have significant effects on rill erodibility. Finally, simple models to predict rill detachment capacity from hydraulic parameters are proposed and validated for the experimental conditions.

2. Materials and Methods
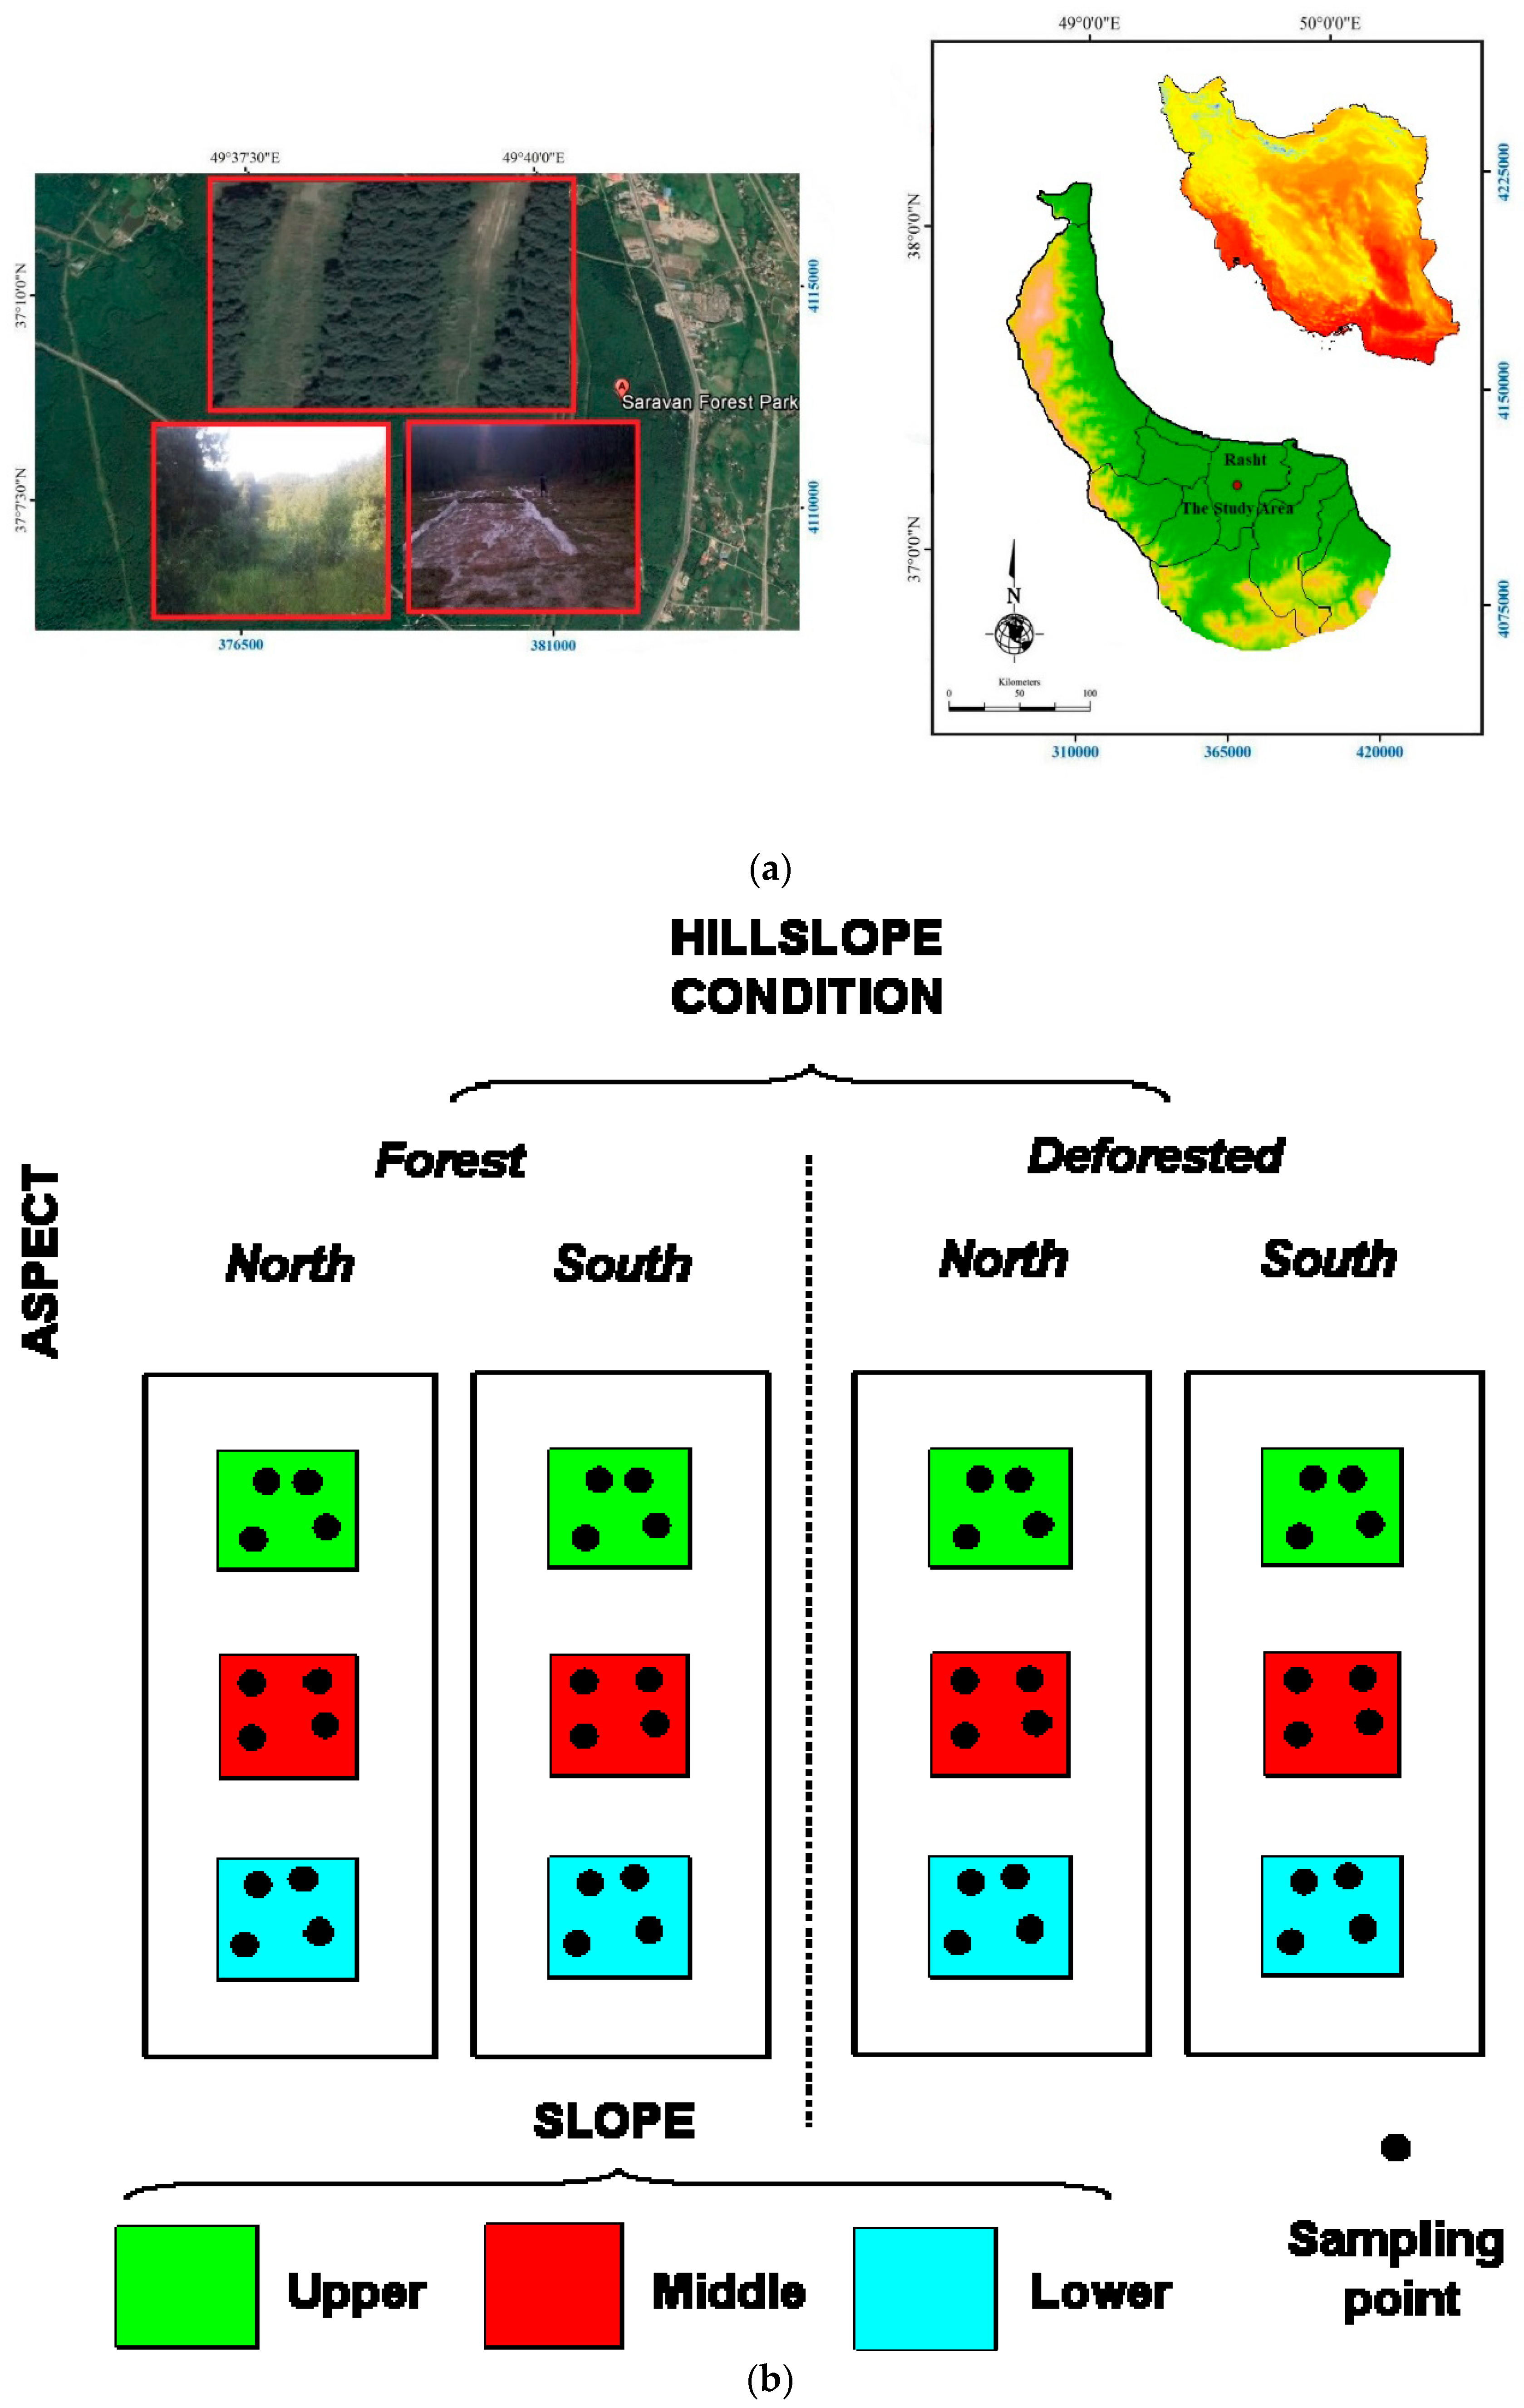
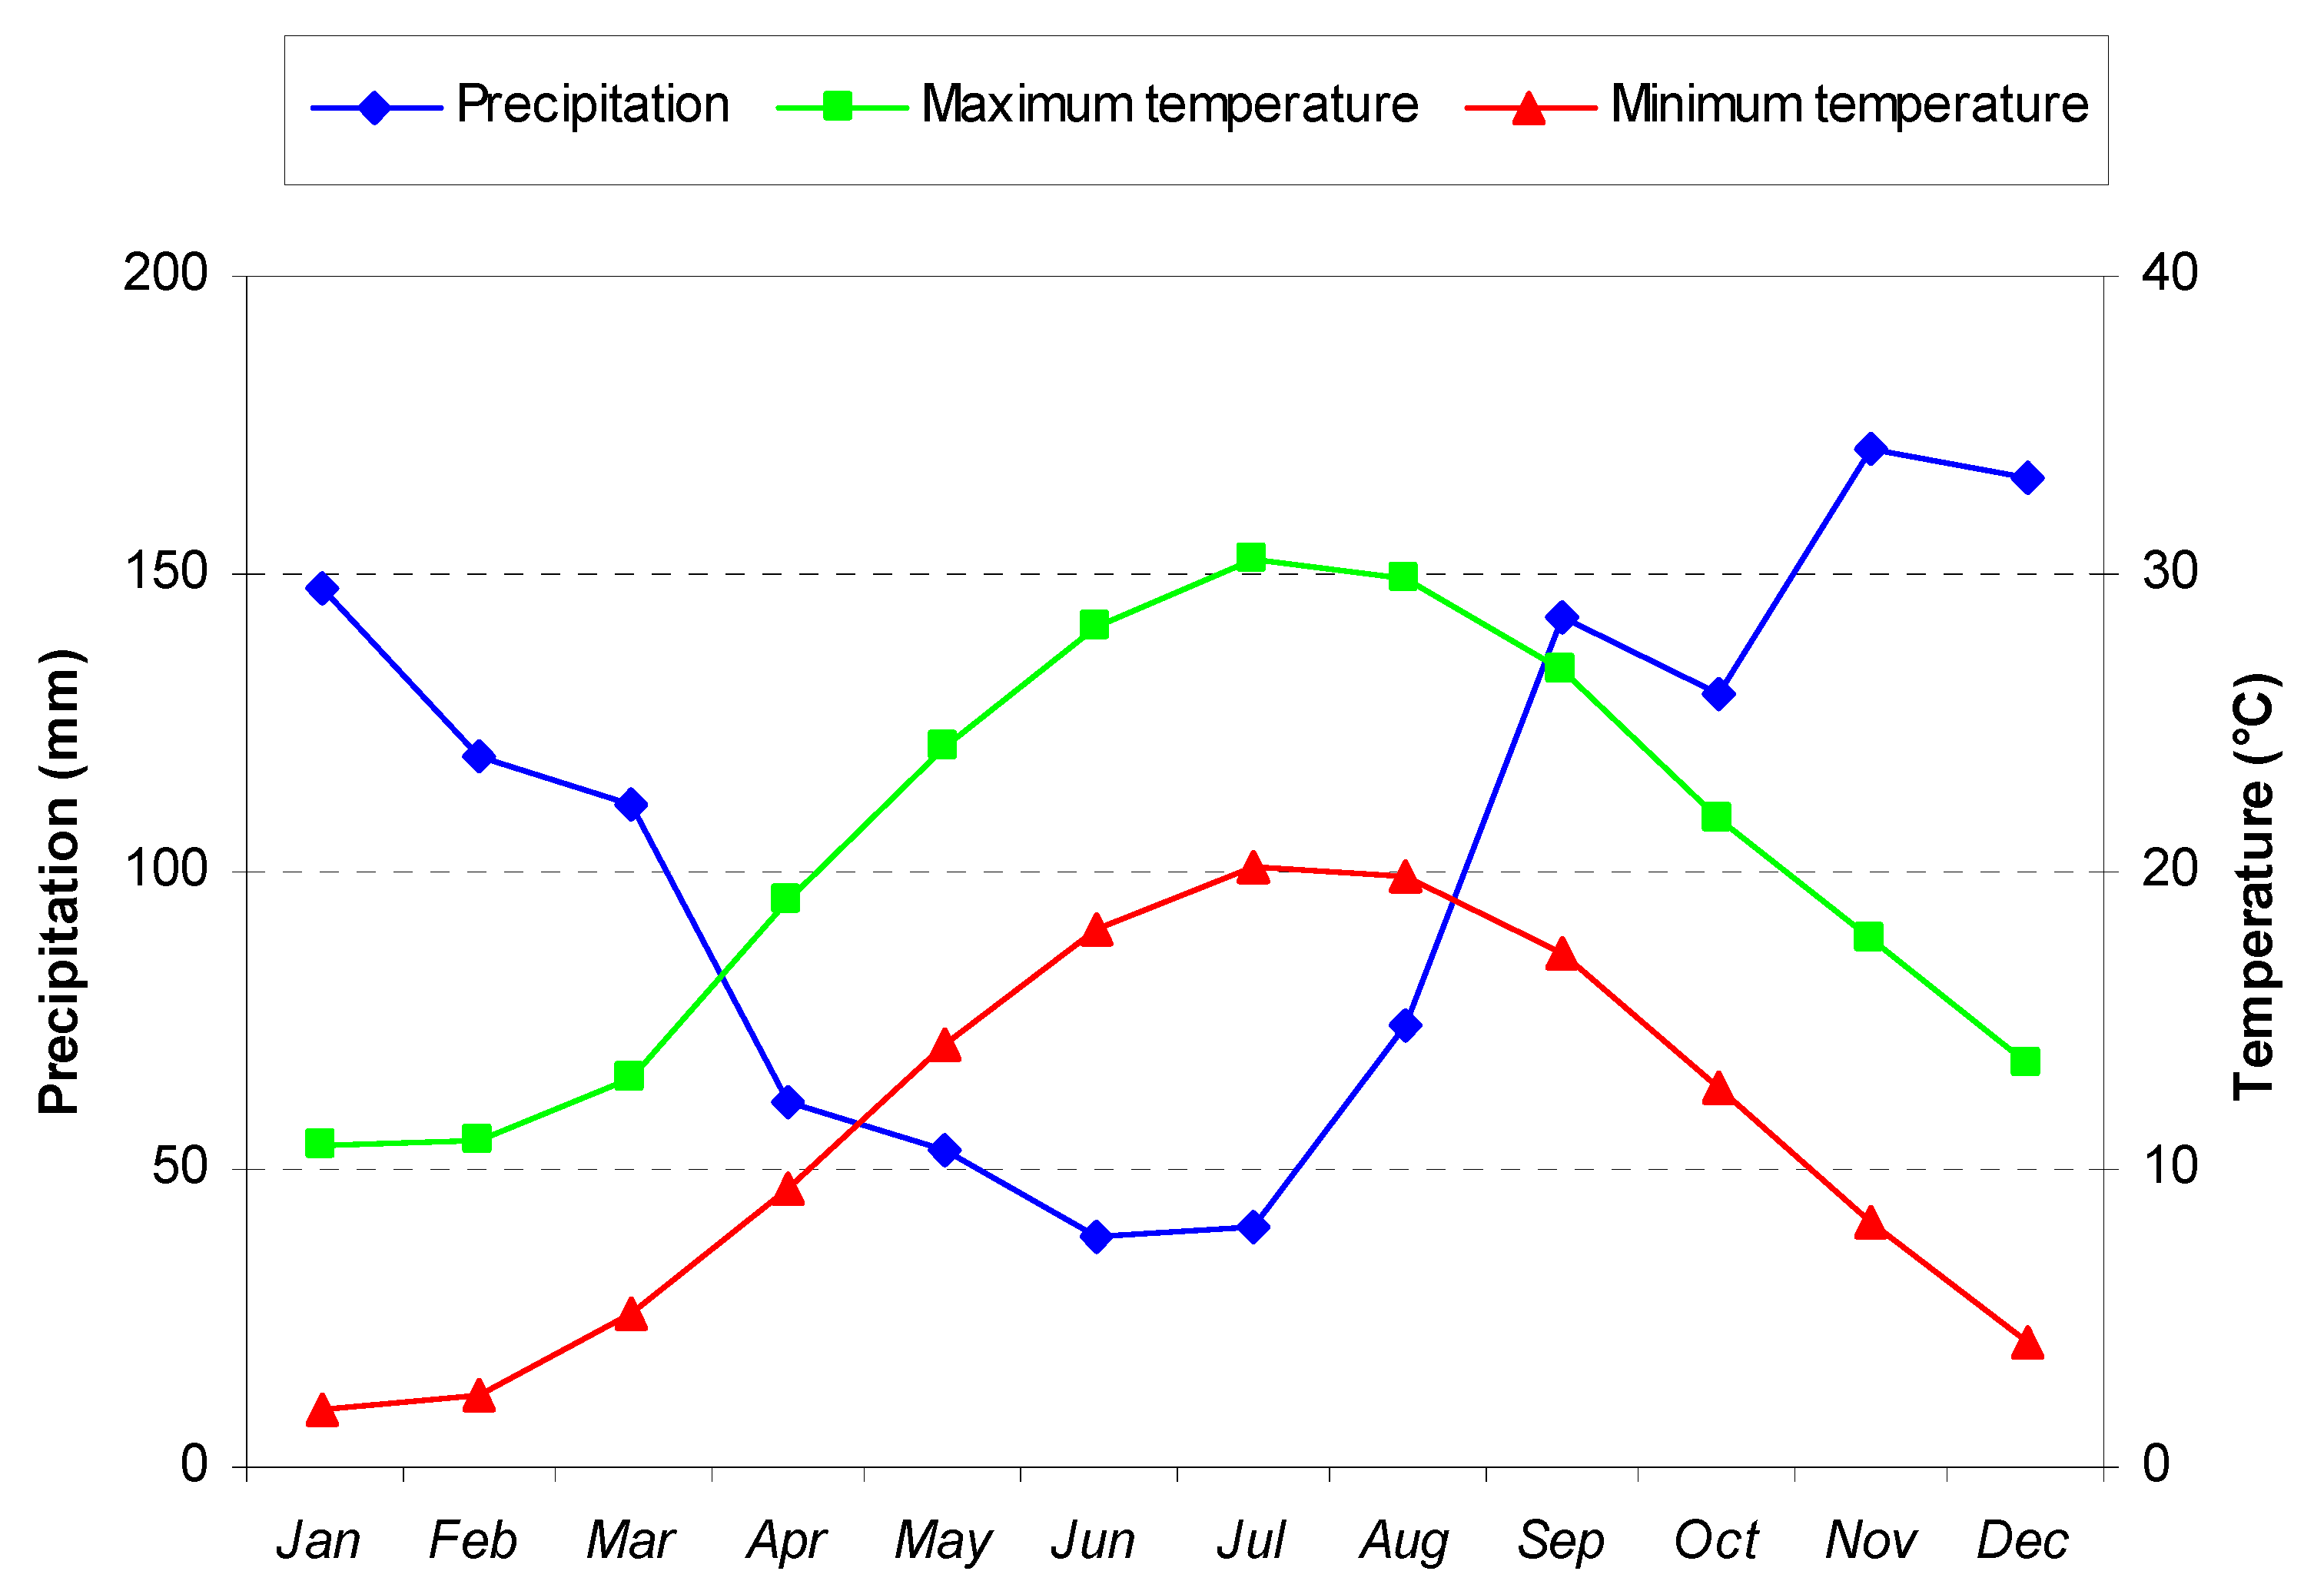
2.1. Study Area

Four hillslopes in the Saravan Forestland Park, Guilan province (37°08′04″ N, 49°39′44″ E), Northern Iran, were selected for this study (Figure 1a). The climate of this area is typically Mediterranean, Csa type according to the Köppen-Geiger classification [38]. The average annual rainfall and temperature are 1360 mm and 16.3 °C, respectively [39]. Precipitation is mainly concentrated in winter, while the hottest months are in summer (Figure 2).
The four hillslopes, about 100-m long and 20-m wide, were covered by forest trees and plants with high density; two hillslopes (hereinafter indicated as “forested hillslopes”) were not subject to any management operation, while two others were deforested about ten years ago to install high-voltage power towers (“deforested hillslopes”) [31]. One of the deforested hillslopes was exposed to south (“DS”) and one to north “(DN”); the forest hillslopes also had different aspects (“FS”, south, and “FN”, north) (Figure 1b). Each of the four hillslopes, with uniform profile (that is, with no convex or concave shape), was divided in three positions from the top to the bottom: upper, middle and lower slopes (“US”, “MS” and “LS”, respectively) (Figure 1b). The hillslopes were selected at altitudes between 50 and 250 m above the mean sea level. The mean slope gradient was about 15%. The vegetation cover was approximately 60% in LS, and lower in MS (50%) and US (30%). Vegetation was absent in the deforested hillslopes.
The soil of the study area was classified as ultic Hapludalfs with silty clay loam texture in all hillslopes [40,41]. Soil quality was variable among the investigated hillslopes, because of different conditions (forest or deforested) and morphology (aspect and position).

2.2. Soil Sampling and Analysis

The soil samples were randomly collected in three positions (US, MS and LS) of the four hillslopes (DS, DN, FS and FN) with four sampling points for each position (total of 48 samples, 2 conditions × 2 aspects × 3 positions × 4 replicates) (Figure 1b). The 48 samples were transported to the laboratory and quickly analyzed to measure the following physico-chemical and biological properties (hereinafter indicated as “soil quality indicators”): (a) organic matter (OM), by Walkley-Black method [42]; (b) aggregate stability (AS) in water; (c) porosity (SP); (d) bulk density (BD) (b, c and d using the wet-sieving and oven-drying methods) [43]; (e) microbial respiration (SMR, as soil biological activity in terms of accumulated C-CO2 using Anderson [44] method; (f) CaCO3, according to Sparks [45], expressed as calcium carbonate equivalent (CCE). Moreover, the soil texture was determined using the hydrometer method [46]. Finally, the available water (AW) of soil samples was estimated as difference between the field capacity and permanent wilting point [47]. The values of soil quality indicators are reported on Table S1 (SD) of the Supplementary Materials.

2.3. The Experimental Device and Procedure

A hydraulic flume (3.5-m long and 0.2-m wide) with a rectangular cross section was used to measure the rill detachment capacity of soil samples collected at each hillslope, considering different values of flow rate (0.26, 0.35, 0.45, 0.56, and 0.67 L m−1 s−1) and soil slope gradient (12%, 16%, and 19%). Asadi et al. [48], Raei et al. [49] and Parhizkar et al. [27] have detailed the flume characteristics in previous studies, while the experimental procedure is reported in the study of Parhizkar et al. [27]. To summarise, the soil was collected from each hillslope using a steel ring with 0.1 m in diameter and 0.05 m in height). The soil surface was wetted by light spraying and then inserted in a hole of the flume bed. Then, the water flow rate and bed slope in the flume were set at the desired values. The water discharge was measured five times per experiment, using a graduated plastic cylinder. The surface flow velocity was measured ten times using the fluorescent dye technique. More specifically, the time for the tracer to travel from the injection point to the observation point was visually estimated [50]. The average flow velocity was calculated reducing the water velocity by 0.6 for laminar flow, 0.7 for transitional flow and 0.8 for turbulent flow [51]. Water temperature was determined to compute water viscosity. The water depth was measured at three points (0.01 m from the left and right sides and in the middle) for two cross sections (located at 0.4 m and 1 m from the flume outlet) using a level probe with accuracy of 1 mm. Then, the mean value of these six measurements was the average flow depth. When the depth of the eroded soil in the steel ring reached 0.015 m, the experiment was stopped. After completing each experiment, the sample of wet soil was oven dried for 24 h at 105 °C to determine its dry weight. The flume experiments were carried out on all soil samples collected. Overall, 720 soil samples (2 conditions × 2 aspects × 3 positions × 4 sampling points × 5 water flow rates × 3 slope gradients) were tested.

2.4. Measurement of Hydraulic Parameters and Rill Detachment Capacity

The rill detachment capacity (Dc, kg s−1 m−2) was estimated as the mean value of four replicates using Equation (1):
D c = Δ M A × Δ t
where ΔM is the dry weight of detached soil (kg), A is the area of the soil sample (m2) and ∆t is the experiment duration(s).
The rill detachment capacity of the hillslopes with different conditions, aspects and positions was calculated as the average among the values measured under the replicates of different water flows and profile slopes in the flume.
Regarding the modeling approach, Dc can be predicted with accuracy by a power function of some important hydraulic parameters, such as the hydraulic shear stress, stream power and unit stream power [25,52]. Therefore, according to Foster [19] and Yang et al. [53] and assuming a rectangular cross section for rills, the hydraulic radius (R, m), mean velocity (V, m s−1), shear stress (τ, Pa) and unit stream power (ω, m s−1) were calculated as follows:
R = h p 2 p + h
τ = ρ g R S
ω = S V
where:
-
h = flow width (0.2 m in this study)
-
p = flow depth [m]
-
ρ = water density [kg m−3]
-
g = gravity acceleration [m s−2]
-
S = slope gradient [m m−1]
-
θ = slope gradient [°] of the flume.
The values of the calculated hydraulic parameters and Dc are reported in Tables S2 (SD) and S3 (SD) of the Supplementary Data.
Parhizkar et al. [27] have demonstrated that, in forest areas, ω is the hydraulic parameter that is the best predictor of Dc. Therefore, the measured values of Dc (considered as the dependent variable) were regressed on ω (independent variables) using non-linear equations based on power function, to identify the most accurate predictive model for each hillslope condition and aspect. The model has therefore the following expression:
Dc = aωb
where “a” and “b” are two coefficients that must be calibrated.
The accuracy of these regression equations was evaluated using quantitative indexes, as the relative error (RE), coefficient of determination (r2) and coefficient of efficiency (NSE) [54]. The optimal values of these indexes are one for r2 and E as well as zero for RE, while the acceptance limits of r2 and NSE are 0.50 and 0.35, respectively; the prediction capacity of a model is considered good when r2 and are higher than 0.75 [55,56,57].
Rill erodibility (Kr, s m−1) and critical shear stress (τc, Pa) are key input parameters for erosion prediction using process-based erosion models [58], such as the Water Erosion Prediction Project (WEPP) [59]. These parameters, which reflect soil resistance to rill erosion, were calculated as the slope and intercept of the following regression equation interpolating τ and Dc:
D c = K r ( τ τ c )

2.5. Statistical Analysis

First, a one-way analysis of variance (ANOVA) and Tukey’s test (at p < 0.05) were used to evaluate the statistical significance of differences in rill detachment capacity and soil quality indicators among the studied hillslopes. The condition (forest or deforested), aspect (north or south) and position (upper, middle and lower) of hillslopes were considered as independent factors, while the rill detachment capacity and quality indicators were the dependent variables. The normality of sample distribution was checked using QQ-plots. To satisfy the assumptions of the statistical tests, the data were square root transformed whenever necessary.
Then, a Principal Component Regression (PCR) [60] was used as a predictive model of rill detachment capacity (dependent variable), using the soil quality indicators (independent variables) as input. PCR is a combination of Principal Component Analysis (PCA) and Multiple Linear Regression (MLR, often an Ordinary Least Squares, OLS, regression), where the Principal Component (PC) scores are used as predictor variables and linear combinations are constructed between predictor and response variables. PCR is advised when the factors are many and highly collinear [61]. As a matter of fact, many pairs of performance indicators adopted in our study were strongly correlated (as shown by the Pearson’s correlation matrix) and therefore collinear. Since PCs are orthogonal, the multicollinearity problems of the original variables are removed [62]. PCR was implemented as follows: (i) a PCA was applied to Dc and soil quality indicators using Pearson’s matrix method [63]; (ii) an OLS regression was run on the first two PCs; (iii) the dependent variable (Dc) was calculated as a linear combination of the first three PCRs, explaining most of the variance of the original independent variables. All statistical analyses were performed using XLSTAT® software (Addinsoft, Paris, France).

3. Results

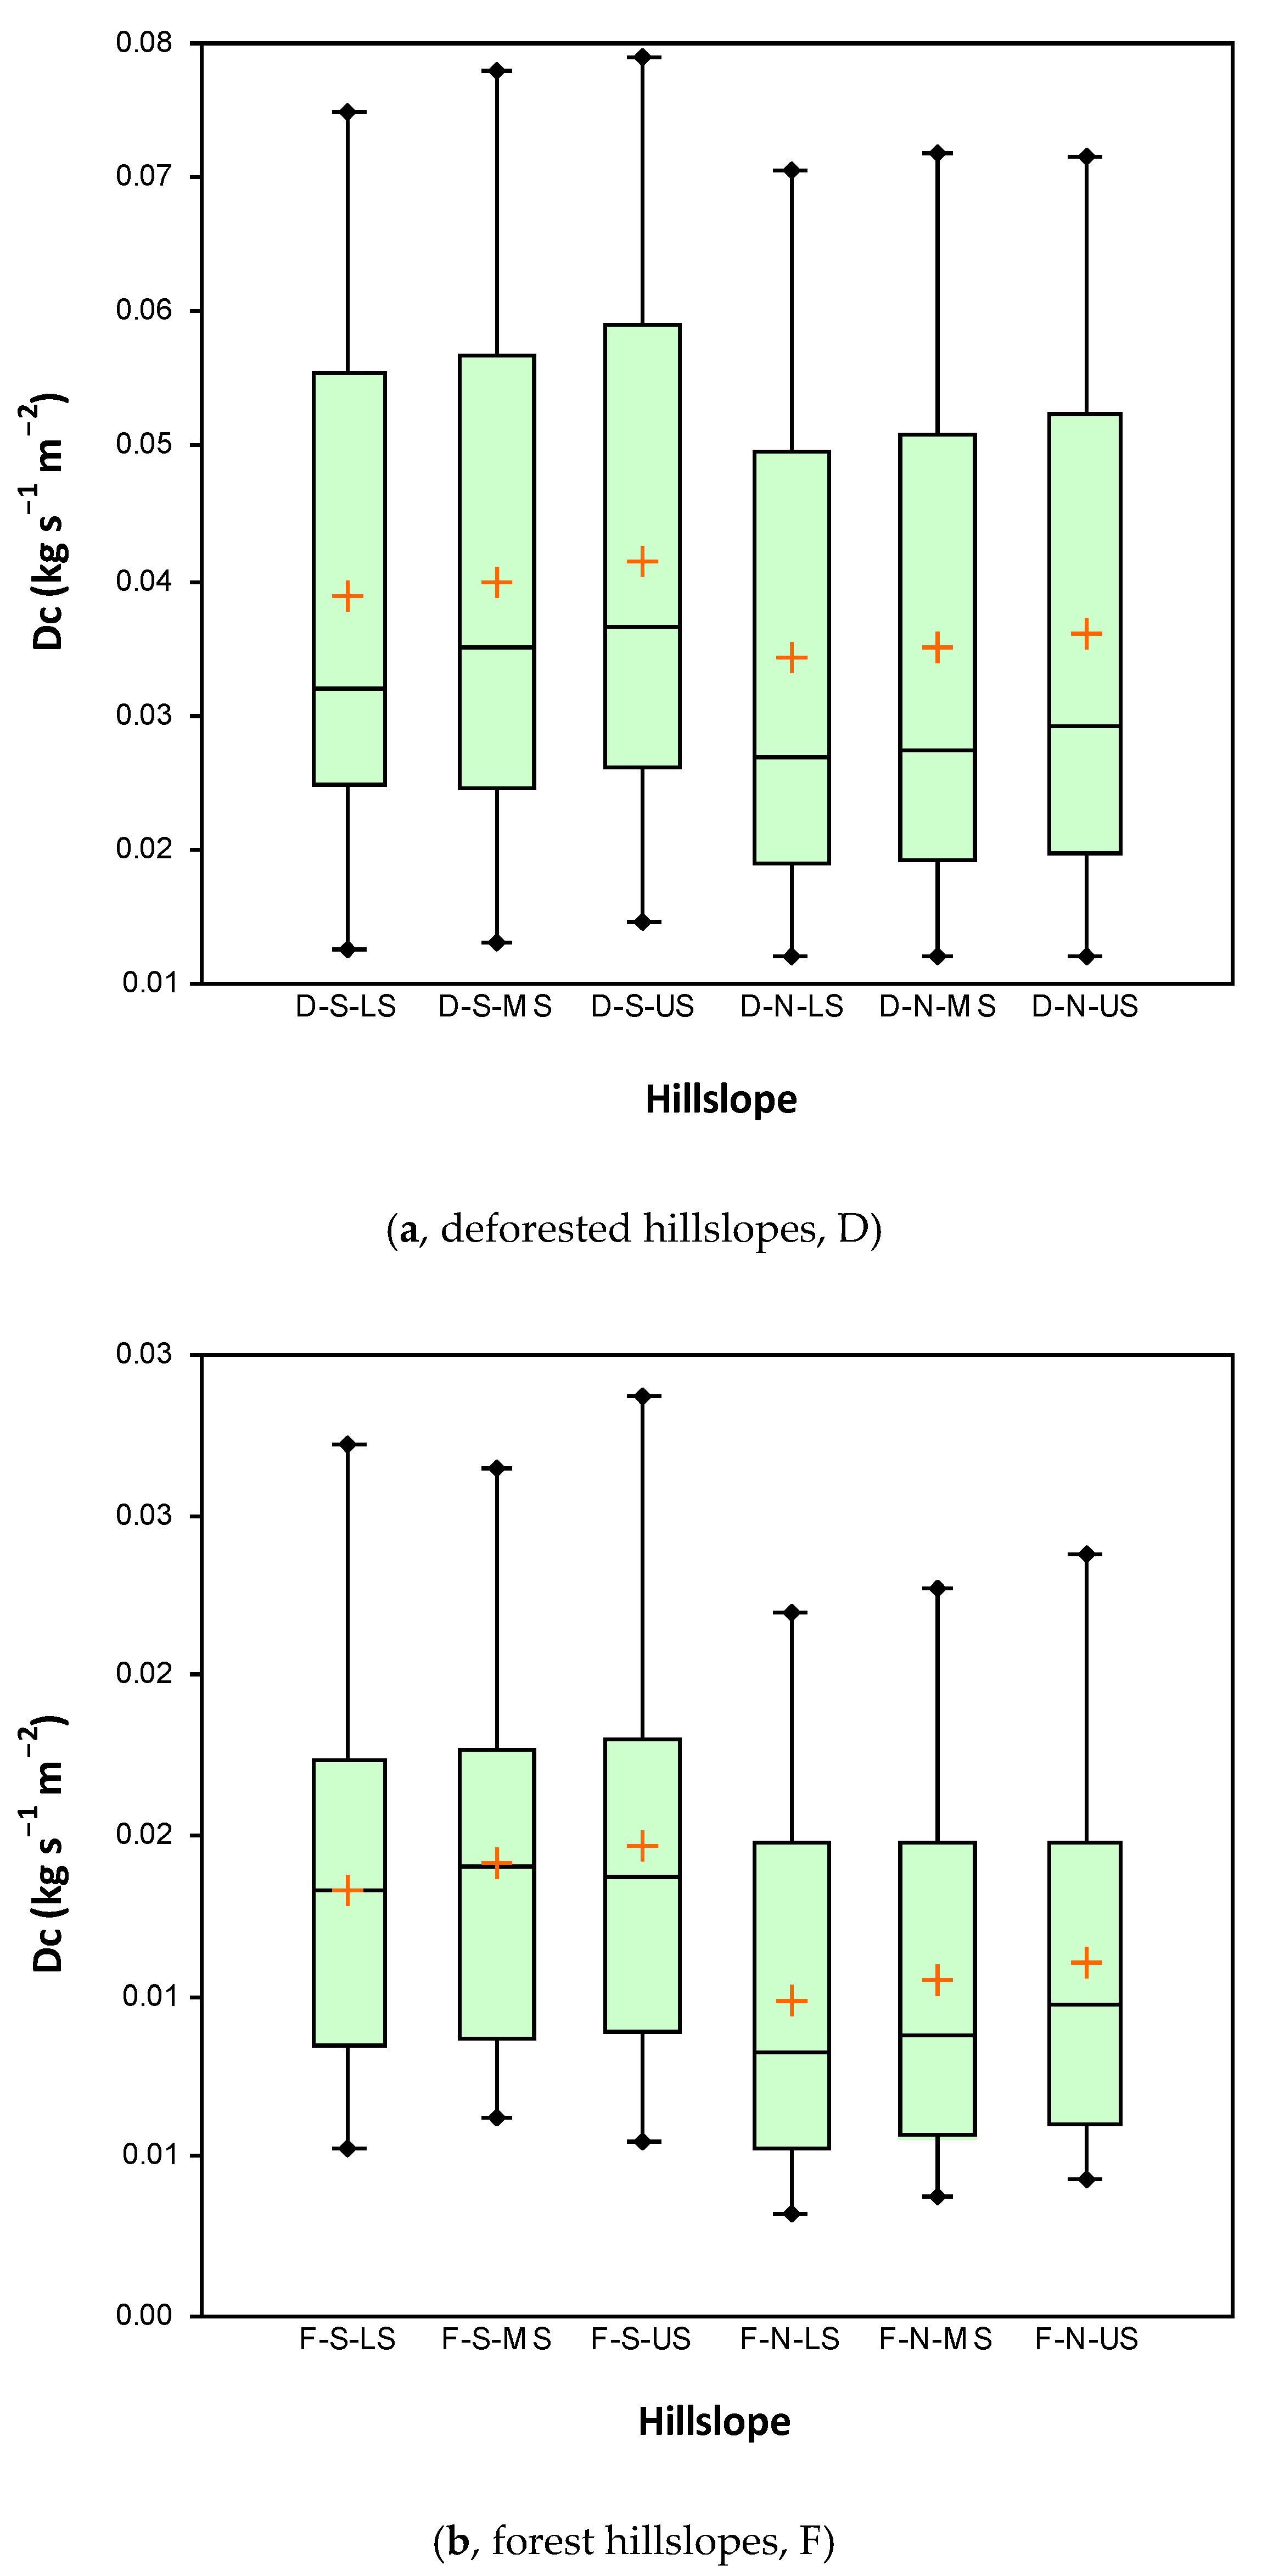
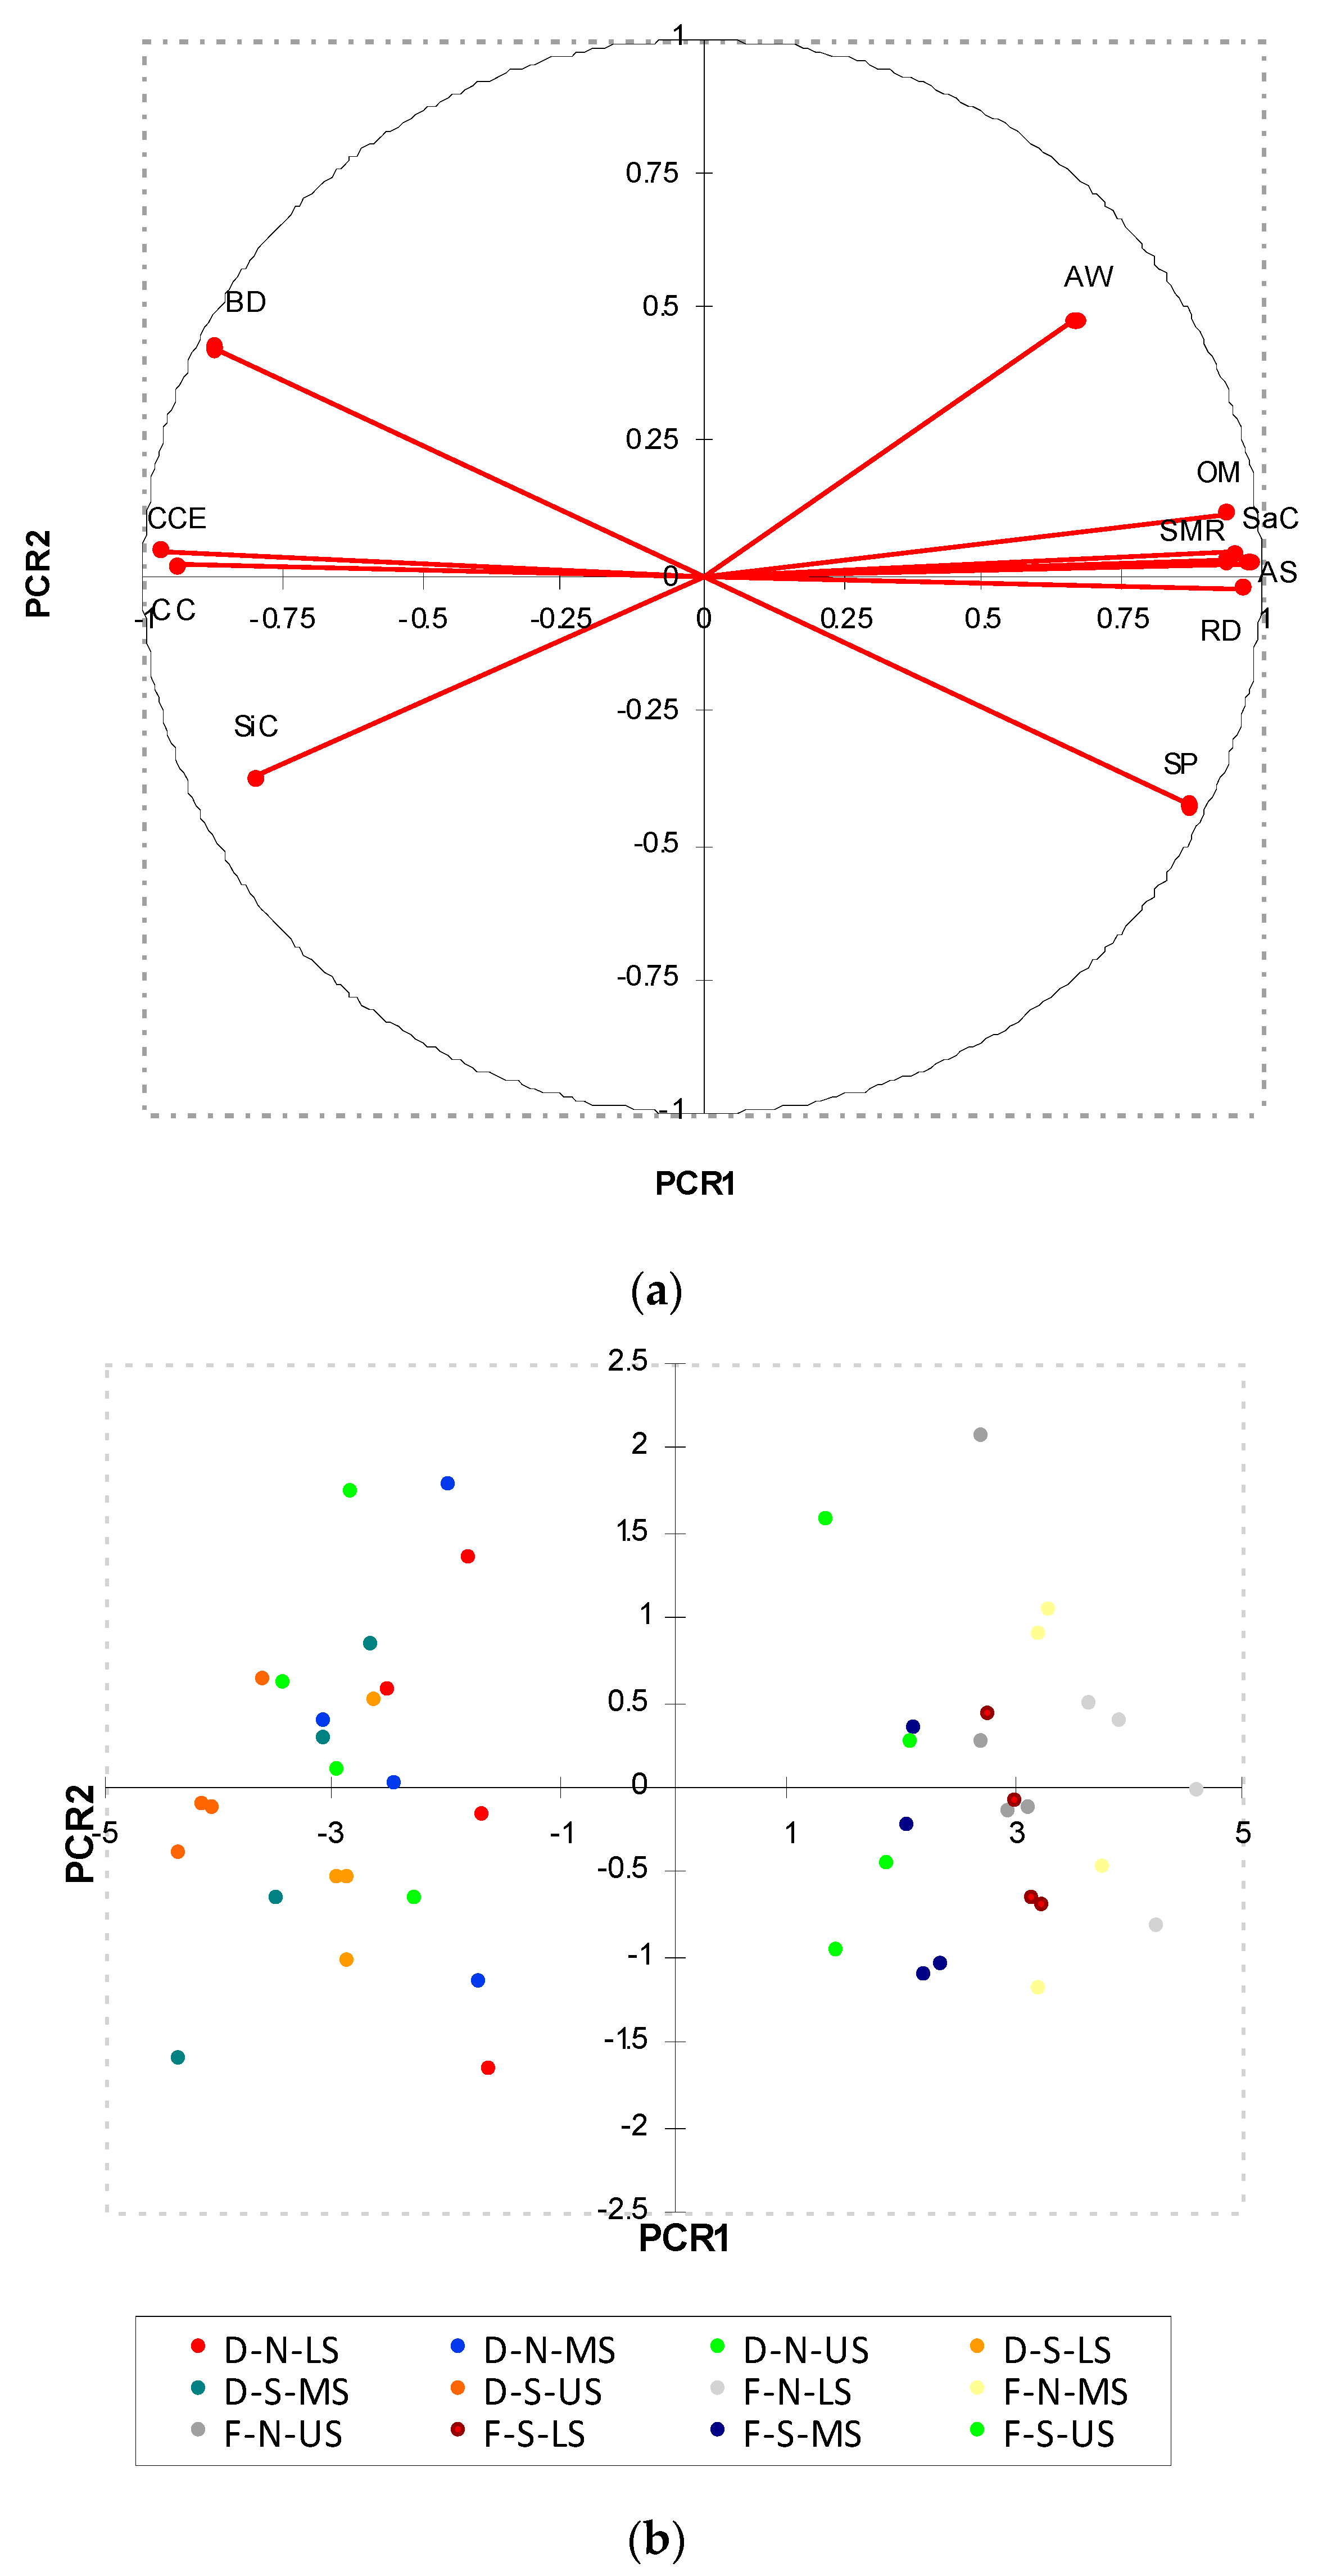
3.1. Spatial Variations of Rill Detachment Capacity and Associations with Soil Quality Indicators

ANOVA showed that Dc was significantly different between forest and deforested hillslopes and north vs. south aspects, but not among upper, middle and lower positions. On average, Dc of deforested hillslopes exposed to south or north was 0.040 ± 0.020 and 0.035 ± 0.019 kg m−2 s−1, respectively. Forest hillslopes showed Dc of 0.014 ± 0.007 (exposed to south) and 0.010 ± 0.006 kg m−2 s−1 (north aspect) (Figure 3). Regarding the soil quality indicators, the differences between forest and deforested soils were always significant according to ANOVA. In more detail, forest soils were less compacted (mean BD of 1374 ± 59.6 kg m−3) compared to the deforested areas (BD of 1554 ± 61.7 kg m−3) and the AS was higher as well (1.47 ± 0.29% against 0.69 ± 0.18% of deforested areas). The deforested hillslopes had lower SP (41.4 ± 2.33% against 48.1 ± 2.25% of forest areas) and AW (11.0 ± 1.93% against 14.5 ± 2.15%); also the OM content and SMR were lower (1.94 ± 0.36% and 0.10 ± 0.03 g of CO2 per kg of soil, respectively) compared to the forest hillslopes (3.23 ± 0.28% and 0.21 ± 0.02 g of CO2 per kg of soil). RWD of the forest hillslopes was 0.60 ± 0.11% and zero in the deforested areas (Table 1). The hillslope aspect influenced OM, RWD, AS, CCE, AW and SMR, but not the other soil quality indicators (texture, BD and SP). More specifically, OM content and AS of soils were lower in the hillslopes exposed to south (2.40 ± 0.68% and 0.96 ± 0.38%, respectively) compared to north (2.77 ± 0.74% and 1.20 ± 0.50%). The latter hillslopes showed higher SMR (0.17 ± 0.05 against 0.14 ± 0.06 g of CO2 per kg of soil) and RWD (0.11 ± 0.11 against 0.56 ± 0.63 kg m−3) compared to the soils exposed to south. Finally, the AW was higher in north (13.7 ± 2.51%) and lower in south hillslopes (11.8 ± 2.58%) (Table 1).
High coefficients of regression were detected between Dc and many soil quality indicators. In more detail, the correlations were positive with SiC (r = 0.880), ClC (r = 0.787) and CCE (r = 0.760) and negative with OM (r = −0.860), RWD (−0.796), AS (−0.768), SaC (r = −0.840) and SMR (r = −0.759). The other correlations among Dc and BD, SP and AW were lower (r < |0.662|), but always significant (Table 2).
Interesting correlations were also found between couples of soil quality indicators. For instance, OM was correlated to BD (r = −0.777), AS (r = 0.860) and SMR (r = 0.880); BD was inversely correlated to RWD (r = −0.823), on its turn strictly linked to SMR and SP (r = 0.899 and 0.823, respectively). The weakest correlations, although being always significant, were detected between AW and the other soil quality indicators (r = |0.678|) (Table 2).
The application of PCR to the soil quality indicators provided a Principal Component (PCR1) that alone explains 81.75% of the total variance of the original variables; the variance explained by the other PCRs was much lower (6.82% for PCR2). All these variables had high factor loadings on PCR1 and, particularly, OM (loading of 0.939), RWD (0.969), SMR (0.948), SaC and ClC (0.980 and −0.967, respectively) and CCE (−0.941). The loadings of all physico-chemical properties of soils on PCR2 were much lower and never significant (Table 3 and Figure 4a).
When the scores of the soil samples collected under different aspects and conditions of hillslopes were plotted on the PCR1-PCR2 chart, two evident clusters were identified. A first cluster grouped all the forest soils, associated to positive values of PCR1, while the second cluster was related to samples of deforested soils, associated to negative PCR1. No evident clusters grouping soil samples collected in hillslopes with different aspects could be found (Figure 4b).

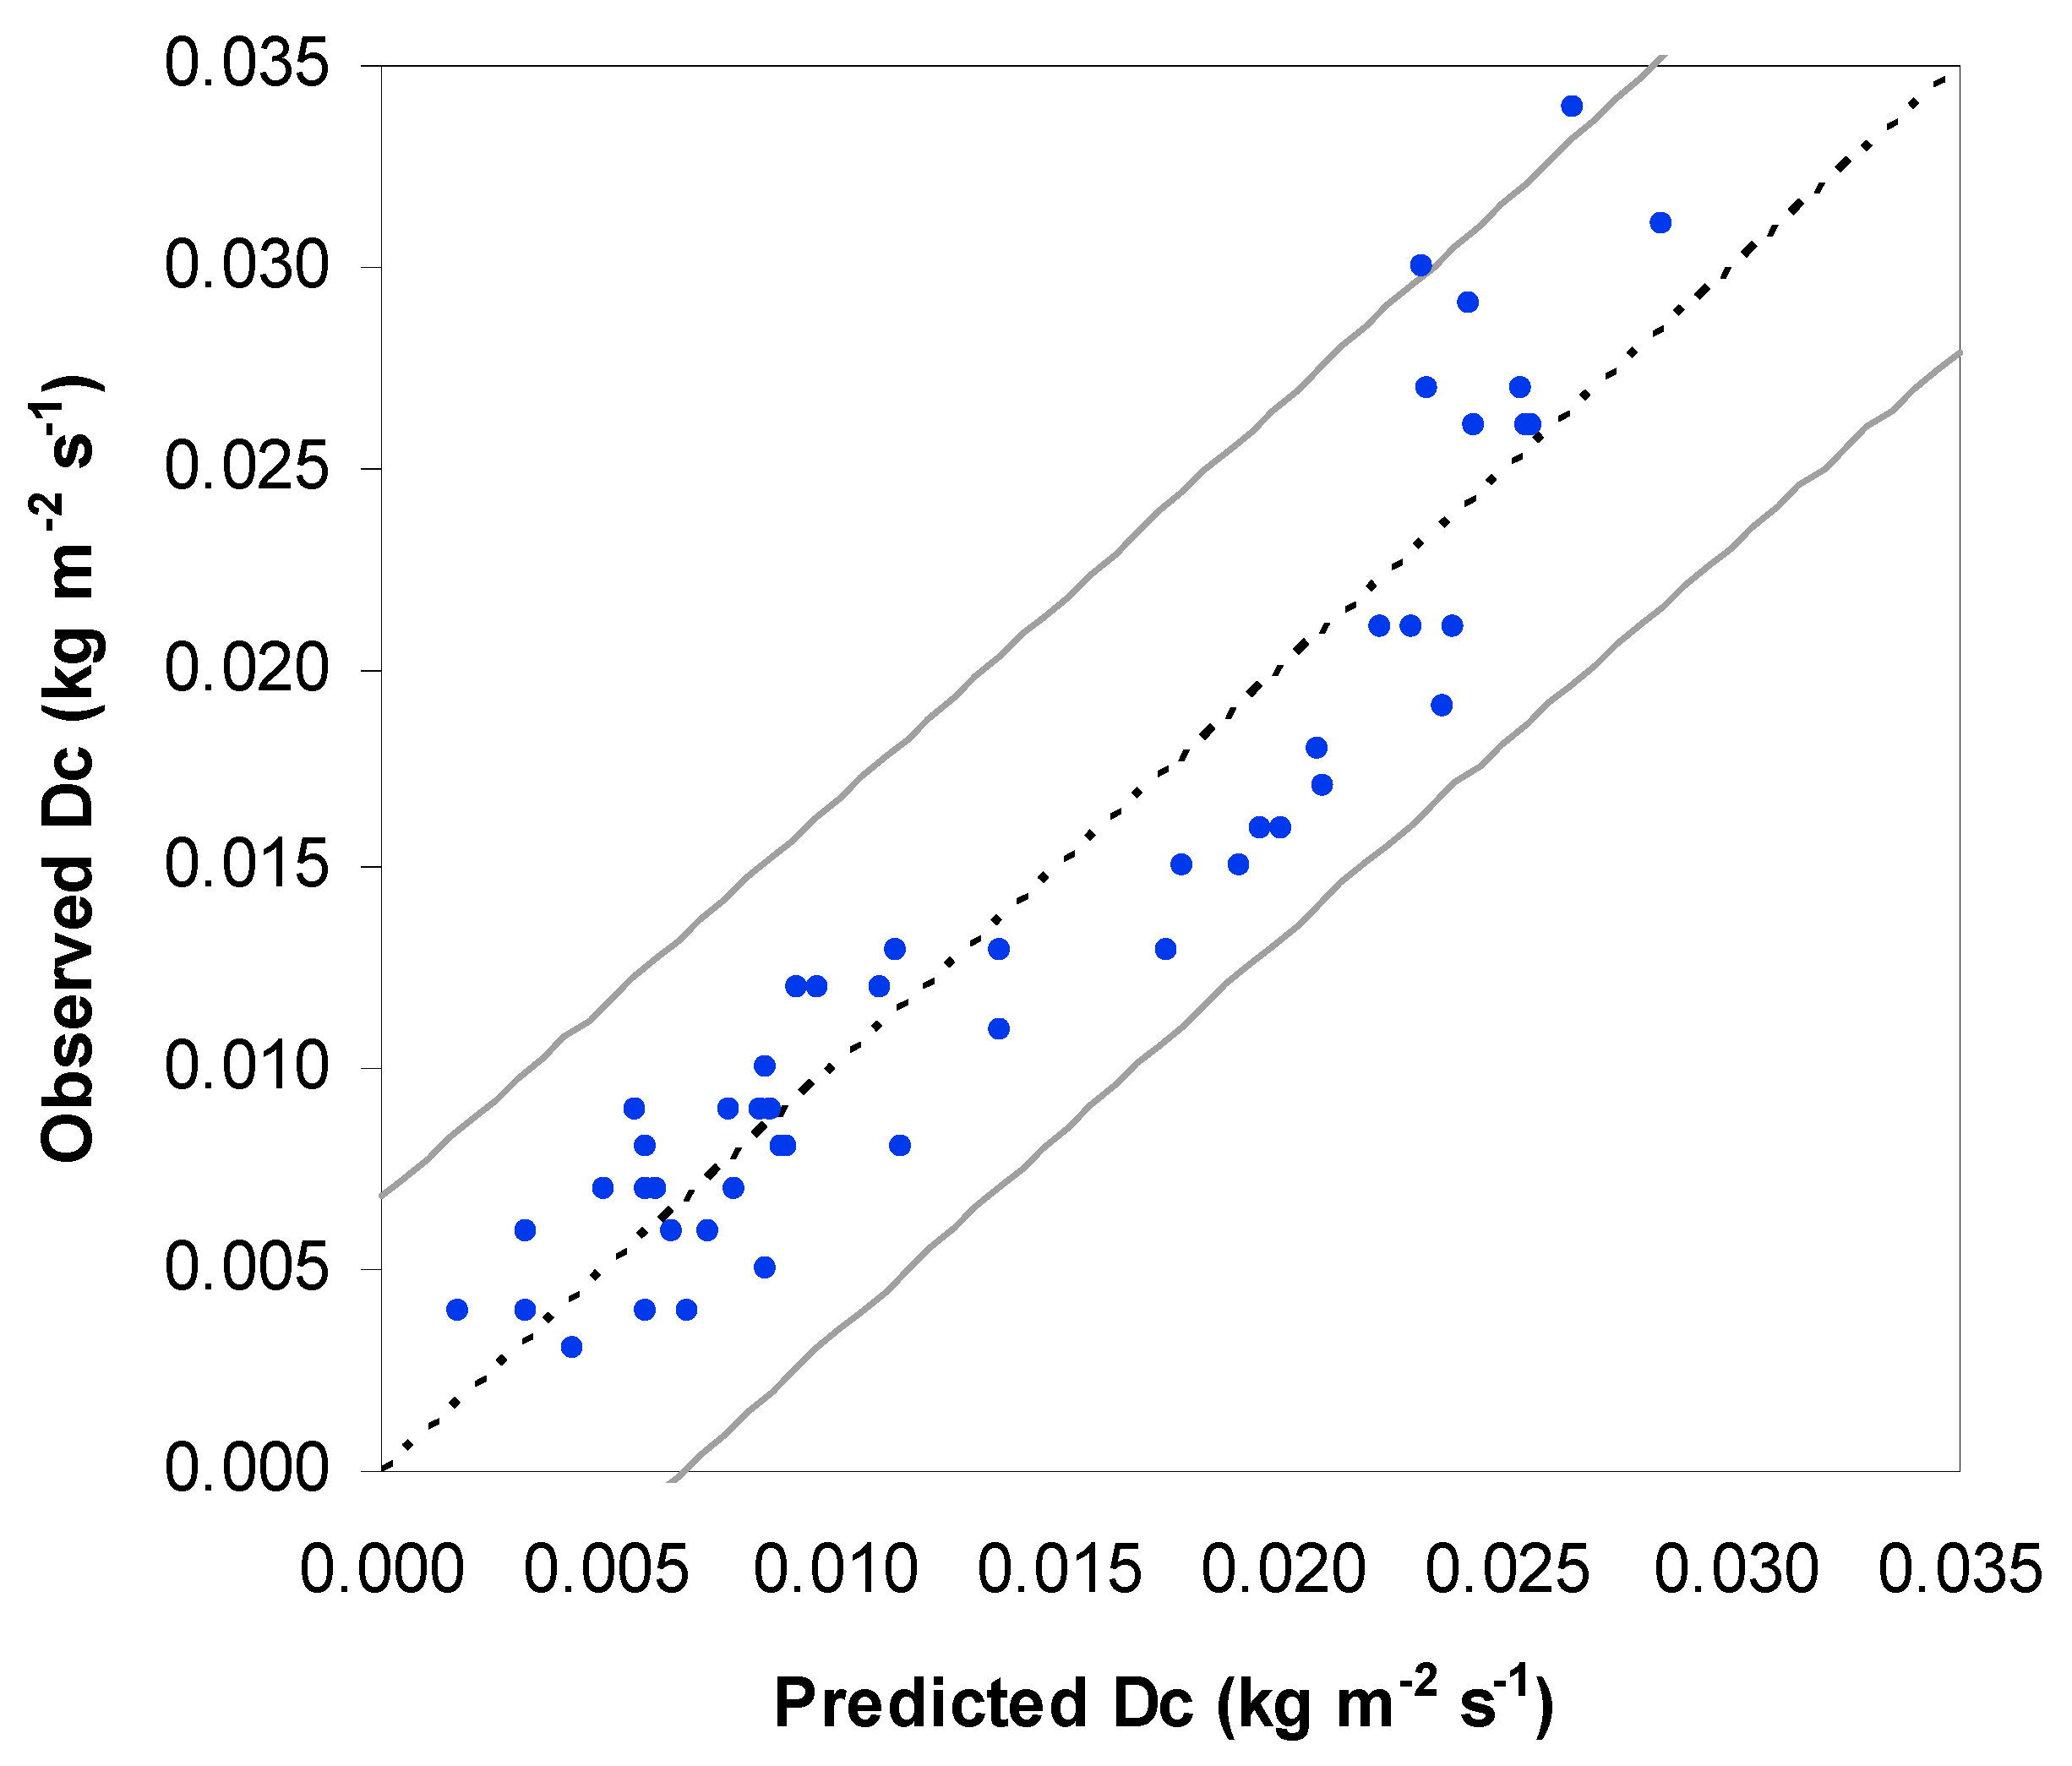
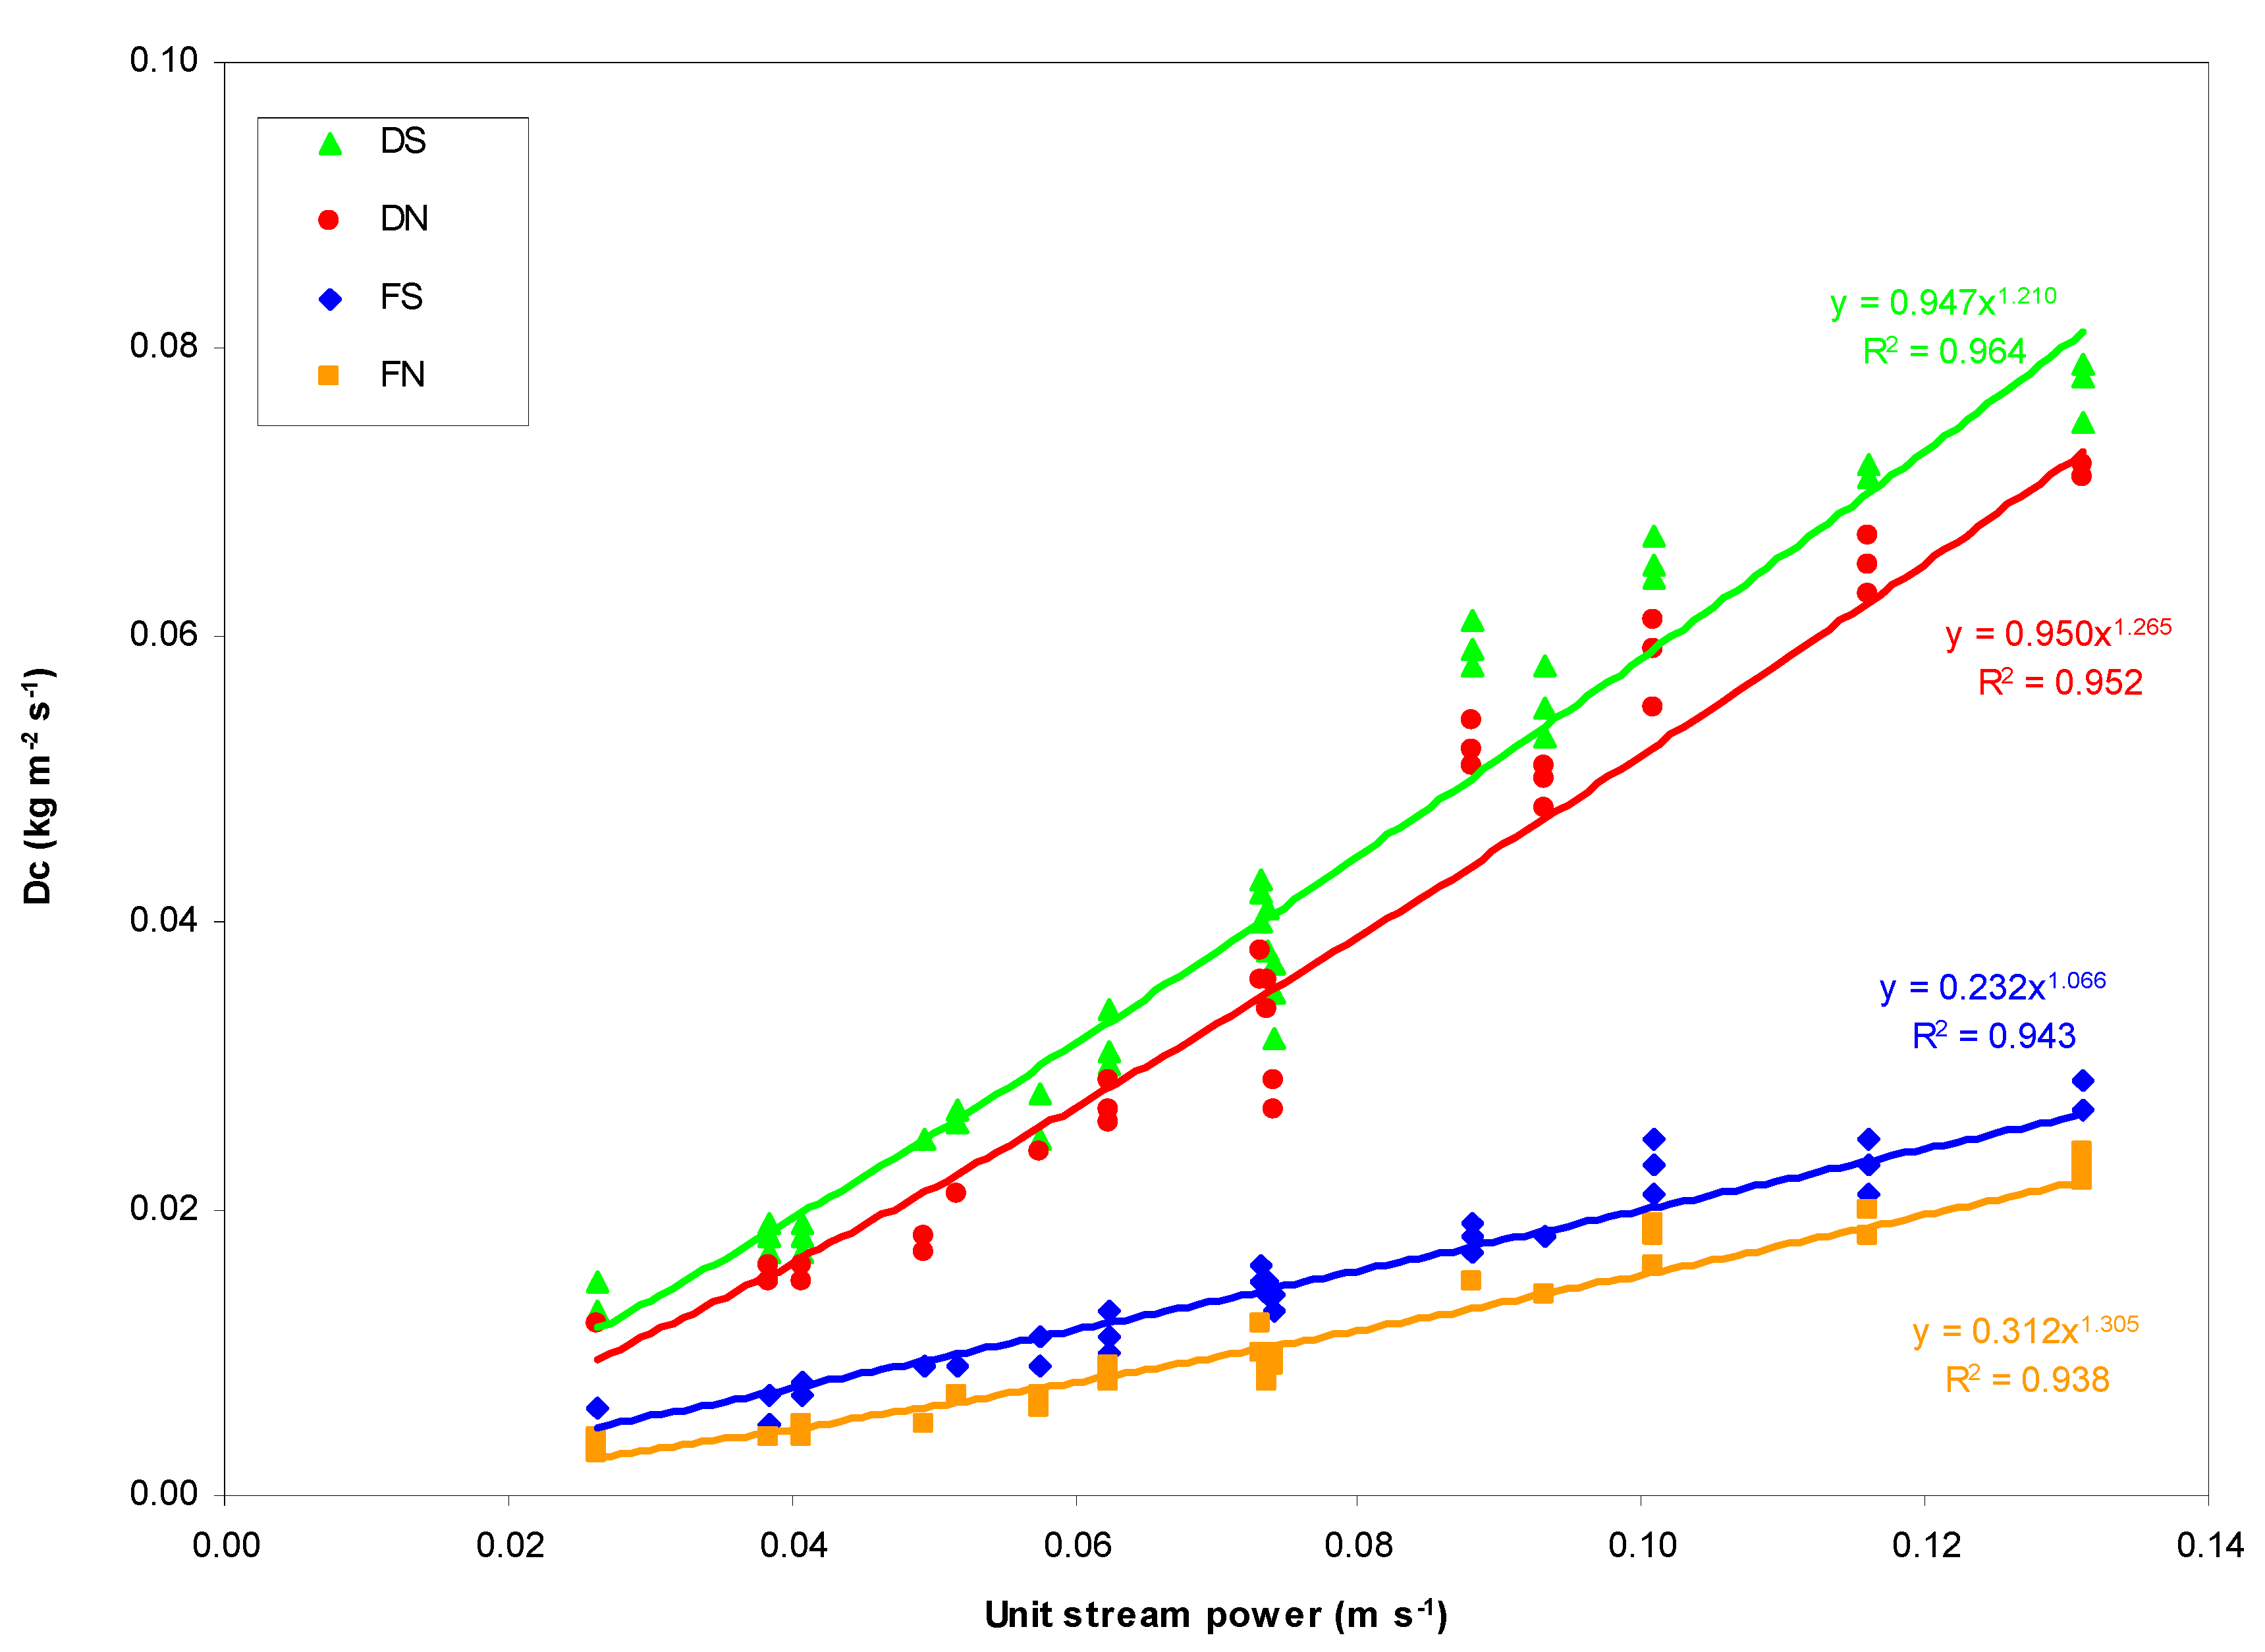
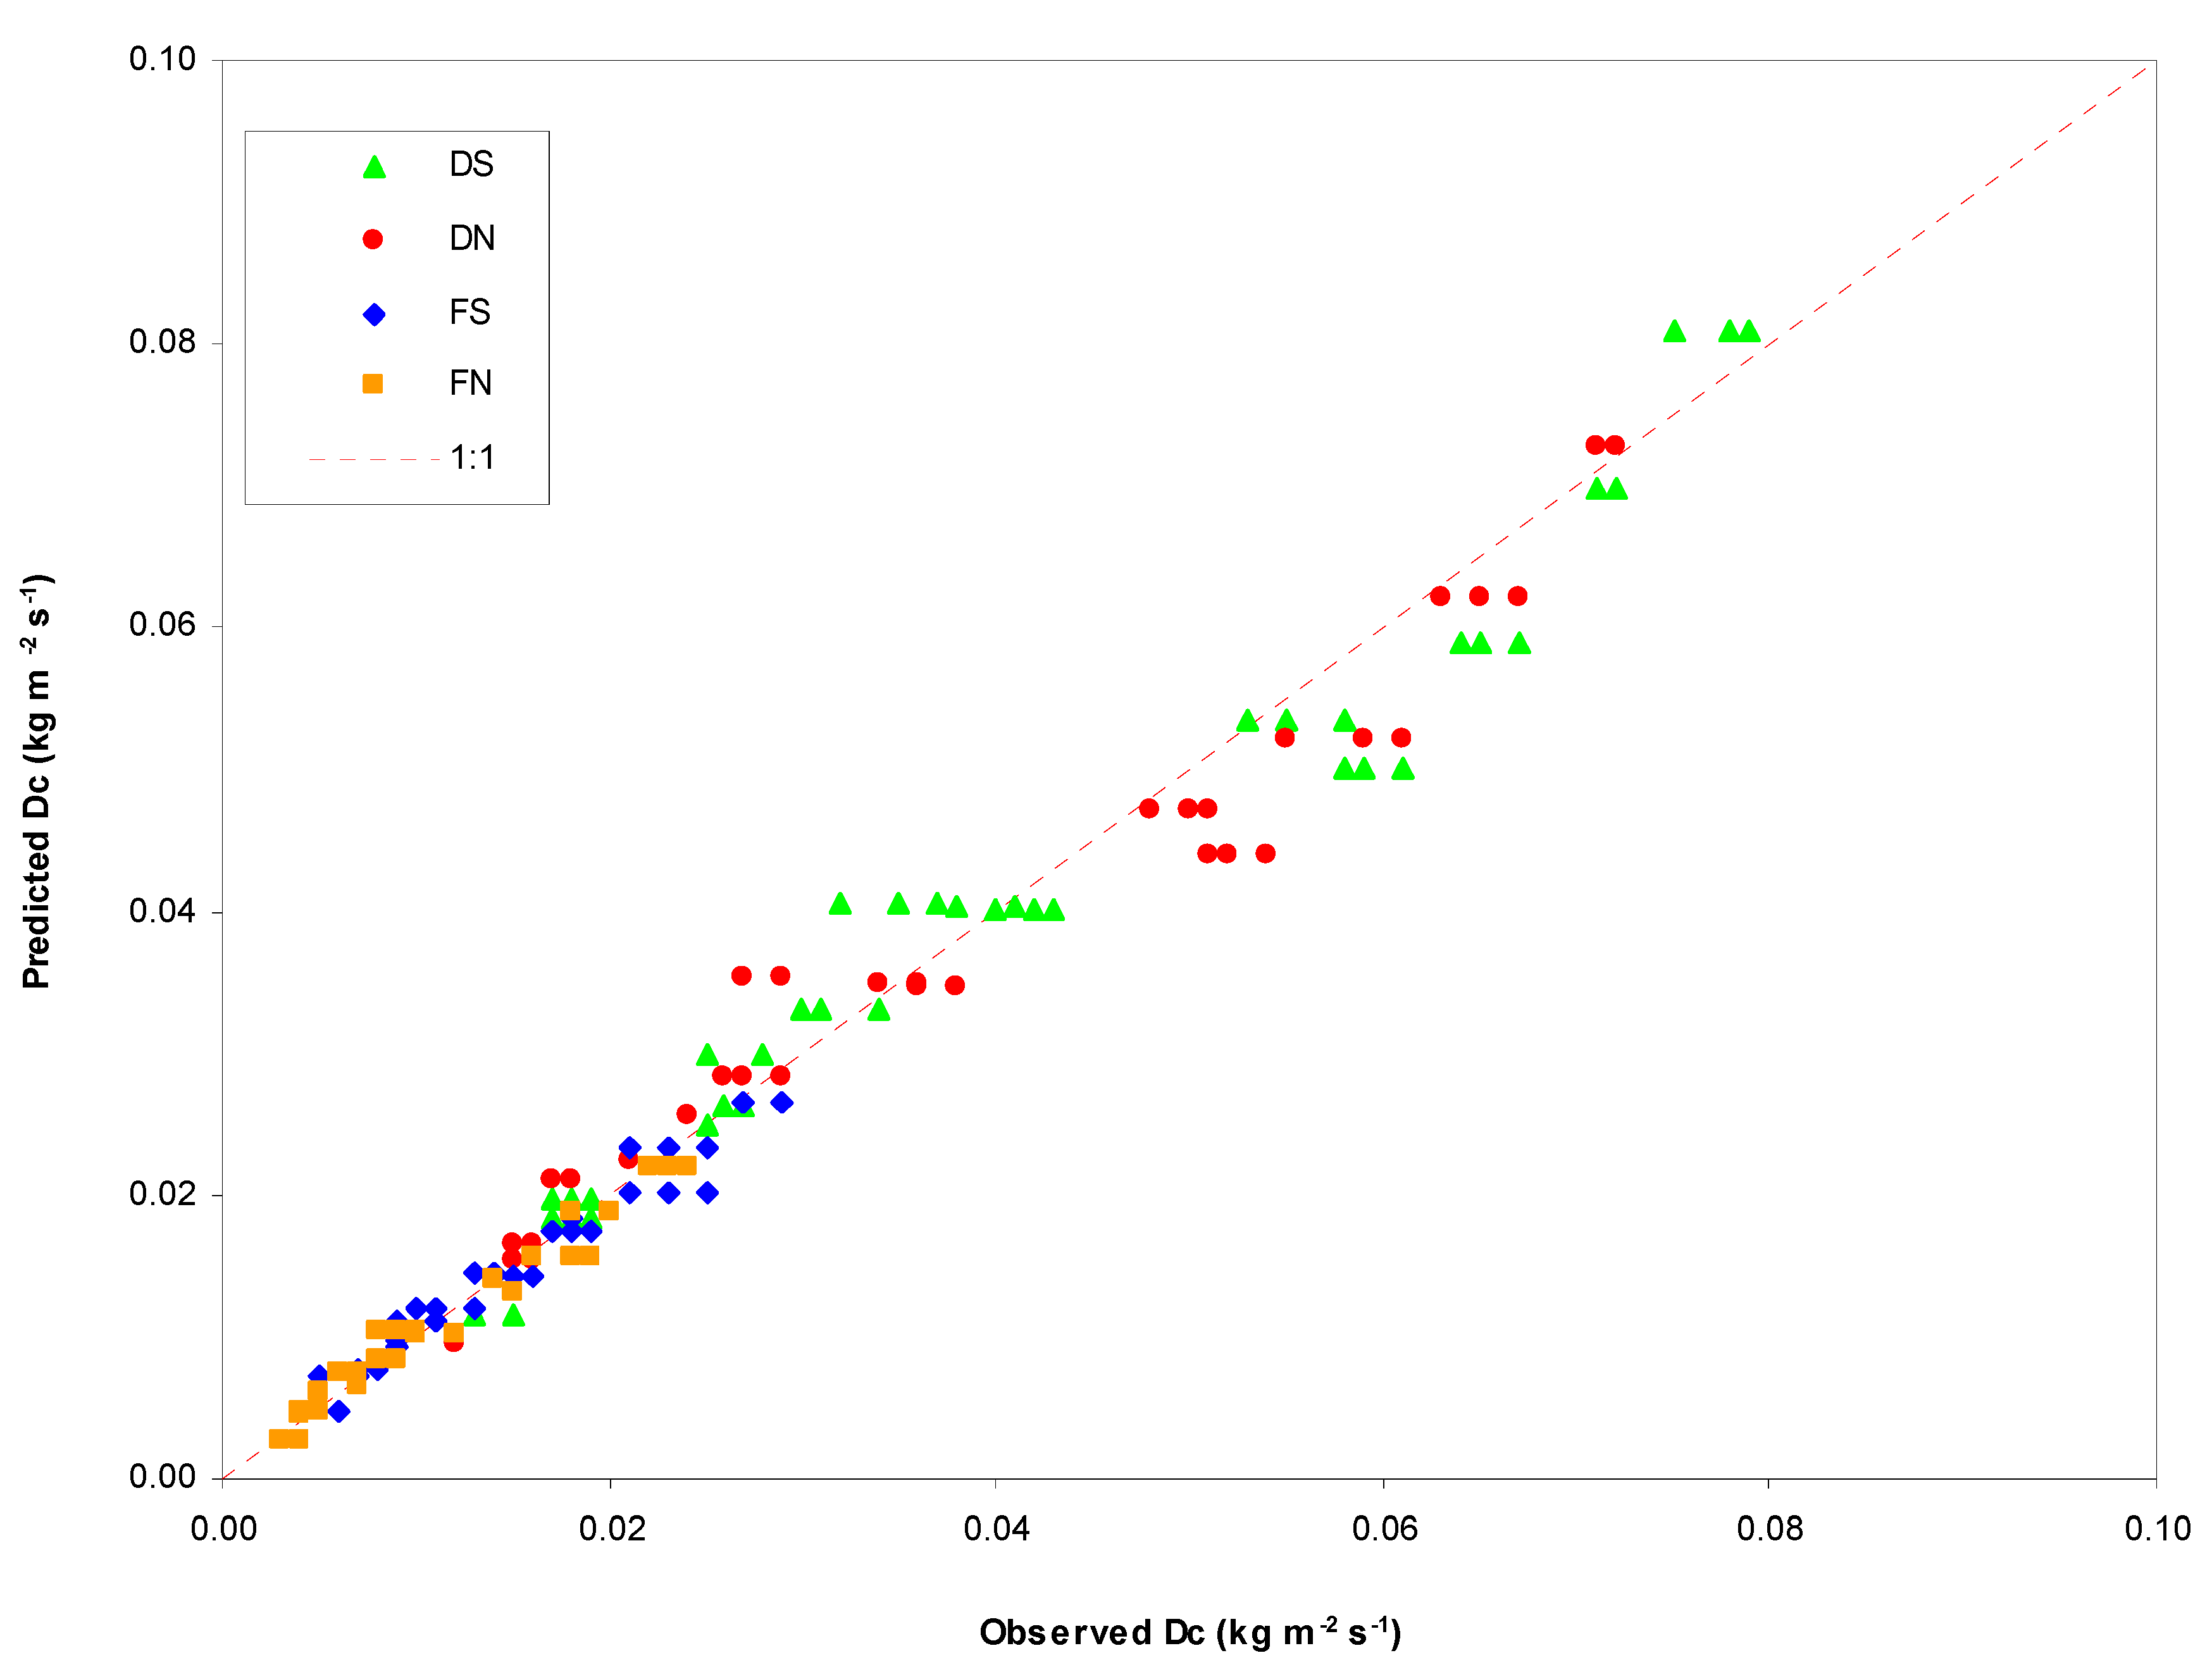
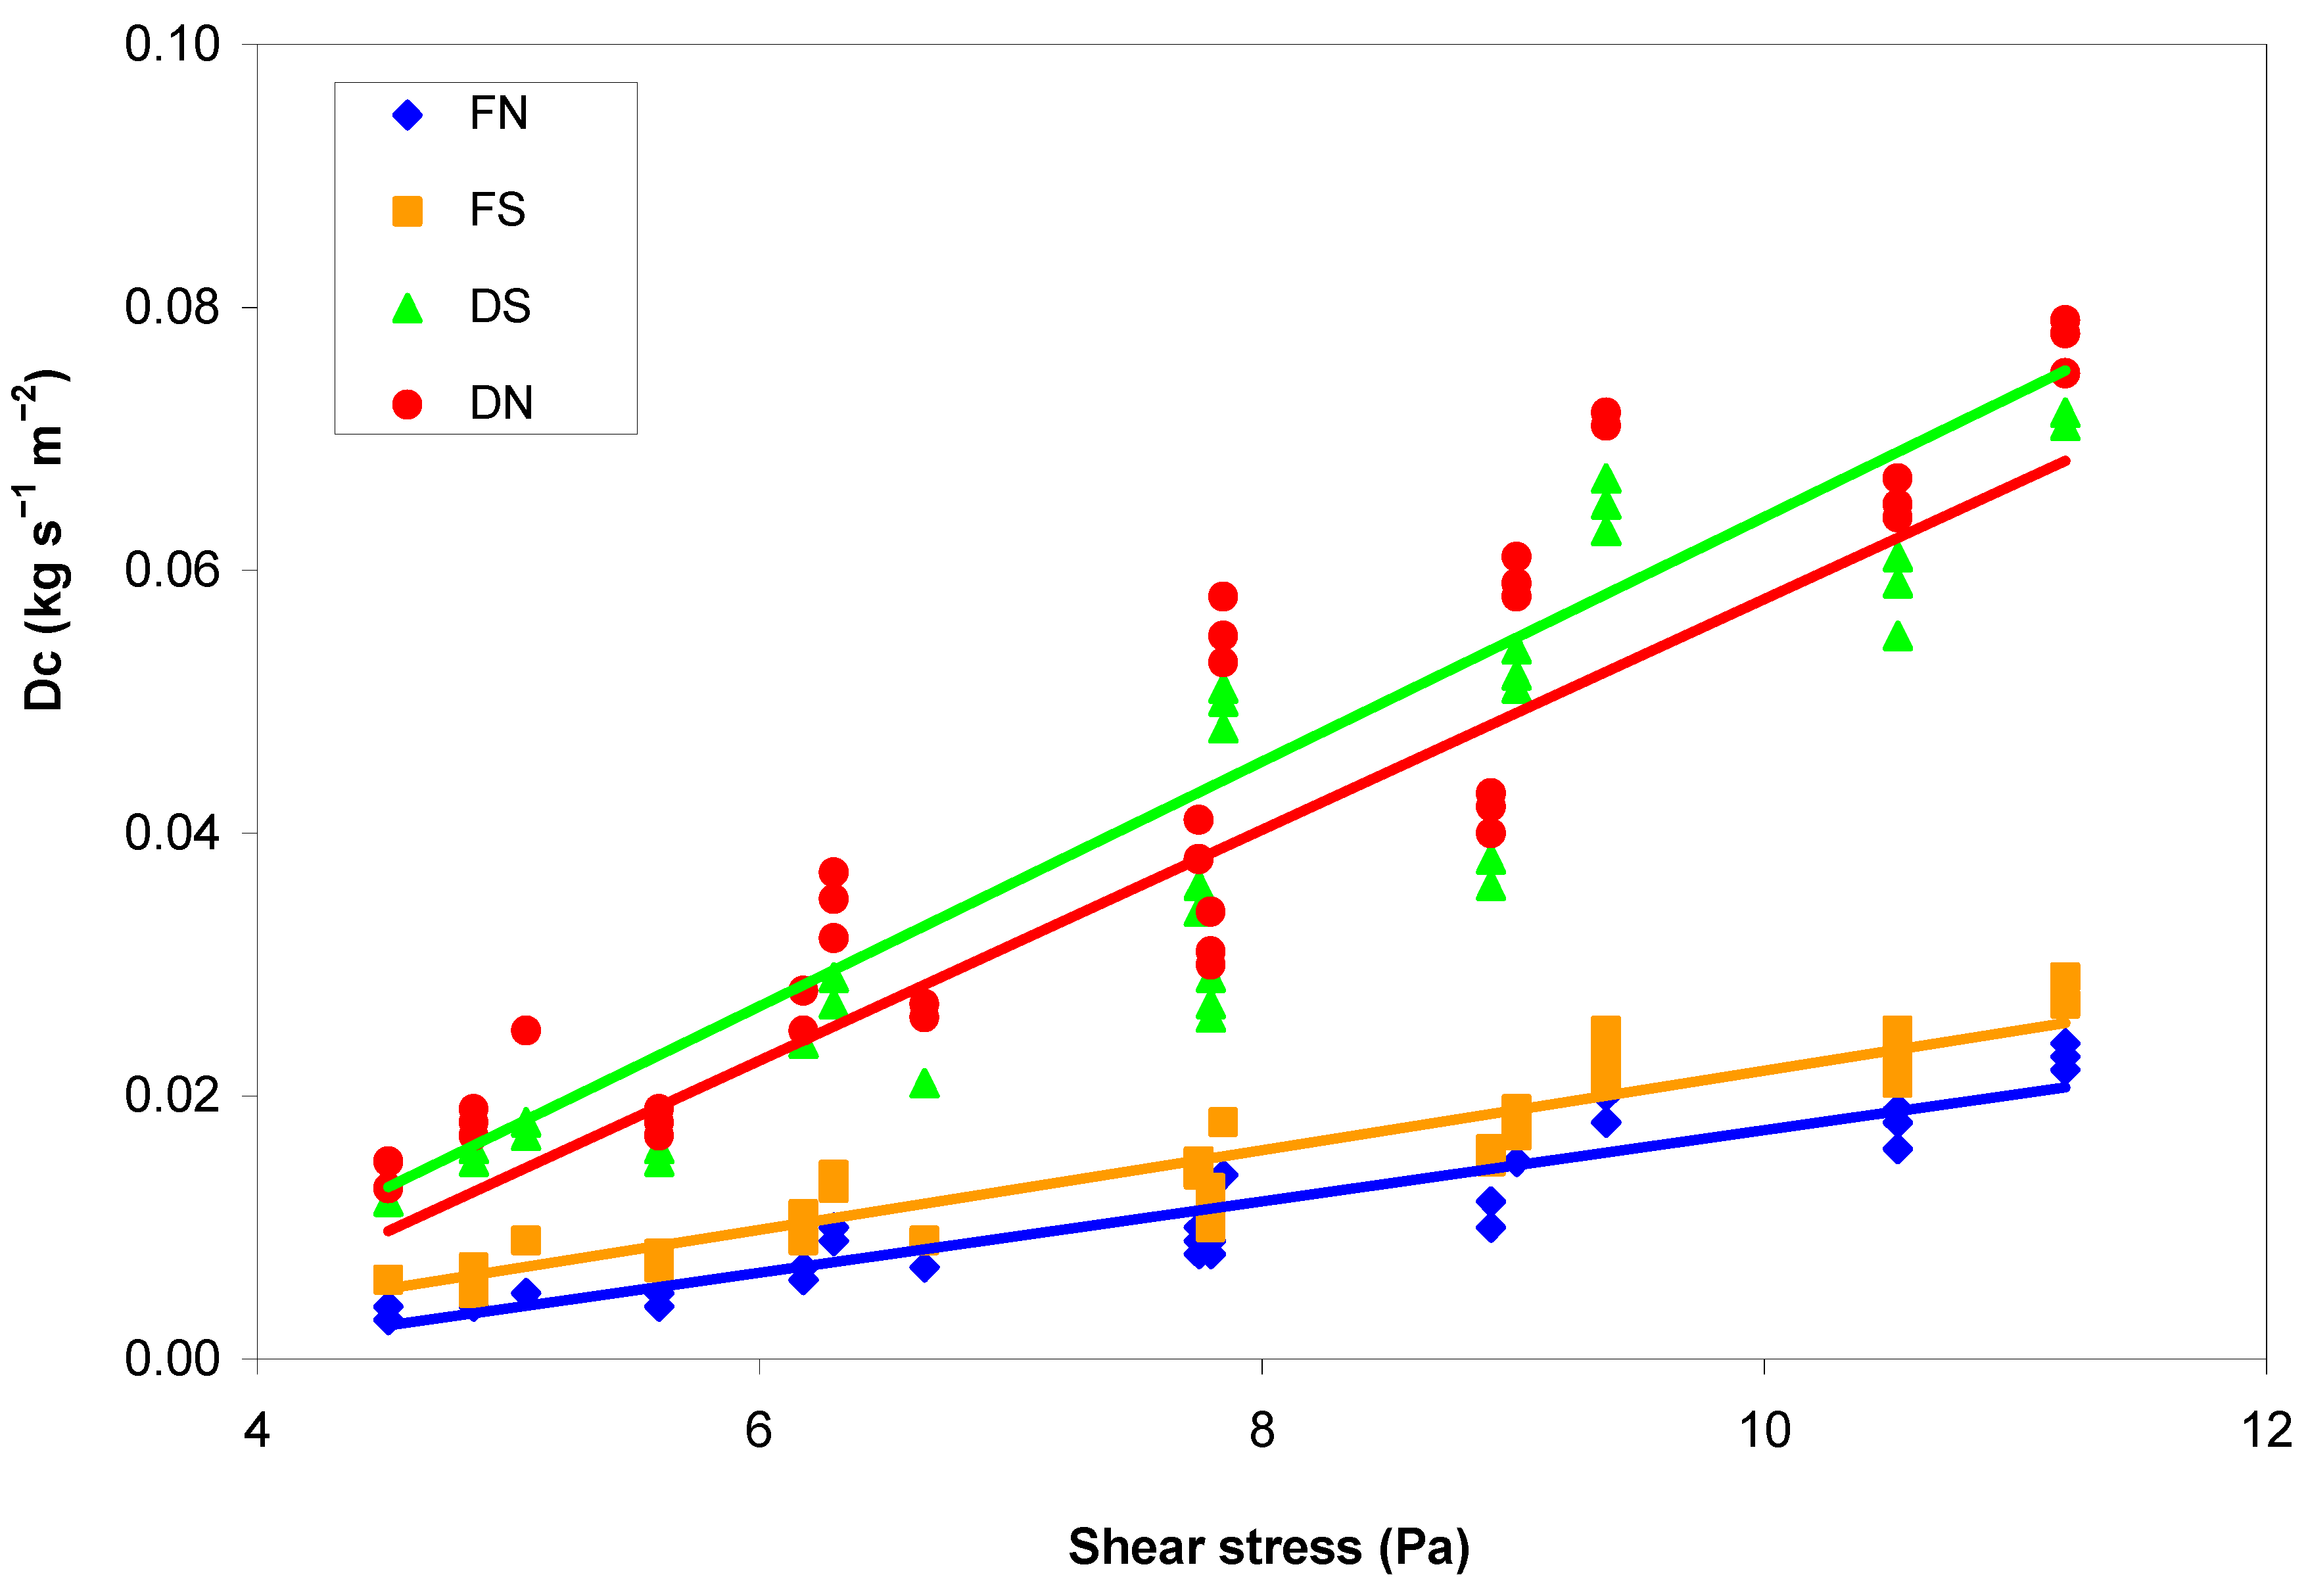
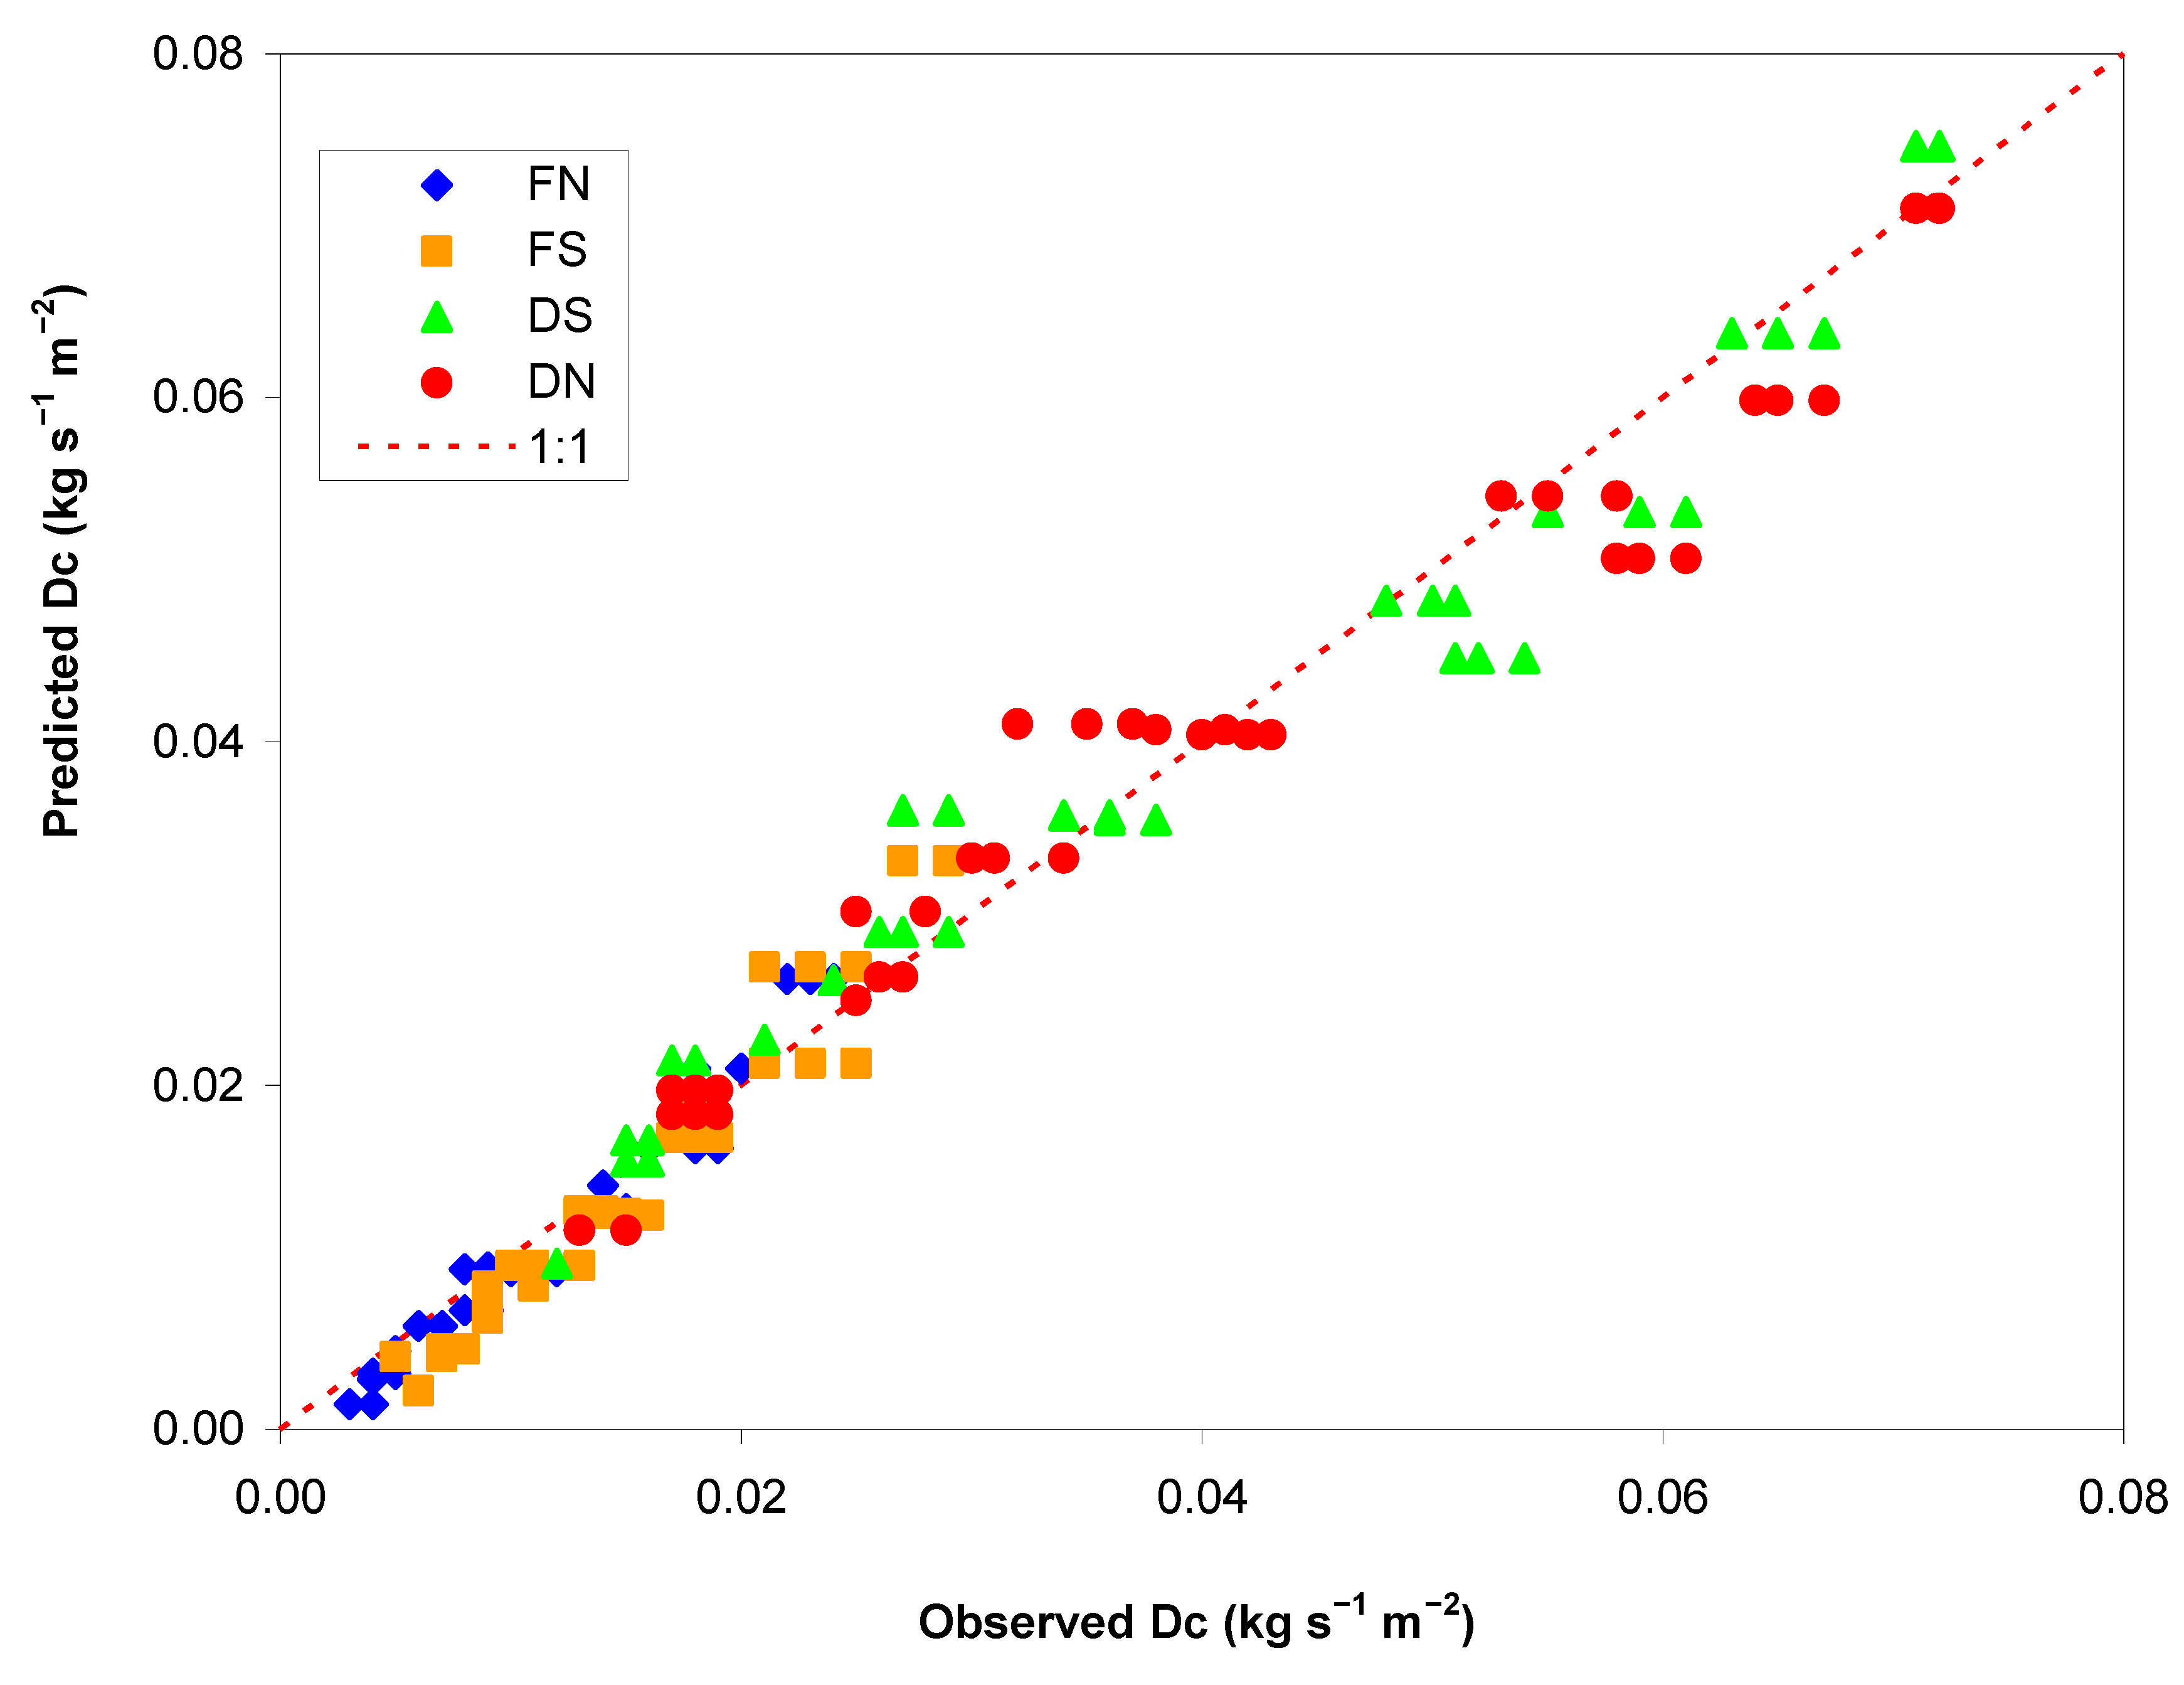
3.2. Modeling the Rill Detachment Capacity and Erodibility

PCR identified a reliable multiregression model (r2 = 0.89) that predicts Dc from the first two PCRs. This model has the following analytical structure:
Dc = −0.00233·PCR1 − 0.00368·PCR2
The scatter plot of Figure 5 shows that almost all the predicted values lie inside the 95%-confidence interval; moreover, the values of RE (3.43%), r2 (0.83) and NSE (0.83) indicate good model accuracy.
High coefficients of determination were found correlating Dc with ω (r2 > 0.938) (Table 4 and Figure 6). Moreover, the regression models established between these variables were accurate, as visually shown by the scatter plot of Figure 7, where the measured-predicted Dc points are grouped close to the identity line. Also, the quantitative indexes, adopted to evaluate the model accuracy, were very satisfactory (RE < 1.4%, r2 and NSE > 0.96).
When Dc was regressed on τ using Equation (6), the differences in the slope (Kr) and intercept (τc) were higher between hillslopes with different conditions (forested vs. deforested) and lower between hillslopes with different aspects. These equations had coefficients of regression (r2) of 0.86–0.88 (Table 5 and Figure 8). Deforested hillslopes exposed to the south and forest areas with north aspects showed the maximum (0.0093 s m−1) and minimum (0.0027 s m−1) values of Kr, respectively, corresponding to τc of 3.11 and 3.57 Pa (Table 5). Also, these regression models were reliable for Dc predictions, as shown by the limited scattering of the measured-predicted Dc around the identity line (Figure 9).

4. Discussion

4.1. Spatial Variations of Rill Detachment Capacity and Associations with Soil Quality Indicators

The soil detachment capacity was significantly lower (on average by 68%) in forest hillslopes compared to the deforested areas and this result was expected. As a matter of fact, the higher erodibility found in the deforested hillslopes is consistent with the results of several studies [64,65,66,67]. In the deforested hillslopes exposed to south the mean Dc was higher by 12% compared to the north, while the variability between the two aspects was slightly higher (14%), considering both forest and deforested hillslopes. Conversely, although a variability in Dc values was detected among areas with different positions (upper, middle and lower slope), the related changes were small and never significant. This should be due to the similar soil characteristics among the three hillslope positions, which were not influenced by external factors (such as climate and past erosion). This is in contrast with some other studies: for instance, Khormali et al. [8] found that the upward slopes were more prone to erosion, especially in the deforested hillslopes, where organic matter content is lower and bulk density is higher with consequent lower infiltrability and more runoff generation capacity. Li et al. [28,31] and Wang et al. [22], proposing accurate regression equations to estimate Dc from hydraulic parameters, showed that hillslope position with different slopes plays a significant influence on rill erodibility.
Several studies have demonstrated that the variability of soil detachment capacity can be associated to changes in soil properties, such as texture, bulk density, cohesion and water stable aggregate [20,26,31]. A review proposed by Knapen et al. [20] evidenced that, among the soil properties, the texture, structural stability of aggregates and organic matter play the main role in the resistance of soil to concentrated flow erosion. Zhang et al. [26] stated that, when the texture of soils with different land uses is the same, the clay content, aggregate median diameter, soil strength, bulk density, in addition to plant root density, are responsible for the differences in Dc among the land uses. According to Li et al. [31], the variability of Dc under different land uses is positively related to silt content, and inversely related to sand content, cohesion, water stable aggregate, aggregate median diameter, organic matter and root density of plants. Also, in this study, the differences in Dc among hillslope conditions and aspects may be ascribed to the variability of the soil quality indicators, which were often significantly different (mainly for the soil condition) among the samples. These relationships between Dc and the soil characteristics are confirmed by the strong correlations revealed by Pearson’s matrix. Generally, for the investigated hillslopes, the soil erodibility is directly associated with the particle fractions of the sampled soils, despite the same soil texture. Dc increased ClC content, as shown by the positive correlations among these soil quality indicators. Although a higher content of clay particles enhances soil cohesion action, which should tie the finer particles and decrease the soil erodibility [26,68,69], the higher Dc of clay-richer soils should be attributed to other factors. These results are in accordance with Li et al. [31] and Parhizkar et al. [27], Ciampalini et al. [68], Zhang et al. [26] and Vaezi et al. [70]. These authors stated that, in soils with higher silt and clay contents, particle detachability increases. Conversely, when the SaC increases, particle detachability decreases, as reported also by Parhizkar et al. [27]. However, the direct associations between soil erodibility and texture characteristics should be generalised with caution, since some studies suggested that soils with high clay [71] and silt [23] contents have low rill erodibility and the effects of sand particles on Dc are ambiguous [31]. Compared to the deforested hillslopes, forest soil showed a higher content of OM (on average 67% more), which is considered as one of the most common soil quality indicators [72]. The negative correlation found between Dc on one side and OM, RWD, AS, SP and SMR on the other side confirms that the forest soils, which have a noticeable vegetation cover, are less erodible compared to soils with lower or no vegetation.
It is well known that soils with noticeable vegetation cover show a high content of organic matter [27,73,74,75]. This higher OM content is due to root presence of the vegetation in the forest areas [76], where plant roots bind soil particles at the soil surface [77,78]. The effectiveness of roots in reducing detachment to flowing water is closely related to its physically binding and chemically bonding effects [18,31,79]. Vegetation roots bind soil particles at or near the soil surface to protect soil from water erosion and enhance its stability [77]. This is a more general process due to the control that vegetation exerts on soil particle detachment [80].
Besides higher OM content and RWD of the forest areas, the larger cover of vegetation increases porosity and aggregate stability of soils, as shown in our study, where SP and AS of forest soils was more than 16% and 100% higher, respectively, compared to deforested hillslopes. The soil structure stability is generally recognised as having a positive effect in reducing Dc [20,31]. The lower soil AS found in deforested hillslopes is in line with the results of Caravaca et al. [81] and Khormali et al. [8]. In more detail, Caravaca et al. [81] showed that the aggregate stability of cultivated soils is significantly lower than that of forest soils. In the study of Khormali et al. [8], deforestation resulted in a significant decrease in AS of the soil surface in all the investigated slope positions.
Moreover, many researchers, such as Shepherd et al. [82], stated that the disintegration of soil aggregates decreases the soil porosity and therefore increases its bulk density. According to McDonald et al. [83], a BD increase exposes the deforested areas to greater erosion rates, while Lemenih et al. [84] associates decreases in SP and increases in BD to a decline in OM content of soils and therefore to worsened soil quality. A negative correlation between Dc and soil porosity was also found in this study. The latter soil property was higher in forest hillslopes, where AW is higher (by 32%), presumably due to the higher AS and OM content of soil. Organic matter is a cementing agent and can help to increase the water content of soils [85]. This is in accordance with other studies [86,87], which reported high water content in soils with high amount of OM. Moreover, according to Rawls et al. [86], water retention of soils with coarse texture is substantially more sensitive to the amount of organic matter as compared with fine-textured soils. Therefore, deforestation and inappropriate management operations can reduce organic matter and thus water retention of soil. The higher water content that soil can store is beneficial for plant growth [88,89].
The high OM content of forest hillslopes is also linked to a high SMR. Conversely, the reduction in OM following deforestation reduced the SMR by over 100%, and a reduced microbial activity in soils is related to lower levels of available organic carbon [8,90]. The high production of biomass in forest soils plays an important effect on its microbial population [91]. Kiani et al. [92] stated that, when the rate of fresh plant residues increases in forest areas, the soil microbial respiration rises, which strictly depends on the nutrient contents of soil (i.e., P, K, Ca and Mg) [93,94,95].
If the differences in Dc between forest and deforested hillslopes can be explained by the changes in the main soil quality indicators monitored in this study, the reasons for the variability of Dc between the two hillslope aspects are less evident. The higher Dc of south-facing hillslopes compared to the areas exposed to north is in accordance with some studies [96,97]. More specifically, Cerdà [96], under simulated rainfalls, demonstrated that both runoff and erosion increase from north-facing to south-facing afforested slopes as the results of variation in soil cover and organic matter content. Also, Petersen et al. [97] reported that water infiltration is significantly lower and sediment load in runoff is higher in soil with south aspect compared to north. In our study, in hillslopes exposed to north the OM content and AS were higher compared to south-facing areas (by about 15% and 24%, respectively) and the same contrast was found for SMR (+28%), RWD (+12%) and AW (+16%). The lower OM in south-facing hillslopes could be due to the higher temperature to which the soils are exposed [98], which accelerate the oxidation of the organic compounds [99,100].
Also, the PCR basically confirms the relationships between Dc and soil quality indicators. When OM, AS, RWD and SP decrease, the rill detachment capacity increases. The forest soils are associated to higher values of OM, SMR, RWD, AS and SP (having high positive loadings on PCR1) and the opposite situation happens for soil samples collected in deforested hillslopes (that is, lower OM, SMR, RWD, AS and SP). The latter soils are characterised by higher BD and CCE, which negatively weigh on PCR1. Moreover, forest soils show higher AW compared to deforested hillslopes. Also, Wang et al. [22] reported negative correlations among the soil detachment capacity and ClC, OM and RWD, and a positive correlation with SP.

4.2. Modeling the Soil Detachment Capacity and Rill Erodibility

It is important to develop reliable and effective models for estimating rill detachment capacity from some measurable parameters, including hydraulic, soil, and vegetation indicators [22]. Several researchers proposed equations to predict Dc in different regions by using hydraulic and soil parameters [26,68]. The regression analysis (by PCR as well as power and linear models) carried out in this study is helpful to predict rill erodibility parameters using some important soil quality indicators or hydraulic characteristics of the overland flow.
The multiregression model (7) to predict rill detachment capacity from the first two PCRs showed that Dc can be estimated with acceptable accuracy using a linear combination of the soil quality indicators (which are the original variables, to which the derivative variables of PCR are correlated [101]). This is confirmed by the fact that the predicted values of Dc lie inside the 95%-confidence interval and, therefore, a reliable estimation of Dc can be achieved when the main soil characteristics are known. This outcome is in line with findings of Zhang et al. [26], who indicated that Dc in rill erosion could be well simulated by clay content, bulk density, aggregate median diameter and soil strength. Moreover, Wang et al. [22], proposed to predict Dc using an exponential equation from BD, OM, root density, τ and cohesion in hillslopes with permanent gullies in southeast China, achieving R and NSE equal to 0.98. The first PCR of the multiregression model (7) proposed in this study can be interpreted as a combined index of soil quality, since it derives from some important indicators of soil quality (e.g., OM, RWD, AS, AW, SMR) and an increased PCR1 indicates an improved soil quality.
The rill detachment capacity also depends on the hydraulic characteristic of the overland flow [48]. The regression analysis carried out in this study confirmed that unit stream power is a good predictor of Dc in the experimental conditions, and particularly for the deforested hillslopes, which are more sensitive to soil erosion [8,102]. This high accuracy may be due to the fact that ω simultaneously takes into account the flow velocity and soil slope, both influencing the soil detachability due to the overland flow [27]. Also, Zhang et al. [26] found that Dc can be accurately predicted by hydraulic parameters, such as stream power, slope and runoff density. These authors achieved r2 of 0.93 and NSE of 0.90 in predicting soil detachment rates from stream power in soils collected in woodland. However, the extrapolation of these equations to other soil conditions and types must be done with caution, as stated by Nearing et al. [52], who stated that stream power is sometimes not an appropriate parameter to uniquely describe detachment rates for different soils. For instance, the application of the similar equations proposed by Parhizkar et al. [27] for forestland and woodland and validated in soils of Northern Iran shows a model accuracy that is lower than in this study (RE between 12% and 42% as well as NSE between −0.25 and 0.66). However, those experimental conditions were different than in this study (moderate differences in soil texture and quality indicators, and different hillslope aspect and vegetation), and this may affect the model prediction accuracy. This does not mean that the models developed in these studies are useless, but they should be applied only in the experimental conditions and validated case by case in soils of different characteristics. Conversely, the proposed equations provide accurate evaluations of rill erodibility in soil subject to conservation or management practices, where the expected changes in soil quality indicators can not affect the reliability of model predictions.
The Dc-ω curves showed that the slopes of the regression models in the forest hillslopes were noticeably higher compared to the deforested areas, indicating that Dc increases more rapidly with unit stream power. Regarding the same soil condition (forest or deforested), the hillslopes exposed to the south showed higher Dc compared to north aspect.
The rill detachment capacity of a soil due to the overland flow is strictly linked to the rill erodibility and critical shear stress. These parameters reflect soil resistance to runoff [59] and are sensitive input parameters in process–based erosion models [23,58,103], such as the WEPP model [104]. In our study, the high coefficients of determination in the linear regression fitting Dc to τ show the accuracy of these models in predicting the parameters linked to the soil resistance to erosion (Kr and τc). This accuracy is consistent with the findings of Zhang et al. [26], who stated that the regressions between Dc and τ can be used to fit the observed data satisfactorily, with r2 up to 0.9. The higher values of Kr in the deforested hillslopes, compared to the forest areas, again confirm the essential role of forest in reducing soil erosion in vegetated areas [13].

5. Conclusions

This study has confirmed in the forest and deforested hillslopes of the case study the expected significant differences in the rill detachment capacity. The variability of this soil property between the areas exposed to the north and south was lower but equally significant. Conversely, the soil erodibility was quite similar and thus not significant among the different soil positions. The differences detected in rill detachment capacity have been associated to the higher organic matter content, aggregate stability, porosity, root weight density, microbial respiration and available water of the forest hillslopes in comparison with the deforested areas. All these soil quality indicators were also higher in the hillslopes exposed to the north compared to the soils with south aspect. However, these differences were less noticeable than the changes detected in soils with different conditions.
The simple models to predict rill erosion proposed in this study may be adopted in order to control and mitigate the risks of erosion and soil quality degradation. The detachment capacity, rill erodibility and critical shear stress of soils can be predicted in the experimental conditions from indicators of soil quality or unit stream power using reliable and accurate regression equations. However, further studies should test the reliability of the suggested equations in other environmental conditions.
Overall, this study has contributed to the understanding of the spatial variability of soil quality and rill erodibility in forest areas. The results can support land planners and watershed managers in prioritizing the actions for soil conservation as well as in the extensive application of erosion prediction models towards the conservation of natural resources.

Supplementary Materials

The following are available online at https://0-www-mdpi-com.brum.beds.ac.uk/2079-9276/9/11/129/s1. Table S1. Soil quality indicators of samples collected in the four hillslopes of Saravan Forestland Park (Northern Iran). Table S2. Hydraulic parameters of flume experiments on soil samples collected in the four hillslopes of Saravan Forestland Park (Northern Iran). Table S3. Soil detachment capacity for different soil slopes and flow discharges simulated in flume experiments on samples collected in the four hillslopes of Saravan Forestland Park (Northern Iran).

Author Contributions

Conceptualization, methodology, and fieldwork, M.P. and M.S.; writing and review M.P., M.E.L.-B.; D.A.Z. All authors have read and agreed to the published version of the manuscript.

Funding

Faculty of Agricultural Sciences, University of Guilan.

Acknowledgments

The authors thank the Faculty of Agricultural Sciences, University of Guilan for its support and experimental assistance.

Conflicts of Interest

The authors declare no conflict of interest.

References

  1. Nosrati, K.; Collins, A.L. Fingerprinting the contribution of quarrying to fine-grained bed sediment in a mountainous catchment. Iran River Res. Appl. 2019, 35, 290–300. [Google Scholar] [CrossRef]
  2. Valderrama, L.; Contreras-Reyes, J.E.; Carrasco, R. Ecological impact of forest fires and subsequent restoration in Chile. Resources 2018, 7, 26. [Google Scholar] [CrossRef] [Green Version]
  3. Bunemann, E.K.; Bongiorno, G.; Bai, Z.G.; Creamer, R.; Deyn, G.B.; de Goede, R.G.M.; de Fleskens, L.; Geissen, V.; Kuijper, T.W.M.; Mäder, P.; et al. Soil quality—A critical review. Soil Biol. Biochem. 2018, 120, 105–125. [Google Scholar] [CrossRef]
  4. Singh, N.; Parida, B.R.; Charakborty, J.S.; Patel, N.R. Net Ecosystem Exchange of CO2 in Deciduous Pine Forest of Lower Western Himalaya, India. Resources 2019, 8, 98. [Google Scholar] [CrossRef] [Green Version]
  5. Mullan, D. Soil erosion under the impacts of future climate change: Assessing the statistical significance of future changes and the potential on-site and off-site problems. Catena 2013, 109, 234–246. [Google Scholar] [CrossRef]
  6. De Vente, J.; Poesen, J. Predicting soil erosion and sediment yield at the basin scale: Scale issues and semi-quantitative models. Earth-Sci. Rev. 2005, 1–2, 95–125. [Google Scholar] [CrossRef]
  7. Cherubin, M.R.; Tormena, C.A.; Karlen, D.L. Soil Quality Evaluation Using the Soil Management Assessment Framework (SMAF) in Brazilian Oxisols with Contrasting Texture. Rev. Bras. Cienc. Solo 2017, 41, 1806–9657. [Google Scholar] [CrossRef] [Green Version]
  8. Khormali, F.; Ajami, M.; Ayoubi, S.; Srinivasarao, C.; Wani, S.P. Role of deforestation and hillslope position on soil quality attributes of loess-derived soils in Golestan province, Iran. Agric. Ecosyst. Environ. 2009, 134, 178–189. [Google Scholar] [CrossRef]
  9. Lucas-Borja, M.E.; Zema, D.A.; Plaza-Álvarez, P.A.; Zupanc, V.; Baartman, J.; Sagra, J.; González-Romero, J.; Moya, D.; de las Heras, J. Effects of Different Land Uses (Abandoned Farmland, Intensive Agriculture and Forest) on Soil Hydrological Properties in Southern Spain. Water 2019, 11, 503. [Google Scholar] [CrossRef] [Green Version]
  10. Shabanpour, M.; Daneshyar, M.; Parhizkar, M.; Lucas-Borja, M.E.; Zema, D.A. Influence of crops on soil properties in agricultural lands of northern Iran. Sci. Total Environ. 2020, 711, 134694. [Google Scholar] [CrossRef]
  11. Jamala, G.Y.; Oke, D.O. Soil Profile Characteristics as affected by Land Use Systems in The Southeastern Adamawa State, Nigeria. J. Agric. Vet. Sci. 2013, 6, 4–11. [Google Scholar] [CrossRef]
  12. Ellison, W.D. Soil erosion studies: Part I. Agric. Eng. 1947, 28, 145–146. [Google Scholar]
  13. Wang, B.; Zhang, G.H.; Shi, Y.Y.; Zhang, X.C. Soil detachment by overland flow under different vegetation restoration models in the Loess Plateau of China. Catena 2014, 116, 51–59. [Google Scholar] [CrossRef]
  14. Li, T.Y.; Li, S.; Liang, C.; He, B.H.; Bush, R.T. Erosion vulnerability of sandy clay loam soil in Southwest China: Modeling soil detachment capacity by flume simulation. Catena 2019, 178, 90–99. [Google Scholar] [CrossRef]
  15. Owoputi, L.; Stolte, W. Soil detachment in the physically based soil erosion process: A review. Trans. ASAE 1995, 38, 1099–1110. [Google Scholar]
  16. Wang, B.; Zhang, G.H.; Zhang, X.C.; Li, Z.W.; Su, Z.L.; Yi, T.; Shi, Y.Y. Effects of near soil surface characteristics on soil detachment by overland flow in a natural succession grassland. Soil Sci. Soc. Am. J. 2014, 78, 589–597. [Google Scholar] [CrossRef] [Green Version]
  17. Poesen, J.; Nachtergaele, J.; Verstraeten, G.; Valentin, C. Gully erosion and environmental change: Importance and research needs. Catena 2003, 50, 91–133. [Google Scholar] [CrossRef]
  18. Chaplot, V. Impact of terrain attributes, parent material and soil types on gully erosion. Geomorphology 2013, 186, 1–11. [Google Scholar] [CrossRef]
  19. Foster, G.R. Modeling the erosion process. In Hydrologic Modeling of Small Watersheds; Haan, C.T., Ed.; ASAE: St. Joseph, MI, USA, 1982; pp. 296–380. [Google Scholar]
  20. Knapen, A.; Poesen, J.; Govers, G.; Gyssels, G.; Nachtergaele, J. Resistance of soils to concentrated flow erosion: A review. Earth-Sci. Rev. 2007, 80, 75–109. [Google Scholar] [CrossRef]
  21. Wang, J.G.; Li, Z.X.; Cai, C.F.; Yang, W.; Ma, R.M.; Zhang, G.B. Predicting physical equations of soil detachment by simulated concentrated flow in Ultisols (subtropical China). Earth Surf. Process. Landf. 2012, 37, 633–641. [Google Scholar] [CrossRef]
  22. Wang, J.; Feng, S.; Ni, S.; Wen, H.; Cai, C.; Guo, Z. Soil detachment by overland flow on hillslopes with permanent gullies in the Granite area of southeast China. Catena 2019, 183, 104235. [Google Scholar] [CrossRef]
  23. Geng, R.; Zhang, G.H.; Ma, Q.H.; Wang, L.J. Soil resistance to runoff on steep croplands in Eastern China. Catena 2017, 152, 18–28. [Google Scholar] [CrossRef]
  24. Lucas-Borja, M.E.; Candel, D.; López-Serrano, F.R.; Andrés, M.; Bastida, F. Altituderelated factors but not Pinus community exert a dominant role over chemical and microbiological properties of a Mediterranean 706 humid soil. Eur. J. Soil Sci. 2012, 63, 541–549. [Google Scholar] [CrossRef]
  25. Zhang, G.H.; Liu, B.Y.; Liu, G.B.; He, X.W.; Nearing, M.A. Detachment of undisturbed soil by shallow flow. Soil Sci. Soc. Am. J. 2003, 67, 713–719. [Google Scholar] [CrossRef]
  26. Zhang, G.H.; Liu, G.B.; Tang, K.M.; Zhang, X.C. Flow detachment of soils under different land uses in the Loess Plateau of China. Trans. ASABE 2008, 51, 883–889. [Google Scholar] [CrossRef]
  27. Parhizkar, M.; Shabanpour, M.; Khaledian, M.; Cerdà, A.; Rose, C.W.; Asadi, H.; Lucas-Borja, M.E.; Zema, D.A. Assessing and Modeling Soil Detachment Capacity by Overland Flow in Forest and Woodland of Northern Iran. Forests 2020, 11, 65. [Google Scholar] [CrossRef] [Green Version]
  28. Li, Z.W.; Zhang, G.H.; Geng, R.; Wang, H. Spatial heterogeneity of soil detachment capacity by overland flow at a hillslope with ephemeral gullies on the Loess Plateau. Geomorphology 2015, 248, 264–272. [Google Scholar] [CrossRef]
  29. Pourbabaei, H.; Naghi Adel, M. Plant ecological groups and soil properties of common Hazel (Corylus avellana L.) stand in Safagashteh forest, north of Iran. Folia For. Pol. 2015, 57, 245–250. [Google Scholar] [CrossRef] [Green Version]
  30. Rezaei, H.; Jafarzadeh, A.A.; Alijanpour, A.; Shahbazi, F.; Khalil Valizadeh, K. Effect of Slope Position on Soil Properties and Types Along an Elevation Gradient of Arasbaran Forest, Iran. Int. J. Adv. Sci. Eng. Inf. Technol. 2015, 5, 449–456. [Google Scholar] [CrossRef] [Green Version]
  31. Li, Z.W.; Zhang, G.H.; Geng, R.; Wang, H.; Zhang, X. Land use impacts on soil detachment capacity by overland flow in the Loess Plateau, China. Catena 2015, 124, 9–17. [Google Scholar] [CrossRef]
  32. Zhang, G.H.; Tang, K.M.; Zhang, X.C. Temporal variation in soil detachment under different land uses in the Loess Plateau of China. Earth Surf. Process. Landf. 2009, 34, 1302–1309. [Google Scholar] [CrossRef]
  33. Hao, H.; Di, H.; Jiao, X.; Wang, J.; Guo, Z.; Shi, Z. Fine roots benefit soil physical properties key to mitigate soil detachment capacity following the restoration of eroded land. Plant Soil 2020, 446, 487–501. [Google Scholar] [CrossRef]
  34. Dube, H.B.; Mutema, M.; Muchaonyerwa, P.; Poesen, J.; Chaplot, V. A global analysis of the morphology of linear erosion features. Catena 2020, 190, 104542. [Google Scholar] [CrossRef]
  35. Kelarestaghi, A.; Ahmadi, H.; Jafari, M. Land use changes detection and spatial distribution using digital and satellite data, case study: Farim drainage basin, Northern of Iran. Desert 2006, 11, 33–47. [Google Scholar]
  36. Gholoubi, A.; Emami, H.; Alizadeh, A.; Azadi, R. Long term effects of deforestation on soil attributes: Case study, Northern Iran. Casp. J. Environ. Sci. 2019, 17, 73–81. [Google Scholar]
  37. Bahrami, A.; Emadodin, I.; Ranjbar Atashi, M.; Bork, H.R. Land-use change and soil degradation: A case study, North of Iran. Agric. Biol. J. N. Am. 2010, 4, 600–605. [Google Scholar]
  38. Kottek, M.; Grieser, J.; Beck, C.; Rudolf, B.; Rubel, F. World Map of the Köppen-Geiger climate classification updated. Meteorol. Z. 2006, 15, 259–263. [Google Scholar] [CrossRef]
  39. Islamic Republic of Iran Meteorological Organization. Annual Rainfall Report. 2016. Available online: www.irimo.ir (accessed on 20 September 2019).
  40. USDA. Soil Survey Staff, Keys to Soil Taxonomy, 11th ed.; U.S. Dep. Agric., Soil Conserv. Serv.: Washington, DC, USA, 2010.
  41. Norouzi, M.; Ramezanpour, H. Effect of fire on soil nutrient availability in forests of Guilan, north of Iran. Carpathian J. Earth Environ. Sci. 2013, 8, 157–170. [Google Scholar]
  42. Walkley, A.; Black, I.A. An examination 807 of the Degtjareff method for determining soil organic matter and a proposed modification of the chromic acid titration method. Soil Sci. 1934, 37, 29–38. [Google Scholar] [CrossRef]
  43. Kemper, W.D.; Rosenau, R.C. Aggregate 672 stability and size distribution. In Method of Soil Analysis, Part 1, Physical and Mineralogical Methods; Agronomy Monographs 9; Klute, A., Ed.; American Society of Agronomy: Madison, WI, USA, 1986; pp. 425–442. [Google Scholar]
  44. Anderson, J.P.E. Soil respiration. In Methods of Soil Analysis, Part 2; Page, A.L., Miller, R.H., Keeney, D.R., Eds.; Soil Science Society of America: Madison, WI, USA, 1982; pp. 831–872. [Google Scholar]
  45. Sparks, D. Methods of Soil Analysis, Part 3, Chemical Methods; SSSA Book Series No. 5; Soil Science Society of America: Madison, WI, USA, 1996. [Google Scholar]
  46. Gee, G.W.; Bauder, J.W. Particle-Size Analysis. In Methods of Soil Analysis, Part 1. Physical and Minerological Methods; Klute, A., Ed.; ASA-SSSA: Madison, WI, USA, 1986; pp. 383–411. [Google Scholar]
  47. Cassel, D.K.; Nielsen, D.R. Field Capacity and Available Water Capacity. Methods Soil Anal. Part 1 Mineral. Methods 1986, 5, 635–662. [Google Scholar]
  48. Asadi, H.; Moussavi, A.; Ghadiri, H.; Rose, C.W. Flow-driven soil erosion processes and the size selectivity of sediment. J. Hydrol. 2011, 406, 73–81. [Google Scholar] [CrossRef] [Green Version]
  49. Raei, B.; Asadi, H.; Moussavi, A.; Ghadiri, H. A study of initial motion of soil aggregates in comparison with sand particles of various sizes. Catena 2015, 127, 279–286. [Google Scholar] [CrossRef] [Green Version]
  50. Zhang, G.H.; Luo, R.T.; Cao, Y.; Shen, R.C.; Zhang, X.C. Correction factor to dye-measured flow velocity under varying water and sediment discharges. J. Hydrol. 2010, 389, 205–213. [Google Scholar] [CrossRef]
  51. Abrahams, A.D.; Parsons, A.J.; Luk, S.H. Field measurement of the velocity of overland flow using dye tracing. Earth Surf. Process. Landf. 1985, 11, 653–657. [Google Scholar] [CrossRef]
  52. Nearing, M.A.; Bradford, J.M.; Parker, S.C. Soil detachment by shallow flow at low slopes. Soil Sci. Soc. Am. J. 1991, 55, 339–344. [Google Scholar] [CrossRef]
  53. Yang, C.T. Unit stream power and sediment transport. J. Hydrol. Div. ASCE 1972, 98, 1805–1826. [Google Scholar]
  54. Nash, J.E.; Sutcliffe, J.V. River flow forecasting through conceptual models part I-a discussion of principles. J. Hydrol. 1970, 10, 282–290. [Google Scholar] [CrossRef]
  55. Van Liew, M.W.; Garbrecht, J. Hydrologic simulation of the Little Washita River experimental watershed using SWAT. J. Am. Water Resour. Assoc. 2003, 39, 413–426. [Google Scholar] [CrossRef]
  56. Singh, J.; Knapp, H.V.; Demissie, M. Hydrologic Modeling of the Iroquois River Watershed Using HSPF and SWAT, ISWS CR 2004–2008, Champaign, Ill.: Illinois State Water Survey. 2004. Available online: http://www.sws.uiuc.edu/pubdoc/CR/ISWSCR2004-08.pdf (accessed on 14 February 2018).
  57. Moriasi, D.N.; Arnold, J.G.; Van Liew, M.W.; Bingner, R.L.; Harmel, R.D.; Veith, T.L. Model evaluation guidelines for systematic quantification of accuracy in watershed simulations. Trans. ASABE 2007, 50, 885–900. [Google Scholar] [CrossRef]
  58. Wang, D.D.; Wang, Z.L.; Shen, N.; Chen, H. Modeling soil detachment capacity by rill flow using hydraulic parameters. J. Hydrol. 2016, 535, 473–479. [Google Scholar] [CrossRef]
  59. Nearing, M.A.; Foster, G.R.; Lane, L.J.; Finkner, S.C. A process-based soil erosion model for USDA-Water Erosion Prediction Project technology. Trans. ASAE 1989, 32, 1587–1593. [Google Scholar] [CrossRef]
  60. Massy, W.F. Principal Components Regression in Exploratory Statistical Research. J. Am. Stat. Assoc. 1965, 60, 234–256. [Google Scholar] [CrossRef]
  61. Wold, H. Soft modelling by latent variables; the nonlinear iterative partial least squares approach. In Perspectives in Probability and Statistics; Papers in honour of M.S. Barlett; Gani, J., Ed.; Academic Press: Cambridge, MA, USA, 1975; pp. 117–142. [Google Scholar]
  62. Carrascal, L.M.; Galván, I.; Gordo, O. Partial least squares regression as an alternative to current regression methods used in ecology. Oikos 2009, 118, 681–690. [Google Scholar] [CrossRef]
  63. Rodgers, J.L.; Nicewander, W.A. Thirteen ways to look at the correlation coefficient. Am. Stat. 1988, 42, 59–66. [Google Scholar] [CrossRef]
  64. Martinez-Mena, M.; Lopez, J.; Almagro, M.; Boix-Fayos, V.; Albaladejo, J. Effect of water erosion and cultivation on the soil carbon stock in a semiarid area of south714 east Spain. Soil Till. Res. 2008, 99, 119–129. [Google Scholar] [CrossRef]
  65. Girmay, G.; Sing, B.R.; Nyssen, J.; Borrosen, T. Runoff and sediment-associated nutrient losses under different land uses in Tigray, Northern Ethiopia. J. Hydrol. 2009, 376, 70–80. [Google Scholar] [CrossRef]
  66. Abdinejad, P.; Feiznia, S.; Pyrowan, H.R.; Fayazi, F.; Tbakh Shabani, A. Assessing the effect of soil texture and slope on sediment yield of Marl units using a portable rainfall simulator. J. Am. Sci. 2011, 7, 617–624. [Google Scholar]
  67. Fang, N.F.; Shi, Z.H.; Li, L.; Guo, Z.L.; Liu, Q.J.; Ai, L. The effects of rainfall regimes and land use changes on runoff and soil loss in a small mountainous watershed. Catena 2012, 99, 1–8. [Google Scholar] [CrossRef]
  68. Ciampalini, R.; Torri, D. Detachment of soil particles by shallow flow: Sampling methodology and observations. Catena 1988, 32, 37–53. [Google Scholar] [CrossRef]
  69. Wang, B.; Zhang, G.H.; Yang, Y.F.; Li, F.F.; Liu, J.X. Response of soil detachment capacity to plant root and soil properties in typical grasslands on the Loess Plateau. Agric. Ecosyst. Environ. 2018, 266, 68–75. [Google Scholar] [CrossRef]
  70. Vaezi, A.R.; Eslami, S.F.; Keesstra, S. Interrill erodibility in relation to aggregate size class in a semi-arid soil under simulated rainfalls. Catena 2018, 167, 385–398. [Google Scholar] [CrossRef]
  71. Sheridan, G.J.; So, H.B.; Loch, R.J.; Pocknee, C.; Walker, C.M. Use of laboratory-scale rill and interill erodibility measurements for the prediction of hillslope-scale erosion on rehabilitated coal mine soils and overburdens. Soil Res. 2000, 38, 285–298. [Google Scholar] [CrossRef]
  72. Pathak, P.; Sahrawat, K.L.; Rego, T.J.; Wani, S.P. Measurable biophysical indicators for impact assessment: Changes in soil quality. In Natural Resource Management in Agriculture, Methods for Assessing Economic and Environmental Impacts; Shiferaw, B., Freeman, H.A., Swinton, S.M., Eds.; ICRISAT: Patancheru, India, 2004. [Google Scholar]
  73. Quideau, S.A.; Chadwick, O.A.; Benesi, A.; Graham, R.C.; Anderson, M.A. A direct link between forestland vegetation type and soil organic matter composition. Geoderma 2001, 104, 41–60. [Google Scholar] [CrossRef]
  74. Ernst, W.H.O. Vegetation, organic matter and soil quality. In Developments in Soil Science; Elsevier: Amsterdam, The Netherlands, 2004; Volume 29, pp. 41–98. [Google Scholar]
  75. An, S.; Mentler, A.; Mayer, H.; Blum, W.E. Soil aggregation, aggregate stability, organic carbon and nitrogen in different soil aggregate fractions under forestland and shrub vegetation on the Loess Plateau, China. Catena 2010, 81, 226–233. [Google Scholar] [CrossRef]
  76. Reicosky, D.C.; Forcella, F. Cover crop and soil quality interactions in agroecosystems. J. Soil Water Conserv. 1998, 53, 224–229. [Google Scholar]
  77. De Baets, S.; Poesen, J.; Gyssels, G.; Knapen, A. Effects of grass roots on the erodibility of topsoils during concentrated flow. Geomorphology 2006, 76, 54–67. [Google Scholar] [CrossRef]
  78. De Baets, S.; Poesen, J.; Knapen, A.; Galindo, P. Impact of root architecture on the 23 erosion-reducing potential of roots during concentrated flow. Earth Surf. Process. Landf. J. Br. Geomorphol. Res. Group 2007, 32, 1323–1345. [Google Scholar] [CrossRef]
  79. Prosser, I.P.; Dietrich, W.E.; Stevenson, J. Flow resistance and sediment transport by concentrated overland flow in a grassland valley. Geomorphology 1995, 13, 71–86. [Google Scholar] [CrossRef]
  80. Cerdà, A.; Doerr, S.H. Soil wettability, runoff and erodibility of major dry- Mediterranean land use types on calcareous soils. Hydrol. Process. Int. J. 2007, 21, 2325–2336. [Google Scholar] [CrossRef]
  81. Caravaca, F.; Lax, A.; Albaladejo, J. Aggregate stability and carbon characteristics of particle-size fractions in cultivated and forested soils of semiarid Spain. Soil Till. Res. 2004, 78, 83–90. [Google Scholar] [CrossRef]
  82. McDonald, M.A.; Healey, J.R.; Stevens, P.A. The effects of secondary forest clearance and subsequent land-use on erosion losses and soil properties in the Blue Mountains of Jamaica. Agric. Ecosyst. Environ. 2002, 92, 1–19. [Google Scholar] [CrossRef]
  83. Lemenih, M.; Karltun, E.; Olsson, M. Assessing soil chemical and physical property responses to deforestation and subsequent cultivation in smallholders farming system in Ethiopia. Agric. Ecosyst. Environ. 2005, 105, 373–386. [Google Scholar] [CrossRef]
  84. Shepherd, T.G.; Saggar Newman, R.H.; Ross, C.W.; Dando, J.L. Tillage induced changes in soil structure and soil organic matter fractions. Aust. J. Soil Res. 2001, 39, 465–489. [Google Scholar] [CrossRef]
  85. Minasny, B.; McBratney, A.B. Limited effect of organic matter on soil available water capacity. Eur. J. Soil Sci. 2017, 69, 39–47. [Google Scholar] [CrossRef] [Green Version]
  86. Rawls, W.J.; Pachepsky, Y.A.; Ritchie, J.C.; Sobecki, T.M.; Bloodworth, H. Effect of soil organic carbon on soil water retention. Geoderma 2003, 116, 61–76. [Google Scholar] [CrossRef]
  87. Wolf, B.; Snyder, G.H. Sustainable Soils: The Place of Organic Matter in Sustaining Soils and Their Productivity; Haworth Press: New York, NY, USA, 2003; p. 352. [Google Scholar]
  88. Bombino, G.; Zema, D.A.; Denisi, P.; Lucas-Borja, M.E.; Labate, A.; Zimbone, S.M. Assessment of riparian vegetation characteristics in Mediterranean headwaters regulated by check dams using multivariate statistical techniques. Sci. Total Environ. 2019, 657, 597–607. [Google Scholar] [CrossRef]
  89. Zema, D.A.; Bombino, G.; Denisi, P.; Lucas-Borja, M.E.; Zimbone, S.M. Evaluating the effects of check dams on channel geometry, bed sediment size and riparian vegetation in Mediterranean mountain torrents. Sci. Total Environ. 2018, 642, 327–340. [Google Scholar] [CrossRef] [PubMed]
  90. Nael, M.; Khademi, H.; Hajabbasi, M.A. Response of soil quality indicators and their spatial variability to land degradation in central Iran. Appl. Soil Ecol. 2004, 27, 221–2320. [Google Scholar] [CrossRef]
  91. Islam, K.R.; Weil, R.R. Land use effects on soil quality in a tropical forest ecosystem of Bangladesh. Agric. Ecosyst. Environ. 2000, 79, 9–16. [Google Scholar] [CrossRef]
  92. Kiani, F.; Jalalian, A.; Pashaee, A.; Khademi, H. Effect of deforestation on selected soil quality attributes in loess-derived landforms of Golestan province, northern Iran. In Proceedings of the 4th International Iran Russia Conference, New York, NY, USA, 15 January 2004; pp. 546–550. [Google Scholar]
  93. Giesler, R.; Esberg, C.; Lagerström, A.; Graae, B.J. Phosphorus availability and microbial respiration across different tundra vegetation types. Biogeochemistry 2012, 108, 429–445. [Google Scholar] [CrossRef]
  94. Tardy, V.; Mathieu, O.; Lévêque, J.; Terrat, S.; Chabbi, A.; Lemanceau, P.; Maron, P.A. Stability of soil microbial structure and activity depends on microbial diversity. Environ. Microbiol. Rep. 2014, 6, 173–183. [Google Scholar] [CrossRef]
  95. Mganga, K.; Razavi, S.B.; Kuzyakov, Y. Land use affects soil biochemical properties in Mt. Kilimanjaro region. Catena 2016, 141, 22–29. [Google Scholar] [CrossRef]
  96. Cerdà, A. The influence of aspect and vegetation on seasonal changes in erosion under rainfall simulation on a clay soil in Spain. Can. J. Soil Sci. 1998, 78, 321–330. [Google Scholar] [CrossRef] [Green Version]
  97. Petersen, S.L.; Stringham, T.K. Infiltration, Runoff, and Sediment Yield in Response to Western Juniper Encroachment in Southeast Oregon. Rangel. Ecol. Manag. 2008, 61, 74–81. [Google Scholar] [CrossRef]
  98. Carter, M.R.; Gregorich, E.G.; Angers, D.A.; Donald, R.G.; Bolinder, M.A. Organic C and N storage and organic C fractions in adjacent cultivated and forested soils of eastern Canada. Soil Till. Res. 1998, 47, 253–261. [Google Scholar] [CrossRef]
  99. Girmay, G.; Singh, B.R.; Mitiku, H.; Borresen, T.; Lal, R. Carbon stocks in Ethiopian soils in relation to land use and soil management. Land Degrad. Dev. 2008, 19, 351–367. [Google Scholar] [CrossRef]
  100. Sidari, M.; Ronzello, G.; Vecchio, G.; Muscolo, A. Influence of slope aspects on soil chemical and biochemical properties in a Pinus laricio forest ecosystem of Aspromonte (Southern Italy). Eur. J. Soil Biol. 2008, 44, 364–372. [Google Scholar] [CrossRef]
  101. Zema, D.A.; Nicotra, A.; Mateos, L.; Zimbone, S.M. Improvement of the irrigation performance in Water Users Associations integrating data envelopment analysis and multi-regression models. Agric. Water Manag. 2018, 205, 38–49. [Google Scholar] [CrossRef]
  102. García-Ruiz, J.M. The effects of land uses on soil erosion in Spain: A review. Catena 2010, 81, 1–11. [Google Scholar] [CrossRef]
  103. Knapen, A.; Poesen, J.; Govers, G.; De Baets, S. The effect of conservation tillage on runoff erosivity and soil erodibility during concentrated flow. Hydrol. Process. 2008, 22, 1497–1508. [Google Scholar] [CrossRef]
  104. Laflen, J.M.; Lane, J.L.; Foster, G.R. WEPP—A New Generation of Erosion Prediction Technology. J. Soil Water Conserv. 1991, 46, 34–38. [Google Scholar]
Figure 1. Geographical location (a, right), photos of forested and deforested hillslopes (a, left, source: Google Maps) and experimental design with sampling points (b) (Saravan Forestland Park, Northern Iran).
Resources 09 00129 g001
Figure 2. Monthly distribution of precipitation and minimum/maximum temperature in Saravan Forestland Park (Northern Iran).
Resources 09 00129 g002
Figure 3. Box-plots of rill detachment capacity (Dc) measured on soil samples collected in the four hillslopes of Saravan Forestland Park (Northern Iran). Notes: D = deforested hillslope; F = forested hillslope; S = south; N = north; US = upper slope; MS = middle slope; LS = lower slope; different letters indicate significant differences between hillslope aspect and position after Tukey’s test (p < 0.05) following ANOVA; +indicates the mean values, the black points indicate the minimum and maximum values.
Resources 09 00129 g003
Figure 4. Loading (a) and scores (b) of the original variables - physico-chemical properties of soil sampled collected in the four hillslopes of Saravan Forestland Park (Northern Iran)—on the first two components (PCR1 and PCR2) of Principal Component Regression (significant parameters at p > 0.05 are reported in bold). Notes: D = deforested hillslope; F = forested hillslope; S = south; N = north; US = upper slope; MS = middle slope; LS = lower slope.
Resources 09 00129 g004
Figure 5. Linear multiregression model based on Principal Component Regression to predict soil detachment capacity (Dc) from the first two PCRs in four hillslopes of Saravan Forestland Park (Northern Iran). Note: the grey lines show the upper and lower 95%-bounds.
Resources 09 00129 g005
Figure 6. Power regression equations (Equation (5)) between soil detachment capacity (Dc) and unit stream power measured on soil samples collected in the four hillslopes of Saravan Forestland Park (Northern Iran). Notes: D = deforested hillslope; F = forested hillslope; S = south; N = north.
Resources 09 00129 g006
Figure 7. Scatter plot of soil detachment capacity (Dc) measured on soil samples collected in four hillslopes of Saravan Forestland Park (Northern Iran) and predicted by the linear regression Equation (5) of Table 4. Notes: D = deforested hillslope; F = forested hillslope; S = south; N = north.
Resources 09 00129 g007
Figure 8. Linear regression equations between soil detachment capacity (Dc) and shear stress measured on soil samples collected in the four hillslopes of Saravan Forestland Park (Northern Iran). Notes: D = deforested hillslope; F = forested hillslope; S = south; N = north.
Resources 09 00129 g008
Figure 9. Scatter plot of soil detachment capacity (Dc) measured on soil samples collected in four hillslopes of Saravan Forestland Park (Northern Iran) and predicted by the power regression Equation (4) of Table 5. Notes: D = deforested hillslope; F = forested hillslope; S = south; N = north.
Resources 09 00129 g009
Table 1. Main properties of soil samples (mean ± std. dev) collected in the four hillslopes of Saravan Forestland Park (Northern Iran).
Soil Quality IndicatorsCondition
DF
Aspect
SNMean DeforestedSNMean Forest
SaC (%)Mean12.713.012.8 a18.819.118.9 b
Std. Dev.0.410.410.440.480.480.49
Mean south15.71 AStd. Dev. south3.14
Mean north16.05 BStd. Dev. North3.12
SiC (%)Mean47.947.747.8 a47.146.947.0 b
Std. Dev.0.460.460.460.370.260.32
Mean south47.48 AStd. Dev. south0.59
Mean north47.28 AStd. Dev. north0.54
ClC (%)Mean39.439.339.3 a34.234.034.1 b
Std. Dev.0.220.190.210.350.390.36
Mean south36.79 AStd. Dev. south2.69
Mean north36.65 AStd. Dev. north2.70
OM (%)Mean1.852.091.94 a3.033.463.23 b
Std. Dev.0.390.330.360.170.200.28
Mean south2.40 AStd. Dev. south0.68
Mean north2.77 BStd. Dev. north0.74
BD (kg m−3)Mean157115411554 a138413541374 b
Std. Dev.25.384.661.760.949.359.6
Mean south1475 AStd. Dev. south104
Mean north1453 AStd. Dev. north115
AS (%)Mean0.630.750.69 a1.291.641.47 b
Std. Dev.0.190.150.180.190.270.29
Mean south0.96 AStd. Dev. south0.38
Mean north1.20 BStd. Dev. north0.50
CCE (%)Mean2.622.412.51 a1.611.301.48 b
Std. Dev.0.300.270.300.270.220.29
Mean south2.11 AStd. Dev. south1.88
Mean north0.58 BStd. Dev. north0.60
SMR (g of CO2 per kg of soil)Mean0.080.130.10 a0.190.220.21 b
Std. Dev.0.020.020.030.020.010.02
Mean south0.14 AStd. Dev. south0.06
Mean north0.17 BStd. Dev. north0.05
RWD (kg m−3)Mean0.000.000.00 a0.560.650.60 b
Std. Dev.0.000.000.000.110.110.11
Mean south0.56 AStd. Dev. south0.11
Mean north0.63 BStd. Dev. north0.11
SP (%)Mean40.741.841.4 a47.848.948.1 b
Std. Dev.0.9543.192.332.2991.862.25
Mean south44.32 AStd. Dev. south3.91
Mean north45.17 AStd. Dev. north4.34
AW (%)Mean10.312.011.0 a13.715.014.5 b
Std. Dev.2.211.281.931.612.142.15
Mean south11.8 AStd. Dev. south2.58
Mean north13.7 BStd. Dev. north2.51
Notes: D = deforested hillslope; F = forest hillslope; S = south; N = north; SaC = sand content; SiC = silt content; ClC = clay content; OM = organic matter content; BD = bulk density; AS = aggregate stability; CCE = calcium carbonate equivalent; SMR = soil microbial respiration; RWD = root weight density; SP = soil porosity; AW = available water; different lowercase and capital letters indicate significant differences between D and F condition as well as N and S aspect, respectively, after Tukey’s test (at p < 0.05) following ANOVA.
Table 2. Pearson’s correlation matrix among the soil properties of samples collected in the four hillslopes of Saravan Forestland Park (Northern Iran).
Soil PropertyOMBDRWDASSaCSiCClCCCESMRSPAWDc
OM1.000−0.7770.9010.8600.914−0.788−0.892−0.8470.8800.7770.678−0.860
BD 1.000−0.823−0.760−0.8270.5330.8470.787−0.796−1.000−0.4830.561
RWD 1.0000.9120.973−0.760−0.967−0.9130.8990.8230.591−0.796
AS 1.0000.903−0.790−0.881−0.9390.9050.7600.531−0.768
SaC 1.000−0.794−0.991−0.9100.9070.8270.642−0.840
SiC 1.0000.7080.798−0.719−0.533−0.5310.880
ClC 1.0000.889−0.901−0.847−0.6320.787
CCE 1.000−0.907−0.787−0.5050.760
SMR 1.0000.7960.669−0.759
SP 1.0000.483−0.561
AW 1.000−0.662
Dc 1.000
Notes: SaC = sand content; SiC = silt content; ClC = clay content; OM = organic matter content; BD = bulk density; AS = aggregate stability; CCE = calcium carbonate equivalent; SMR = soil microbial respiration; RWD = root weight density; SP = soil porosity; AW = available water; Dc = soil detachment capacity.
Table 3. Loadings of the original variables—soil properties of samples collected in the four hillslopes of Saravan Forestland Park (Northern Iran)—on the first two components (PCR1 and PCR2) of Principal Component Regression (significant parameters at p > 0.05 are reported in bold).
Soil Properties PCR1PCR2
OM0.9390.121
BD−0.8740.424
RWD0.969−0.020
AS0.9370.030
SaC0.9800.026
SiC−0.800−0.376
ClC−0.9670.050
CCE−0.9410.020
SMR0.9480.046
SP0.874−0.424
AW0.6660.477
Notes: PCR = principal component of regression; SaC = sand content; SiC = silt content; ClC = clay content; OM = organic matter content; BD = bulk density; AS = aggregate stability; CCE = calcium carbonate equivalent; SMR = soil microbial respiration; RWD = root weight density; SP = soil porosity; AW = available water.
Table 4. Power regression equations between soil detachment capacity (Dc, kg m−2 s−1) and unit stream power (ω, m s−1) measured on soil samples collected in four hillslopes of Saravan Forestland Park (Northern Iran).
Hillslope CharacteristicPower Regression Equation (5)r2
ConditionAspect
DeforestedSouthDc = 0.947ω1.2100.964
NorthDc = 0.950ω1.2650.952
ForestedSouthDc = 0.232ω1.0660.943
NorthDc = 0.312ω1.3050.938
Table 5. Linear regression equations between soil detachment capacity and critical shear stress measured on soil samples collected in four hillslopes of Saravan Forestland Park (Northern Iran).
Hillslope CharacteristicLinear Regression Equation (6)Kr [s m−1]τc [Pa]r2
ConditionAspect
DeforestedSouthDc = 0.0093 τ − 0.02890.00933.110.864
NorthDc = 0.0088 τ − 0.02990.00883.420.870
ForestedSouthDc = 0.0030 τ − 0.00830.00302.740.874
NorthDc = 0.0027 τ − 0.00970.00273.570.875
Notes: Kr = rill erodibility; τc = critical shear stress.
Publisher’s Note: MDPI stays neutral with regard to jurisdictional claims in published maps and institutional affiliations.

