An Approach to Analysing Water Consumers’ Acceptance of Risk-Reduction Costs


1
Department of Water Supply and Sewerage Systems, Faculty of Civil, Environmental Engineering and Architecture, Rzeszow University of Technology, Al. Powstancow Warszawy 6, 35-959 Rzeszow, Poland
2
Department of Geotechnics, Geomatics and Waste Management, Faculty of Environmental, Geomatic and Energy Engineering, Kielce University of Technology, Al. 1000-lecia Panstwa Polskiego 7, 25-314 Kielce, Poland
*
Author to whom correspondence should be addressed.
Resources 2020, 9(11), 132; https://0-doi-org.brum.beds.ac.uk/10.3390/resources9110132
Submission received: 18 August 2020
/
Revised: 3 November 2020
/
Accepted: 4 November 2020
/
Published: 6 November 2020
(This article belongs to the Special Issue Advances in Water Resource Monitoring and Modelling: Water Quantity and Quality Issues)
Abstract
:The proper operation of a water supply system (WSS) requires constant investment. The priority is to provide residents with high quality potable water, in the required quantity and pressure, in accordance with the applicable regulations. The paper presents an assessment of the potential inherent operational risk of a WSS in support of the risk-based investment management process. It is of high importance to invest in the operational safety as it concerns both producers and consumers. The investment engenders additional costs that should partially be supported by the consumers. Thus, the paper presents a methodology to analyse consumers’ readiness to accept water supply services’ additional costs. The proposed methods may underpin a comprehensive program for risk-based investment management and operational decision-making. The case study and the approach in this article concern one particular regional WSS, based on information collected from water consumers. The assessment suggests a willingness to tolerate additional costs in view of enhancing the performance of the water supply services.
1. Introduction
A global water supply safety system represents a collection of organisations, institutions, technical systems, educational, and control measures, whose aim is to ensure the safety of those who consume water. A safety management system tends to be introduced at the local level [1,2], and in today’s world typically, or even necessarily, embraces risk management [3]. In the context of a water supply company, this is a multi-stage procedure that aims at improving system security, especially regarding the supply of drinking water in both its quantitative and qualitative aspects [4]. Key aspects here are risk analysis, risk assessment, and decision-making regarding acceptability and temporary control [5,6].
At the outset, it is necessary to recall how risk derives from a lack of knowledge of events that may occur in the human environment as a process operator [7,8]. On that basis, today’s active risk management entails the identification and analysis of the causes of risk, limiting losses, and building a strategy of success. The effects to be achieved are risk control and risk reduction to tolerable levels [9,10].
In the case of water distribution systems, the most important factors are production, logistics, and research and development [11]. Where these are integrated, risk management can be coordinated [12]. The risk associated with the production and distribution of drinking water relates in particular to the likelihood of adverse events and the extent of possible damage [13]. During the phase in which water is produced, risk can be assigned to either strategic or operational categories [14]. Strategic production risk is long-term, relating to the investment decisions water supply companies take, not least regarding the quality of the water source as conceived broadly (activities in compliance with provisions on zones for the protection of intakes) [15]. Operational production risk, in turn, refers to current disruptions in the production and distribution of water, and is of a short-term nature [16,17].
Logistic risk is determined in the planning phase of water supply operations, and relates to its management methods [18,19]. The purpose of logistic protection in crisis situations (e.g., flood or drought) is to ensure appropriate organisation and operational effectiveness within the framework of crisis response, in a manner adequate to the level of the threat. In the Polish case specifically, this should be in accordance with the country’s Crisis Management Act. The most important logistical safeguards limiting risk include, among other things [20,21,22]:
- Developing emergency plans in the event of failures of various kinds;
- Securing the work of means of communication and an alarm notification network;
- Arranging the supply of water from alternative sources (e.g., water delivery to housing estates in water tankers);
- Providing basic medical and sanitary measures (e.g., for water supply);
- Providing resources as part of external support (e.g., in the supply of bottled water to the population);
- Organising preventive inspections aimed at assessing the state of emergency protection and identifying potential new causes of failures;
- Developing a crew-training system in the event of a crisis, including periodic civil-defence exercises.
Risk management should be treated as a process inseparable from the management of the entire water supply company, as related to the development of risk response methods, i.e., the preparation of organisational infrastructure in support of risk management [23]. Risk identification is based on the selection of representative emergency events that may occur during system operation, including initiating events capable of inducing a so-called domino effect [24]. Risk assessment is then a process of qualitative and quantitative analysis using methods adequate to a given type of risk and determining the criterion value for the adopted risk scale. Risk scale may be a three-level scale distinguishing tolerated, controlled, and unacceptable risk, or a five-level one in which the risk area is additionally distinguished as neglected and absolutely unacceptable [25]. Risk control and reduction involves the implementation of procedures as well as the registration and evaluation of the results of changes [26]. This helps the company to define its policy and implies a process for the implementation of measures in order to obtain an acceptable risk level at an acceptable cost [27,28]. In the literature, the following indicators can be used to analyse risk-reduction costs [29,30]:
- Assumed cost of preventing undesirable events, the so-called ICAF—Implied Cost of Averting a Fatality:
ICAF = ∆Cost/∆r,
Δr = rp − rk,
- An indicator called the Cost of Unit Risk Reduction—CURR:
A water supply company’s priority is to ensure the continuity of drinking water supply of adequate quality. Ageing water distribution systems and growing quality requirements demand large financial outlays. Consequently, this impacts on the cost of water supply services. The process of communicating with water consumers, and of marketing and information activities, represents an integral aspect of the management of a water supply company, including its risk management. The approach presented here gives a view to a water supply company in the context of management and informs consumers about the functioning of water utilities. Water-supply companies are obliged to analyse risk, to develop water safety plans, and thus, to pursue modernisation and risk reduction. Given recent epidemiological threats related to COVID-19, additional procedures are in place, and should also gain the acceptance of consumers. All these activities have an impact on the price of water in the context of risk reduction and increasing levels of safety. Therefore, consumers have to be informed of company pricing politics. In line with the approach presented here, there is a clear indication as to whether the means of informing, communicating with, and explaining to consumers are appropriate, and why these costs are incurred. Company managers should assess the acceptability of their modernisation actions to reduce risk and the corresponding cost by the consumers.
2. Criteria for Risk Acceptance as an Element of Risk Management
Risk assessment in the context of a WSS consists of risk analysis and risk evaluation [31,32]. The former should also assess the functional limitations of individual WSS subsystems [33]. More generally, the results of the risk analysis represent input into risk evaluation, whose purpose is to decide whether risks are within tolerable limits, or whether there should be reduction via [34]:
- Systemic solutions (e.g., modernisation of the system, alternative water sources kept in constant readiness, emergency capacity in water tanks, correction of water treatment technology, redesign of the water supply network, alternative energy sources, reserving strategic network facilities, and the introduction of remote supervision and system control using GIS);
- Technical and complementary protective measures (the introduction of a multi-barrier system, i.e., an early, delayed, or late warning system);
- Information for water consumers.
Figure 1 presents detailed risk management procedures for a water supply company.
The definition of risk-acceptability criteria should primarily take account of aspects related to the safety of water consumers, and technical or technical/economic analysis. Such criteria are used for decisions that are made on running the system (e.g., regarding renovation, modernisation, and authorisation for use). According to [35], a system can be considered safe if the level of risk generated during its operation does not exceed certain limits.
In situations where criteria regarding acceptable risk have not yet been established, the risk value at the given moment can be considered a measure of safety [36]. This is the basis to determine the criteria that offer a value of tolerated risk. The risk acceptability level and risk-assessment methods are often subject to legal regulations regarding specific technical systems [37,38,39], e.g., transport-related or industrial. Given that, the more exigent the risk-acceptance criteria are, the more extensive the security and protection measures are [40,41,42]. Risk-acceptability criteria are then an important element to a water supply company’s financial policy [43].
Determination of criterion values in risk assessment denotes the application of the so-called As Low As Reasonably Practicable (ALARP) principle, the assumption being that the level of risk should be seen in this way, with the “reasonably” aspect implying justification of an economic and technical nature. The ALARP principle was first introduced in the United Kingdom. Accordingly, it was considered as an unacceptable value for risk of death: for individual employees (r = 0.001) and for the population (r = 0.0001). The ALARP principle assumes that the entire risk range is divided into three areas:
- The area below the lower limit, i.e., of widely tolerated risk;
- The area above the upper limit, i.e., of unacceptable risk;
- The ALARP area between the two given boundaries.
Figure 2 proposes criteria values for the individual risks faced by water consumers, with reference to the ALARP concept.
The risk-reduction process should include a cost–benefit analysis. The level of risk to be determined is that at which the costs of further reduction are disproportionately high in relation to potential benefits. The Health and Safety Executive (HSE) guidelines introduce the concept of the statistical cost of avoiding fatalities, which, in accordance with the given guidelines, is estimated at around GBP (British Pound Sterling) 1 million.
3. Materials and Methods
3.1. Materials
The distinguished water supply system is located in Poland’s Podkarpacie Province. The supplied city is on the right bank of the Vistula in the southeastern part of the country, covers a total area of 130 km2, and lies at 50°02′01″ N 22°00′17″ E. In 2019, the city had an urbanisation rate of 1546 inhabitants/km2 and is at between 197 and 384 m a.s.l.
The city is supplied with water from the river using a bank chamber water intake with a capacity of 84,000 m3/d. Water is treated in two modernised Water Treatment Plants and meets the quality requirements for water intended for human consumption. In total, about 190,000 residents of the city and nearby towns are using the distinguished water supply system currently. In 2019, the average daily production of treated water was approx. 34,600 m3/day, with customers’ demand for water met fully in this capacity.
The research was carried out in relation to the assessment of water supply services by water consumers (Table 1), which were used to determine the quality indicators. The conducted tests form an element of regional studies and are preliminary partial tests used to estimate the assessments included in the assumed indicator. The selection of a representative random sample was assumed according to guidelines presented in [35]. The research was conducted on a sample of 200 people (of legal age over the age of 18), prepared in line with recommendations contained in the literature. Statistical analysis was performed with the Statsoft software, version 12 [44]. The highest reliability of the questionnaire occurred with ten questions. The further elimination of questions does not improve the result, but worsens it, so it is the optimal set of questions for the formulated set of 10 questions. None of the people who completed the questionnaire were excluded. Reliability statistics showed that the Cronbach alpha value has a high reliability (consistency) for the questionnaire. Differences concerning mean values for variables were tested with the Student t-test, and for proportions, the Z test was applied. In order to evaluate the equality of distributions, a Kolmogorov–Smirnov test was performed. A p-value of less than 0.05 was considered statistically significant. No statistically significant differences between gender and age group were observed.
3.2. Assumptions Underpinning the Method Analysing Consumers’ Acceptance of Risk-Reduction Costs
As the risk-reduction process requires financial investment, an impact on the price of drinking water is exerted and should be accepted by water consumers. The level of acceptance for a water company’s expenditure related to risk management depends on various factors, such as: a quality-of-life indicator, the awareness of water consumers regarding the risks arising from lack of risk management procedures, and the degree of confidence in the water supply company. Experts in the sector of water supply system management tested, adjusted, and validated a survey through a pilot study. The question was selected in such a way as to gather information about quality of services related to the use of public water supply systems, in particular, reliable and safe access to drinking water (in accordance with applicable regulations). An important element in this respect is also the subjective assessment of water consumers, their sense of safety, and their trust in the water supply company as to the quality of services provided, which translates directly into the acceptance of actions (including acceptance of the water price) undertaken by the water utility (e.g., modernization, renovation, etc.)
The use of so-called Acceptance Risk Index (ARI) achieves an evaluation of the level of acceptance by water consumers of the costs incurred by a supply company, as it implements risk management methods [35].
The Acceptance Risk Index can be described as a function of subjective assessments related to the assessment by consumers (users) of the functioning of a water supply company:
ARIijk = Qi × Pj × Tk,
The adopted methodology proposed the following assessments included in the ARIjik:
- Qi is a consumers’ assessment of drinking water quality, for i = 1, 2, 3;
- Pj is an assessment related to the acceptance of water prices by consumers, for j = 1, 2, 3;
- Tk is an assessment related to the degree of trust and knowledge of water consumers as regards activities carried out by a water supply company, including the trust that tap water is safe for health, for k = 1, 2, 3.
The next stage of the procedure is to classify ARI values into individual sets that characterize the obtained values of Qi, Pj, and Tk on the adopted point weights presented in the Table 1.
The obtained values of Qi, Pj, and Tk take values from a three-point scale from 1 to 3 on the basis of the performed assessment related to the consumers’ assessment [35].
The set of possible ARI values, ARI = {ARIijk}, can be represented in the form of the matrix.
In this way, the data matrix MARI for the ARI indicator is as follows:
The ARI index assumes values from 1 to 27.
The classification proposed for acceptance levels has:
- High-scale (when ARI takes values equals or higher than 12), ARIh = {ARI322, ARI223, ARI323, ARI232, ARI322, ARI233, ARI333}.
- Average-scale (when ARI takes values from 6 to 12), ARIa = {ARI312, ARI213, ARI313, ARI321, ARI222, ARI123, ARI231, ARI331, ARI132, ARI133}.
- Low-scale (when ARI takes values less than 6), ARIl = {ARI111, ARI211, ARI311, ARI112, ARI212, ARI113, ARI121, ARI221, ARI122, ARI131}.
The assessment of the analysis is in turn as follows:
- If the ARI level is classified as high on the scale provided, this denotes acceptance by consumers of the costs incurred by the water supply company.
- If, on a given scale, the level of ARI is classified as medium, this means that the costs incurred by the water supply company are tolerated by consumers. However, the company should pursue an information campaign to convince consumers of the necessity of the new measures being applied.
- If the ARI level is classified as low on the scale provided, this means that the costs incurred by the water supply company are not accepted by water consumers. The company should verify its action plan and make adjustments in the design phase.
3.3. Results of Research
The results of the research related to consumers’ assessments of the quality of water supply services were used to determine the ARI value. The structuring of answers is as presented in Table 2, Table 3, Table 4 and Table 5 [35], while the results of the research (quality assessment of water supply services) are included in Figure 3, Figure 4, Figure 5, Figure 6, Figure 7, Figure 8, Figure 9, Figure 10, Figure 11 and Figure 12.
Answers to Questions 1–6 were used directly to determine the ARI indicator. Questions from 7 to 10 were asked to obtain approximate information on consumer knowledge regarding the city’s water supply.
The results of the research allowed the following conclusions to be drawn:
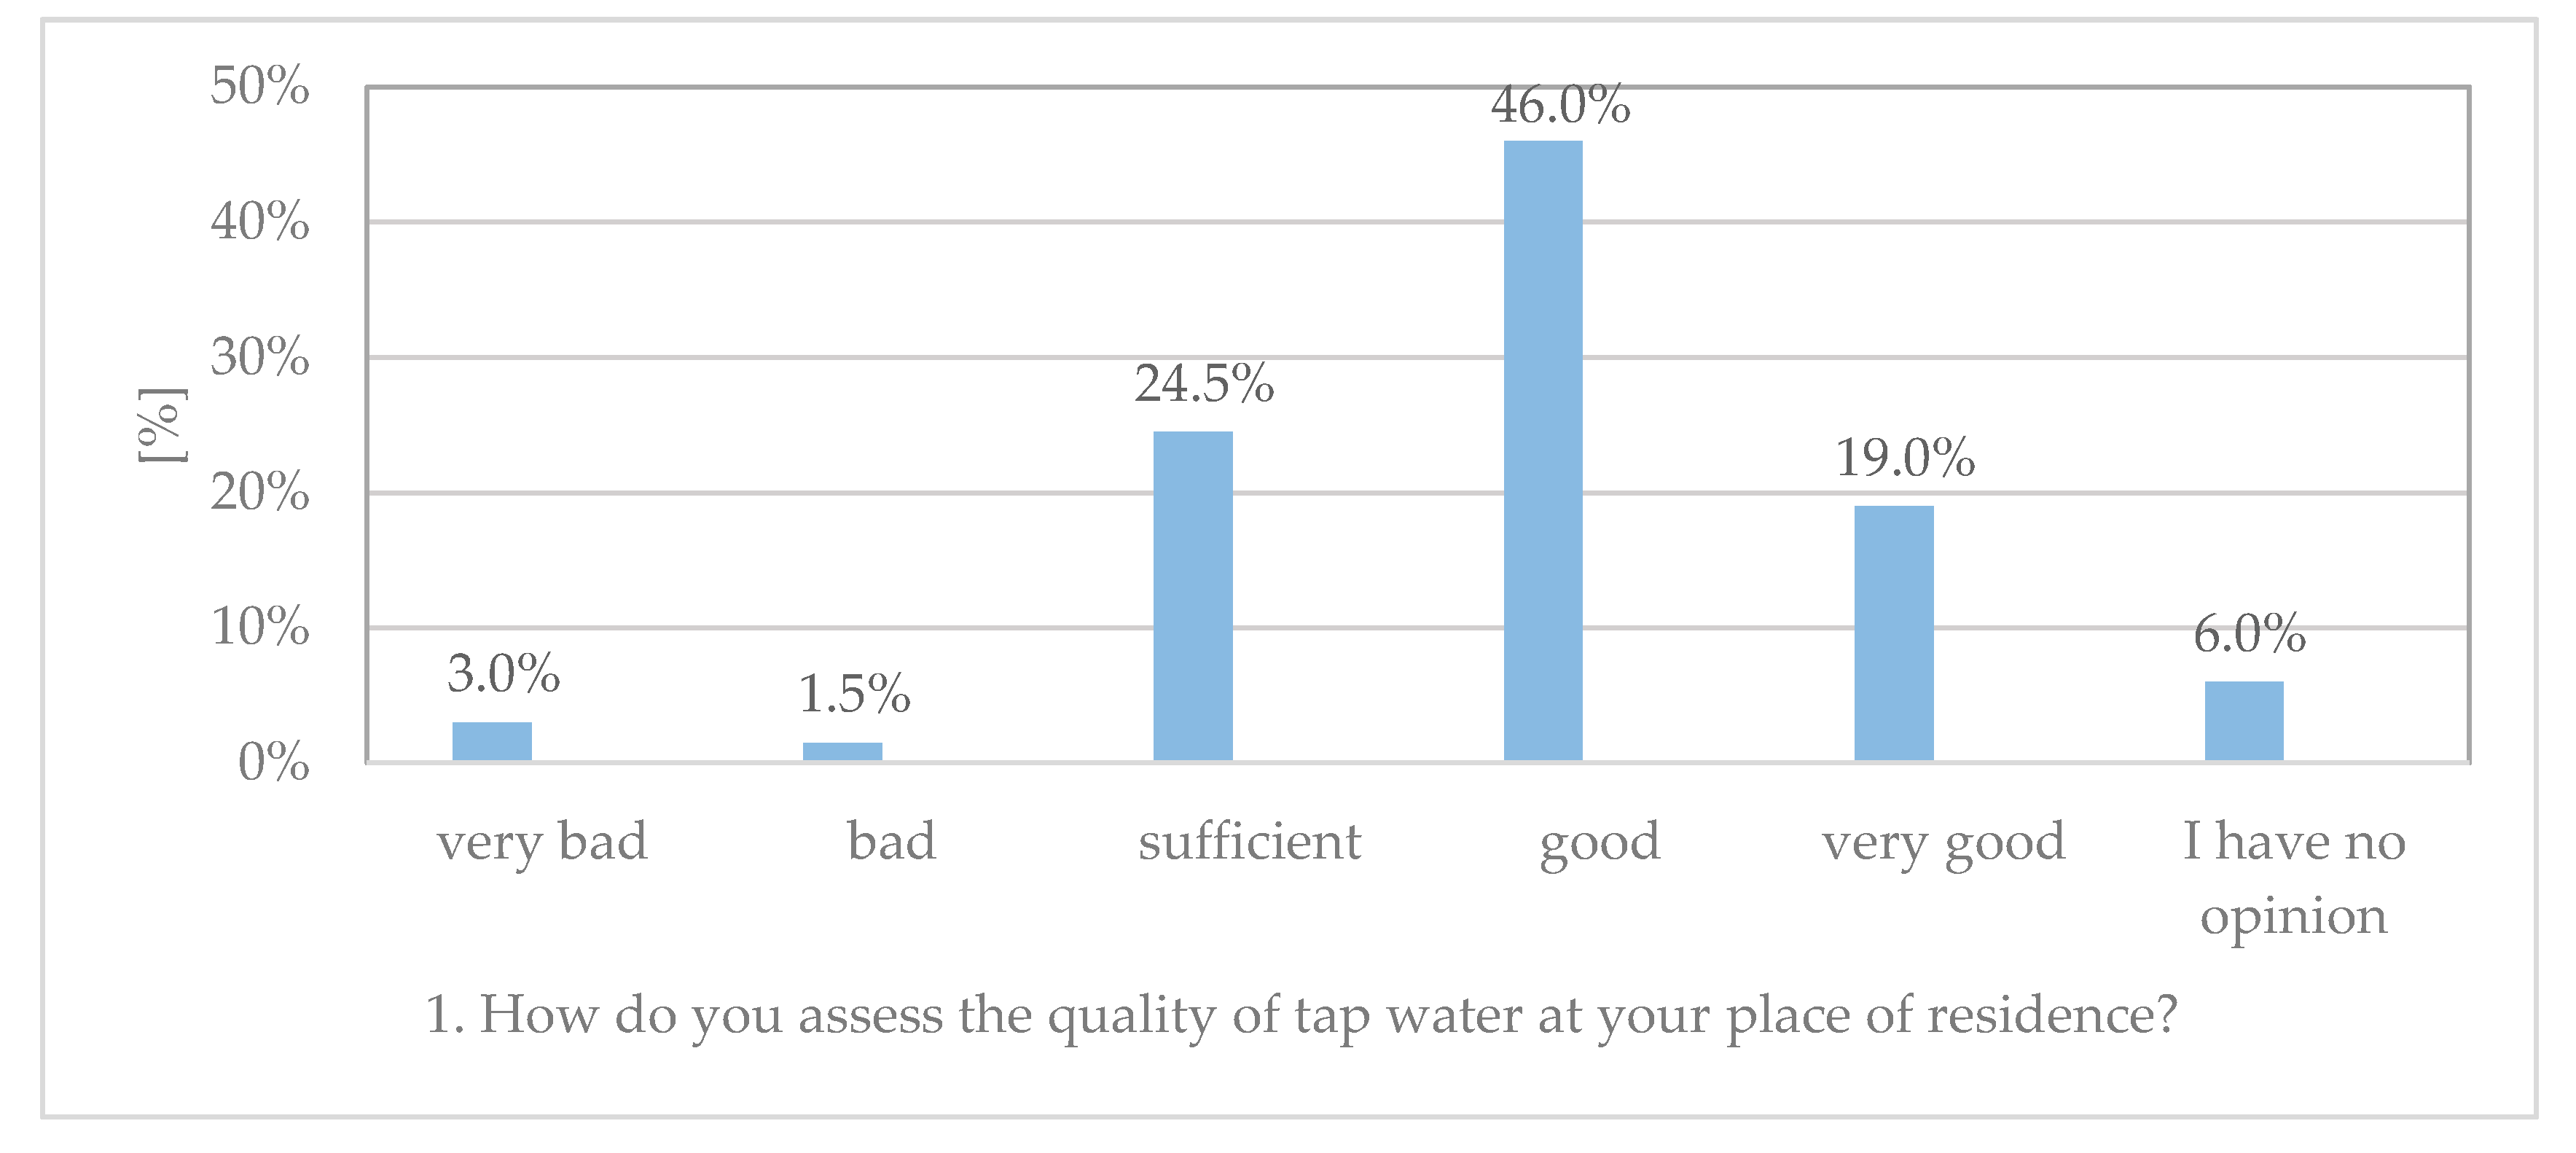
- Around 65% of respondents assess the quality of tap water, the work of the water supply company (75%), and the quality of water resources (47%) as good and very good;
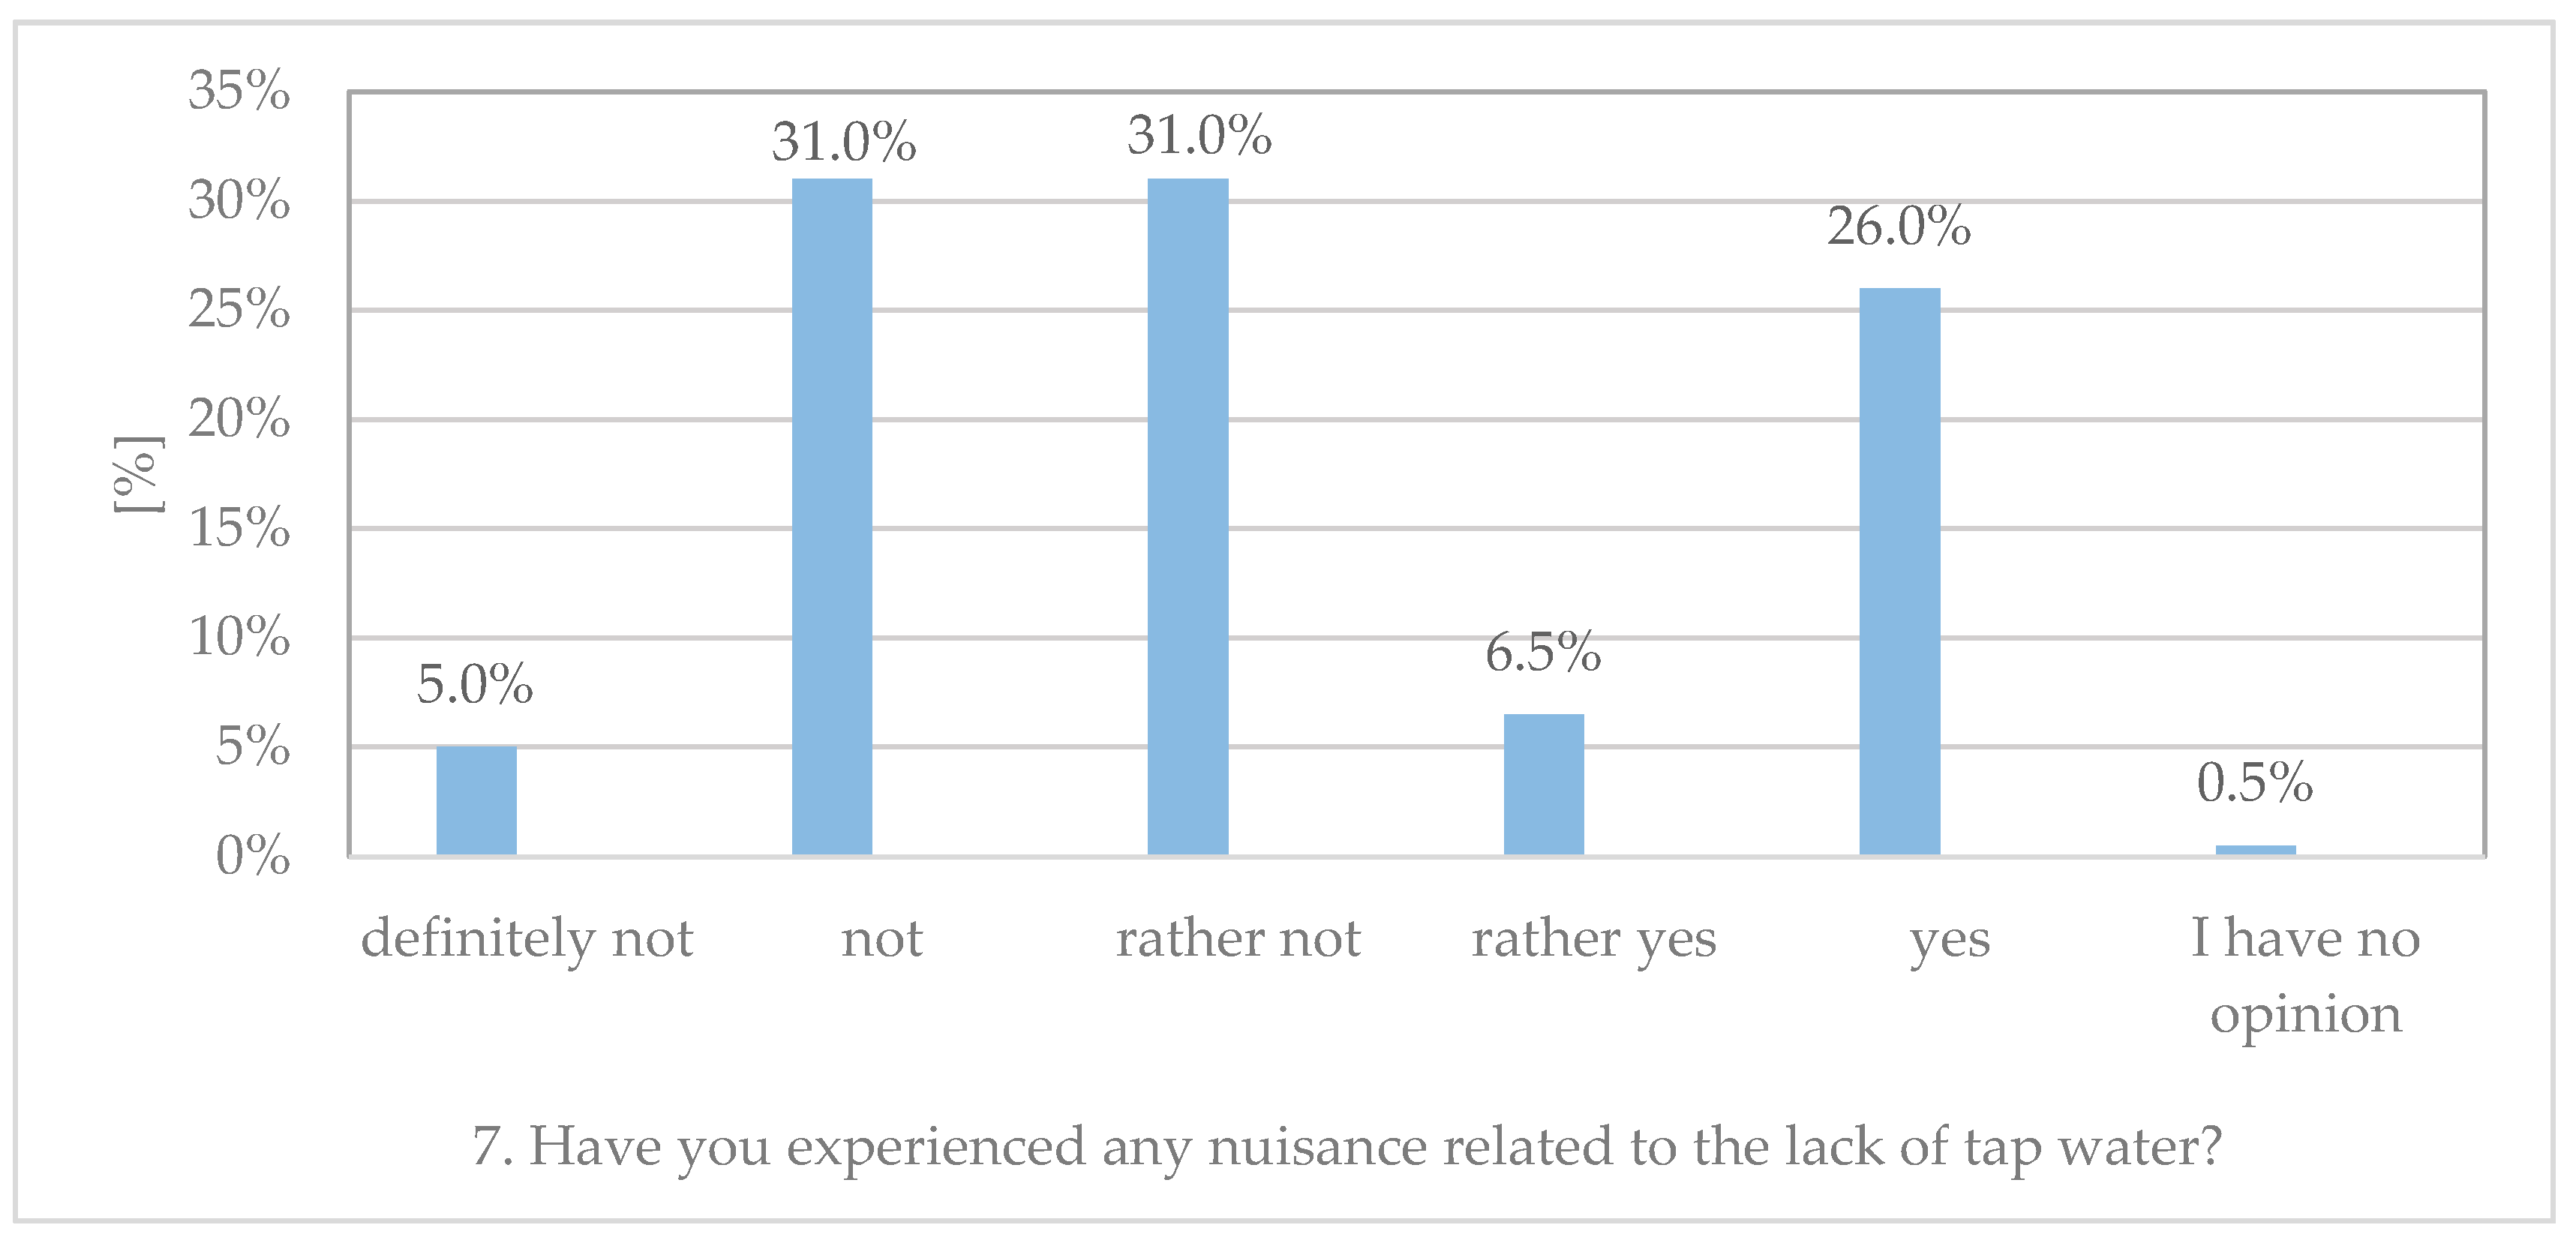
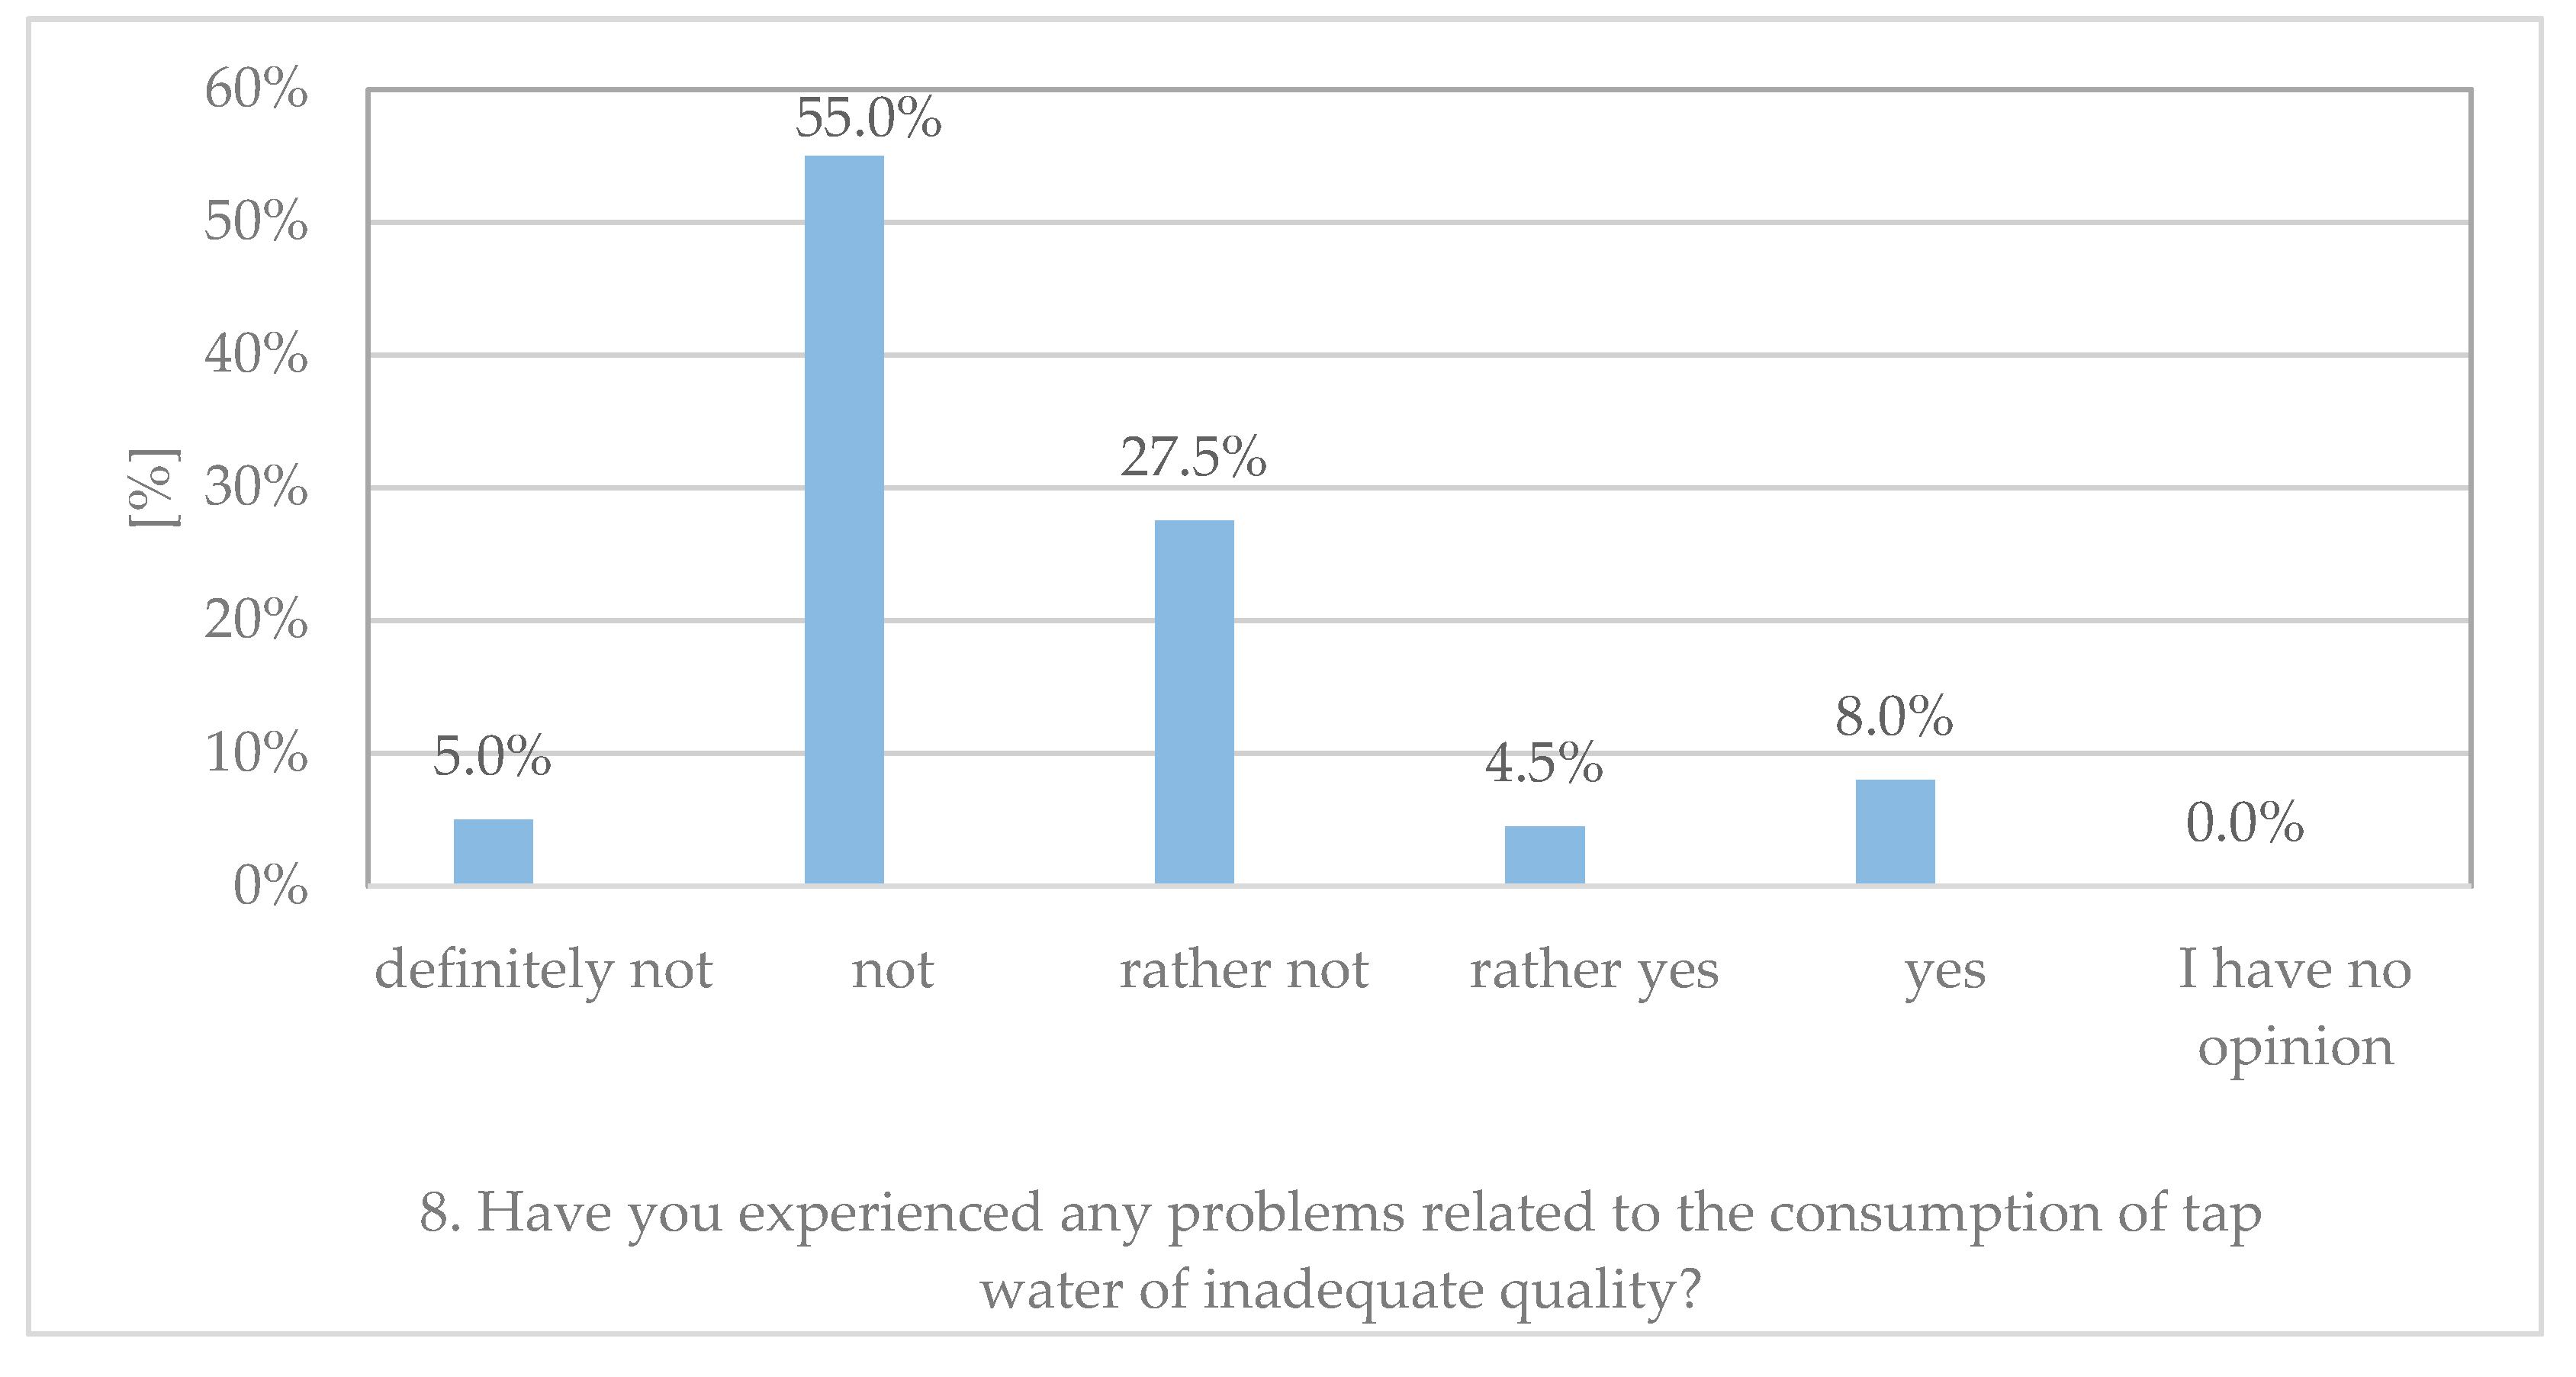
- Around 67% of respondents have not experienced a related nuisance with a lack—or poor quality—of tap water (87%);
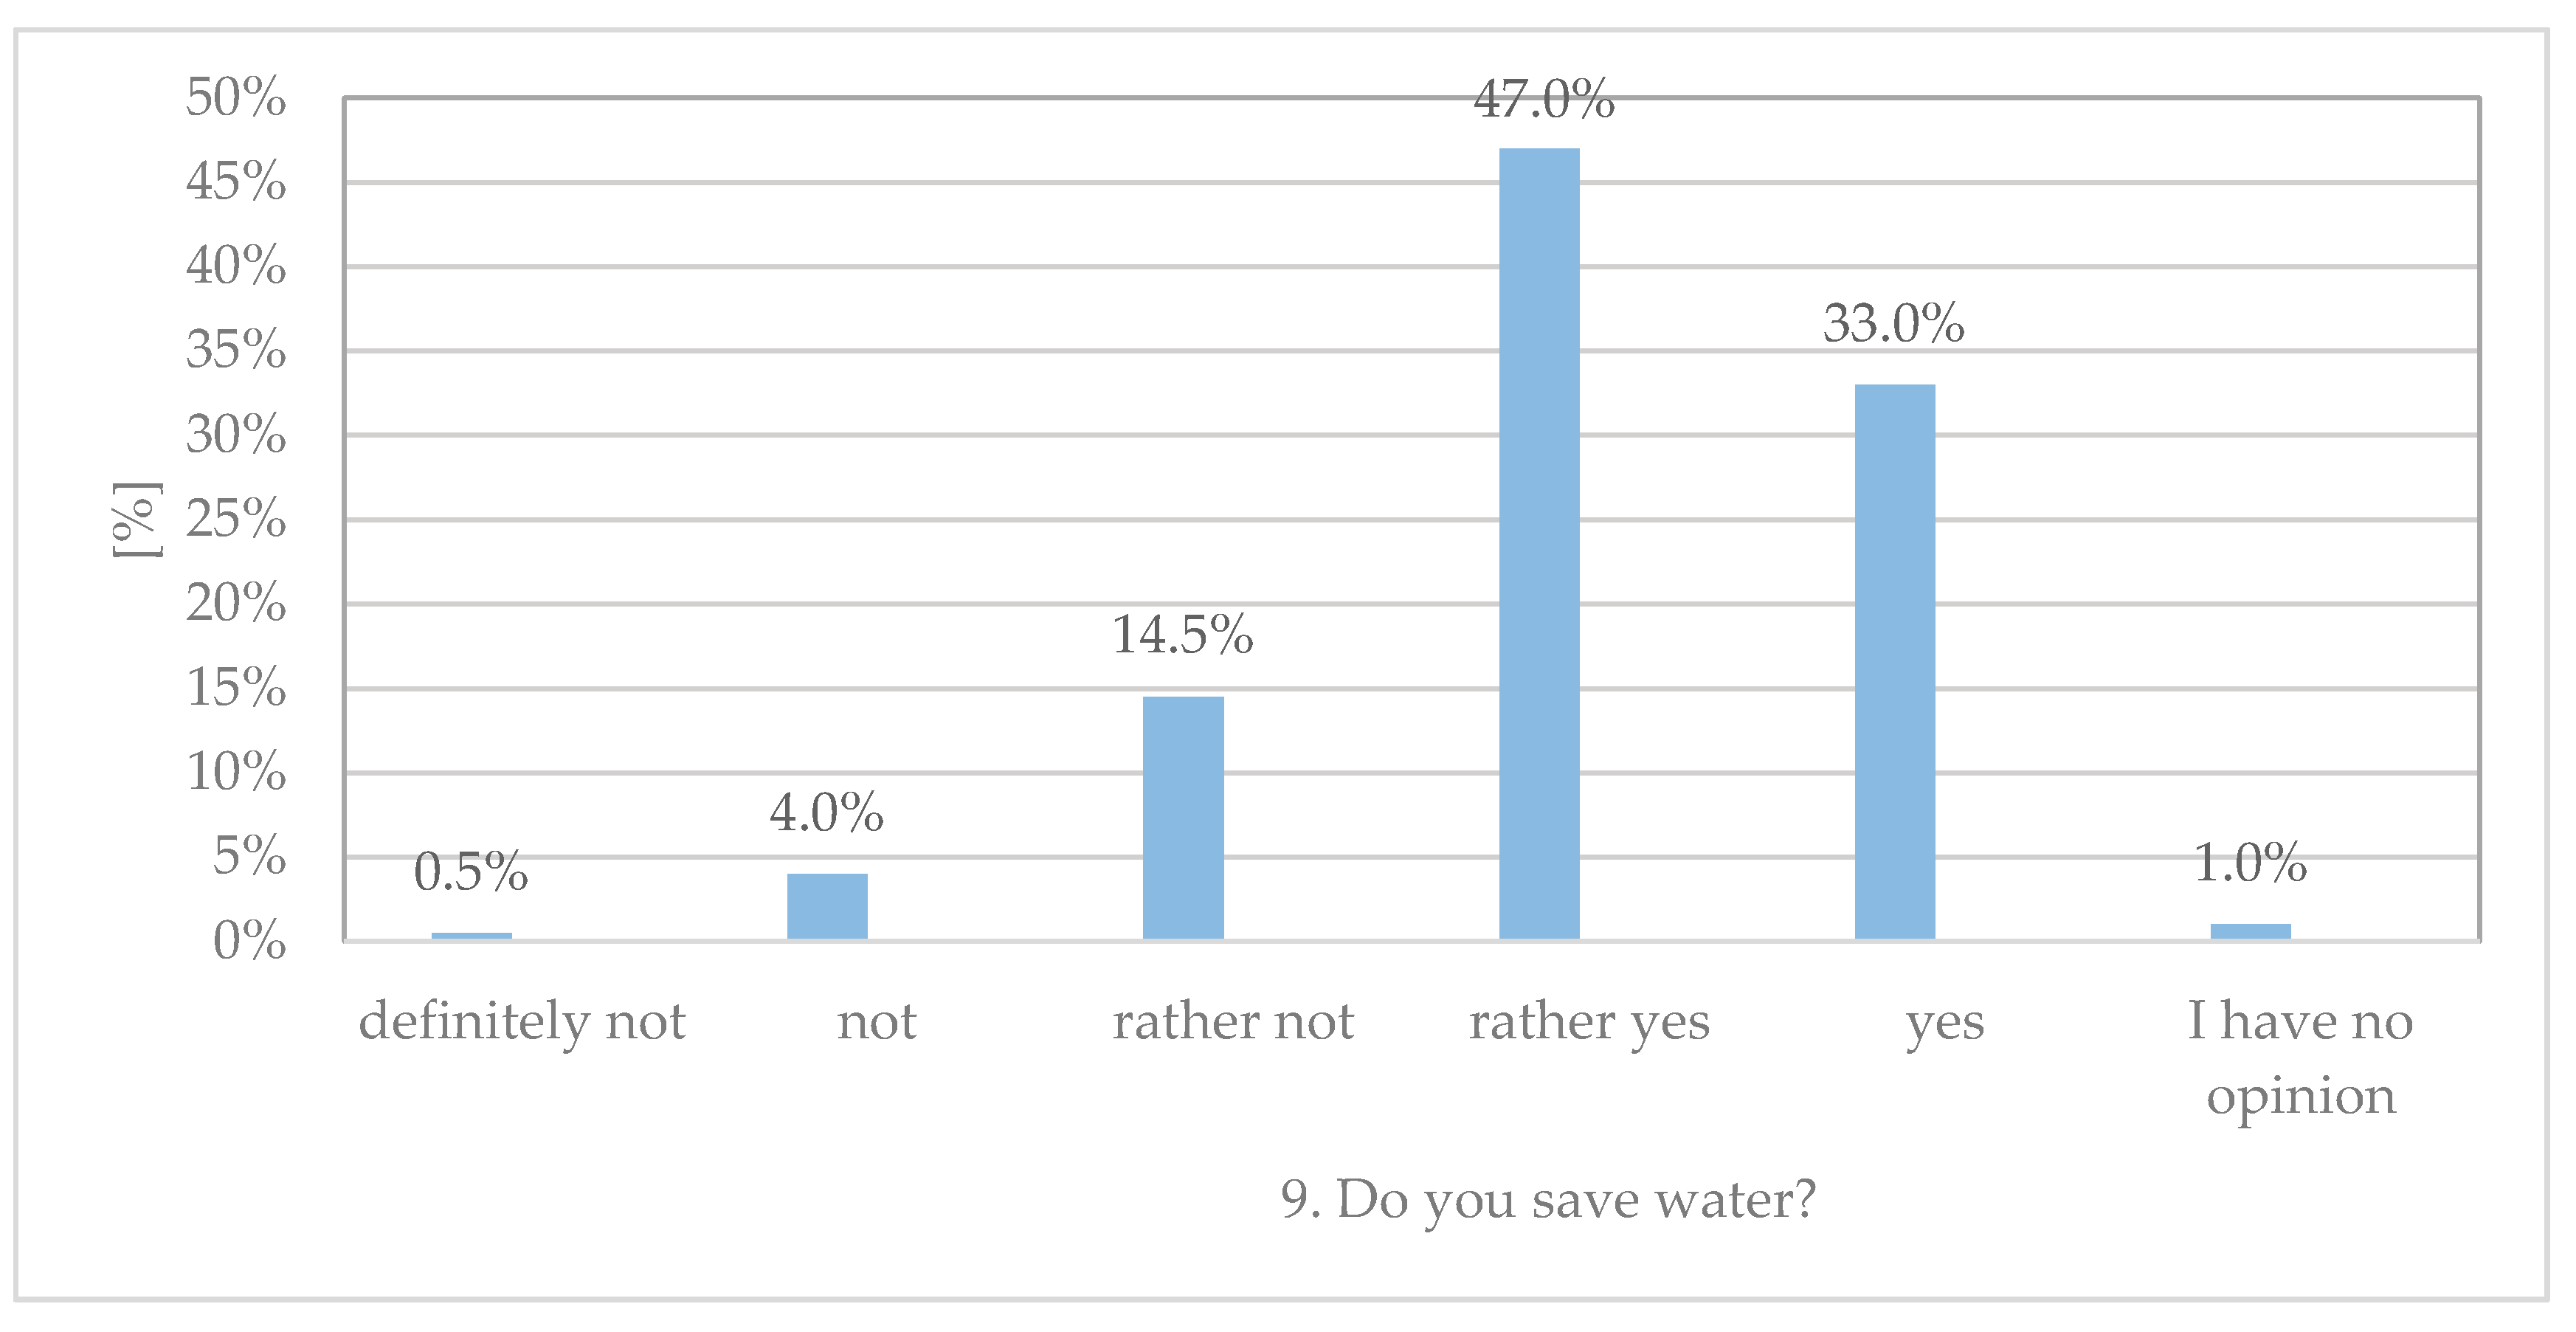
- Over 80% of respondents declare that they save water;
- Around 68% of respondents do not know where alternative water sources are located.
To generate the ARI water supply quality assessment index, individual assessments were estimated based on the results of a research:
- Answers to Question 2 (Figure 4) indicate that about 48.5% of respondents approve of the price of water in the city, and about 44% of them do not accept it, or “rather” do not accept it. On this basis, in line with the data in Table 1, it was assumed that assessment is at the average level (P2 = 2),
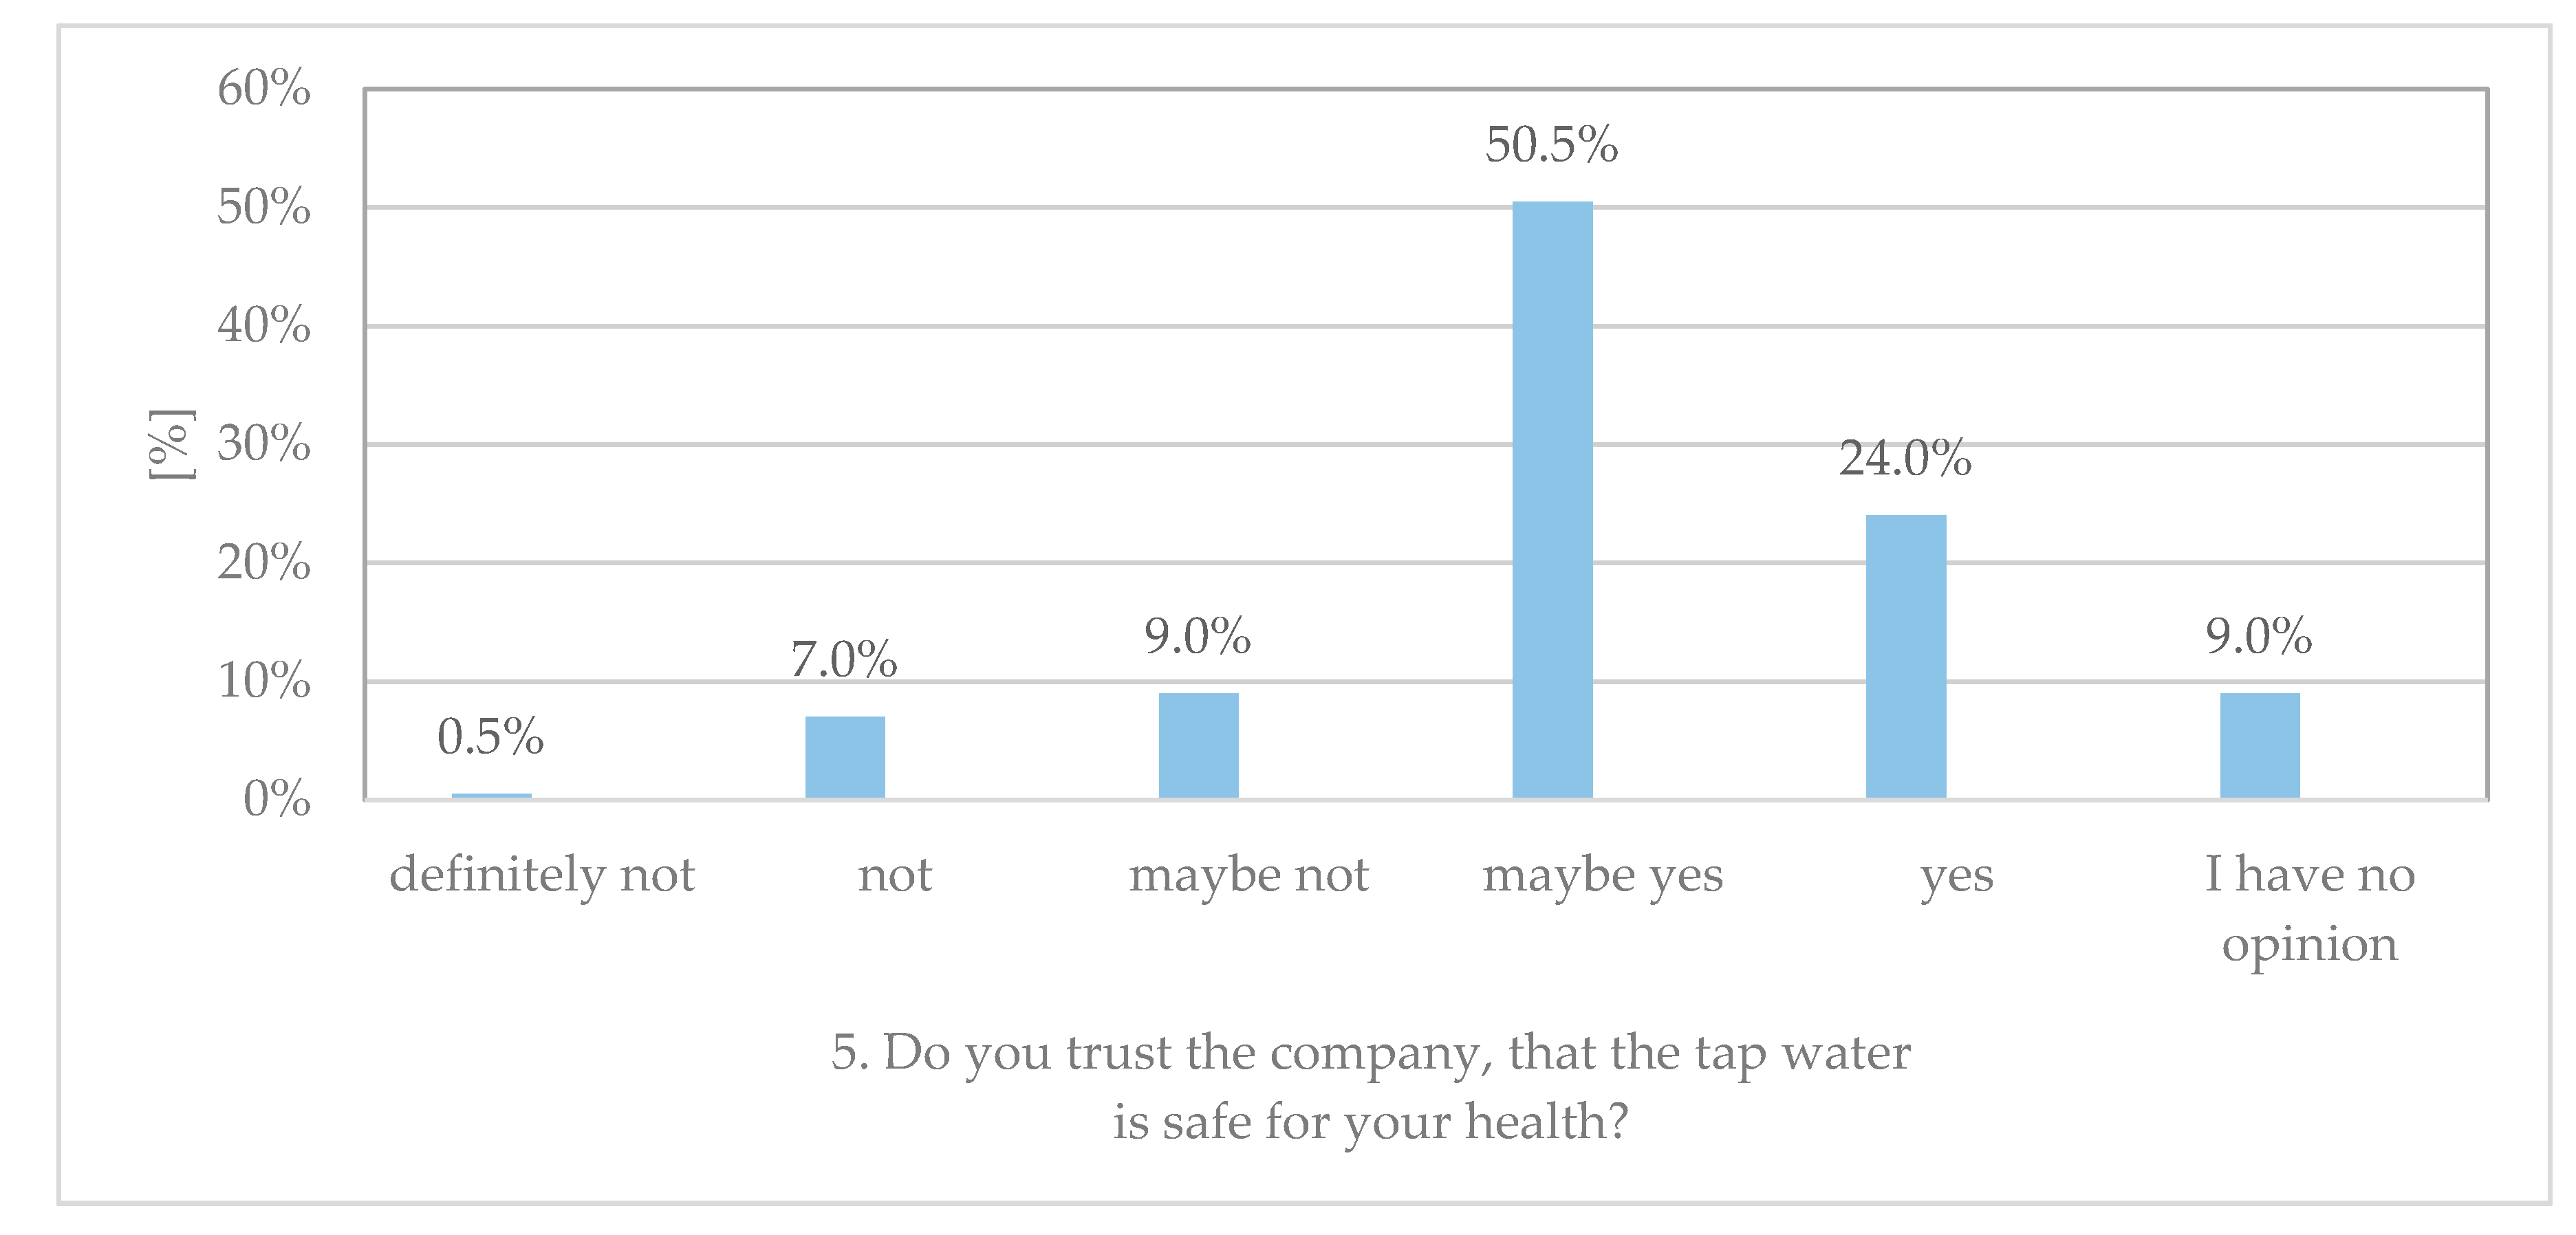
- Consumer confidence and communication of the water supply company with water consumers: To estimate this assessment, the answers to Questions 3–6 included in Table 4 were analysed (Figure 5, Figure 6, Figure 7 and Figure 8). Based on these research results, it can be concluded that about 74.5% of respondents accept and evaluate the activities of the water supply company favourably or very favourably. The results also showed that about 60% of those answering did not know about alternative water sources in the city. Based on the results of the analyses, it was assumed that this assessment assumes the average value (T3 = 2).
The ARI was calculated in line with Formula (4) and is equal to 4.
According to the presented guidelines, this indicator is in the low range, from which it follows that water consumers in the serviced area tolerate the costs incurred by the company with respect to modernisation, protection, and repairs of the water distribution system in view of reducing the risk of failure. The analysis showed that the water supply company should pay more attention to the need to inform consumers about the existing risk and behaviour at the time of its occurrence, protection options, crisis prevention, as well as arrangements for water prices and the need to reduce water losses and save water. The results of the research contained in [45] indicate that the reliability of water supply expressed in terms of its quality and quantity is an important factor in its assessment by water consumers. Additionally, the test results contained in [46,47] indicate that the continuity of the water supply is an important factor in the assessment of water by consumers, who are willing to pay more for a reduction in the frequency and duration of interruptions in water supply. The aim of the water supply system’s safe operation is to counteract against lack of water or its bad quality threatening the health of municipal water pipe users and to supervise this action using processes and information resources in the given operating conditions, in compliance with the valid law, and with economic justification [48]. However, legal regulations do not control the operation of water supply companies and conditions of receiving water with certain deficiencies [49]. Therefore, in countries where there are WSS, the proposed approach allows one to orientate on consumer opinions and to check consumer satisfaction about WSS operations. In developing waterworks, a pro-consumer attitude also requires improvement in consumer service, but the situation differs from systems, in which continuous water supply is taken for granted [50].
4. Conclusions
Society expects high standards in the sphere of social and economic life. While quality of life is a subjective and hard-to-measure concept, one standard should undoubtedly be reliable and safe access to clean water. This often denotes high costs to water supply companies as they seek to minimise the risk associated with the possibility of various adverse events in the water supply system arising.
The presented research-based method of analysing the acceptance by water consumers of the costs incurred by enterprises in risk reduction should be part of an appropriate policy that an enterprise pursues in the context of consultation with the local community. It can also constitute an important step towards ensuring the safety of water consumers and should therefore be a fundamental element in the strategy pursued by water utilities. Detailed procedures should be consulted with a wide range of experts from various fields. The costs of changes and improvements should be taken account of, but priority should always be given to providing consumers with water that is safe for their health.
An important element of accident risk management in a water supply company should be the analysis of consumer acceptance of the actions taken to reduce risk, as these influence the price of water. On this basis, water utilities can implement information management procedures.
The survey will always be subjective, as the scope of interpretation is wide. This is a proposal, and questions should be modified for each country, city, municipality, etc., in line with population size. Local governments preparing such a survey can modify and adapt it to local conditions in other ways, given that each system and community is different. Such methods can also in fact be used as other local government surveys are conducted. As various types of threats arise today, water utilities will have to introduce a range of modernisation procedures, at the same time ensuring their actions remain acceptable to the public. It is not possible to create a survey for every case. This process can be pursued based on appropriate research. The proposed method allows assessment of the level of public acceptance.
Author Contributions
All authors equally contributed to the development of this manuscript. All authors have read and agreed to the published version of the manuscript.
Funding
This research received no external funding.
Acknowledgments
We thank the reviewers for their feedback, which helped to improve the quality of the manuscript.
Conflicts of Interest
The authors declare no conflict of interest.
References and Notes
- Kaplan, S.; Garrick, B.J. On the quantitative definition of risk. Risk Anal. 1981, 1, 11–27. [Google Scholar] [CrossRef]
- Merkel, W.; Castell-Exner, C. Managing risk under normal operation and in crisis situations. Water Util. Manag. Int. 2010, 9, 19–22. [Google Scholar]
- Pollard, S.J.T.; Strutt, J.E.; Macgillivray, B.H.; Hamilton, P.H.; Hrudey, S.E. Risk analysis and management in the water utility sector-a review of drivers, tools and techniques. Process Saf. Environ. Prot. 2008, 82, 1–10. [Google Scholar]
- Drinking Water Directive (Council Directive 98/83/EC of 3 November 1998 on the Quality of Water Intended for Human Consumption), with Its Latest Amendments Including Commission Directive (EU) 2015/1787 of 6 October 2015. Available online: https://ec.europa.eu/environment/water/water-drink/legislation_en.html (accessed on 6 November 2020).
- Council Directive 2008/114/EC of 8 December 2008 on the Identification and Designation of European Critical Infrastructures and the Assessment of the Need to Improve Their Protection, OJ L 345, 23.12.2008. Available online: https://eur-lex.europa.eu/LexUriServ/LexUriServ.do?uri=OJ:L:2008:345:0075:0082:EN:PDF (accessed on 6 November 2020).
- Molinos-Senante, M.; Maziotis, A.; Sala-Garrido, R. Estimating the cost of improving service quality in water supply: A shadow price approach for England and Wales. Sci. Total Environ. 2016, 539, 470–477. [Google Scholar] [CrossRef] [PubMed]
- Chen, B.P.-T.; Chen, C.-S. Feasibility Assessment of a Water Supply Reliability Index for Water Resources Project Planning and Evaluation. Water 2019, 11, 1977. [Google Scholar] [CrossRef] [Green Version]
- Rogers, J.W.; Garrick, E.; Louis, G.E. Risk and opportunity in upgrading the US drinking water infrastructure system. J. Environ. Manag. 2008, 87, 26–36. [Google Scholar] [CrossRef]
- World Health Organization. Guidelines for Drinking-Water Quality, 4th ed.; World Health Organization: Geneva, Switzerland, 2011. [Google Scholar]
- Tchórzewska-Cieślak, B.; Pietrucha-Urbanik, K. Failure risk analysis in the collective water supply systems in crisis situations. J. Pol. Saf. Reliab. Assoc. 2013, 1, 129–136. [Google Scholar]
- Mays, L.W. The Role of Risk Analysis in Water Resources Engineering; Arizona State University: Tempe, AZ, USA, 2005. [Google Scholar]
- Tanyimboh, T.T.; Burd, R.; Burrows, R.; Tabesh, M. Modelling and reliability analysis of water distribution systems. Water Sci. Technol. 1999, 39, 249–255. [Google Scholar] [CrossRef]
- Hrudey, S.E. Drinking water quality–a risk management approach. Water 2001, 26, 29–32. [Google Scholar]
- Schramm, V.B.; Schramm, F. An Approach for Supporting Problem Structuring in Water Resources Management and Planning. Water Resour. Manag. 2018, 9, 2955–2968. [Google Scholar] [CrossRef]
- Su, H.-T.; Tung, Y.-K. Comparisons of Risk-based Decision Rules for the Application of Water Resources Planning and Management. Water Resour. Manag. 2014, 12, 3921–3935. [Google Scholar] [CrossRef]
- Lee, S.; Oak, S.; Jung, D.; Jun, H. Development of Failure Cause–Impact–Duration (CID) Plots for Water Supply and Distribution System Management. Water 2019, 11, 1719. [Google Scholar] [CrossRef] [Green Version]
- Tchórzewska-Cieślak, B. Estimation of acceptance of the costs of risk associated with the operation of the water supply system. Ochr. Srodow. 2007, 7, 69–72. [Google Scholar]
- Shinstine, D.S.; Ahmed, I.; Lansey, K. Reliability/availability analysis of municipal water distribution networks: Case Studies. J. Water Resour. Plan. Manag. 2002, 128, 140–151. [Google Scholar] [CrossRef]
- Kordana, S.; Słyś, D. Decision Criteria for the Development of Stormwater Management Systems in Poland. Resources 2020, 9, 20. [Google Scholar] [CrossRef] [Green Version]
- Quimpo, R.; Wu, S. Condition assessment of water supply infrastructure. J. Inf. Syst. 1997, 3, 15–20. [Google Scholar] [CrossRef]
- Grbčić, L.; Lučin, I.; Kranjčević, L.; Družeta, S. A Machine Learning-based Algorithm for Water Network Contamination Source Localization. Sensors 2020, 20, 2613. [Google Scholar] [CrossRef] [PubMed]
- Martin-Candilejo, A.; Santillán, D.; Iglesias, A.; Garrote, L. Optimization of the Design of Water Distribution Systems for Variable Pumping Flow Rates. Water 2020, 12, 359. [Google Scholar] [CrossRef] [Green Version]
- Cao, Y.; Zhang, W.; Ren, J. Efficiency Analysis of the Input for Water-Saving Agriculture in China. Water 2020, 12, 207. [Google Scholar] [CrossRef] [Green Version]
- Rak, J. Selected problems of water supply safety. Environ. Prot. Eng. 2009, 2, 23–28. [Google Scholar]
- Rak, J.; Tchórzewska-Cieślak, B. Review of matrix methods for risk assessment in water supply system. J. Konbin 2006, 1, 67–76. [Google Scholar]
- Dettori, M.; Pittaluga, P.; Busonera, G.; Gugliotta, C.; Azara, A.; Piana, A.; Arghittu, A.; Castiglia, P. Environmental Risks Perception Among Citizens Living Near Industrial Plants: A Cross-Sectional Study. Int. J. Environ. Res. Public Health 2020, 17, 4870. [Google Scholar] [CrossRef] [PubMed]
- Di Bona, G.; Forcina, A.; Falcone, D.; Silvestri, L. Critical Risks Method (CRM): A New Safety Allocation Approach for a Critical Infrastructure. Sustainability 2020, 12, 4949. [Google Scholar] [CrossRef]
- Tiganoaia, B.; Niculescu, A.; Negoita, O.; Popescu, M. A New Sustainable Model for Risk Management—RiMM. Sustainability 2019, 11, 1178. [Google Scholar] [CrossRef] [Green Version]
- Maziotis, A.; Villegas, A.; Molinos-Senante, M. The cost of reducing unplanned water supply interruptions: A parametric shadow price approach. Sci. Total Environ. 2020, 719, 137487. [Google Scholar] [CrossRef]
- Molinos-Senante, M.; Sala-Garrido, R. How much should customers be compensated for interruptions in the drinking water supply? Sci. Total Environ. 2017, 586, 642–649. [Google Scholar] [CrossRef]
- EN 15975-1. Security of drinking water supply. Guidelines for risk and crisis management. Part 1 Crisis management.
- EN 15975-2. Security of drinking water supply. Guidelines for risk and crisis management. Part 2. Risk management.
- Haimes, Y.Y.; Li, Y. Risk Modeling, Assessment and Management; Wiley: New York, NY, USA, 1998. [Google Scholar]
- Hastak, H.; Baim, E. Risk factors affecting management and maintenance cost of urban infrastructure. J. Inf. Syst. 2001, 7, 67–75. [Google Scholar] [CrossRef]
- Tchórzewska-Cieślak, B. Methods for Analyzing and Assessing the Risk of Failure of the Water Distribution Subsystem; Rzeszów University of Technology Publishing House: Rzeszow, Poland, 2011. [Google Scholar]
- Grey-Gardner, G. Implementing risk management for a water supplies, a catalyst and incentive for change. Rangel. J. 2008, 30, 149–156. [Google Scholar] [CrossRef] [Green Version]
- Geng, Z.Q.; Chen, N.; Han, Y.M.; Ma, B. An improved intelligent early warning method based on MWSPCA and its application in complex chemical processes. Can. J. Chem. Eng. 2020, 98, 1307–1318. [Google Scholar] [CrossRef]
- Duan, W.; He, B.; Nover, D.; Yang, G.; Chen, W.; Meng, H.; Zou, S.; Liu, C. Water Quality Assessment and Pollution Source Identification of the Eastern Poyang Lake Basin Using Multivariate Statistical Methods. Sustainability 2016, 8, 133. [Google Scholar] [CrossRef] [Green Version]
- Geng, Z.; Hu, X.; Han, Y.; Yanhua, Z. A Novel Leakage-Detection Method Based on Sensitivity Matrix of Pipe Flow: Case Study of Water Distribution Systems. J. Water Resour. Plan. Manag. ASCE 2019, 145, 04018094. [Google Scholar] [CrossRef]
- Geng, Z.Q.; Wang, Z.; Hu, H.X.; Han, Y.M.; Lin, X.Y.; Zhong, Y.H. A fault detection method based on horizontal visibility graph-integrated complex networks: Application to complex chemical processes. Can. J. Chem. Eng. 2019, 97, 1129–1138. [Google Scholar] [CrossRef]
- Bondoc, I. European Regulation in the Veterinary Sanitary and Food Safety Area, a Component of the European Policies on the Safety of Food Products and the Protection of Consumer Interests: A 2007 Retrospective. Part One: The Role of European Institutions in Laying Down and Passing Laws Specific to the Veterinary Sanitary and Food Safety Area. Universul Juridic Supliment 2016, 5, 12–15. [Google Scholar]
- Bondoc, I. European Regulation in the Veterinary Sanitary and Food Safety Area, a Component of the European Policies on the Safety of Food Products and the Protection of Consumer Interests: A 2007 Retrospective. Part Two: Regulations. Universul Juridic Supliment 2016, 5, 16–19. [Google Scholar]
- Ezell, B.; Farr, J.; Wiese, I. Infrastructure risk analysis of municipal water distribution system. J. Inf. Syst. 2000, 6, 118–122. [Google Scholar] [CrossRef]
- StatSoft, Inc. STATISTICA (Data Analysis Software System), Version 12. Available online: www.statsoft.com (accessed on 15 August 2020).
- Shuang, Q.; Liu, H.J.; Porse, E. Review of the Quantitative Resilience Methods in Water Distribution Networks. Water 2019, 11, 1189. [Google Scholar] [CrossRef] [Green Version]
- Pietrucha-Urbanik, K.; Rak, J.R. Consumers’ Perceptions of the Supply of Tap Water in Crisis Situations. Energies 2020, 13, 3617. [Google Scholar] [CrossRef]
- Fang, L.; Wu, F. Can Water Rights Trading Scheme Promote Regional Water Conservation in China? Evidence from a Time-Varying DID Analysis. Int. J. Environ. Res. Public Health 2020, 17, 6679. [Google Scholar] [CrossRef] [PubMed]
- Quach, S.; Thaichon, P.; Hewege, C. Triadic relationship between customers, service providers and government in a highly regulated industry. J. Retail. Consum. Serv. 2020, 55, 102148. [Google Scholar] [CrossRef]
- Franceys, R.W.A.; Gerlach, E. Consumer involvement in water services regulation. Util. Policy 2011, 19, 61–70. [Google Scholar] [CrossRef]
- Shin, S.; Lee, S.; Judi, D.R.; Parvania, M.; Goharian, E.; McPherson, T.; Burian, S.J. A Systematic Review of Quantitative Resilience Measures for Water Infrastructure Systems. Water 2018, 10, 164. [Google Scholar] [CrossRef] [Green Version]
Figure 1.
Risk management procedures in a water supply company.
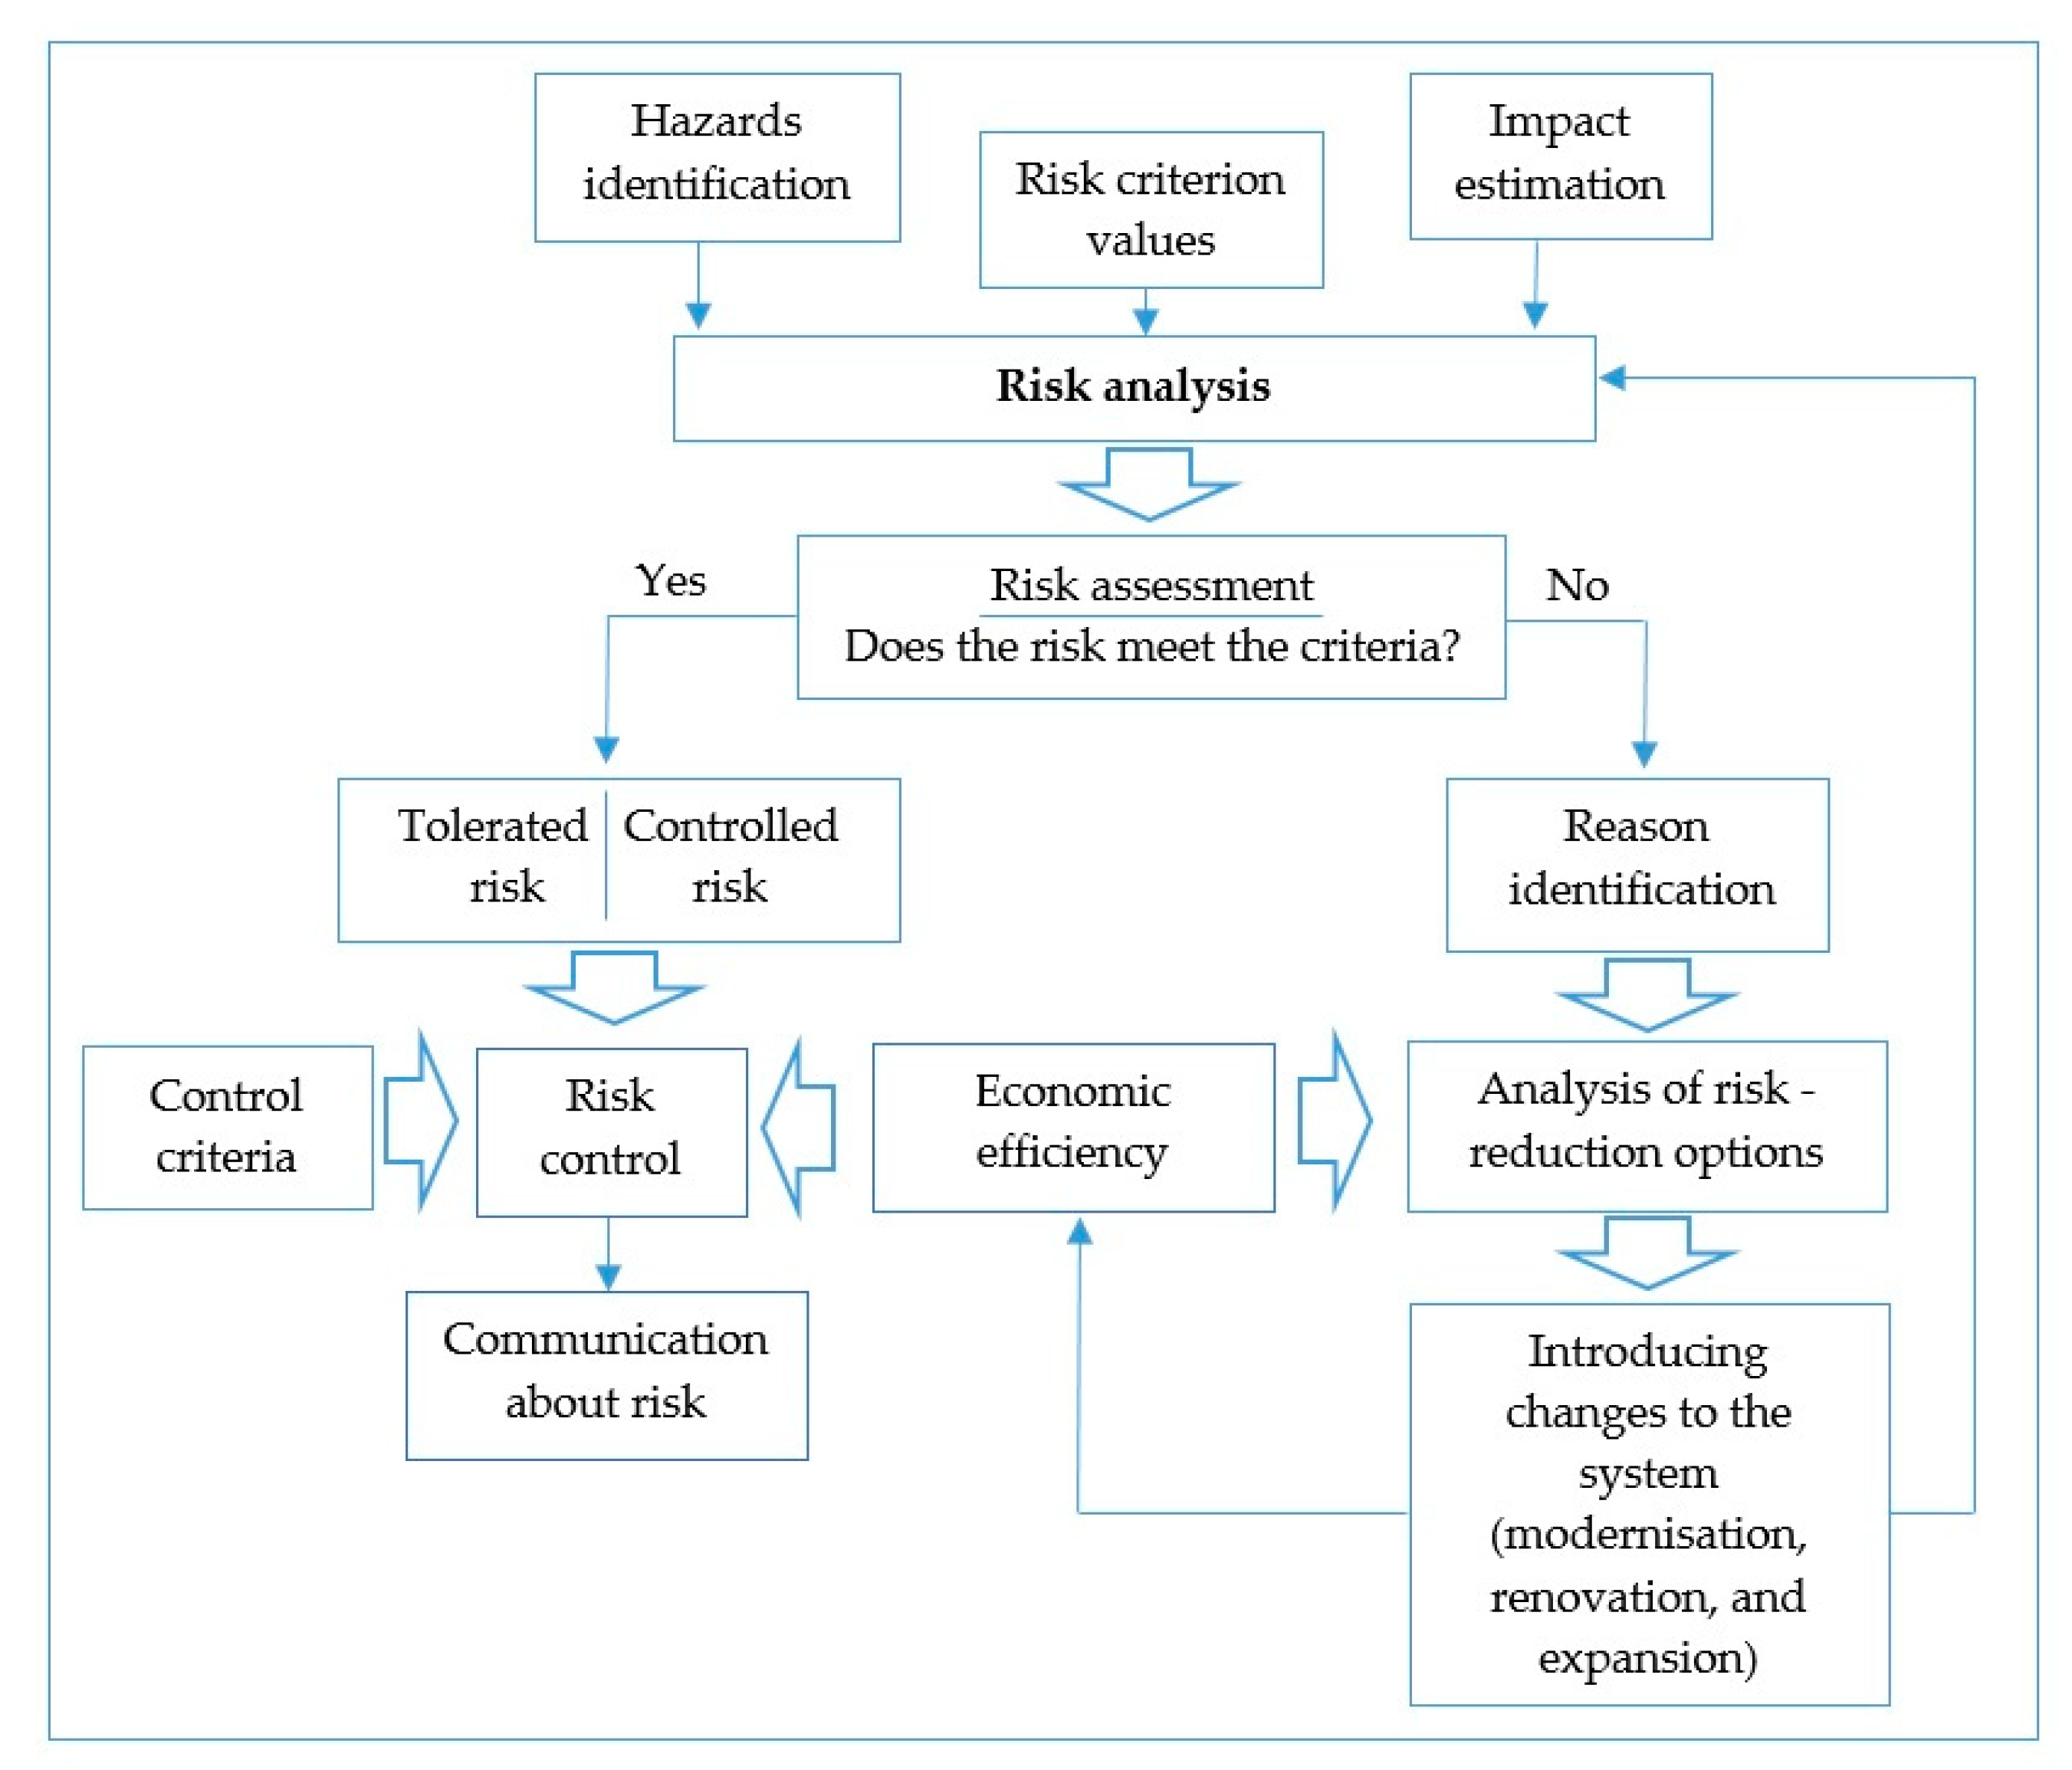
Figure 2.
Proposed criteria for the accepted risk to water consumers.

Figure 3.
Results for answers to Question 1.

Figure 4.
Results for answers to Question 2.
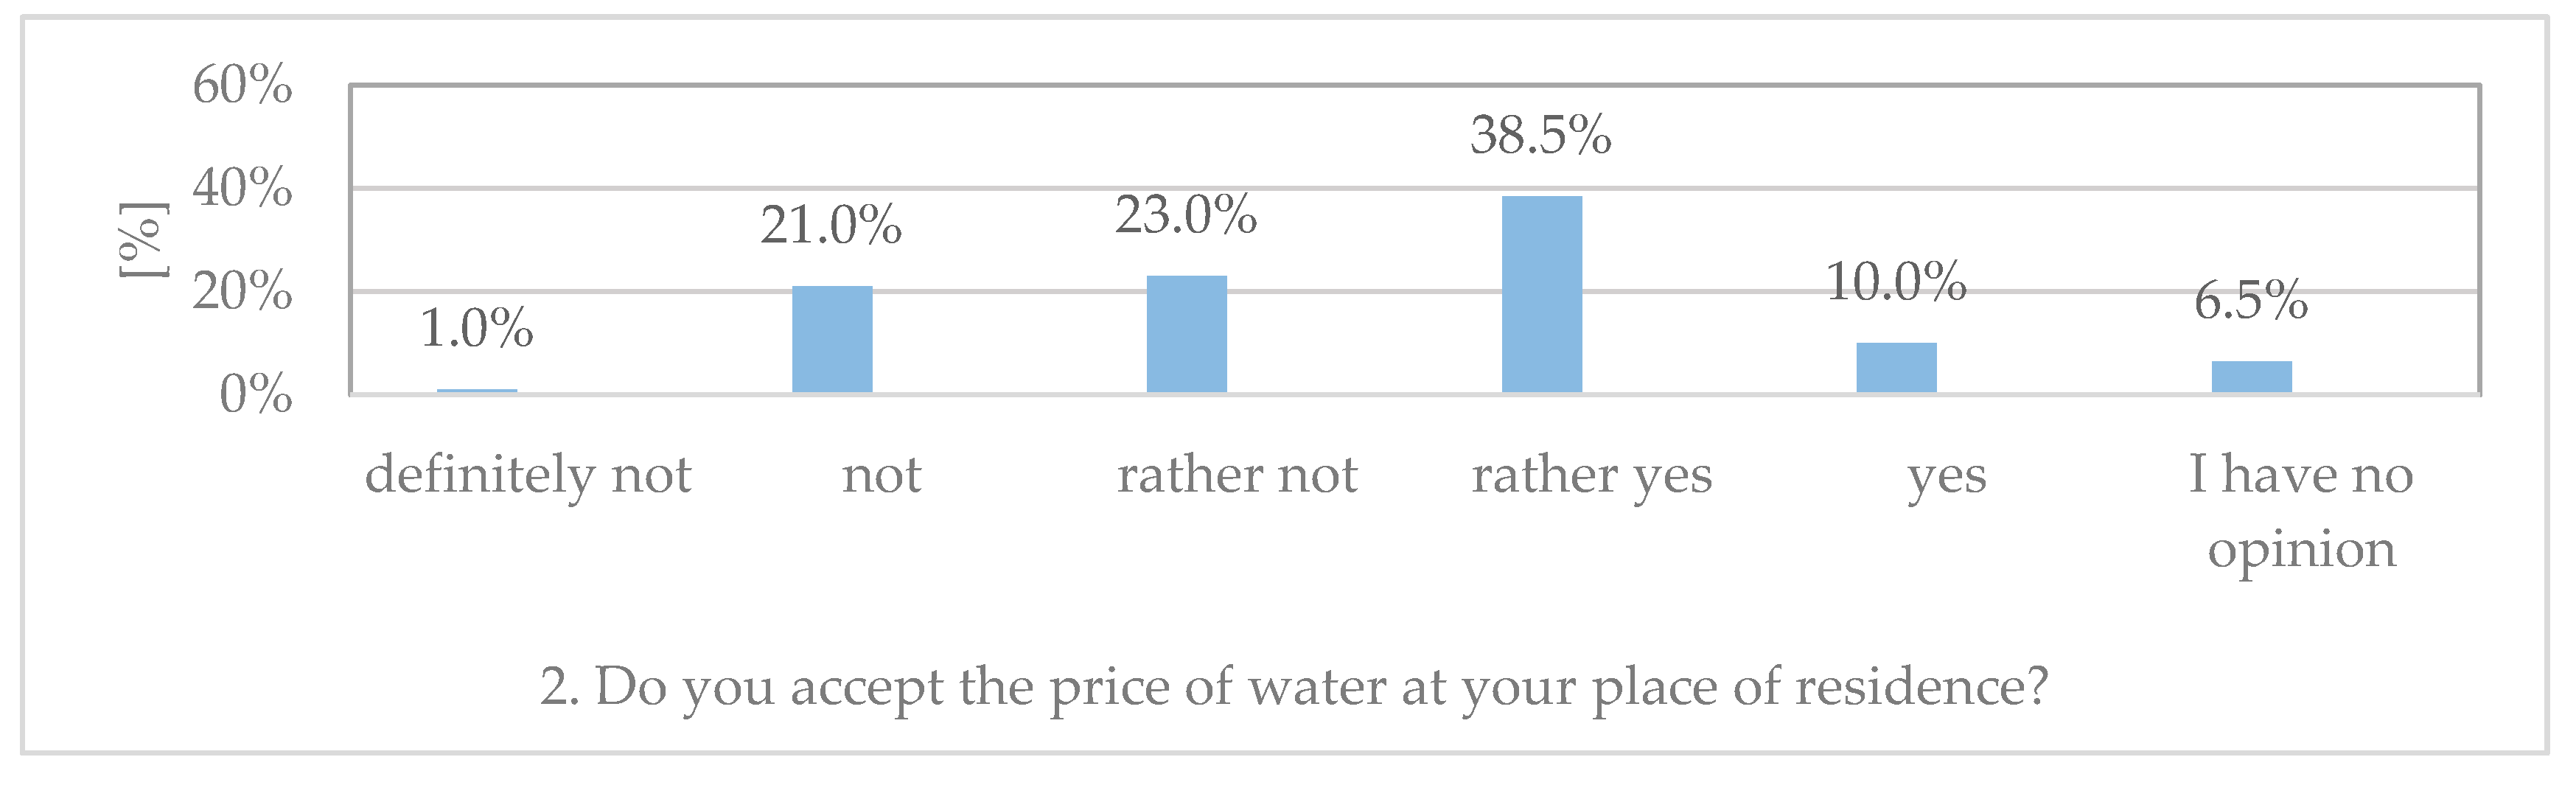
Figure 5.
Results for answers to Question 3.

Figure 6.
Results for answers to Question 4.
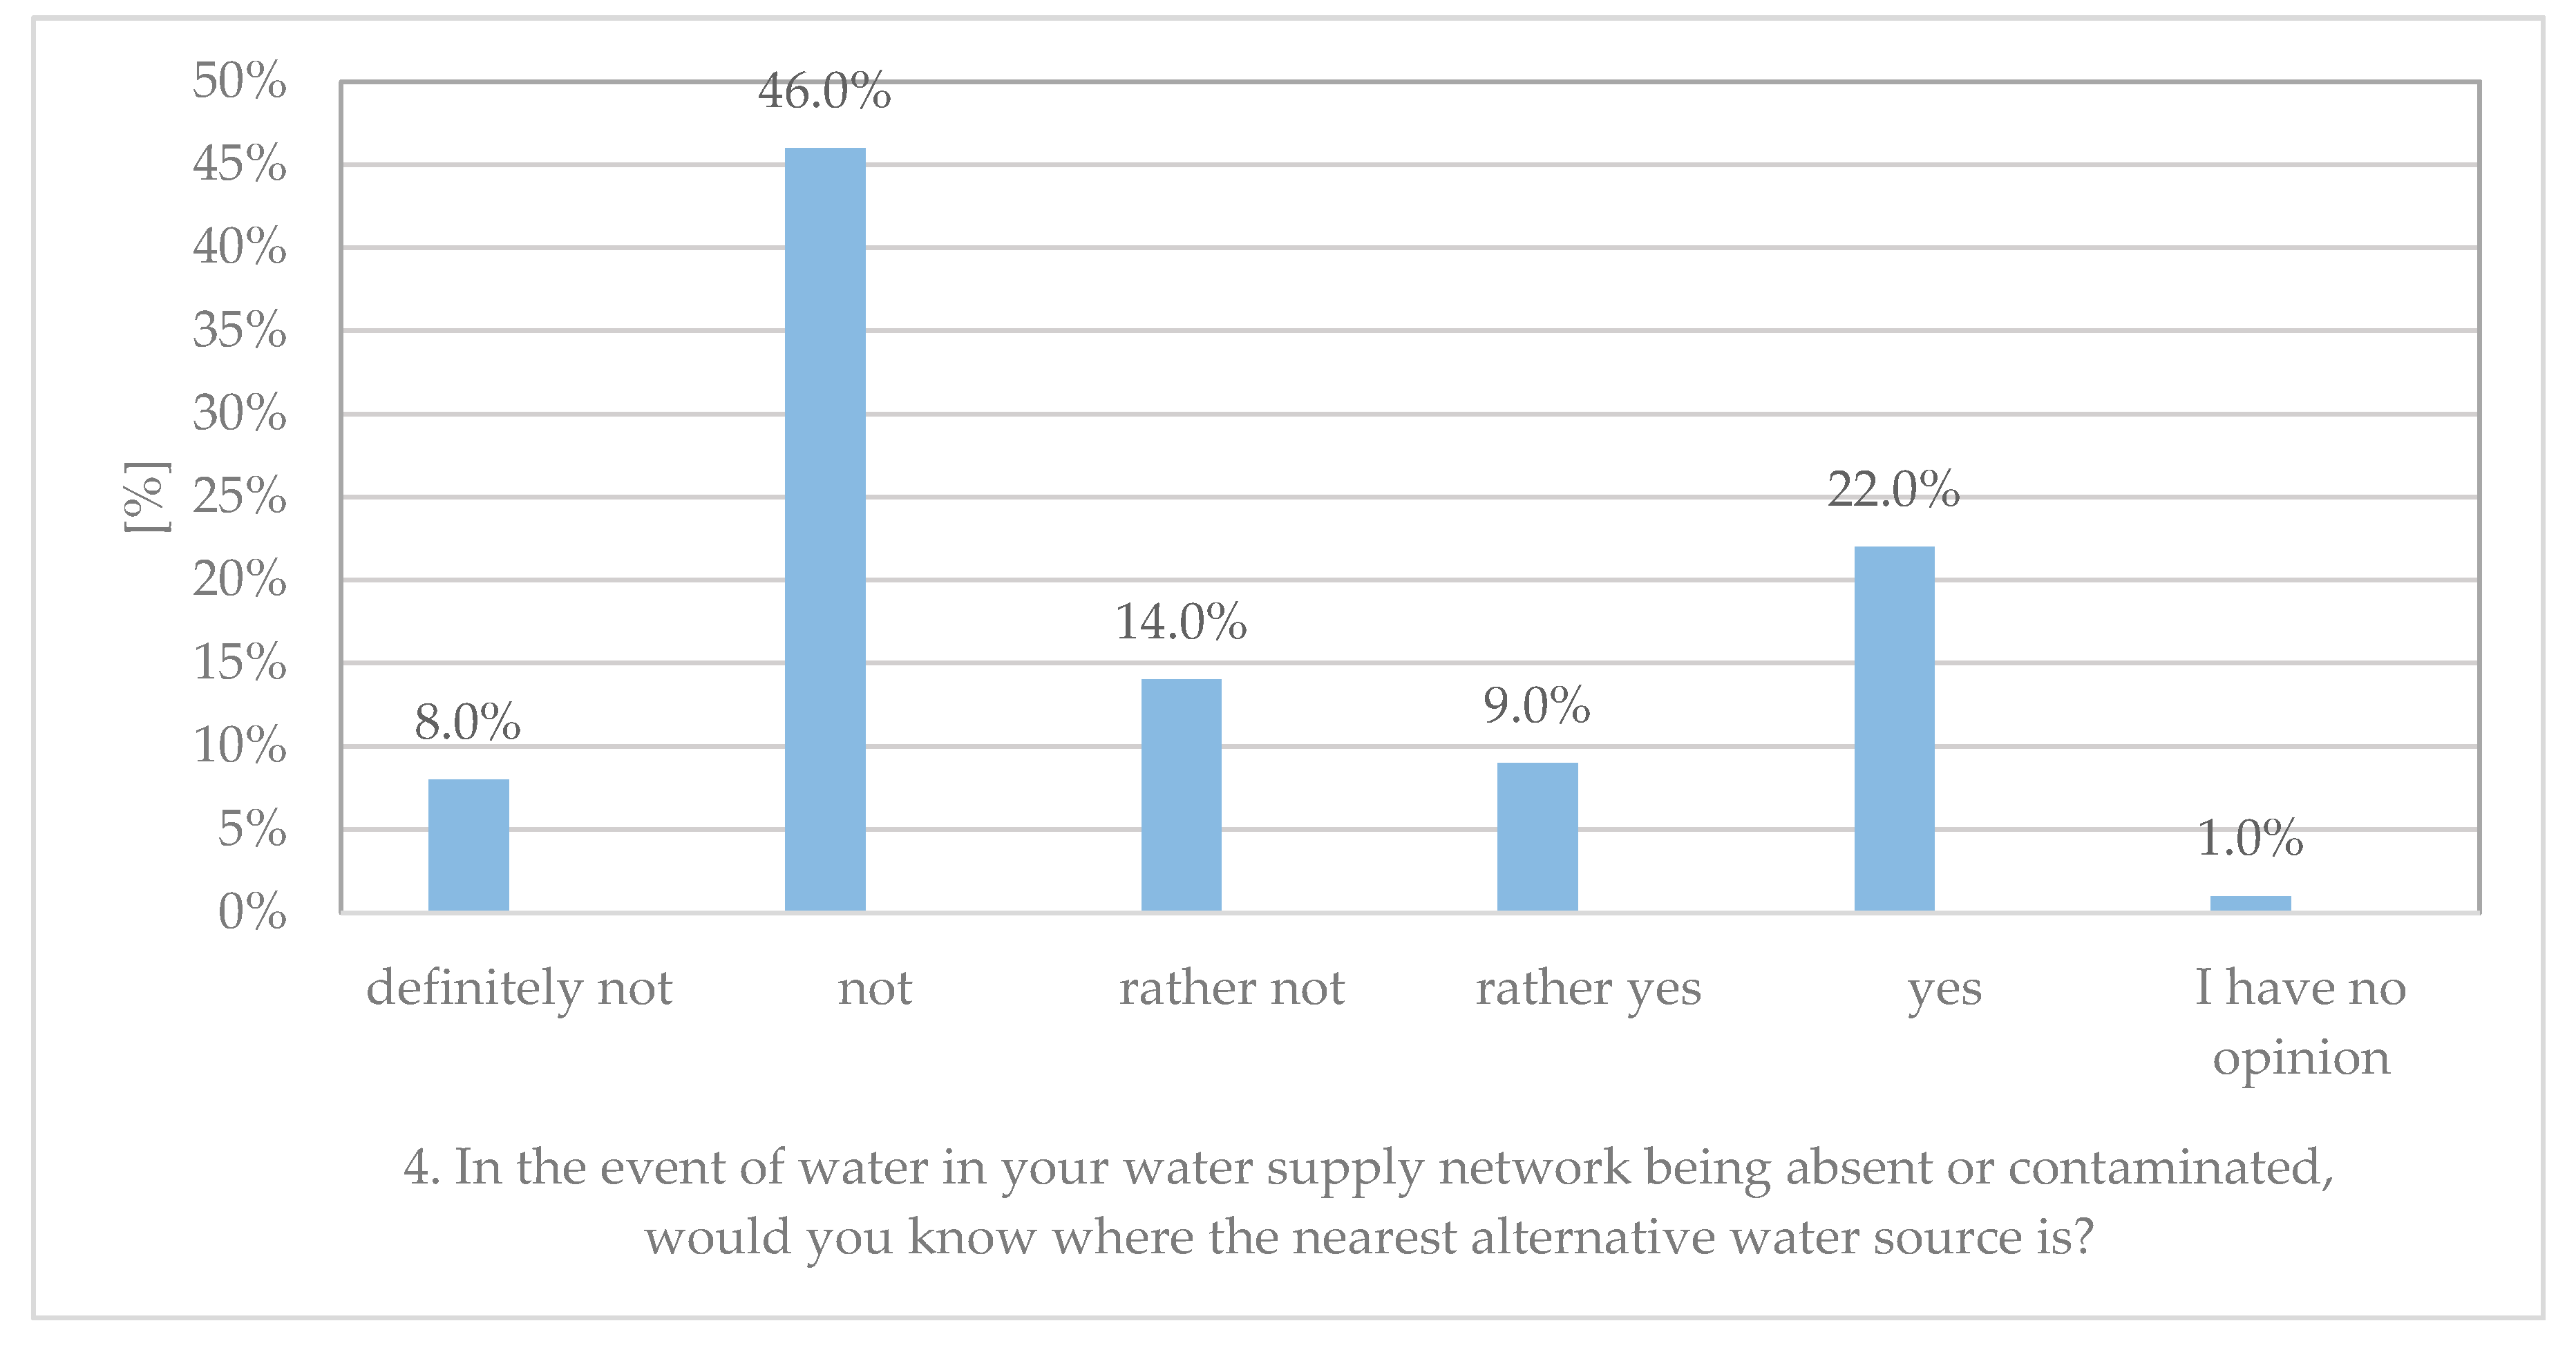
Figure 7.
Results for answers to Question 5.

Figure 8.
Results for answers to Question 6.
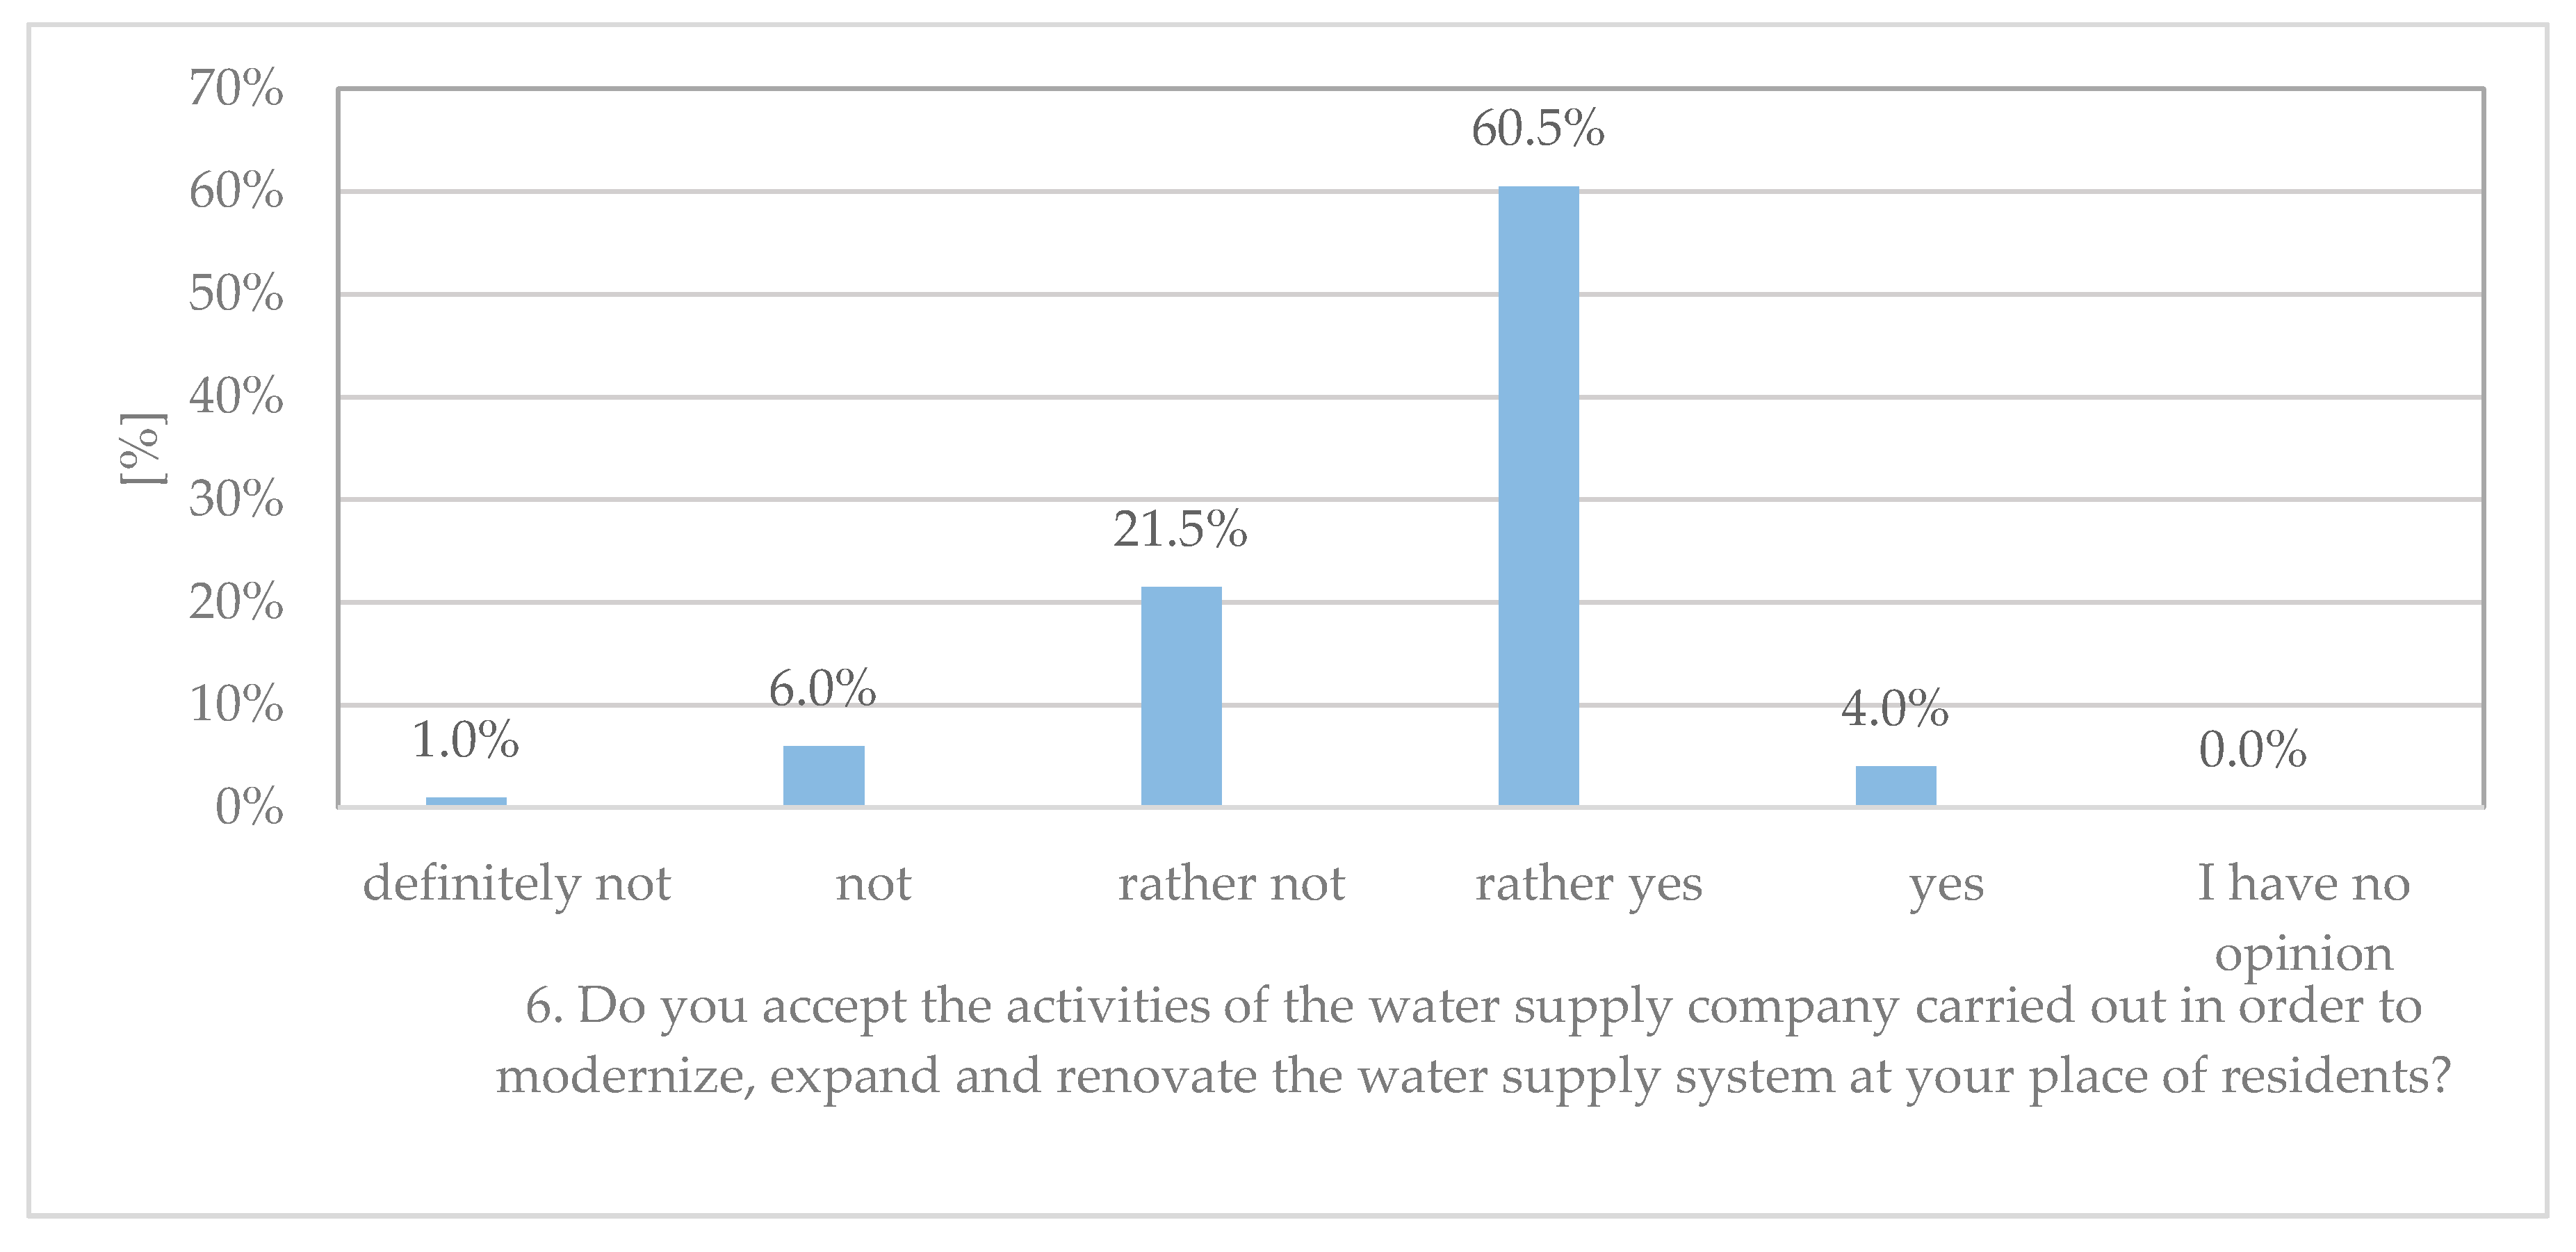
Figure 9.
Results for answers to Question 7.

Figure 10.
Results for answers to Question 8.

Figure 11.
Results for answers to Question 9.

Figure 12.
Results for answers to Question 10.


Table 1.
Point weights for individual Acceptable Risk Index (ARI) parameters.
| Parameter | Description of the Parameter | Point Weight |
|---|---|---|
| Degree of drinking water quality assessment Qi | big | 3 |
| average | 2 | |
| small | 1 | |
| Degree of water prices acceptance by consumers Pj | good | 3 |
| average | 2 | |
| bad | 1 | |
| Degree of water consumers’ trust Tk | high | 3 |
| average | 2 | |
| low | 1 |
Table 2.
Scheme of possible answers from consumers of water as regards the assessed quality of supply services regarding the parameters of ARI—degree of drinking-water quality assessment.
Table 2.
Scheme of possible answers from consumers of water as regards the assessed quality of supply services regarding the parameters of ARI—degree of drinking-water quality assessment.
| Degree of Drinking-Water Quality Assessment—Qi | |
|---|---|
| No. → Question | 1. How do you assess the quality of tap water at your place of residence? |
| Assessment | ○ very bad ○ bad ○ sufficient ○ good ○ very good ○ I have no opinion |
Table 3.
Scheme of possible answers from consumers of water as regards the assessed quality of supply services regarding the parameters of ARI—degree of the acceptance of water prices by consumers.
Table 3.
Scheme of possible answers from consumers of water as regards the assessed quality of supply services regarding the parameters of ARI—degree of the acceptance of water prices by consumers.
| Degree of the Acceptance of Water Prices by Consumers—Pj | |
|---|---|
| No. → Question | 2. Do you accept the price of water at your place of residence? |
| Assessment | ○ definitely not ○ not ○ rather not ○ rather yes ○ yes ○ I have no opinion |
Table 4.
Scheme of possible answers from consumers of water as regards the assessed quality of supply services regarding the parameters of ARI—degree of trust of water consumers.
Table 4.
Scheme of possible answers from consumers of water as regards the assessed quality of supply services regarding the parameters of ARI—degree of trust of water consumers.
| Degree of Trust of Water Consumers—Tk | |
|---|---|
| No. → Question | 3. How do you assess the work of the company supplying water at your place of residence? |
| Assessment | ○ very bad ○ bad ○ sufficient ○ good ○ very good ○ I have no opinion |
| No. → Question | 4. In the event of water in your water supply network being absent or contaminated, would you know where the nearest alternative water source is? |
| Assessment | ○ definitely not ○ not ○ rather not ○ rather yes ○ yes ○ I have no opinion |
| No. → Question | 5. Do you trust the company, that the tap water is safe for your health? |
| Assessment | ○ definitely not ○ not ○ maybe not ○ maybe yes ○ yes ○ I have no opinion |
| No. → Question | 6. Do you accept the activities of the water supply company carried out in order to modernise, expand and renovate the water supply system at your place of residence? |
| Assessment | ○ definitely not ○ not ○ rather not ○ rather yes ○ yes ○ I have no opinion |
Table 5.
Scheme of possible answers from consumers of water as regards the assessed quality of supply services regarding the parameters of ARI—consumer knowledge regarding the city’s water supply.
Table 5.
Scheme of possible answers from consumers of water as regards the assessed quality of supply services regarding the parameters of ARI—consumer knowledge regarding the city’s water supply.
| Consumer Knowledge Regarding the City’s Water Supply | |
|---|---|
| No. → Question | 7. Have you experienced any nuisance related to the lack of tap water? |
| Assessment | ○ definitely not ○ not ○ rather not ○ rather yes ○ yes ○ I have no opinion |
| No. → Question | 8. Have you experienced any problems related to the consumption of tap water of inadequate quality? |
| Assessment | ○ definitely not ○ not ○ rather not ○ rather yes ○ yes ○ I have no opinion |
| No. → Question | 9. Do you save water? |
| Assessment | ○ definitely not ○ not ○ rather not ○ rather yes ○ yes ○ I have no opinion |
| No. → Question | 10. How do you assess the quality of water resources in the region? |
| Assessment | ○ definitely not ○ not ○ rather not ○ rather yes ○ yes ○ I have no opinion |
Publisher’s Note: MDPI stays neutral with regard to jurisdictional claims in published maps and institutional affiliations. |
© 2020 by the authors. Licensee MDPI, Basel, Switzerland. This article is an open access article distributed under the terms and conditions of the Creative Commons Attribution (CC BY) license (http://creativecommons.org/licenses/by/4.0/).
Share and Cite
MDPI and ACS Style
Tchórzewska-Cieślak, B.; Pietrucha-Urbanik, K.; Kuliczkowska, E. An Approach to Analysing Water Consumers’ Acceptance of Risk-Reduction Costs. Resources 2020, 9, 132. https://0-doi-org.brum.beds.ac.uk/10.3390/resources9110132
AMA Style
Tchórzewska-Cieślak B, Pietrucha-Urbanik K, Kuliczkowska E. An Approach to Analysing Water Consumers’ Acceptance of Risk-Reduction Costs. Resources. 2020; 9(11):132. https://0-doi-org.brum.beds.ac.uk/10.3390/resources9110132
Chicago/Turabian StyleTchórzewska-Cieślak, Barbara, Katarzyna Pietrucha-Urbanik, and Emilia Kuliczkowska. 2020. "An Approach to Analysing Water Consumers’ Acceptance of Risk-Reduction Costs" Resources 9, no. 11: 132. https://0-doi-org.brum.beds.ac.uk/10.3390/resources9110132
Note that from the first issue of 2016, this journal uses article numbers instead of page numbers. See further details here.