Article

Torrefaction as a Pretreatment Technology for Chlorine Elimination from Biomass: A Case Study Using Eucalyptus globulus Labill

by
Letícia C. R. Sá
1,
Liliana M. E. F. Loureiro
1,
Leonel J. R. Nunes
2,3,* and
Adélio M. M. Mendes
4
1
YGE—Yser Green Energy SA, Área de Acolhimento Empresarial de Úl/Loureiro, Lote 17, 3720-075 Loureiro OAZ, Portugal
2
proMetheus—Unidade de Investigação em Materiais, Energia e Ambiente para a Sustentabilidade, Escola Superior Agrária, Instituto Politécnico de Viana do Castelo, Rua da Escola Industrial e Comercial de Nun’Alvares, 4900-347 Viana do Castelo, Portugal
3
GOVCOPP—Unidade de Investigação em Governança, Competitividade e Políticas Públicas, DEGEIT—Departamento de Economia, Gestão, Engenharia Industrial e Turismo, Universidade de Aveiro, Campus Universitário de Santiago, 3810-193 Aveiro, Portugal
4
LEPAE—Laboratório de Engenharia de Processos, Ambiente e Energia, FEUP—Faculdade de Engenharia da Universidade do Porto, Rua Roberto Frias, 4200-465 Porto, Portugal
*
Author to whom correspondence should be addressed.
Submission received: 10 April 2020 / Revised: 28 April 2020 / Accepted: 29 April 2020 / Published: 1 May 2020
(This article belongs to the Special Issue Assessment of Biomass for Bioenergy)

Abstract

:
The recognition of the effects of fossil fuel consumption resulted in several agreements, legislation, and projects focusing on the minimization of impacts caused. Biomass is a versatile energy source. Eucalyptus is a fast-growing crop, mainly used by the pulp and paper industry. Torrefaction is a thermochemical conversion process that can improve biomass fuel properties, enabling its use in the energy sector. However, correct management of biomass is crucial for the sustainability of this process. Torrefaction can also be used to eliminate some elements that can hinder subsequent conversion processes. One example is chlorine, which, during combustion or gasification processes, can form hydrochloric acid that leads to corrosion of metal surfaces. In this context, this research aimed to determine the temperature at which chlorine is eliminated during torrefaction process. For this purpose, several tests were performed at different temperatures and residence times. All samples were analyzed before and after the process, and were characterized by proximate and elemental analysis, calorimetry, and chlorine titration. The analysis showed that, even for the lowest torrefaction temperature used, chlorine content was already below the detection value, showing that, even at lower temperatures, thermal treatment is an efficient technique for the elimination of chlorine from biomass.

1. Introduction

Humans have used energy derived from fossil fuels for a long time without thinking of the consequences, and it is now increasingly clear that actions must be taken to rectify the situation [1]. Ever growing concentration of greenhouse gases (GHGs) in the atmosphere, the shortage of fossil fuel reserves, and the rise in temperature are some of the main concerns presently faced by mankind, and with each passing day new research provides different pathways to address these challenges, or at least part of them [2]. Biomass is only one of the options, but it has an enormous potential [3].
Biomass can be converted into usable forms of energy, such as heat and electricity [4]. It can be obtained from several sources, including waste from forestry and agricultural operations, or from other industries, such as pulp and paper, or textile industries [5]. This energy source has many advantages if managed correctly. It is highly available, produces low levels of GHGs during its conversion, and can result in many different energy forms, following actual energy grid needs [6]. However, wasteful consumption without replacement, lack of treatment for secondary gaseous products, and even the high costs of transportation make the use of biomass oftentimes unfeasible and environmentally unfriendly [7].
In its natural form, the chemical and physical properties of biomass can hinder its use in some energy applications [8]. Its low bulk density and heating value, along with its high moisture content and poor grindability, make biomass a worse fuel than coal [9]. However, it is possible to pretreat biomass before other conversion processes [10]. In the thermal energy sector, torrefied biomass can have an important role in combustion applications, since it can be fired directly, either alone (as the only source of fuel) or along with a primary fuel (co-firing) [11].
Torrefaction is a thermochemical conversion process that occurs in the temperature range of 220–320 °C, with oxygen shortage and under atmospheric pressure conditions [12]. It is based on the molecular disintegration of hemicellulose, with small alterations in the structures of cellulose and lignin [13]. As a result, the ability of biomass to acquire moisture and to rot decreases, simplifying storage cautions [14]. Furthermore, during the process, there is a partial devolatilization that leads to a decrease in mass, even though the initial energy content is mostly preserved, which means higher energy density and lower transportation costs [15].
In Portugal, the potential of the available forest biomass is 2.2 × 10⁶ tons per year, which corresponds to approximately 20% of the country needs [16]. However, forest biomass is the main raw material for several processes, particularly for the pulp and paper industry, which makes it a highly competitive market [17]. For that reason, it is necessary to find alternatives for the most required types of forest biomass in order to minimize production costs. Eucalyptus genus is native to Oceania, where it is the dominant genus of flora. The genus includes more than 700 species, almost all originated in Australia, with only a small number of species belonging to neighboring territories of New Guinea and Indonesia, and one more species (the most northern) in the southern Philippines. The genus acquired great importance due to its utilization as fiber raw material and for biomass production [18]. It is also known for its high flammability and fire survivability, which may cause problems in dry-climate locations [19]. The pulp and paper industry in Portugal use mainly older eucalyptus trees with diameters larger than 10 cm. The possibility of using the remaining and disposed smaller eucalyptus available for the production of torrefied biomass could guarantee lower production costs and reduce the risk of wild fires [20].
The purpose of this research was to encourage the incorporation of eucalyptus trees with diameters smaller than 10 cm into the biomass energy supply chain. This article presents the results obtained from six samples of eucalyptus trees, ranging from 2 to 9 cm in diameter. The main focus was the analyses of the amount of chlorine present in the biomass that could later damage the equipment during thermal reactions. A set of analyses was performed for characterizing raw biomass. After torrefaction, a new set of analysis took place to determine the remaining amount of chlorine. Torrefaction occurred at three different temperatures and residence times, with the objective to determine at which temperature chlorine would disappear and which combination would guarantee the best results.

2. State-Of-The-Art

2.1. Biomass

IUPAC (International Union of Pure and Applied Chemistry) defines biomass as a material produced by the growth of microorganisms, plants, or animals, which can be used to produce energy [21]. In 2017, total energy production worldwide was 14 Mtoe, being biomass responsible for 10% of that value [22]. This source is extremely versatile since it is possible to generate power and heat through direct burning, or converted into several different forms, e.g., bio-oil or syngas [23].
Biomass originates from the reaction of CO2, water, and sunlight, via photosynthesis, to produce carbohydrates (or sugars) [24]. During photosynthesis, solar energy is stored in chemical bonds of the structural components of biomass. Due to human activity, especially fossil-fuel burning, atmospheric CO2 concentration increased. However, not all stays there, since part of it is used for photosynthesis, ending up in several types of biomatter. Classification of biomass depends on the field, purpose, and application [25].
Lignocellulosic biomass consists of an amorphous matrix that surrounds cellulose fibers, and acts as a natural barrier, making the structure of the biomass more rigid and less reactive [26]. Some key components of biomass are cellulose, hemicelluloses, lignin, starch, and proteins, although trees mainly consist of cellulose, hemicelluloses, and lignin [27]. Cellulose is an organic compound, with the formula (C6H10O5)n, derived from D-glucose units linked uniformly through β-glucosidic bonds. Many properties of cellulose depend on its chain length or degree of polymerization, indicated by n, which is the number of glucose units that make up one polymer molecule, which can range from several thousand to several tens of thousands. It consists of crystalline and amorphous structures [28]. Hemicelluloses are a heterogeneous group of polysaccharides located in plant cell walls that have β-(1→4)-linked backbones with an equatorial configuration, and the average molecular formula is (C5H8O4)n. Its principal role is the contribution to the cell wall strength. Since the degree of polymerization, n, is between 50 and 200, they are easier to break down than cellulose and generally soluble in alkaline solutions [29]. Lignin is a constituent of all vascular plants, is the second most common organic substance on Earth, and influences the transport of liquids in the plant, making it possible for the plant to grow and compete for sunlight. Lignin is a three-dimensional polymer composed of a structure based on phenylpropane and its derivates. Its molecular structure is incredibly complex and hard to decompose. For that reason, its function is thought to confer mechanical strength and protection [30]. Chemical composition of lignocellulosic biomass varies among species, but it generally contains 10–25% lignin, which are non-sugar type molecules that act as a glue, uniting fibers, and 75–90% carbohydrates or sugars, which are linked together to form long chains or polymers and a small amount of ash and extractives [31].
Apart from the components previously discussed, there are a few other components that need special attention concerning biomass and conversion processes leading its valorization. Moisture is one of the main factors to consider. Wetter biomass has a lower calorific value, limiting the amount of energy obtained from it. For example, moisture content can vary significantly from as low as 3% in paper to 98% in sludge [32]. Ash is the non-combustible portion of the raw biomass. There are two types of ash present in biomass, the part formed by salts that are chemically bonded to the carbon structure, and the part composed by mineral soil particles gathered during growth or harvest and transport. High ash content leads to fouling and slagging problems, especially if the ash is high in alkali metals [33].
Carbon content is another crucial aspect to consider since heating value depends on the ratio of elements, especially carbon, in the biomass. A higher carbon content in raw biomass means a higher heating value. Coal consists of at least 60% carbon, while raw biomass only contains around 45% [5]. Hydrogen is the third major constituent of biomass, comprising typically 5–6% dry matter [34]. Its impact is similar to carbon content, where higher percentages of hydrogen also lead to higher heating values [35]. Nitrogen content varies from 0.2% to 1%, and it is directly related to NOx emissions. For that reason, the lower is the amount present in the biomass, the better [36]. Sulfur content is relatively low, especially when compared to coal, but it can have negative impacts on the environment. Although this value is normally below 0.2%, its presence leads to the formation of SOx, which are partly responsible for particulate matter pollution and acid rain [5].
Some nutrients, such as Ca, Mg, Na, K, and P, are fundamental to plants and can be obtained from air or soil [37]. However, during biomass collection, these nutrients are removed from the soil, which can impair the possibility of new plants growing in that location. For that reason, it is crucial to find a way to recycle those nutrients back [38]. A high chlorine concentration can cause severe impacts to the process. High-temperature chlorine corrosion of superheaters is the worst of them since it leads to higher maintenance costs [39].

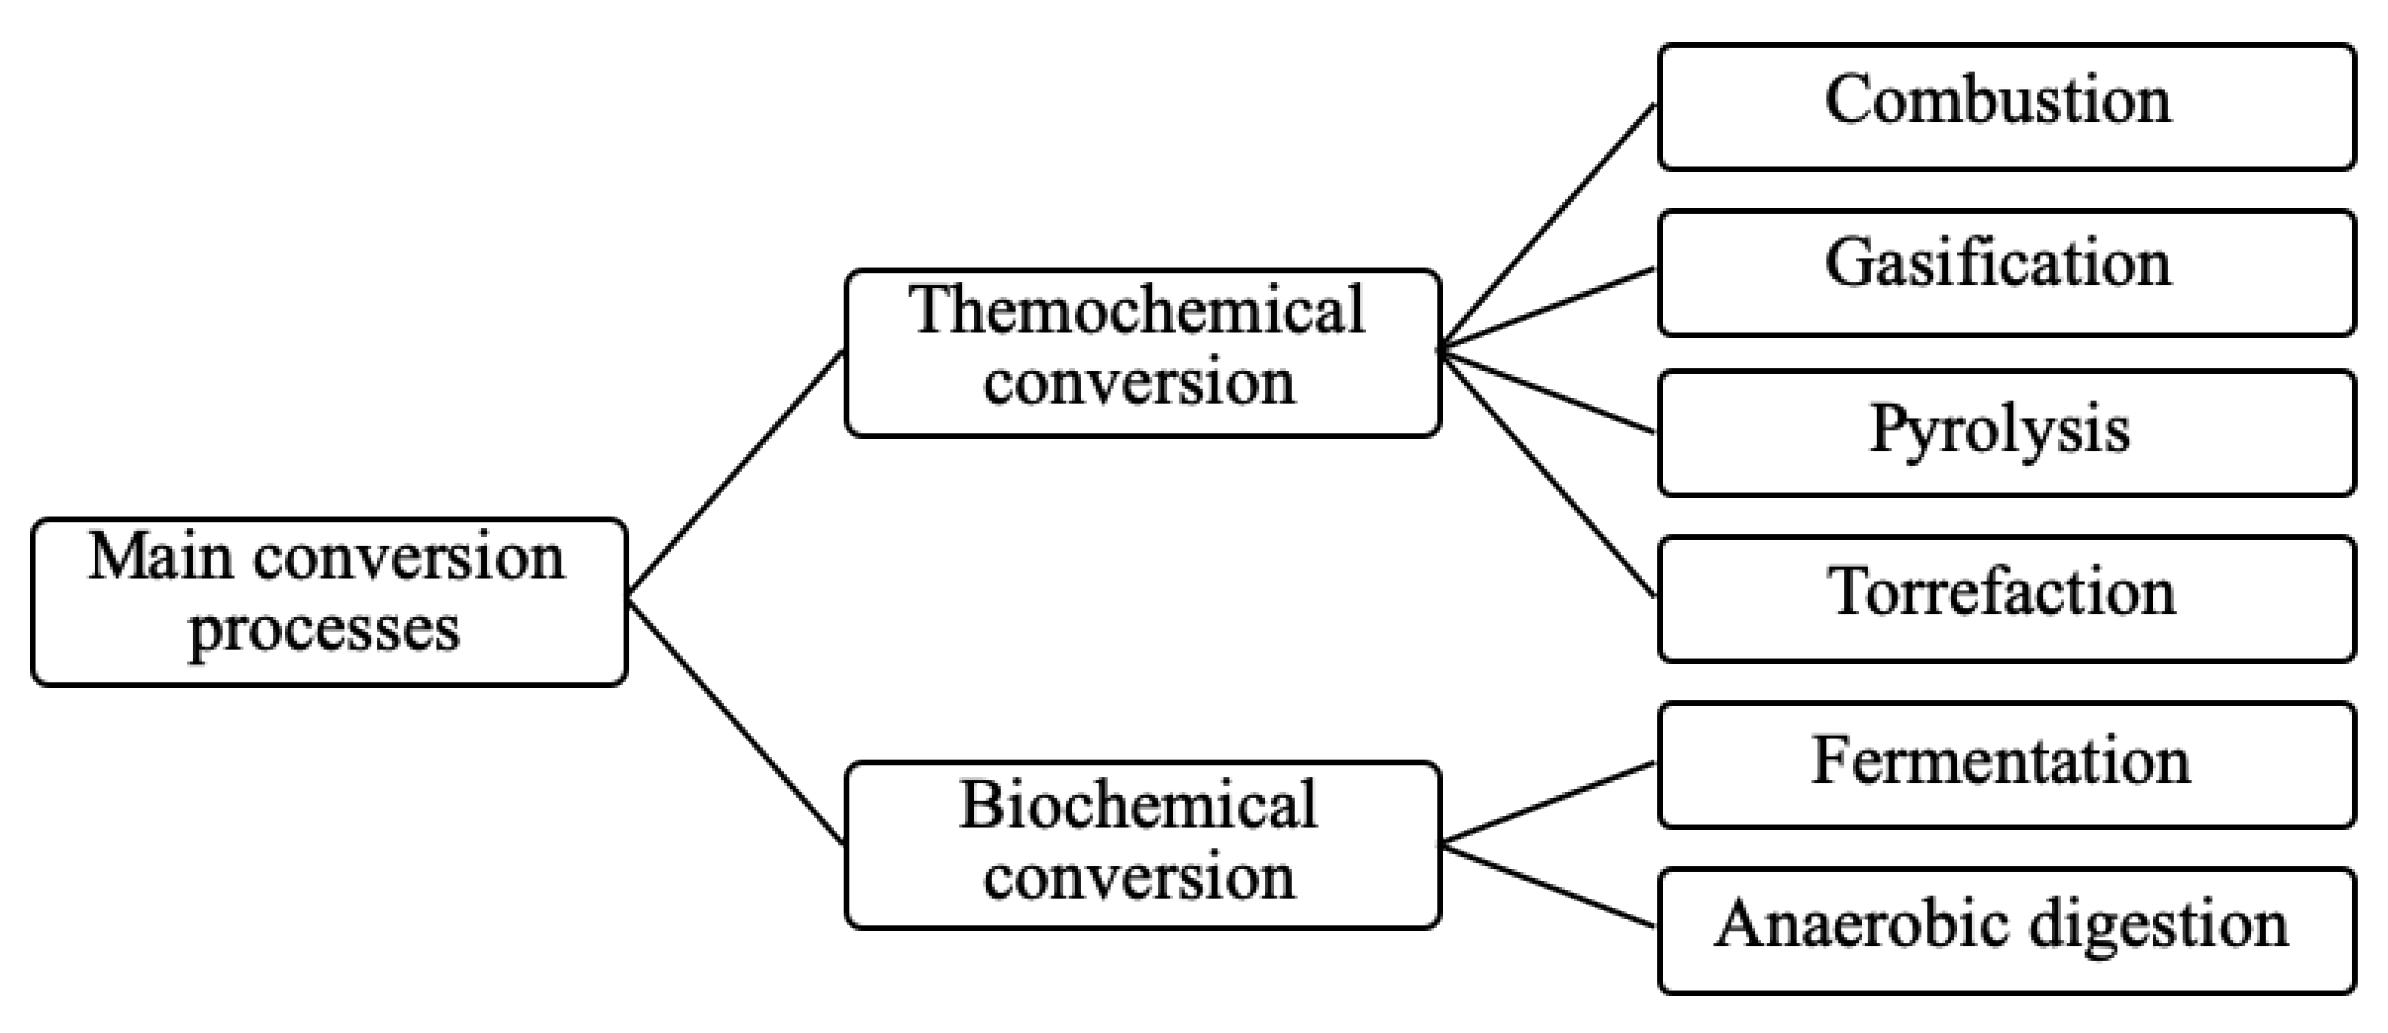
2.2. Biomass Thermochemical Conversion

2.2.1. Torrefaction Process

Biomass conversion into an enriched product involves different biomass sources and varieties, and the determination of the best conversion process for each situation depends on many factors, such as the type and quantity of biomass, the desired product, environmental standards, economic conditions, and available infrastructure [40]. The most common processes used today are of thermochemical and/or biological nature, as shown in Figure 1.
Combustion is the primary process adopted worldwide to convert biomass into heat, mechanical energy, or electricity, and it is also the oldest one [41]. During the process, flammable materials are burned in the presence of air, or oxygen, to release heat [42]. To be feasible, this process requires biomass with a moisture content lower than 50% [43]. Combining fossil fuels, such as coal or natural gas, with biomass is known as co-firing, and it has several advantages since it reduces the amount of GHGs emission and, depending on the ratio used, loses little efficiency [44].
Gasification is the partial oxidation of biomass above 800 °C with a controlled amount of oxygen [45]. Molecules break down to produce syngas, which is a mixture of CO and H2 that can be used for many applications [46]. Its higher efficiency makes it more desirable than direct combustion, and there are many methods available, which are classified according to combinations of conditional factors, such as pressure, temperature, gasifying agent, heating rate and gasifier type [47].
Pyrolysis is a thermochemical process where biomass heats up to approximately 500 °C in a scarce or low-oxygen atmosphere, preventing total combustion but still causing changes in the chemistry of the biomass [48]. Pyrolysis produces a hydrocarbon-rich gas mixture, an oil-like liquid, and a carbon-rich solid residue, with proportions depending on process parameters [49]. Although the expectation was to have low dioxin emission, high power generation efficiency, and the recycling of molten slag, recent studies have shown that the process requires high consumption of auxiliary energy and that slag recycling rate is low and not worth the cost [50].
Torrefaction is a conversion process where biomass is heated in the range from 220 to 320 °C, at atmospheric pressure and in the absence or scarcity of oxygen [52]. During the process, hemicellulose is decomposed, while lignin and cellulose remain practically the same. It can be used as a pretreatment since it improves several properties of raw biomass, making it a better fuel for other process, such as combustion or gasification [53].
Fermentation is a biological process that happens at room temperature and pressure. During the reaction, microorganisms convert organic material into simpler compounds in anaerobic condition. It is possible to produce ethanol from biomass-containing sugars, starch, or cellulose, but both starch and cellulose require additional processing even though they are usually cheaper than sugar-based sources [54].
Anaerobic digestion is the degradation of the carbonaceous matter in organic compounds through bacterial action in the absence of oxygen. The decay of sewage and animal waste generates biogas, a mixture of methane and carbon dioxide, with small quantities of other gases [55].
During torrefaction, biomass is decomposed at moderate temperatures in the absence of oxygen and at atmospheric pressure. The lower temperature limit is related to the onset of decomposition of hemicelluloses, and the second limit is related to the onset of decomposition of cellulose [56]. This temperature range guarantees that the main target of the decomposition, in the case of lignocellulosic biomass, is hemicellulose, even though both lignin and cellulose may also suffer some decomposition [57]. Several studies have proven the benefits of the biomass torrefaction process [53,58,59,60]. As a result, it is possible to obtain a substantial increase in the performance of biomass during co-combustion and gasification processes [61]. Apart from the improvements mentioned above, there are many others: lower grindability and moisture, higher heating value and hydrophobicity, and more homogeneous properties give torrefied biomass a more significant appeal when compared to raw biomass [62]. These new characteristics simplify storage, reduce transportation costs and energy consumption, and optimize energy production.
The torrefaction process can be divided into five main stages, which guarantee the optimization of torrefaction by taking into account changes that occur throughout the process. Bergman [63] came up with the following definitions that are now the basis for defining these temperature–time stages:
  • Initial heating: The temperature of the biomass starts to increase and moisture starts to evaporate in the end.
  • Pre-drying: It occurs at approximately 100 °C and, during this stage, free water present in biomass evaporates at a constant rate.
  • Post-drying and intermediate heating: The temperature of the biomass increases to 200 °C. At this stage, biomass releases water present in its chemical bonds, practically eliminating all the moisture. Due to the evaporation of light organic compounds, some mass loss can occur.
  • Torrefaction: This is the stage where the biomass is torrefied. It happens during the time in which the temperature is superior to 200 °C, or 220 °C as previously mentioned, and consists of a heating period, a constant temperature period, and a cooling period. Mass loss starts during the first and stops after the latter. The maximum constant temperature reached is known as the torrefaction temperature (TTor).
  • Solids cooling: The torrefied biomass cools further until it reaches room temperature.

2.2.2. Torrefaction Parameters

The following parameters have been proven to affect torrefaction process and final products [64]:
  • Temperature and residence time: They are crucial to understand how the exposure of biomass to high temperatures affects its structure since it generally results in mass loss. The temperature attained and its duration influence the degree of thermal degradation. Regarding residence time, previous studies commented the importance of replacing this term with reaction time since the former mainly influences the degradation of hemicellulose, while the latter affects the cellulose mass loss [65,66]. As mentioned, the torrefaction process has several heating stages, even before torrefaction starts. Therefore, residence time does not represent biomass exposure to torrefaction. When comparing the effects of temperature and residence time on the characteristics of the final product, it is important to mention that both are connected and dependent on each other, even though temperature has a more significant influence since it defines the kinetics of the reaction.
  • Heating rate: The heating rate (°C/min) chosen during torrefaction affects solid, liquid, and gaseous portions in the final product, since it influences secondary degradation reactions. The use of high heating rates reduces parallel reactions, which impacts the distribution of the products. A recent study suggested that the effects of heat and mass transfer in the particles decrease by increasing the heating rate [67].
  • Atmosphere composition: The torrefaction process can be affected by the gas flow used during the process due to the secondary interactions between the gases. Carbon monoxide is the main gas released in the process, occurring through a secondary reaction as the temperature increases. Furthermore, the longer is the residence time, the lower is the CO2/CO ratio. There are no substantial changes in biomass reactivity or in the solid reaction products depending on the presence of O2 in the atmosphere.
  • Reactor type: Besides being a relatively new technology, there are several reactors available in the market [68,69]. Reactor design is the main difference between the technologies, each one with its heat transfer method and mixing pattern, determining product quality. The most commonly used technologies are the rotatory drum kiln, which is indirectly heated (through the reactor wall) and the rotary drum reactor, which is directly heated [70].

2.2.3. Torrefied Biomass Properties

As mentioned above, the purpose of torrefaction is to transform natural biomass into a product with better fuel characteristics by altering some of its properties. Although this process influences several biomass attributes, it presents most of its alterations in the following features [71]:
  • Moisture content: Before torrefaction process, moisture content in raw biomass ranges from 10% to 50%, but, by the end, it reaches 1–3% due to the high temperatures obtained during the process. This reduction contributes to many improvements, such as a lower transportation cost since there is no unwanted water in the product, simplified storage, transportation given by its new hydrophobicity, and better performance during the subsequent conversion process due to a higher heating value.
  • Energy and bulk density: The torrefaction process results in loss of mass in different states, which leads to an increase in biomass porosity. As a result, both volumetric and bulk densities decrease, even though several studies have shown a substantial increase of more than 50% in energy density [72].
  • Grindability: Biomass is naturally fibrous and tenacious. During torrefaction, structural changes decrease the length of the fibers, making it weaker. This modification favors the utilization of biomass alongside coal in processes such as co-firing and co-gasification, since solid fuel is now easily ground. Apart from that, energy consumption during grinding decreases significantly, with some studies observing reductions of 70–90% [73].
  • Heating value: The torrefaction process increases the carbon content, while the oxygen and hydrogen content of the biomass decrease with increasing temperature. The amount of carbon lost during the process is lower than the loss of other components, which leads to a higher heating value when compared to raw biomass. This increase results in better combustion characteristics and approaches properties of torrefied biomass to those of coal.
As mentioned above, the purpose of this study was to determine the temperature at which chlorine elimination occurs during torrefaction. Therefore, the equipment used for torrefaction is not particularly relevant in this case. The choice of a reactor did not follow the conventional path, and the decision was to use a laboratory-scale high-temperature furnace, or ceramic muffle, as proposed by Ribeiro et al. [74], and already followed by other researchers in recently published works [75]. The generation of heat occurs through electrical resistance spread across the interior of the furnace, making it possible to reach the different heating stages needed in the process, such as a conventional reactor. This methodology was proven to be similar to other technologies available, and for research purposes it can be cheaper and more straightforward than the alternatives [74].

2.3. Soil and Nutrient Depletion

Biomass contains several macro- and micronutrients that are absorbed from air or soil, even though the proportions of each may vary among different species, ages, and locations [76]. There are 17 indispensable elements and substances responsible for the completion of the normal lifecycle of a plant. However, those are not always beneficial. When in excess, some of them can lead to soil, water, and air contamination, and even to death of the plant [77].
During their growth, trees accumulate heavy metals of anthropogenic origin, and these metals tend to accumulate in the ashes after the conversion processes, along with the nutrients [78]. The problem here is that, generally, ashes are returned to soil so that they can replace previously extracted nutrients, and heavy metals hinder recirculation of these nutrients, maximizing negative environmental impacts. The presence of heavy metals can contaminate soil and water, which can become a severe environmental problem. Therefore, the application of a separation technique could be extremely favorable [79].

2.4. Forest Typology of Mainland Portugal

In 2010, Portugal had a forest area that represented 35.4% of its territory. Since 1995, there was a reduction of almost 5% in the national forest area, which can be explained by an increase in urban area. However, this trend shifted in 2015, with an increment of 59,000 ha (1.9%), when compared to the previous assessment [80]. The 6th National Forest Inventory (IFN6) also concluded that, in 2005 and 2015, Portugal had the same amount of wood in growth (172 Mm3). These data prove that forest production has been sustainable during this period and that it can remain sustainable if a balance among forest growth, logging, and losses from fire or pests prevails. The following four broad groups, or forest formations, make up the Portuguese mainland forest: pine forests, evergreen broadleaf, deciduous broadleaf, and industrial broadleaf forest [80,81].
  • Pine forests are the second largest forest formation, but had a more considerable reduction in the occupied area.
  • Evergreen broadleaves are cork oak and holm oak and represent about 1/3 of the forest.
  • Deciduous hardwoods composed of oaks, chestnut trees, and others are the least representative forest formation concerning the occupied area.
  • Industrial broadleaf forests are composed by eucalyptus, which showed an increment in occupied area over the last 50 years, representing about 26% of the mainland forest.
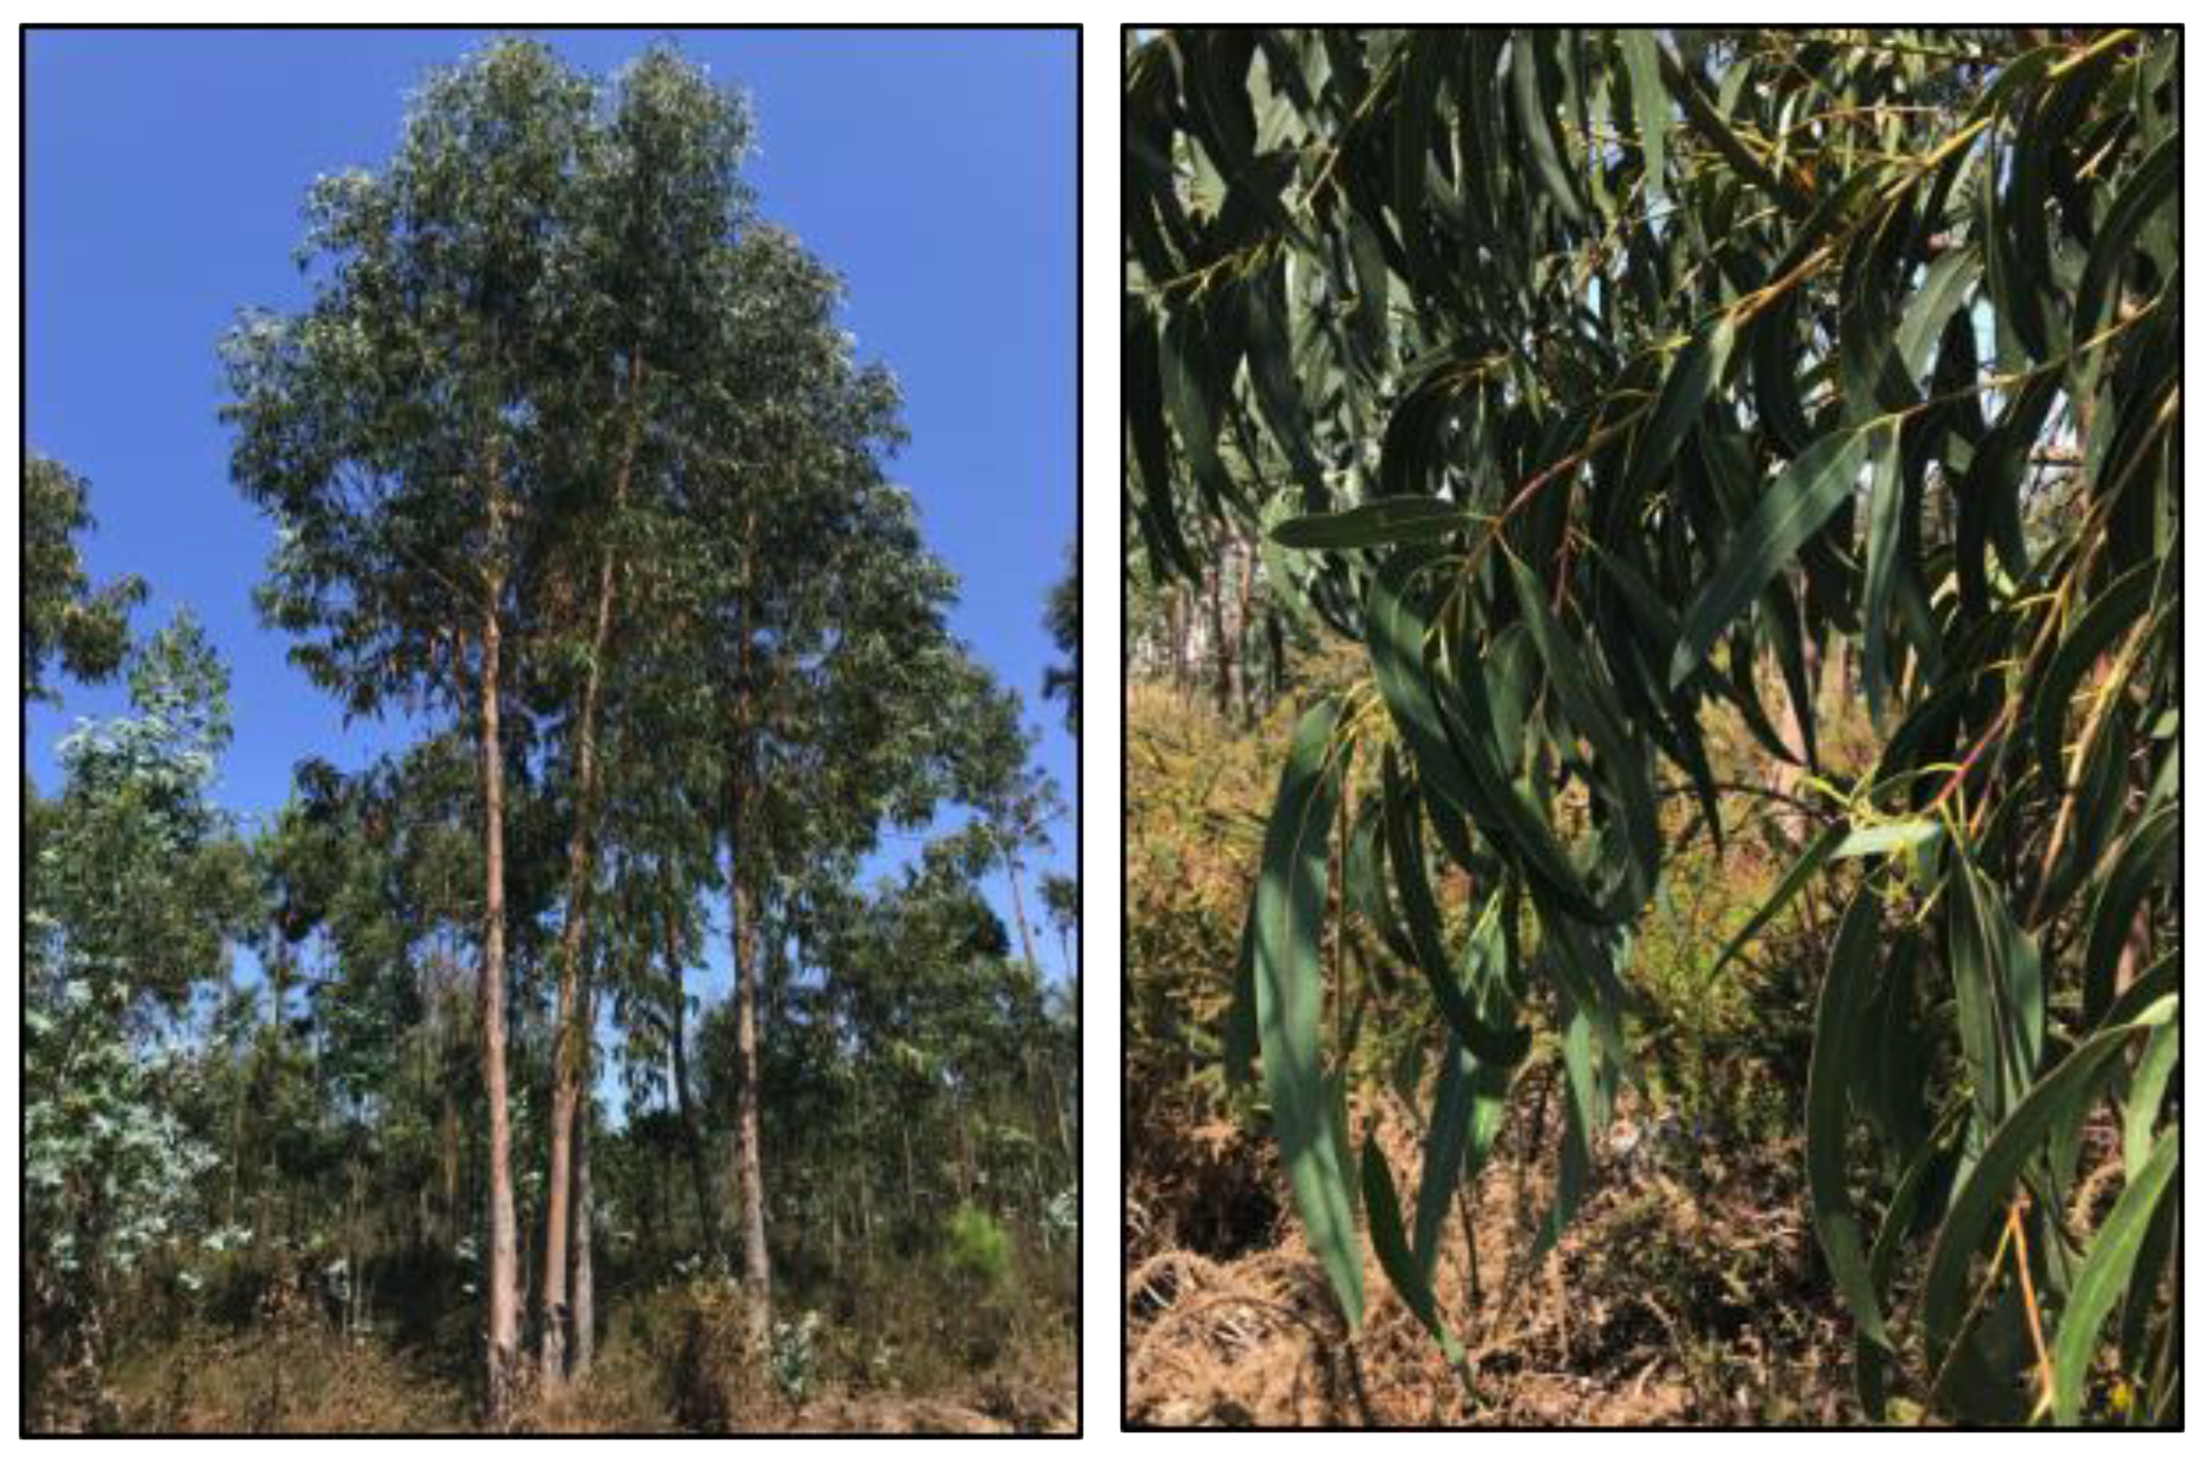
Eucalyptus is distributed in Portugal mainly in the north and center regions, with predominance for the lowest quotas and in areas closer to the coast. However, some areas of the interior of the country have also extensive plantations of eucalyptus, mainly next to the large water courses, where large factories for the production of pulp have also been installed.

2.5. Eucalyptus

Eucalyptus globulus Labill., shown in Figure 2 (left), belongs to the Myrtaceae family and is originally from Australia [82]. In Portugal, E. globulus was introduced in the 19th century [19]. This species combines fast growth with high productivity, which makes it appealing for forest producers [83]. E. globulus has thick leaves, Figure 2 (right), which simplifies the light capture. Moreover, its form allows it to avoid stress caused by excessive light and to cool down through perspiration with air movement. All these factors, coupled with good biochemical defense against high temperatures, optimize photosynthesis during the entire year [83]. Despite that, eucalyptus is an exotic species that may present invasive behavior if not controlled and properly managed. Its advantage against others can lead to drastic consequences to the biodiversity in Portuguese forests, and its high flammability is a dangerous disadvantage, especially during dry season. At this moment, pulp and paper industry are the primary eucalyptus consumer in Portugal. However, there is still potential for the energy sector to explore this species and to minimize its adverse impacts on the Portuguese forest.
Traditionally, pulp industry only accepts rolls with diameters greater than 10 cm. Thus, all lower diameters are discarded and not recovered. Its use in other supply chains, such as those in the biomass pellets industry, has neglected this source of biomass, since its properties as a fuel are not the best due to a set of disadvantages common to other forms of residual biomass, namely its low density, high moisture content, and the presence of elements such as chlorine, which during the combustion process can cause damage to the metal surfaces of combustion equipment.

3. Materials and Methods

3.1. Materials

Six different samples of Eucalyptus globulus were collected, with diameters ranging from 2 to 9 cm. The samples were cut, debarked, dried, ground, and analyzed prior to torrefaction as well as after. For the analysis performed before torrefaction process, eucalyptus samples were divided into trunks, barks, and leaves, and weighed separately, which led to knowledge of the percentage that each portion represents in the collected trees. Since the two smaller tree samples were not big enough for all analyses performed, they were mixed for the torrefaction step and subsequent steps. A weighted average was used for the following calculations.

3.2. Torrefaction Process

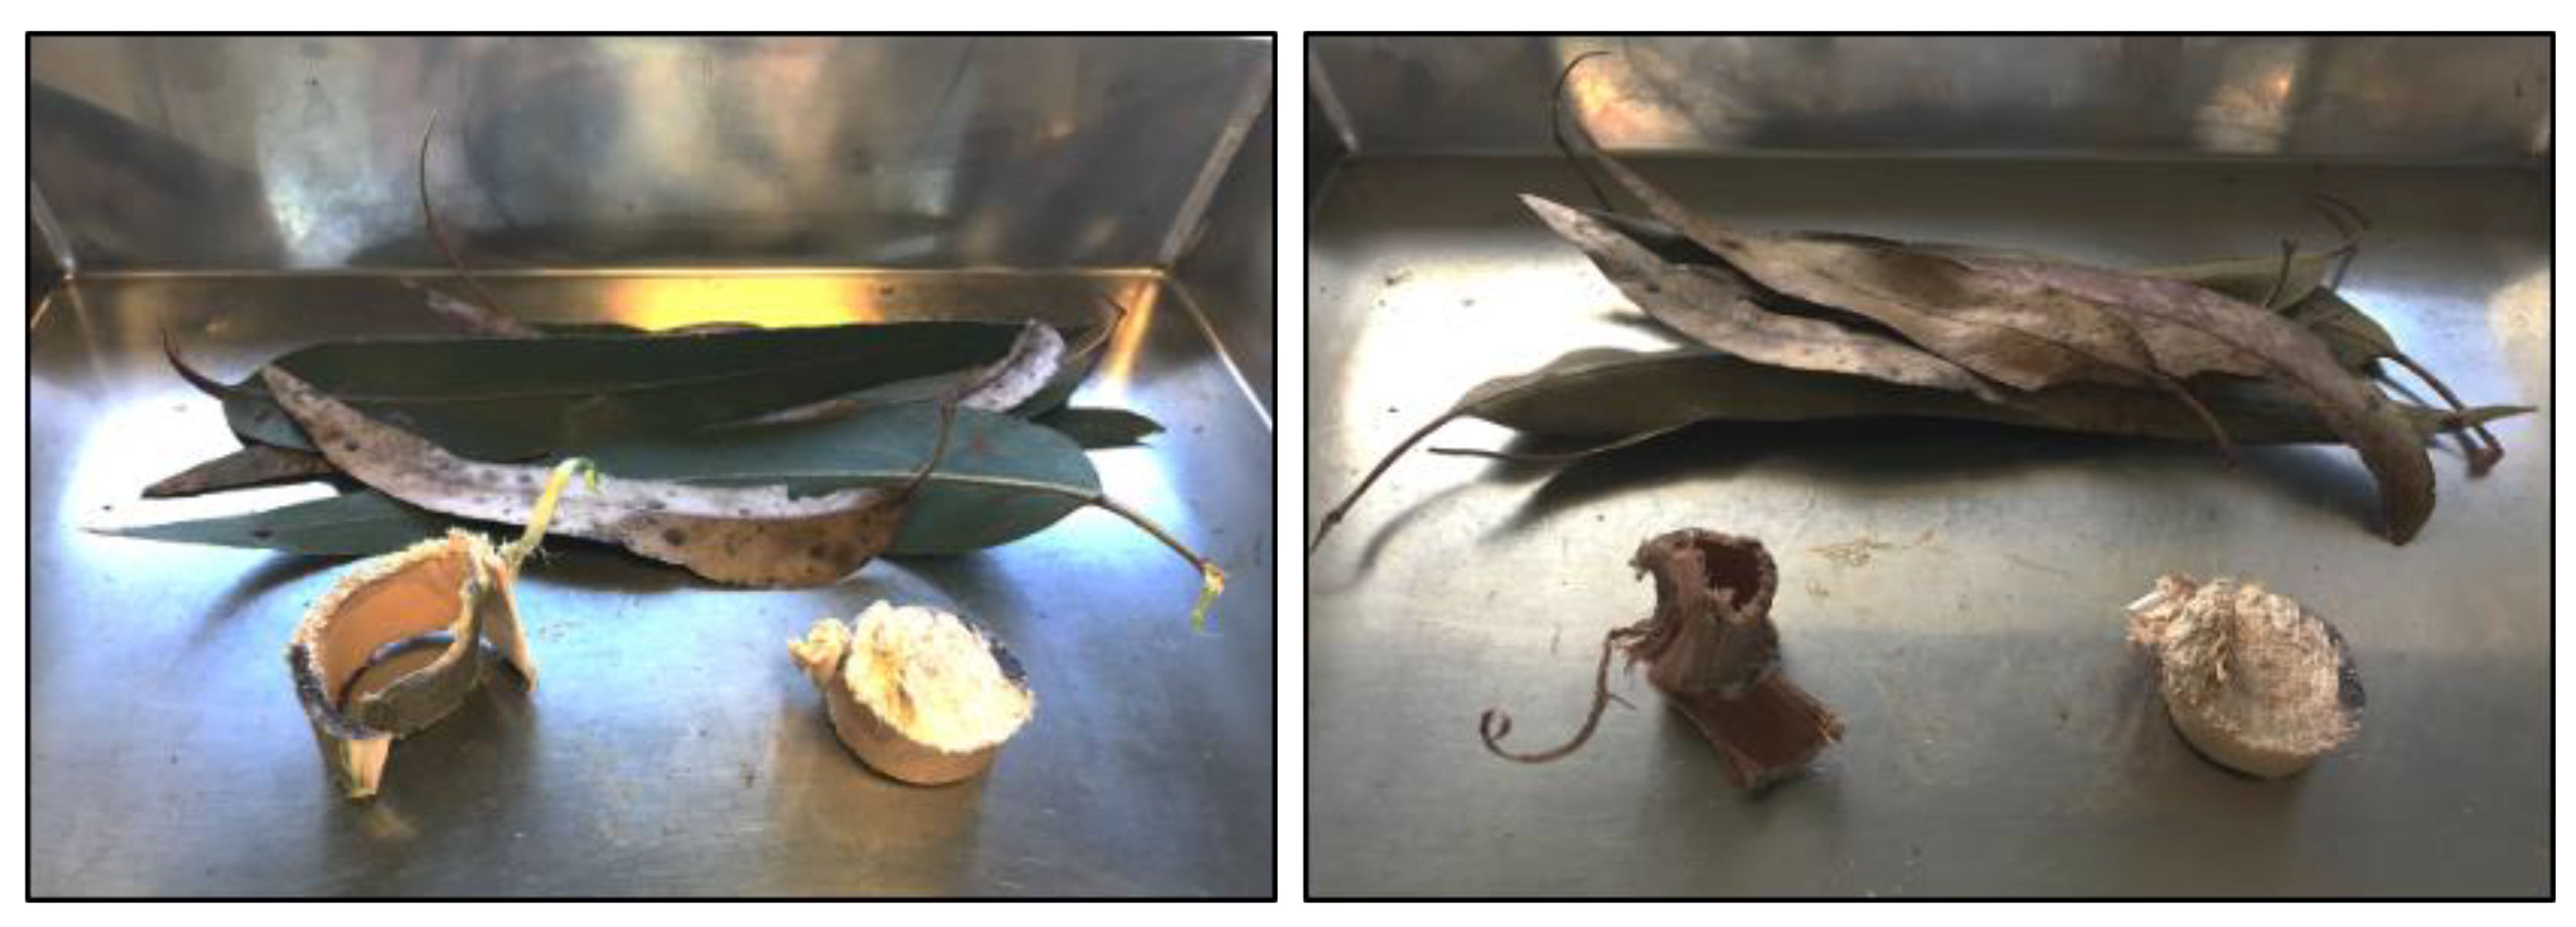
3.2.1. Sample Selection and Preparation

As mentioned above, E. globulus was the selected biomass source. Diameters were measured before cutting to ensure that sizes varied within chosen range. Following the selection, the trees were cut, debarked, and prepared for analysis and torrefaction. The samples that were analyzed before the torrefaction process were divided as previously described, and then dried and ground to comply with the standards. The samples that followed for torrefaction, only the trunks, were dried, cut into smaller pieces, ground, and then wrapped in conventional aluminum foil.
Equipment used for drying and grinding were an ECOCELL forced air oven and a RETSCH (model SM300) blade mill. Before torrefaction, a 10-mm diameter sieve was used to homogenize the samples, while a 2-mm diameter sieve was used for grinding before the analysis. Since Trees 1 and 2 were mixed before the torrefaction process, there were five samples for each torrefaction test.

3.2.2. Torrefaction Procedure

For this study, the equipment of choice was a BARRACHA (model K-3) high-temperature furnace, which uses electrical resistances for the generation of heat. This furnace also presents a built-in thermal controller that enables programming four temperature stages with respective residence times. The preparation of the samples was made with the aid of conventional aluminum paper used to wrap the material into a cylindrical shape. Because the aluminum paper has two distinct sides, it should be noted that the opaque part of the sheet must be directed towards the outside so that during the torrefaction process the heat is not reflected.
The definition of optimal temperature stages and a scheme of the programmable stages are presented in Table 1, where T1 is approximately 100 °C and T2 is the torrefaction temperature.

3.2.3. Torrefaction Parameters

As mentioned above, torrefaction process was repeated several times with a variation in two parameters. Different temperatures and residence times were chosen, and each torrefied product was analyzed to ensure that the best combination of the two would lead to the desired result. When compared to the previously specified steps, it is important to highlight that Steps 1 and 2 were combined and that temperatures of the stages did not follow the definitions mentioned by Bergman [63]. Temperatures were chosen based on the torrefaction temperature range, as defined by Nunes (2020) [70], while the residence times were selected based on the study by Ribeiro et al. [74]. Table 2 presents the parameters used in each one of the tests performed along with their identification.

3.3. Laboratorial Characterization of the Samples

3.3.1. Initial Moisture Content

As soon as the samples were cut, a small piece of each portion (trunk, bark, and leaves) was used to determine the initial moisture content of each tree. The pieces were weighed, put in a container, and placed in a forced-air oven. Every 3 h, each piece was weighed until all moisture had evaporated. Lastly, Equation (1) was applied to obtain the initial moisture content (M1):
M 1 ( % ) = ( w initial - w final w initial ) × 100 ,
where winitial is the initial mass and wfinal is the final mass, and was only analyzed before torrefaction.

3.3.2. Chlorine Content

Chlorine is usually present in biomass in low concentrations [84,85]. However, during combustion, hydrochloric acid is formed, which can lead to corrosion in the furnace [86,87,88]. Therefore, it is crucial to determine the torrefaction temperature that will eliminate that component. Chloride titration was the method chosen to determine the chlorine content, and the equipment used was a TITROLINE 7000 titrator from SI Analytics. For this procedure, sample preparation involves previous digestion of the sample, performed in a SINEO MDS-6G microwave, since titration requires a liquid sample. Chlorine content determination is achieved by potentiometric titration. This method consists of measuring the potential difference while the titrant, in this case, AgNO3, is added. Equation (2) presents the redox reaction that occurs:
Cl   ( aq . ) + AgNO 3   ( aq . ) AgCl   ( s ) +   NO 3   ( aq . ) ,
As the next step, software creates a spreadsheet with the potential difference and titrant volume variation over time. The first derivative can then be calculated through Equation (3) and the equivalence point can be determined as the volume corresponding to the maximum of the first derivative:
f ( x ) = Δ U Δ V = U i -   U i - 1 V i -   V i - 1 ,
where ΔU is the potential difference variation (mV) and ΔV is the volume variation (mL).
Chlorine content on a dry basis (wCl,db) is then determined by Equation (4), in compliance with the European standard EN15289:
w Cl , db   ( % ) = ( C C 0 ) ×   V m × 100 × 100 100 M ad ,
where C is the concentration of chloride in the solution (mg/L), C0 is the concentration of chloride in the blank solution (mg/L), V is the volume of the solution (L), m is the mass of the test portion used in the digestion (mg), and Mad is the moisture content in the analysis test sample (%).

3.3.3. Major and Minor Elements Analysis

Inductively coupled plasma atomic emission spectroscopy (ICP-AES), also known as inductively coupled plasma optical emission spectrometry (ICP-OES), is an analytical technique which produces excited atoms and ions that emit electromagnetic radiation at different wavelengths and is used for the determination of trace elements. The main advantages are its multi-element capability, broad dynamic range, and effective background correction [89]. For preparation of the samples, microwave digestion was once again necessary to ensure that the capillaries did not get obstructed. The model used for the analysis was a THERMO SCIENTIFIC (iCAP 6000 series). A peristaltic pump delivered the digested samples to an analytical nebulizer and introduced into the plasma flame that breaks down the samples into charged ions, releasing radiation with specific wavelengths. In the end, software generates a spreadsheet with the results. Equations (5) and (6) were used to calculate the content of each element in the sample on a dry basis (wi,db), in compliance with standards EN15289, EN15290, and EN15297:
w i , db = ( mg kg ) = ( C -   C i , 0 )   ×   V m   ×   100 100 -   M ad   ,
where Ci is the concentration of the element in the diluted sample digest (mg/L), Ci,0 is the concentration of the element in the solution of the blank experiment (mg/L), V is the volume of the diluted sample digest solution (mL), m is the mass of the test portion used (g), and Mad is the moisture content in the analysis test sample (%).
w S , db   ( % ) = ( C -   C 0 ) ×   V m   ×   0.3338   ×   100   × 100 100 -   M ad ,
where Ci is the concentration of sulfate in the solution (mg/L), Ci,0 is the concentration of sulfate in the solution of the blank experiment (mg/L), V is the volume of the diluted sample digest solution (mL), m is the mass of the test portion used (g), 0.3338 is the stoichiometric ratio of the relative molar masses of sulfur and sulfate, and Mad is the moisture content in the analysis test sample (%).

3.3.4. Elemental Analysis

Elemental analysis was performed in a LECO CHN628. The operational principle consists of weighing a sample in a tin foil that is later placed in the autoloader. The sample is then introduced into the primary furnace containing only pure oxygen, which results in fast and complete combustion. Carbon, hydrogen, and nitrogen present in the sample are oxidized to CO2, H2O, and NOx, respectively, and are swept by the oxygen carrier gas through a secondary furnace for further oxidation and particulate removal. Detection of H2O and CO2 occurs through separate, optimized, non-dispersive infrared cells, while the NOx gases are reduced to N. Lastly, N2 is detected when the gas passes through a thermal conductivity cell. After the analysis is complete, moisture content obtained through thermogravimetric analysis is introduced into the software and the CHN contents are automatically calculated. Following that, it is possible to estimate the oxygen content on a dry basis (wO,db) from Equation (7):
wO,db (%) = 100 − wC,db − wH,db − wN,db − wS.db − wCl,db,
where wC,db is the carbon content on a dry basis (%), wH,db is the hydrogen content on a dry basis (%), wN,db is the nitrogen content on a dry basis (%), wS,db is the sulfur content on a dry basis (%), and wCl,db is the chlorine content on a dry basis (%).

3.3.5. Proximate Analysis

The proximate analysis consists in the determination of ash, moisture, fixed carbon, and volatile matter content, which makes it crucial for the thermal conversion of biomass [90]. These values can affect not only the combustion behavior, but also plant design since high moisture content decreases heating value, and the presence of ash influences corrosion and slag formation [91]. Proximate analysis by thermogravimetry enables study of mass loss of the sample in a controlled environment as a function of the temperature [92].
The thermogravimetric analyzer used was an ELTRA THERMOSTEP model. One gram of each sample was introduced into crucibles and placed inside an oven, along with an empty reference crucible. As temperature increased, crucibles were weighed on a precision scale. Moisture, volatiles, and fixed carbon content were determined in this order throughout the heating process. Lastly, the final residue represents the ash content.

3.3.6. Heating Value

Heating value, also known as the calorific value, defines the energy content of biomass fuel [93]. This parameter can be described in two ways: higher heating value (HHV) or gross calorific value refers to the heat released from fuel combustion along with the vaporization energy from water, while lower heating value (LHV) or net calorific value is based on steam as the product, which means its vaporization energy is not considered heat [35].
The heating value of biomass, both higher and lower, can be determined experimentally by employing an adiabatic bomb calorimeter. The model used in this project was the 6400 Automatic Isoperibol Calorimeter by PARR INSTRUMENT. After each procedure, the equipment provides the corrected temperature increase that is later used for the determination of the heating value. Due to the nitrogen- and oxygen-rich atmosphere inside the calorimeter, nitric acid and sulfuric acid are formed, respectively, and the heat of formation of both acids must be disregarded. For HNO3, the wash water for the pump was titrated with NaOH (0.1 M) and Equation (8) was applied, while for H2SO4, knowing the sulfur content, Equation (9) can be applied:
QN,S = 1.43 × VNaOH,
where QN,S is the heat contribution relative to nitric acid formation (cal) and VNaOH is the volume of NaOH used in the titration of the wash water of the pump (mL).
QS,add = 13.61 × wS,db,
where QS,add is the additional contribution relative to sulfur dioxide formation and wS,db is the sulfur content on a dry basis (%).
With this information, Equation (10) can be applied to obtain the gross calorific value, or high heating value, at a constant volume, qV,gr (J/g):
q V , gr = ( ε   ×   θ   -   Q thread   -   Q N , S m -   Q S , add )   ×   4.1868 ,
where ε is the calorific capacity of the calorimeter (previously determined) (cal/°C), θ is the corrected temperature increase (°C), Qthread is the heat contribution relative to the thread combustion (cal), QN,S is the heat contribution relative to nitric acid formation (cal), QS,add is the additional contribution relative to sulfur dioxide formation (cal), and m is the mass of the sample (g).
Equation (11) was used to calculate the gross calorific value at constant volume on a dry basis, qV,gr,db (J/g):
q V , gr , db = q V , gr   ×   100 100   -   M ad ,
where qV,gr,db is the gross calorific value at constant volume (J/g) and Mad is the moisture content in the analysis test sample (%). Lastly, the net calorific value at constant pressure on a dry basis, qp,net,db (J/g), can be calculated through Equation (12):
q   p , net , db = q V , gr , db     212.2   ×   w H , db   -   0.8   ×   ( w O , db + w N , db )   ,
where qV,gr,db is the gross calorific value at constant volume on a dry basis (J/g), wH,db is the hydrogen content on a dry basis (%), wO,db is the oxygen content on a dry basis (%), and wN,db is the nitrogen content on a dry basis (%). It should be noted that the oxygen content used in Equation (12) is not the same as that calculated in Equation (13). According to the European standard EN14918, (wO,db + wN,db) is obtained from Equation (13):
( w O , db +   W N , db ) = 100   w A , db   w C , db   w H , db   w S , db ,
where wA,db is the ash content on a dry basis (%), wC,db is the carbon content on a dry basis (%), wH,db is the hydrogen content on a dry basis (%), and wS,db is the sulfur content on a dry basis (%).

3.3.7. Energy Density and Mass and Energy Yield

Lastly, parameters such as the energy densification ratio (EDR), mass yield ratio (MYR), and energy yield (EY) were analyzed. The calculations were made using Equations (11)–(13), according to Grigiante and Antolini (2014) [94]:
EDR = HHV dried   torrefied   biomass HHV dried   raw   biomass ,
where HHVdried torrefied biomass is the high heating value of the dried torrefied biomass and HHVdried raw biomass is the high heating value of the dried raw biomass.
MYR   ( % ) = w dried   torrefied   biomass w dried   raw   biomass × 100 ,
where wdried torrefied biomass is the mass of the dried torrefied biomass and wdried raw biomass is the mass of the dried raw biomass.
EY   ( % ) = MYR   ×   EDR ,
where MYR is the mass yield ratio (%) and EDR is the energy densification ratio.

4. Results and Discussion

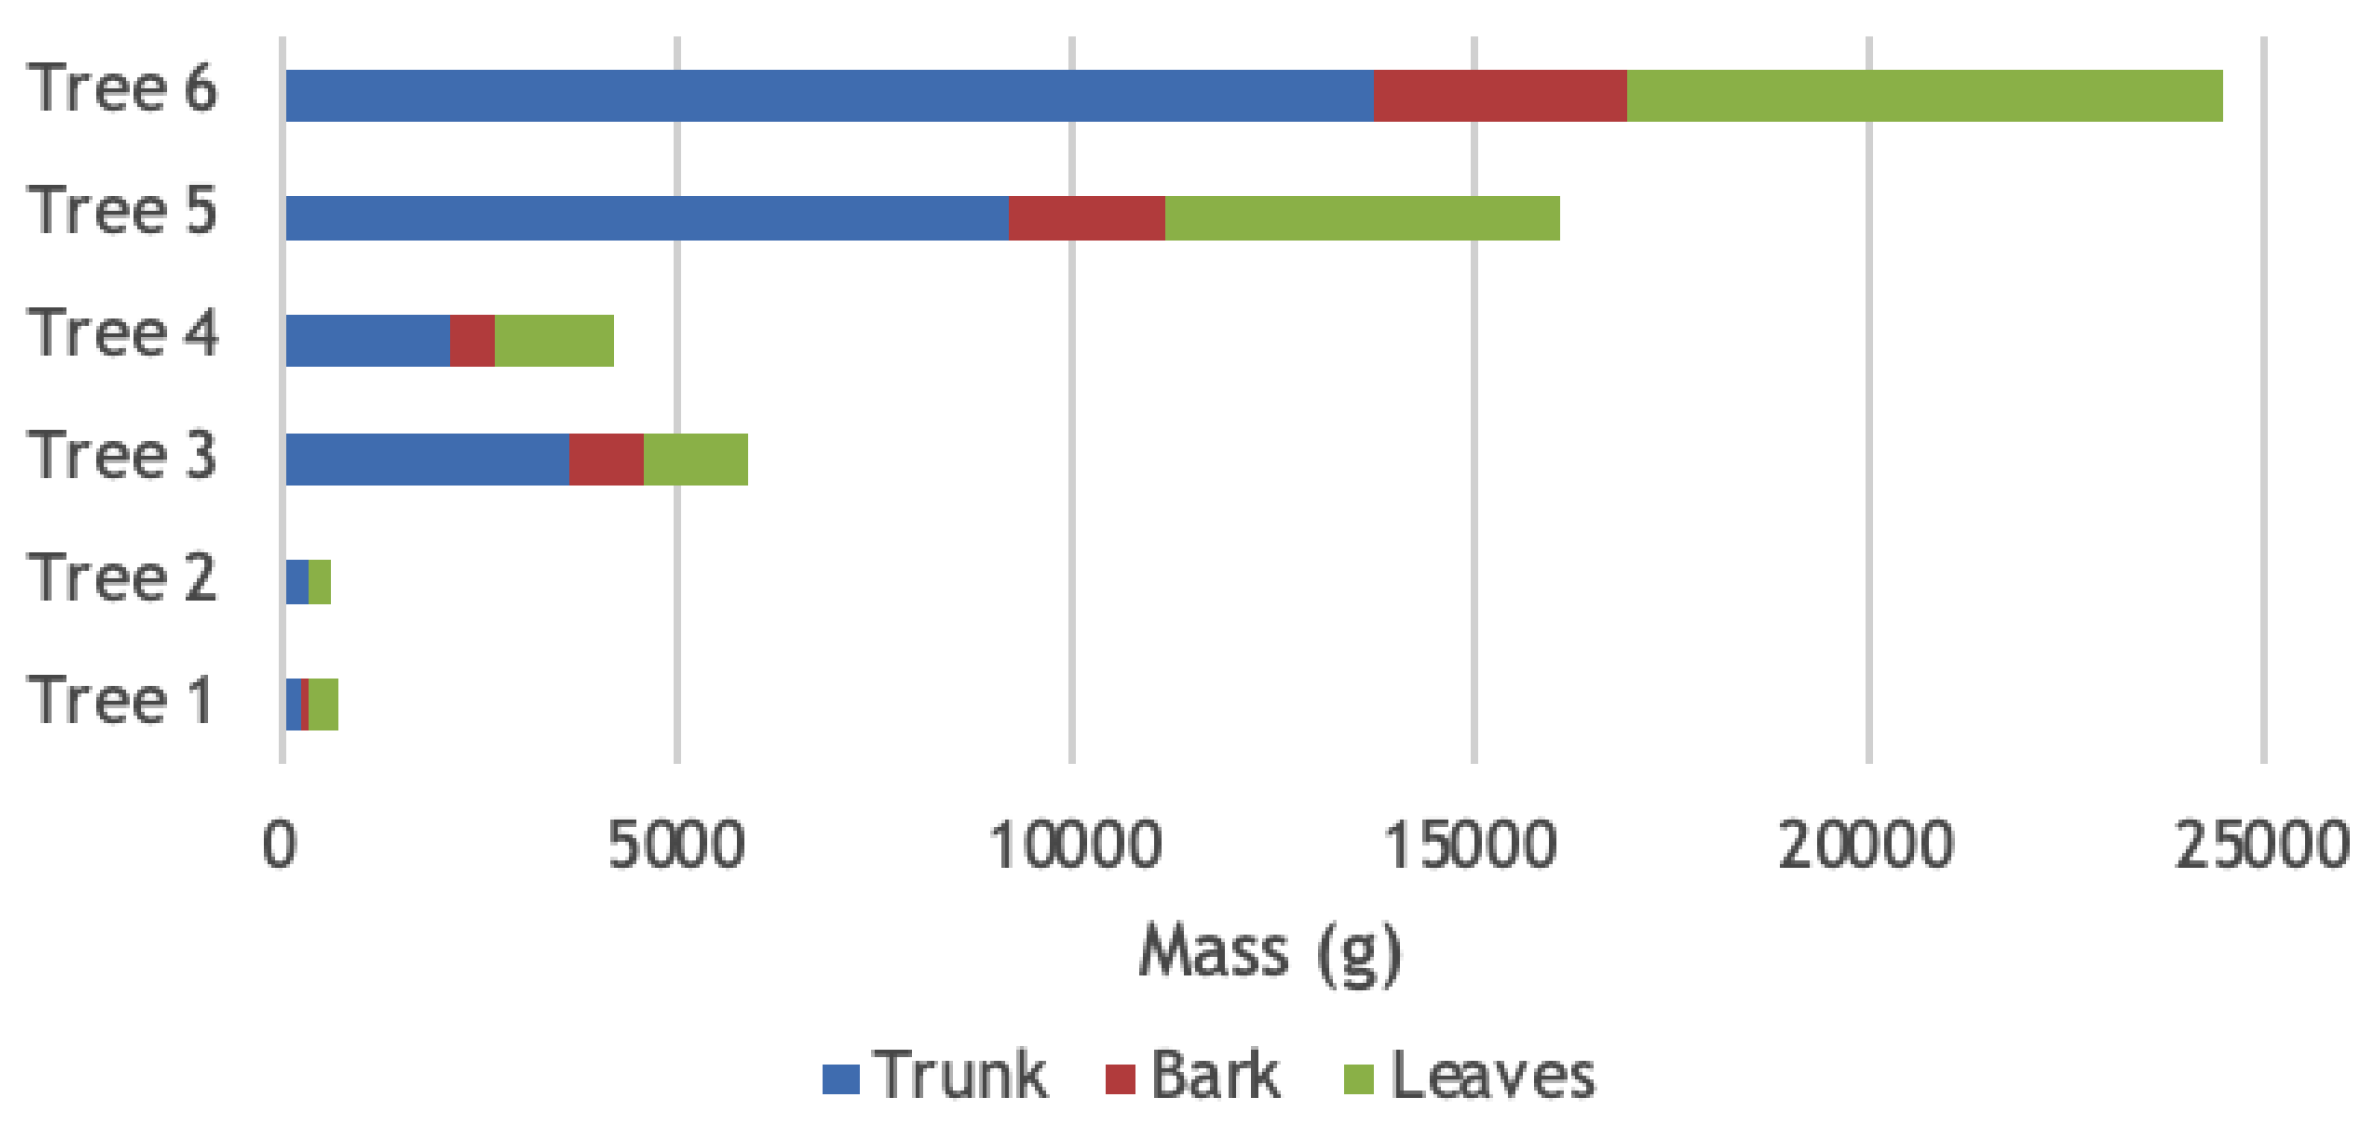
4.1. Mass Distribution and Initial Moisture Content

As mentioned above, the first task was to divide trees into trunks, bark, and leaves. All samples were weighed as soon as they were separated, and a portion of each sample followed to the forced air oven for initial moisture content determination. An example of the material before and after the procedure is presented in Figure 3.
The contribution of each section to the total mass of the tree can be seen in Figure 4. It is possible to observe that Trees 5 and 6 have a more significant contribution from the trunks, which is expected since it is denser. From that, it can be concluded that the older is the tree, the higher is the trunk contribution. All this information is vital since the focus of the pulp and paper industry are the trunks; the bark and leaves are important biomass components that should be used for other applications, such as to produce thermal or electric energy.
Initial moisture content is another essential factor, especially for energy purposes. Table 3 presents obtained results. Torrefaction process can be implemented as a pretreatment to improve this property for subsequent conversion processes.

4.2. Chlorine Content

Determination of the temperature at which chlorine disappears is the main focus of this project and this the first study conducted on this subject. The original chlorine content for E. globulus was approximately 0.04%, depending on its location, which agrees with the values obtained in previous studies [95,96]. As mentioned above, torrefaction processes were performed in nine different conditions for subsequent analysis. Table 2 presents the temperature stages for tests Tor 1 to Tor 9, and the chlorine content variation for the process is presented in Table 4, Table 5, Table 6, Table 7, Table 8, Table 9, Table 10, Table 11, Table 12 and Table 13.
From the data, it is noticeable that chlorine content is undetectable for most of the samples. A possible explanation for some residual chlorine is that during the tests, the element remained attached to the aluminum foil that wrapped the samples, which would not happen in an industrial procedure. Once the chlorine content was already zero for the less intense torrefaction, Tor 1, it was not possible to determine the temperature at which chlorine disappears. This observation is of particular importance, as it allows to deduce that it is possible to eliminate chlorine at lower temperatures than those used during torrefaction process. That is, most likely, it will be possible to eliminate chlorine in more intense drying processes, thus avoiding damages caused by chlorine in the torrefaction equipment, such as those reported by Nunes (2020) [70]. However, this aspect must be confirmed by new research, since it is also necessary to determine whether if, in addition to temperature, residence time also has a direct influence on the chlorine elimination process, or if it is capable, as an alternative to the increment in temperature, to contribute to the acceleration of the process. Thus, considering the use of an industrial scale process, after measuring the temperature, it may be sufficient to subject the materials to be treated, to a longer residence time.

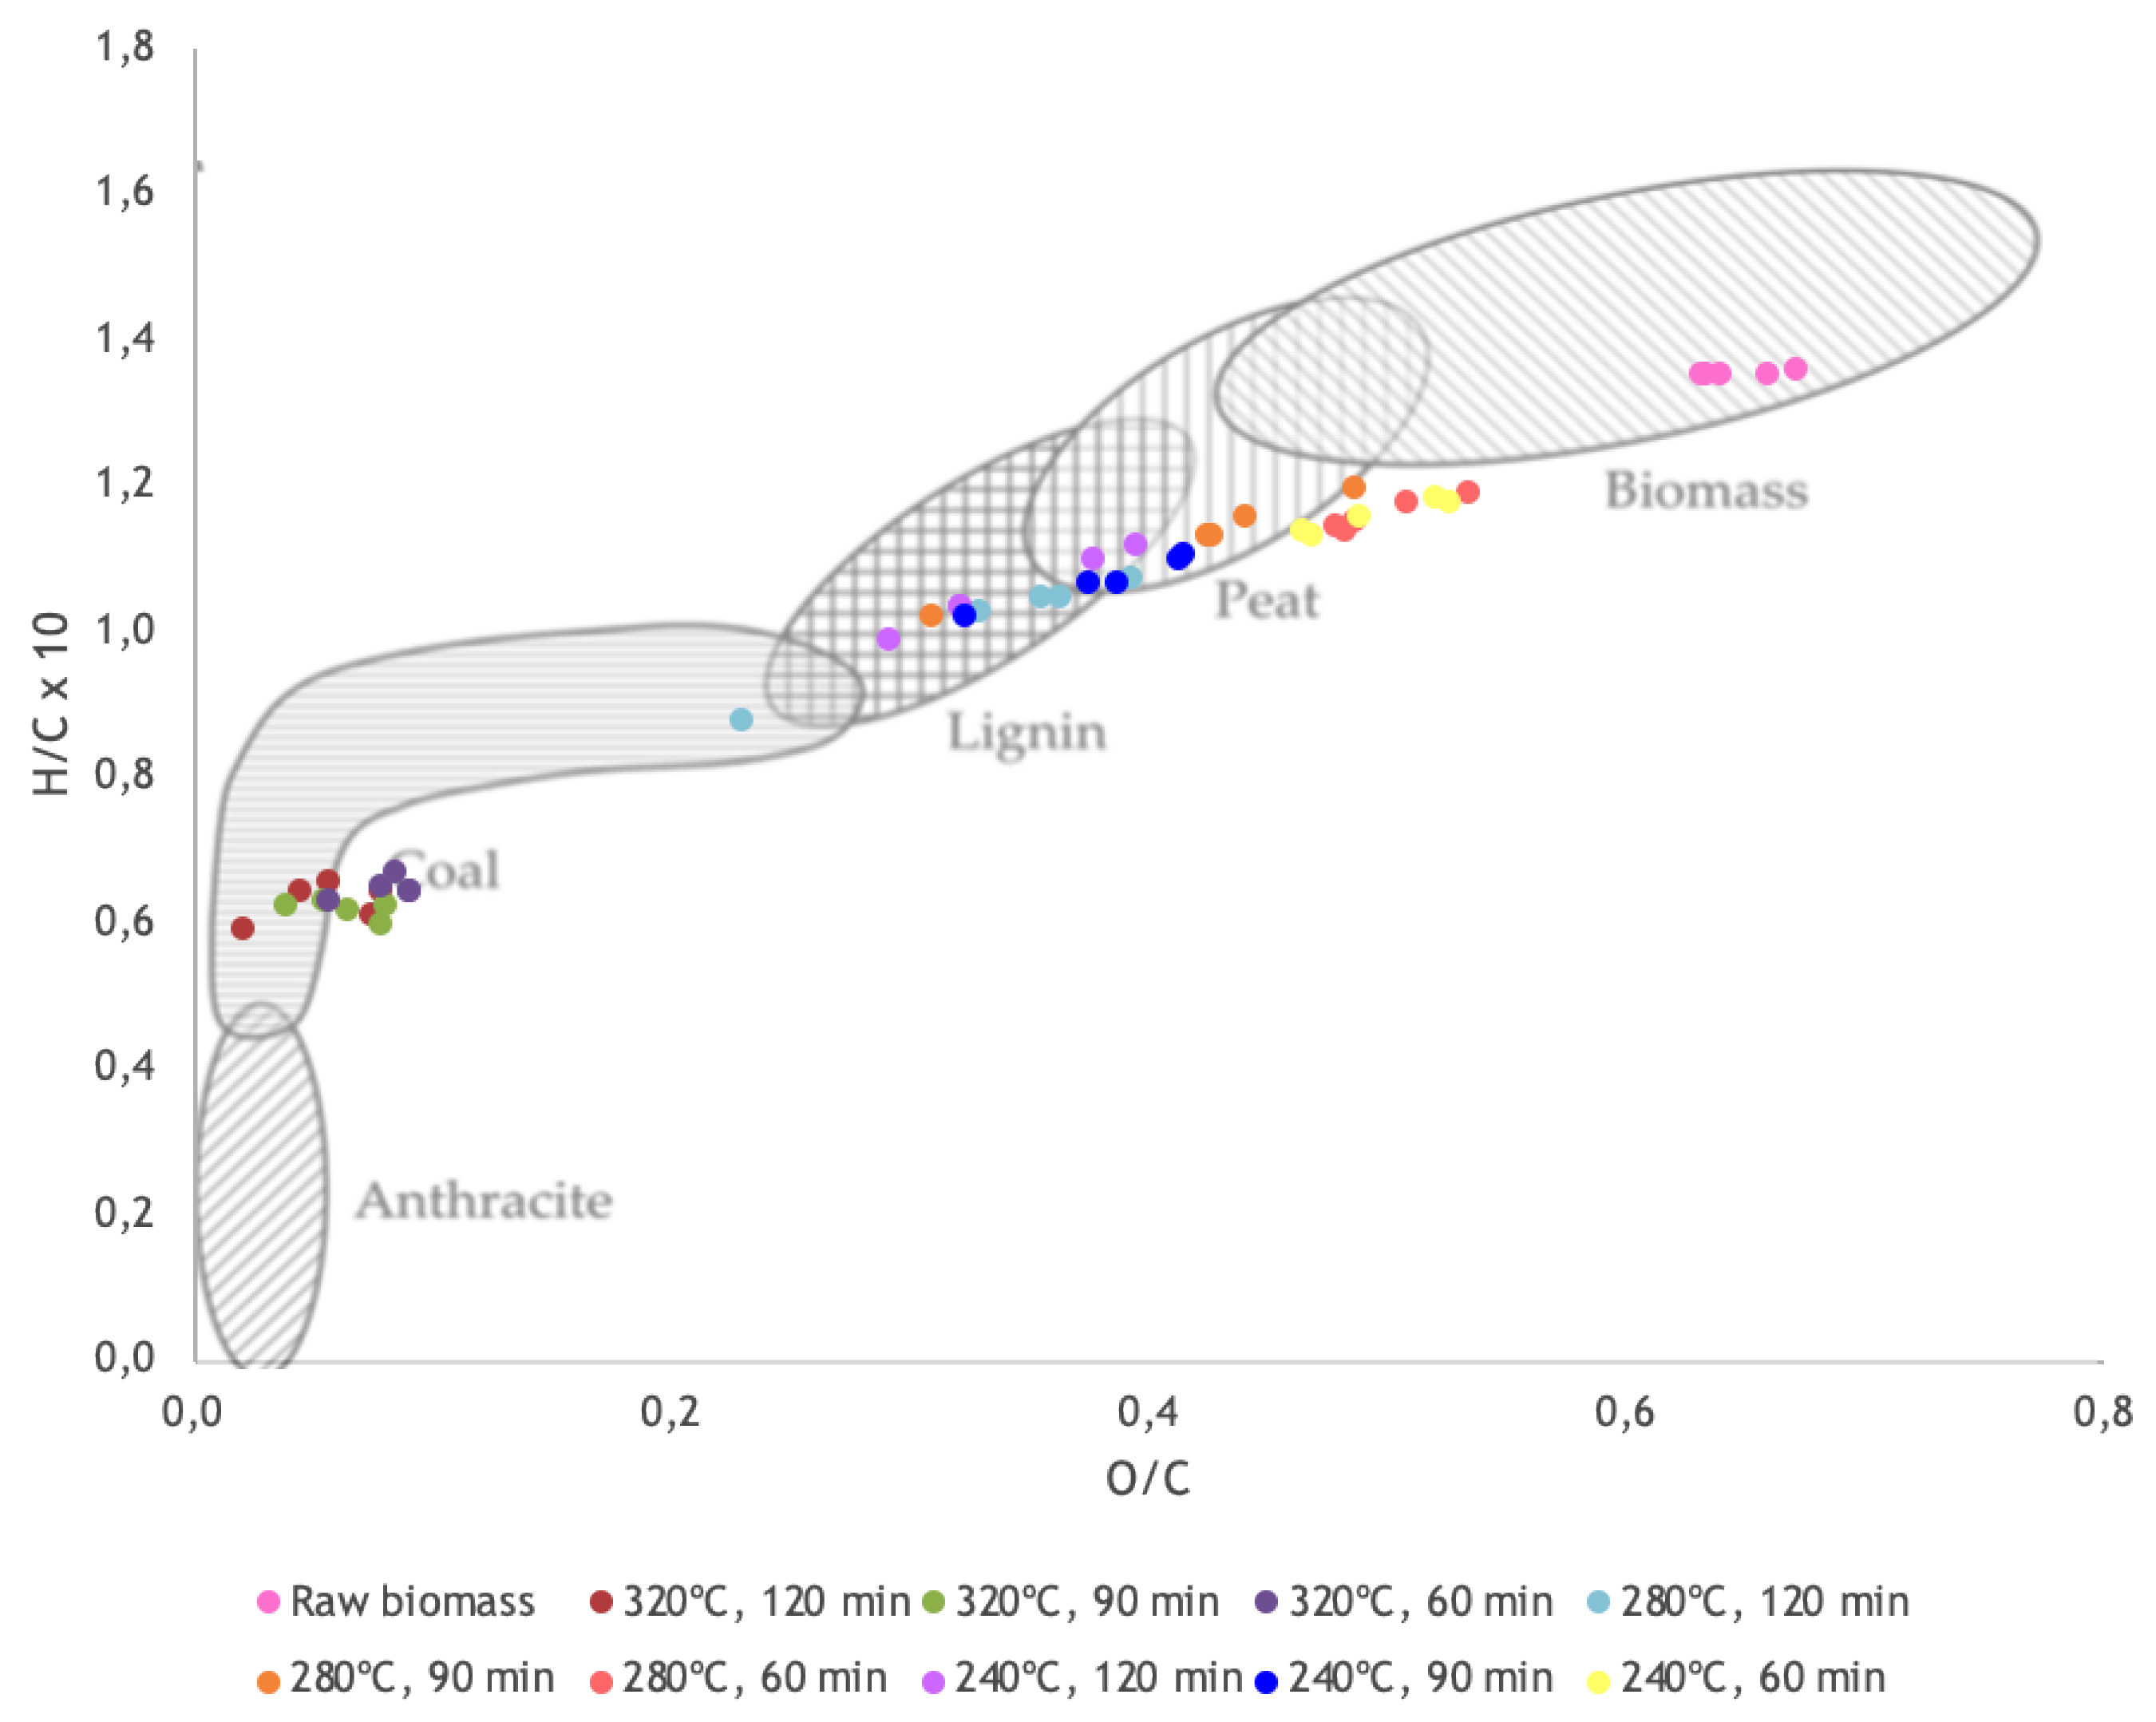
4.3. Elemental Analysis

Elemental analysis was performed in a CHN elemental analyzer. However, for calculation of the oxygen content, sulfur and chlorine content were also used, as stated in Equation (7). Prior to torrefaction, sulfur content was obtained through ICP-OES since it was not possible to perform this analysis afterwards and the initial content was already low. A behavior similar to chlorine was assumed for calculation purposes. Chlorine content was obtained through chloride titration both before and after torrefaction. Carbon content increased with torrefaction and was intensified with higher temperatures, while hydrogen content displayed the opposite response.
Table 4, Table 5, Table 6, Table 7, Table 8, Table 9, Table 10, Table 11, Table 12 and Table 13 present the results obtained for CHN, including the calculated oxygen content. From the results, it was possible to calculate the H/C and O/C ratios to be used in the van Krevelen diagram, presented in Figure 5.
Through the analysis of Figure 5, it is possible to see that samples that were torrefied at 320 °C are close to the Coal zone of the diagram, as expected. During torrefaction, oxygen and hydrogen are removed from the samples, leading to a solid product with lower O/C and H/C ratios. Samples that went through less intense torrefaction at 280 and 240 °C, showed an improvement when compared to initial raw biomass, even though H/C and O/C ratios were still high when compared to coal.

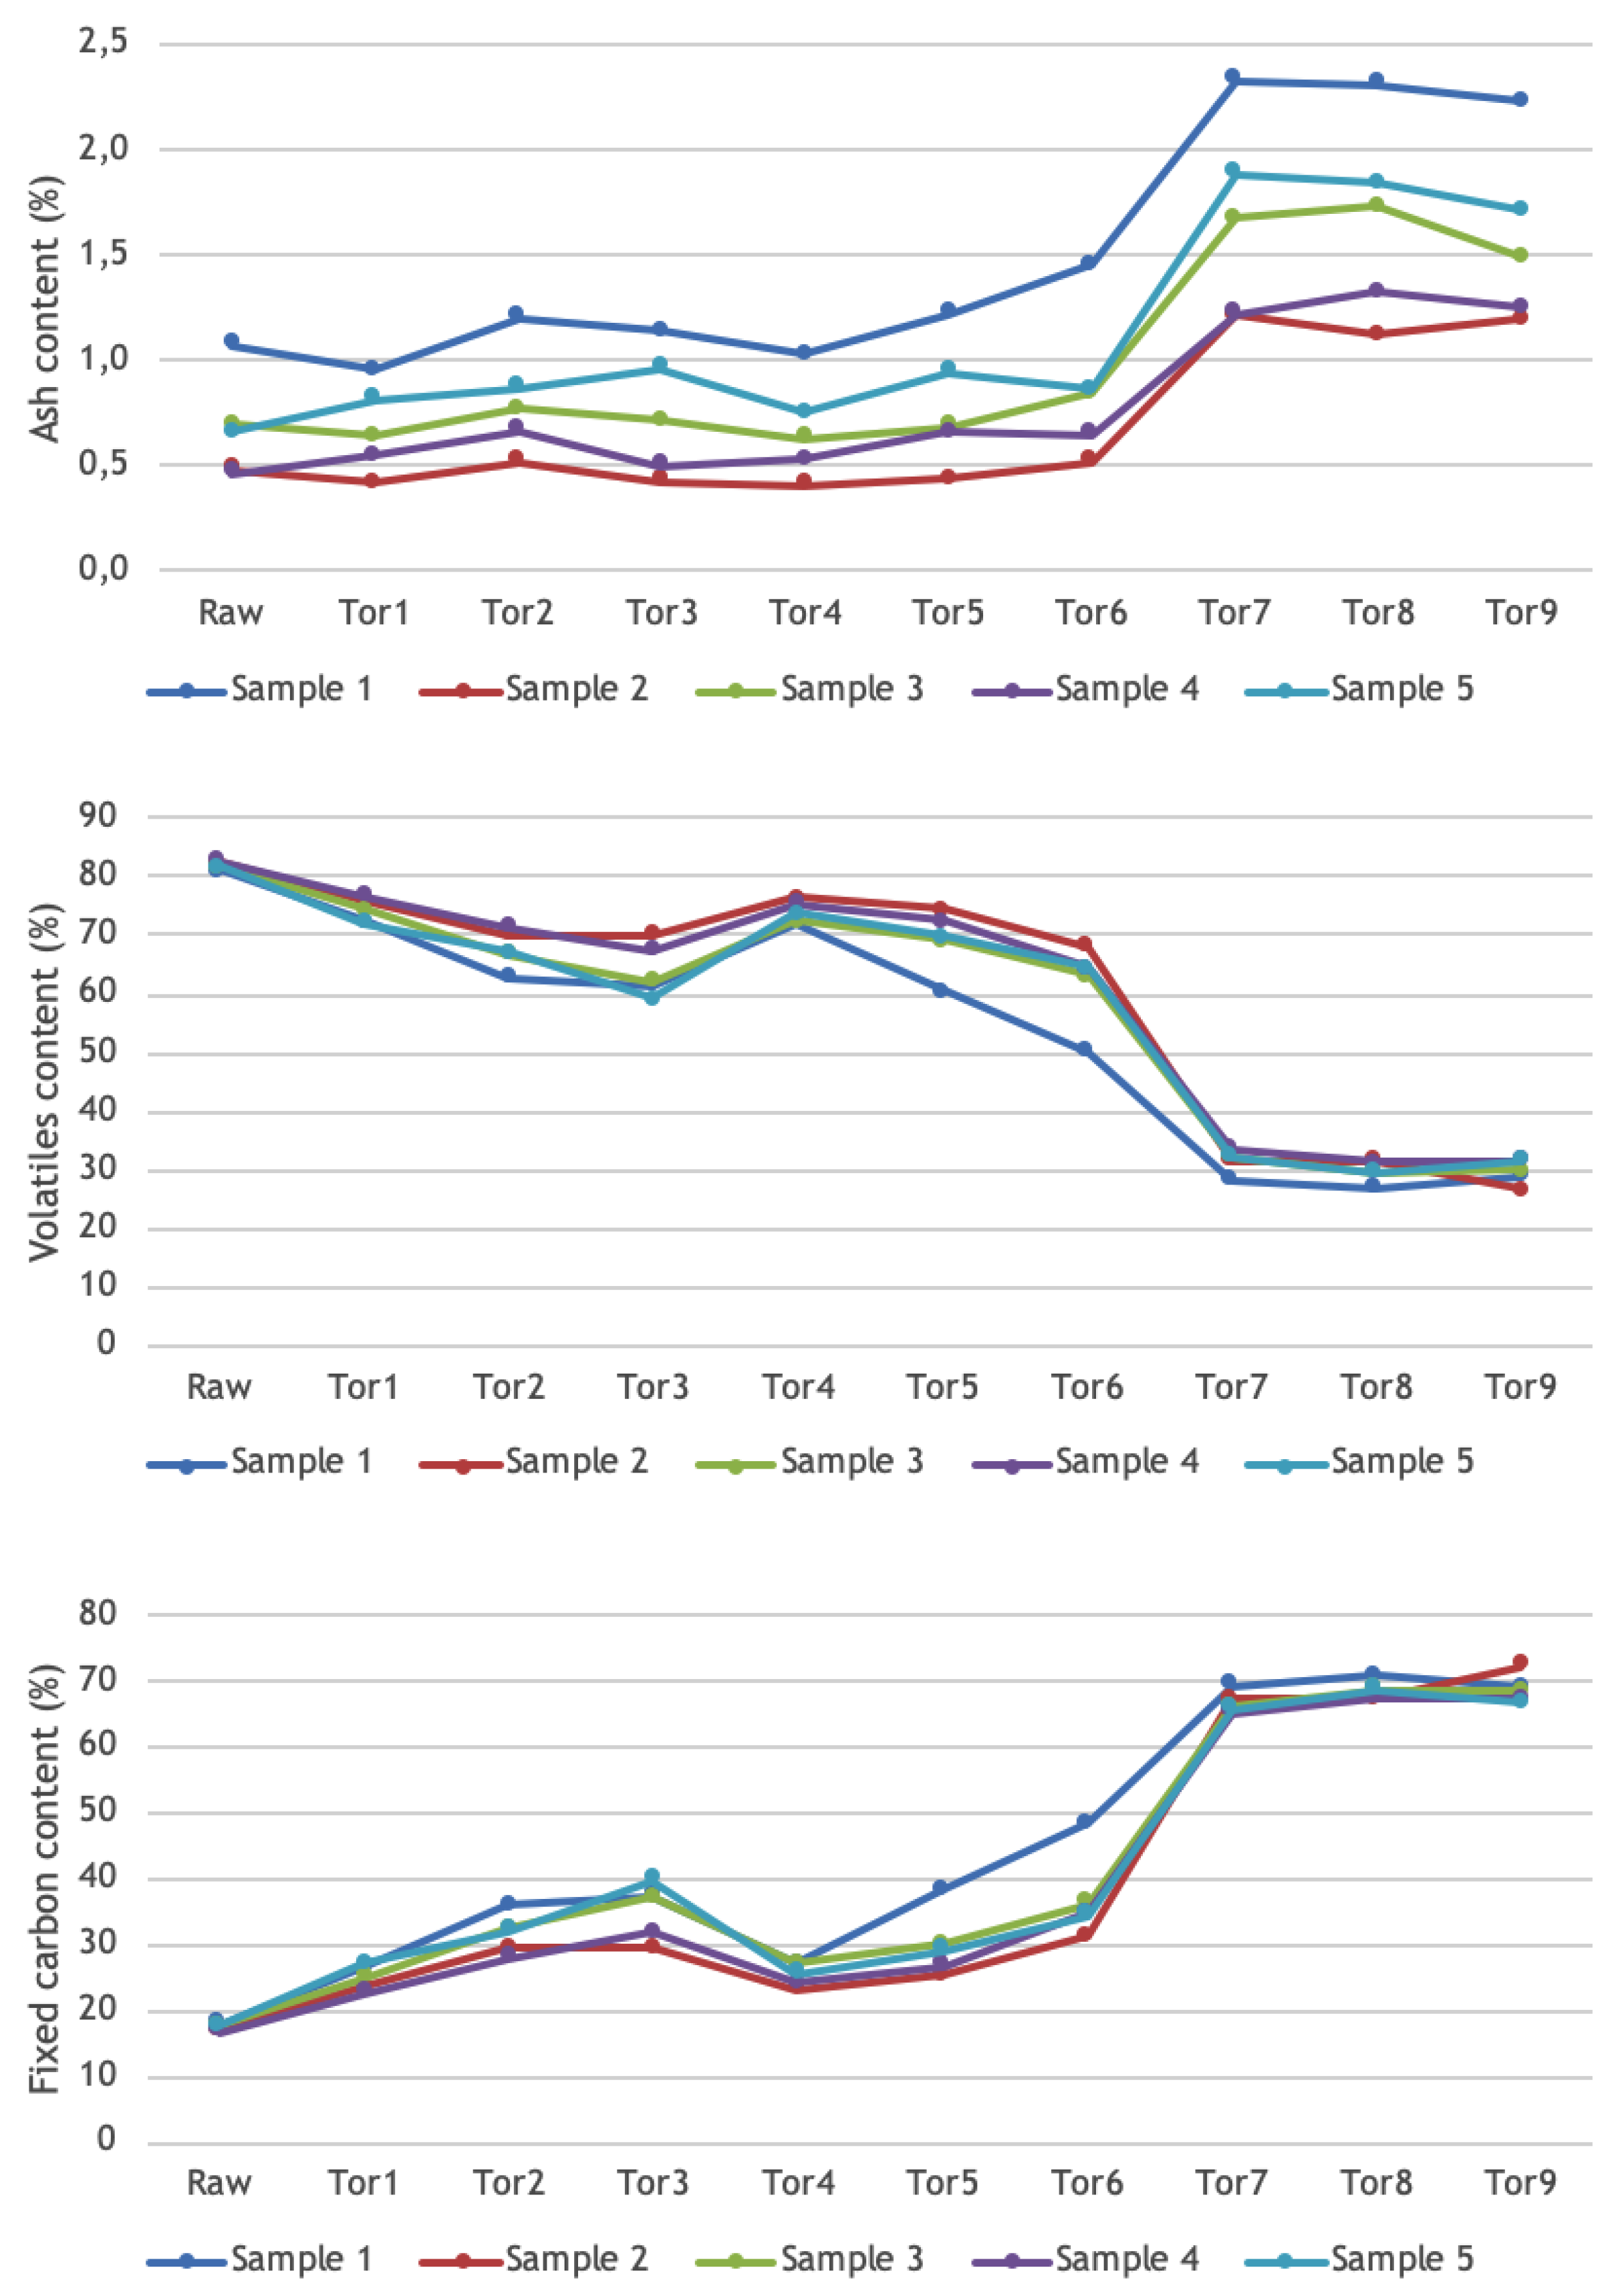
4.4. Proximate Analysis
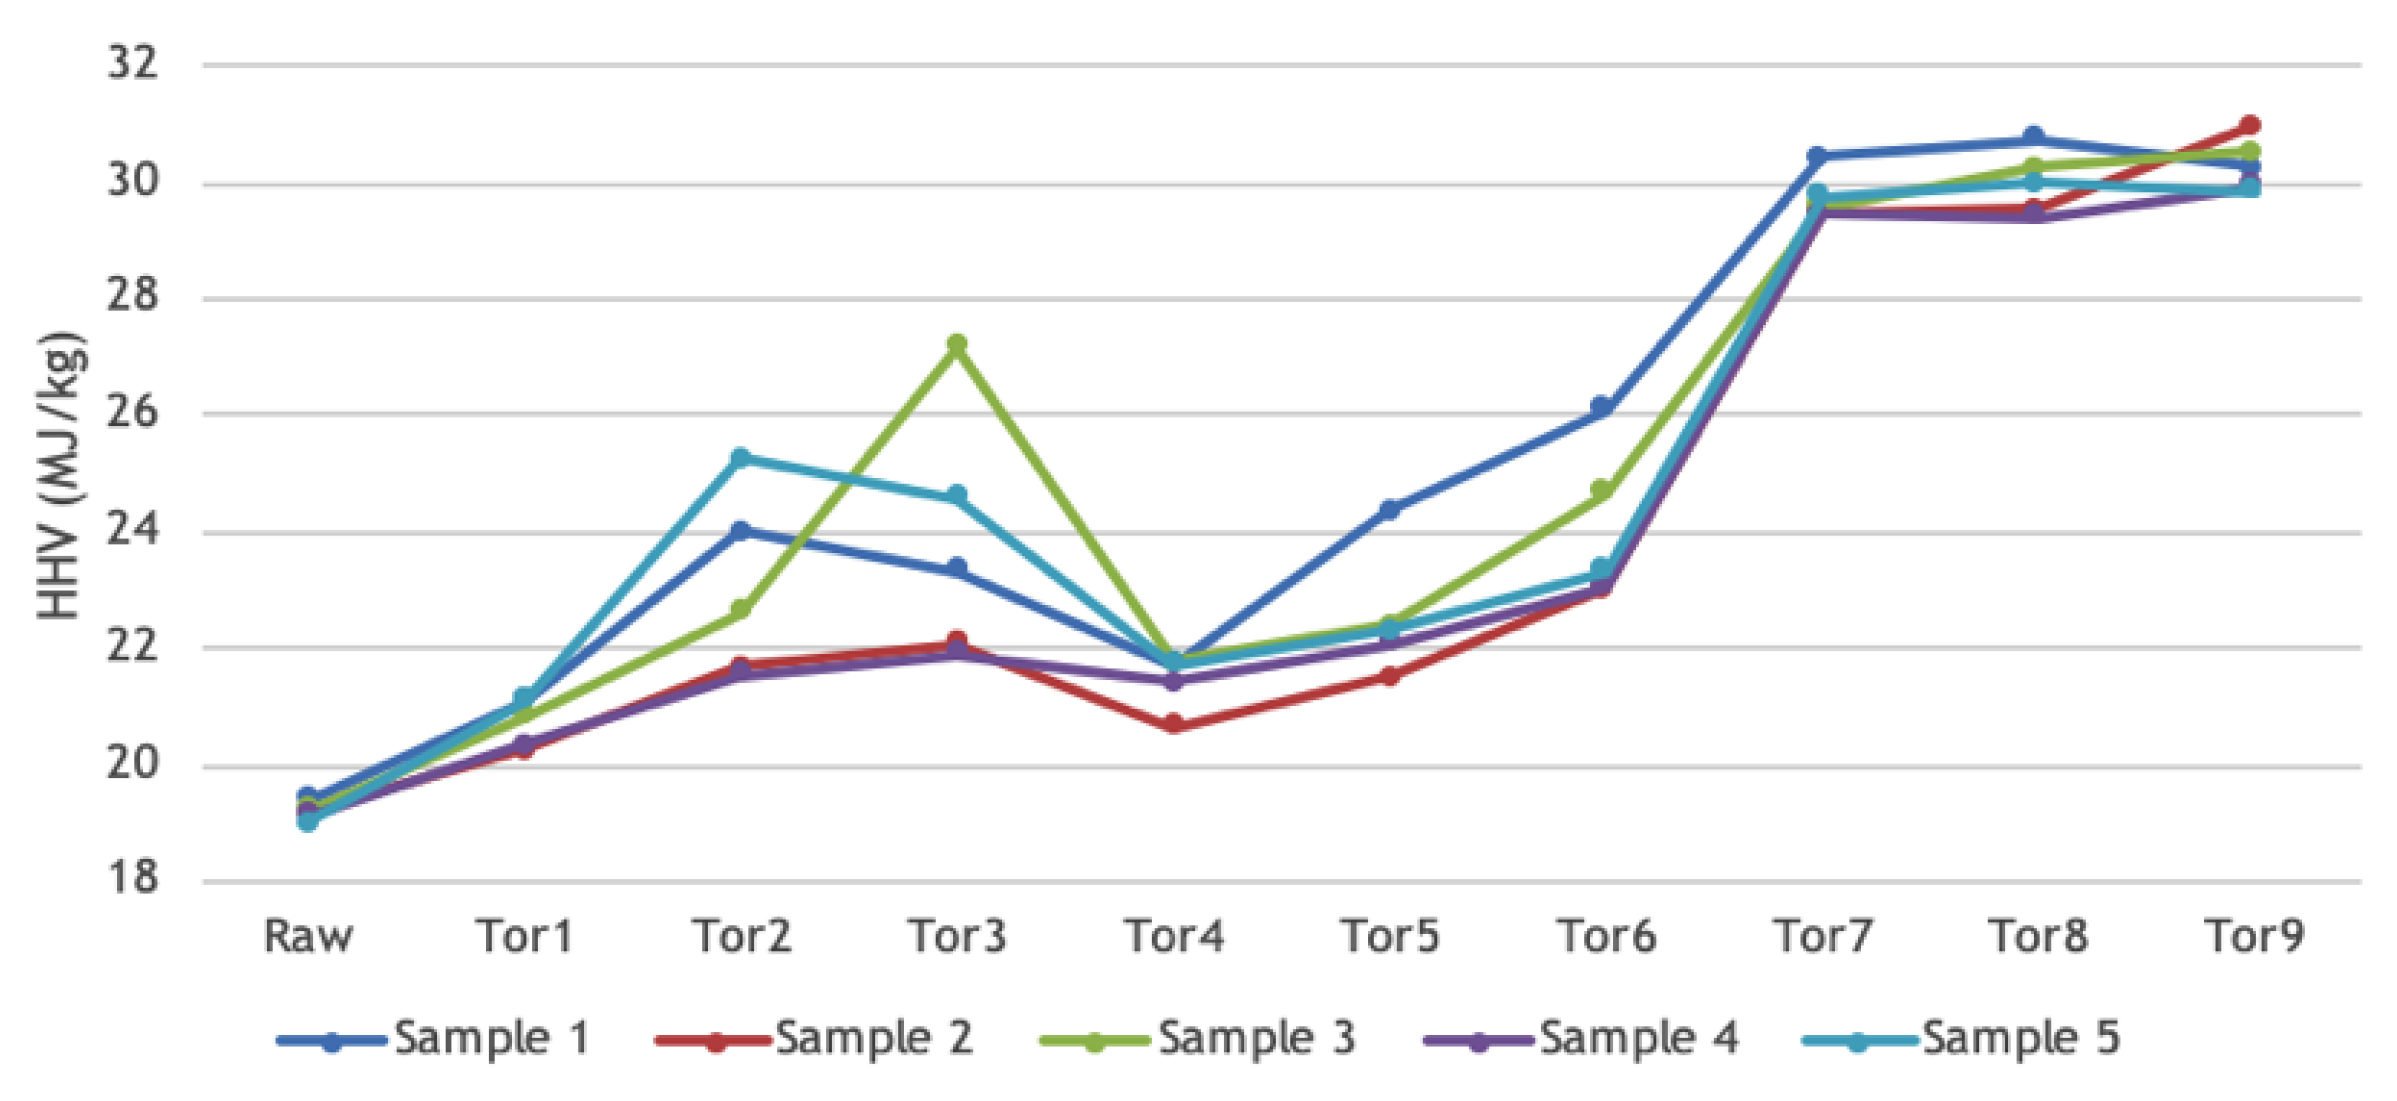
As torrefaction severity increases, both fixed carbon and ash content present in biomass also increase. However, volatile content presents an opposite behavior. Ash content has a significant impact on the process, especially in terms of operating costs. Studies have shown that high ash content leads to fouling and slagging phenomena, which can damage the equipment used in the process. From the results presented in Figure 6, it is possible to confirm that ash content increases with torrefaction at higher temperatures, and fixed carbon increases and volatiles decrease with an increment in temperature. Moreover, it is noticeable that the two properties presented opposite behavior.

4.5. Heating Value

Heating value of the samples was obtained through calorimetry. Results are presented in Figure 7. Due to the high values of HHV for the torrefied samples, the calorimeter presented some problems. Although the analysis was performed in triplicate, only the two closest results were used in accordance with the European standard. In Figure 7, it is possible to see that, even though most of the samples presented the expected results, not all of them did. When compared to raw biomass, an increment in HHV of 58% after torrefaction is in accordance with Chew et al. (2011) [97].

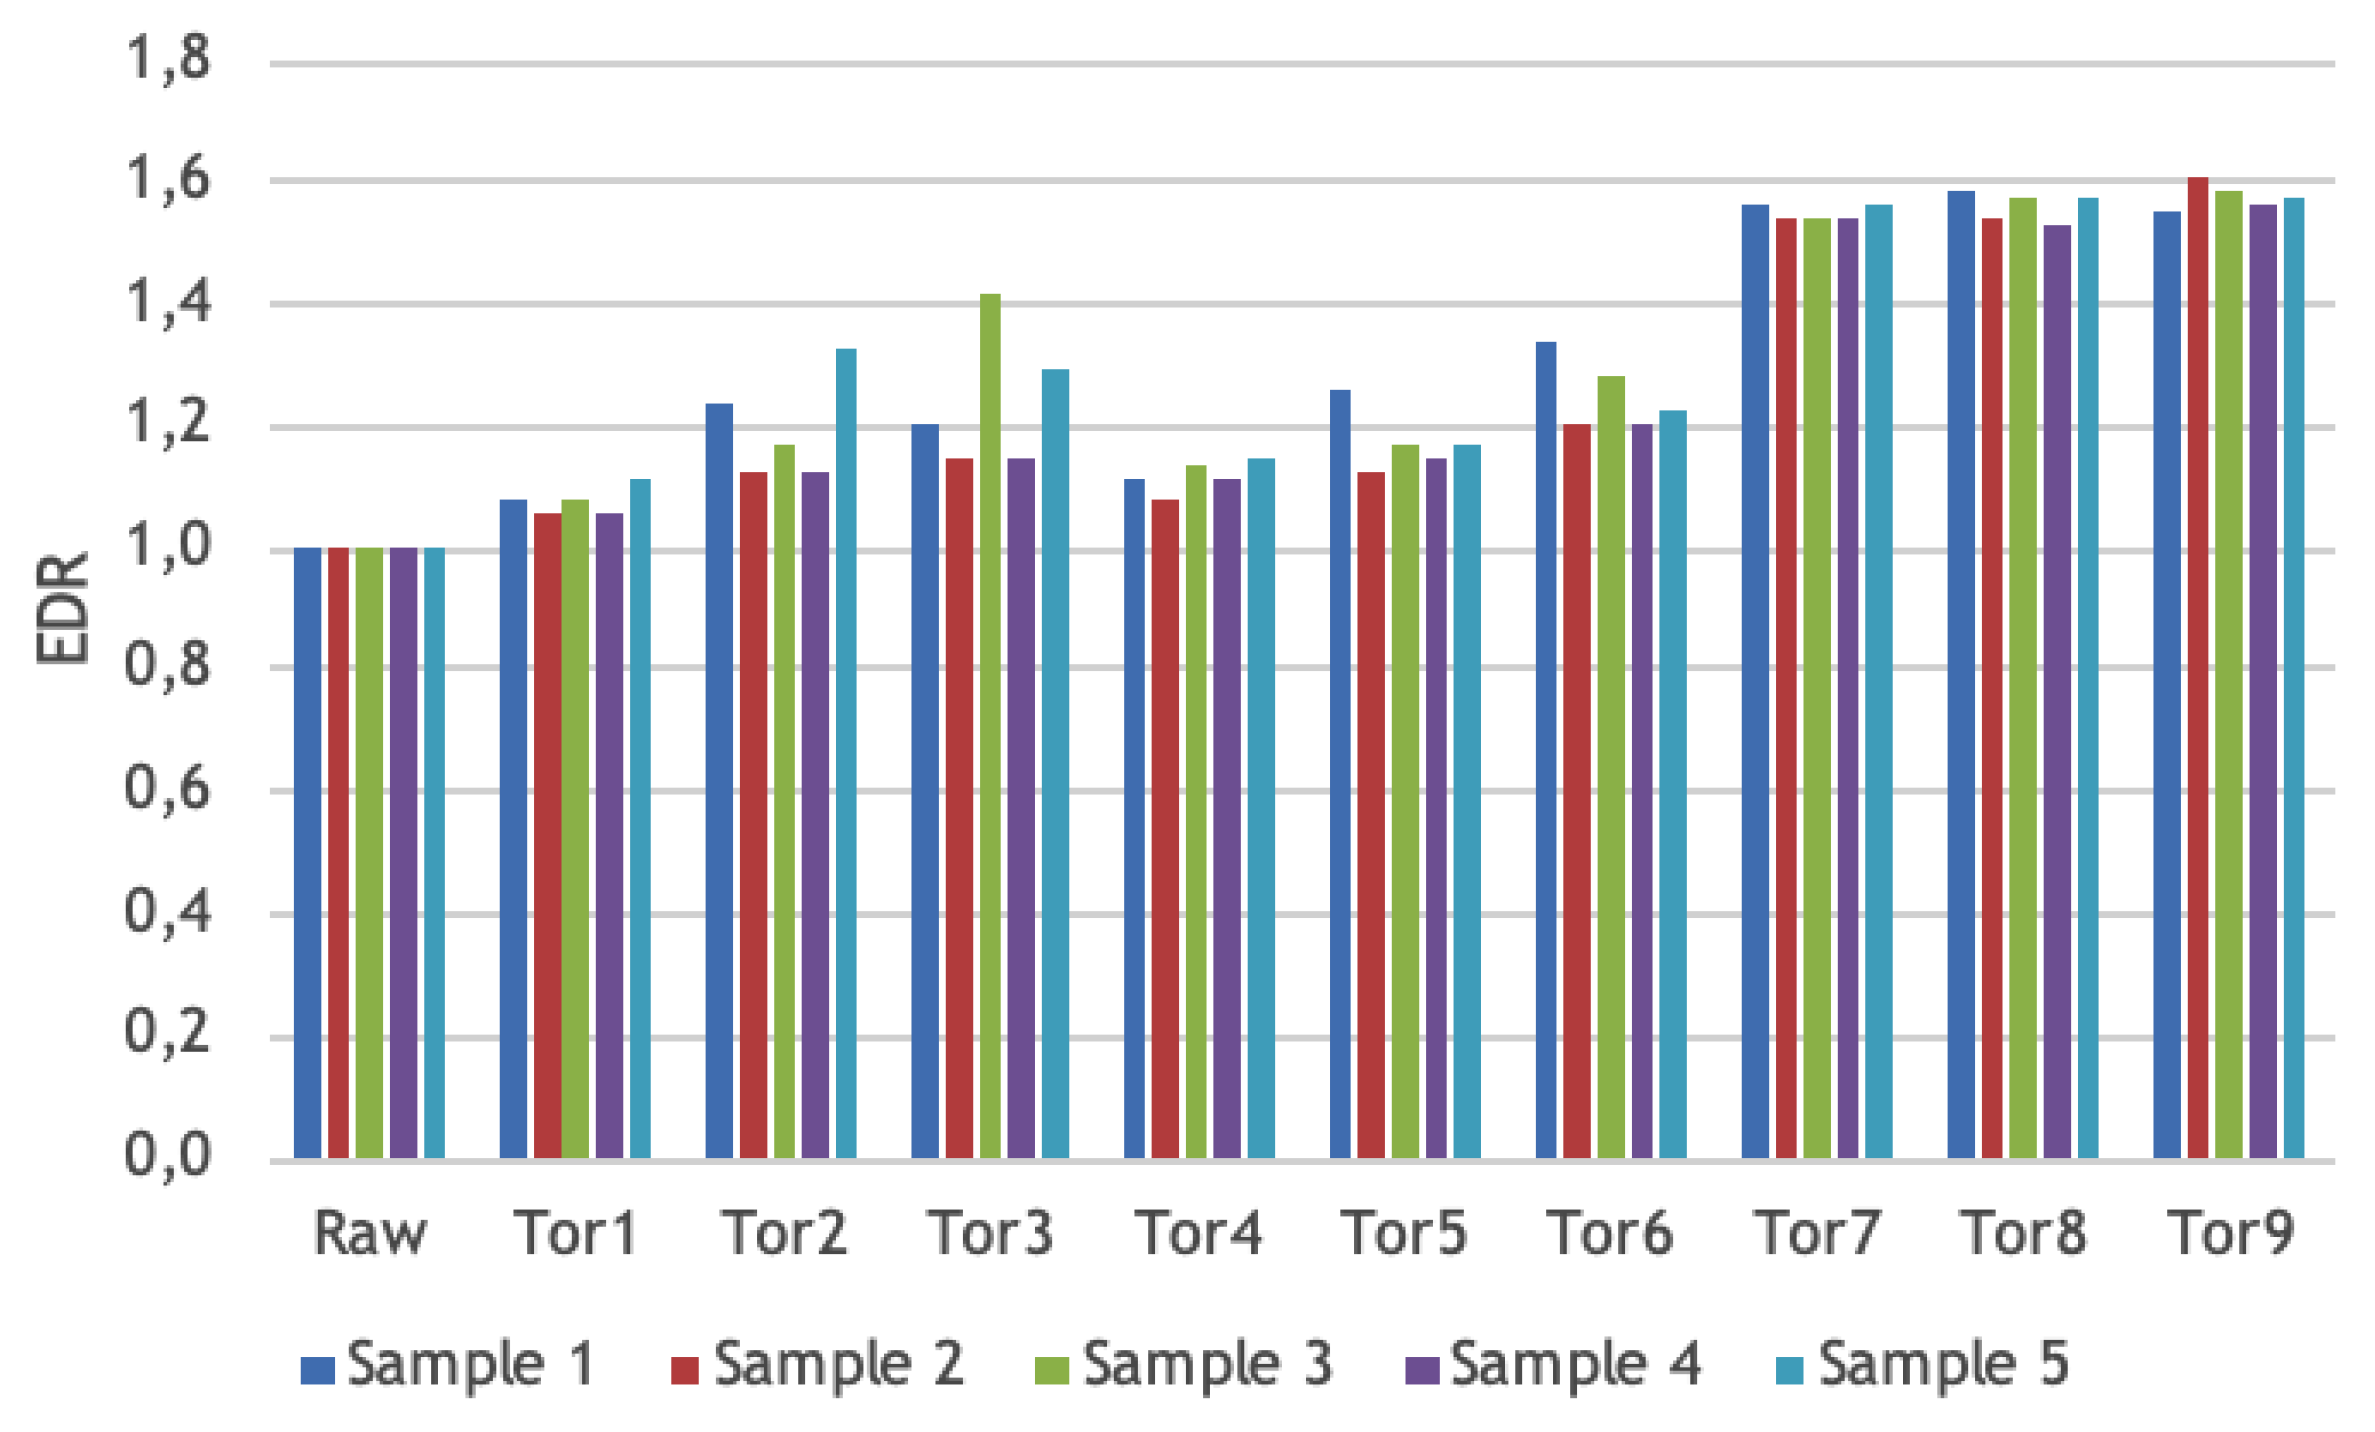
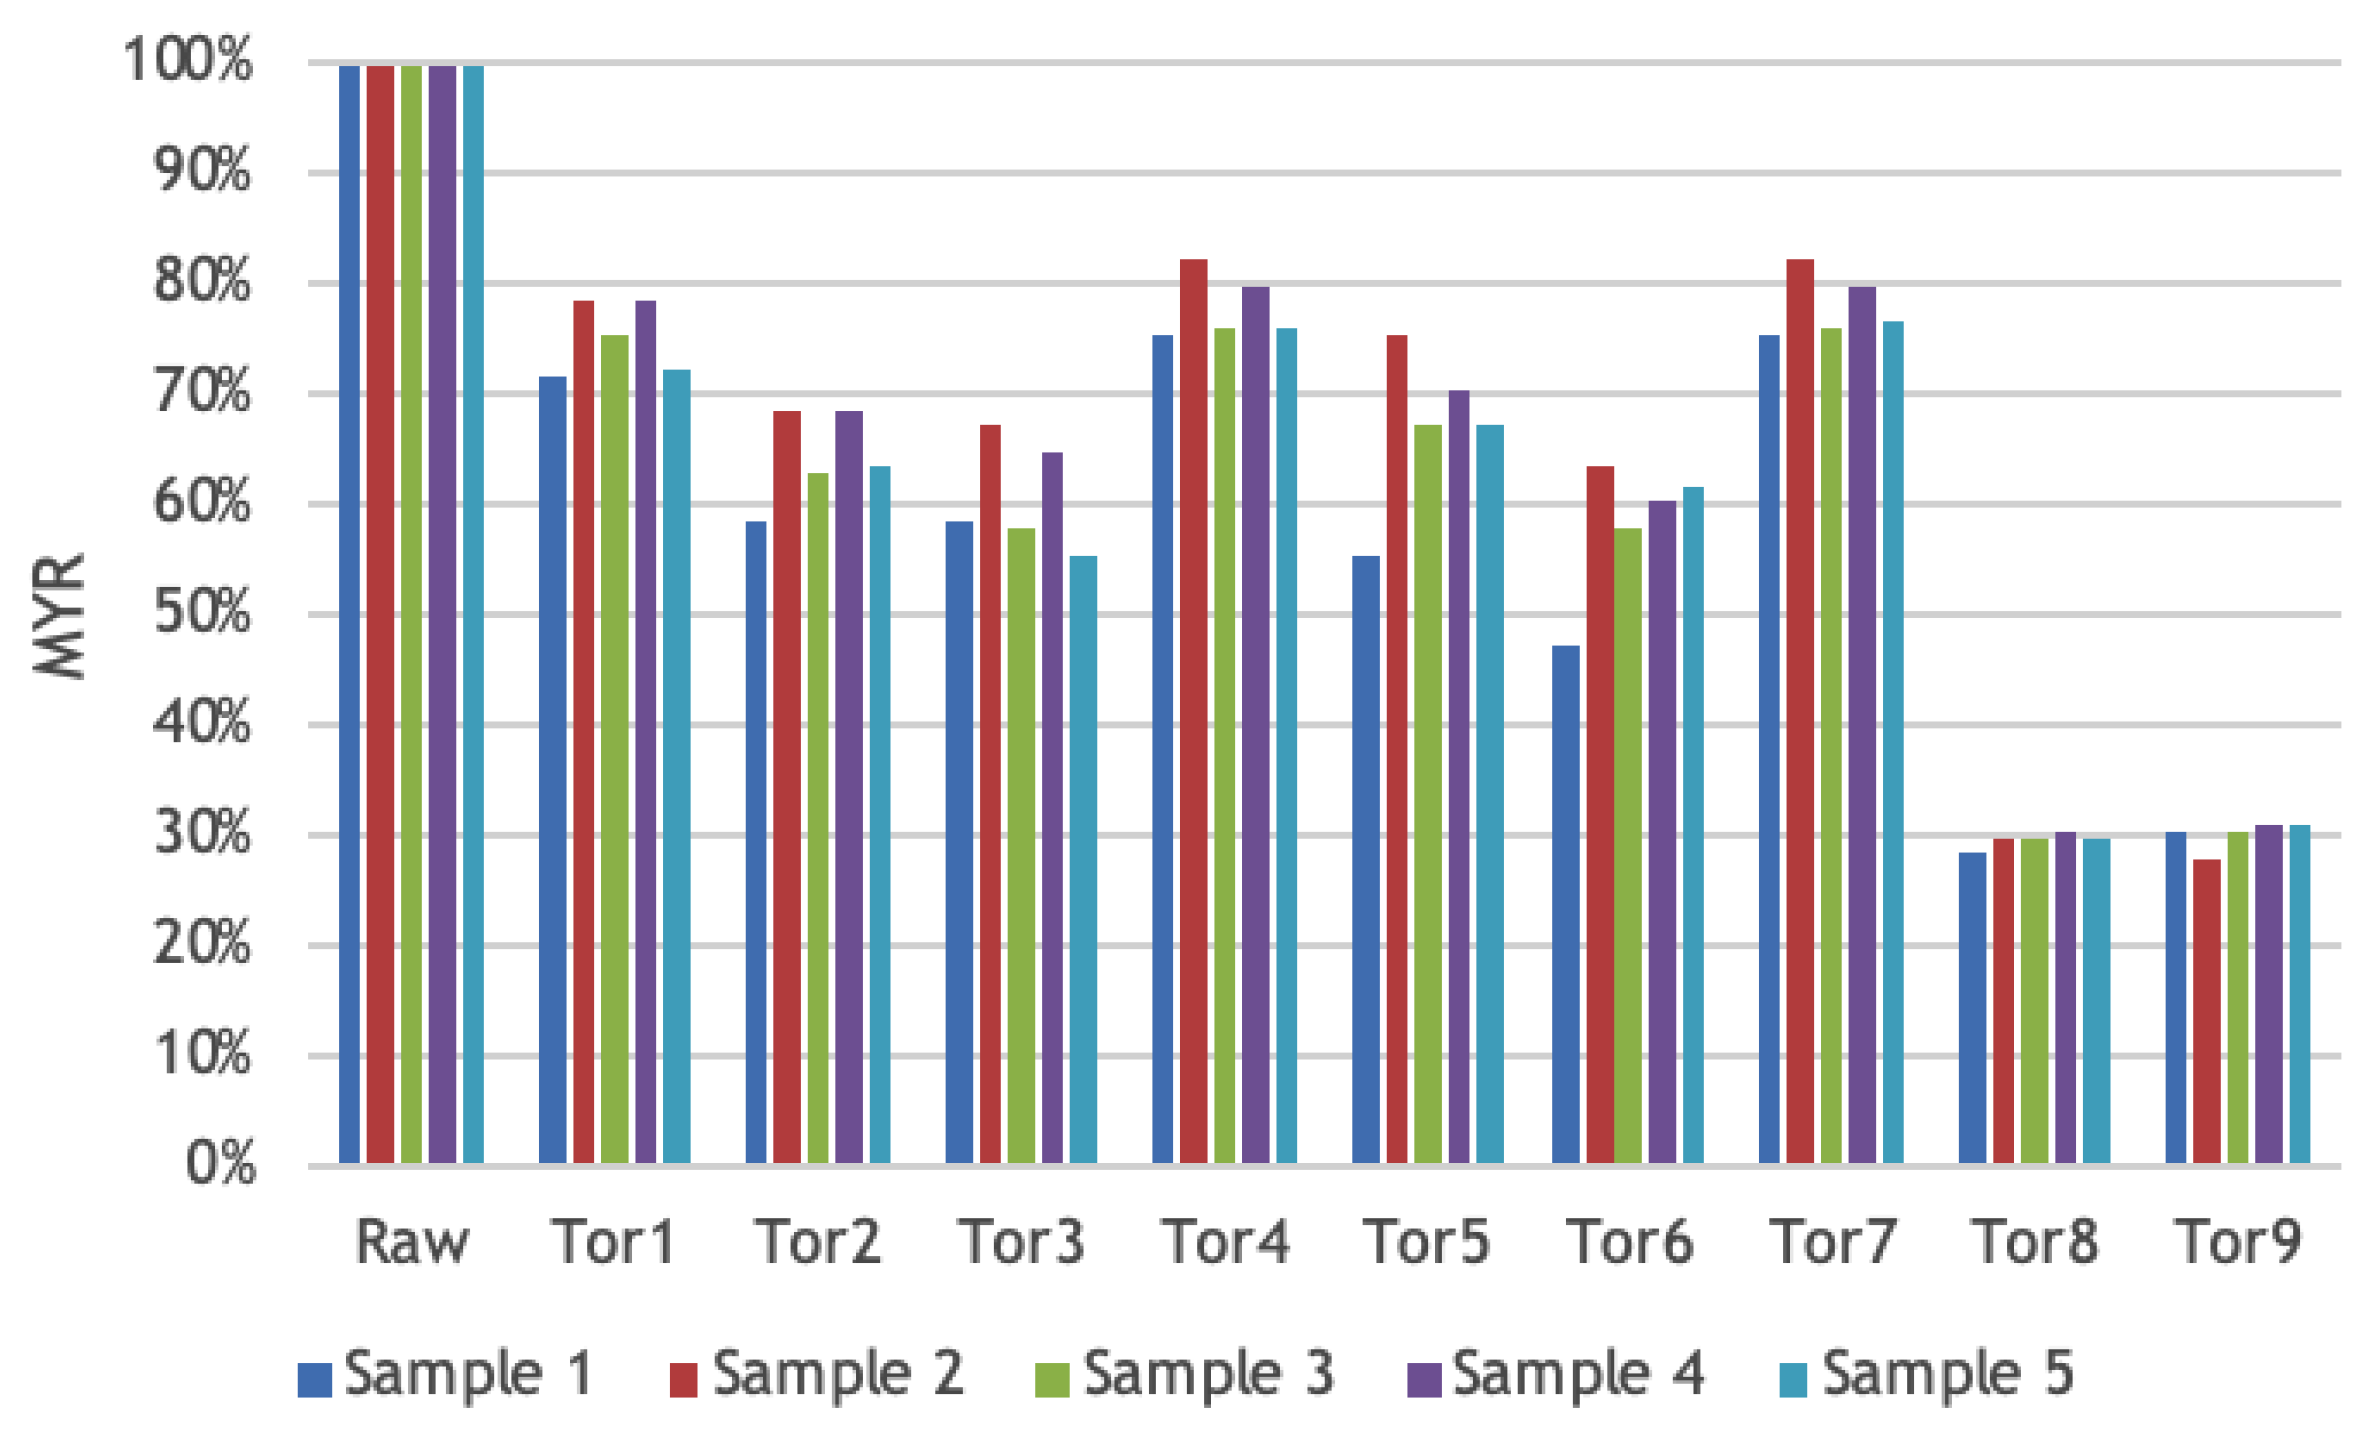
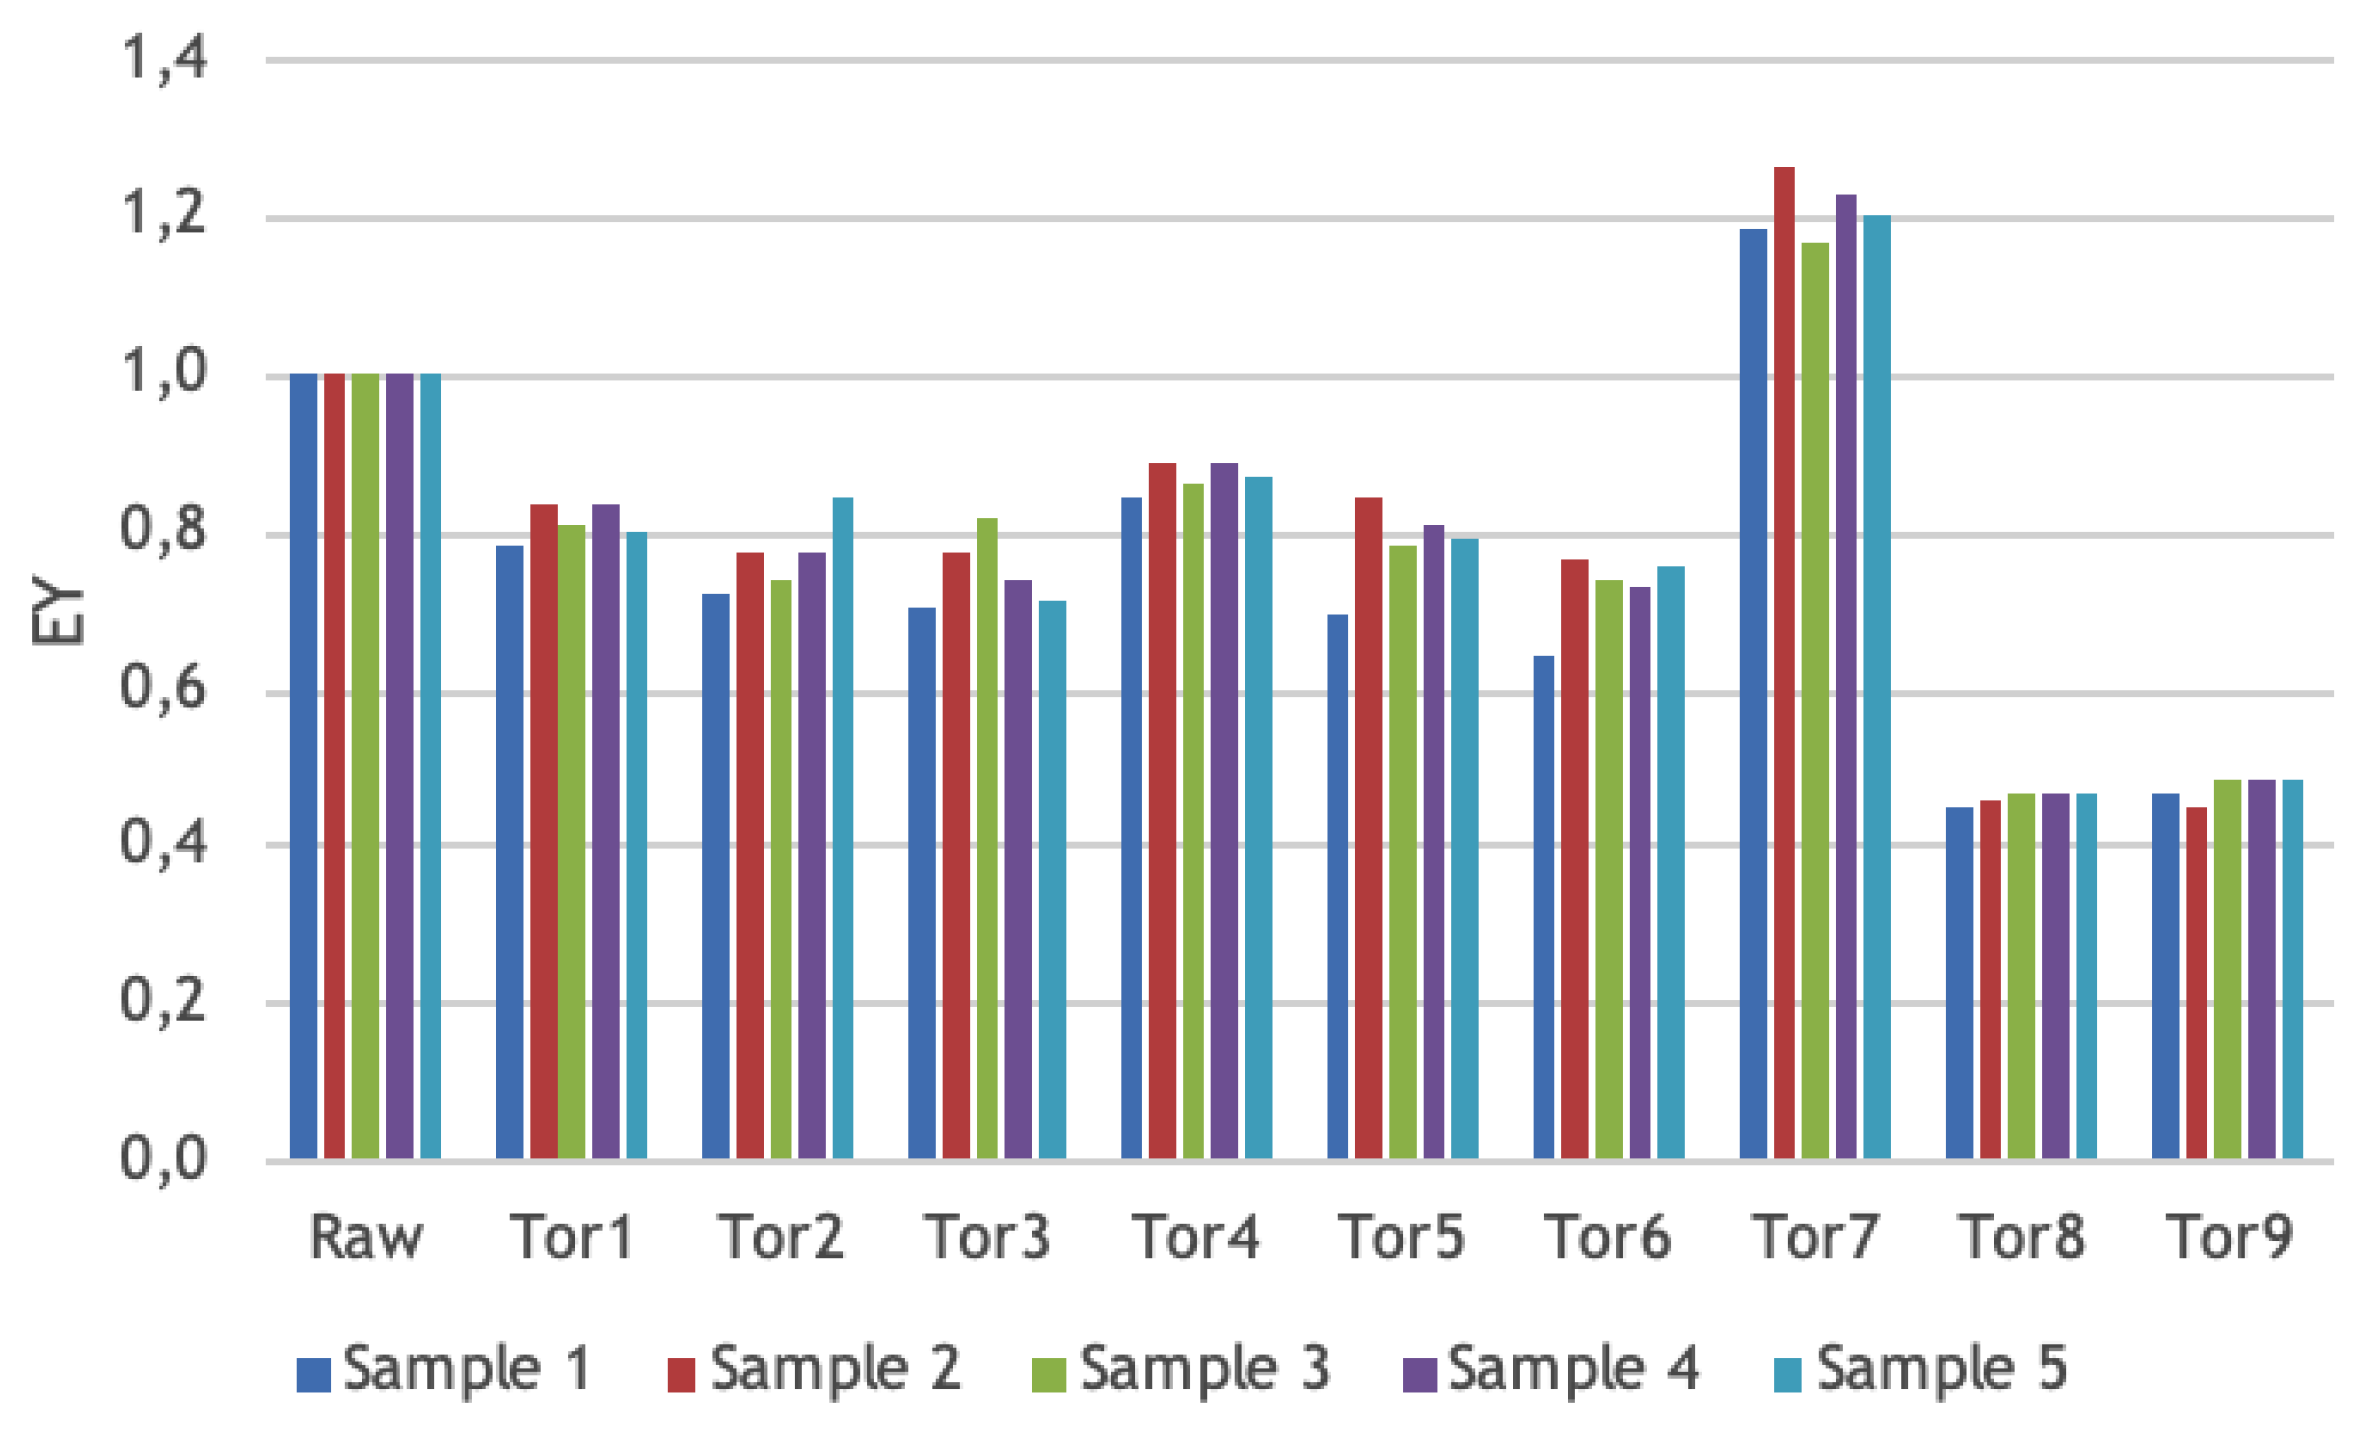
4.6. Energy Density and Mass and Energy Yield

From the values obtained through calorimetry for the HHV before and after the torrefaction process, it was possible to calculate the energy densification ratio, which is presented graphically in Figure 8.
In Equation (14), the energy densification ratio is related to the HHV. Therefore, it is expected that samples with a higher HHV have a higher EDR. The series of torrefaction processes carried out at 320 °C gave the expected results. However, the series performed at 280 and 240 °C should be more easily distinguished. All samples were weighed before and after torrefaction. Following Equation (15), it was possible to use these values to calculate the mass yield ratio of each sample, which is presented in Figure 9.
In the figure, it is possible to notice that all samples presented mass loss and that this is more prominent as the intensity of the process increases. The samples that went through Tor 7 displayed mass losses of approximately 25%, which is quite low, considering that the torrefaction temperature was 320 °C, even if the residence time was only 60 min. According to Bergman [63], there is a direct relationship between the mass loss and the increase in energy density. That cannot be said for the samples from Tor 7 but is in accordance with the remaining results presented. Lastly, from Equation (16), the energy yields were calculated for all samples, and they are displayed in Figure 10.
It was expected that, as torrefaction severity increased, energy yield would decrease. This can be explained by the fact that, even though there is an increase in the energy density, the mass loss caused by torrefaction renders samples less energy efficient. Once more, results from Tor 7 disagree with the expectations and display higher values to those from the raw biomass. It should be noted that, since the equipment used for these tests was a ceramic muffle, it was not possible to guarantee that temperature was uniform in the entire furnace since it depends on the performance of each resistance. Therefore, variations in the torrefaction degree could explain some unexpected results.

5. Conclusions

The search for alternative energy sources that can minimize environmental impacts of fossil fuels has been a concern for some time. Due to its versatility and high availability, biomass has great potential for the energy sector, mainly because it can be converted into different forms of energy, and thus can be used as an alternative to fossil fuels. Furthermore, unlike what happens with other renewable sources, biomass does not have the problem of intermittent supply, as with wind or sun, thus it can be used as a backup and reserve source. In Portugal, the ever-growing Eucalyptus globulus forest is mainly used by the pulp and paper industry; however. this research studied the incorporation of eucalyptus biomass with diameters of less than 10 cm in the biomass energy recovery supply chain.
Summarizing, six samples of eucalyptus trees were selected and characterized before the torrefaction process for later comparison. Torrefaction was carried out nine times for three temperatures and three residence times, and, following torrefaction, a new series of analyses took place. As the research demonstrated, moisture content decreased and the HHV increased when higher torrefaction temperatures were used, in accordance with the reviewed literature. Carbon content is another important parameter that, according to the results obtained, followed the expected behavior, increasing with higher torrefaction temperatures.
This study successfully determined that at 240 °C the chlorine content of eucalyptus trees in the selected range was already nonexistent. This new knowledge can contribute to the reduction of operating costs due to the possibility of performing torrefaction at lower temperatures without further concerns related with equipment damaging caused by corrosion.
Since this was the first study conducted on this subject, the selected parameters and the chlorine quantification technique can be improved in future research. Focus on lower temperature ranges, between 220 and 240 °C, or even lower and out of the usually assumed torrefaction temperature range, 220–320 °C, with narrower intervals, and the use of quantification methods, such as gas chromatography (GC) or X-ray fluorescence (XRF), may help to determine the exact temperature at which the chlorine is eliminated, and how the process occurs. However, due to the results obtained, which can be considered preliminary, the use of thermal methods to improve the combustibility conditions of residual biomass can be considered as very promising. This possibility opens the door to the use of types of biomass that until now are mostly outside the biomass supply chains for energy, but which, when introduced, will allow the reduction of production costs with the acquisition of raw materials, ones that do not compete with the circuits already installed to supply industry.

Author Contributions

Conceptualization, L.J.R.N. and A.M.M.M.; methodology, L.J.R.N. and A.M.M.M.; validation, L.C.R.S., L.M.E.F.L., and L.J.R.N.; formal analysis, L.C.R.S., L.M.E.F.L., and L.J.R.N.; investigation, L.C.R.S., L.M.E.F.L., and L.J.R.N.; resources, L.J.R.N.; data curation, L.C.R.S., L.M.E.F.L., and L.J.R.N.; writing—original draft preparation, L.C.R.S. and L.M.E.F.L.; writing—review and editing, L.J.R.N. and A.M.M.M.; supervision, L.J.R.N. and A.M.M.M.; and project administration, L.J.R.N. and A.M.M.M. All authors have read and agreed to the published version of the manuscript.

Funding

This research received no external funding.

Acknowledgments

The authors would like to acknowledge the Portuguese companies YGE (Yser Green Energy SA) and AFS (Advanced Fuel Solutions SA), both in Portugal, who allowed the execution of the laboratory tests.

Conflicts of Interest

The authors declare no conflict of interest.

References

  1. Omer, A.M. Energy, environment and sustainable development. Renew. Sustain. Energy Rev. 2008, 12, 2265–2300. [Google Scholar] [CrossRef]
  2. Renton, A. Suffering the Science: Climate change, people, and poverty. Oxfam Policy Pract. Clim. Chang. Resil. 2009, 5, 53–113. [Google Scholar]
  3. Sheldon, R.A. Green and sustainable manufacture of chemicals from biomass: State of the art. Green Chem. 2014, 16, 950–963. [Google Scholar] [CrossRef]
  4. Zhang, L.; Xu, C.C.; Champagne, P. Overview of recent advances in thermo-chemical conversion of biomass. Energy Convers. Manag. 2010, 51, 969–982. [Google Scholar] [CrossRef]
  5. Demirbas, A. Potential applications of renewable energy sources, biomass combustion problems in boiler power systems and combustion related environmental issues. Prog. Energy Combust. Sci. 2005, 31, 171–192. [Google Scholar] [CrossRef]
  6. Vélez, F.; Segovia, J.J.; Martín, M.C.; Antolín, G.; Chejne, F.; Quijano, A. A technical, economical and market review of organic Rankine cycles for the conversion of low-grade heat for power generation. Renew. Sustain. Energy Rev. 2012, 16, 4175–4189. [Google Scholar] [CrossRef]
  7. Balat, M. Use of biomass sources for energy in Turkey and a view to biomass potential. Biomass Bioenergy 2005, 29, 32–41. [Google Scholar] [CrossRef]
  8. Franco, A.; Giannini, N. Perspectives for the use of biomass as fuel in combined cycle power plants. Int. J. Therm. Sci. 2005, 44, 163–177. [Google Scholar] [CrossRef]
  9. Vassilev, S.V.; Vassileva, C.G.; Vassilev, V.S. Advantages and disadvantages of composition and properties of biomass in comparison with coal: An overview. Fuel 2015, 158, 330–350. [Google Scholar] [CrossRef]
  10. Maciejewska, A.; Veringa, H.; Sanders, J.; Peteves, S. Co-Firing of Biomass with Coal: Constraints and Role of Biomass Pretreatment; 9279029894; Office for Official Publications of the European Communities: Luxemburg, 2006. [Google Scholar]
  11. Van der Stelt, M.; Gerhauser, H.; Kiel, J.; Ptasinski, K. Biomass upgrading by torrefaction for the production of biofuels: A review. Biomass Bioenergy 2011, 35, 3748–3762. [Google Scholar] [CrossRef]
  12. Nhuchhen, D.R.; Basu, P.; Acharya, B. A comprehensive review on biomass torrefaction. Int. J. Renew. Energy Biofuels 2014, 2014, 1–56. [Google Scholar] [CrossRef]
  13. Klinger, J.; Bar-Ziv, E.; Shonnard, D. Unified kinetic model for torrefaction–pyrolysis. Fuel Process. Technol. 2015, 138, 175–183. [Google Scholar] [CrossRef] [Green Version]
  14. Ciolkosz, D.; Wallace, R. A review of torrefaction for bioenergy feedstock production. Biofuels Bioprod. Biorefining 2011, 5, 317–329. [Google Scholar] [CrossRef]
  15. Acharya, B.; Sule, I.; Dutta, A. A review on advances of torrefaction technologies for biomass processing. Biomass Convers. Biorefinery 2012, 2, 349–369. [Google Scholar] [CrossRef]
  16. Fernandes, U.; Costa, M. Potential of biomass residues for energy production and utilization in a region of Portugal. Biomass Bioenergy 2010, 34, 661–666. [Google Scholar] [CrossRef]
  17. Viana, H.; Cohen, W.B.; Lopes, D.; Aranha, J. Assessment of forest biomass for use as energy. GIS-based analysis of geographical availability and locations of wood-fired power plants in Portugal. Appl. Energy 2010, 87, 2551–2560. [Google Scholar] [CrossRef]
  18. Monteiro, E.; Mantha, V.; Rouboa, A. The feasibility of biomass pellets production in Portugal. Energy Sources Part B Econ. Plan. Policy 2013, 8, 28–34. [Google Scholar] [CrossRef]
  19. Barreiro, S.; Tomé, M. Analysis of the impact of the use of eucalyptus biomass for energy on wood availability for eucalyptus forest in Portugal: A simulation study. Ecol. Soc. 2012, 17, 17. [Google Scholar] [CrossRef] [Green Version]
  20. Lopes, E.; Dias, A.; Arroja, L.; Capela, I.; Pereira, F. Application of life cycle assessment to the Portuguese pulp and paper industry. J. Clean. Prod. 2003, 11, 51–59. [Google Scholar] [CrossRef]
  21. Casanave, D.; Duplan, J.-L.; Freund, E. Diesel fuels from biomass. Pure Appl. Chem. 2007, 79, 2071–2081. [Google Scholar] [CrossRef]
  22. Toklu, E. Biomass energy potential and utilization in Turkey. Renew. Energy 2017, 107, 235–244. [Google Scholar] [CrossRef]
  23. Demirbas, M.; Balat, M. Recent advances on the production and utilization trends of bio-fuels: A global perspective. Energy Convers. Manag. 2006, 47, 2371–2381. [Google Scholar] [CrossRef]
  24. McKendry, P. Energy production from biomass (part 1): Overview of biomass. Bioresour. Technol. 2002, 83, 37–46. [Google Scholar] [CrossRef]
  25. Hu, L.; Zhao, G.; Hao, W.; Tang, X.; Sun, Y.; Lin, L.; Liu, S. Catalytic conversion of biomass-derived carbohydrates into fuels and chemicals via furanic aldehydes. RSC Adv. 2012, 2, 11184–11206. [Google Scholar] [CrossRef]
  26. Ragauskas, A.J.; Beckham, G.T.; Biddy, M.J.; Chandra, R.; Chen, F.; Davis, M.F.; Davison, B.H.; Dixon, R.A.; Gilna, P.; Keller, M. Lignin valorization: Improving lignin processing in the biorefinery. Science 2014, 344, 1246843. [Google Scholar] [CrossRef] [PubMed]
  27. Yang, H.; Yan, R.; Chen, H.; Zheng, C.; Lee, D.H.; Liang, D.T. In-depth investigation of biomass pyrolysis based on three major components: Hemicellulose, cellulose and lignin. Energy Fuels 2006, 20, 388–393. [Google Scholar] [CrossRef]
  28. Zugenmaier, P. Contribution to the historical development of macromolecular chemistry—Exemplified on cellulose. Cellul. Chem. Technol. 2009, 43, 351. [Google Scholar]
  29. Gilbert, H.J. The biochemistry and structural biology of plant cell wall deconstruction. Plant Physiol. 2010, 153, 444–455. [Google Scholar] [CrossRef] [Green Version]
  30. Hedges, J.I.; Mann, D.C. The characterization of plant tissues by their lignin oxidation products. Geochim. Et Cosmochim. Acta 1979, 43, 1803–1807. [Google Scholar] [CrossRef]
  31. Anwar, Z.; Gulfraz, M.; Irshad, M. Agro-industrial lignocellulosic biomass a key to unlock the future bio-energy: A brief review. J. Radiat. Res. Appl. Sci. 2014, 7, 163–173. [Google Scholar] [CrossRef]
  32. Demirbas, A. Competitive liquid biofuels from biomass. Appl. Energy 2011, 88, 17–28. [Google Scholar] [CrossRef]
  33. Saidur, R.; Abdelaziz, E.; Demirbas, A.; Hossain, M.; Mekhilef, S. A review on biomass as a fuel for boilers. Renew. Sustain. Energy Rev. 2011, 15, 2262–2289. [Google Scholar] [CrossRef]
  34. Jenkins, B.; Baxter, L.; Miles Jr, T.; Miles, T. Combustion properties of biomass. Fuel Process. Technol. 1998, 54, 17–46. [Google Scholar] [CrossRef]
  35. Yin, C.-Y. Prediction of higher heating values of biomass from proximate and ultimate analyses. Fuel 2011, 90, 1128–1132. [Google Scholar] [CrossRef] [Green Version]
  36. Forbes, E.; Easson, D.; Lyons, G.; McRoberts, W. Physico-chemical characteristics of eight different biomass fuels and comparison of combustion and emission results in a small scale multi-fuel boiler. Energy Convers. Manag. 2014, 87, 1162–1169. [Google Scholar] [CrossRef]
  37. Khaled, H.; Fawy, H.A. Effect of different levels of humic acids on the nutrient content, plant growth, and soil properties under conditions of salinity. Soil Water Res. 2011, 6, 21–29. [Google Scholar] [CrossRef] [Green Version]
  38. Wolf, B. A comprehensive system of leaf analyses and its use for diagnosing crop nutrient status. Commun. Soil Sci. Plant Anal. 1982, 13, 1035–1059. [Google Scholar] [CrossRef]
  39. Uusitalo, M.; Vuoristo, P.; Mäntylä, T. Elevated temperature erosion–corrosion of thermal sprayed coatings in chlorine containing environments. Wear 2002, 252, 586–594. [Google Scholar] [CrossRef]
  40. Kleinert, M.; Barth, T. Towards a lignincellulosic biorefinery: Direct one-step conversion of lignin to hydrogen-enriched biofuel. Energy Fuels 2008, 22, 1371–1379. [Google Scholar] [CrossRef]
  41. Arbon, I. Worldwide use of biomass in power generation and combined heat and power schemes. Proc. Inst. Mech. Eng. Part A J. Power Energy 2002, 216, 41–57. [Google Scholar] [CrossRef]
  42. Toftegaard, M.B.; Brix, J.; Jensen, P.A.; Glarborg, P.; Jensen, A.D. Oxy-fuel combustion of solid fuels. Prog. Energy Combust. Sci. 2010, 36, 581–625. [Google Scholar] [CrossRef]
  43. Werther, J.; Saenger, M.; Hartge, E.-U.; Ogada, T.; Siagi, Z. Combustion of agricultural residues. Prog. Energy Combust. Sci. 2000, 26, 1–27. [Google Scholar] [CrossRef]
  44. Doshi, V.; Vuthaluru, H.B.; Korbee, R.; Kiel, J.H. Development of a modeling approach to predict ash formation during co-firing of coal and biomass. Fuel Process. Technol. 2009, 90, 1148–1156. [Google Scholar] [CrossRef]
  45. Wang, Z.; He, T.; Qin, J.; Wu, J.; Li, J.; Zi, Z.; Liu, G.; Wu, J.; Sun, L. Gasification of biomass with oxygen-enriched air in a pilot scale two-stage gasifier. Fuel 2015, 150, 386–393. [Google Scholar] [CrossRef]
  46. McKendry, P. Energy production from biomass (part 3): Gasification technologies. Bioresour. Technol. 2002, 83, 55–63. [Google Scholar] [CrossRef]
  47. Devi, L.; Ptasinski, K.J.; Janssen, F.J. A review of the primary measures for tar elimination in biomass gasification processes. Biomass Bioenergy 2003, 24, 125–140. [Google Scholar] [CrossRef]
  48. Kim, K.H.; Kim, J.-Y.; Cho, T.-S.; Choi, J.W. Influence of pyrolysis temperature on physicochemical properties of biochar obtained from the fast pyrolysis of pitch pine (Pinus rigida). Bioresour. Technol. 2012, 118, 158–162. [Google Scholar] [CrossRef]
  49. Jahirul, M.I.; Rasul, M.G.; Chowdhury, A.A.; Ashwath, N. Biofuels production through biomass pyrolysis—A technological review. Energies 2012, 5, 4952–5001. [Google Scholar] [CrossRef]
  50. Daugaard, D.E.; Brown, R.C. Enthalpy for pyrolysis for several types of biomass. Energy Fuels 2003, 17, 934–939. [Google Scholar] [CrossRef] [Green Version]
  51. Faaij, A. Modern biomass conversion technologies. Mitig. Adapt. Strateg. Glob. Chang. 2006, 11, 343–375. [Google Scholar] [CrossRef] [Green Version]
  52. Eseyin, E.; Ekpenyong, I. Advances in Low Temperature Biomass Pyrolysis: A Brief Review. J. Biofuels 2015, 6, 44–56. [Google Scholar]
  53. Shankar Tumuluru, J.; Sokhansanj, S.; Hess, J.R.; Wright, C.T.; Boardman, R.D. A review on biomass torrefaction process and product properties for energy applications. Ind. Biotechnol. 2011, 7, 384–401. [Google Scholar] [CrossRef] [Green Version]
  54. Kwietniewska, E.; Tys, J. Process characteristics, inhibition factors and methane yields of anaerobic digestion process, with particular focus on microalgal biomass fermentation. Renew. Sustain. Energy Rev. 2014, 34, 491–500. [Google Scholar] [CrossRef]
  55. Gunaseelan, V.N. Anaerobic digestion of biomass for methane production: A review. Biomass Bioenergy 1997, 13, 83–114. [Google Scholar] [CrossRef]
  56. Nordin, A.; Pommer, L.; Nordwaeger, M.; Olofsson, I. Biomass conversion through torrefaction. Technol. Convert. Biomass Useful Energy 2013, 217–244. [Google Scholar] [CrossRef]
  57. Azizaddini, S.; Haghparast, A.; Adl, M.; Hadijafari, P. Assessment of gasification potential of agricultural and woody biomass resources. Iran. Int. J. Environ. Bioenergy 2012, 3, 75–87. [Google Scholar]
  58. Li, J.; Brzdekiewicz, A.; Yang, W.; Blasiak, W. Co-firing based on biomass torrefaction in a pulverized coal boiler with aim of 100% fuel switching. Appl. Energy 2012, 99, 344–354. [Google Scholar] [CrossRef]
  59. Almeida, G.; Brito, J.O.; Perré, P. Alterations in energy properties of eucalyptus wood and bark subjected to torrefaction: The potential of mass loss as a synthetic indicator. Bioresour. Technol. 2010, 101, 9778–9784. [Google Scholar] [CrossRef]
  60. Sadaka, S.; Negi, S. Improvements of biomass physical and thermochemical characteristics via torrefaction process. Environ. Prog. Sustain. Energy: Off. Publ. Am. Inst. Chem. Eng. 2009, 28, 427–434. [Google Scholar] [CrossRef]
  61. Goldfarb, O. Economic aspects of energy generation using agricultural and municipal solid waste. Ecol. Environ. 2015, 6, 224–230. [Google Scholar]
  62. Proskurina, S.; Heinimö, J.; Schipfer, F.; Vakkilainen, E. Biomass for industrial applications: The role of torrefaction. Renew. Energy 2017, 111, 265–274. [Google Scholar] [CrossRef]
  63. Bergman, P.C.; Kiel, J.H. Torrefaction for biomass upgrading. In Proceedings of the 14th European Biomass Conference, Paris, France, 17 October 2015; pp. 17–21. [Google Scholar]
  64. Medic, D.; Darr, M.; Potter, B.; Shah, A. Effect of torrefaction process parameters on biomass feedstock upgrading. In Proceedings of the 2010 Pittsburgh, Pennsylvania, PA, USA, 20–23 June 2010; p. 1. [Google Scholar]
  65. Wang, L.; Barta-Rajnai, E.; Skreiberg, Ø.; Khalil, R.; Czégény, Z.; Jakab, E.; Barta, Z.; Grønli, M. Impact of torrefaction on woody biomass properties. Energy Procedia 2017, 105, 1149–1154. [Google Scholar] [CrossRef]
  66. Jagodzińska, K.; Czerep, M.; Kudlek, E.; Wnukowski, M.; Pronobis, M.; Yang, W. Torrefaction of agricultural residues: Effect of temperature and residence time on the process products properties. J. Energy Resour. Technol. 2020, 142, 070912. [Google Scholar] [CrossRef] [Green Version]
  67. Silveira, E.A.; Galvão, L.G.O.; Sá, I.A.; Silva, B.F.; Macedo, L.; Rousset, P.; Caldeira-Pires, A. Effect of torrefaction on thermal behavior and fuel properties of Eucalyptus grandis macro-particulates. J. Therm. Anal. Calorim. 2019, 138, 3645–3652. [Google Scholar] [CrossRef]
  68. Kung, K.S.; Shanbhogue, S.; Slocum, A.H.; Ghoniem, A.F. A decentralized biomass torrefaction reactor concept. Part I: Multi-scale analysis and initial experimental validation. Biomass Bioenergy 2019, 125, 196–203. [Google Scholar] [CrossRef]
  69. Kung, K.S.; Ghoniem, A.F. A decentralized biomass torrefaction reactor concept. Part II: Mathematical model and scaling law. Biomass Bioenergy 2019, 125, 204–211. [Google Scholar] [CrossRef]
  70. Nunes, L.J. A Case Study about Biomass Torrefaction on an Industrial Scale: Solutions to Problems Related to Self-Heating, Difficulties in Pelletizing, and Excessive Wear of Production Equipment. Appl. Sci. 2020, 10, 2546. [Google Scholar] [CrossRef] [Green Version]
  71. Bates, R.B.; Ghoniem, A.F. Biomass torrefaction: Modeling of volatile and solid product evolution kinetics. Bioresour. Technol. 2012, 124, 460–469. [Google Scholar] [CrossRef]
  72. Niu, Y.; Lv, Y.; Lei, Y.; Liu, S.; Liang, Y.; Wang, D. Biomass torrefaction: Properties, applications, challenges, and economy. Renew. Sustain. Energy Rev. 2019, 115, 109395. [Google Scholar] [CrossRef]
  73. Hasan, M.; Haseli, Y. An Oxyfuel Combustion-Based Torrefaction Process: Technoeconomic Analysis. J. Energy Resour. Technol. 2020, 142, 032205. [Google Scholar] [CrossRef]
  74. Ribeiro, J.M.C.; Godina, R.; Matias, J.C.d.O.; Nunes, L.J.R. Future perspectives of biomass torrefaction: Review of the current state-of-the-art and research development. Sustainability 2018, 10, 2323. [Google Scholar] [CrossRef] [Green Version]
  75. Rodrigues, A.; Nunes, L. Evaluation of ash composition and deposition tendencies of biomasses and torrefied products from woody and shrubby feedstocks: SRC poplar clones and common broom. Fuel 2020, 269, 117454. [Google Scholar] [CrossRef]
  76. Hagen-Thorn, A.; Stjernquist, I. Micronutrient levels in some temperate European tree species: A comparative field study. Trees 2005, 19, 572–579. [Google Scholar] [CrossRef]
  77. Soetan, K.; Olaiya, C.; Oyewole, O. The importance of mineral elements for humans, domestic animals and plants: A review. Afr. J. Food Sci. 2010, 4, 200–222. [Google Scholar]
  78. Gaur, N.; Flora, G.; Yadav, M.; Tiwari, A. A review with recent advancements on bioremediation-based abolition of heavy metals. Environ. Sci. Process. Impacts 2014, 16, 180–193. [Google Scholar] [CrossRef]
  79. Kamnev, A.A. Phytoremediation of heavy metals: An overview. Recent Adv. Mar. Biotechnol. 2003, 8, 269–318. [Google Scholar]
  80. Sarmento, P.; Monteiro, G.; Marcelino, F.; Igreja, C.; Caetano, M. Avaliação da Exatidão Temática das Cartas de uso e Ocupação do solo para Portugal Continental COS1995v1.0, COS2007v2.0 e COS2010v1.0. Direção-Geral do Território; DGT: Lisboa, Portugal, 2016. [Google Scholar]
  81. Caldeira, F.; Mestre, S.; Alegria, C.; Quinta-Nova, L.; Albuquerque, M. Os SIG como ferramenta de apoio à gestão sustentável da floresta. In Ii Jorn. Potencial Científico E Técnico Do Ipcb; IPCB: Castelo Branco, Portugal, 2013; pp. 2–10. [Google Scholar]
  82. Rozefelds, A. Eucalyptus phylogeny and history: A brief summary. Tasforests-Hobart- 1996, 8, 15–26. [Google Scholar]
  83. Águas, A.; Ferreira, A.; Maia, P.; Fernandes, P.M.; Roxo, L.; Keizer, J.; Silva, J.S.; Rego, F.C.; Moreira, F. Natural establishment of Eucalyptus globulus Labill. in burnt stands in Portugal. For. Ecol. Manag. 2014, 323, 47–56. [Google Scholar] [CrossRef] [Green Version]
  84. Mlonka-Mędrala, A.; Gołombek, K.; Buk, P.; Cieślik, E.; Nowak, W. The influence of KCl on biomass ash melting behaviour and high-temperature corrosion of low-alloy steel. Energy 2019, 188, 116062. [Google Scholar] [CrossRef]
  85. Wang, X.; Hu, Z.; Wang, G.; Luo, X.; Ruan, R.; Jin, Q.; Tan, H. Influence of coal co-firing on the particulate matter formation during pulverized biomass combustion. J. Energy Inst. 2019, 92, 450–458. [Google Scholar] [CrossRef]
  86. Vainio, E.; DeMartini, N.; Hupa, L.; Åmand, L.-E.; Richards, T.; Hupa, M. Hygroscopic Properties of Calcium Chloride and Its Role on Cold-End Corrosion in Biomass Combustion. Energy Fuels 2019, 33, 11913–11922. [Google Scholar] [CrossRef]
  87. Meng, X.; Zhou, W.; Rokni, E.; Chen, G.; Sun, R.; Levendis, Y.A. Release of Alkalis and Chlorine from Combustion of Waste Pinewood in a Fixed Bed. Energy Fuels 2019, 33, 1256–1266. [Google Scholar] [CrossRef]
  88. Blomberg, T.; Tripathi, T.; Karppinen, M. New chemical mechanism explaining the breakdown of protective oxides on high temperature steels in biomass combustion and gasification plants. RSC Adv. 2019, 9, 10034–10048. [Google Scholar] [CrossRef] [Green Version]
  89. Uvegi, H.; Chaunsali, P.; Traynor, B.; Olivetti, E. Reactivity of industrial wastes as measured through ICP-OES: A case study on siliceous Indian biomass ash. J. Am. Ceram. Soc. 2019, 102, 7678–7688. [Google Scholar] [CrossRef]
  90. Özsin, G.; Pütün, A.E. TGA/MS/FT-IR study for kinetic evaluation and evolved gas analysis of a biomass/PVC co-pyrolysis process. Energy Convers. Manag. 2019, 182, 143–153. [Google Scholar] [CrossRef]
  91. Rony, A.H.; Kong, L.; Lu, W.; Dejam, M.; Adidharma, H.; Gasem, K.A.; Zheng, Y.; Norton, U.; Fan, M. Kinetics, thermodynamics, and physical characterization of corn stover (Zea mays) for solar biomass pyrolysis potential analysis. Bioresour. Technol. 2019, 284, 466–473. [Google Scholar] [CrossRef]
  92. Brillard, A.; Trouvé, G.; Maryandyshev, P.; Kehrli, D.; Lyubov, V.; Brilhac, J.-F. Analysis through thermogravimetric analyses of the impact of torrefaction processes performed under a non-oxidative atmosphere on hydrolysis lignin samples. Fuel 2020, 260, 116261. [Google Scholar] [CrossRef]
  93. Friedl, A.; Padouvas, E.; Rotter, H.; Varmuza, K. Prediction of heating values of biomass fuel from elemental composition. Anal. Chim. Acta 2005, 544, 191–198. [Google Scholar] [CrossRef]
  94. Grigiante, M.; Antolini, D. Experimental results of mass and energy yield referred to different torrefaction pathways. Waste Biomass Valorization 2014, 5, 11–17. [Google Scholar] [CrossRef]
  95. González-García, S.; Hospido, A.; Moreira, M.T.; Romero, J.; Feijoo, G. Environmental impact assessment of total chlorine free pulp from Eucalyptus globulus in Spain. J. Clean. Prod. 2009, 17, 1010–1016. [Google Scholar] [CrossRef]
  96. Keipi, T.; Tolvanen, H.; Kokko, L.; Raiko, R. The effect of torrefaction on the chlorine content and heating value of eight woody biomass samples. Biomass Bioenergy 2014, 66, 232–239. [Google Scholar] [CrossRef]
  97. Chew, J.J.; Doshi, V. Recent advances in biomass pretreatment–Torrefaction fundamentals and technology. Renew. Sustain. Energy Rev. 2011, 15, 4212–4222. [Google Scholar] [CrossRef]
Figure 1. Main biomass conversion technologies available (adapted from [51]).
Resources 09 00054 g001
Figure 2. E. globulus plantation in Oliveira de Azeméis (left) and E. globulus leaves (right).
Resources 09 00054 g002
Figure 3. Example of the pieces before (left) and after (right) moisture evaporation.
Resources 09 00054 g003
Figure 4. Mass distribution of non-dried biomass.
Resources 09 00054 g004
Figure 5. Van Krevelen diagram representation of the raw and torrefied materials comparatively to traditional biomass forms and coal products.
Resources 09 00054 g005
Figure 6. Results for the mass fraction of ash, volatiles, and fixed carbon contents.
Resources 09 00054 g006
Figure 7. Results for higher heating value (MJ/kg).
Resources 09 00054 g007
Figure 8. Results for energy densification ratio.
Resources 09 00054 g008
Figure 9. Results for mass yield ratio.
Resources 09 00054 g009
Figure 10. Results for energy yield.
Resources 09 00054 g010
Table 1. Scheme of the furnace’s programmable stages according to the temperature and residence time.
StagesTorrefaction StepsTemperature (°C)Residence Time (min)
1Initial heating/pre-dryingTroom–T1t1
2Post-drying and intermediate heatingT1–T2t2
3TorrefactionT2t3
4Solids coolingT2–50 °Ct4
Table 2. Chosen torrefaction parameters.
TorrefactiontR (min)T1 (°C)T2 (°C)
Tor 160150240
Tor 290
Tor 3120
Tor 460175280
Tor 590
Tor 6120
Tor 760200320
Tor 890
Tor 9120
Table 3. Initial moisture content by section.
TreeTrunk (%)Bark (%)Leaves (%)
154.7163.7547.30
254.7163.7547.30
341.7455.2741.10
445.5152.0140.88
550.0863.2349.63
653.3262.5051.52
Table 4. Elemental analysis results, as well as sulfur and chlorine content results.
TestSampleCHN (%)S (%)Cl (%)O (%)
CHN
Raw
biomass
156.935.760.390.010.0536.86
257.875.880.230.000.0335.99
357.755.850.190.010.0436.17
458.035.880.150.000.0335.91
556.625.780.220.000.0337.35
Table 5. Elemental analysis results, as well as sulfur and chlorine content results.
TestSampleCHN (%)S (%)Cl (%)O (%)
CHN
Torr 1165.085.180.260.000.0029.48
262.495.230.160.000.0032.12
364.045.250.190.000.0030.52
462.735.280.150.000.0031.84
565.025.140.160.000.0029.68
Table 6. Elemental analysis results, as well as sulfur and chlorine content results.
TestSampleCHN (%)S (%)Cl (%)O (%)
CHN
Torr 2172.274.950.280.000.0022.50
267.595.120.190.000.0027.10
369.565.060.200.000.0025.18
467.485.190.190.000.0027.14
568.925.030.200.000.0025.85
Table 7. Elemental analysis results, as well as sulfur and chlorine content results.
TestSampleCHN (%)S (%)Cl (%)O (%)
CHN
Torr 3172.305.020.340.000.0022.34
268.315.320.200.000.0026.17
372.375.050.190.000.0022.39
469.355.250.160.000.0025.24
574.254.840.210.000.0020.70
Table 8. Elemental analysis results, as well as sulfur and chlorine content results.
TestSampleCHN (%)S (%)Cl (%)O (%)
CHN
Torr 4164.485.200.260.000.0030.06
262.105.300.160.000.0032.44
364.415.160.170.000.0030.26
463.205.290.130.000.0031.38
564.185.220.150.000.0030.45
Table 9. Elemental analysis results, as well as sulfur and chlorine content results.
TestSampleCHN (%)S (%)Cl (%)O (%)
CHN
Torr 5172.974.990.300.000.0021.74
264.065.480.140.000.0030.32
366.935.290.180.000.0027.60
466.125.430.160.000.0028.29
566.875.290.180.000.0027.66
Table 10. Elemental analysis results, as well as sulfur and chlorine content results.
TestSampleCHN (%)S (%)Cl (%)O (%)
CHN
Torr 6178.424.220.350.000.0017.01
268.645.050.190.000.0026.12
372.044.950.190.000.0022.82
470.254.950.160.000.0024.64
570.625.010.200.000.0024.17
Table 11. Elemental analysis results, as well as sulfur and chlorine content results.
TestSampleCHN (%)S (%)Cl (%)O (%)
CHN
Torr 7192.762.720.390.000.004.13
289.952.750.290.000.007.01
389.942.740.250.000.007.07
490.193.000.240.000.006.57
590.942.850.240.000.005.97
Table 12. Elemental analysis results, as well as sulfur and chlorine content results.
TestSampleCHN (%)S (%)Cl (%)O (%)
CHN
Torr 8194.312.700.470.000.002.52
291.052.570.220.000.006.16
393.072.740.230.000.003.96
491.442.340.160.000.006.06
592.402.560.240.000.004.80
Table 13. Elemental analysis results, as well as sulfur and chlorine content results.
TestSampleCHN (%)S (%)Cl (%)O (%)
CHN
Torr 9193.612.850.390.000.003.15
296.402.440.290.000.000.87
392.592.960.330.000.004.12
491.042.750.240.000.005.97
591.582.520.240.000.005.66

