Article

Changes in the Environmental Sustainability of the Urban Transport System when Introducing Paid Parking for Private Vehicles

Department of Road Transport Operation, Industrial University of Tyumen, 38, Volodarskogo str., 625000 Tyumen, Russia
*
Author to whom correspondence should be addressed.
Submission received: 4 June 2020 / Revised: 14 August 2020 / Accepted: 19 August 2020 / Published: 21 August 2020
(This article belongs to the Special Issue Renewables Application: Challenges and Perspectives)

Abstract

:
The work proposes a methodological approach to studying and assessing the environmental sustainability of the transport system of the city. The authors have selected parameters for assessing the environmental sustainability of the transport system and identified significant factors affecting environmental sustainability. A coefficient of environmental sustainability of the urban transport system and a formula for its calculation are proposed. A simulation was used to assess the amount of emissions of harmful substances from the car exhaust gases if the demand structure changes with respect to the means of transport and transportation methods. The paper presents the results of changing the parameters of the traffic flow and demand by means of transport and transportation methods when introducing a parking fee in the central part of the city, changing the cost of parking and expanding the paid parking area.

Graphical Abstract

1. Introduction

Sustainability is one of the important properties of the transport system of the city and depends on a large number of external and internal factors [1,2,3,4,5,6,7,8,9,10]. In turn, sustainability is a complex property, which can also be divided into parts and evaluated by various criteria: social, economic, environmental. All criteria are important and interconnected. The complex task of choosing indicators for assessing sustainability must be approached comprehensively [11], which emphasizes the importance of research in this area. At the same time, according to the authors, the environmental sustainability criteria in Russian cities are understudied and are not regulated by standards. This work focuses on the environmental sustainability of the transport system. When developing the Program for the comprehensive development of the city transport infrastructure, the environmental criterion falls within the optional group [12]. As a result, when developing this document, the customer may not include this indicator in the technical specification and, accordingly, the contractor does not take into account the environmental criterion when choosing the optimal set of measures in the project.
Meanwhile, world experience shows that transport has a significant impact on climate change [13,14,15,16,17]. It is the source of up to 23% of all CO2 emissions from fuel combustion in the world [18]. In this regard, the environmental situation in Russian cities remains quite tense. The level of motorization has a significant impact on the volume of emissions of harmful substances into the atmosphere of cities. Electric cars and cycling are not so widespread in Russian cities as in cities around the world. More than 30 times fewer people use bicycles for daily travel around the city than in countries with a developed cycling culture [19,20,21]. As of 1 January 2020, the share of electric cars is 0.014% [22] of the total number of cars in the Russian Federation. For a number of reasons, the increasing interest of the population in electric vehicles, noted in various sources [23,24,25], has not yet resulted in a significant reduction in the number of cars with an internal combustion engine on the roads of Russian cities. In developing countries, the transition to electric cars will not be so massive and rapid in the near future due to the lack of the necessary charging infrastructure and the high cost of such cars. Given this, we cannot speak about the possibility of a significant improvement in the environmental situation by increasing the share of electric vehicles and cycling in Russian cities in the near future. Large Russian cities gradually introduce electric buses (Moscow, Kazan, St. Petersburg, Perm, Rostov-on-Don, Tyumen, etc.). The efficiency of their operation can be limited because of a long winter period with low air temperatures in a significant part of the country. The effect of low air temperature on energy consumption by batteries of electric cars and buses is currently understudied [25,26].
Another relevant area for improving the environmental situation in cities is the transition of vehicles to the use of natural gas instead of gasoline and diesel fuel [26,27]. This area is promising for Russia because of the large methane reserves in the country and the high level of development of the oil and gas production and processing. An important deterrent is the insufficient number of CNG stations in the country. Recently, however, the government has been paying greater attention to this issue [28].
Achieving the goal of improving the environmental situation in the cities of the Russian Federation should be considered as a derivative of improving the operating parameters of the entire transport system. The effectiveness of evaluating the performance of the transport system is inextricably linked with the use of “big data” and digital technologies in the urban transport complex [29,30]. Measures aimed at improving the organization of road traffic [31] will also have an effect on improving the environmental situation.
The main measures to improve the efficiency of traffic management are the separation of road traffic and pedestrian flows in space (the construction of costly transport interchanges, tunnels, underground or elevated pedestrian crossings) and the development of a road network. Due to the reconstruction of streets of regulated traffic into main streets of continuous traffic, the resistance of the transport system to changes in weather and road conditions [32] is increased. These measures, however, are quite expensive and require time and resources.
Less costly is the improvement of traffic management schemes, including restrictive measures (elimination of left turns or use of indirect left turns through the right turn). However, almost all of them have already been implemented, and there is no longer any reserve for further improving the road situation in the cities of the Russian Federation. The city authorities are left with the option of introducing Intelligent Transport Systems and reducing the number of journeys in personal vehicles by applying restrictive measures (reducing the number of parking spaces and introducing parking fees) [33,34,35,36]. Parking pricing is an important element in the implementation of the “Mobility as a Service (MaaS)” concept in cities and reducing the demand for personal transport [37,38,39].
The author [40] shows a close relationship between the increase in the number of parking lots and the number of personal vehicles. The authors of a number of studies [41,42,43] point out a great potential in the influence of the parking fees introduction on changing a modal split. Thus, studies carried out in the early 1990s in the most unfavorable, from a transport point of view, region of the United States—Southern California [44] demonstrated that the increase in the cost of parking spaces is the second most important factor influencing the decision to abandon a personal car in favor of public transport, exceeding the fuel costs and transport taxes. Therefore, this article studies the impact of the introduction of parking fees on the environmental sustainability of the city’s transport system with complex climatic conditions, based on simulations of flow movements throughout the city using known techniques.
The aim of this paper is to formulate an approach to assess the environmental sustainability of the city’s transport system when changing the organization of traffic and the redistribution of demand by types (means) of city transport and transportation methods, setting the regularity of the influence of the parking pricing on the environmental sustainability of the city’s transport system.

2. Materials and Methods

To study the urban transport system, the authors used the theory of systems, system analysis and simulation modeling.
The simulation model was developed in 2018 with the subsequent update in 2019–2020. The studies presented in this paper are based on the initial data of 2017–2019 and do not take into account the impact of the Coronavirus Covid-19 pandemic in 2020 on the transport mobility of the population and the sustainability of urban transport systems. Restrictions on transportation and operation of enterprises significantly affected the transport system [45,46]. In Tyumen, traffic in the central part of the city decreased on average by two times. This temporarily led to a significant reduction in the emission of harmful substances from car exhaust gases and an improvement in environmental sustainability. The number of traffic accidents also decreased significantly. Due to restrictive measures, there was a significant decrease in the number of journeys taken on all types of transport.
The work evaluated the change in the environmental sustainability of the transport system with a change in the share of travel by car and public transport due to the introduction of a parking fee for a personal car in the city center and changes in the cost of parking. These factors affect the efficiency of traffic management, changes in the parameters of traffic flows, and, consequently, the environmental situation in cities.
A simulation was carried out in the PTV Visum computer software. The macromodel of the city transport includes 400 transport areas, 7744 nodes, and 17,274 segments. The total length of the city’s road network is 2424 km, including 1200 km of roads, 381 traffic light objects, 48,131 vehicles in the system, and 1,538,871 km of total vehicle mileage within the modeling boundaries.
A parking cost simulation was carried out in two stages. At the first stage, based on empirical data on the existing paid parking in Tyumen, the characteristics of parking sessions were determined: the average number of car park uses per day per parking space, the average parking time, the distribution of parking time by time intervals, and the change in the characteristics of parking sessions when the parking cost changes from 25 to 40 rubles. At the second stage, coefficients characterizing the additional resistance at the adjoining areas for the movement of individual transport were determined. The additional resistance takes into account: the average time for using paid parking, average and median income of city residents, the cost of owning a personal car, the cost of using paid parking, and a number of other factors. Based on the totality of these factors, a coefficient was determined that describes the reduction in money to time costs.
The simulation was carried out for optimal weather, climatic, and road conditions with the basic (standard) program settings for the city of Tyumen (Russia), in compliance with the requirements of the rules of the road for high-speed mode:
  • Traffic capacity of a road lane, car/h—900;
  • Maximum speed on main streets, km/h—60;
  • Maximum speed on main streets, km/h—90.
The simulation period was 3 h for morning time and maximum load of the road network. In Tyumen, there are no large enterprises with a large number of workers, due to which commuting to a certain area would occur.
The urban district, the city of Tyumen, is the administrative center of the Tyumen region, located in the Urals Federal District. It has the following parameters:
  • city area (within the urban district boundaries)—698 km2;
  • built-up area—23%;
  • population density—1129 people/km2;
  • motorization level—500 cars per 1000 inhabitants.

3. Results and Discussion

The transport system is complex and large and includes several subsystems: city passenger public transport, route network, road network, traffic light management, including intelligent transport systems, traffic flow of cars and trucks, buses belonging to individual owners, organizations, and taxi companies. It has a combination of properties: organization, integrity, emergence, functionality, structure, sustainability, reliability, survivability, and adaptability. The authors conducted research on the environmental sustainability of one of the subsystems of the urban transport system—the traffic management system.
An analysis of previous studies showed that the environmental sustainability of the urban transport system to changes in the weather, climate, transport, and road conditions of car operation should take into account the influence of a large number of external and internal factors. External factors include sociodemographic, economic, and weather–climatic groups of factors.
The economic group of factors includes the cost of travel by public transport; the cost of owning a vehicle, which takes into account fuel for a vehicle; electricity for electric vehicles; parking fees; taxes and civil liability insurance costs for vehicle owners; expenses for vehicle maintenance and repair; fines for violation of traffic rules. Weather and climate (air temperature, rainfall, and others) and road conditions affect the efficiency of traffic management [8,9,10], and, consequently, the sustainability of the urban transport system.
The main internal factors affecting the environmental sustainability of the transport system include:
  • vehicle fleet structure by vehicle types, internal combustion engine (ICE) types and types of fuel used;
  • average age (life) of vehicles;
  • technical condition of vehicles;
  • traffic management conditions (complexity);
  • balance of transport demand for traveling by personal vehicles and transport supply (traffic capacity of roads);
  • balance of demand for free parking and the availability of parking for traveling with a full-time work purpose.
If transport demand and supply were unbalanced, the time for correspondence by cars increased. This led to traffic congestion, an increase in vehicle traffic unevenness, and, consequently, an increase in the amount of harmful substances emitted with the ICE exhaust gases.
In the case of an imbalanced demand for free parking and the availability of parking for traveling with a full-time work purpose, several options are possible on the part of residents. They can:
  • refuse to travel by personal transport in favor of other means (public transport, taxi, car sharing, motorcycle) and methods of transportation (walking and cycling, the use of individual mobility means (scooters, gyro scooters, etc.));
  • change the time of the travel to work to earlier or later;
  • violate traffic rules and park a car off-street, on sidewalks, or lawns;
  • use paid parking if available within walking distance;
  • use intercepting parking and complete the travel to the city center by public transport (if available).
Figure 1 shows the change in the estimated daily value of emissions of harmful substances with the ICE exhaust gases in Tyumen by 2040 and its comparison with the data from 2019 (for a weekday). The calculation results predict that by 2040, there will be an increase in CO emissions by 66%, CO2 emissions by 86%, and NOx emissions by 73%. The increase in emissions is due to an increase in the population, an increase in the total number of cars and the level of motorization, as well as an increase in the length of travel routes due to an increase in the area of the city. These results prove the relevance of research to determine a set of measures to reduce air pollution and improve the environmental sustainability of the city’s transport system.

3.1. Methodological Approach to Assessing the Environmental Sustainability of the Transport System

Environmental sustainability is one of the partial coefficients ke of the integral indicator of the transport system sustainability, estimated by the coefficient Ki, [31], which was determined taking into account the degree of weight λi (0 ≤ λi ≤ 1;   i = 1 N λ i = 1 ) of each factor; Equation (1):
K   =   i = 1 n K i × λ i ,
where n—number of criteria involved in the assessment. Where Ki—partial sustainability coefficient, λi—will be different for different transport systems of municipalities and can be determined by expert estimates based on the aim of the study.
When assessing environmental sustainability, the work took into account the environmental situation in the entire city and in certain sections of the road network. Assessment of the environmental situation in certain areas is advisable in places with a large number of pedestrians (pedestrian crossings, public transport stops). To assess the environmental sustainability of the transport system, the authors proposed introducing the coefficient Ke, which was determined by the relative change in damage caused by harmful substances from exhaust gases; Equation (2):
K e   =   D e D e   =   N i = 1 G i × K i N i = 1 G i × K i
where D′e, De—environmental damage to atmospheric air, G′i Gi—the actual mass of the ith harmful substance entering the atmospheric air with the exhaust car gases during the considered period of time, respectively, in the current conditions and after changing the functioning of the transport system.
The environmental sustainability coefficient shows how many times the amount of emissions of harmful substances from automobile exhaust gases decreases when a set of measures is taken to reduce the negative impact of transport on the environment.
When assessing the environmental situation using simulation, the amount of emissions of Carbon dioxide (CO2) and harmful substances with exhaust gases of internal combustion engines of cars was calculated by their type:
  • Carbon monoxide CO;
  • Nitrogen oxide NOx;
  • Hydrocarbons CH;
  • Other harmful substances (Ammoniac NH3, Nonmethane hydrocarbon (NMHC), PM, Sulfur dioxide SO2, Methane CH4, Nitrous oxide N2O, Benzene).
During simulation at the macro level, the influence of different transportation modes on the emissions of individual pollutants was neglected. This reduced the assessment reliability, but increased the availability of the method, because there was no need for large amounts of additional information for calculations. The amount of harmful substance emissions during macromodeling was calculated according to the Handbook Emission Factors for Road Transport 3.3 (HBEFA) method, which takes into account the mileage emissions when driving cars and emissions in idle mode [47]. This took into account the composition of the traffic flow, fuel types, service level, road class, traffic speed, load on the road network. The change in the amount of emissions of harmful substances during simulation correlated with the indicator of fuel consumption by cars.

3.2. Methodological Approach to Assessing the Impact of the Parking Cost and the Number of Parking Spaces on the Effectiveness of Traffic Management and the Environmental Sustainability of the Transport System

The introduction of parking fees for cars in the road network has been used worldwide for over 85 years. In the Russian Federation, this procedure has become widespread relatively recently. Moscow has the most widespread paid parking system in the Russian Federation. As of 2020, paid parking has become widespread to some degree in 19 cities (Table 1). Moscow and St. Petersburg have the highest cost of parking (from 30 to 380 rubles). In other cities of the Russian Federation, the cost of parking for personal vehicles averages 30–50 rubles per 1 h.
Municipal authorities in the Russian Federation note that the introduction of a parking fee is not for replenishing the budget of cities. The main goal of paid parking is to demotivate the use of cars by citizens and stimulate the use of public transport, taxis, car sharing, cycling, or walking to the city center. Moscow has the largest empirical experience with paid parking. Since the introduction of parking fees, tariffs in certain areas of Moscow have increased from 80 to 380 rubles. With the development of car sharing, the occupancy rate of parking lots for these cars has increased.
The hypothesis of the study is that with an increase in the area and cost of paid parking in the city center, the demand is redistributed by means of transport (an increase in the share of travel by public transport and taxis and a decrease in travel by cars). As a result, the unevenness of traffic with respect to time is reduced, the proportion of time when cars are moving at a constant speed increases, and the number of stops, acceleration, and braking is reduced. Reducing the time the cars are idling and the traffic is uneven reduces the amount of emissions of harmful substances from the exhaust gases of ICE cars. This leads to the increased environmental sustainability of the city’s transport system.
Traffic simulation allows us to evaluate the change in the parameters of the urban transport system when external and internal conditions affecting the system change. Table 2 presents the changes in the number of transport correspondences when introducing parking fees and expanding the paid parking zone in the city. Table 3 presents the changes in the number of transport correspondences when introducing parking fees and expanding the paid parking zone in the city center.
When the number of correspondence changes, the structure of transport demand changes by modes of transport and ways of movement in the city (Table 4).
The introduction of a fee for cars parking within the road network in the center of the city led to a redistribution of demand by means of transport and transportation methods when performing transport correspondence to this area. The share of travel by cars decreased by 1.2%. The share of travel by public transport increased by 0.9%. Pedestrian traffic changed by 0.2%. At first glance, such slight changes in transport demand are due to an estimate for the entire city and all travel, which concern not only the area of introduction of paid parking but the city as a whole. Changes in transport demand in the area of introduction of paid parking are more significant (Table 5 and Table 6).
With the introduction of the paid parking zone within the boundaries of the historical city center, there was an increase in the share of travel by public transport by 3.9% and a decrease for cars by 5.4%. The share of pedestrian traffic increased by 1.5% (Table 5). Due to the peculiarities of simulation modeling, the approach to the public transport stop and the travel by public transport were considered as two independent movements; therefore, the total number of correspondences increased. With the expansion of the paid parking zone, the redistribution in absolute terms increased, but the relative value decreased slightly. This is due to the presence of parking spaces outside the paid parking zone and that drivers can park their car in the neighboring area without payment. The effect of loading parking lots in the areas adjacent to the paid parking zone was observed with the introduction of paid parking in Moscow and St. Petersburg in 2018–2019. A significant increase in the share of cycling (15%) for the paid parking zone in the central part of the city was caused by its very small initial value (the low base effect in the calculation) (Table 6).
A decrease in the number of journeys by cars led to an increase in the average traffic speed by 1.9% and a decrease in the average travel time by 2.25% in the entire city. A slight increase in speed was due to the high base effect and a small share of vehicles that moved within the road network in the area of paid parking from the total number of vehicles in the city’s transport system.
The introduction of paid parking led to a decrease in transport demand for travel by personal vehicles, which led to a decrease in traffic congestion and an increase in the efficiency of traffic management. As a result, there was a decrease in fuel consumption and emissions of harmful substances from exhaust gases of ICE cars. This was due to two factors:
  • Car traffic decreased;
  • The irregularity of car traffic, the number of stops, accelerations, and braking decreased (the proportion of time when cars were moving in an unsteady mode of operation decreased).
Table 7 provides changes in the amount of emissions of harmful substances from the exhaust gases of ICE cars in the entire city with the introduction of paid parking and the expansion of its zone in the morning rush hour.
With the introduction of a parking fee in the historical center, the total amount of harmful substance emissions in the city as a whole decreased by 1.6%, and with the expansion of the zone—by 1.9%. The value of the coefficients of environmental sustainability Ke will be 1.02.
Practice of introducing paid parking showed that there was a change in demand for paid parking over time. At the initial stage, there was a decrease in demand. Some car owners refused to use cars and use other modes of transport instead. Having gained experience and having estimated the expense of journeys by new transport modes, former car owners decided to continue journeys to work using new modes of transport or use cars again. Several factors played an important role here:
  • Level of development and quality of work of public transport (remoteness of work and place of residence from public transport stops, presence of a direct transport route without transfers, waiting time);
  • Travel time (depends on the remoteness of the person’s place of residence from work, presence of light rail transport, compliance of the carrying capacity with transport demand);
  • Number of journeys per day, including for purposes other than work (cultural, etc.);
  • Need to travel with family members (take children to school, kindergarten, clubs, etc.);
  • Financial possibilities of the family budget to use paid parking.
The cost of 1 h of parking plays an important role in deciding whether to use a paid parking space when traveling from home to work and back or not. An increase in the cost of parking led to a decrease in the number of journeys by cars and an increase in other means of transport and other methods of transportation (Table 8 and Table 9).
The change in the number of journeys from home to work and back and the structure of transport demand with increasing parking costs was nonlinear and depended on several factors: the availability of free parking within walking distance, the presence of high-paid workers (the structure of job placement by field of activity and employee income) in the coverage area of paid parking, and others.
With an increase in the cost of parking due to a decrease in the number of journeys by personal transport, traffic congestion decreased and traffic parameters improved. This led to a decrease in the amount of emissions of harmful substances from the exhaust gases of ICE vehicles (Table 10). The amount of emissions of the three most common harmful substances was reduced from 11% to 22%.
With the expansion of the paid parking zone from the boundaries of the historical city center to the boundaries of the central part, the number of parking spaces increased from 3400 to 5980 (by 66%). This then led to an increase in the intensity of changes in the number of correspondences by mode of transport (Table 11) and transportation methods (Table 12) when corresponding to the central part of the city. The structure of transport demand in the city as a whole changed less significantly under the influence of the cost of paid parking (Table 13).
As can be seen from the simulation results, an increase in the cost of parking led to a decrease in the share of use of cars and an increase in the share of journeys by public transport and pedestrian traffic. The share of journeys by personal transport in the city as a whole was greater than the corresponding value for transport correspondence to the central part of the city. The intensity of changes in demand by means of transport in the city as a whole was lower than for the central part of the city with a paid parking zone.
The constant value of the bicycle traffic share in the entire city with an increase in the cost of paid parking was due to the insufficient development of cycling infrastructure. If bicycle lanes develop, there will be an increase in the share of bicycle rides at the expense of other modes of transport. A change in the demand structure by means of transport with the expansion of the paid parking zone led to an increase in the efficiency of traffic management, and, consequently, to a reduction in air pollution by emissions of harmful substances (Table 14).
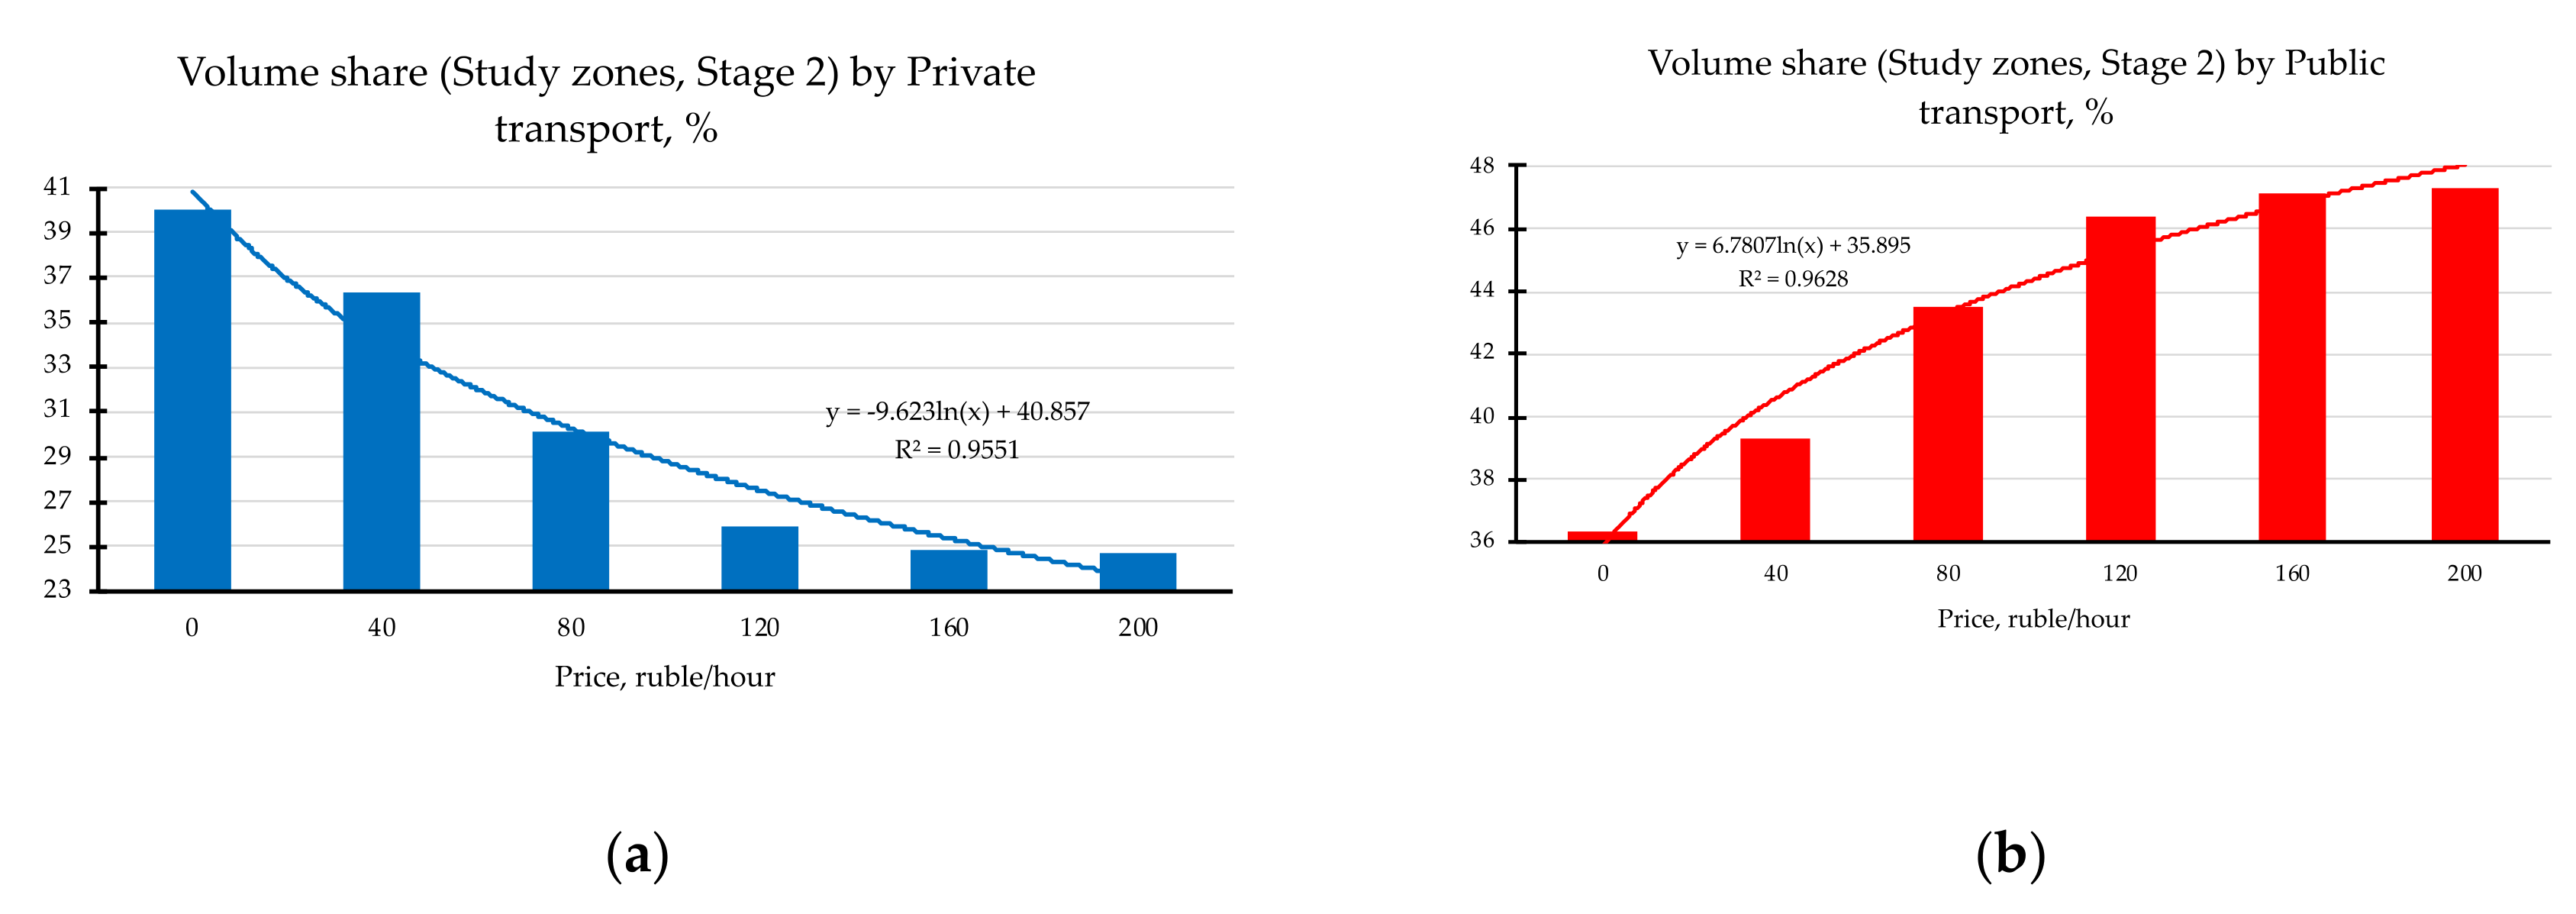
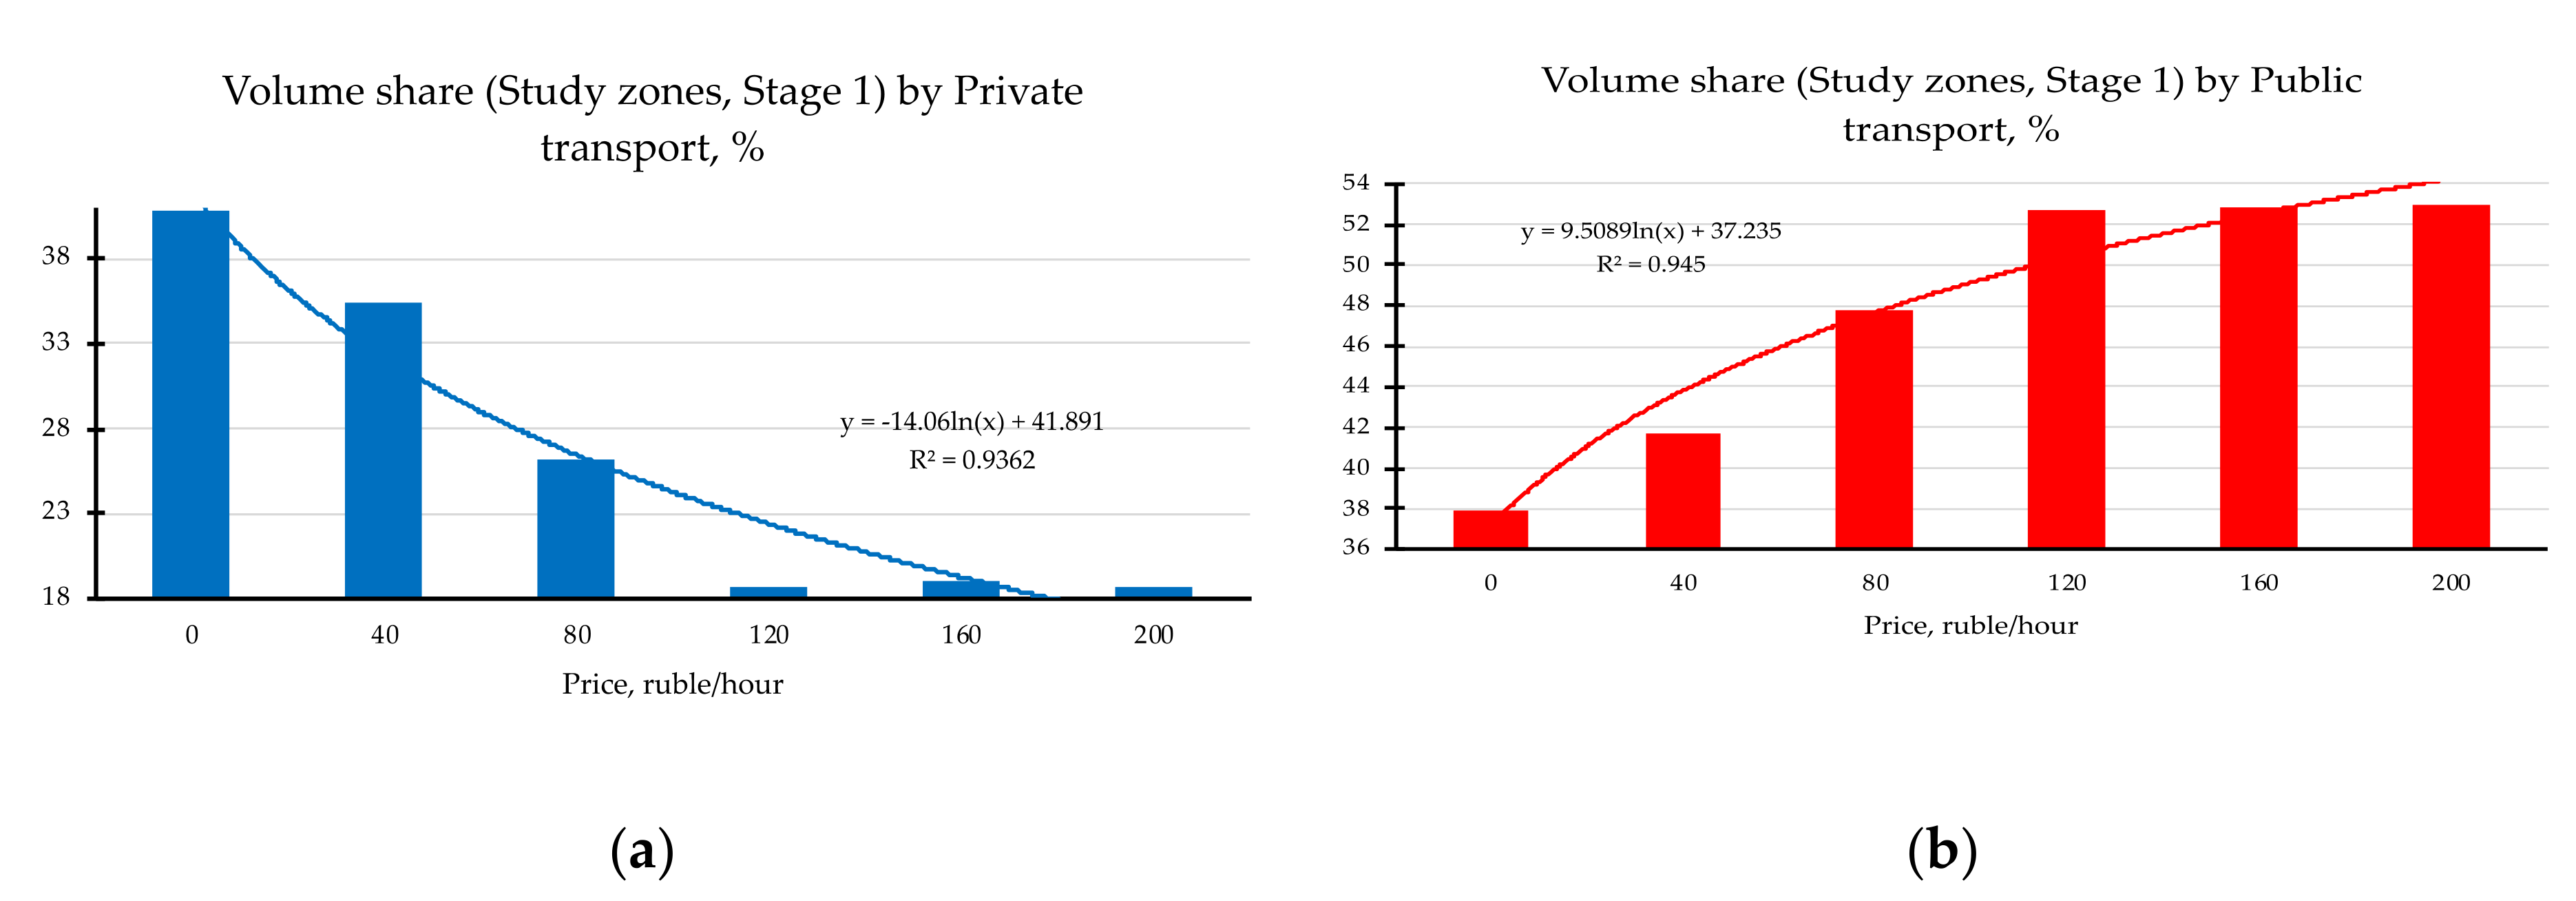
The estimated value of the coefficient ke of environmental sustainability of the transport system for paid parking areas is 1.23. The values of indicators given in Table 2, Table 3, Table 4, Table 5, Table 6, Table 7, Table 8, Table 9, Table 10, Table 11, Table 12 and Table 13 characterize the simulated system as a whole (city) and the largest part of the system (large area of the city). In some sections of the road network, the change in indicators were even more significant. The impact of parking costs on transport demand and the amount of emissions of harmful substances for two zones with a different number of parking spaces differed in the dynamics of changes (Figure 2 and Figure 3).
The impact of parking costs on emissions of nitrogen oxides and total emissions of harmful substances from automobile exhaust gases for two zones with a different number of parking spaces differed in the dynamics of changes (Figure 4).
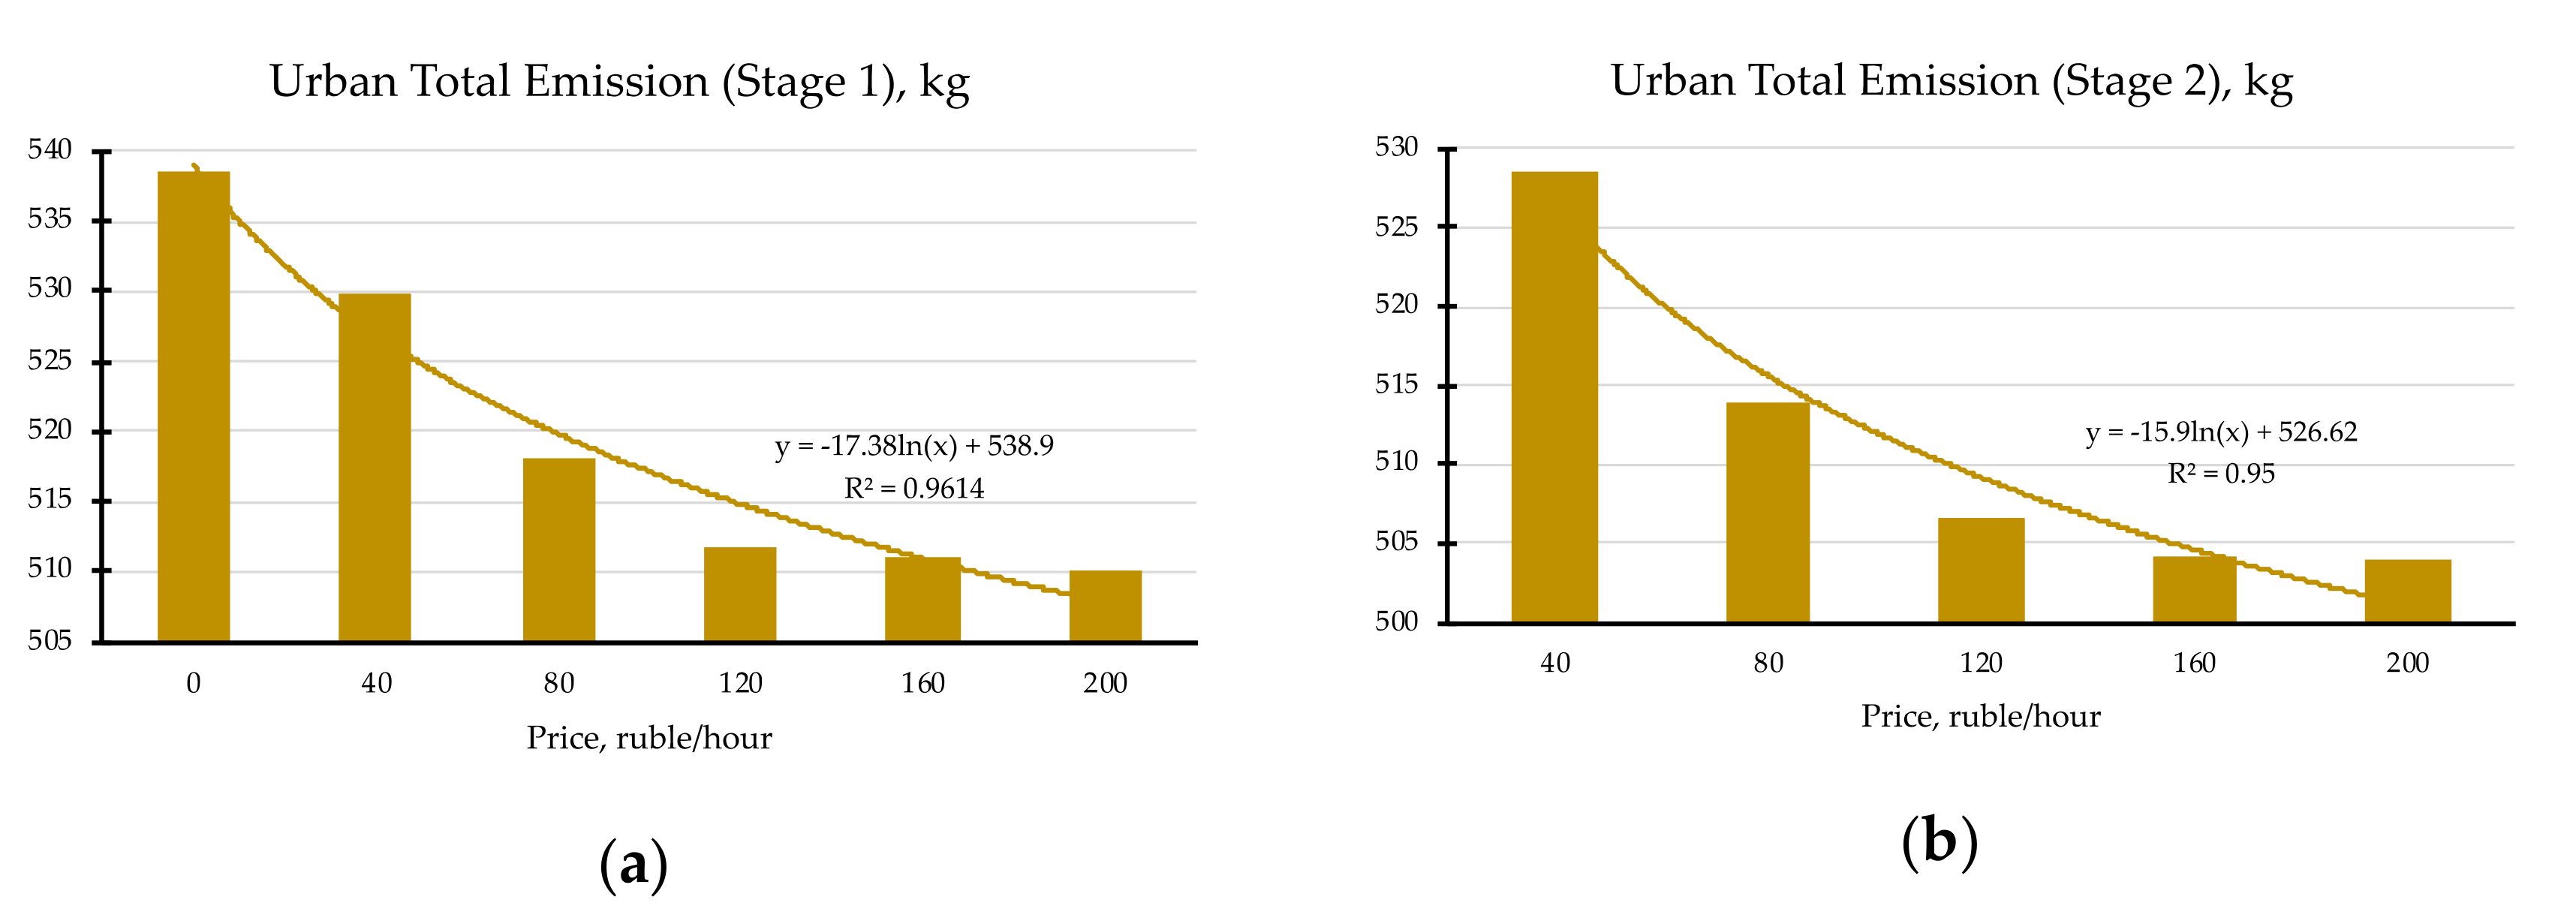
With the expansion of the paid parking zone and increase in its cost, nitrogen oxide emissions and the total emissions of harmful substances from automobile exhaust gases in the city generally decreased (Figure 5 andFigure 6).
An analysis of the simulation results shows that the cost of parking and its coverage area affect the transport demand to varying degrees.
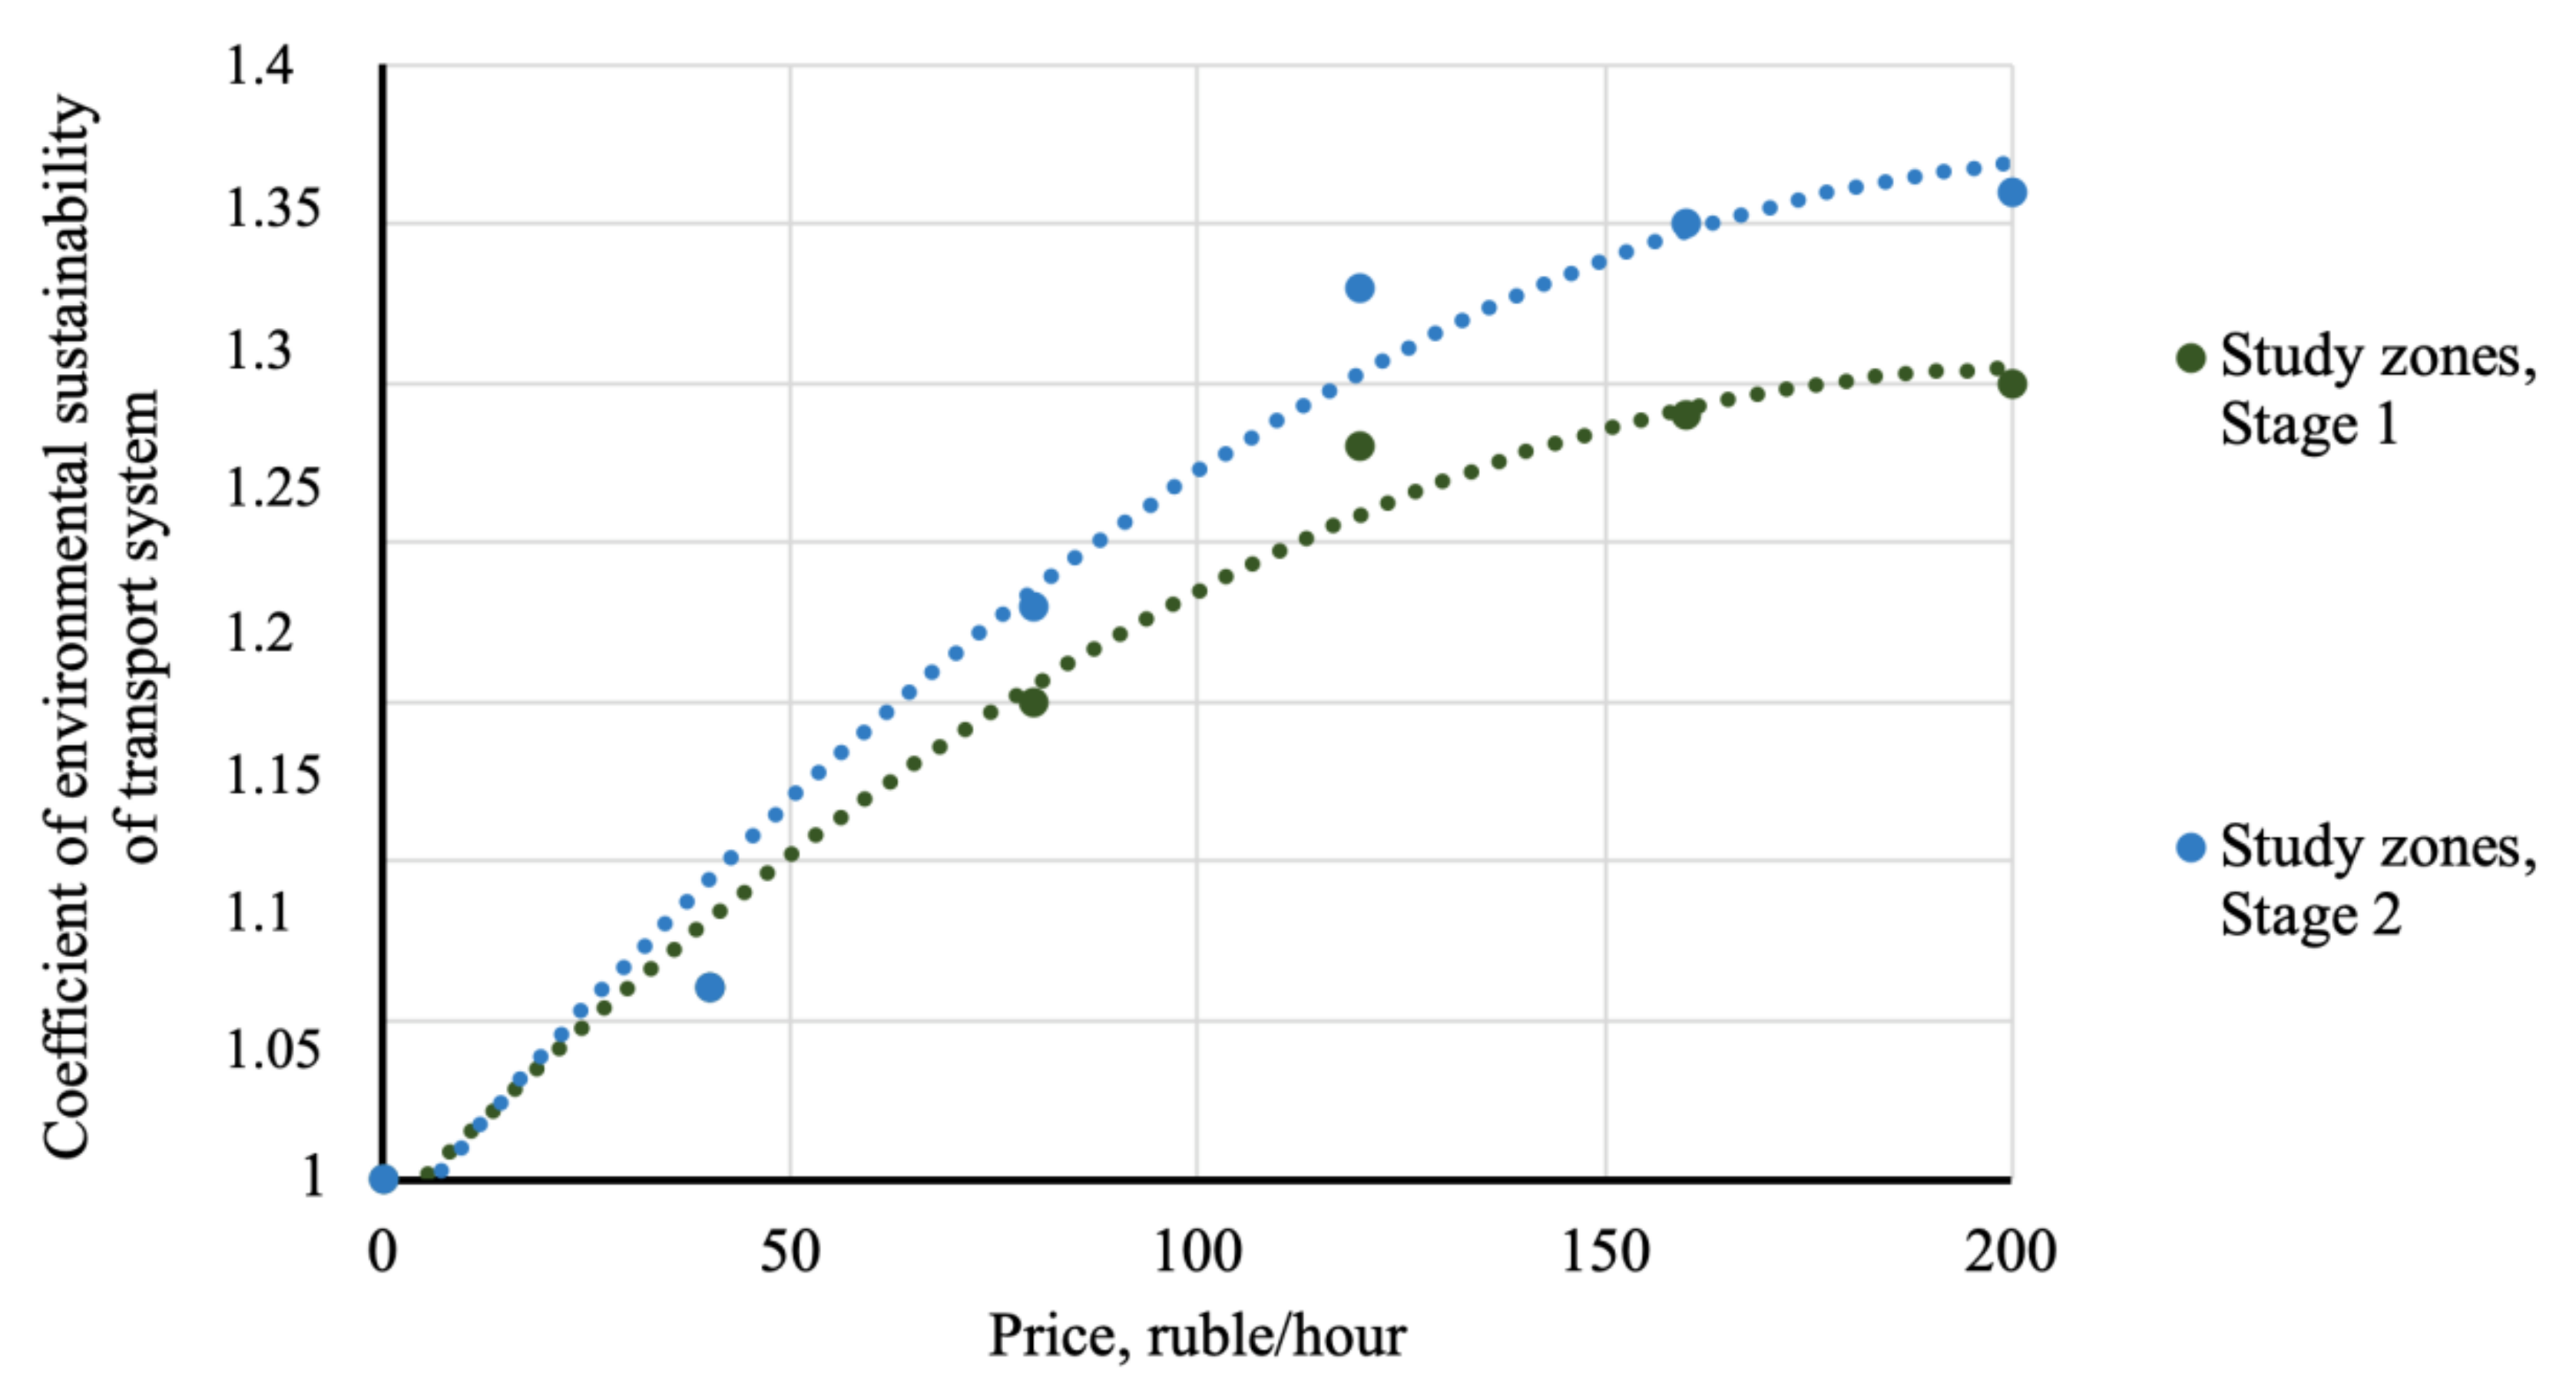
Figure 7 shows changes in the environmental sustainability indicator ke of the transport system with changes in the cost and expansion of the area of paid parking.
The indicator changed in the range of 1.00–1.25 (for the historical part of the city) and in the range of 1.00–1.31 (for the central part of the city). The intensity of increasing environmental sustainability increased with the increasing cost of parking and the expansion of its coverage area. As can be seen from the graph (Figure 7), the cost of parking had a greater impact on environmental sustainability than its coverage area. A change in cost from 0 to 200 rubles increased the coefficient of environmental sustainability by 31%, and the expansion of the paid parking area by 6%.
We can increase the environmental sustainability of the transport system with significant transport demand by reducing the number of journeys by private residents and using fixed-route transport. In this case, the environmental sustainability of the public transport system may slightly deteriorate as the quantity of rolling stock increases. However, the negative effect of public transport will be significantly lower than the positive effect of reducing emissions from cars. Improving the efficiency of traffic management by reducing the number of individual vehicles on highways will improve the technical and operational performance of the public transport rolling stock and the quality of passenger transportation and ride comfort.
Thus, the management of transport demand by regulating the cost of parking and the number of parking spaces can improve the environmental sustainability of the transport system. All measures that increase the environmental sustainability of the city’s transport system can be divided into groups according to several criteria.

4. Conclusions

The authors carried out theoretical and experimental studies on the establishment of patterns of how the cost of paid parking lots and their quantity influence transport demand with respect to the means of transport and transportation methods, and, consequently, the efficiency of traffic management and the environmental sustainability of the urban transport system. Establishing these patterns allows us to formulate recommendations to improve the environmental sustainability of urban transport systems, taking into account the specifics and characteristics of Russian cities and transport systems.
Thus, the management of transport demand by regulating the cost of parking and the number of parking spaces can improve the environmental sustainability of the transport system. All measures that increase the environmental sustainability of the city’s transport system can be divided into groups according to several criteria:
  • Direct and restrictive in nature (restriction of entry to certain areas for vehicles with a low emission class or all vehicles, restrictions on the use of diesel buses on city routes, and introduction of requirements in the tender documentation for the use of electric buses and vehicles on natural gas);
  • Direct (development of the road network and reduction in the unevenness of vehicle traffic due to an increase in the share of main streets of continuous traffic in the total number of roads in the city, introduction of the adaptive control of traffic lights, and development of intelligent transport systems);
  • Indirect and stimulating in nature (free parking in the city center for electric vehicles, development of a network of bike lanes, bike rentals, and reduced fares for public transport).
The combination of these measures, the impact of each of them individually, and as part of a set of measures are possible using simulation modeling of traffic flows and calculating the coefficient of environmental sustainability of the urban transport system. Choosing a set of the most effective measures will reduce the negative impacts of vehicles on the environmental situation in cities.
Simulation allows us to determine the maximum number of cars in the transport system to maintain environmental sustainability at the ultimate level. These results can be useful to municipal authorities to formulate a strategy for a comfortable and environmentally sound functioning of the city; determine a set of measures to stimulate the use of environmentally friendly modes of transport; simulate measures for their development; and determine demotivating and prohibitive measures for the use of environmentally obsolete vehicles. The environmental sustainability criterion can be taken into account when determining the architecture of intelligent transport systems (ITS) and the number of its elements, as well as when setting up algorithms and control modes for traffic lights. In areas with the highest air pollution from vehicles, measures can be taken to restrict vehicles of a low emission class and (or) all vehicles with internal combustion engines.

Author Contributions

Conceptualization, D.Z.; formal analysis, A.F.; investigation, D.Z., A.F.; project administration, D.Z., D.C.; methodology, D.Z.; supervision, D.Z.; validation, D.Z., D.C.; data curation, A.F.; funding acquisition, D.Z.; writing—review and editing, D.C. All authors have read and agreed to the published version of the manuscript.

Funding

This research was funded by the Russian Ministry of Education and Science on the project: “New patterns and solutions for the functioning of urban transport systems in the paradigm ‘Transition from owning a personal car to mobility as a service’” (No. 0825-2020-0014, 2020-2022)

Conflicts of Interest

The Authors declare no conflict of the interests.

References

  1. Bergström, P.; Malefors, C.; Strid, I.; Hanssen, O.J.; Eriksson, M. Sustainability Assessment of Food Redistribution Initiatives in Sweden. Resources 2020, 9, 27. [Google Scholar] [CrossRef] [Green Version]
  2. Sustainable Development. Shanghai Manual: A Guide for Sustainable Urban Development in the 21st Century. Available online: https://sustainabledevelopment.un.org/index.php?page=view&type=400&nr=633&menu=35 (accessed on 27 May 2020).
  3. Greengrowthknowledge. Integrated Approaches to Sustainable Infrastructure. Available online: https://www.greengrowthknowledge.org/sites/default/files/downloads/resource/Integrated_Approaches_To_Sustainable_Infrastructure_UNEP.pdf (accessed on 27 May 2020).
  4. Genon, G.; Panepinto, D.; Viggiano, F.; Magaril, E.; Abrzhina, L.; Magaril, R. Sustainability in automotive transport: Russian and Italian experience concerning actual situation and intervention tools. Int. J. Sustain. Dev. Plan. 2016, 11, 603–615. [Google Scholar] [CrossRef]
  5. Reyes-Rubiano, L.S. Sustainable urban freight transport: A simheuristic approach. In Proceedings of the Winter Simulation Conference (WSC), Las Vegas, NV, USA, 3–6 December 2017; Volume Part F134102, pp. 4620–4621. [Google Scholar] [CrossRef]
  6. Currie, G.; De Gruyter, C. Exploring links between the sustainability performance of urban public transport and land use in international cities. J. Transp. Land Use 2018, 11, 325–342. [Google Scholar] [CrossRef] [Green Version]
  7. Qian, Y.; Ding, L.; Wang, W.; Qiao, G. Green level and sustainability evaluation with bus enterprises. CICTP 2017: Transportation Reform and Change—Equity, Inclusiveness, Sharing, and Innovation. In Proceedings of the 17th COTA International Conference of Transportation Professionals, Shanghai, China, 7–9 July 2017; pp. 3032–3041. [Google Scholar]
  8. Dinesh, M.; Geetam, T. Sustainable Transport Systems: Linkages between Environmental Issues, Public Transport, Non-Motorised. Econ. Political Wkly. 1999, 34, 1589–1596. [Google Scholar]
  9. Keay, K.; Simmonds, I. The Association of Rainfall and Other Weather Variables with Road Traffic Volume in Melbourne, Australia. Accid. Anal. Prev. 2005, 37, 109–124. [Google Scholar] [CrossRef]
  10. Koetse, M.J.; Rietveld, P. The impact of climate change and weather on transport: An overview of empirical findings. Transp. Res. Part. D 2009, 14, 205–221. [Google Scholar] [CrossRef]
  11. Cottrill, C.D.; Derrible, S. Leveraging big data for the development of transport sustainability indicators. J. Urban Technol. 2015, 22, 45–64. [Google Scholar] [CrossRef]
  12. The Russia Government. On Approval of Requirements for the Integrated Development Programs of the Transport Infrastructure of Settlements, Urban Districts. Available online: http://static.government.ru/media/files/yztKbOi0Ya02aon6yE9W6mfAFet6BAqX.pdf (accessed on 27 May 2020).
  13. Arts, J.; Hanekamp, T.; Dijkstra, A. Integrating land-use and transport infrastructure planning: Towards adaptive and sustainable transport infrastructure. In Proceedings of the Transport Research Arena (TRA) 5th Conference: Transport Solutions from Research to Deployment, Paris, France, 14–17 April 2014. [Google Scholar]
  14. Liao, Y.; Gil, J.; Pereira, R.H.M.; Yeh, S.; Verendel, V. Disparities in travel times between car and transit: Spatiotemporal patterns in cities. Sci. Rep. 2020, 10, 4056. [Google Scholar] [CrossRef]
  15. Anisimov, I.; Burakova, A.; Chainikov, D.; Magaril, E.; Magaril, R.; Panepinto, D.; Zanetti, M.C.; Rada, E.C. Climate change mitigation: Hypothesis-formulation and analysis of interventions. Wit Trans. Ecol. Environ. 2018, 230, 387–398. [Google Scholar] [CrossRef] [Green Version]
  16. Stroe, C.-C.; Panaitescu, V.N.; Ragazzi, M.; Rada, E.C.; Ionescu, G. Some considerations on the environmental impact of highway traffic. Rev. De Chim. 2014, 65, 152–155. [Google Scholar]
  17. Magaril, E.; Magaril, R. Fuel Quality: Challenges to the Sustainable Development of Automobile Transport and Approach to Solution. In Proceedings of the International Conference on Sustainable Cities (ICSC 2016), E3s Web Conference 2016, Ekaterinburg, Russia, 19 May 2016; Kortov, S., Terlyga, N., Eds.; EDP Sciences: Lesulis, France; Volume 6, p. 03001. [CrossRef] [Green Version]
  18. The World Bank. CO2 Emissions from Transport (% of Total Fuel Combustion). Available online: http://data.worldbank.org/data-catalog/world-development-indicators (accessed on 27 May 2020).
  19. Gent. Mobiliteit in Cijfers. Available online: https://stad.gent/nl/mobiliteit-openbare-werken/mobiliteit/plannen-projecten-subsidies-cijfers-scholenwerking/mobiliteit-cijfers-0 (accessed on 27 May 2020).
  20. HSE. The Role of Bicycles in Changing the City Transport System. Available online: https://publications.hse.ru/mirror/pubs/share/folder/42r16c0llc/direct/188170750 (accessed on 27 May 2020).
  21. CBS. 4 Procent Lopend Naar Het Werk. Available online: https://www.cbs.nl/nl-nl/nieuws/2018/14/4-procent-lopend-naar-het-werk (accessed on 27 May 2020).
  22. Autostat. The Car Market of RUSSIA—2020. Available online: https://www.autostat.ru/research/product/365/ (accessed on 27 May 2020).
  23. Dolganova, I.; Rödl, A.; Bach, V.; Kaltschmitt, M.; Finkbeiner, M. A Review of Life Cycle Assessment Studies of Electric Vehicles with a Focus on Resource Use. Resources 2020, 9, 32. [Google Scholar] [CrossRef] [Green Version]
  24. Bloomberg. Electric Vehicle Outlook 2019. BNEF’s Annual Long-Term Forecast of Global Electric Vehicle (EV) Adoption to 2040. Available online: https://about.bnef.com/electric-vehicle-outlook/#toc-download (accessed on 27 May 2020).
  25. Markets and Markets. Electric Vehicle Market by Vehicle (Passenger Cars & Commercial Vehicles), Vehicle Class (Mid-priced & Luxury), Propulsion (BEV, PHEV & FCEV), EV Sales (OEMs/Models) Charging Station (Normal & Super) & Region—Global Forecast to 2030. Available online: https://www.marketsandmarkets.com/Market-Reports/electric-vehicle-market-209371461.html (accessed on 27 May 2020).
  26. Chikishev, E.; Ivanov, A.; Anisimov, I.; Chainikov, D. Prospects of and problems in using natural gas for motor transport in Russia. In IOP Conference Series: Materials Science and Engineering Electronic Edition; National Research Tomsk Polytechnic University: Tomsk, Russia, 2016; Volume 142, p. 12110. [Google Scholar] [CrossRef]
  27. Engerer, H.; Horn, M. Natural gas vehicles: An option for Europe. Energy Policy 2010, 38, 1017–1029. [Google Scholar] [CrossRef]
  28. Dementiev, V.V.; Koklin, I.M. About the construction of CNG RSs and LNG RSs to expand the use of NGV market. In Autogas Filling Complex + Alternative Fuel; JSC Mechanical Engineering Publishing: Moscow, Russia, 2014; Volume 4, pp. 34–50. [Google Scholar]
  29. Santos, G.; Behrendt, H.; Teytelboym, A. Policy Instruments for Sustainable Road Transport. Res. Transp. Econ. 2010, 28, 46–91. [Google Scholar] [CrossRef]
  30. Shepelev, V.; Aliukov, S.; Nikolskaya, K.; Shabiev, S. The capacity of the road network: Data collection and statistical analysis of traffic characteristics. Energies 2020, 13, 1765. [Google Scholar] [CrossRef] [Green Version]
  31. Shepelev, V.; Aliukov, S.; Nikolskaya, K.; Das, A.; Slobodin, I. The Use of Multi-Sensor Video Surveillance System to Assess the Capacity of the Road Network. Transp. Telecommun. 2020, 21, 15–31. [Google Scholar] [CrossRef] [Green Version]
  32. Zakharov, D.; Magaril, E.; Rada, E.C. Sustainability of the urban transport system under changes in weather and road conditions affecting vehicle operation. Sustainability 2018, 10, 2052. [Google Scholar] [CrossRef] [Green Version]
  33. Hamre, A.; Buehler, R. Commuter mode choice and free car parking, public transportation benefits, showers/lockers, and bike parking at work: Evidence from the Washington, DC Region. J. Public Transp. 2014, 17, 67–91. [Google Scholar] [CrossRef] [Green Version]
  34. Van Ommeren, J.N.; Wentink, D.; Rietveld, P. Empirical evidence on cruising for parking. Transp. Res. Part A Policy Pract. 2012, 46, 123–130. [Google Scholar] [CrossRef] [Green Version]
  35. Wilson, R.W. Estimating the travel and parking demand effects of employer-paid parking. Reg. Sci. Urban Econ. 1992, 22, 133–145. [Google Scholar] [CrossRef]
  36. Yakimov, M.R. Determination of the Optimal Number of Parking Spaces Based on the Formulation and Solution of the Optimization Problem of the Transport Demand Distribution. In Proceedings of the Systems of Signals Generating and Processing in the Field of on Board Communications, Moscow, Russia, 20–21 March 2019; p. 8706750. [Google Scholar] [CrossRef]
  37. Noy, K.; Givoni, M. Is ’′smart mobility′ sustainable? Examining the views and beliefs of transport′s technological entrepreneurs. Sustainability 2018, 10, 422. [Google Scholar] [CrossRef] [Green Version]
  38. Disney, J.; Rossiter, W.; Smith, D.J. Nottingham Express Transit: The role of green innovation in the drive for sustainable mobility through improved public transport. Int. J. Entrep. Innov. 2018, 19, 56–68. [Google Scholar] [CrossRef]
  39. Errampalli, M.; Chalumuri, R.S.; Nath, R. Development and evaluation of an integrated transportation system: A case study of Delhi. In Proceedings of the Institution of Civil Engineers: Transport, Delhi, India, 21 May 2018; Volume 171, pp. 75–84. [Google Scholar] [CrossRef]
  40. McCahill, C.; Garrick, N.; Atkinson-Palombo, C.; Polinski, A. Effects of Parking Provision on Automobile Use in Cities: Inferring Causality. Transp. Res. Rec. J. Transp. Res. Board 2016, 2543, 159–165. [Google Scholar] [CrossRef] [Green Version]
  41. Shoup, D.; Yuan, Q.; Jiang, X. Charging for Parking to Finance Public Services. J. Plan. Educ. Res. 2017, 37, 136–149. [Google Scholar] [CrossRef]
  42. Hamer, P.; Currie, G.; Young, W. Equity Implications of Parking Taxes. Transp. Res. Rec. J. Transp. Res. Board 2012, 2319, 21–29. [Google Scholar] [CrossRef]
  43. Litman, T. How More Efficient Parking Pricing Can Help Solve Parking and Traffic Problems, Increase Revenue. Available online: https://vtpi.org/parkpricing.pdf (accessed on 10 July 2020).
  44. Deakin,, E.; Harvey, G.; Pozdena, R.; Yarema, G. Transportation Pricing Strategies for California: An Assessment of Congestion, Emissions, Energy and Equity Impacts; California Air Resources Board: Sacramento, CA, USA, 1996. [Google Scholar]
  45. COVID-19 Impact on Traffic Intensity in Pilsen. Available online: http://innoconnect.net/covid-19-impact-on-traffic-intensity-in-pilsen (accessed on 10 July 2020).
  46. Traffic Intensity Before, During and After Intelligent Lockdown Measures in the Netherlands. Available online: https://www.ams-institute.org/news/traffic-intensity-during-and-after-intelligent-lockdown-measures-netherlands (accessed on 10 July 2020).
  47. PTV AG, PTV Visum Manual. Available online: http://cgi.ptvgroup.com/vision-help/VISUM_18_ENG/ (accessed on 23 July 2020).
Figure 1. Estimated value of emissions of harmful substances from the exhaust gases of car engines in Tyumen by 2040.
Resources 09 00100 g001
Figure 2. The impact of parking costs on the share of transfers to the paid parking area (historical center of the city): (a) by cars; (b) by public transport.
Resources 09 00100 g002
Figure 3. The impact of parking costs on the share of transfers to the paid parking area (central part of the city): (a) by cars; (b) by public transport.
Resources 09 00100 g003
Figure 4. The impact of parking costs on exhaust emissions of nitrogen oxides from automobiles: (a) paid parking zone is the historical city center; (b) paid parking zone is the central part of the city.
Resources 09 00100 g004
Figure 5. The impact of parking costs on total exhaust emissions of automobiles: (a) paid parking zone is the historical city center; (b) paid parking zone is the central part of the city.
Resources 09 00100 g005
Figure 6. The impact of parking costs on the total emissions of harmful substances from automobile exhaust gases in the city: (a) paid parking zone is the historical city center; (b) paid parking zone in the central part of the city.
Resources 09 00100 g006
Figure 7. The impact of parking costs on the coefficient of environmental sustainability of the transport system.
Resources 09 00100 g007
Table 1. Distribution of the parking cost and the number of parking spaces in Russian cities.
CityPopulation, PersonsNumber of Equipped Paid Parking SpacesTotal Number of Paid Parking SpacesCost, Ruble/Hour
Moscowmore than 10 millionundefined81,80040–380
St. Petersburgmore than 5 million221283860
Kazanmore than 1 million272more 260030–100
Nizhny Novgorod1645850
Voronezh1034about 600040
Rostov-on-Don897622835
Yekaterinburg195446130
Krasnodar1988128
Permianundefined132020
Tyumenmore than 500 thousand 547540
Ryazan420242920
Sochimore than 300 thousand 28101550
Vladimir1196
Tula110164740
Kaluga90113535
Belgorod191232230
Kursk831082
Stavropol432838
Tver1591188
Table 2. Changes in the number of correspondences with the introduction of paid parking and the expansion of the paid parking zone in the city.
IndicatorNumber of Correspondences, Units with
No Paid ParkingIntroduction of Paid Parking (40 Rubles per 1 h)Expansion of Paid Parking Zone (40 Rubles per 1 h)
number of transport and pedestrian correspondences to the historical city center, including147,346147,626147,716
by cars (including taxi, car sharing)74,05572,81672,518
by public transport49,96351,26051,523
by bicycle and means of personal mobility689688690
on foot22,63922,86222,985
Table 3. Changes in the number of correspondences with the introduction of paid parking in the historical city center (parameters in the coverage area of paid parking).
IndicatorNumber of Correspondences, Units with
No paid ParkingIntroduction of Paid Parking (40 Rubles per 1 h)Relative Change, %
number of transport and pedestrian correspondences to the historical city center, including24,94325,2881.4
by cars (including taxi, car sharing)10,1598937−12
by public transport943710,54111.7
by bicycle and means of personal mobility55597.3
pedestrian traffic529257518.7
Table 4. Changes in demand by means of transport and transportation methods around the city as a whole with the introduction of paid parking and the expansion of its zone.
Demand by Means of Transport and Transportation Methods Share of Demand, % with
No Paid ParkingIntroduction of Paid Parking (40 Rubles per 1 h)Expansion of Paid Parking Zone (40 Rubles per 1 h)
cars (including taxi, car sharing)50.049.148.8
public transport34.134.935
bicycle traffic0.50.50.5
pedestrian traffic15.415.615.6
Table 5. Changes in demand by means of transport and transportation methods with the introduction of paid parking in the historical city center.
Demand by Means of Transport and Transportation MethodsShare of Demand, % with
No Paid ParkingIntroduction of Paid Parking (40 Rubles per 1 h)Change
cars (including taxi, car sharing)40.635.25.4
public transport37.941.83.9
bicycle traffic0.20.20
pedestrian traffic21.322.81.5
Table 6. Changes in demand by means of transport and transportation methods with the introduction of paid parking in the central part of the city.
Demand by Means of Transport and Transportation MethodsShare of Demand, % with
No Paid ParkingIntroduction of Paid Parking (40 Rubles per 1 h)Change
cars (including taxi, car sharing)4036.4−3.6
public transport36.439.32.9
bicycle traffic0.20.230.03
pedestrian traffic23.624.40.8
Table 7. Changes in emissions of harmful substances from the exhaust gases of ICE vehicles in the entire city with the introduction of paid parking and the expansion of the paid parking zone.
Harmful Substances in Exhaust Gases of VehiclesAmount of Harmful Substance Emissions with
No Paid ParkingIntroduction of Paid Parking (40 Rubles per 1 h)Expansion of Paid Parking Zone (40 Rubles per 1 h)
CO2 emissions, kg110,300108,468108,159
CO emissions, kg163.3160.6160.26
NOx emissions, kg253.35249.2248.6
CH emissions, kg12.3712.1612.13
Other harmful substances (NH3, NMHC, PM, SO2, CH4, N2O, benzene), kg110.34108.54108.27
Total emissions (excluding CO2), kg539.34530.54529.25
Table 8. Changes in the number of correspondences when the cost of paid parking changes.
IndicatorNumber of Correspondences at a Cost of 1 h of Parking, Rubles (Paid Parking Zone is the Historical City Center), Units
04080120160200
number of transport and pedestrian correspondences to the historical city center, including24,88825,22925,86924,42426,37926,400
by cars (including taxi, car sharing)10,10488786725450349314855
by public transport943710,54112,35212,87413,92613,996
by bicycle and means of personal mobility555966637272
pedestrian traffic529257516726698474507476
Table 9. Changes in demand by means of transport and transportation methods when the cost of paid parking changes.
Demand by Means of Transport and Transportation MethodsShare of Demand, % at a Cost of 1 h of Parking, Rubles (Paid Parking Zone Is the Historical City Center)
04080120160200
cars (including taxi, car sharing)40.635.226.018.418.718.4
public transport37.941.847.752.752.853
bicycle traffic0.20.20.30.30.30.3
pedestrian traffic21.322.826.028.628.228.3
Table 10. Changes in emissions of harmful substances from automobile exhaust gases when the cost of paid parking changes.
Harmful Substances in Exhaust Gases of VehiclesEmissions of Harmful Substances at a Cost of 1 h of Parking, Rubles (Paid Parking Zone is the Historical City Center)
04080120160200
CO emissions, kg5.735.024.734.454.554.51
NOx emissions, kg8.837.887.296.786.896.85
CH emissions, kg0.440.400.340.320.330.33
Table 11. Changes in the number of correspondences when the cost of paid parking changes.
IndicatorNumber of Correspondences at a Cost of 1 h of Parking, Rubles (Paid Parking Zone is the Central Part of the City), Units
04080120160200
number of transport and pedestrian correspondences to the central part of the city, including45,57045,96746,74647,274166,83347,416
by cars (including taxi, car sharing)18,14816,60613,93712,09611,65611,570
by public transport16,56818,05420,33421,94122,34222,425
by bicycle and means of personal mobility100105116123125125
pedestrian traffic10,75411,20212,35913,114132,71013,296
Table 12. Changes in demand by means of transport and transportation methods when the cost of paid parking changes.
Demand by Means of Transport and Transportation MethodsShare of Demand, % at a Cost of 1 h of Parking, Rubles (Paid Parking Zone is the Central Part of the City)
04080120160200
cars (including taxi, car sharing)39.836.1729.8525.5424.6424.44
public transport36.439.343.546.447.147.3
bicycle traffic0.20.230.250.260.260.26
pedestrian traffic23.624.426.427.72828
Table 13. Changes in demand by means of transport and transportation methods in the city as a whole when the cost of paid parking changes.
Demand by Means of Transport and Transportation MethodsShare of Demand, % at a Cost of 1 h of Parking, Rubles (Paid Parking Zone is the Central Part of the City)
04080120160200
cars (including taxi, car sharing)50.0348.8346.8345.5345.1345.13
public transport34.135.036.437.337.637.6
bicycle traffic0.470.470.470.470.470.47
pedestrian traffic15.415.616.316.716.816.8
Table 14. Changes in emissions of harmful substances from automobile exhaust gases in the central part of the city when the cost of paid parking changes.
Harmful Substances in Exhaust Gases of VehiclesEmissions of Harmful Substances at a Cost of 1 h of Parking, Rubles (Paid Parking Zone is the Central Part of the City)
04080120160200
CO emissions, kg10.539.998.988.468.318.28
NOx emissions, kg16.2415.4213.7512.8512.6412.6
HC emissions, kg0.810.760.660.620.600.60
Fuel consumption (citywide), t34.9534.2733.2832.7832.5932.61