1. Introduction
The promotion of renewable energy has been a driving factor of European Union policies for a long time. The ever-increasing penetration of power generators from fluctuating renewable energy sources with hardly predictable, weather-dependent outputs brings new challenges to the reliable and secure operation of the electric power system [
1]. This increasing share of renewable energy sources creates adequate additional resources needed to cover the domestic demand for electricity and heat [
2] and cover the increasing consumption of energy, as well as the exhaustibility of fossil resources [
3].
The reduction of climate change and greenhouse gas emissions is an essential objective of the European Union [
4]. One of the important methods by which to cut down greenhouse gas emissions to less than half of the current level is greater production and use of renewable sources of energy. Over-exploitation of fossil fuels not only reduces their availability for subsequent generations but also intensifies the greenhouse gas effect [
5,
6,
7] in [
8], Lajdová et al. agree and state that resource strategy concern and the need for secure, clean and efficient energy that mitigates the environmental impact associated with fossil fuels are the main drivers of the deployment of renewable energy sources [
9]. Results of Mikulčić et al.′s research show that Sweden had the lowest environmental impact of European Union countries because of hydro energy and nuclear energy prevailing in the energy mix, without any fossil fuel contributions [
10]. On the other side, Poland is an example of such a country where conventional sources of energy cover more than 80% of the total energy demand—this means excessive emissions to the atmosphere [
11] in [
12]. It is necessary to look for possibilities to use resources other than fossil fuels because the economy must cope with the fact that mining costs will increase and finally the fossil fuel supply will be exhausted [
13]. The most applied market-based initiative enacted to mitigate climate change is the energy tax. In all European Union countries, higher tax rates on fossil fuel energy did not directly or indirectly correspond to lower greenhouse gas emissions [
14]. In general, determining options for reducing greenhouse gas emissions requires screening across all economic sectors to determine possibilities for implementing renewable systems. Research shows that this economy-wide transformation across all sectors is technically feasible for countries but it requires rapid and ambitious implementation on the policy side [
15,
16,
17] in [
18]. Article 6 of the Paris Agreement aims at promoting approaches that will assist in establishing a policy foundation for an emissions trading system—a mechanism to contribute, among other things, to the mitigation of global greenhouse gas emissions [
19]. The result of the climate summit, the COP25 (Madrid, Spain on December 2019), was disappointing (in the field of Article 6). One side is hopeful of increasing the ambition of achieving net-zero emissions/carbon neutrality; the other side is postponing important decisions (e.g., establishing a carbon market to accelerate countries´ efforts to reduce greenhouse gas emissions). What these negotiations have achieved is to create a foundation for continued progress so that truly convincing global measures to make the world carbon neutral by 2050 (will be agreed on at the COP26 in Glasgow) are implemented; the European Union will become carbon neutral by mentioned year (newly adopted European Green Deal) [
20]. From the political point of view, renewable energy sources have been dealt with by, e.g., Baldwin et al. They compared the policy instruments that influence renewable energy adoption across low, middle and high income countries [
21].
Investments in the power sector are characterized by high capital intensity and a long payback period [
22]. Global renewable energy investments have grown, exceeding investments in fossil fuel power in recent years [
23]—a shift in investments from fossil fuels to renewable energy could be underway [
24] in [
25]. New investments in renewable power and fuels in 2019 totaled USD 301.7 billion [
26]. In terms of sources, investments are divided into two groups: (i) private investments originate from project developers, corporations, commercial finance institutions, households and institutional investors [
27] and (ii) public investments, which include international, development and local finance institutions, export credit agencies and climate finance institutions [
28]. In order to direct future investment, it is necessary to understand the environmental footprint of projected energy growth scenarios, focusing on sustainable energy generation practices [
29]. The money raised for the next generation of the European Union will be invested into supporting member states with the green and digital transitions and national economies (€560 billion). This renewable energy support can hold the key to Europe´s future prosperity and resilience [
30].
Job creation is an important socioeconomic benefit of renewable energy deployment (e.g., renewable energy sector might reduce poverty [
31]). Three job categories can be identified according to the level of proximity to the economic activity under study: direct, indirect and induced jobs [
32]. Ram et al. affirm in their research that renewable energy technologies create more jobs than conventional energy technologies [
33], but renewable energy is generally more labor-intensive for producing electricity than conventional fossil-fueled power plants. [
34]. High unemployment rates and the continued use of highly polluting energy sources have the effect of reducing energy sustainability. In order to promote energy sustainability, policies that promote the culture and knowledge of new non-polluting energies are important. This result can be achieved through education, dissemination of professions related to ecology and the ecologically sustainable world [
35].
Results of this research show which member states of the European Union achieved above-average and below-average values in selected renewable energy indicators compared to the average values achieved in European Union countries in the monitored period of 2009–2016. This evaluation of European Union countries (as we remarked above) is set as the main objective. Principal component analysis is used to achieve the objective of this paper. The central idea of this analysis is to reduce the dimensionality of the data set, which consists of a large number of variables. In this paper, there are five renewable energy indicators (electricity generation, electricity capacity, investments from public financial institutions, number of employees and turnover achieved from the economic activities) which were chosen as input data. The results confirm their lack of change or their movement in the space between average, above-average and below-average values. Indicators help us to comprehensively evaluate the situation in European Union countries in the period of 2009–2016. There are many other indicators and models that can be used to analyze the situation in the renewable energy sector. For comparison, Mittal et al. used an agent-based approach, which can be used to test the effect of varying policy indicators (e.g., tax benefits) [
36]. Sakamoto and Managi used policy indicators, too. They studied the renewable energy sector by applying a decentralized economy model to analyze the subsidies awarded for renewable energy use [
37].
2. Materials and Methods
Member states of the European Union are the subject of the research: EU-27 (2009–2012); EU-28 (2013–2016). The two-letter ISO codes (ISO 3166 alpha-2) have been used for the member states, except for Greece and the United Kingdom of Great Britain and Northern Ireland, for which the abbreviations EL and UK are recommended. The member states have been monitored from the perspective of the situation with renewable energy sources. Renewable energy has been examined as a whole; it means water + wind + solar + geothermal + biomass energy.
The data (necessary for the research part of this paper) were provided by the following sources: IRENA (International Renewable Energy Agency) and Eurostat (Statistical Office of the European Communities).
The basic file represents data in the following structure (selected renewable energy indicators):
electricity generation (MWh per capita),
electricity capacity (MW per capita),
investments from public financial institutions (USD per capita),
number of employees (n per capita),
turnover achieved from the economic activities related to production, distribution, installation, operation and maintenance of equipment (USD per capita).
Principal component analysis (PCA) was used to achieve the main objective of this paper. The first step was to find the linear function α′
1x of the x elements, which has the greatest variability, where α1 is the vector of p constants (α
11, α
12… α
1p) and where symbol ′ transposes
A linear function α′
2x (which did not correlate with α′1x, which had maximum variability) was found, and so on, so that, at the k-th stage, the linear function α′kx was found. The k-th derived variable was the k-th PC axis. To correctly define and understand PC axes, it was important to focus on the fact that α′1x; α1 maximizes variability [α′
1x] = α′
1 ∑ α
1. The maximum was not reached for the final α
1, so a normalization constraint had to be introduced. The most practical limitation, in this case, was α′
1 α
1 = 1 (i.e., the sum of the squares of α1 is equal to one). To maximize α′
1 ∑ α
1, we used
where λ—Lagrange multiplier.
Differentiation for α
1 gives
where Ip—(p × p) unit matrix.
λ represented the eigenvalue of the sum and α
1 was the corresponding eigenvector. To determine which of the p eigenvectors maximized α
1, we used
where λ had to be the greatest possible value. Thus, α1 was the eigenvector corresponding to the largest eigenvalue of the sum and var (α′
1x) = α′
1∑α
1 = λ
1 [
38,
39].
Next, we used the k-means algorithm. We were able to identify five optimal clusters in the PC axis, to which European Union countries belonged.
3. Results and Discussion
Principal component analysis was used to achieve the main objectives of this paper. Five PC axes were created by applying PCA to available data. The first two axes (which explain the largest share of data variability) were used for the visualization—the PC1 and PC2 axes explain 57.18% of variability (
Table 1).
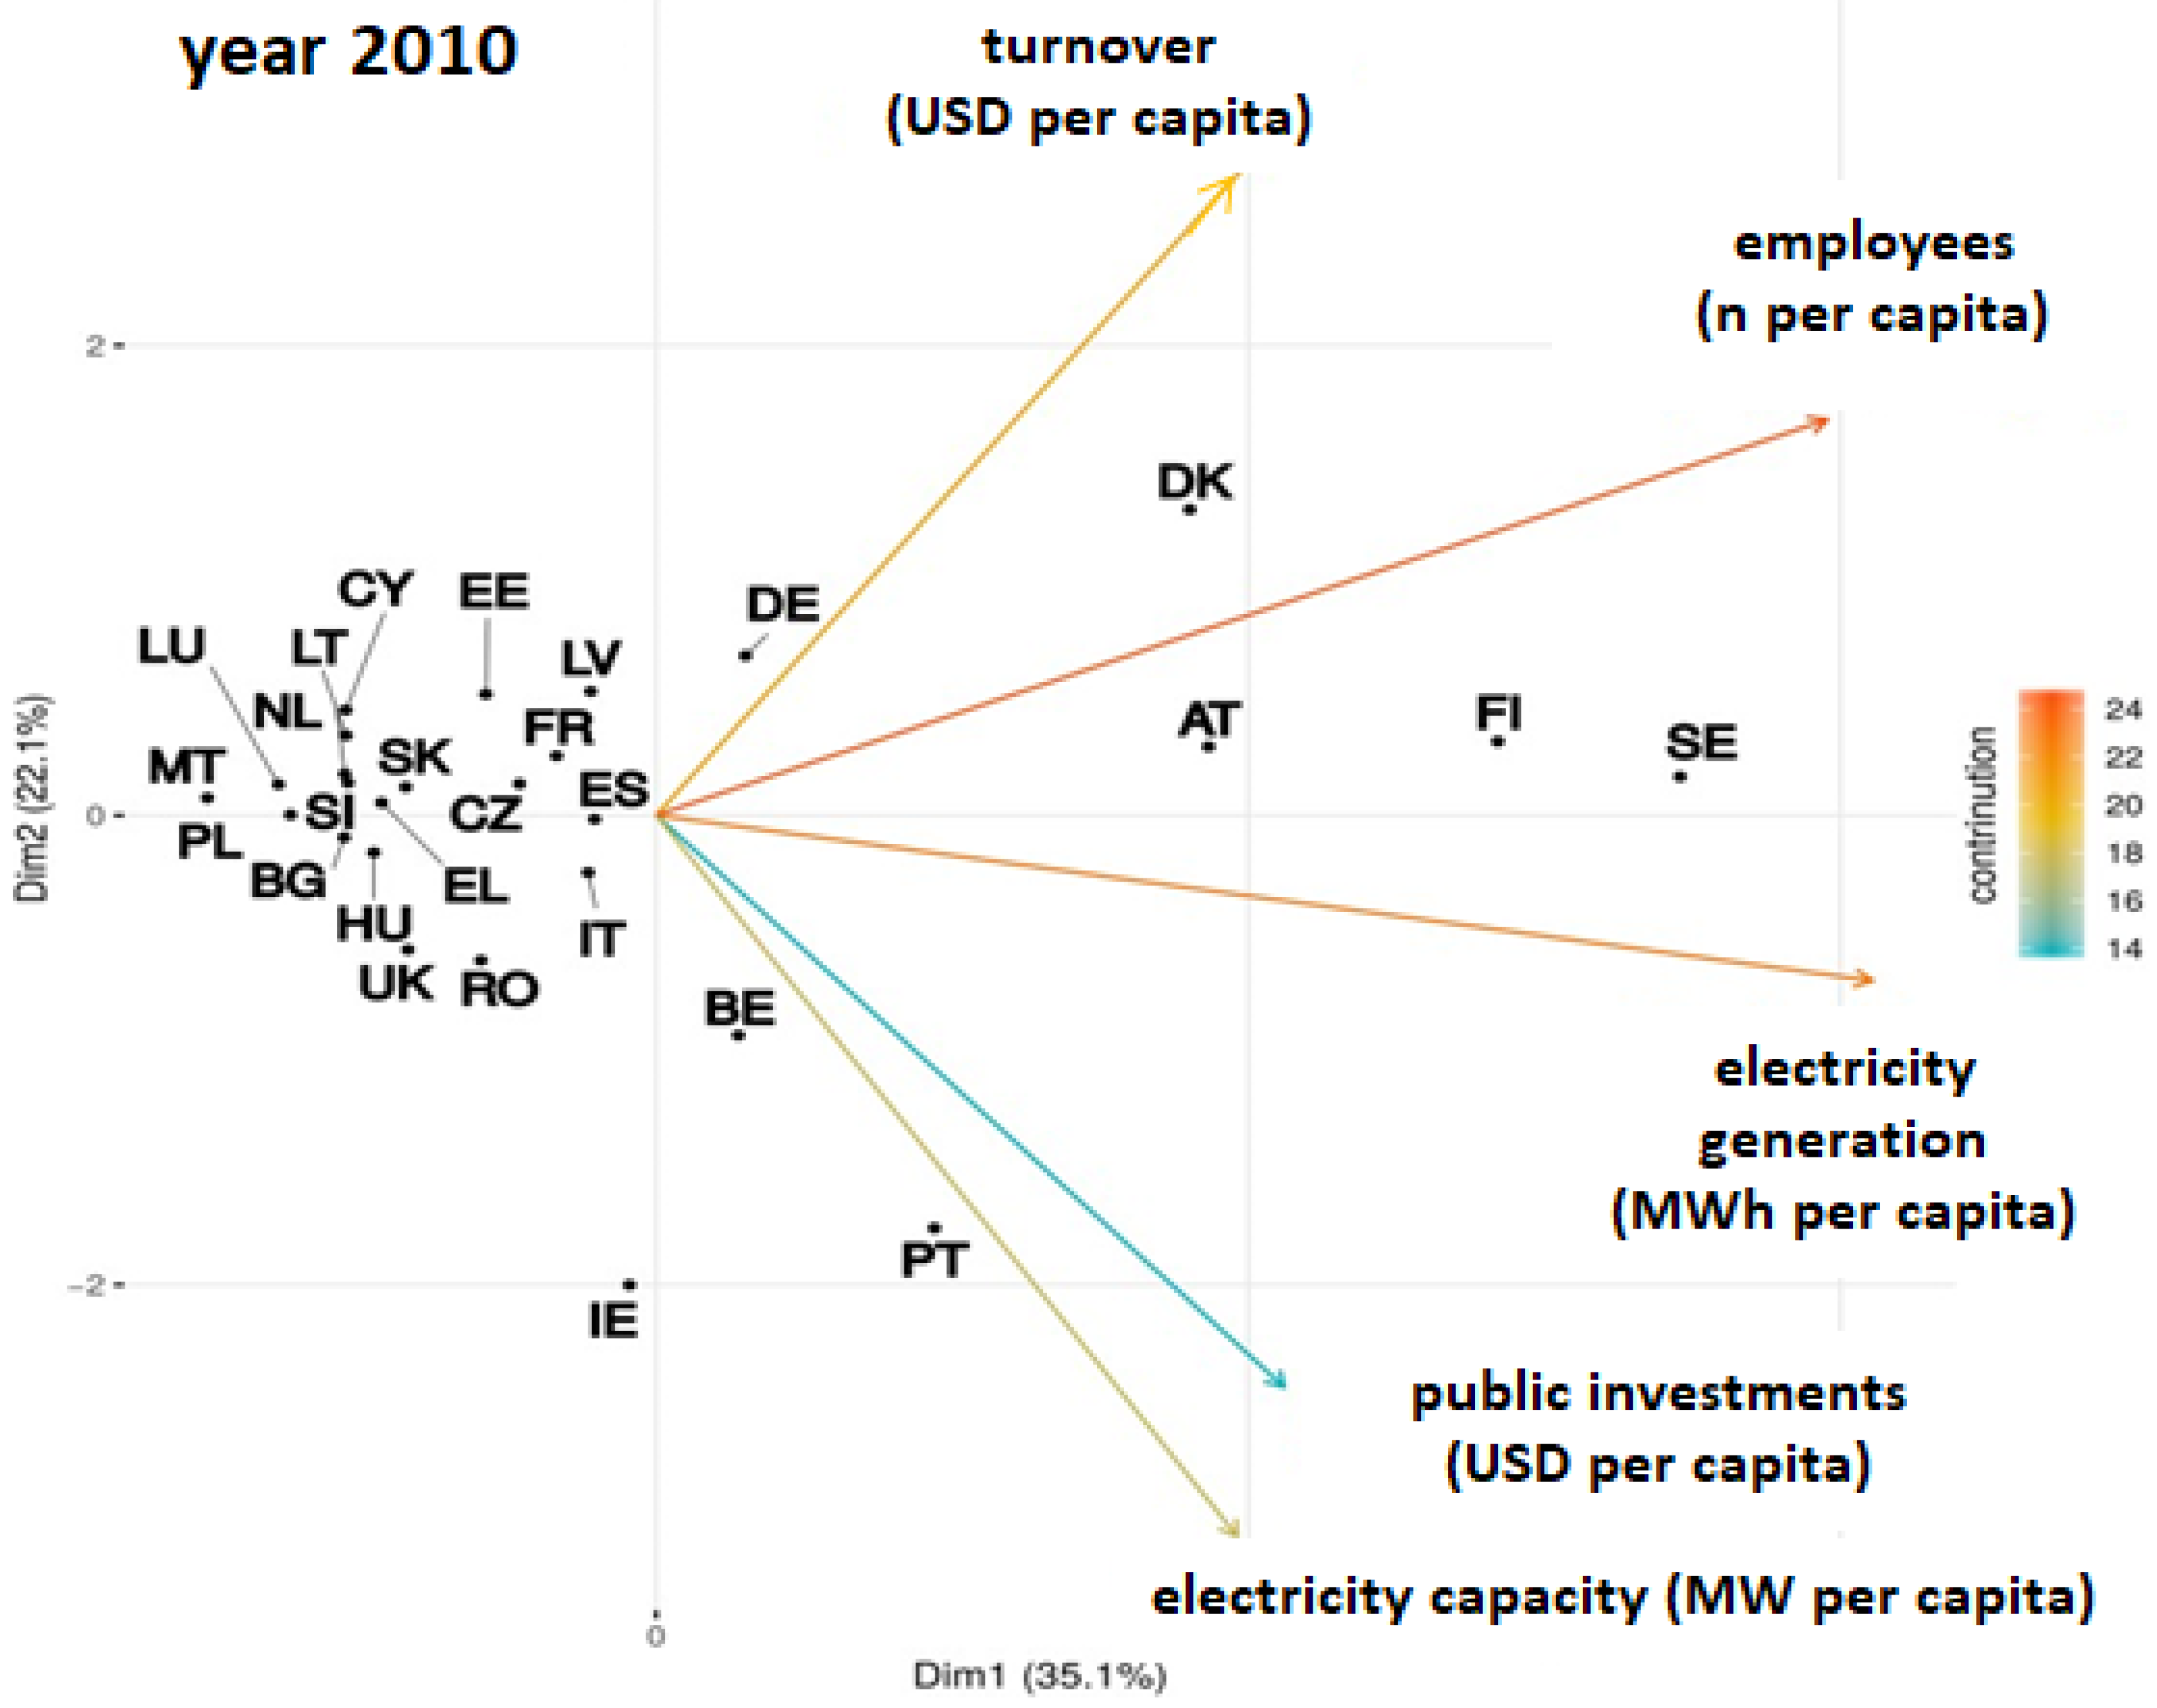
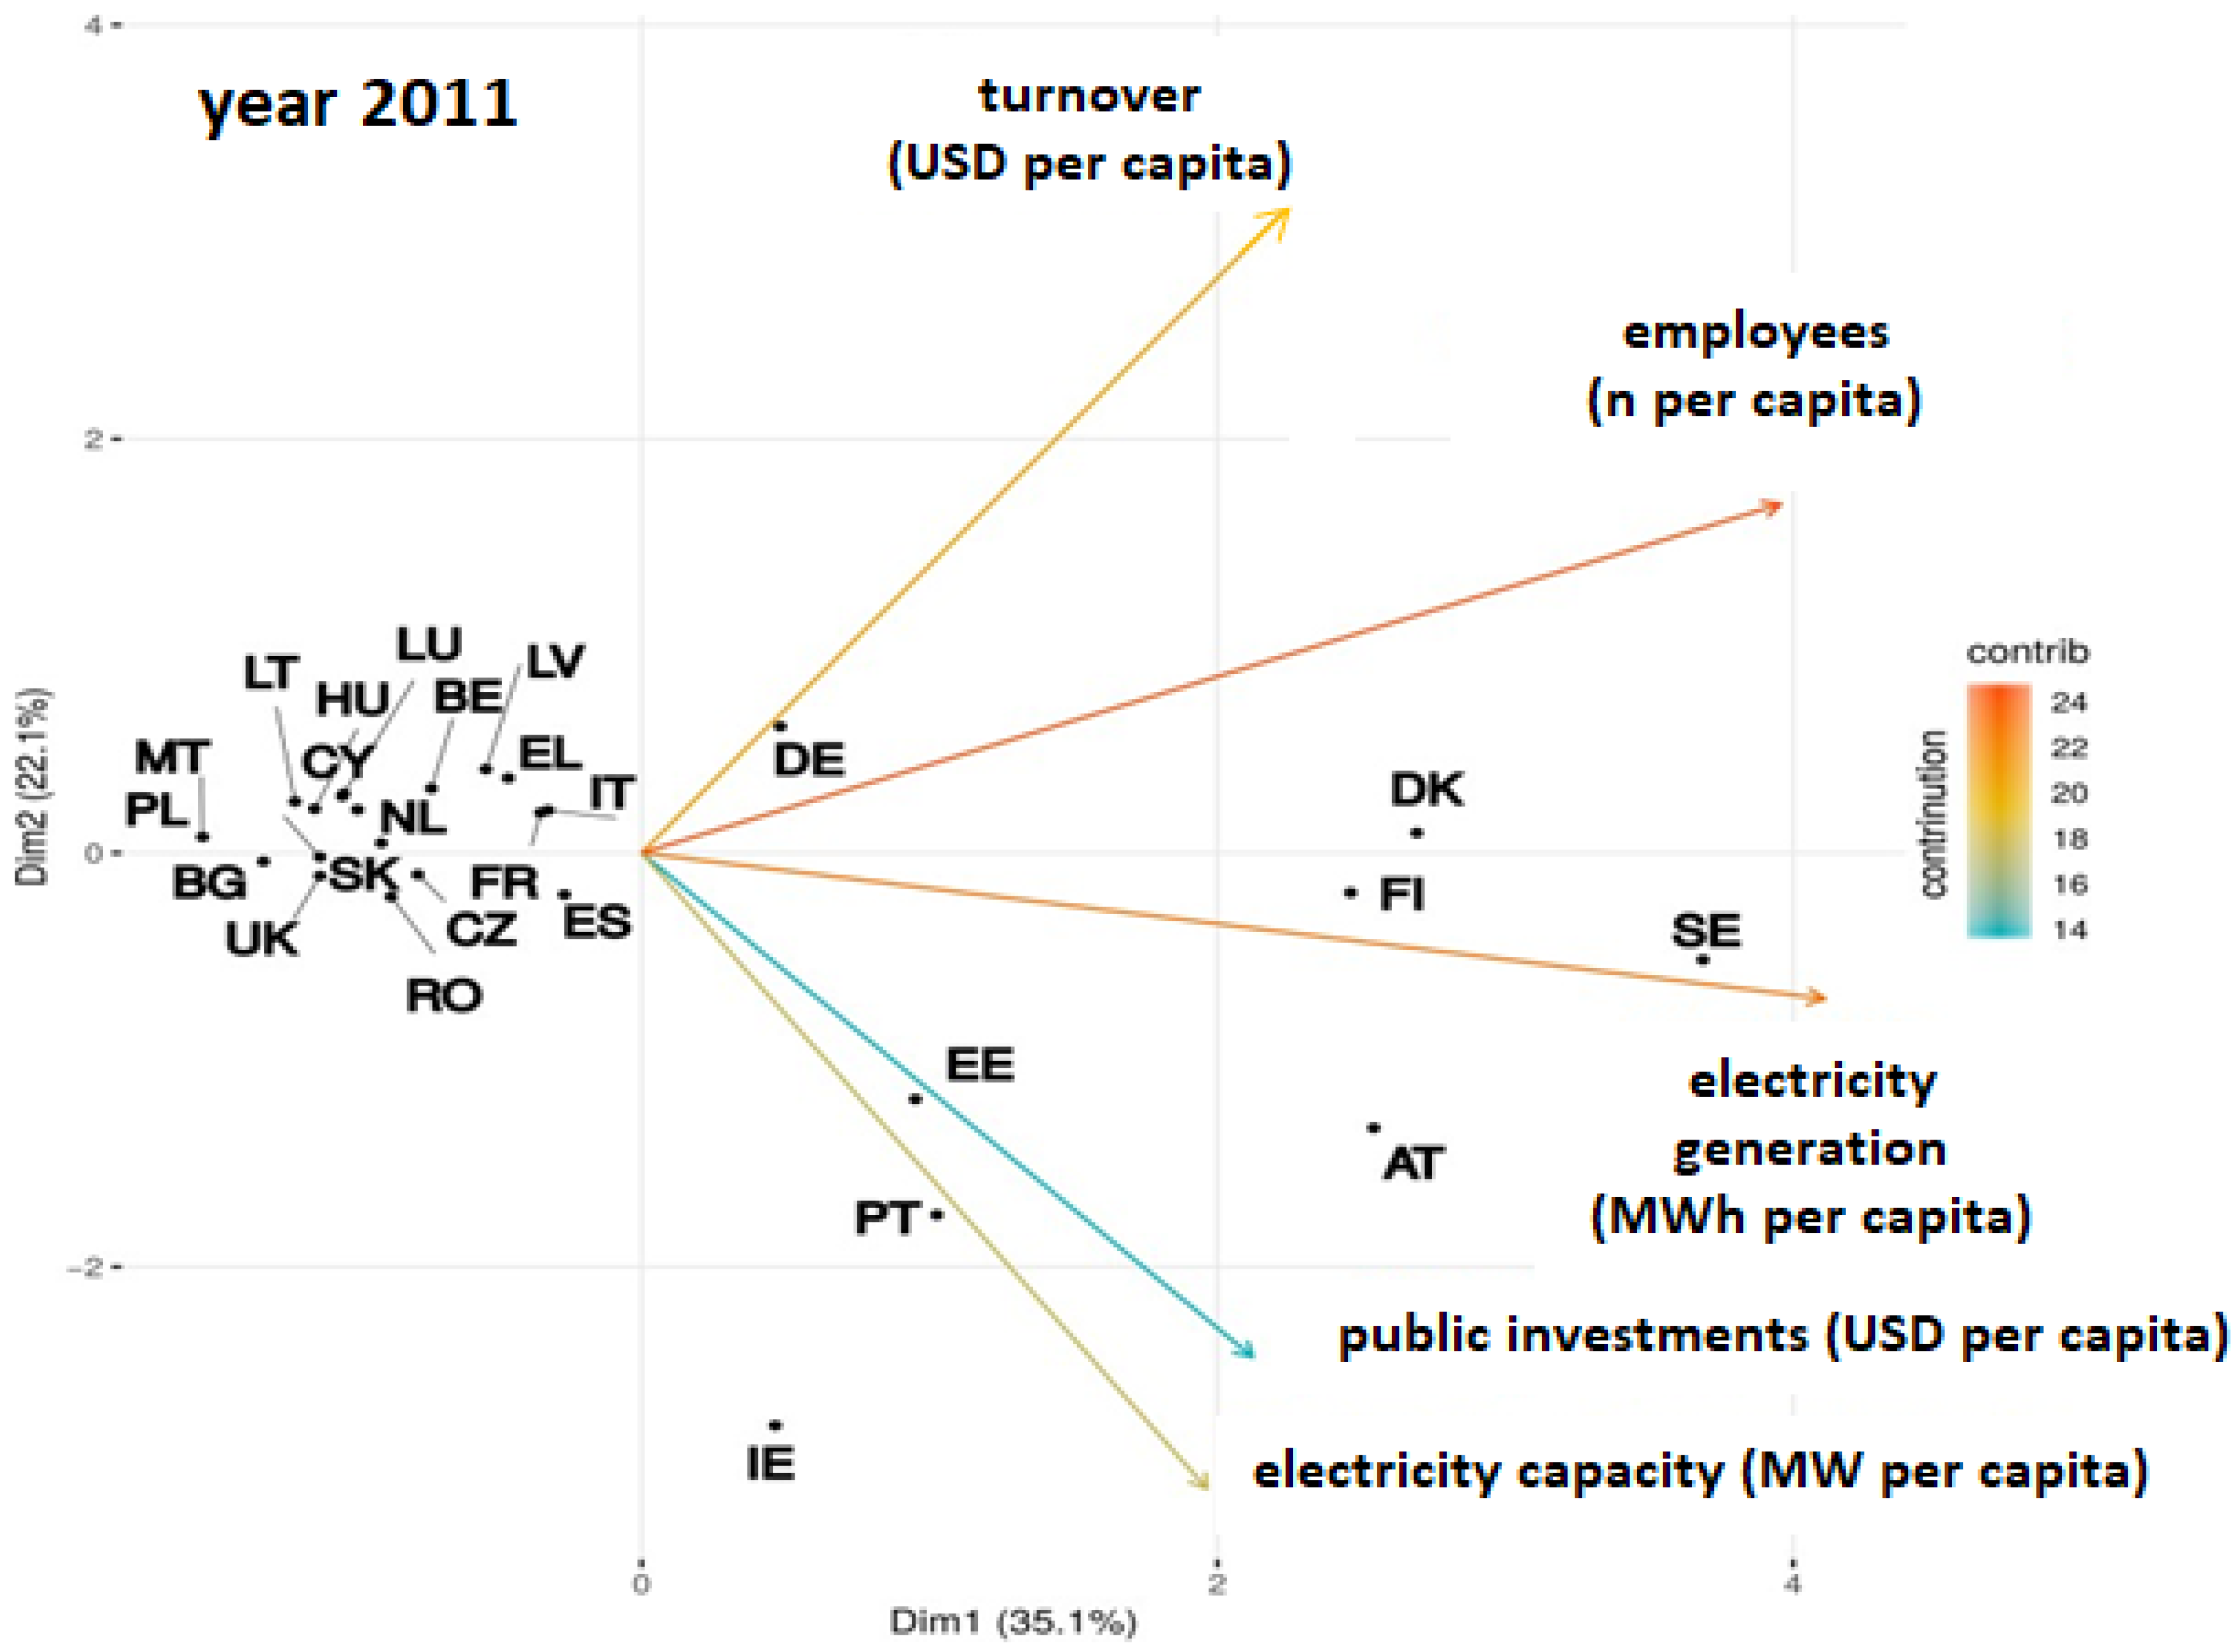
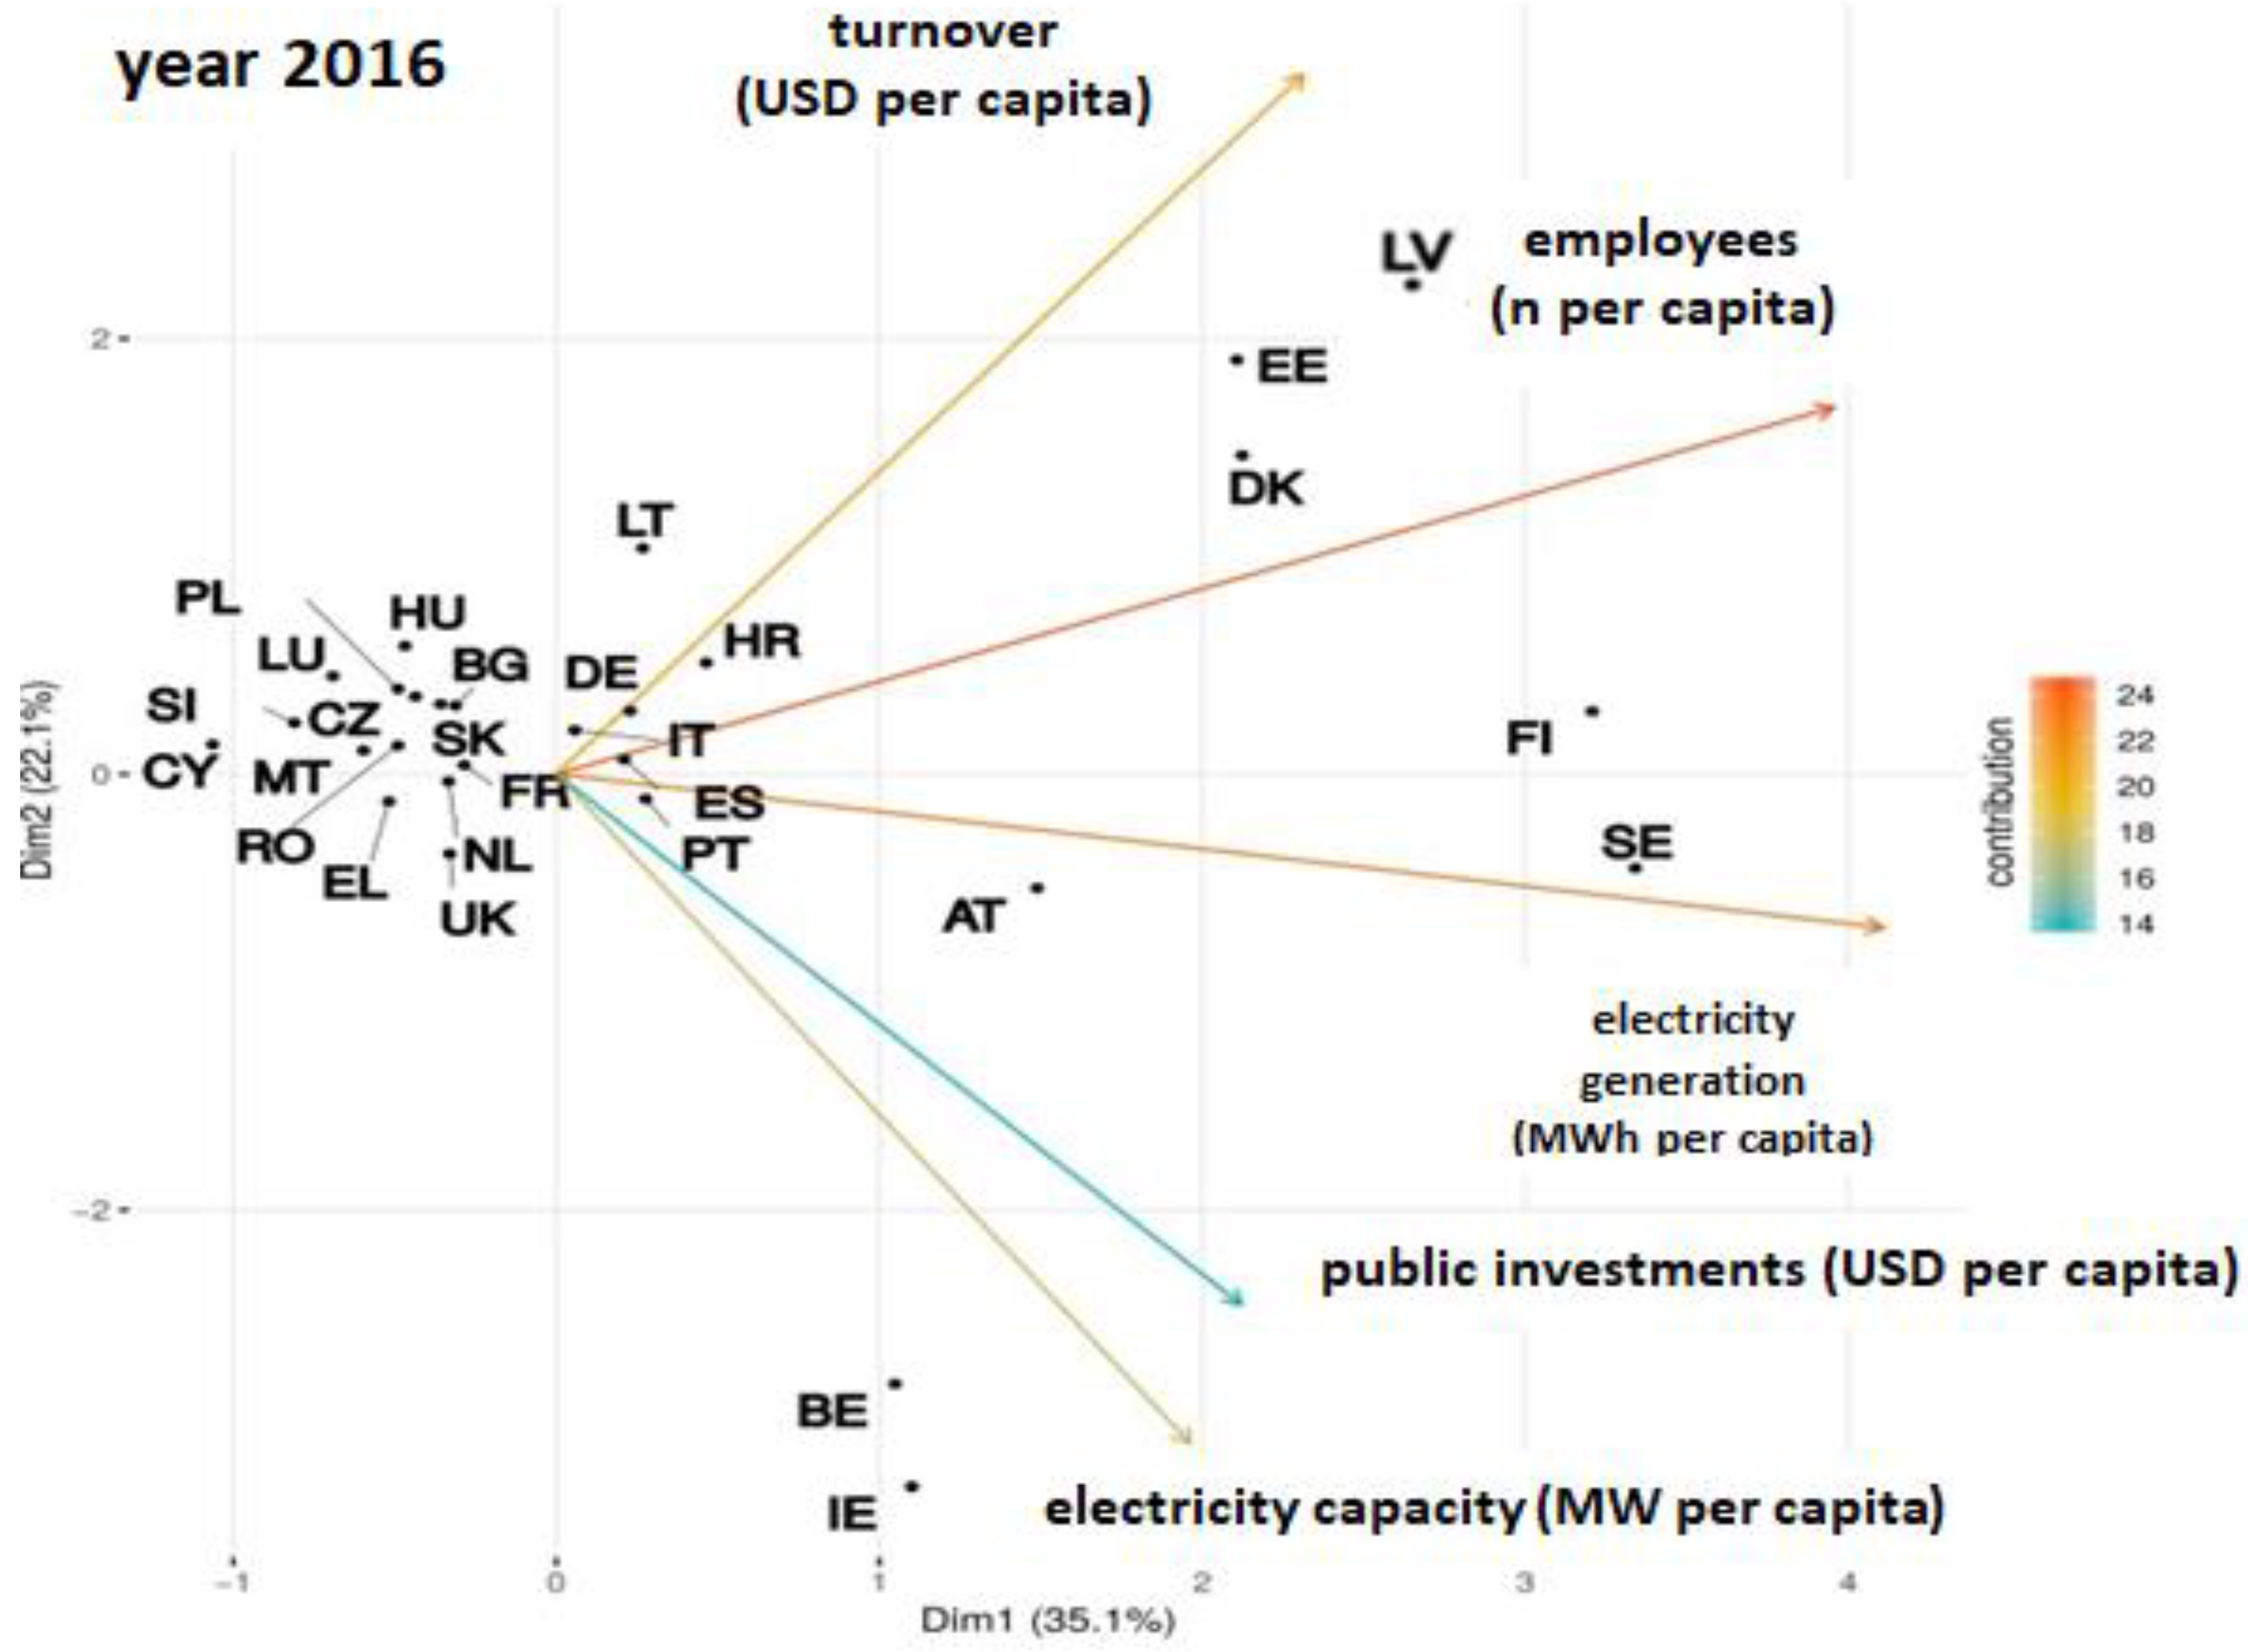
If the point, which indicates the EU-27 or the EU-28 member state, is in the direction of the arrow, the member state shows an above-average value; in the opposite direction of the arrow, it shows a below-average value compared to other states. The member state whose position is close to the central axis [0,0] shows the average value in almost all renewable energy indicators;
The longer the arrow, the more important the renewable energy indicator;
Arrows which point in the same direction symbolize those of the renewable energy indicators, which have a strong positive correlation. On the other hand, those directing away from each other have a strong negative correlation. A 90-degree angle of the arrows represents zero correlation;
Member states that are close to each other are more similar than those that are far apart.
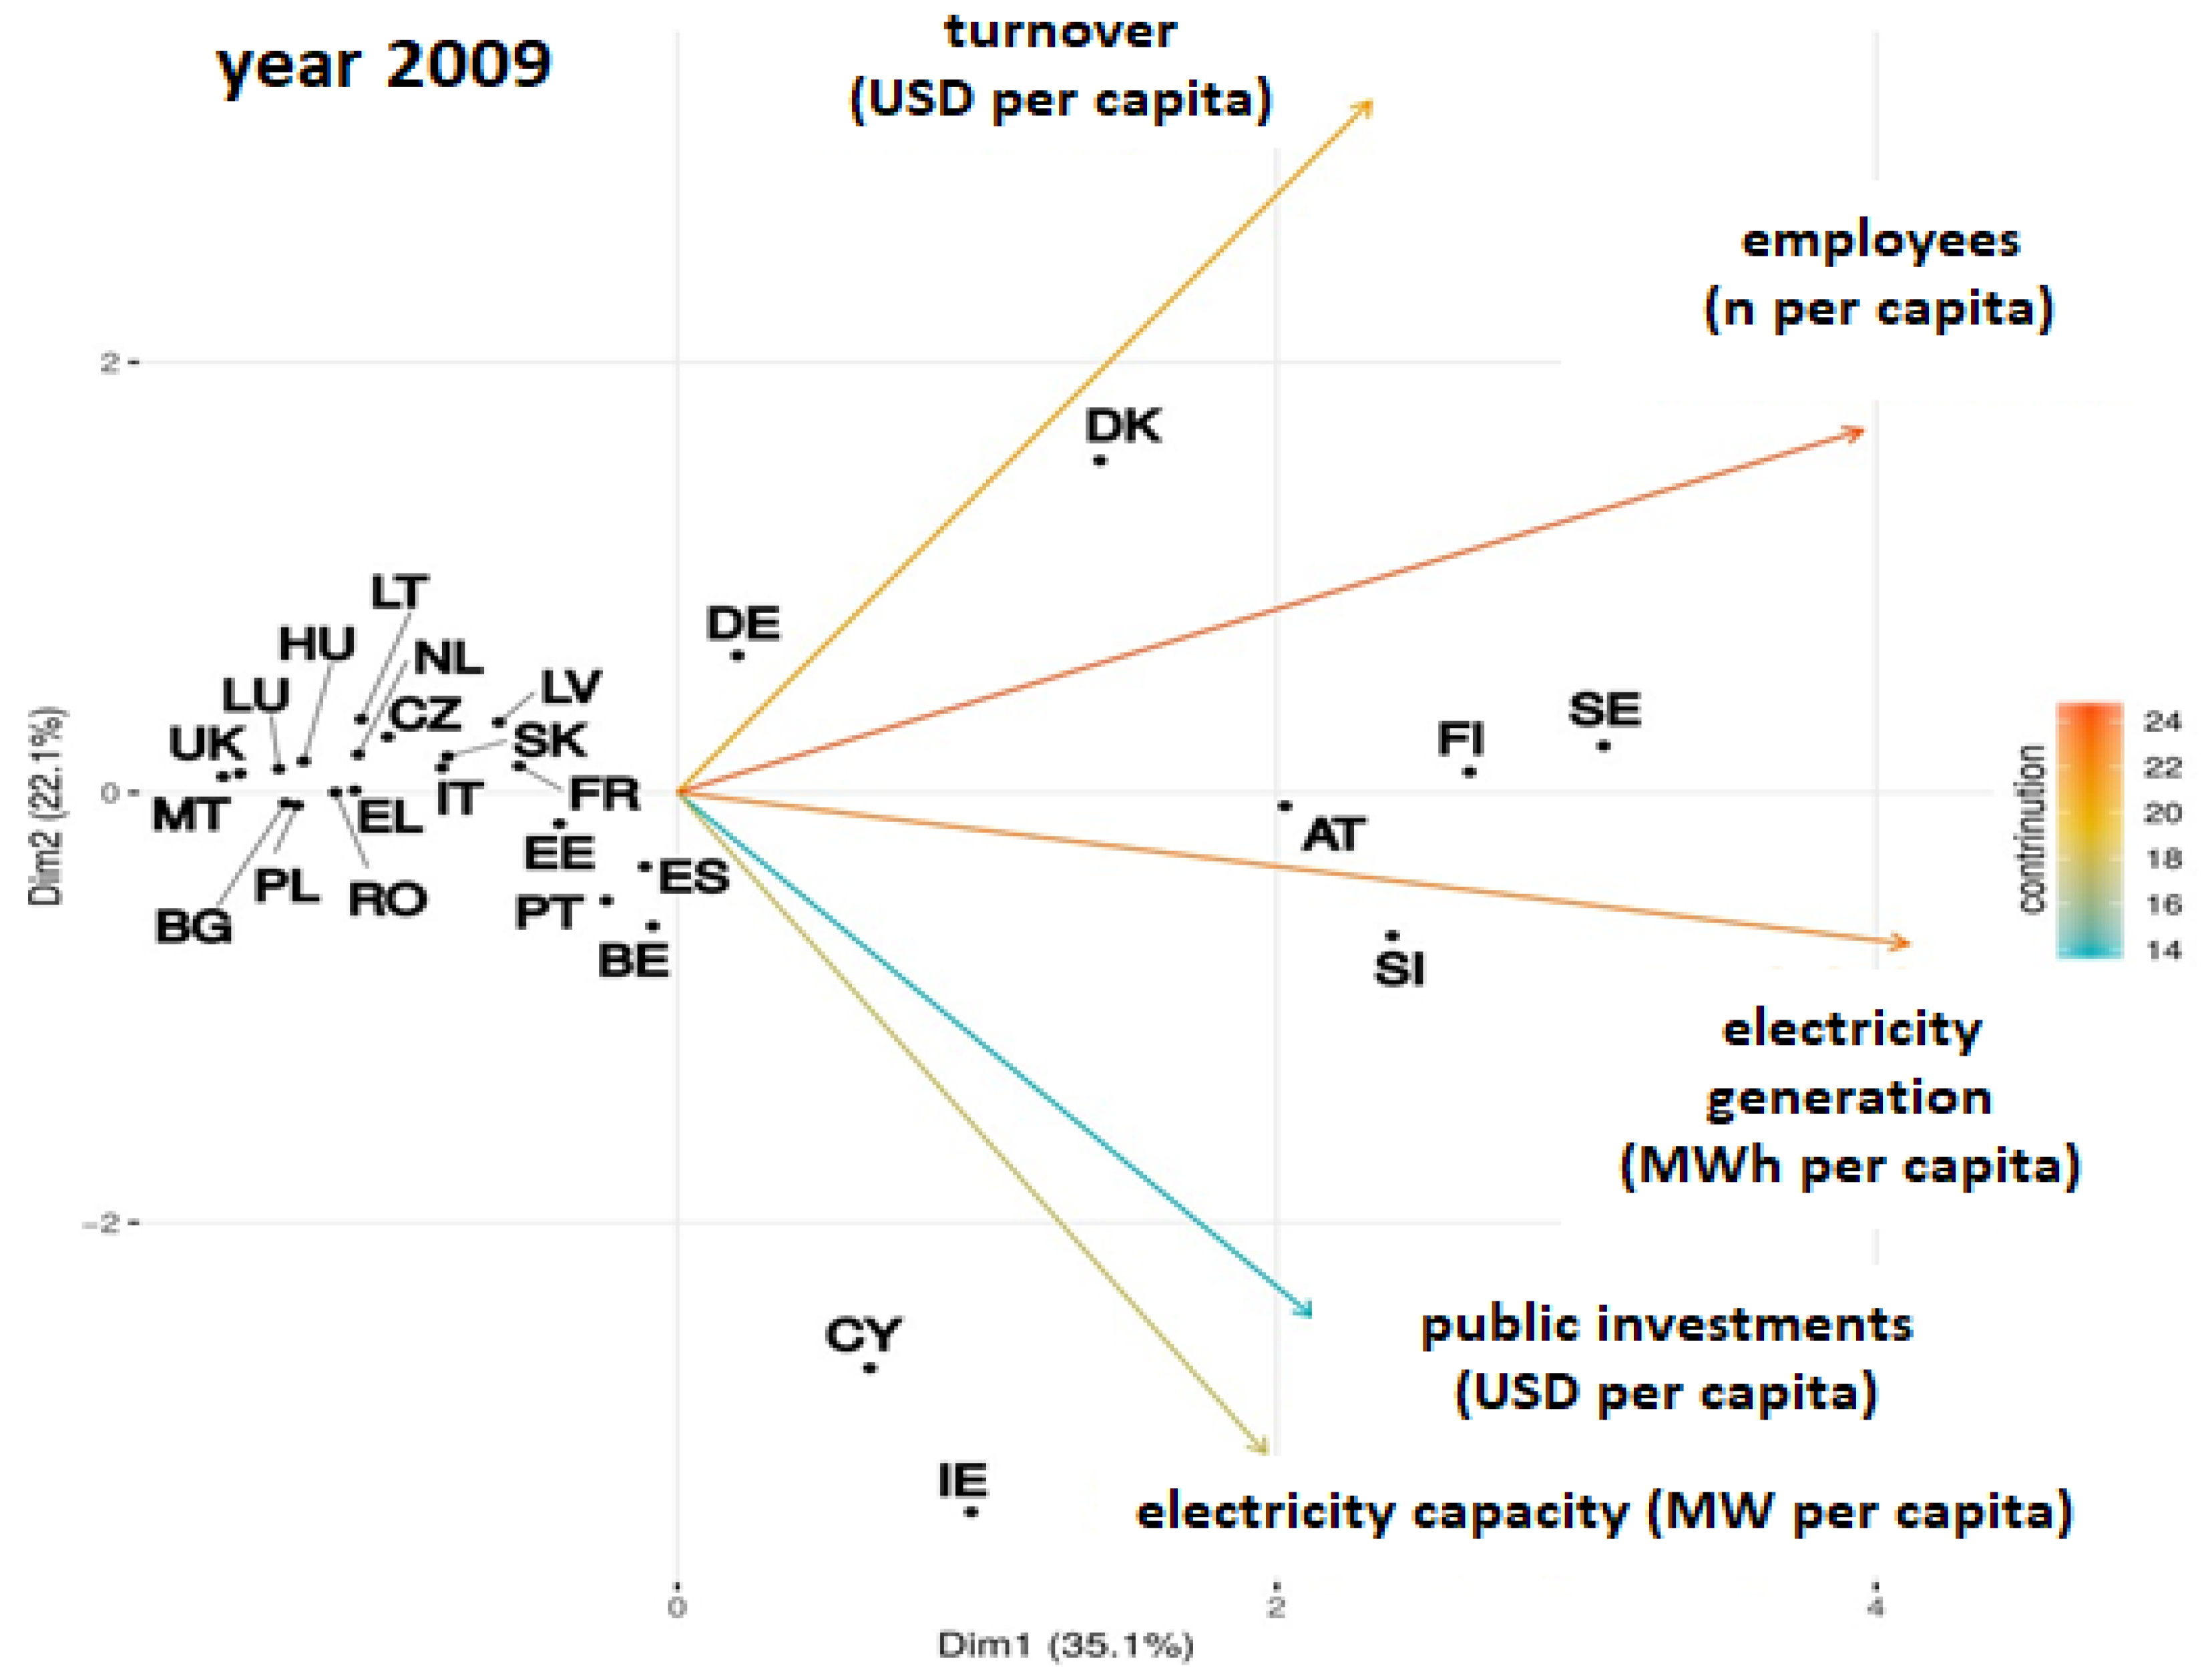
The above-average values in terms of electricity generation from renewable resources (considering the number of inhabitants of the EU-27) in comparison with other countries recorded Sweden (SE), Finland (FI), Slovenia (SI) and Austria (AT). The values of energy produced in these countries ranged between 4 and 12 MWh per capita. All of them produced most of their energy from renewable energy sources in the sector of hydro energy, which also represented the highest portion of the renewable energy mix for the whole EU in 2009. Among all renewable energy sources, hydropower seems to be more reliable and cleaner, and the most important feature of hydropower is lower emission of greenhouse gases [
40] in [
41]. Sweden, Finland, Slovenia and Austria also employed the highest number of people in the renewable energy sector in comparison to the rest of the EU countries. Based on the figure (
Figure 1), we can observe that Cyprus (CY) and Ireland (IE) had the highest flows of public investments into the renewable energy sector. Cyprus invested into the development of wind energy plants, close to the city of Pafos, in the south-west, in 2009. Ireland invested in the development of wind energy, too. The positions of Cyprus and Ireland in the chart, which we can observe (
Figure 1), prove the accelerated values of installed capacities of renewable energy facilities (public investments and electricity capacity for the use of renewable energy facilities show a strong correlation). The highest turnover is observed in the case of Denmark (DK)—this amounted to USD 1385 per capita, with a big lead over Germany (DE), where the value of turnover reached USD 421 per capita and is approaching the average values. Denmark achieved the highest turnover based on economic activity in the field of production, distribution and installation of facilities in the sector of wind energy, including in their operation and maintenance. Abolhosseini and Heshmati, based on their results, state that wind energy is the primary source in Denmark [
42]. The averaged values in almost all observed indicators (electricity generation, public investments, electricity capacity, number of employees and turnover) were recorded in the case of Spain (ES), France (FR), Belgium (BE), Estonia (EE) and Portugal (PT), as they lie close to the central coordinate. The rest of the EU-27 reported values relatively strongly below-average.
The reality of the EU-27 for 2010 is shown (
Figure 2). The positions of countries which reported values above the average in the sector of renewable energy sources in 2009 remained unchanged in 2010. Denmark (DK) achieved a turnover of USD 1442 per capita in 2010. Similarly, as in 2009, the turnover was achieved based on economic activity in the field of production, distribution and installation of facilities in the sector of wind energy, as well as their operation and maintenance. In terms of electricity generation from renewable energy sources, the situation changed in the case of Slovenia (SI). It moved from the zone of above-average production to the zone of below-average. This can be explained by the fact that, in 2010, only negligible data were available regarding the amount of energy generated from renewable resources. The highest flow of public investments in the field of renewable energy can be observed in the case of Portugal (PT) and Belgium (BE) (but it lies in the zone of average investments). Belgium, in comparison to 2009, invested in 2010 by USD 15 more per capita. The investment of Belgium was reflected in the building of a wind farm located on the sea, 35 km from the coast of Belgium. Portugal invested in 22 wind turbines with a newly installed capacity of 486 MW. The highest number of employees in the field of renewable energy was recorded in the cases of Austria (AT), Finland (FI), Sweden (SE) and Denmark (DK). It can be therefore stated that the situation in terms of the number of employees did not change when compared with the year 2009. Countries such as France (FR), Spain (ES), Italy (IT), Latvia (LV), Belgium (BE), the Czech Republic (CZ), Estonia (EE), Germany (DE) and Romania (RO) achieved average values in almost all indicators. The rest of the countries are situated in the zone below the average in all indicators.
In 2011, the highest values of the indicator “electricity generation from renewable resources in MWh per capita” were achieved by Finland (FI), Austria (AT), Sweden (SE) and Denmark (DK). Based on this, it can be stated that, in comparison with 2010, Sweden and Finland stayed in the zone of above-average production of energy. In addition to lying within the zone with high turnover and number of employees, in comparison to previous years, Denmark also lies in the zone with above-average electricity generation. The increased values of electricity generation in MWh per capita in Denmark can be observed in the sector of wind energy and bioenergy. High public investments reflected in the newly installed electricity capacities for renewable energy resources can be observed in the cases of Portugal (PT) and Estonia (EE). Two indicators, public investments and electricity capacity, are strongly correlated; therefore, it is complicated to differentiate their impact (although Ireland lies in the zone of above-average public investments and electricity capacities, it can be stated that, based on the available data, this is due to electricity capacities). The above-mentioned countries invested the most into the sector of wind energy, hydro energy and bioenergy. From the figure (
Figure 3), it is clear that Slovenia (SI) moved from the zone of countries below-average (considering almost all indicators) to the zone of above-average turnover, in relation to the EU-27 average. All the other countries reported average or below-average values in the case of almost all indicators.
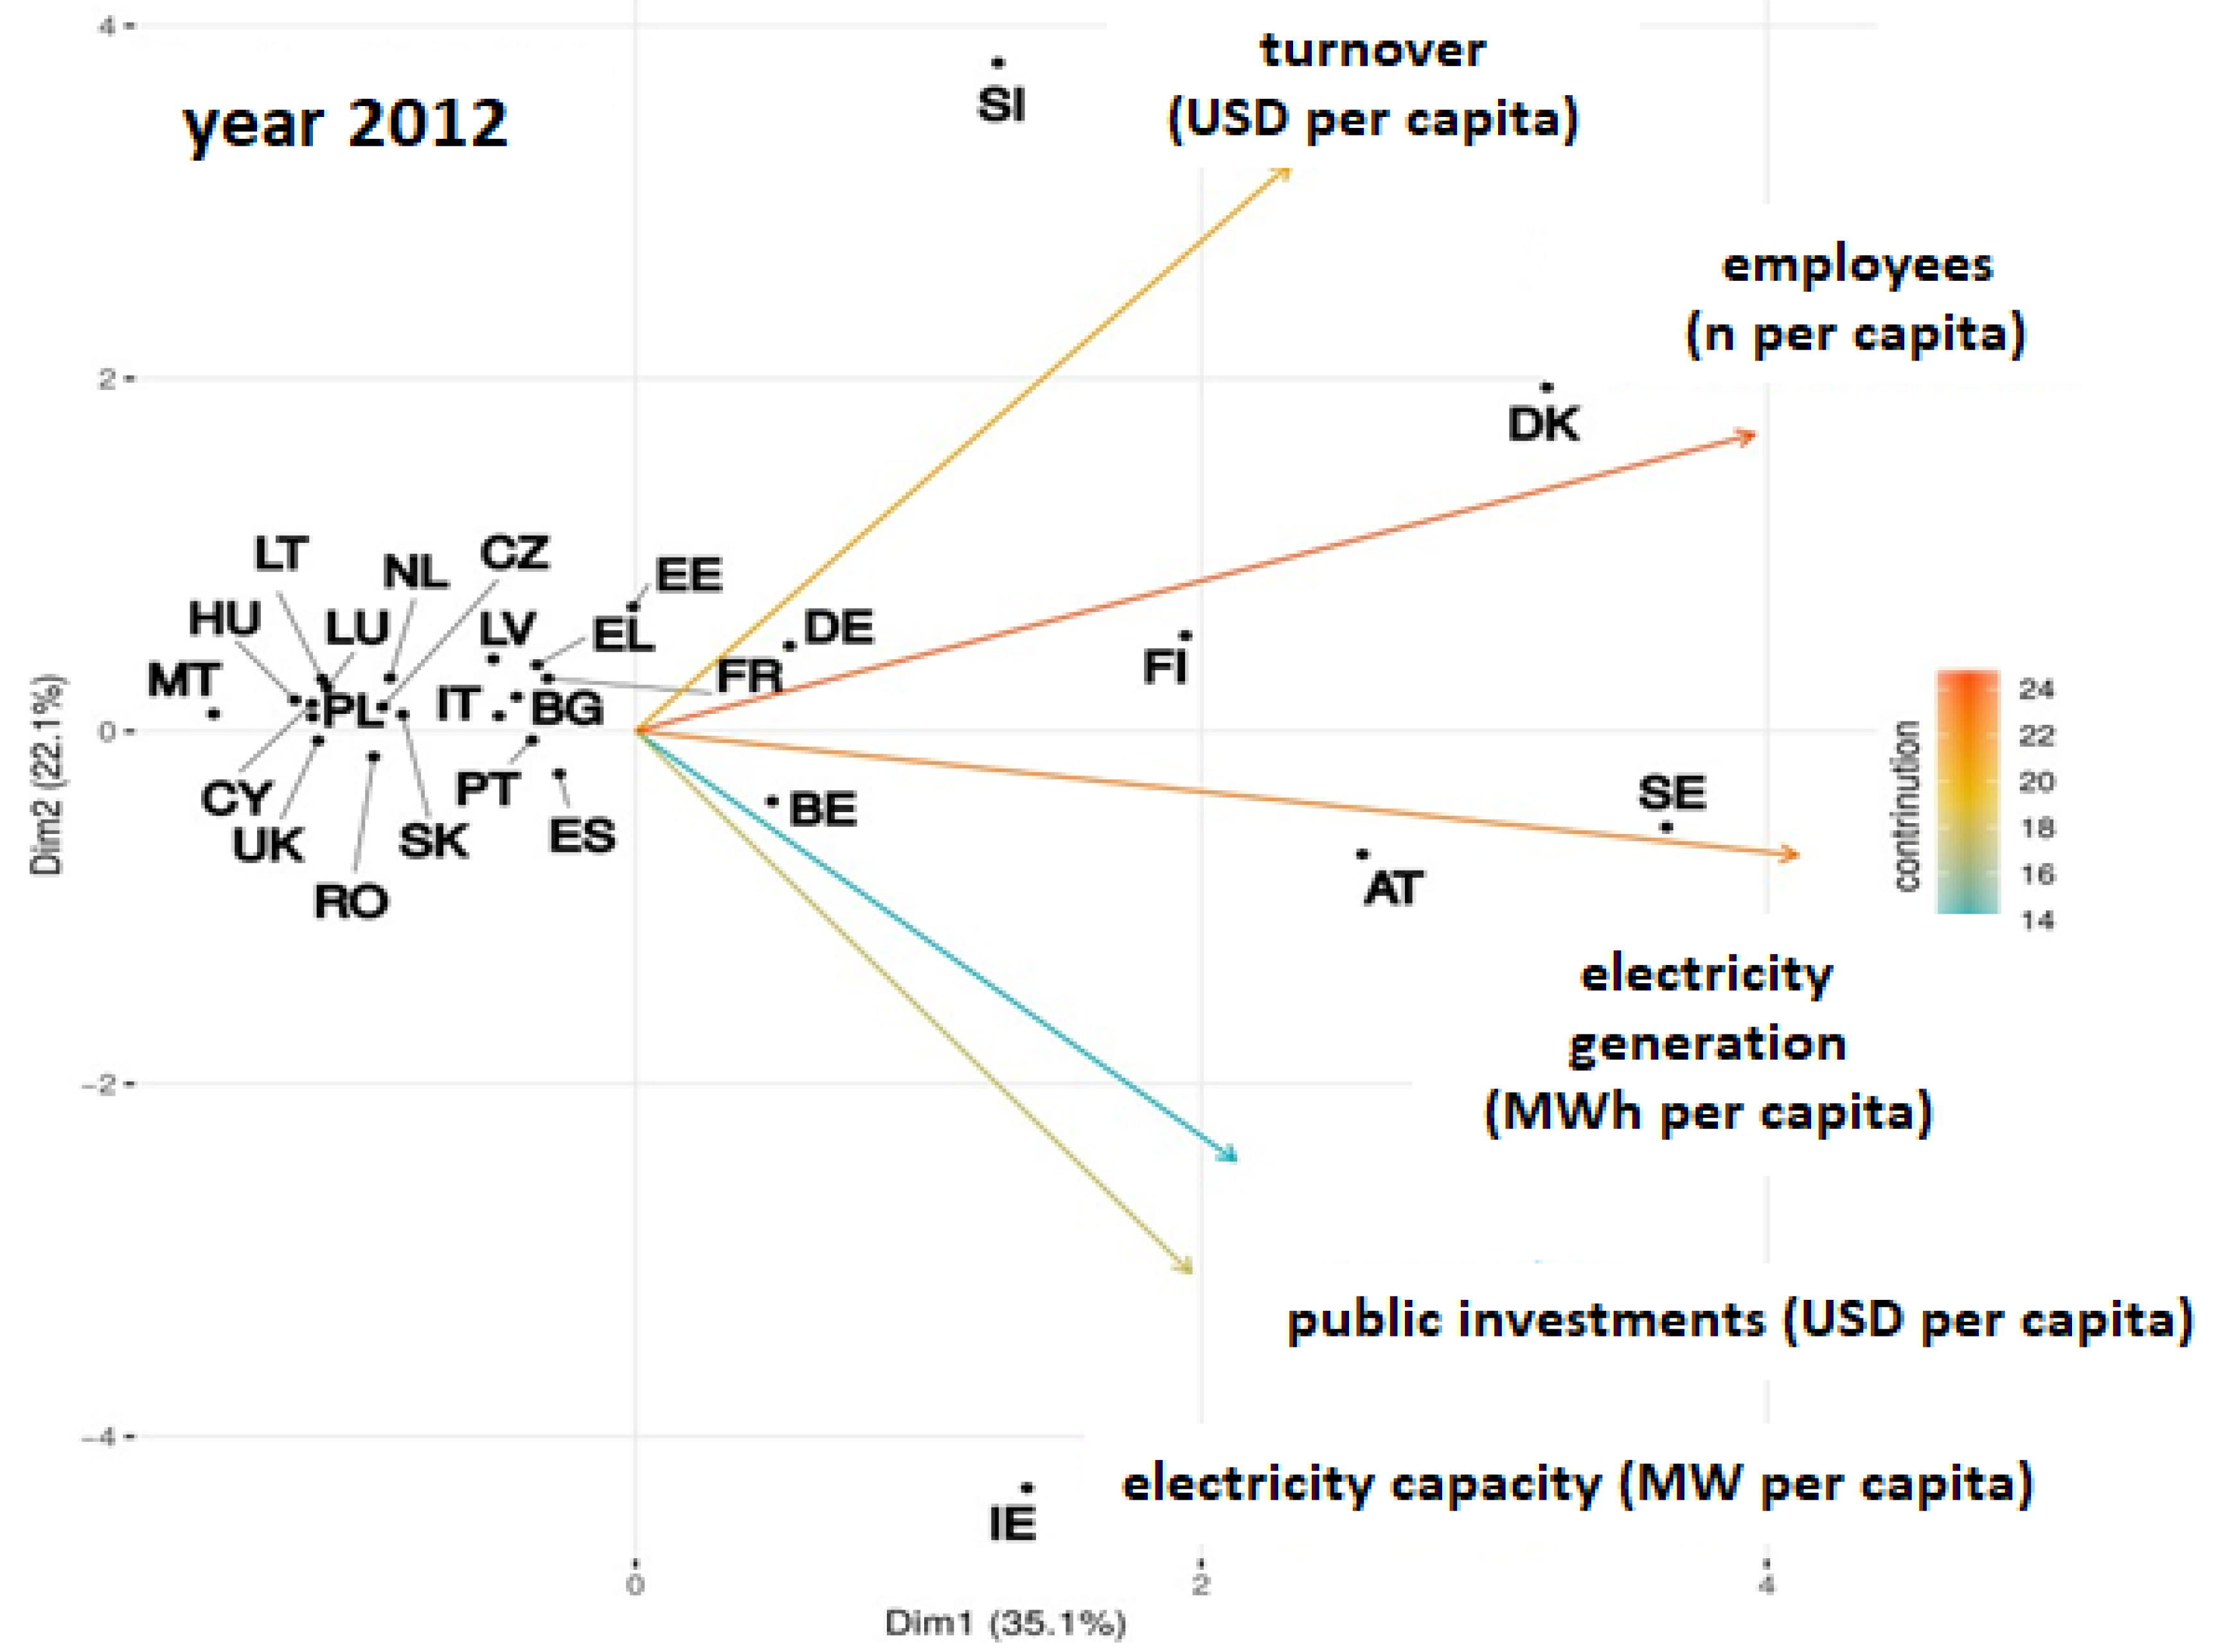
The last year observed within the countries of EU-27 was 2012. Values above-average in the case of the indicator of electricity generation from renewable resources in MWh per capita were reported for Sweden (SE)—10 MWh per capita—and Austria (AT)—6 MWh per capita. Most of the energy produced in these countries is from the sector of hydro energy. In consideration of the fact that the indicators of public investments and installed electricity capacities are strongly correlated (arrows of these indicators have an almost identical direction;
Figure 4), it can be stated that it is complicated to differentiate in which indicator Ireland (IE) achieved above-average values. Based on available data, we can assume that, in 2012, Ireland built seven wind farms with an overall newly installed capacity of 213.9 MW. When it comes to the above-average zone for turnover, Slovenia (SI) maintained the same position as in 2011 (especially in economic activity in the field of production, distribution and installation of facilities in the sector of solar energy, as well as their operation and maintenance). The above-average values for the number of employees in the sector of renewable energy sources were reported in the case of Denmark (DK) and Finland (FI). All the other observed countries of the EU-27, based on their position, have all the indicators in the average zone (approaching the central coordinate [0,0]) or values below the average.
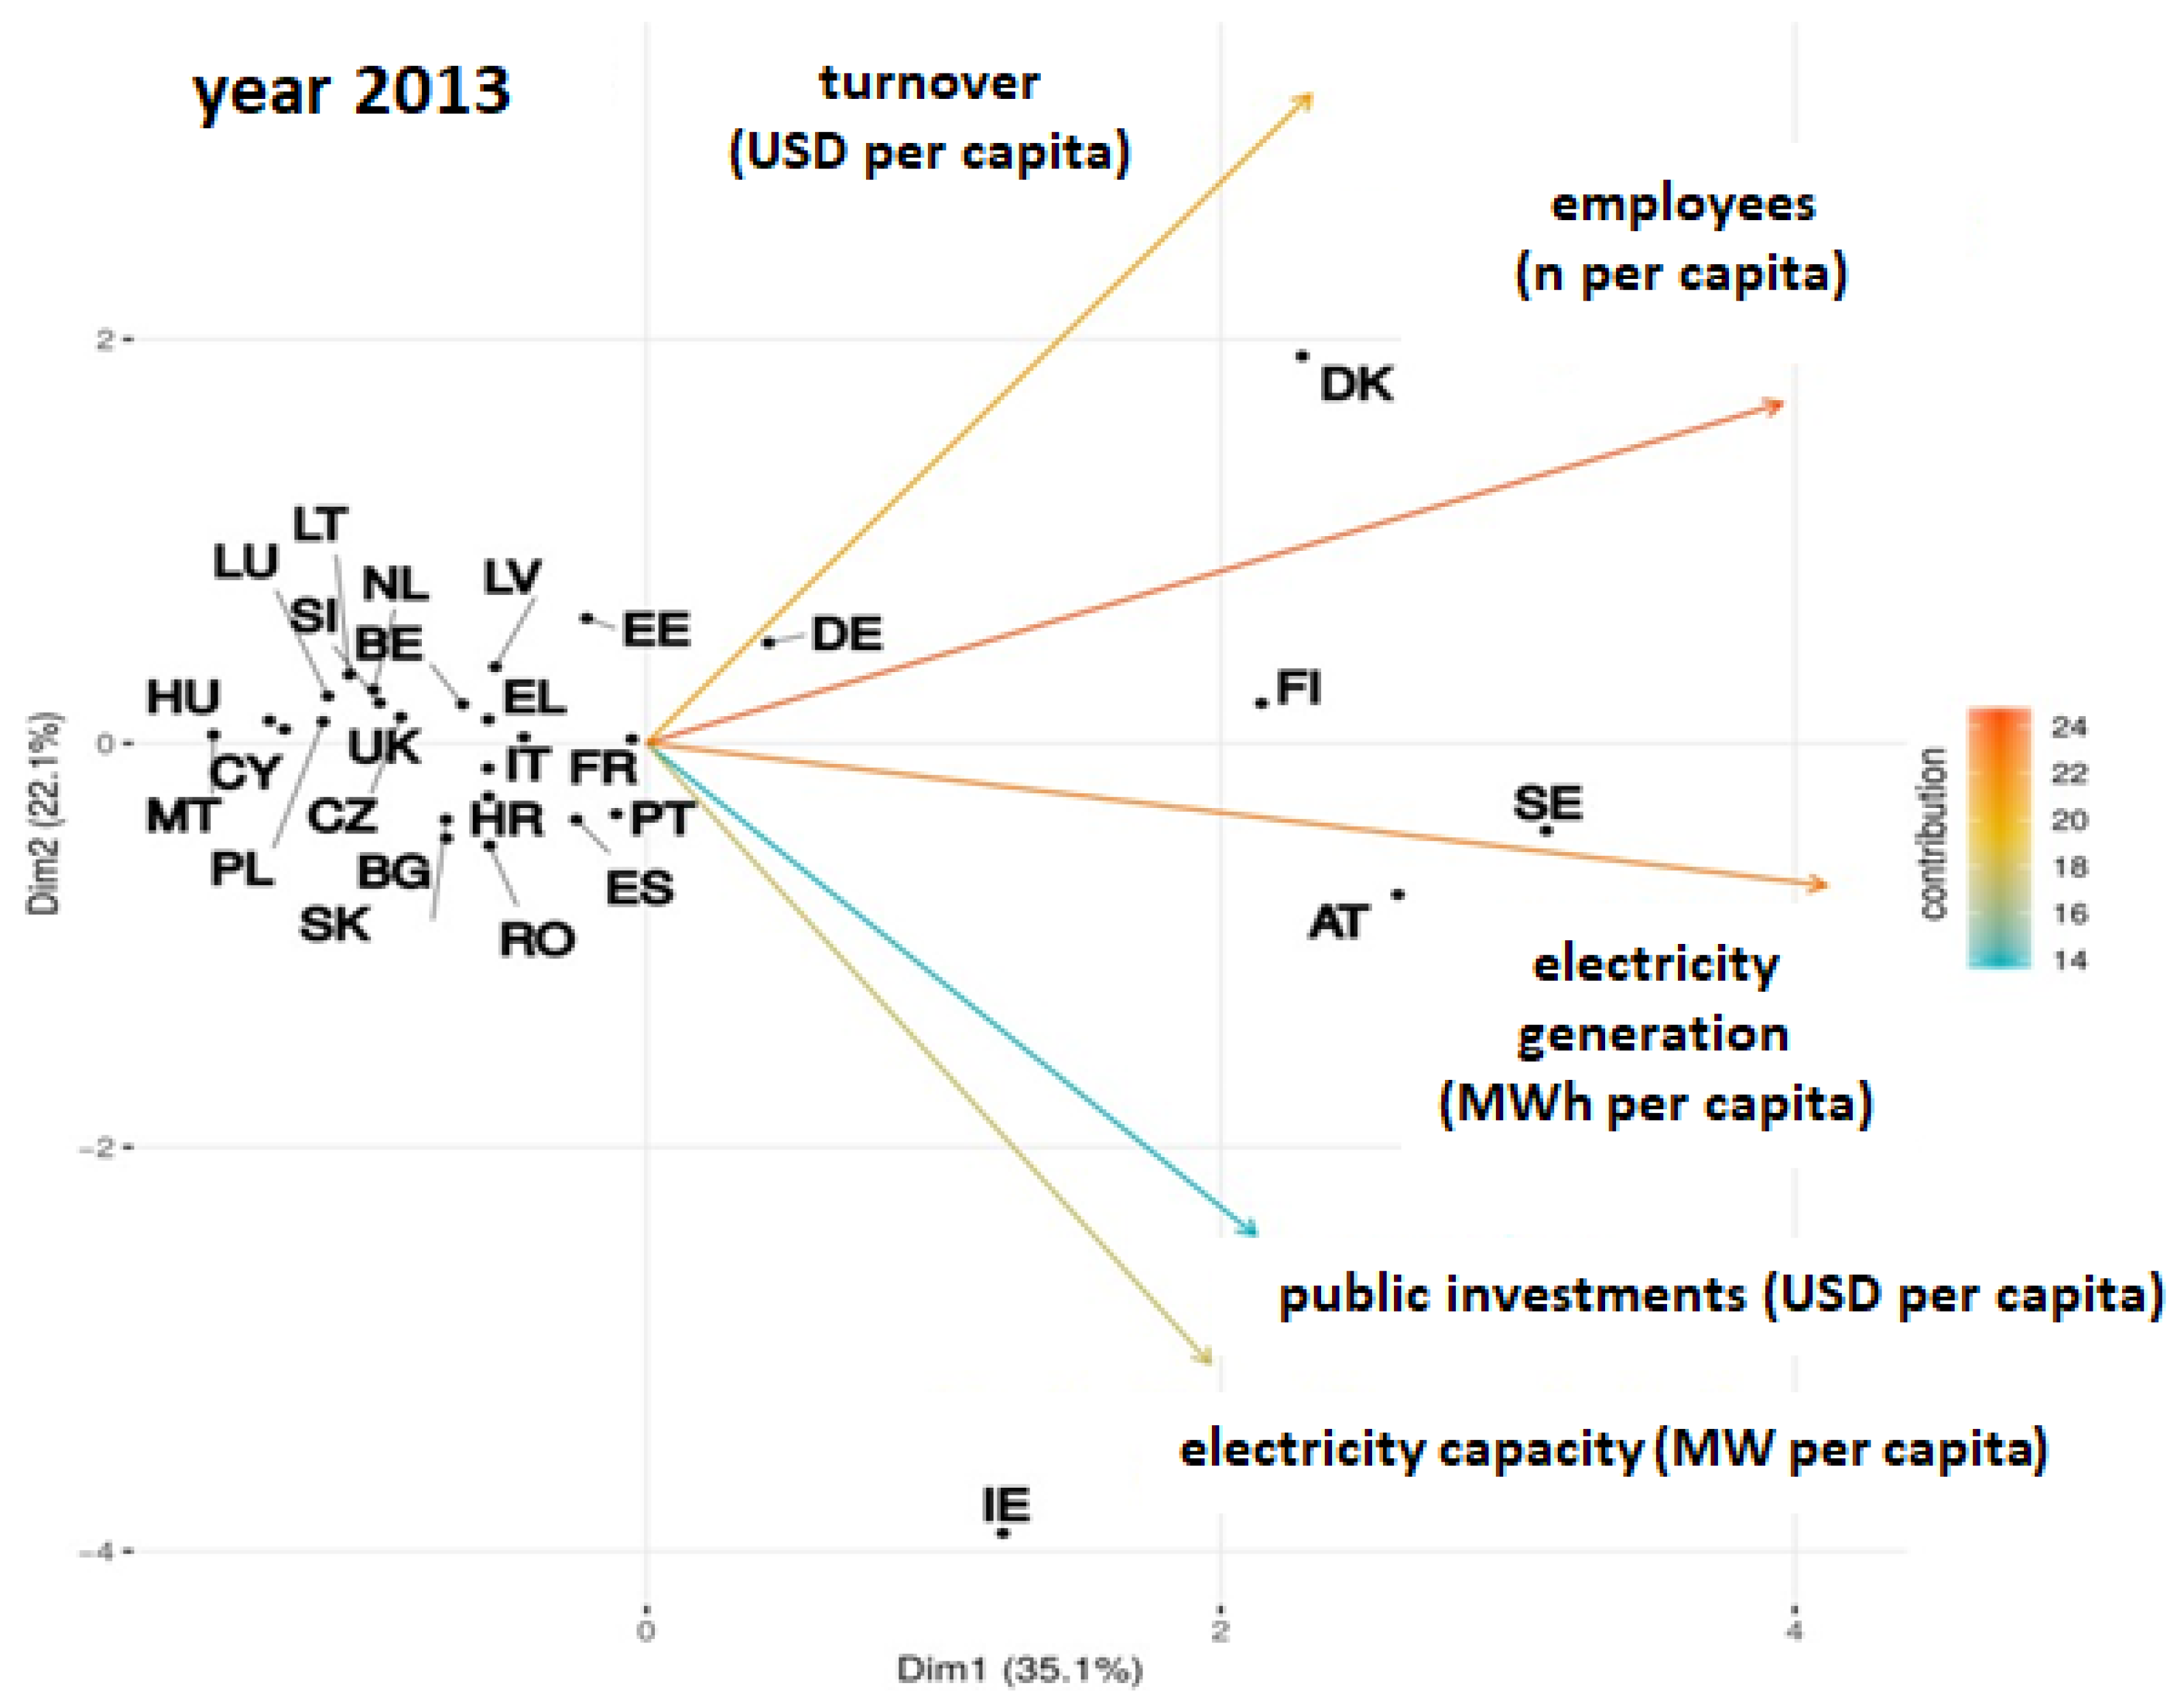
After Croatia joined the EU in July 2013, we observed the situation in the EU-28. Values above the average for electricity generation from renewable resources were observed in Sweden (SE), Finland (FI) and Austria (AT). In comparison to 2012, the situation for this indicator did not change (Finland (FI) moved even closer to the zone of above-average generation). This concerns energy produced in the sector of renewable hydro energy and energy from biomass. Similarly, as observed in 2012, in 2013, Ireland (IR) can also be assigned to countries which recorded high values of installed electricity capacities per capita, in comparison to average values. For comparison, China, the USA, Brazil, Canada and Germany are the top countries for total renewable electric capacities by the end of 2013 in the world, as stated by Bilgili et al. [
43]. Denmark lies in the above-average zone for the number of employees and above-average turnover in the sector of renewable energy resources. Colijn agrees and adds that Denmark has a fairly large number of jobs with a sustainable component in 2013 [
44]. All the other countries reported average or below-average values (
Figure 5).
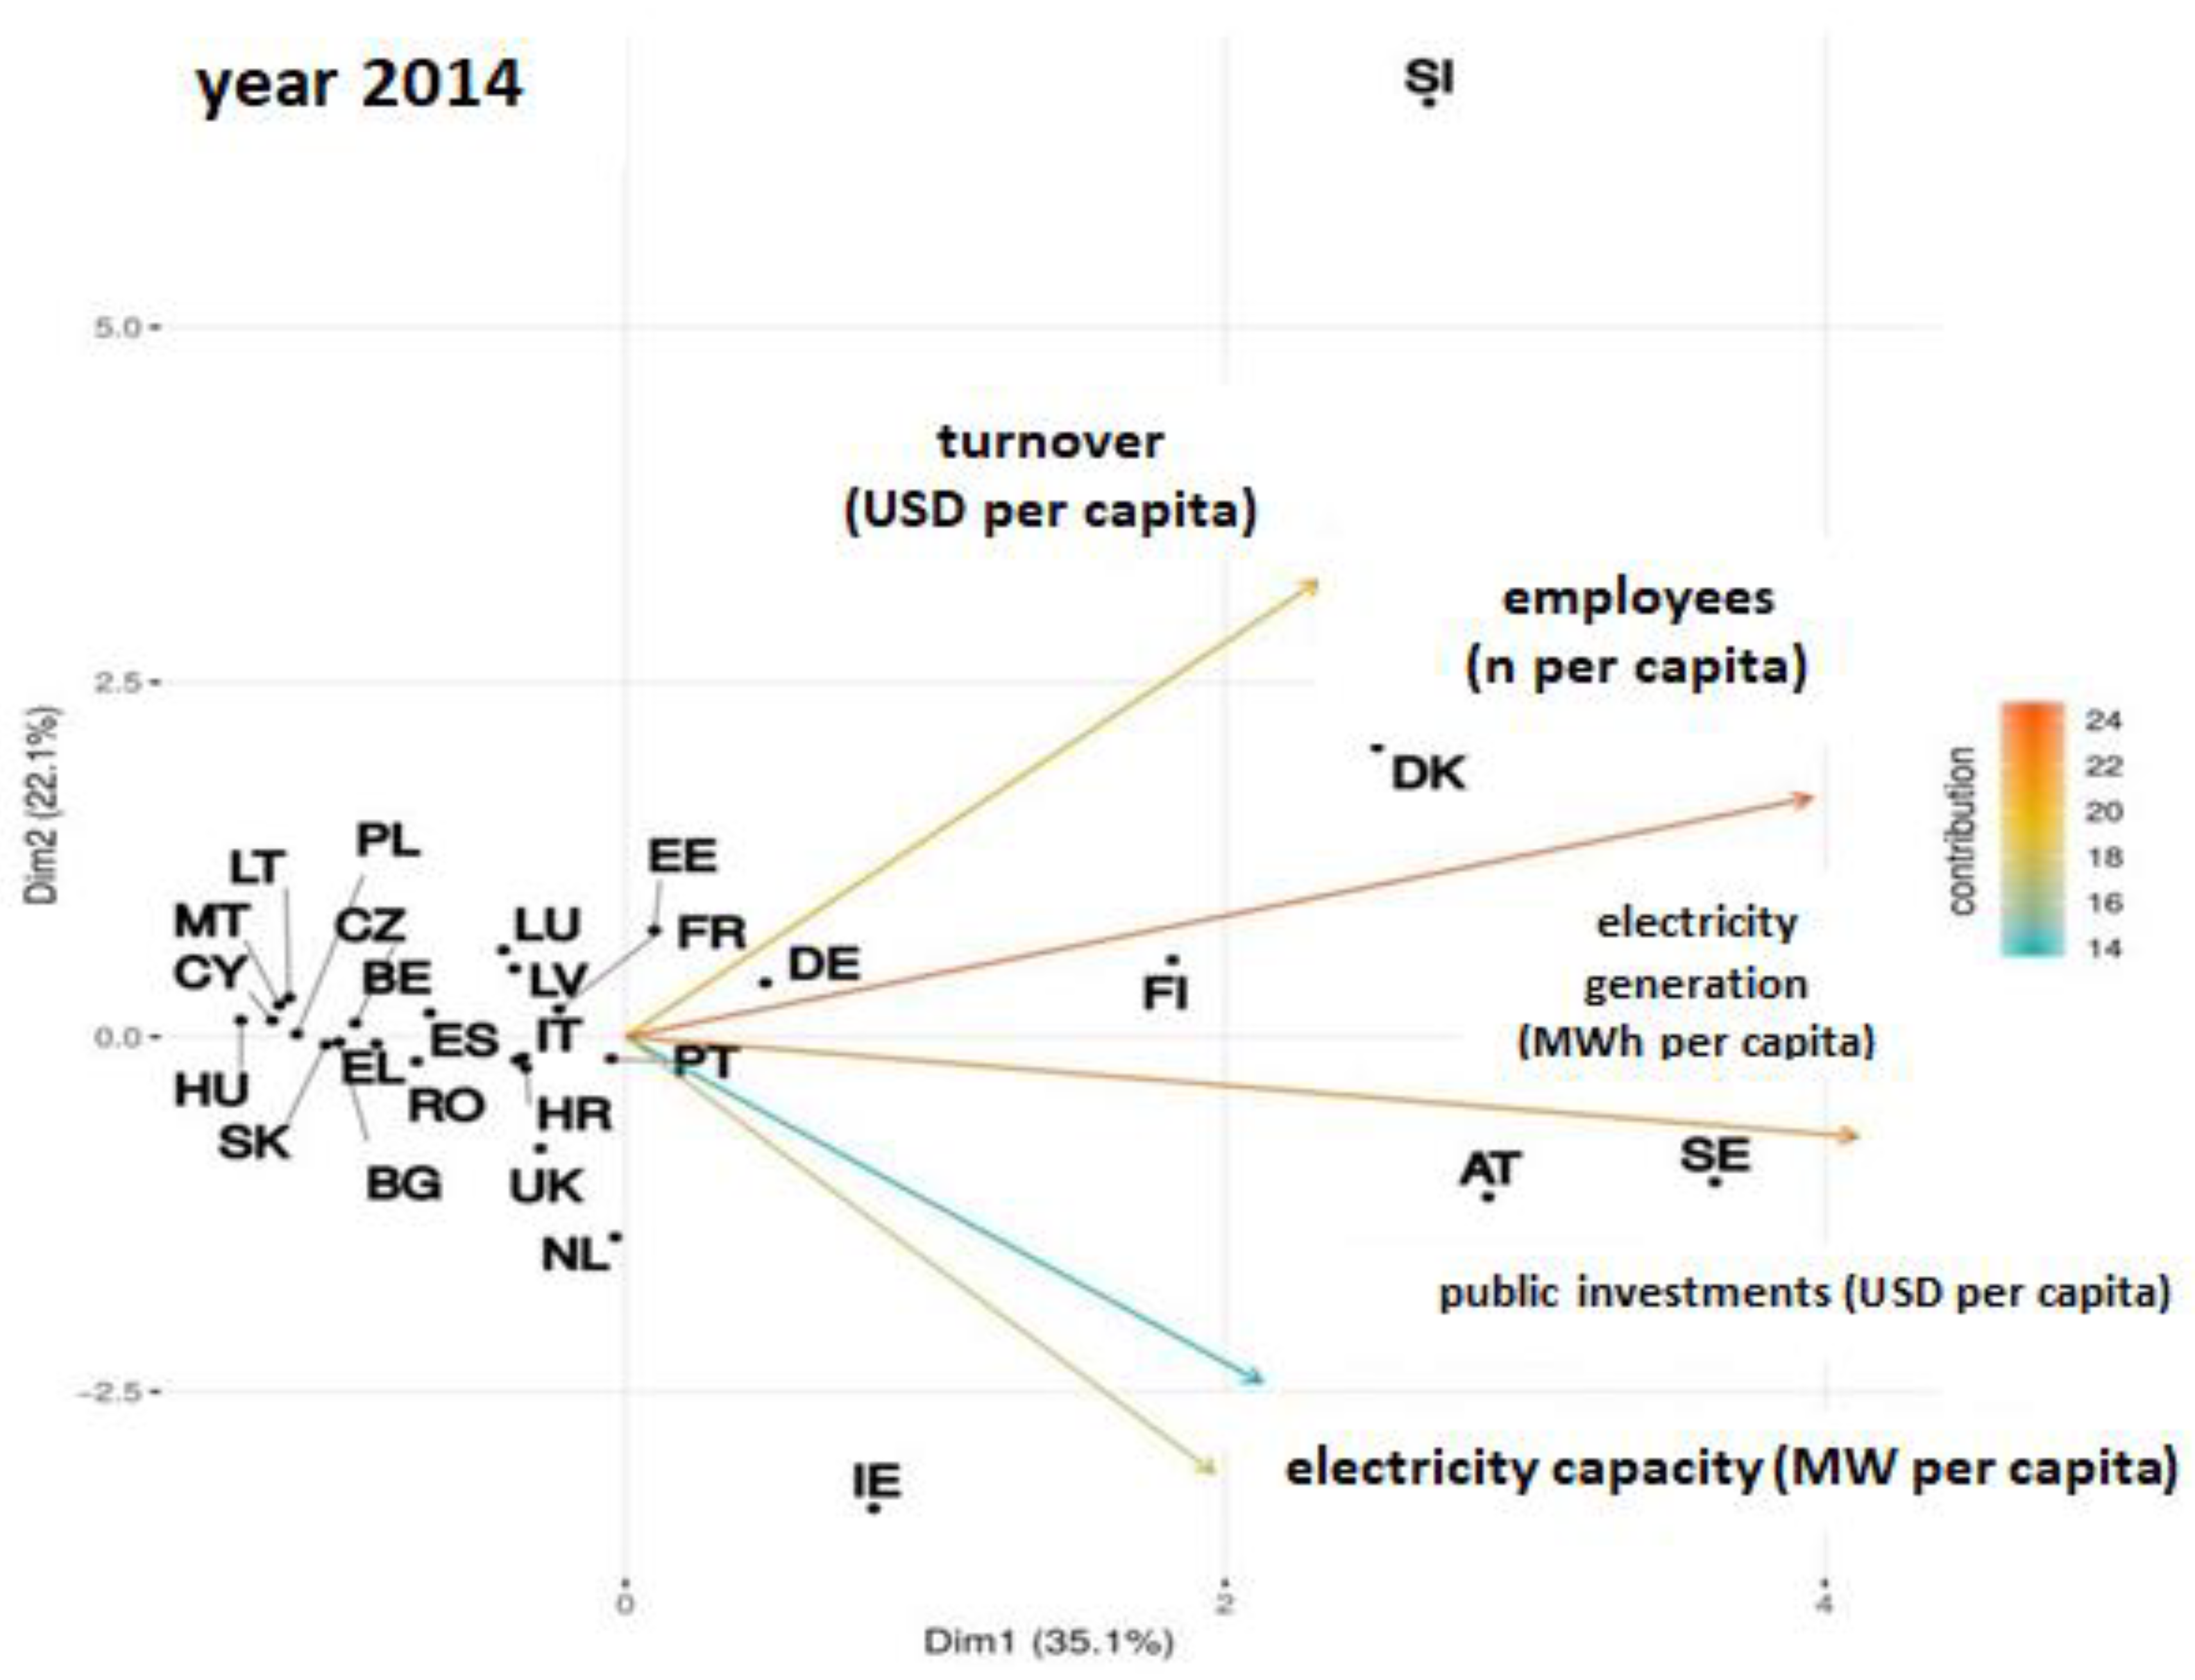
No significant changes were recorded in 2014 in comparison to the previous period. The most significant change can be observed in the shifting of Slovenia (SI) from the zone of countries below the average to the countries in the zone with significantly above-average values of turnover. This was caused by an increased turnover from economic activity in the field of renewable energy sources (in total) per capita (
Figure 6).
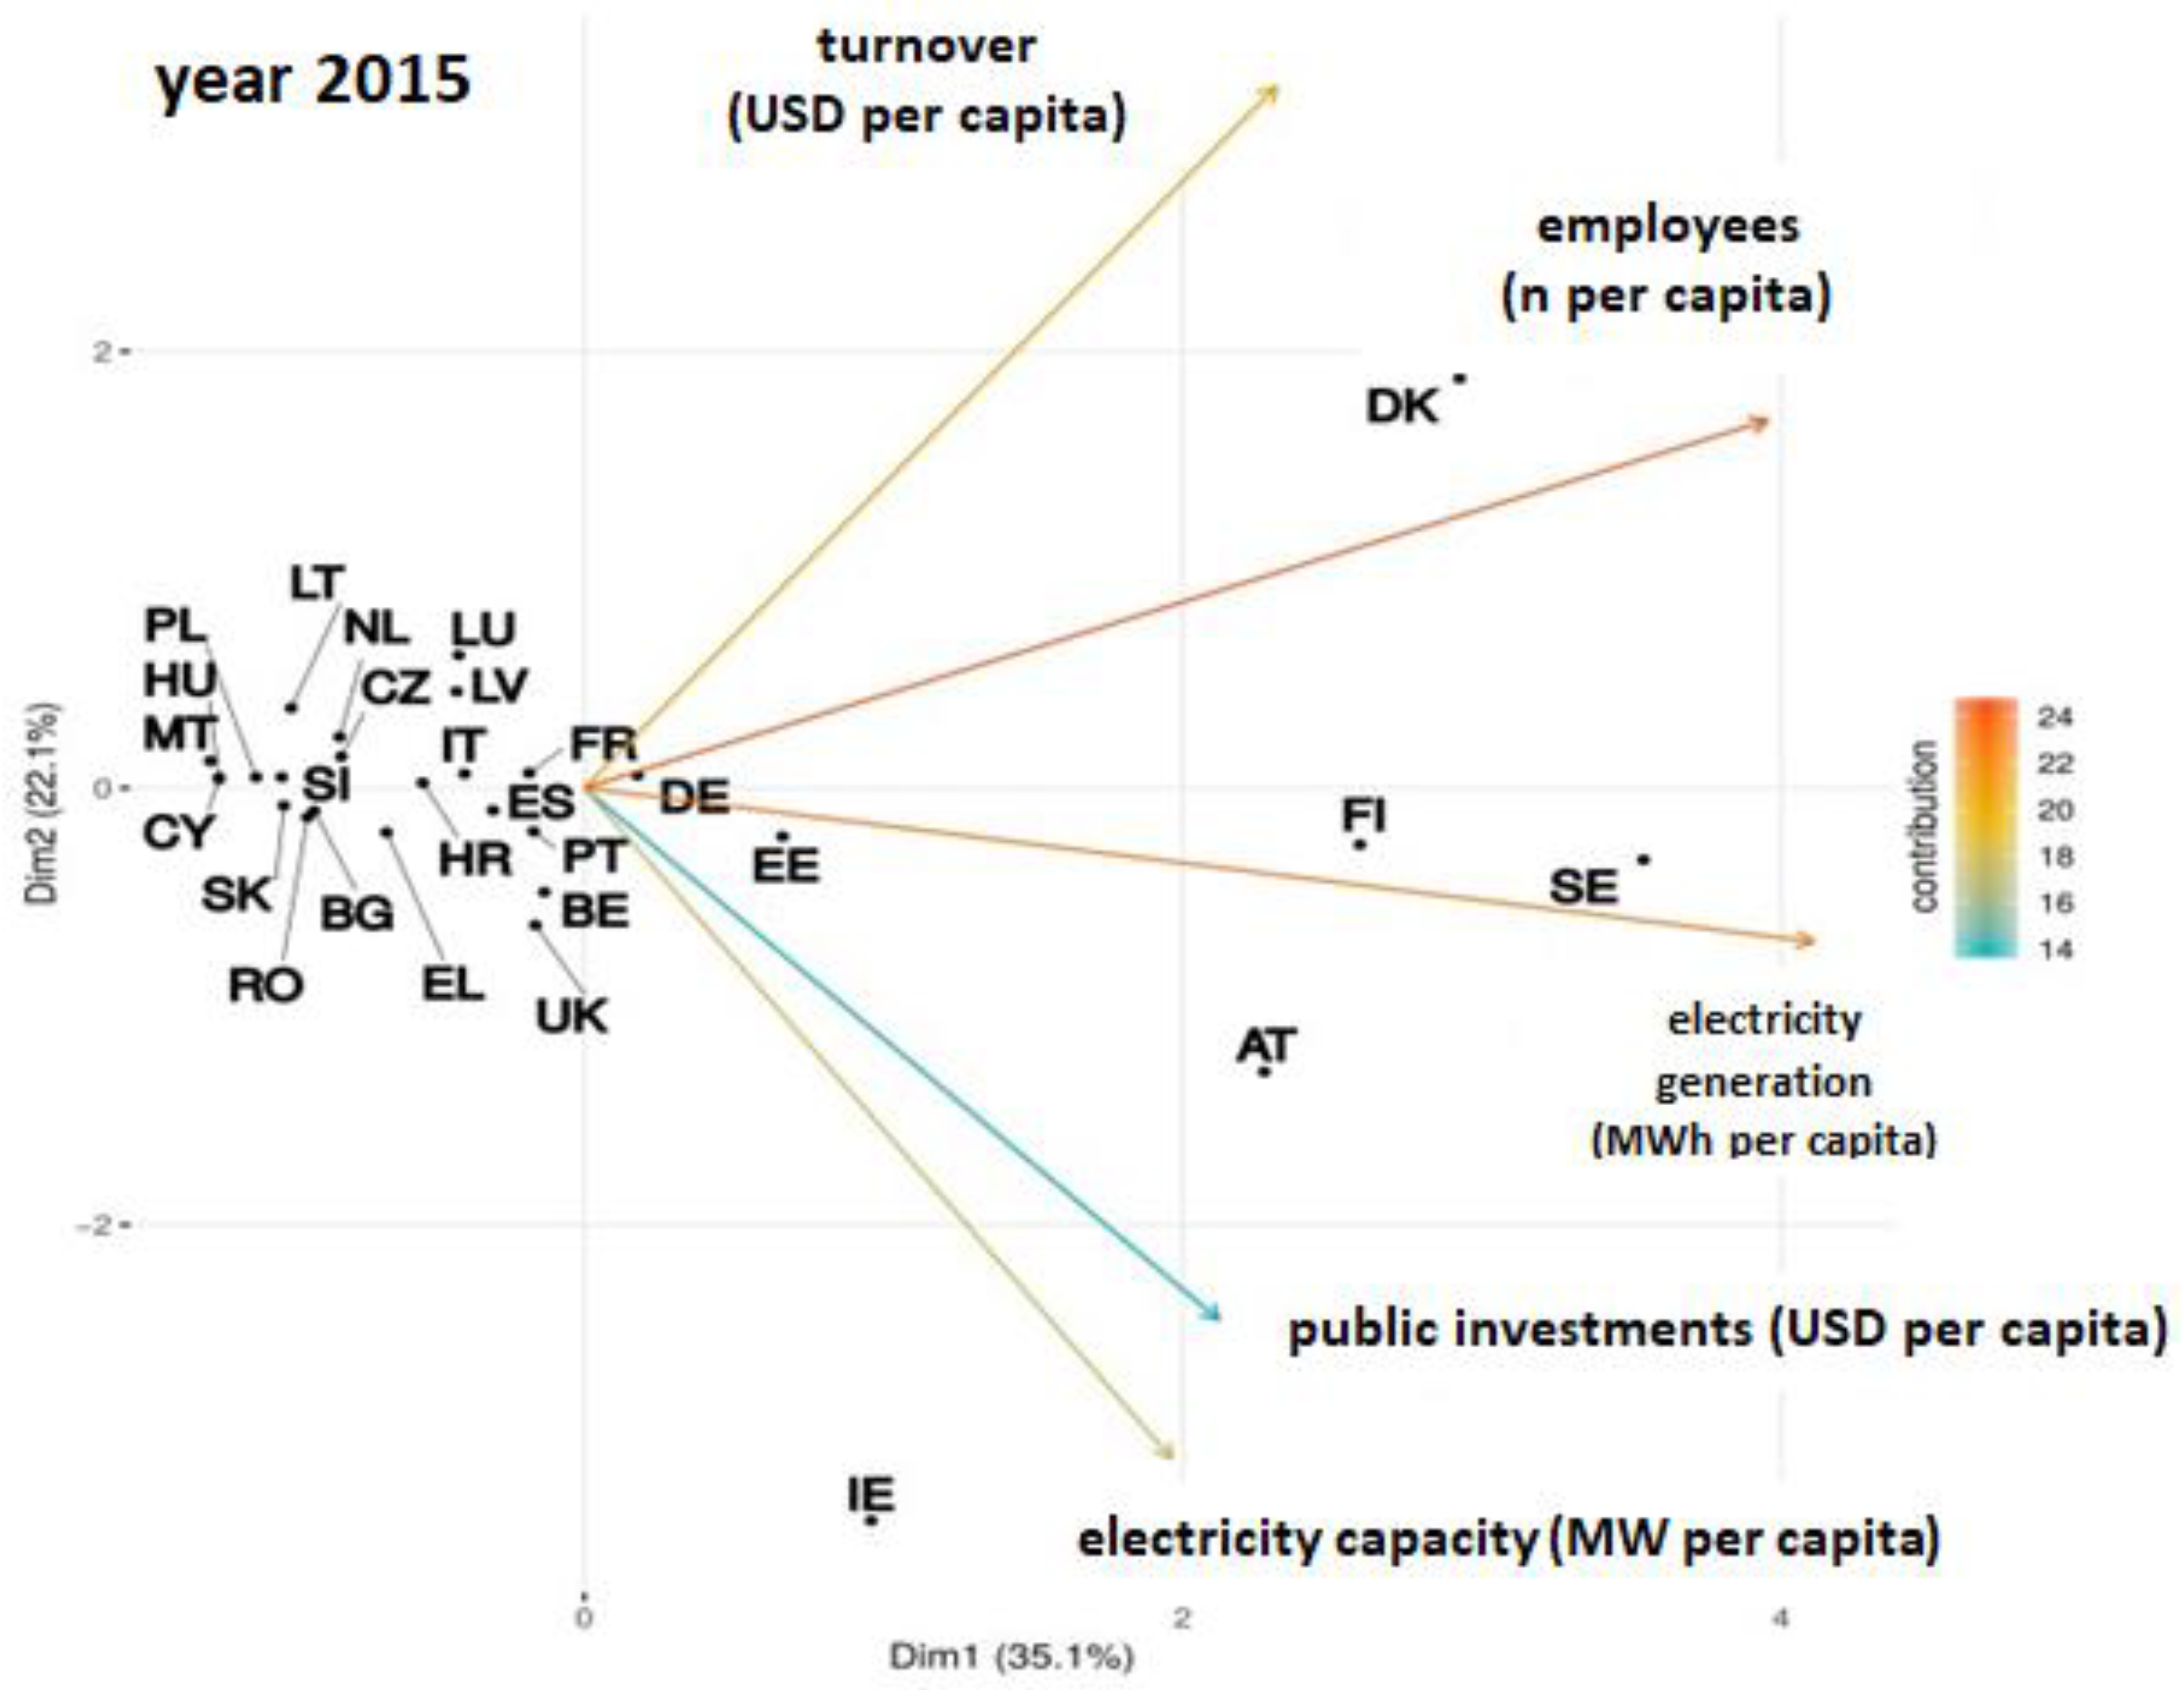
As we can observe from the figure (
Figure 7), the situation in 2015 did not change in comparison to 2014. There were shifts in countries with average values for almost all indicators to values below the average or vice versa.
In 2016, there were changes compared to 2015, when Belgium (BE) spent more money from public financial institutions. It invested specifically in wind energy. A breakthrough year also occurred for the V4 countries (the Slovak Republic—SK, Hungary—HU, Poland—PL and the Czech Republic—CZ), which moved all from the zone of below-average values to the zone of average values. Latvia (LV) increased the number of employees in the renewable energy sector—the biomass energy sector—focusing on export activities and increased pellet production, and Estonia achieved the same in the wind energy sector (
Figure 8).
The results of our research were visualized by using a 2D dimensional graph (
Figure 1,
Figure 2,
Figure 3,
Figure 4,
Figure 5,
Figure 6,
Figure 7 and
Figure 8). The analysis resulted in the same number of PC axes as the number of original variables. However, it was optimal to capture most of the variability of the data set in the first two axes for better clarity.
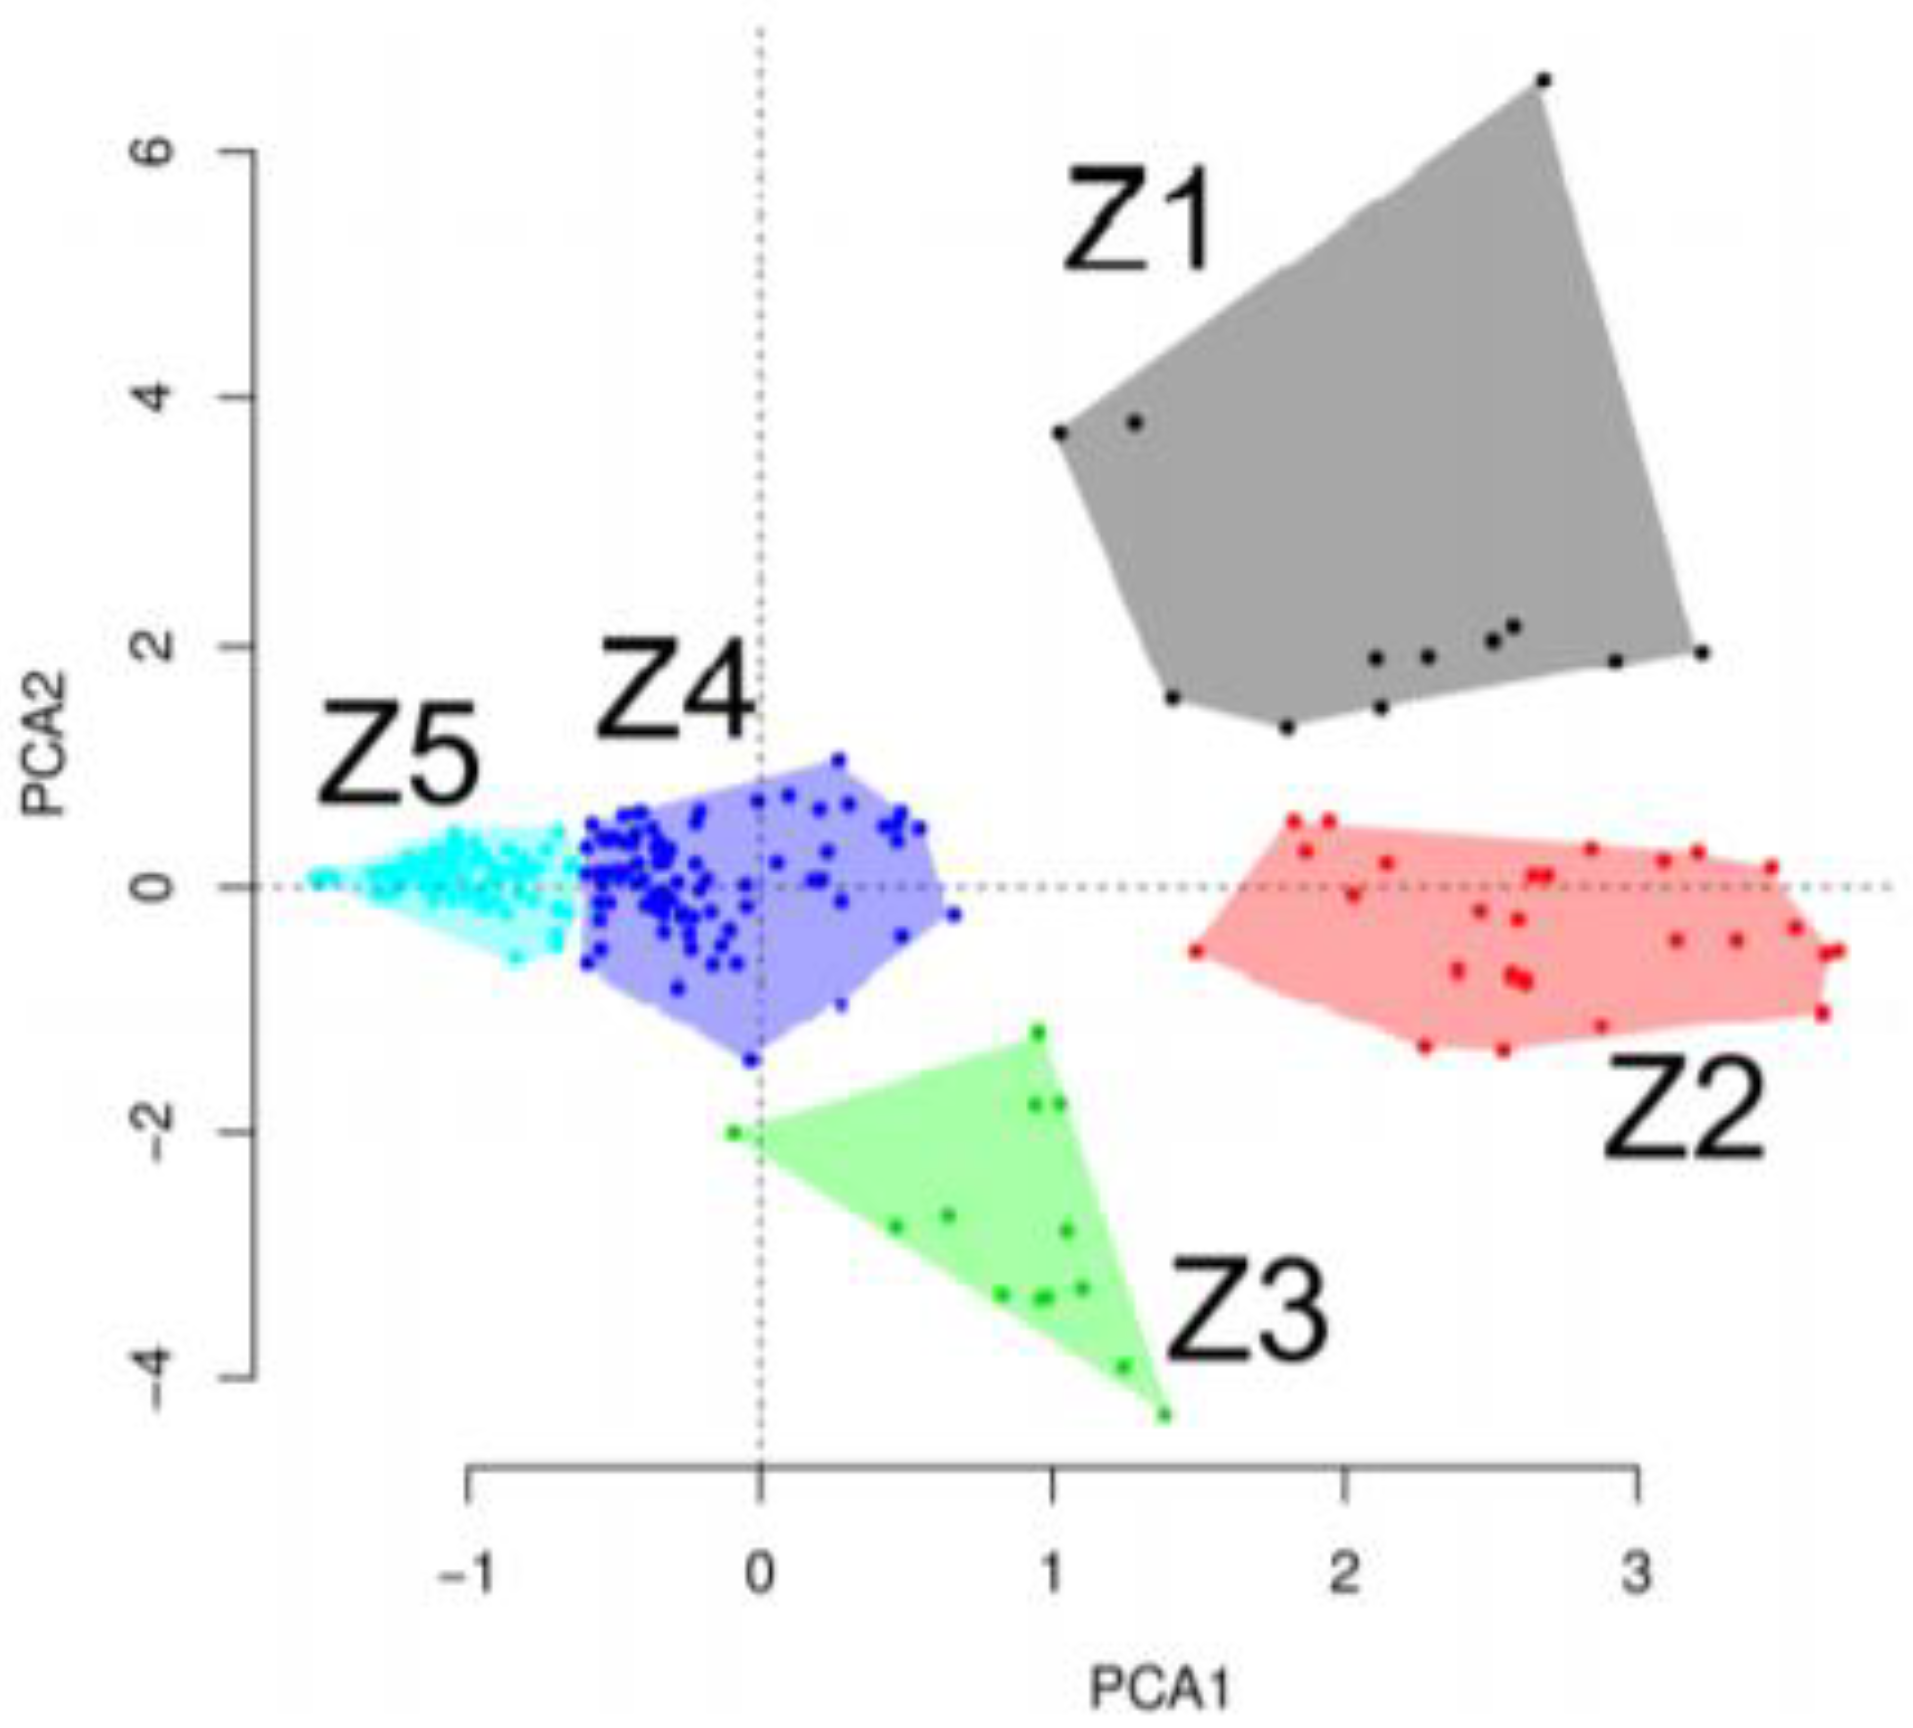
In the context of the results achieved, the member states of the European Union were further divided into five optimal clusters (clustering explains 85.5% variability)—see
Figure 9:
Z1: a group of European Union countries with above-average values of turnover and numbers of employees in the renewable energy sector
Z2: a group of European Union countries focused on above-average values of electricity generation
Z3: a group of European Union countries with above-average values of electricity capacity and public investments
Z4: a group of European Union countries with average values of all factors related to the renewable energy sector
Z5: a group of European Union countries with below-average values of all factors related to the renewable energy sector
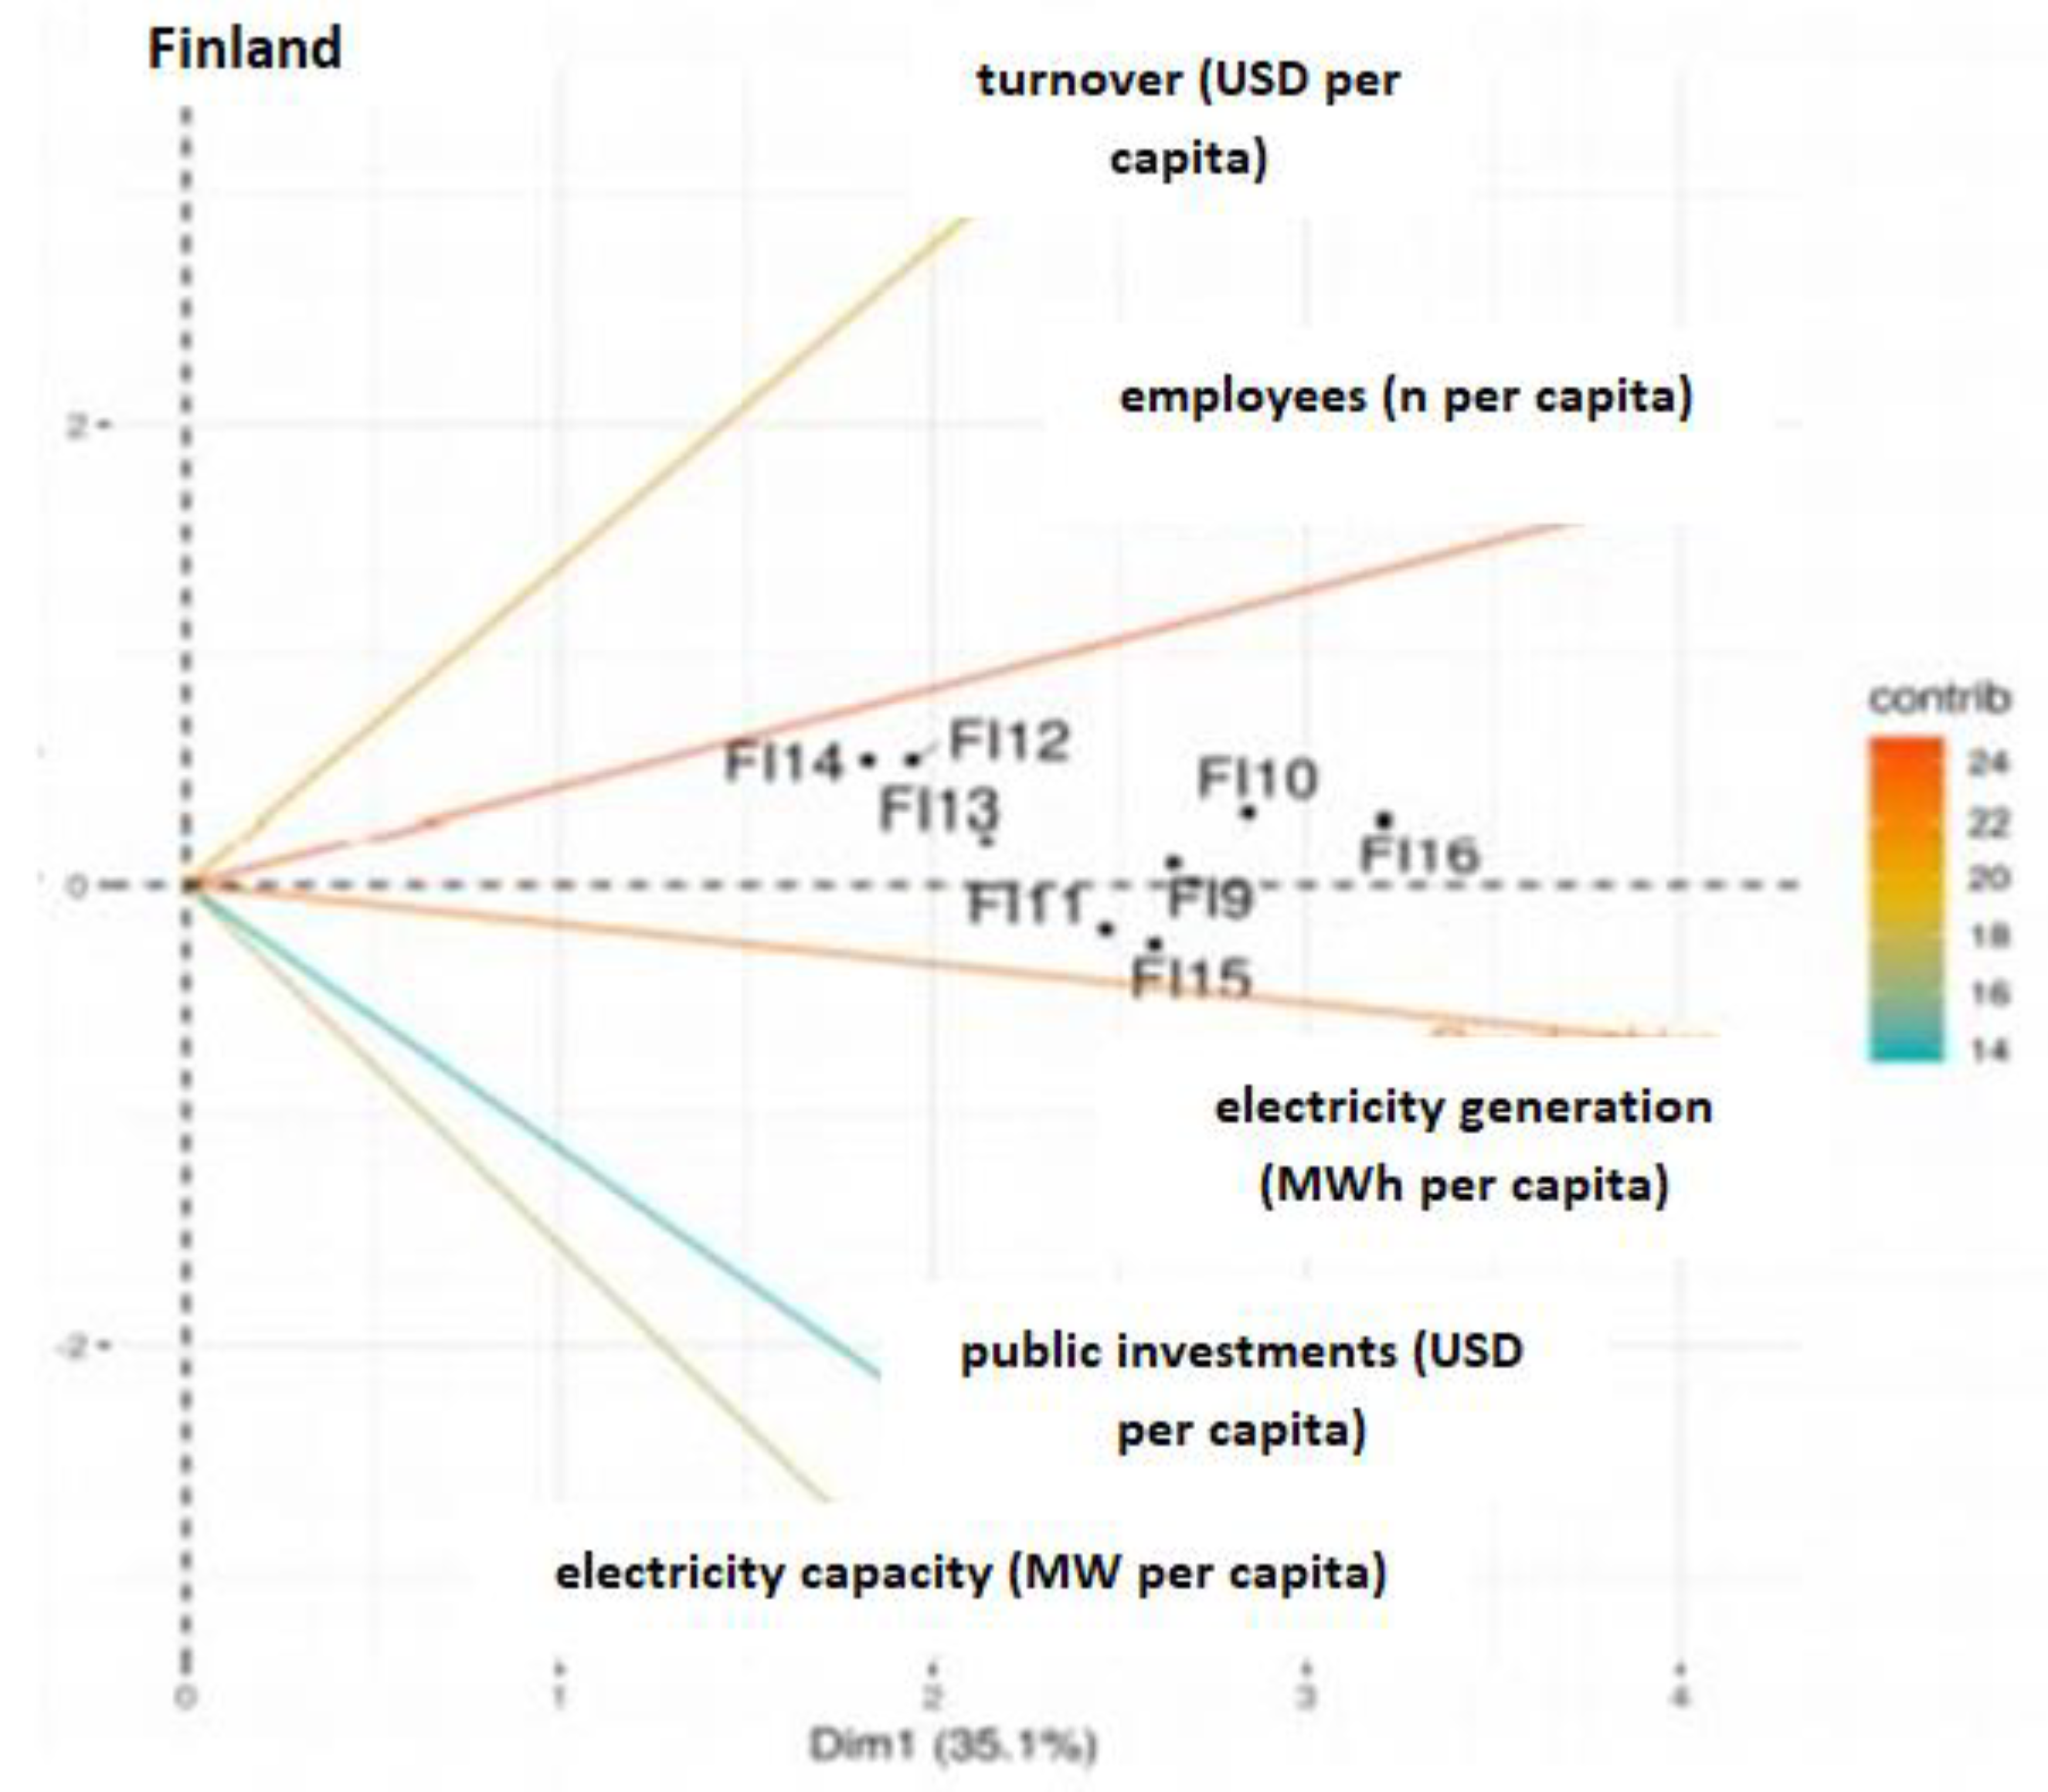
Finland is an example of a country that has managed to sustain its place in a single cluster (cluster Z2) throughout the period under review. Finland is a country of the European Union that obviously has a long-term strategy in the renewable energy sector. It maintains above-average values of electricity generation throughout the monitored period, especially in the renewable hydropower sector and biomass sector. Finland´s strategy is partly based on the above-average number of employees in this sector because its position is close to this indicator (
Figure 10).
4. Conclusions
The use of renewable energy has many benefits, e.g., reduction in greenhouse gas emissions (lower ecological footprint than fossil fuels); it also reduces dependency on fossil fuels and stimulates employment in the European Union member states through the creation of jobs in new technologies of renewable energy sources and the diversification of energy supplies. The main objective of this paper was to evaluate the European Union countries in terms of achieving above-average, average and below-average values of selected renewable energy indicators in 2009–2016. Selected renewable energy indicators were electricity generation, electricity capacity, public investments, number of employees and turnover achieved from economic activities. Every indicator was expressed per capita. Principal component analysis was used to achieve the main objective of this paper. Two-dimensional graphs were used for visualization—two PC axes, which explained 57.18% of data variability. The situation was monitored for each year in the period of 2009–2016. In 2009, Sweden, Finland, Austria and Slovenia achieved above-average values of electricity generation. These member states, together with Denmark, employed the largest numbers of employees in the sector under review. Cyprus and Ireland invested the most money provided by public financial institutions, specifically in the wind energy. Denmark achieved above-average values of turnover from economic activities related to the production, distribution, installation, operation and maintenance of equipment. In 2016, the situation changed. Latvia and Estonia achieved an above-average number of employees in the renewable energy sector and Belgium achieved above-average values of wind energy public investments.
Each member state has different natural, economic and legislative conditions. The mentioned differences are reflected in the evaluation of the stability of renewable energy indicators in the space (PCA). Therefore, renewable energy sources were evaluated as a whole. It is not possible to use wind, water, solar, geothermal and biomass energy to the same extent. PCA further pointed to the fact that the electricity capacity indicator and public investments indicator were difficult to distinguish from each other, as the correlation between them was strong.
The five created clusters helped to identify the direction in which the countries of the European Union “are going one way” in terms of selected indicators of renewable energy sources. We found that most countries do not have a clearly defined target and are mostly situated in the space of average and below-average values throughout the period under review. However, some member states have a clearly defined “policy” aimed at maintaining a position in a single cluster. An example is Finland, which focused mainly on achieving above-average values of the indicators of “energy generation” in 2008–2016. The research revealed that this strategy can be regarded as the most sustainable because countries that have clearly defined directions focused on this indicator. This “policy” promotes important non-polluting energies.

 ,
, 


