Variability of Air Temperature, Precipitation and Outflows in the Vistula Basin (Poland)


Faculty of Earth Sciences and Spatial Management, Nicolaus Copernicus University, Lwowska 1, 87-100 Toruń, Poland
Resources 2020, 9(9), 103; https://0-doi-org.brum.beds.ac.uk/10.3390/resources9090103
Submission received: 23 July 2020
/
Revised: 19 August 2020
/
Accepted: 24 August 2020
/
Published: 27 August 2020
(This article belongs to the Special Issue Water Resources and Climate Change)
Abstract
:This study examines trends in temperature, precipitation and discharge rates over a 65-year observation period (1951–2015) and compares the two sub-periods 1951–1980 and 1981–2015. The research was carried out on annual and monthly values. The research area is the basin of the Vistula, the largest river in Poland. The main aim of the study was to assess how changes in air temperature and precipitation in the Vistula basin have translated into river hydrology. In the 65-year study period, a lack of statistically significant trends in outflow prevailed. Compared to the full period 1951–2015, the sub-period 1951–1980 stood out for its statistically significant increase in annual average outflows. In the years 1981–2015 a slight falling trend in outflow of the Vistula was noted, though the values were not statistically significant. This was caused by significant warming during this period (an increase in air temperature of between 0.27 and 0.45 °C per decade, depending on location) and a slight increase in precipitation. Seasonal changes in outflows were more volatile. The results indicate that the Vistula’s water resources have fallen slightly as a result of changes in air temperature and precipitation and due to the river’s significant hydrological inertia, which in turn results from the catchment being very large and physiographically diverse.
1. Introduction
In recent years, numerous studies have been conducted on climate change and its impact on water resources. Spatial and temporal changes in precipitation and air temperature have been observed in many parts of the world [1,2,3]. Precipitation and air temperature are considered to be the main climatic drivers of hydrological changes. The amount of river outflow, apart from climatic conditions, is influenced by the physiographic features of the basin area, e.g., soil permeability, topography, land use. In addition to natural conditions, the hydrological systems of rivers are influenced by human use of river catchments’ water resources and modifications of the river regimes. Due to the complexity of the interactions of the above factors, it is extremely difficult to clearly establish which of these factors plays a decisive role. This is especially true of larger catchments, where processes with opposing hydrological influences may operate simultaneously. Among the elements of the hydrological cycle, the most attention has been devoted to the analysis of river flow trends over the past decades. River runoff is one of the most sensitive elements of the hydrological cycle, especially to changes in precipitation. In principle, the change of one element of the water balance entails the change of other elements. Therefore, various studies use water balance simulations based on various models that include analyzes of the impact of climate change on surface runoff and groundwater flow [4,5]. Spatial and temporal changes in river outflow have been observed in many regions of Europe [6,7,8,9,10,11,12,13,14,15]. The causes of changes in river runoff are symptoms of climate warming. Depending on the adopted observation periods and the research area, the obtained results indicate different trends in outflow changes. An example is the study carried out for 441 rivers in 15 European countries between 1962–2004. They showed negative trends in annual flows in the south and east of Europe and generally positive trends in other regions [16] (Stahl et al. 2010). The trends in monthly flows between 1962–2004 explained the potential causes of these changes, as well as changes in the hydrological regime across Europe. Positive trends occurred in the winter months in most catchments. In turn, studies by the authors [17] showed that there are regional patterns of both increases and decreases in observed river flows between 1951 and 2010, which are indications of a changing climate. In the analyzed multiannual period of 1951–2010, an increase in autumn and winter precipitation was observed, increasing floods in north-western Europe; decreasing rainfall and increasing evaporation has led to a reduction in the number of floods medium and large catchments in southern Europe and decreasing snow cover and snow melting, resulting from higher temperatures, led to a reduction in the number of floods in eastern Europe. Pressure on water resources is increasing and often reduces the availability of water resources. The volume of water resources depends primarily on changing climatic conditions [18]. The climate changes currently being observed manifest in, among other things, more frequent extreme weather phenomena [19,20]. Over the past decades, several extreme events related to water excesses and deficits (floods and droughts) have occurred in Europe that have had dramatic economic and social consequences [21,22,23]. In the very late 20th and early 21st centuries, some of the most severe floods in a century occurred in many European countries [24,25,26,27,28]. By contrast, prolonged periods of little or no precipitation and intense heat waves led to droughts (meteorological and hydrological), which affected a much larger area of Europe than did floods [29,30]. In Poland, as in many other European countries, risk events associated with fresh water, especially drought, are expected to become more frequent, more intense and longer due to climate change [31,32]. It is forecast that these changes will adversely affect the volume of water resources and their temporal and spatial distribution, making surface and ground waters less accessible and less available [33]. This problem is significant because Poland’s water resources are among the lowest in Europe. Total resources in the years 1951–2015 averaged 1600 m3/person per annum [34]. Surface waters are the main source of water supply for the national economy in Poland. They cover as much as 84% of demand, mainly for industrial production purposes [34]. Information on water resources, especially relating to periods of excess or deficit, is crucial not only for conducting water management activities, but it also significantly supports the analysis of hydrological processes, their modelling and a number of environmental protection issues [35].
Studies on the hydrological regimes of Polish rivers have been conducted by many researchers [36,37,38,39,40,41]. However, the majority of research on this issue has focused on selected regions or aspects that allowed temporal and spatial changes in river outflow to be identified, as well as its structure and seasonality. Studies using various hydrological and climatological indicators to detect trends and changes have mainly involved single small catchments [42,43,44,45] or several catchments with a relatively unmodified outflow regime [46,47,48,49,50,51,52,53,54]. The impact of meteorological conditions (air temperature and precipitation) on large catchment areas in Poland has been little studied [55,56,57].
It therefore seems desirable to conduct more detailed analyzes of precipitations patterns, air temperature and outflow and their variability in individual sub-catchments of the river basin with different meteorological and physical geographic conditions. This will provide insight into various aspects of potential hydrological changes that result from meteorological changes. The main idea and novelty of this study compared to other studies was an integrated analysis of trends and changes in the hydrological regime of the river as well as changes in precipitations and air temperature.
This study aims to provide a long-term analysis of changes in precipitation (P), air temperature (T) and river outflows (Q) in the Vistula basin over the last 65 years (1951–2015). The research covered annual and seasonal variability of meteorological conditions and their impact on river outflow. The main aim of the study was to assess changes in air temperature and precipitation and their impact on changes in outflows in the Vistula River basin. Trend analysis will not only determine the direction and pace of changes, but also whether the data series are statistically homogenous. If the trends are weak and insignificant, this will indicate the statistical homogeneity of the data series.
2. Data and Methods
2.1. Research Area
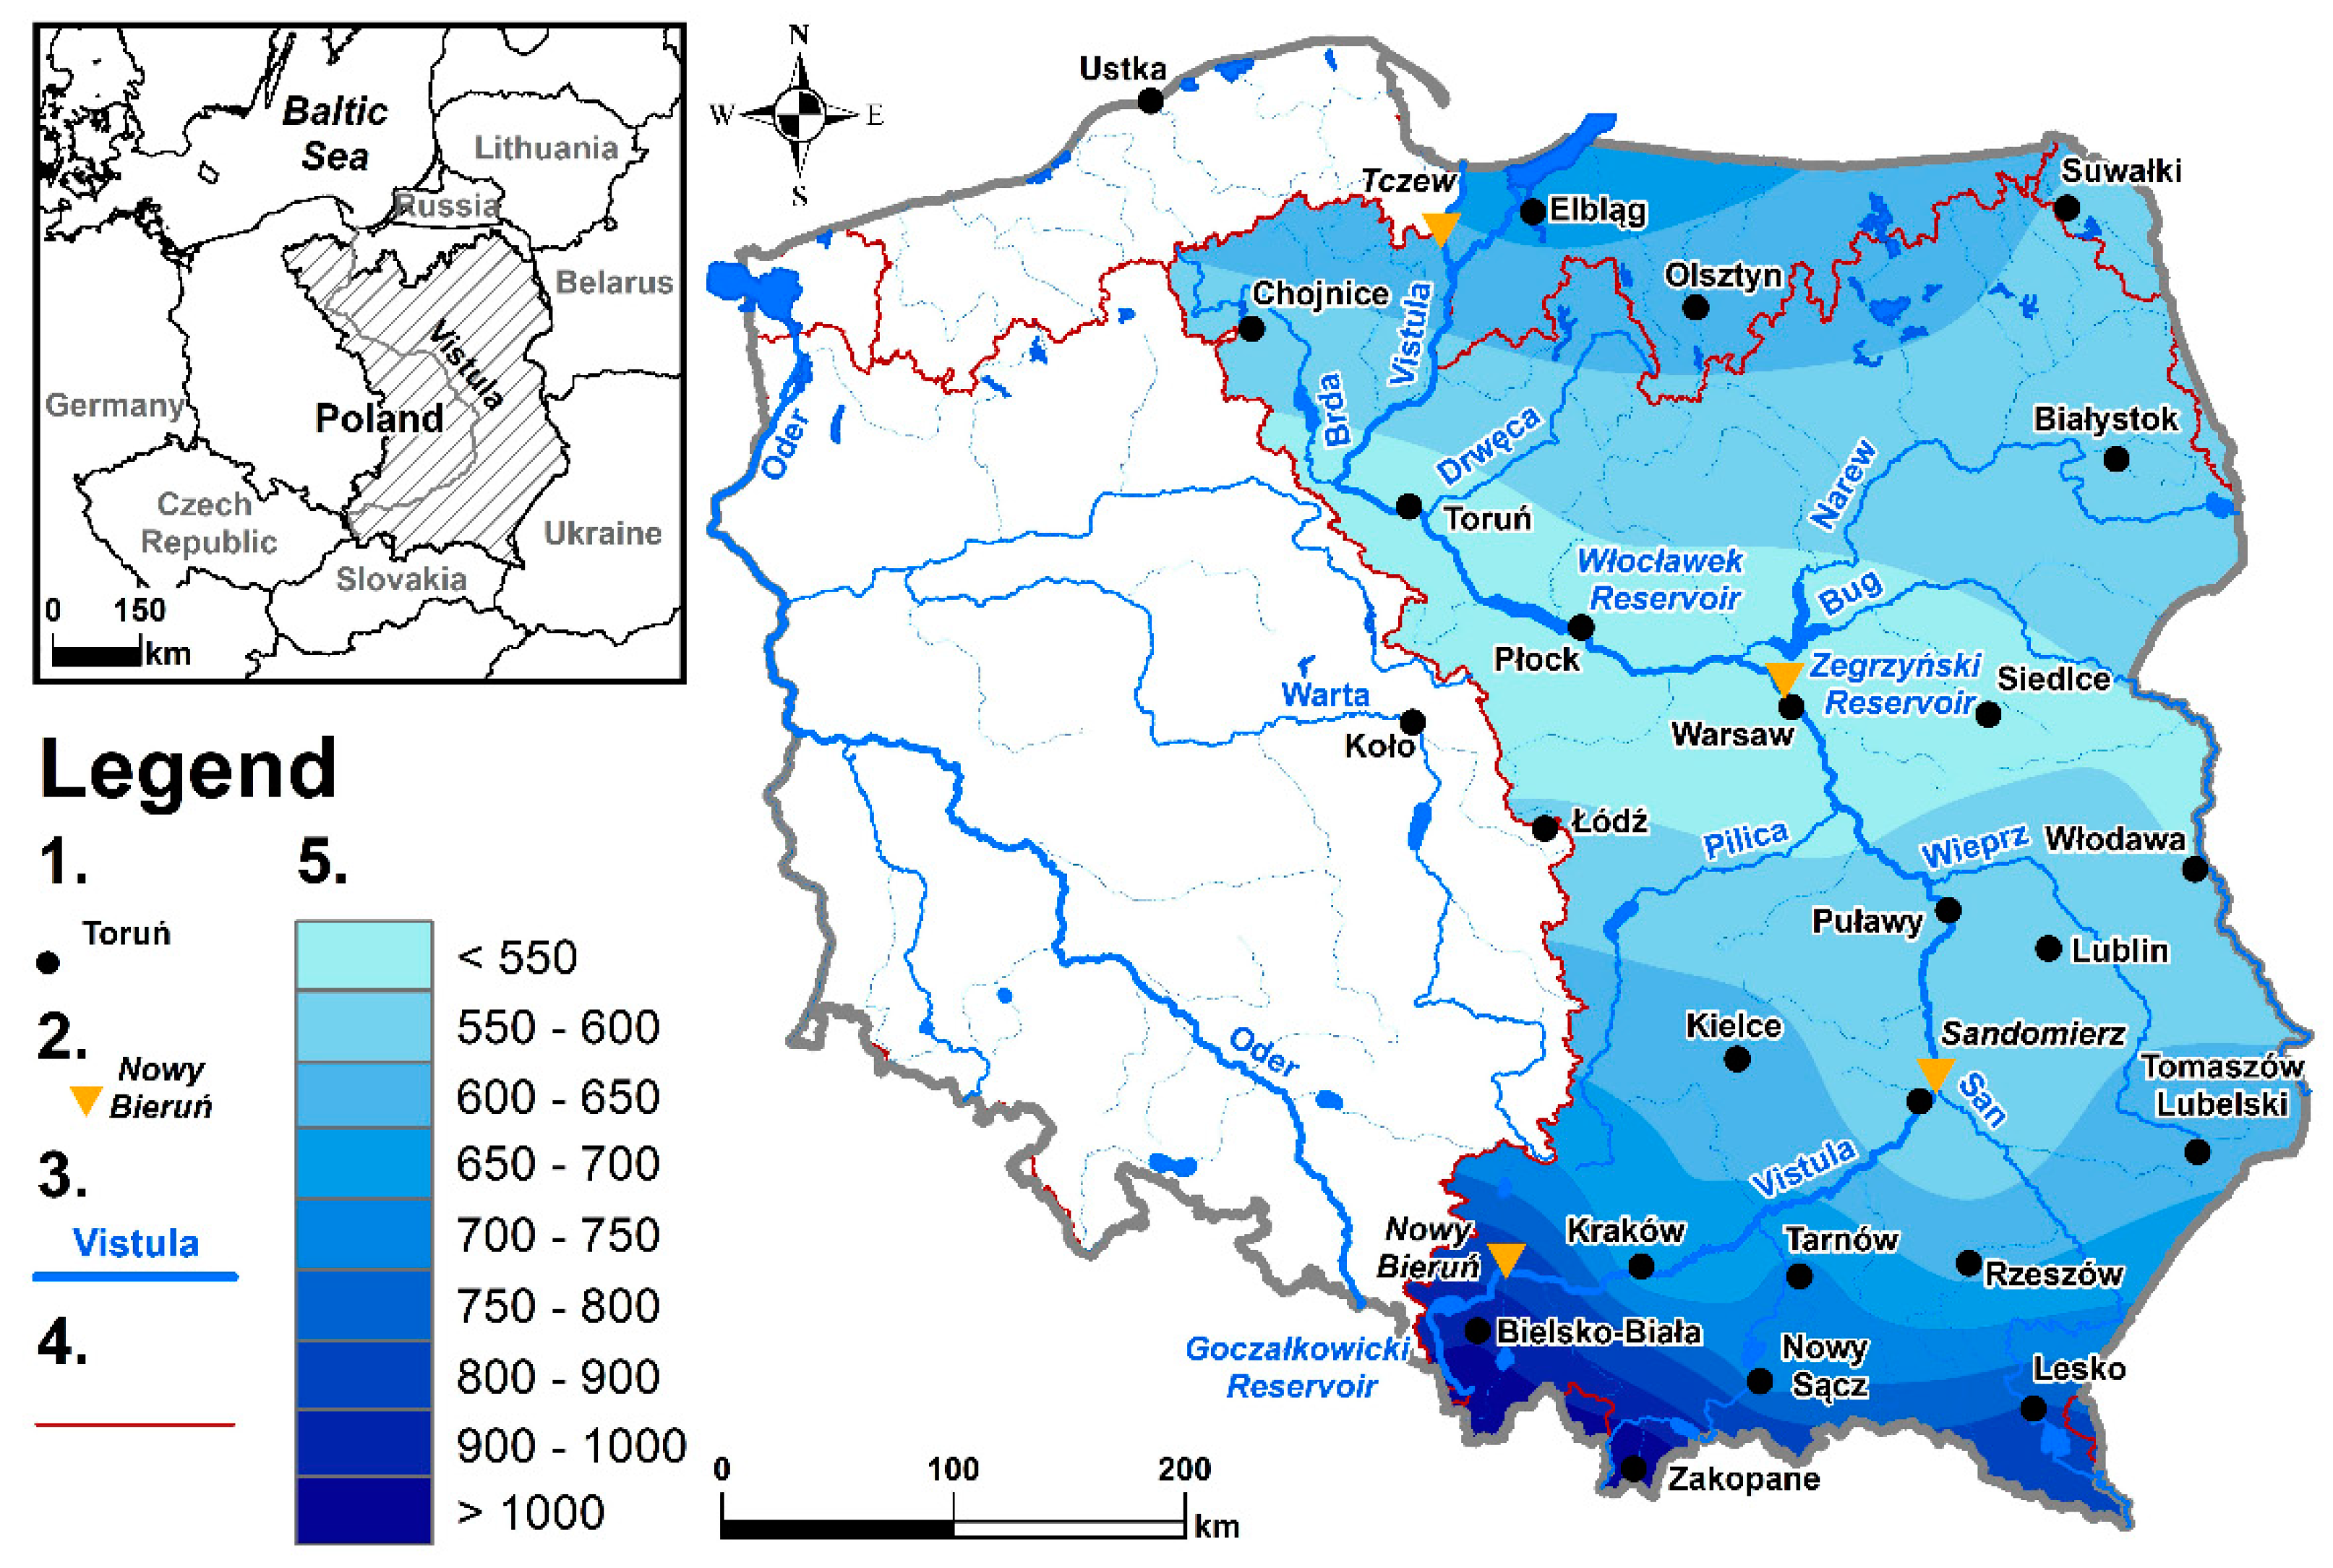
The study covered the Vistula River, the largest river in Poland, with the second-largest river basin area in the Baltic Sea catchment. The river’s total length is 1022 km. The area of the Vistula River basin enclosed by the water gauge in Tczew is 194,376 km2. The Vistula River basin constitutes 54% of the area of Poland [58,59]. The most important tributaries of the Vistula are the Dunajec, the Wisłoka, the San, the Wieprz, the Bug with the Narew, and the Drwęca on the right bank, and the Pilica, the Bzura and the Brda on the left (Figure 1). The Vistula runs meridionally, from south to north. The river has its sources on the slopes of Barania Góra at an altitude of 1106 m a.s.l., but flows into the Baltic Sea forming a delta at Żuławy Wiślane. Some of the Vistula waters discharge into the Vistula Lagoon through a branch of the Vistula called the Nogat River. However, the amount of water is small and negligible to the total outflow of the Vistula River. In terms of economics, the Vistula is an important water supply for the population, including the drinking water intake for the national capital, Warsaw, and for industrial purposes. The Vistula River basin can be divided into three basic hydrographic regions:
- (1)
- The upper Vistula basin from the source to the mouth of the San. Within this part, a section of the Vistula known as the Mała Wisła (Little Vistula) splits off from the sources and runs to the mouth of the Przemsza River. In this section the river has the character of a mountain river, and in the subsequent part up to the confluence with the San River it takes on an upland character,
- (2)
- The middle Vistula basin from the mouth of the San to the mouth of the Narew. This constitutes the largest area of the Vistula River basin,
- (3)
- The lower Vistula River basin from the mouth of the Narew to the mouth to the Baltic Sea.
There are two reservoirs on the Vistula: the Goczałkowice reservoir in the upper course of the Vistula and the Włocławek reservoir in the lower course [60,61]. The largest water reservoirs on the Vistula’s tributaries include: the Solina reservoir on the San River, the Czorsztyn reservoir and the Rożnowski reservoir on the Dunajec, as well as the Porąbka and Tresna reservoirs on the Soła River [62].
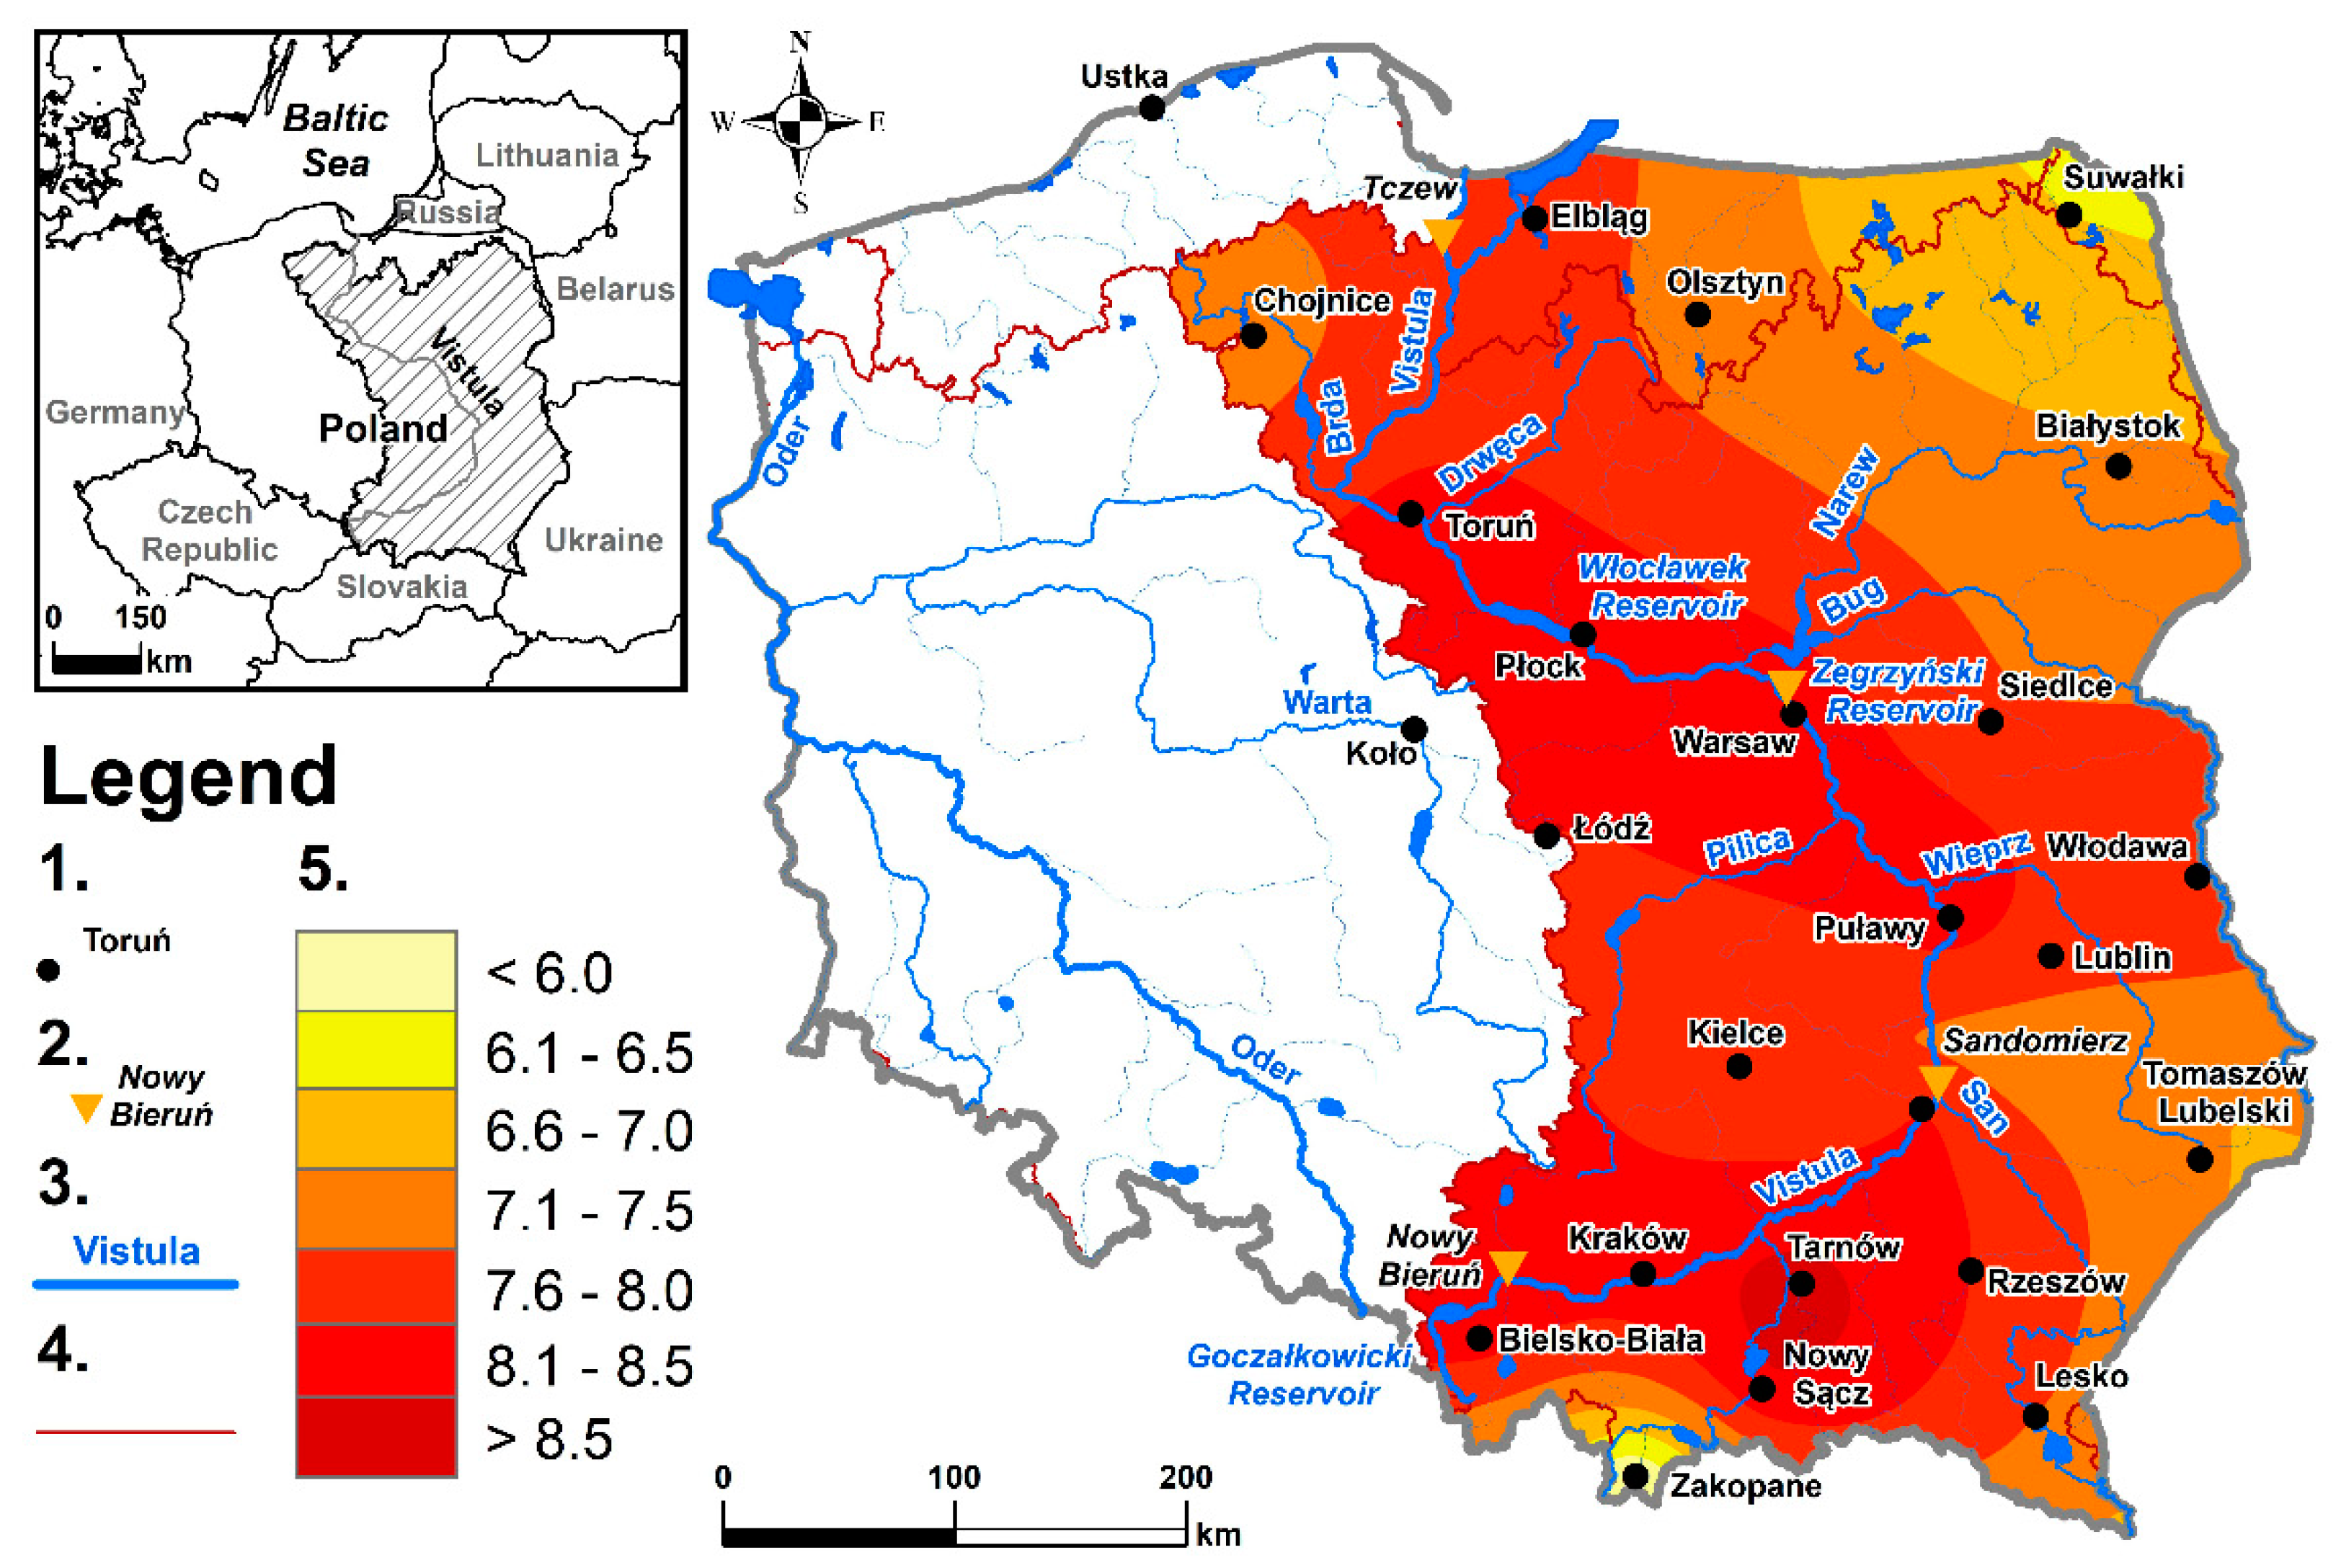
The Vistula River basin is clearly zoned in terms of terrain and amount of precipitation. The climate is transitional (maritime–continental), and continental and oceanic masses often collide, resulting in highly changeable weather. Four zones can be distinguished in the annual precipitation distribution in the Vistula basin. The lowest precipitations totals were found in the lowland belt in the central part of the Vistula River basin (less than 550 mm), slightly higher annual precipitation totals were found in the northern part of the basin and in the upland belt (up to 700 mm). In the southern part of the Vistula river basin, annual rainfall amounts ranged from 700 to 800 mm, while in the mountain areas, rainfall in the basin was the highest and exceeded 800 mm (Figure 1). The longitudinal belt system of hypsometry in Poland facilitates the free flow of air masses in parallel from east to west. In the Vistula basin, there is a greater continental influence in the east, and more maritime influence in the west of the basin. The average annual air temperature in the western part of the Vistula River basin was above 8 °C and decreased towards the east reaching 7 °C. The lowest average annual air temperature was recorded in the north-eastern part of the basin and in mountain areas (below 6.5 °C) (Figure 2).
Over the last few decades, there have been extreme climatic events such as warm and dry periods, periods with catastrophic rainfall. Intensive rainfall, which occurred in May and June 2010 in the south-eastern part of the Vistula basin, contributed to the catastrophic flooding along the entire section of the Vistula [24,63]. Average monthly rainfall totals in May 2010 were 3–4 times higher than the average values for the period 1951–2015 at most meteorological stations in the southern part of the Vistula basin. During the last three decades, there were also dry periods (with little rainfall) and warm (often with hot summers), which resulted in meteorological droughts and, consequently, in the formation of hydrological droughts. Examples are 1992, 1994, 2003, 2006, 2008 and 2015 [64,65].
2.2. Data
In order to identify changes in the outflow of the Vistula River along its course, changes in meteorological conditions within its river basin were analyzed. The study takes into account a continuous data series of daily measurements and includes the sum of precipitation (P), average air temperature (T), minimal air temperature (T min), maximal air temperature (T max) and outflow rate (Q) in the hydrological years 1951–2015. The study was conducted in relation to the hydrological year, which in Poland lasts from November 1 to October 31 of the following year. The data is provided by the Institute of Meteorology and Water Management—National Research Institute. Monthly and annual averages were calculated based on daily values. In total, data from four hydrological stations in the river’s upper, middle and lower courses were used. Meteorological conditions were characterised based on nine meteorological stations in the Vistula River basin that recorded daily precipitation sums and air temperatures in the years 1951–2015 (Table 1). For the selected 4 meteorological stations (Bielsko-Biała, Lublin, Białystok and Chojnice), the average monthly maximum and minimum air temperature was presented. Based on the initial analysis of hydrometeorological data, the 65 year period (1951–2015) was divided into two comparable sub-periods: 1951–1980 (30 years) and 1981–2015 (35 years).
Data available for 25 meteorological stations, most of which have complete data from 1951–2015, were used to map the course of annual precipitation totals (Figure 1) and the average annual air temperature (Figure 2). The exceptions are meteorological stations in Rzeszów (1952–2015), Lesko (1954–2015) and Nowy Sącz (1954–2015). Points interpolation through the kriging tool in ArcGIS was used to prepare the map. The selection of meteorological and hydrological data of appropriate quality is extremely important for further analysis [66]. The meteorological and hydrological stations represent the various geographic regions of the country. The above data series come from a certified database, adapted to the heterogeneity of the Institute of Meteorology and Water Management—National Research Institute.
The basic criteria for the selection of stations were the length and completeness of the available time series of records and the spatial distribution of the stations in order to cover the range, it is not possible that this is the territory of Poland in a uniform manner in climatic regions. Data was used only from the station with no breaks in the observation series. The data has been identified and quality control has been performed. The first step was to digitize errors such as the maximum temperature lower than the minimum temperature. Daily precipitation values were also checked to identify false values according to the approach of other authors [67,68]. On the basis of the daily average, maximum and minimum air temperature values, monthly average values were calculated.
The highest of the meteorological stations is in Bielsko-Biała (398 m a.s.l.), which reflects the meteorological conditions in the upper Vistula basin. There are three meteorological stations in the upland area of the Vistula River basin, i.e., in Kraków (237 m a.s.l.), Kielce (260 m a.s.l.) and Lublin (238 m a.s.l.). The majority of the Vistula River basin lies at altitudes ranging from 100 to 200 m a.s.l. (Łódź, Warsaw, Białystok, Chojnice). The most low-lying is the meteorological station in Toruń (69 m a.s.l.). Four hydrological stations were used to address the hydrological conditions of the Vistula, and these reflect the volume of Vistula outflows in its upper (Nowy Bieruń and Sandomierz), middle (Warsaw) and lower (Tczew) courses (Table 2).
2.3. Statistical Data Homogeneity
The statistical homogeneity of the data was determined using the non-parametric Kruskal–Wallis test [69], known as the rank sum test. This involved ordering and assigning a rank to the items of all samples, and then determining the sum of ranks for each sample. If the verified hypothesis H0 that all samples derive from a single general population (i.e., that they are homogenous) is true, then the sum of ranks for individual samples should not differ significantly. The x2 statistic used in this test has an asymptotic distribution with k − 1 degrees of freedom. For the assumed significance level α and for k − 1 degrees of freedom the critical value x2 is read from the Pearson x2 distribution table, such that P {x2 ≥ xα2} = α. If the calculated value of statistics x2 ≥ xα2 then the H0 hypothesis should be rejected, whereas if x2 < xα2 then there is no reason to reject the H0 hypothesis, indicating that all the samples are homogenous. The null hypothesis H0 was verified as significant at α = 0.05.
2.4. Detecting Trends
The non-parametric Mann–Kendall test [70,71], which is commonly used in hydrological analyses, was used to track changes in river outflow trends. Mann–Kendall statistics and the β directional coefficient expressed by the Theil-Sen estimator [72,73] were calculated for periods covering every possible combination of start- and end-years for the multi-year research period. The minimum length of calculation period was 30 years, as per the standard for hydrological calculations [74,75,76].
Mann–Kendall S statistics were calculated using the formula:
where:
- xj and xk—values of the variable in particular years j and k, where j > k,
- n—series length (number of years).
The S statistic quickly tends towards the norm, and for n > 10 this statistic has an approximately normal distribution with a mean of 0 and a variance described by the formula:
In the Mann–Kendall test, the null hypothesis assumes no significant trend in the data series. The trend is significant if the null hypothesis cannot be accepted. The region of acceptance at the significance level α = 0.05 is determined by the range −1.96 ≤ Z ≤ 1.96 (no significant trend), while the rejection region is given by Z < −1.96 (significant downward trend) and Z > 1.96 (significant upward trend), where Z is a standardized test statistic.
T β directional coefficient expressed by the Theil–Sen estimator (β) was calculated by the formula:
A positive β value indicates an upward (increasing) trend, and a negative value indicates a downward (decreasing) trend in a time series.
2.5. Annual and Seasonal Variability
The annual and seasonal variability was determined using the Cv coefficient of variation based on long-term annual averages and monthly averages.
- δ—standard deviation
- —monthly average value in a given year (precipitation, outflow) or month
- —average monthly value over several years for individual years or months
- n—number of years in a multi-annual period.
Changes in river outflow at selected posts were analyzed based on average monthly precipitation sums and average monthly outflows in the years 1951–1980 and 1981–2015.
3. Results
3.1. Precipitation and Air Temperature in the Vistula Basin in 1951–2015 and Their Annual Variability
Analysis of annual sums of atmospheric precipitation in the Vistula basin in 1951–2015 showed uneven precipitation distribution in individual years and at individual meteorological stations (Figure 1). Precipitation shows a dependence on hypsometry and its spatial distribution corresponds to the layout of the main geographical regions. The highest precipitation is recorded in the south of Poland, in the mountain region. The highest average annual precipitation in the studied long-term period was recorded at the Bielsko-Biała meteorological station (987.2 mm), in the upper part of the river basin. As terrain lowers northwards, so the amount of precipitation decreases, and in the uplands precipitation totaled 550 mm (Kraków, Kielce, Lublin, Łódź). The central part of the Vistula River basin is occupied by a belt of lowlands (central Poland) where precipitation is lowest, ranging from 550 mm to 500 mm (Warsaw, Toruń). In the northern part of the river basin, in the lakelands, annual precipitation was slightly higher, at 550–600 mm (Białystok, Chojnice).
The annual average temperature at individual meteorological stations in the period 1951–2015 ranged from 8.2 °C in the south and center of Poland to 7.1 °C in the north (Białystok). The highest annual average temperatures at all stations were recorded in 2007. The lowest annual air temperatures were recorded in 1996 at the four stations in the south of the country, while in central and northern Poland the lowest average annual temperatures were recorded in 1970. Only at the most eastward meteorological station of Bialystok was the coldest year 1987.
Based on the calculations (Table 2), it was indicated that at all meteorological stations analyzed the average annual air temperatures were significantly higher in 1981–2015 than in 1951–1980. Meanwhile, at six meteorological stations, the annual precipitation totals were lower in the years 1981–2015 than in the years 1951–1980 or 1951–2015. The exceptions, where the precipitation was slightly higher, were stations in central and northern Poland (Warsaw, Toruń, Chojnice).
Annual Trends in Precipitation and Air Temperature
The average annual precipitation and air temperature values for the nine meteorological stations were analyzed statistically to assess homogeneity of measurement series. The results of the Kruskal–Wallis test for atmospheric precipitation for the years 1951–1980 and 1981–2015 indicated no reasons to reject the null hypothesis (H0) assuming homogeneity of the analyzed precipitation data for the nine meteorological stations (Białystok, Bielsko-Biała, Chojnice, Kielce, Kraków, Łódź, Lublin, Toruń, Warsaw). This is evidenced by the χ2 values, which were smaller than the value adopted when defining the critical region (for the compared samples: χ2kr = 3.841 and 2.706). This means that the analyzed random variables came from the same general population. It was found that there was no significant factor affecting the processes controlling the large water outflow from the studied catchments that appeared in the analyzed multi-year period. In the case of annual average sums of precipitation, a slight upward trend or no trend was recorded throughout the entire period of 1951–2015 for seven of the meteorological stations (Figure 2, Table 3). Only at the stations in Bielsko-Biała and Kielce was the trend downwards during this period, though this was not statistically significant. In the years 1981–2015, a slight upward trend in precipitation was recorded at all the meteorological stations. The results for the nine meteorological stations agree with the results presented by other authors for a greater number of meteorological stations in the Vistula basin [77,78].
The calculated statistics of the non-parametric Kruskal–Wallis rank sum for air temperature indicate that the H0 hypothesis about the homogeneity of air temperature observations should be rejected for all nine meteorological stations. Air temperatures were definitely higher in 1981–2015 than in 1951–1980. A particular increase in temperature was recorded in the years 1981–2015, when the rate of increase was varied, ranging from 0.27 to 0.45 °C per decade at different stations. A downward trend in air temperature was recorded at six meteorological stations in the period 1951–1980. The upward trend in air temperature was statistically significant at all analyzed meteorological stations in the years 1951–2015 and 1981–2015, as the statistics show (Table 3).
3.2. Outflows in the Years 1951–2015 and Their Volatility
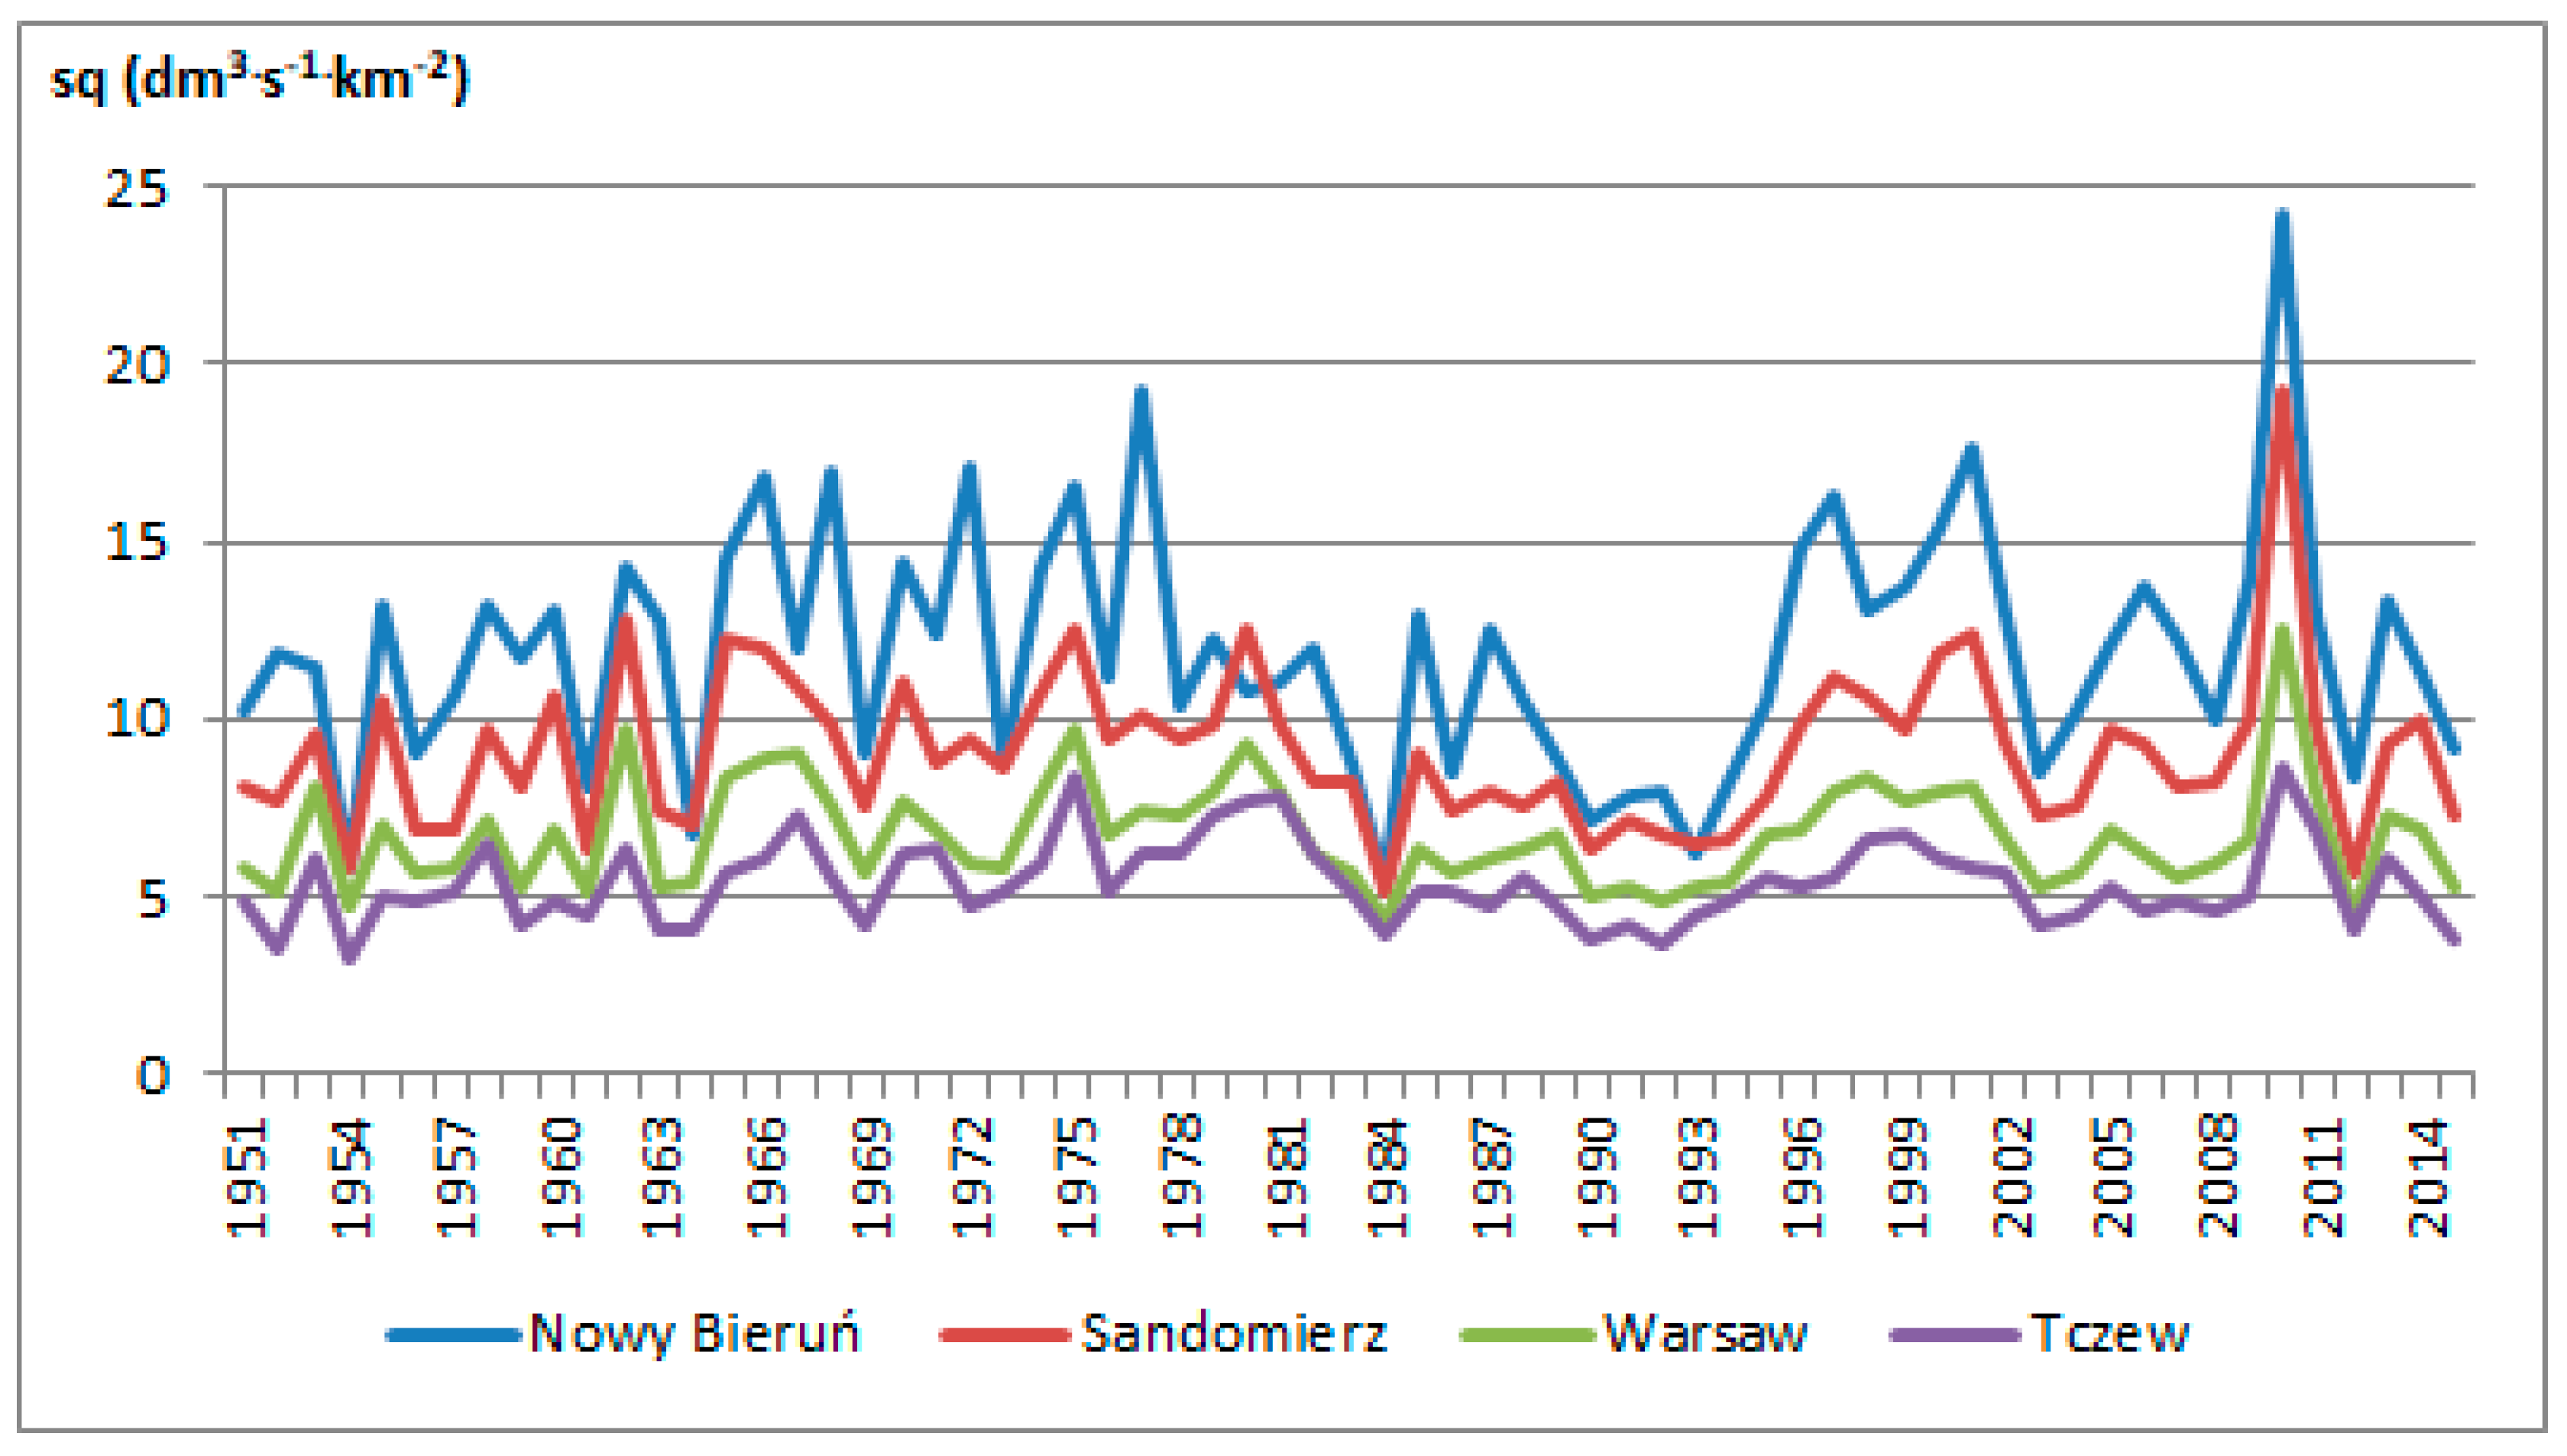
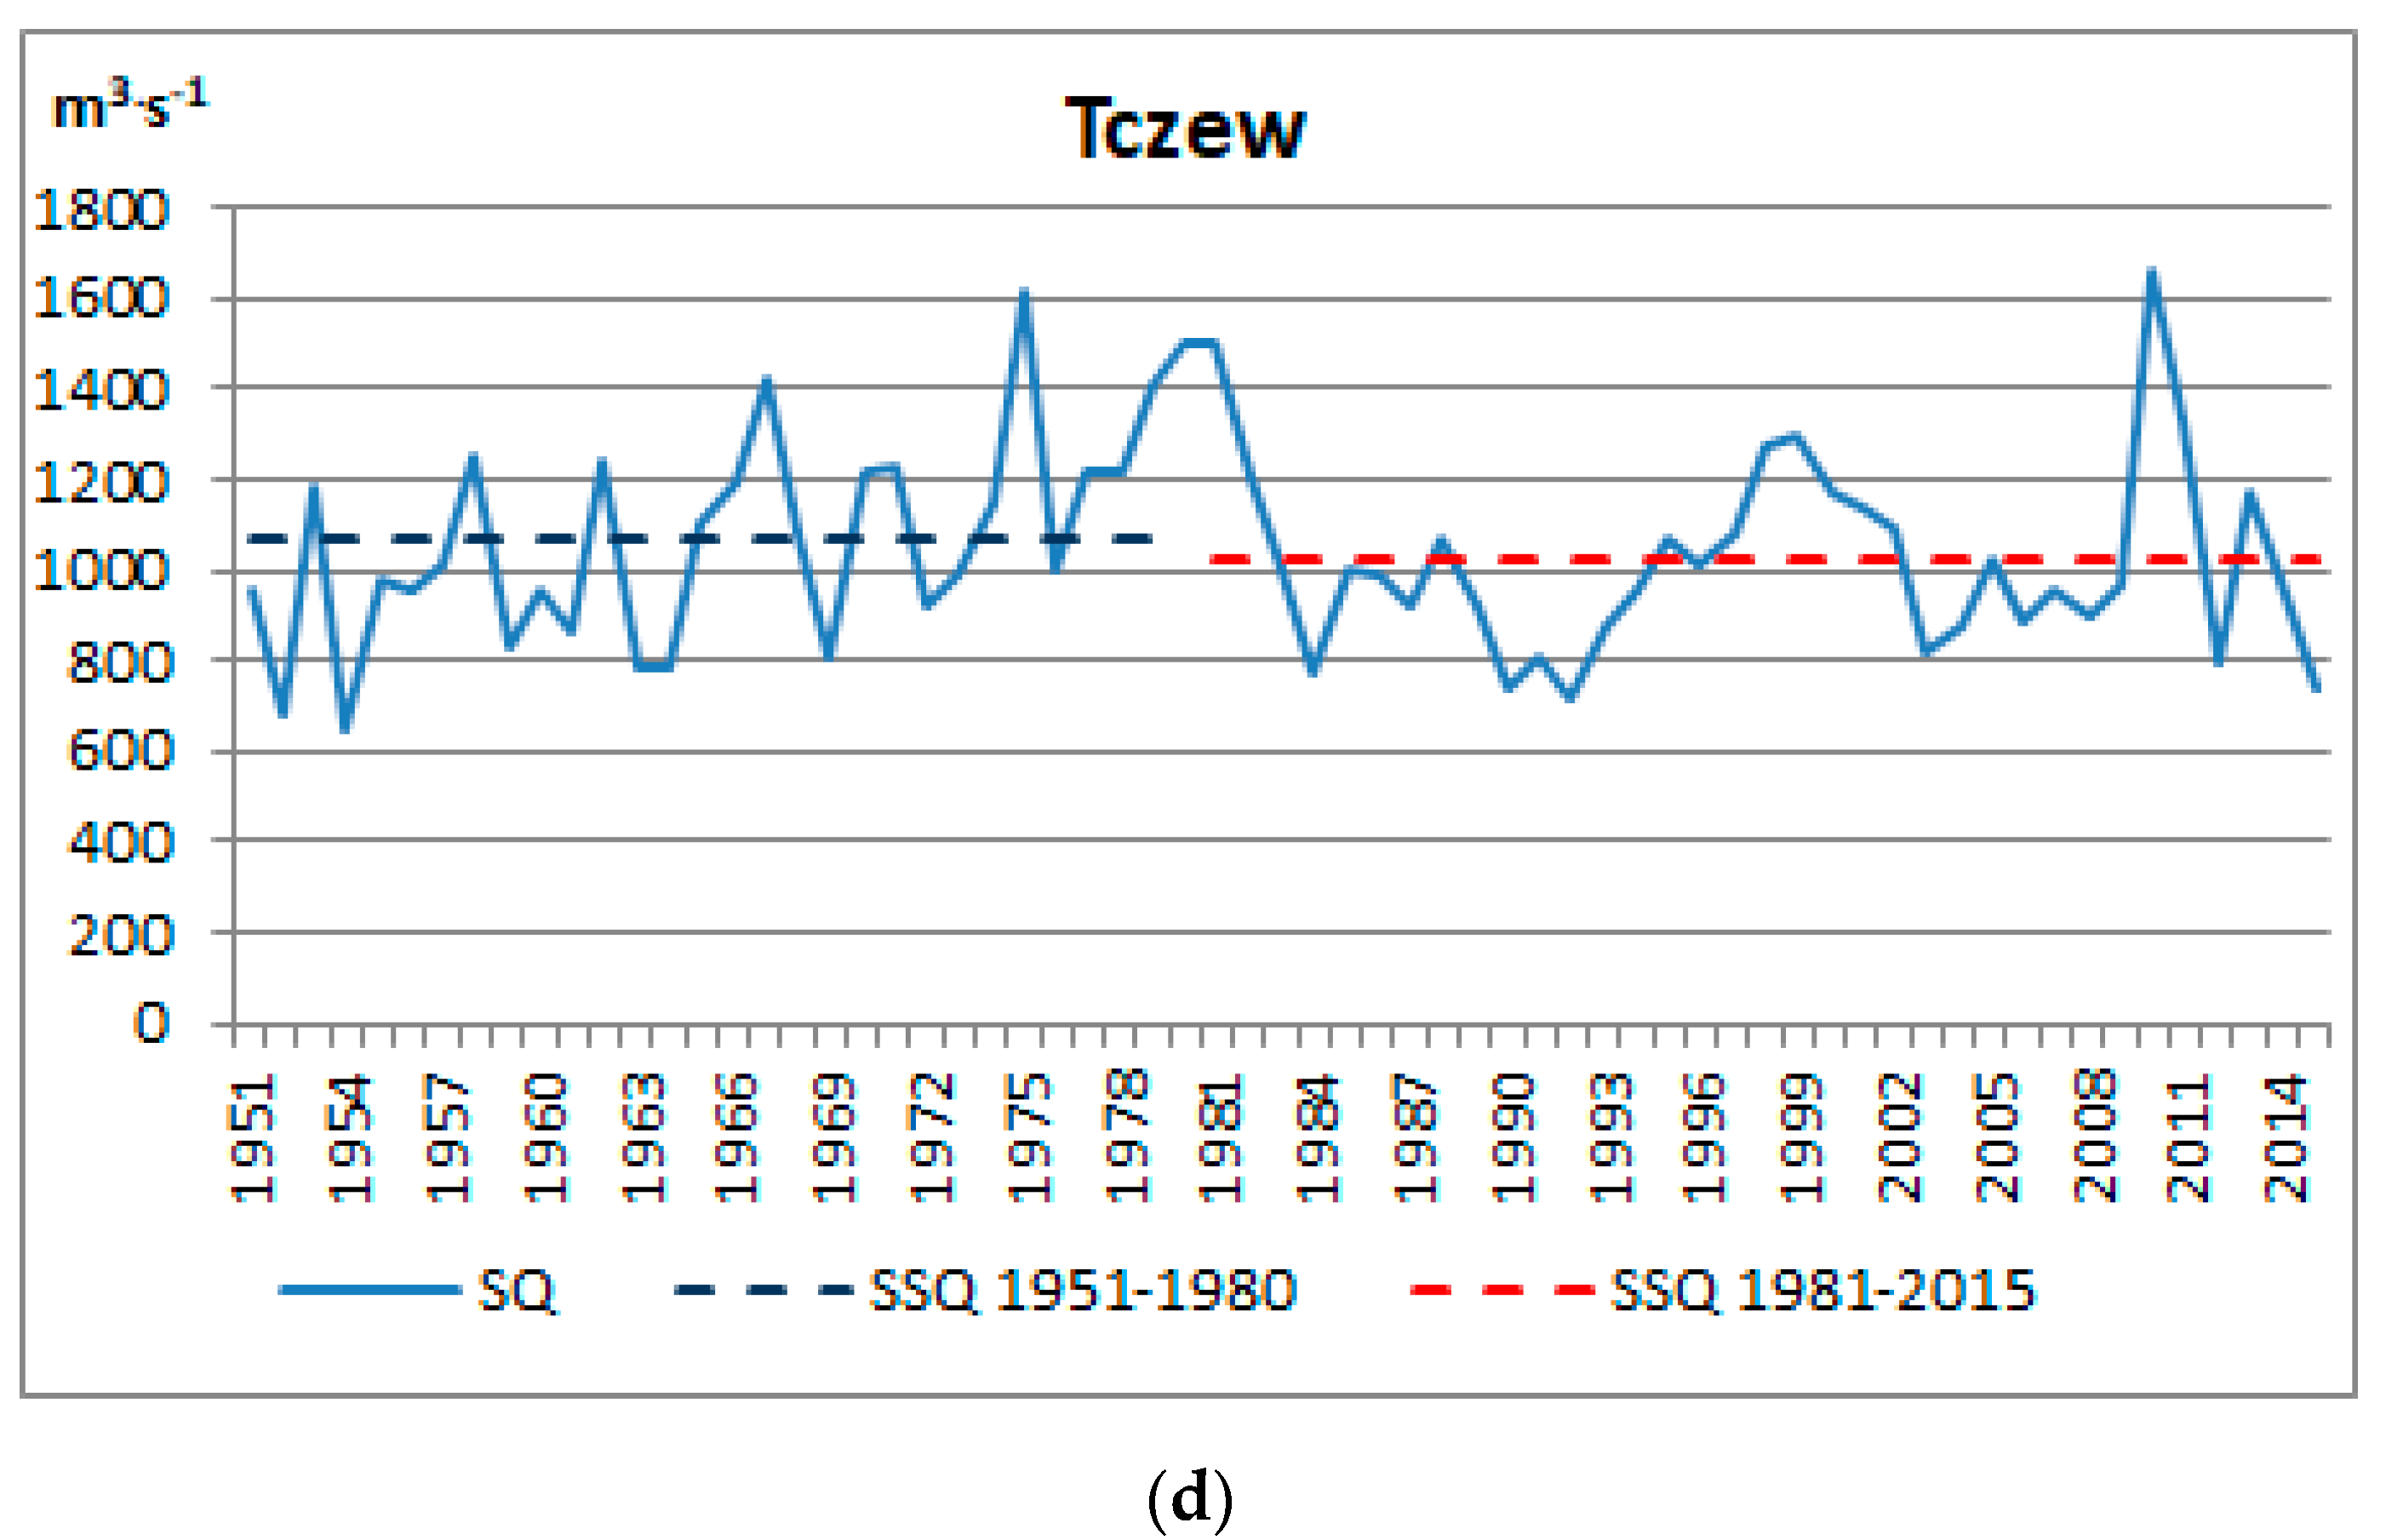
The analysis of average annual outflows of the Vistula included data for four hydrological stations along the river’s course. The volume of outflows on the Vistula increased with the increase in catchment size along its course: the smallest outflows were recorded in Nowy Bieruń and the largest in Tczew. Outflow variability (Cv) decreased with the increase in catchment size along its course in the research period (Table 4). The 1981–2015 period was characterized by greater outflow variability than the 1951–1980 period, with the exception of Tczew. At all analyzed hydrological stations, the average annual outflow was lower in 1981–2015 than in 1951–1980. The highest average annual Vistula River outflows in the analyzed multi-year period occurred in 2010 at all water gauge stations. They were caused by intense precipitation in May and June in the south-eastern part of the Vistula basin. The unit outflow decreased inversely to the area of individual sub-catchments, and in the years 1951–2015 averaged from 11.9 dm3·s−1·km−2 in the upper Vistula River (Nowy Bieruń) to 5.4 dm3·s−1·km−2 in the lower course (Tczew). Unit outflow for particular sub-catchments in 2010 ranged from 8.6 dm3·s−1·km−2 in Tczew to 24.2 dm3·s−1·km−2 in Nowy Bieruń. The lowest average annual outflows were recorded in 1984 (Nowy Bieruń, Sandomierz, Warsaw) and in 1954 (Tczew). Unit outflow in these years was 5.4 dm3·s−1·km−2 in Nowy Bieruń, 5.2 dm3·s−1·km−2 in Sandomierz and 4.32 dm3·s−1·km−2 in Warsaw. The smallest average annual unit outflow in 1954 was 3.3 dm3·s−1·km−2, recorded in Tczew (Figure 3).
3.2.1. Analysis of Annual Outflow Trends
The results of the Kruskal–Wallis test for 1951–1980 and 1981–2015 did not indicate any reasons to reject the null hypothesis (H0) assuming homogeneity of the analyzed data for Nowy Bieruń, Sandomierz, Warsaw and Tczew. This is evidenced by the χ2 values, which were smaller than the value adopted when defining the critical region (for the compared samples: χ2kr = 3.841 and 2.706). This means that the analyzed random variables come from the same general population. It was found that there was no significant factor affecting the processes controlling the large water outflow from the studied catchments that appeared in the analyzed multi-year period.
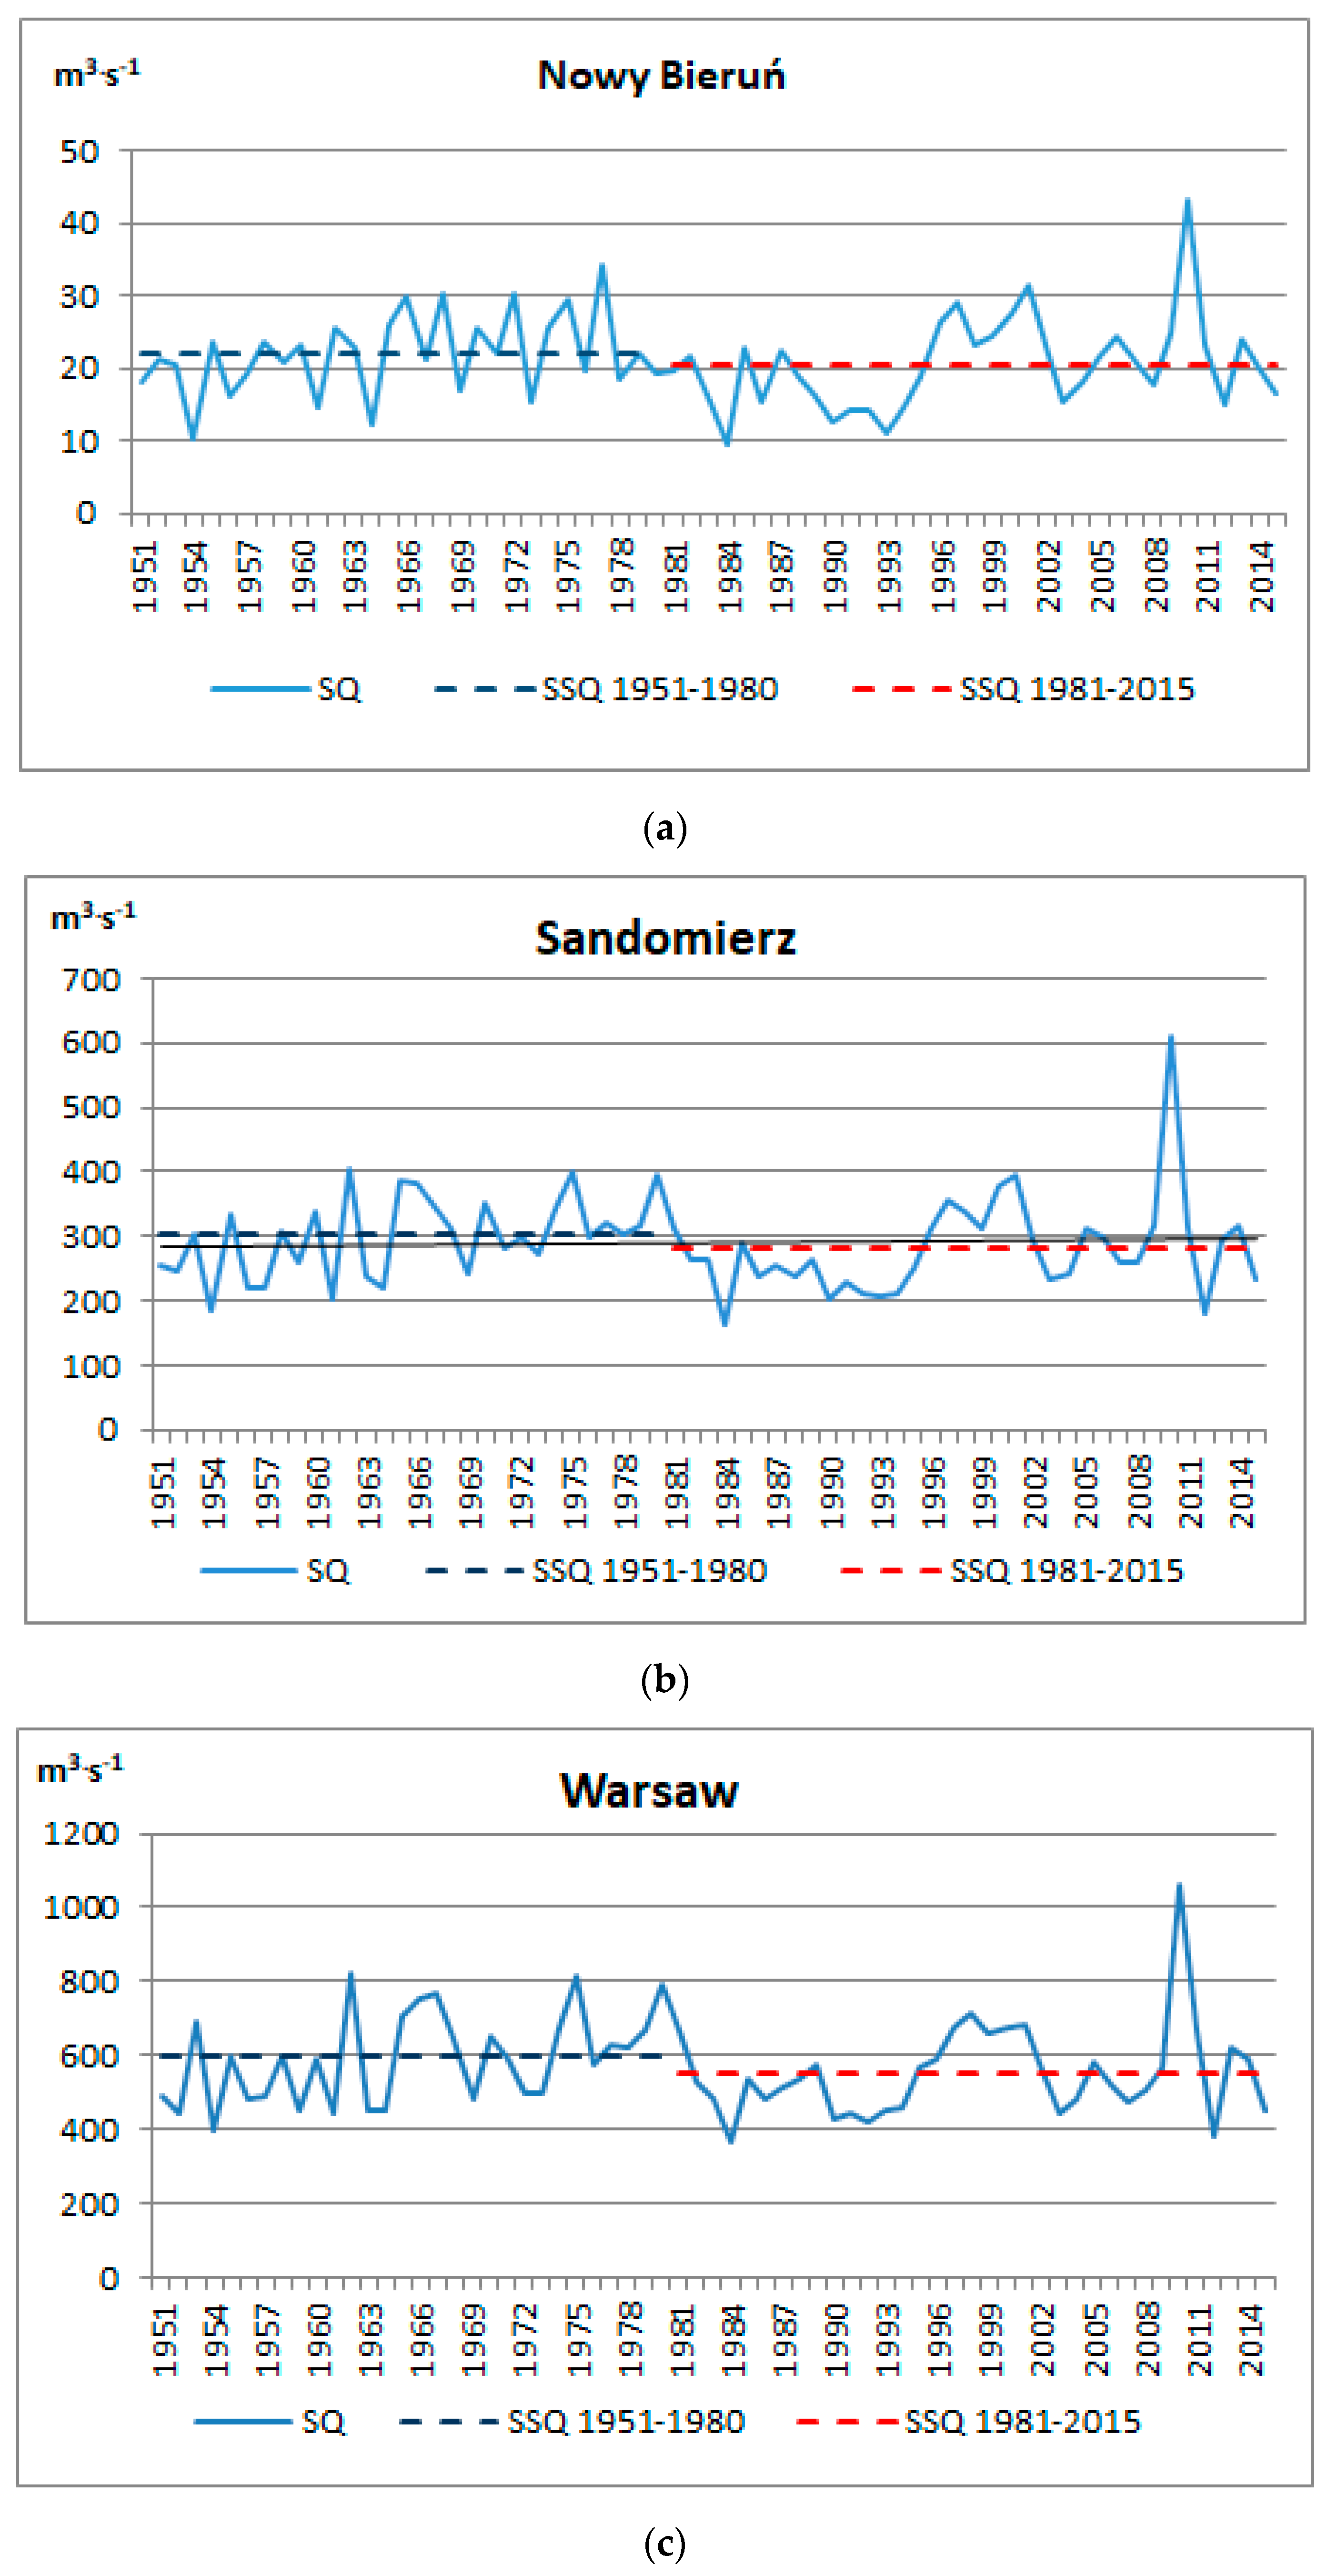
The analysis of annual average Vistula outflows in the years 1951–2015 at all analyzed hydrological stations showed slight to zero upward trends that were not statistically significant. The largest changes in river outflow were recorded in 1951–1980. In these years, strong upward trends in statistically significant outflows were recorded in three out of four hydrological stations, with the exception being the station at Nowy Bieruń. In the years 1981–2015, a slight upward trend was noticeable at the stations at Nowy Bieruń and Sandomierz (the upper course of the Vistula), while at the other hydrological stations in Warsaw (the middle section of the river) and Tczew (the lower section of the river) this trend was much smaller (Figure 4). The results are not statistically significant. This means that the river outflow has been stable over the years, with no major changes.
The analysis of the Vistula outflows revealed a slight increase or no trend at all hydrological stations in the years 1951–2015 and 1981–2015, in contrast to the period 1951–1980, when there was an upward trend in outflows (Table 5). It can thus be concluded that outflows trended downwards in the years 1981–2015 as compared to the years 1951–1980. This is the result of a large increase in air temperature alongside a small increase in precipitation, which indicates an increase in evapotranspiration. The lack of a clear downward trend in statistically significant outflows in the years 1981–2015 may result from short-term high outflows that affected average outflow rates. An additional factor affecting outflow is land use, the volume of water abstraction for economic purposes, and groundwater supply. Therefore, to determine the impact of meteorological conditions on the volume of the Vistula’s water resources requires analysis of the distribution of outflows, precipitation and air temperature in individual months in the years 1981–2015 compared to 1951–1980.
3.2.2. Variability of Precipitation and Air Temperature over the Year
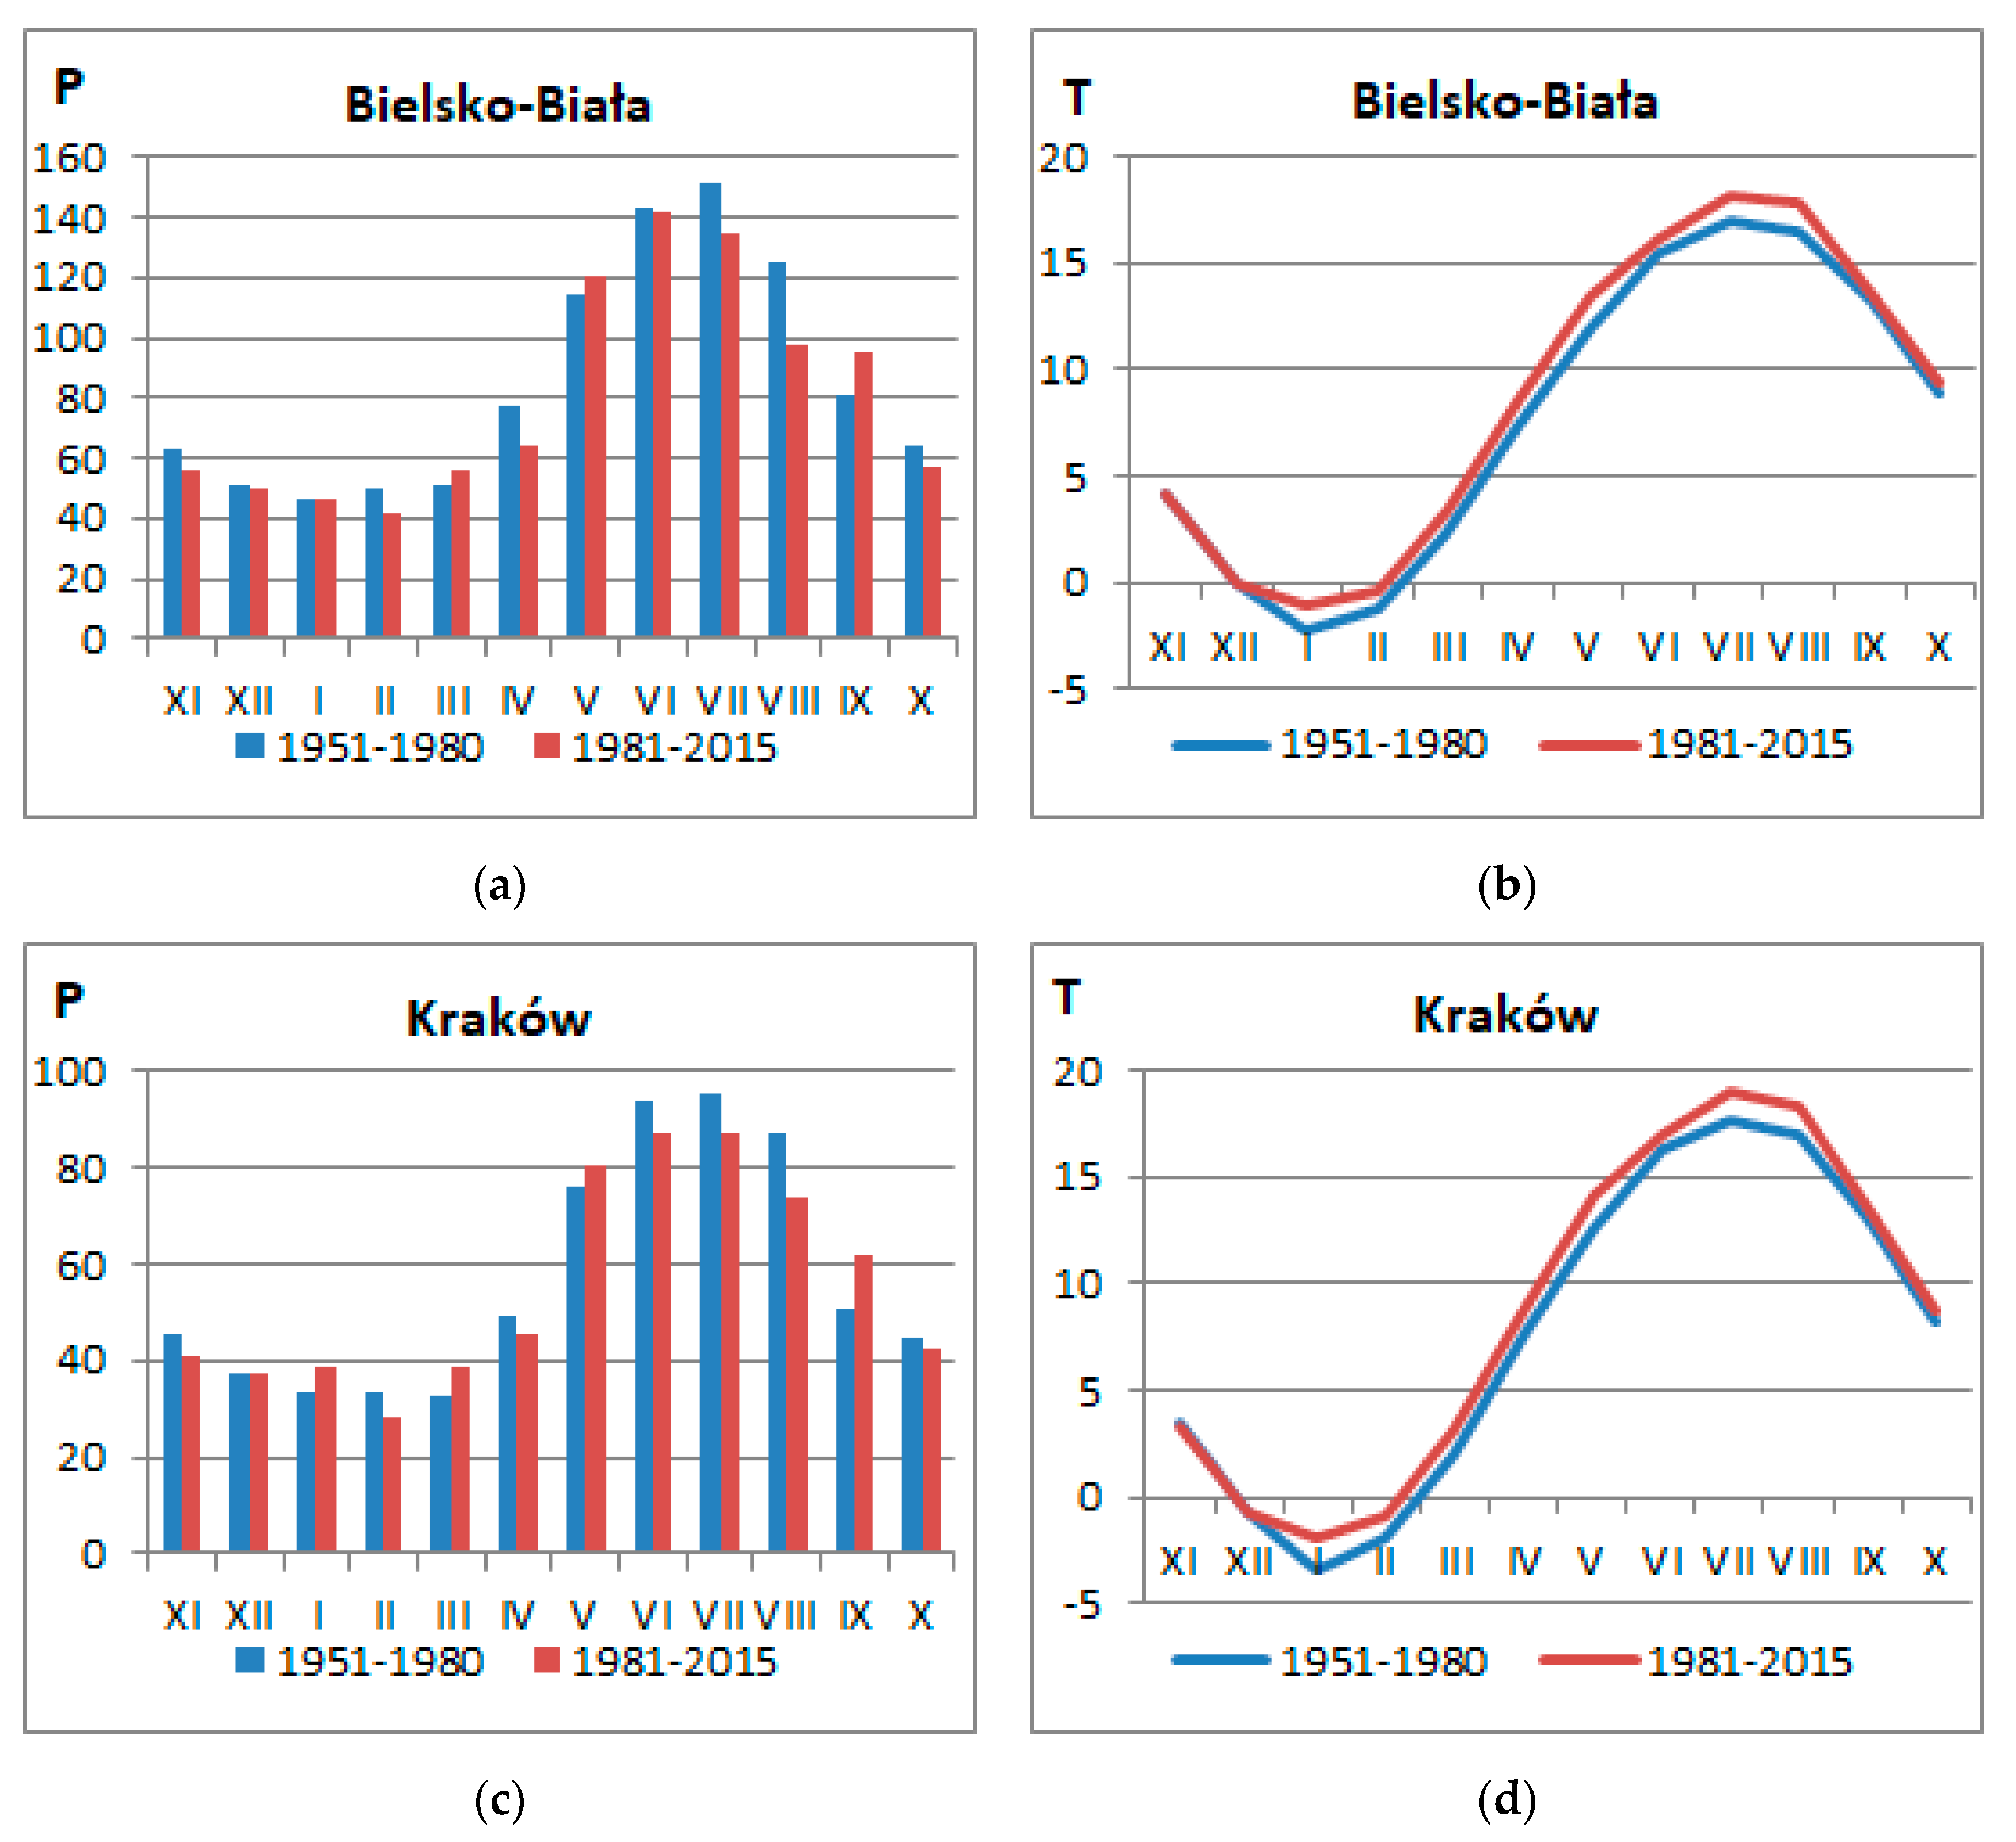
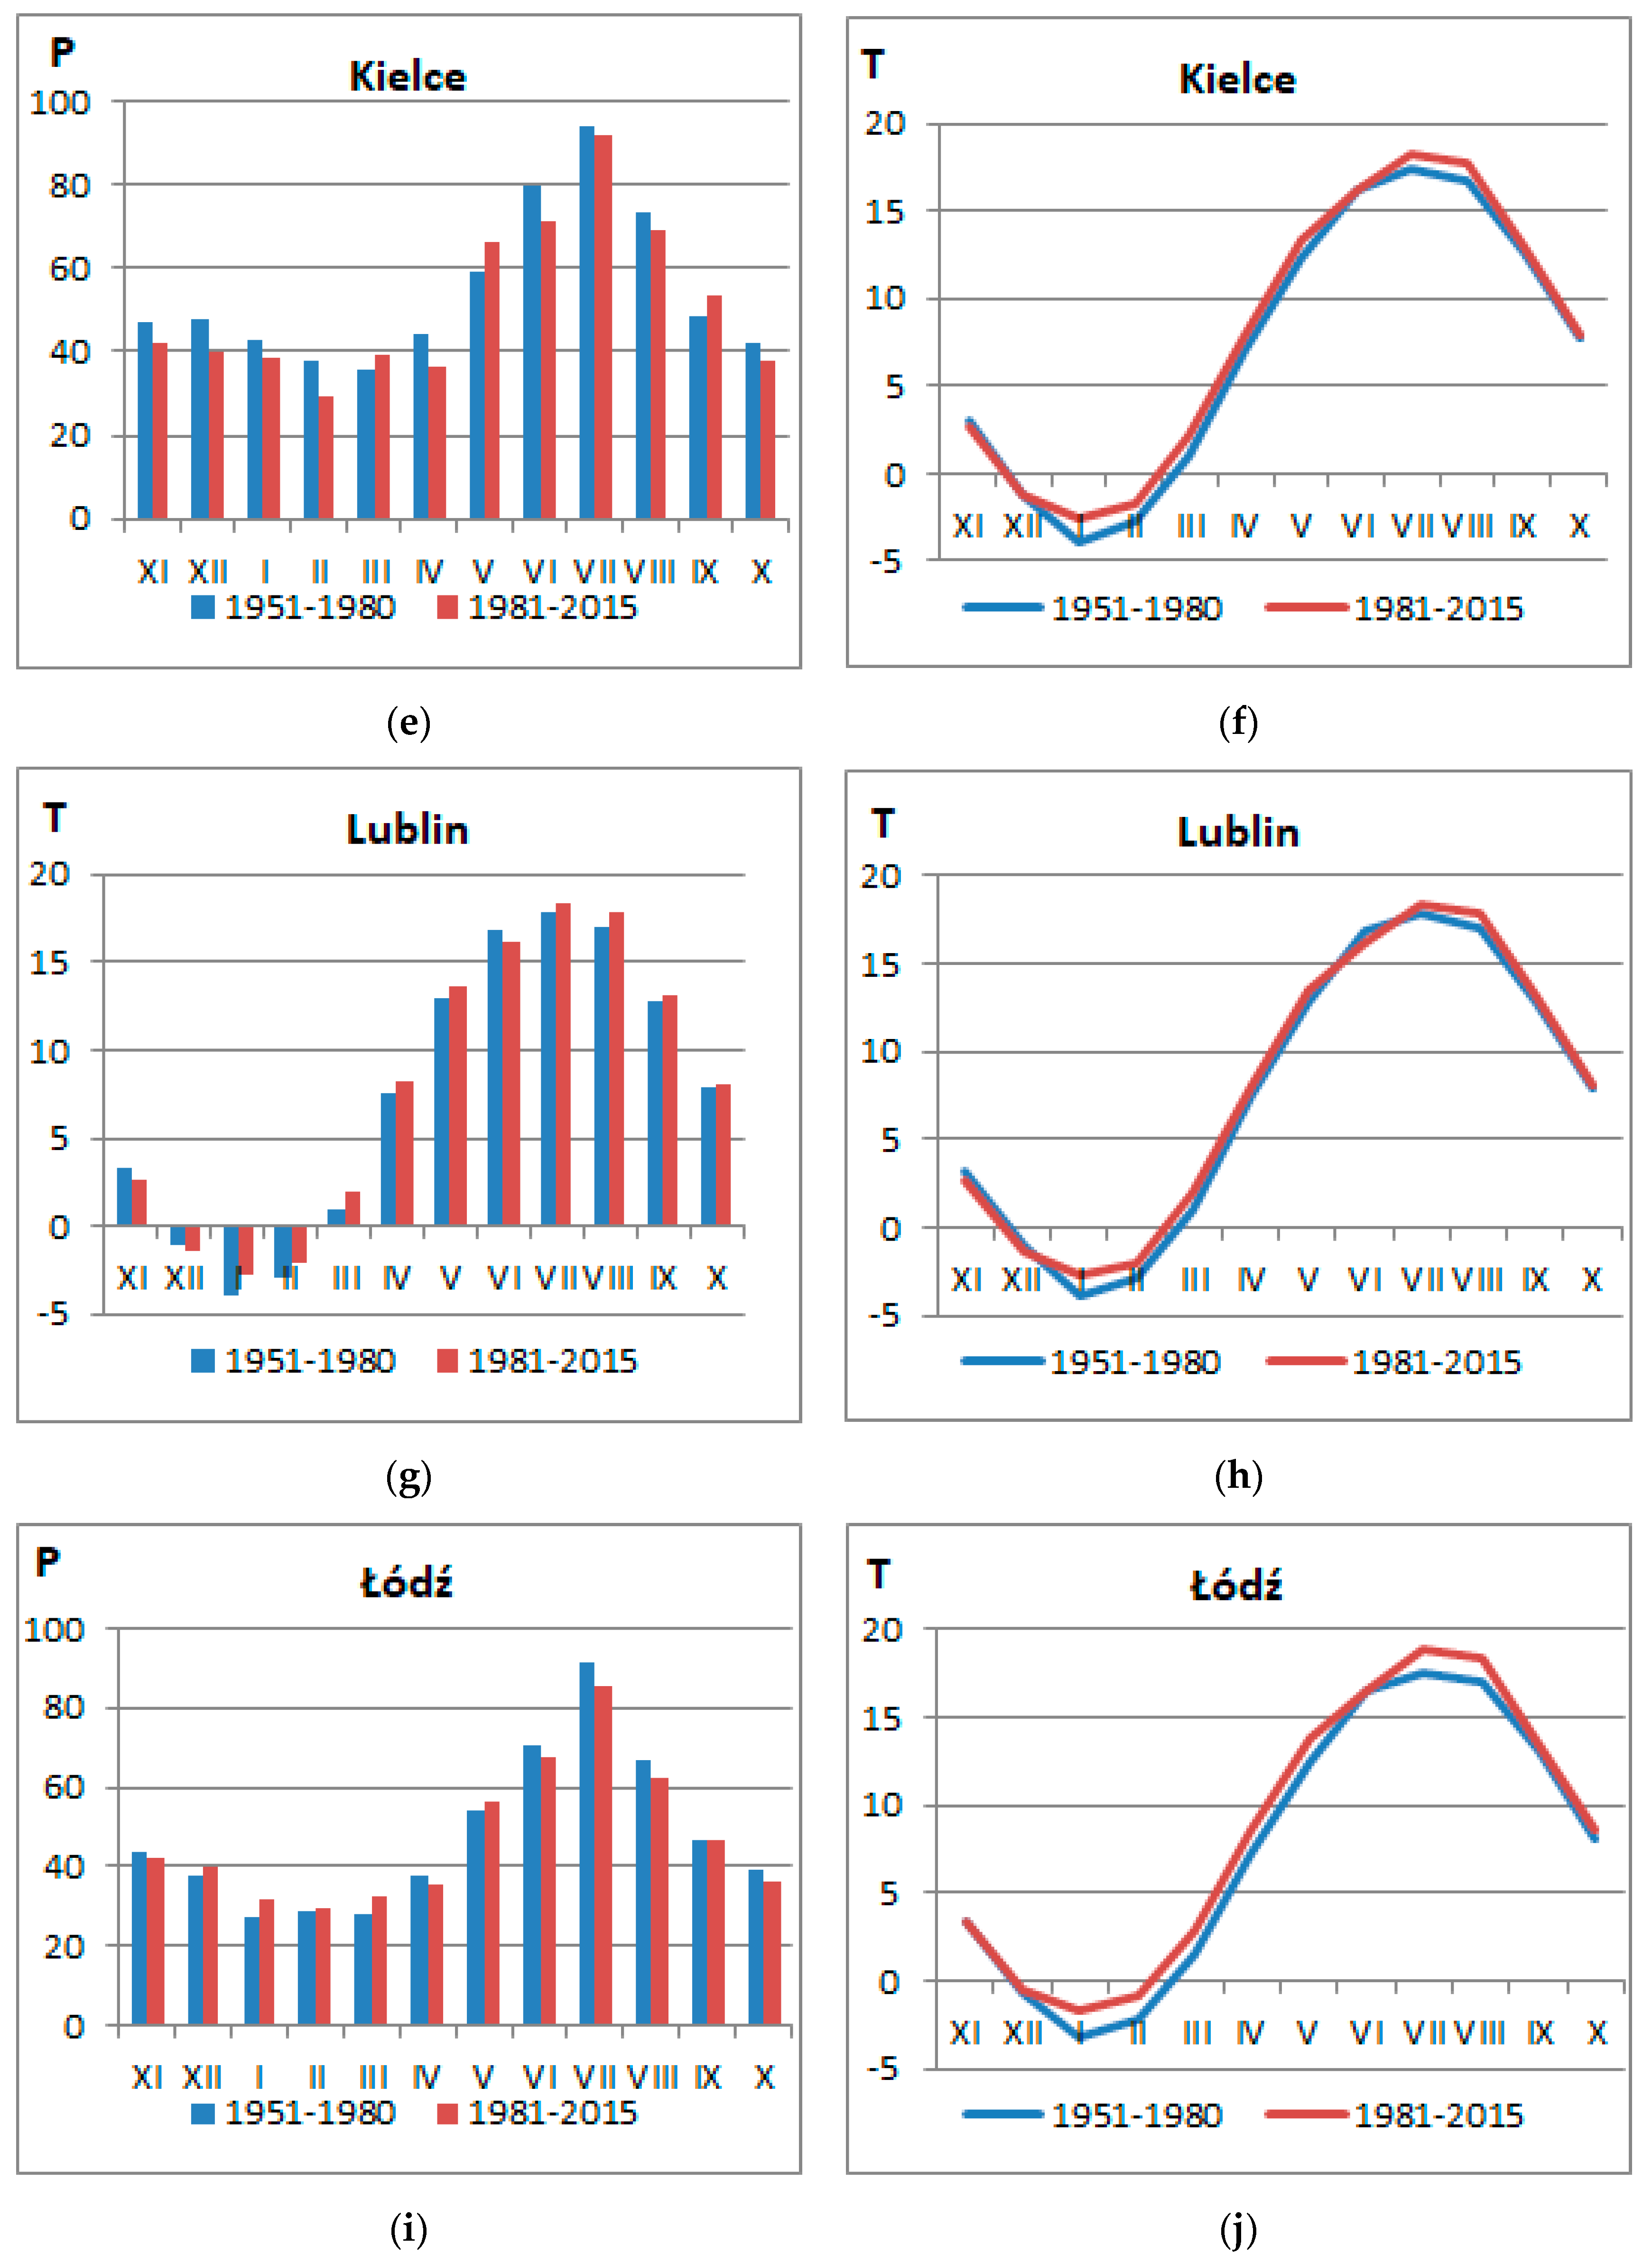
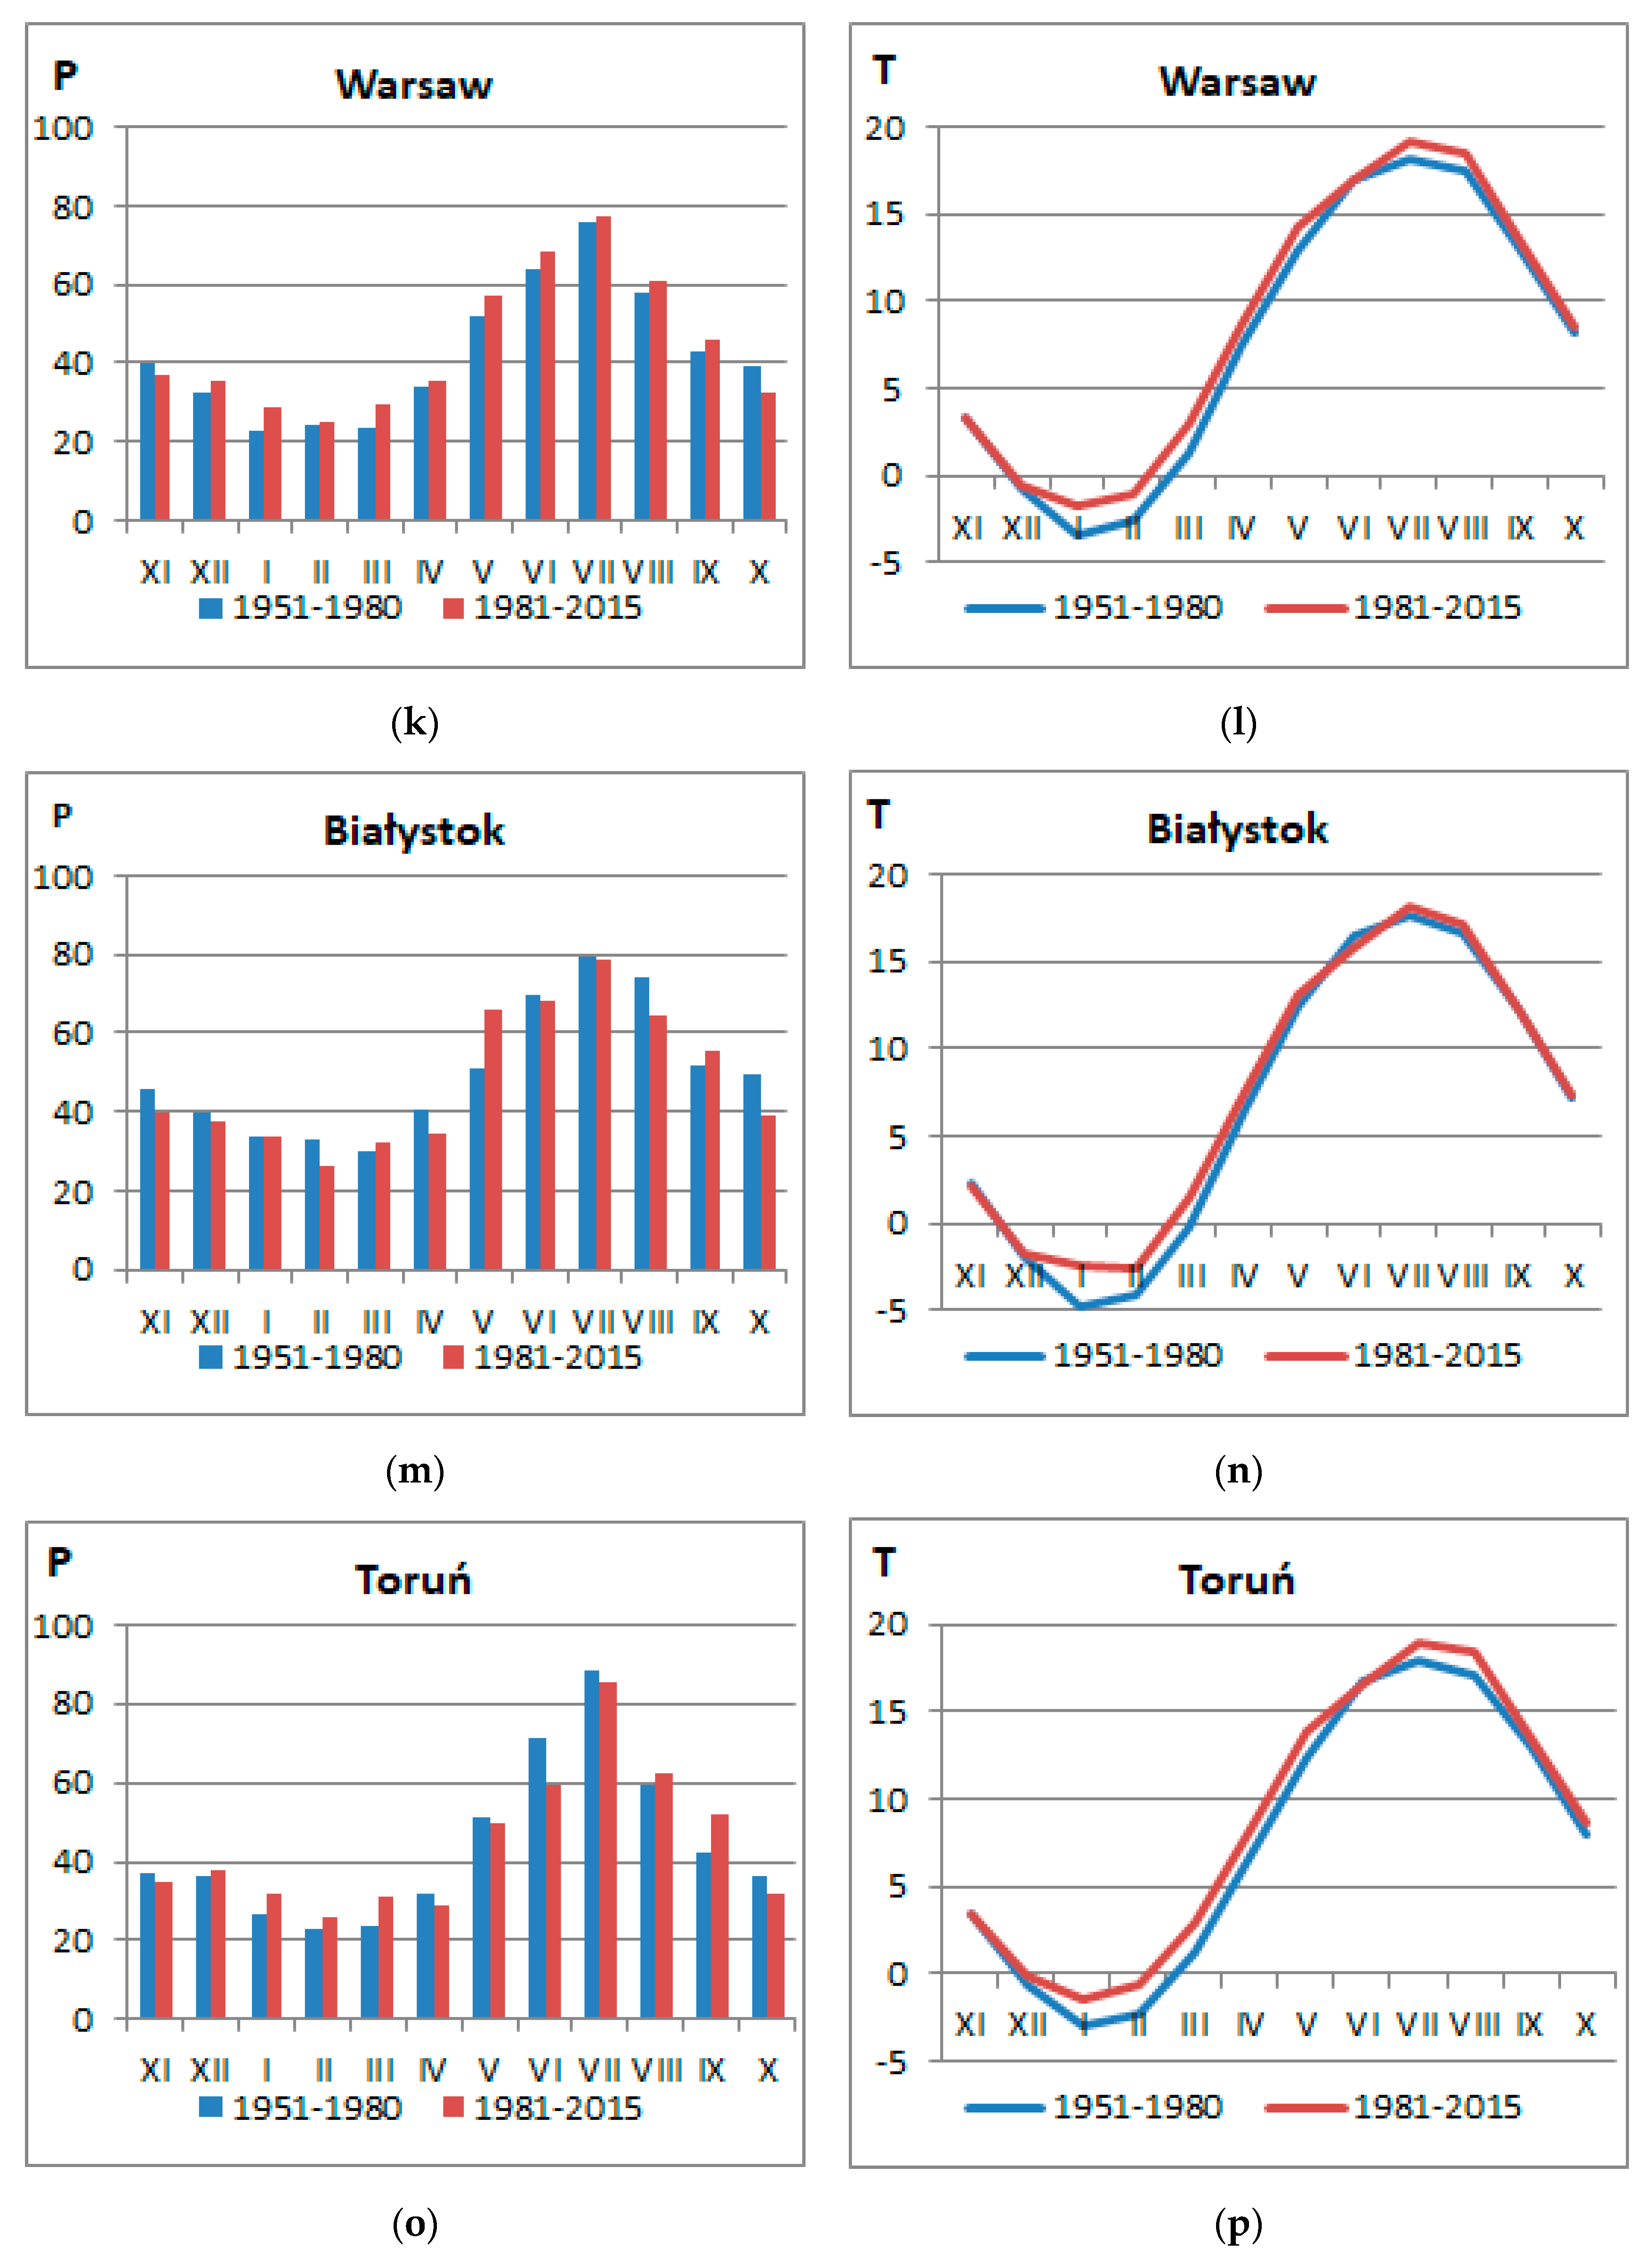
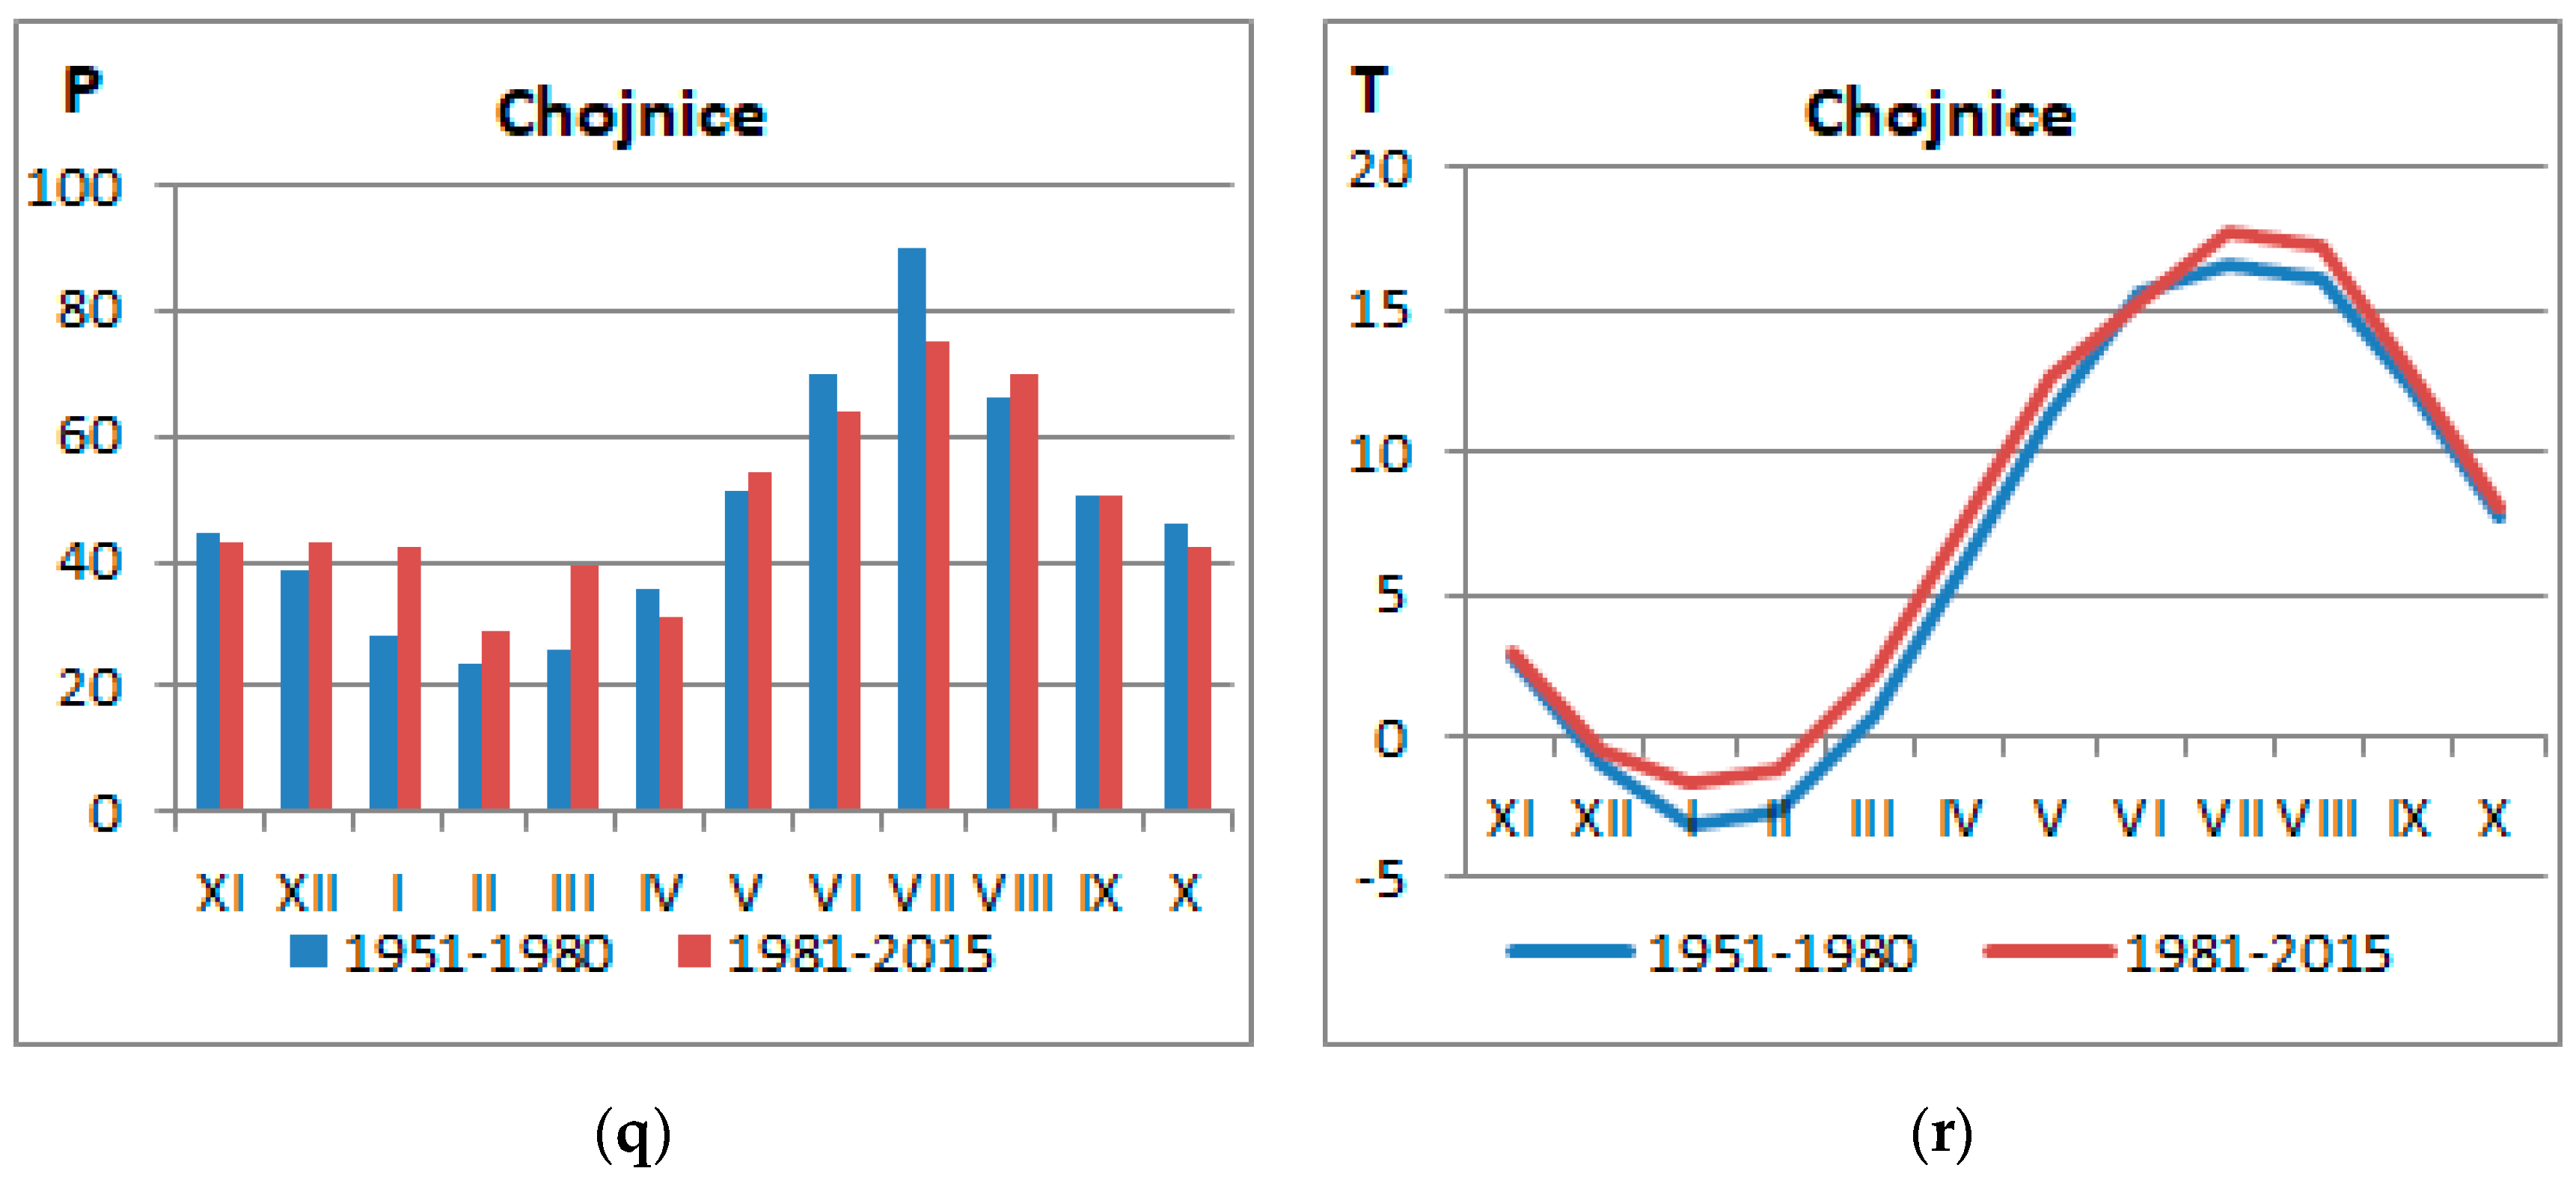
Figure 5 summarizes the average monthly sums of precipitation and average air temperature, which reflect meteorological conditions in individual sub-catchments of the Vistula River basin, for the period 1981–2015 compared to the period 1951–1980. In the years 1951–1980, precipitation was highest in the summer months, from May to September, peaking in July. Precipitation was lowest in the months from January to March, bottoming out in February. Over the last 35 years (1981–2015) precipitation has increased noticeably in September and May, which extended the period of high precipitation during the year (May to September), and this was countered by a drop in precipitation mainly in August and October. The highest average monthly air temperatures were recorded in the summer months, peaking in July and lowest in February. The trajectory of average monthly air temperatures over the years 1981–2015 was similar to the years 1951–1980, but with noticeably higher values at all analyzed meteorological stations. This shows that the years 1981–2015 were clearly warmer than the period 1951–1980.
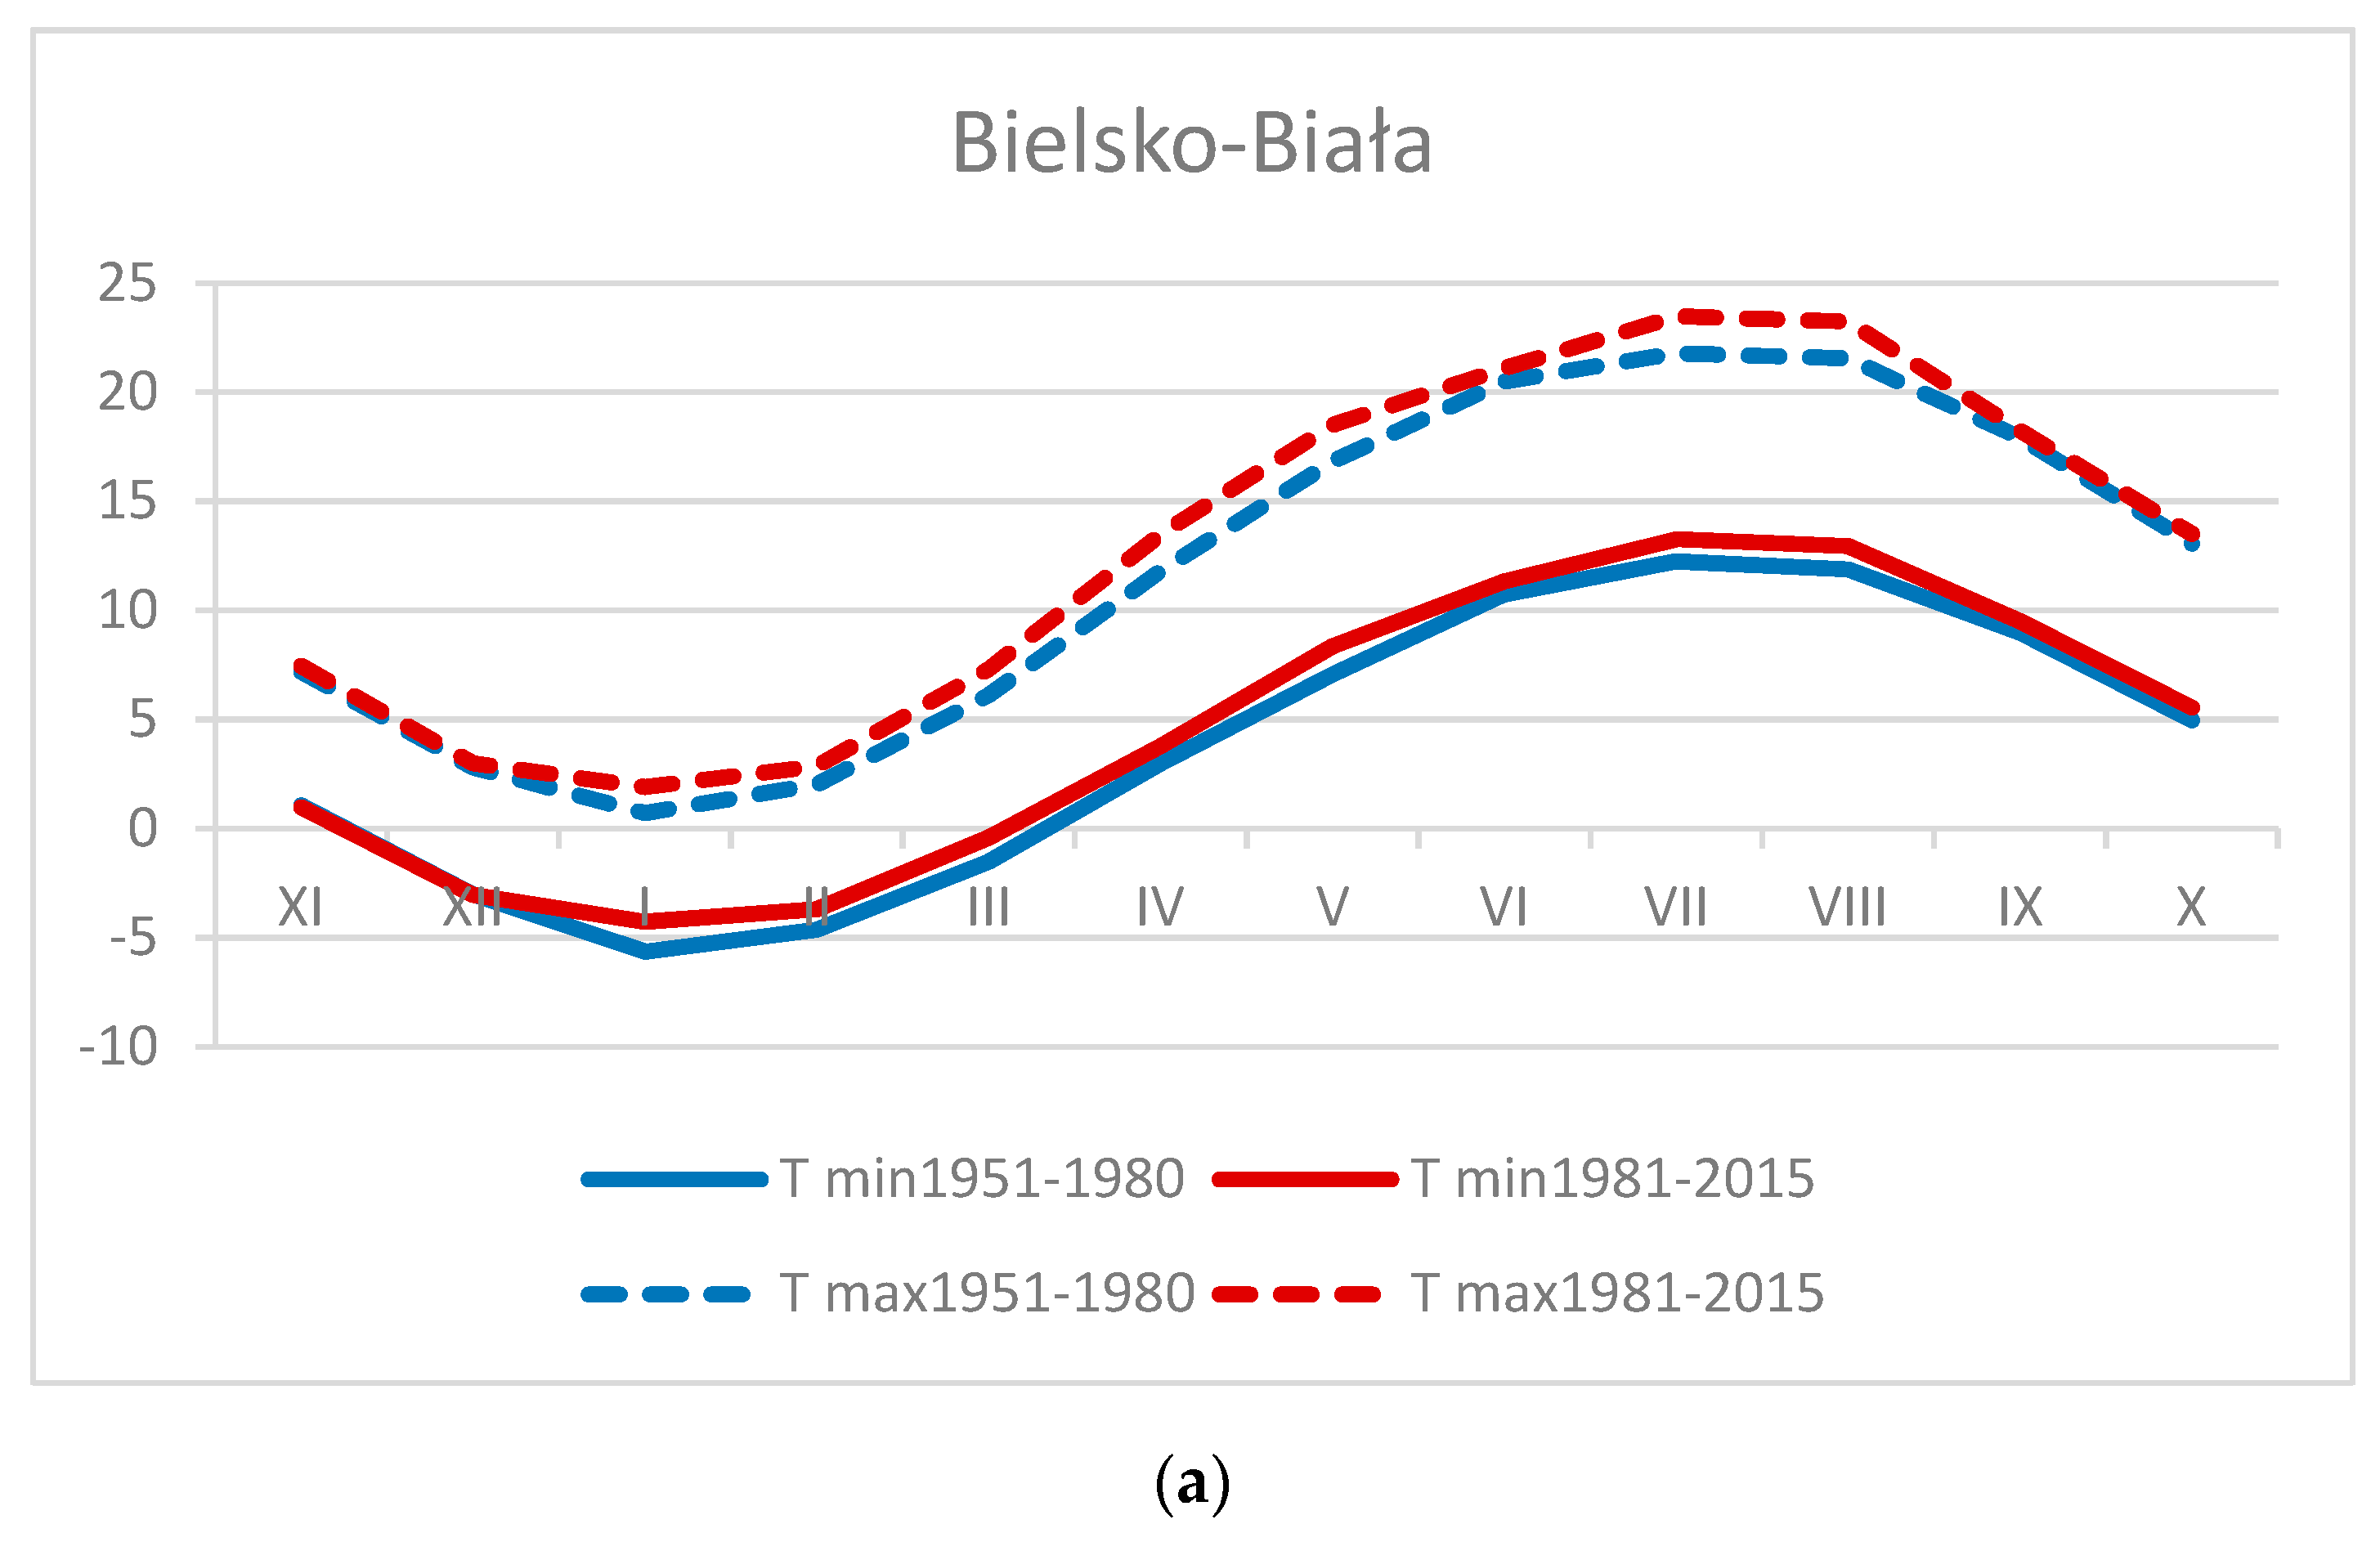
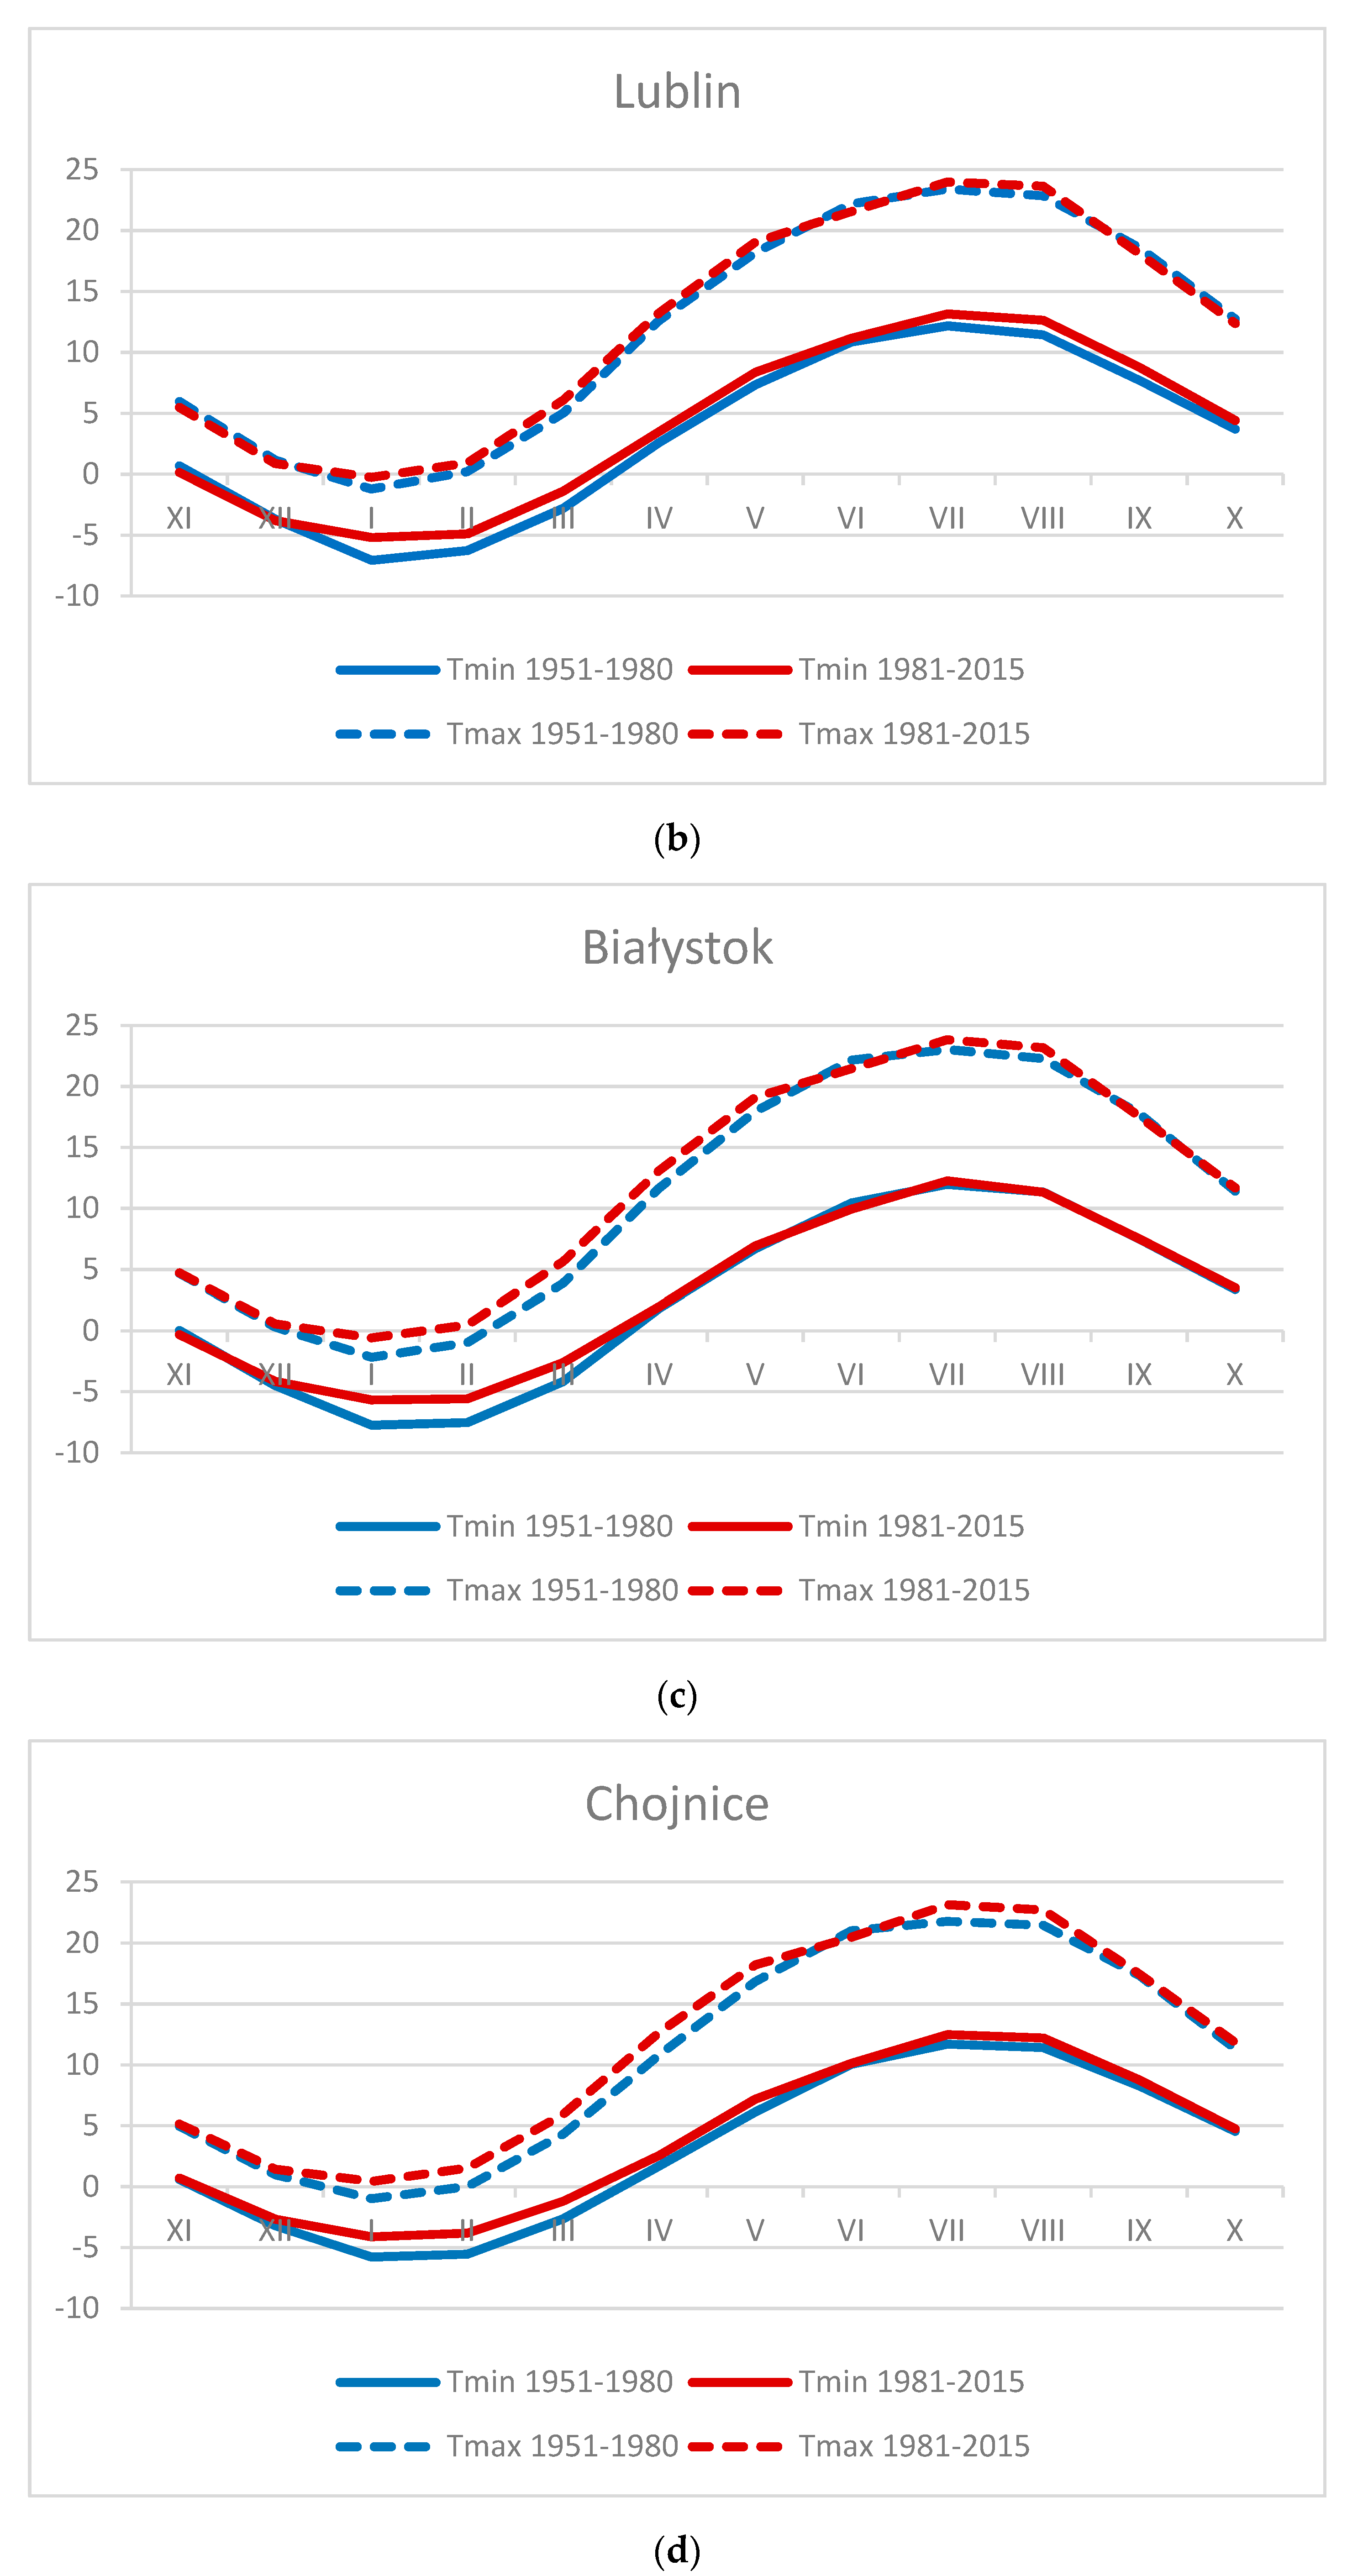
The average monthly minimal (Tmin) and maximal (Tmax) air temperatures over the years 1981–2015 was similar to the years 1951–1980, but with noticeably higher values at all analyzed meteorological stations (Figure 6). This shows that the years 1981–2015 were clearly warmer than the period 1951–1980. It is especially visible in the winter months (January and February). The average minimal and maximal air temperature in the period 1981–2015 is about 2 °C higher than in the period 1951–1980 in the same month.
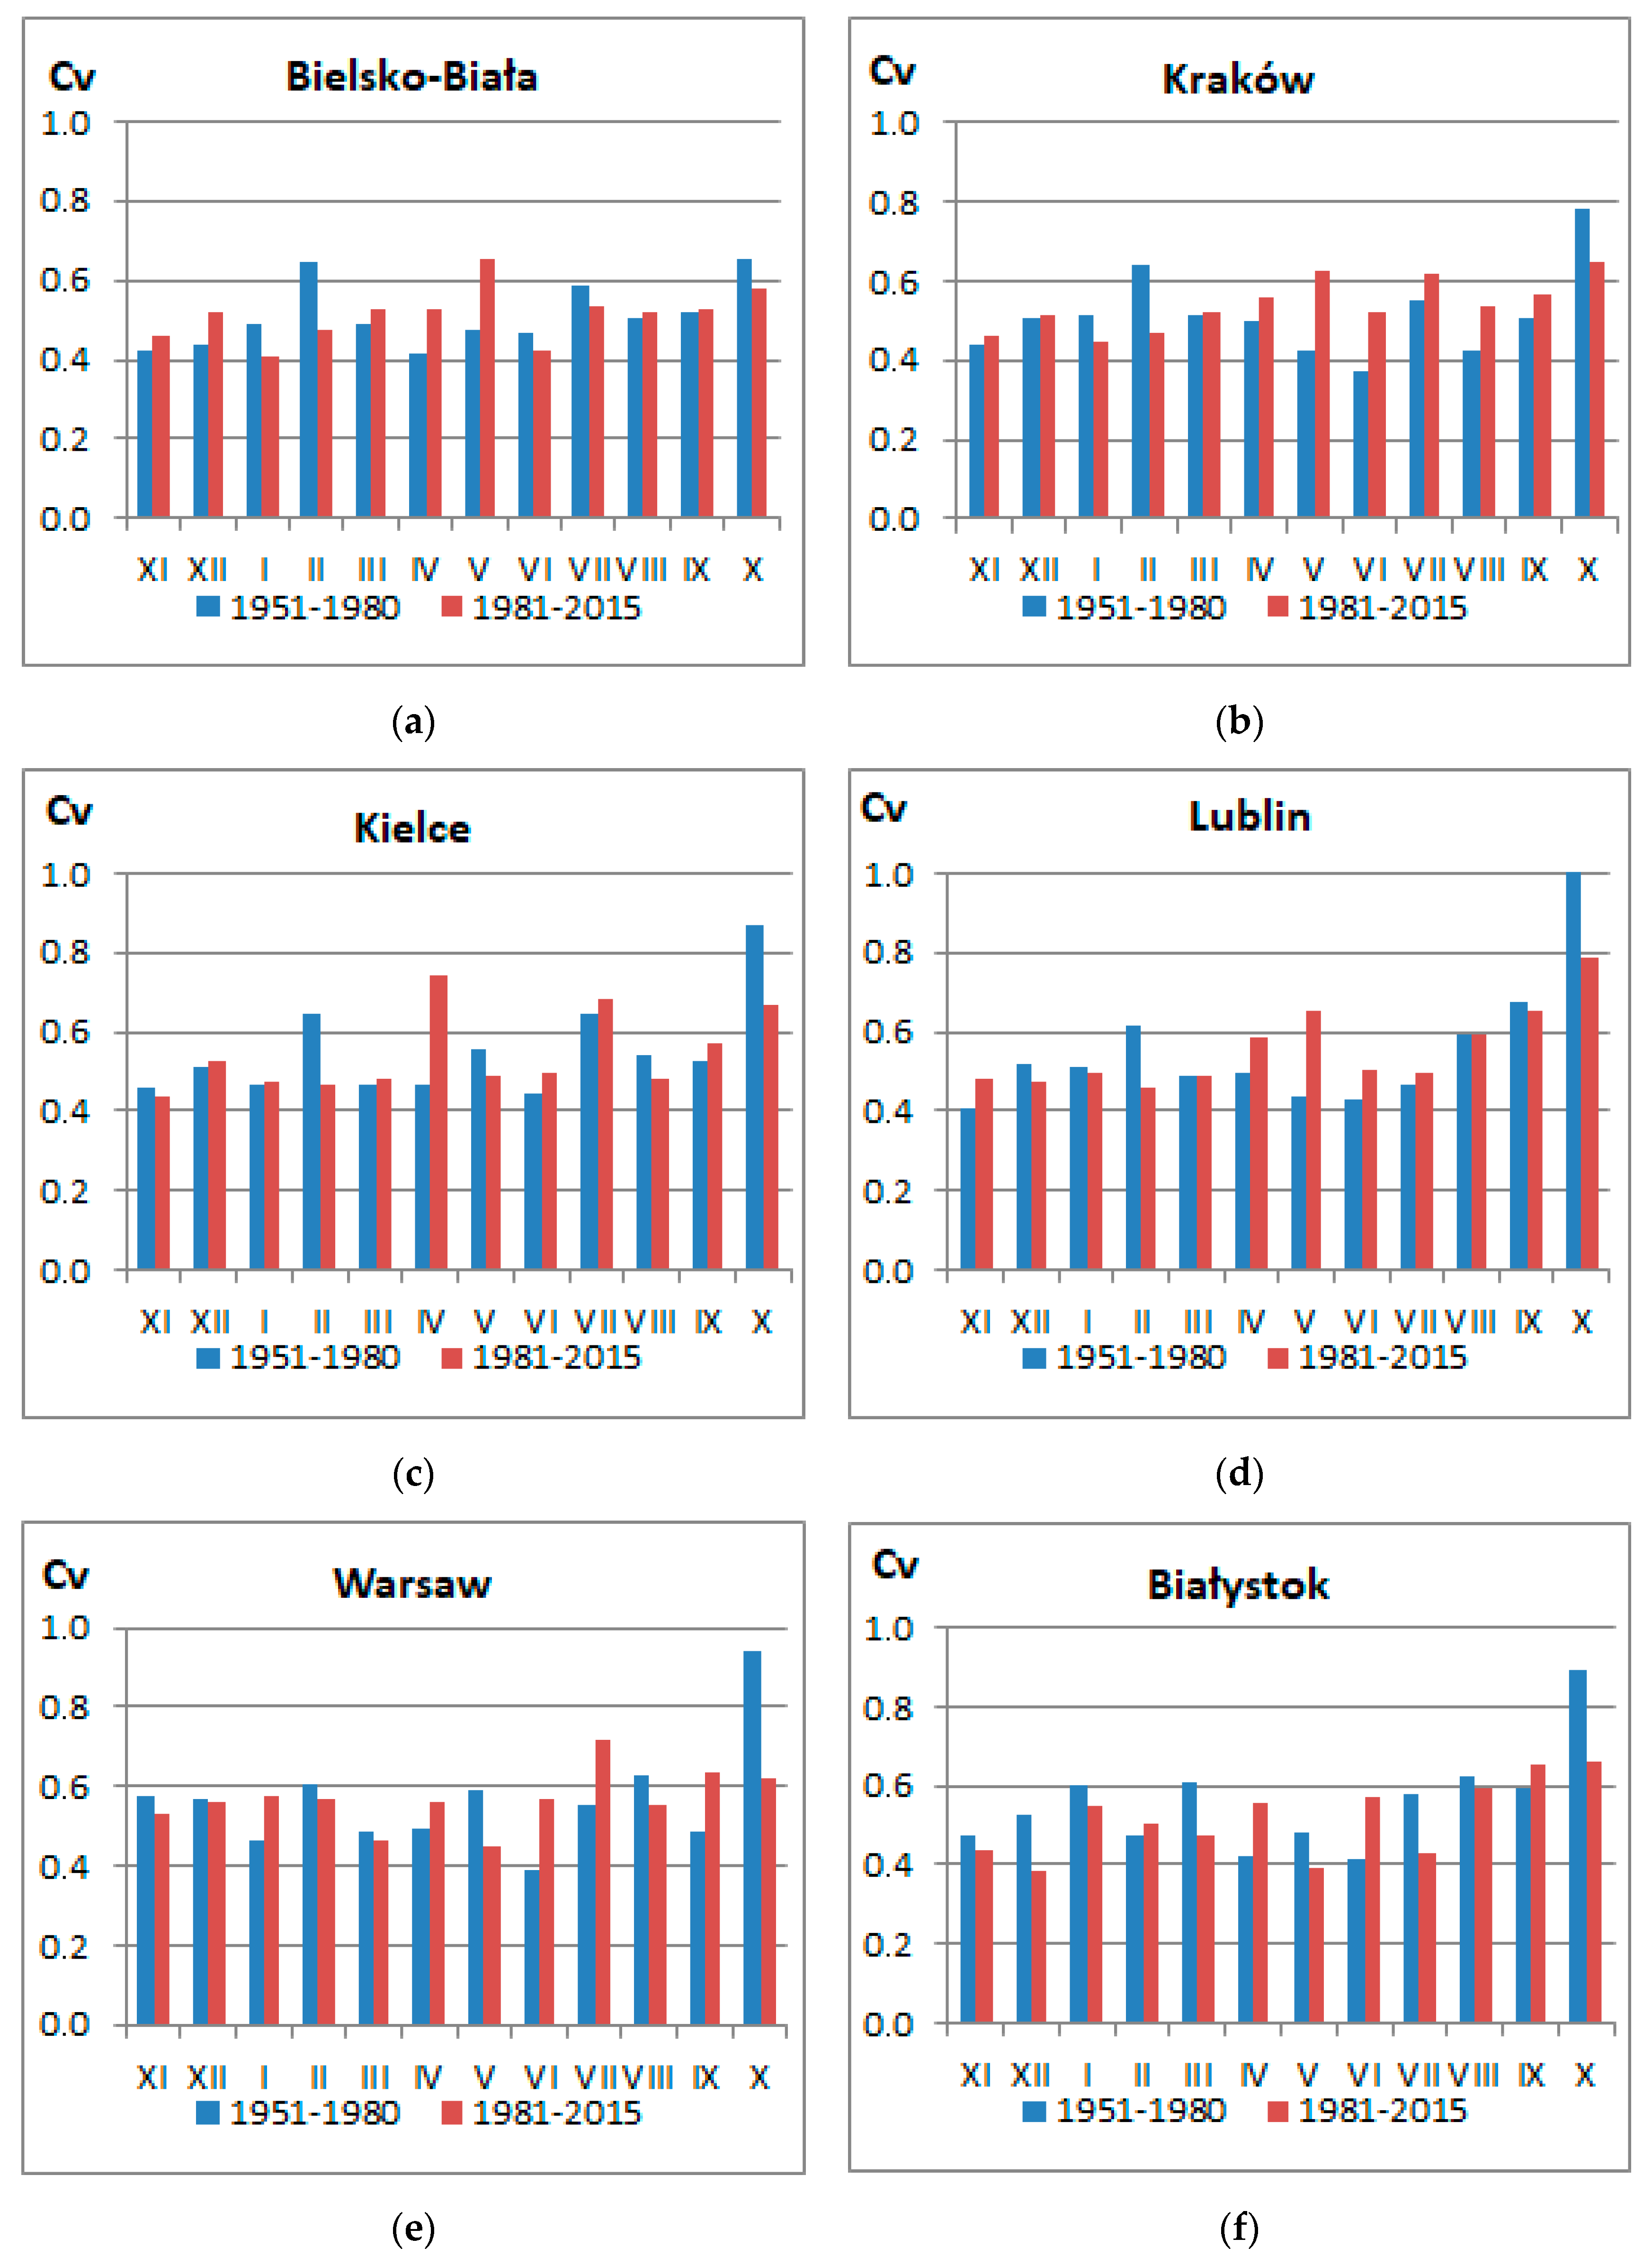
On the basis of the coefficient of variation Cv, the variability of monthly sums of precipitation in the years 1981–2015 was compared to that of the period 1951–1980 (Figure 7). Over the years 1951–1980, precipitation varied most for October and February at most meteorological stations. The exception was Toruń, where the highest variability in precipitation during this period was in June. The diversity in precipitation variability between individual meteorological stations was noted to be greater in the period 1981–2015 than in 1951–1980. In addition to October, high precipitation variability was recorded in May in the southern and eastern parts of the river basin (Bielsko-Biała, Kraków, Lublin), as well as in April (Kielce, Toruń) and July (Warsaw).
Average monthly air temperatures were characterized by high fluctuations in the two main sub-periods. Air temperatures were most variable in December and March in the years 1951–1980, but in December and February in the years 1981–2015. The high air temperature variability in these months shortened the cold periods while extending the warm periods. Increased variability of precipitation can, in combination with high winter air temperatures in particular, increase the risk of flooding.
3.2.3. Analysis of Seasonal Outflows and Their Volatility
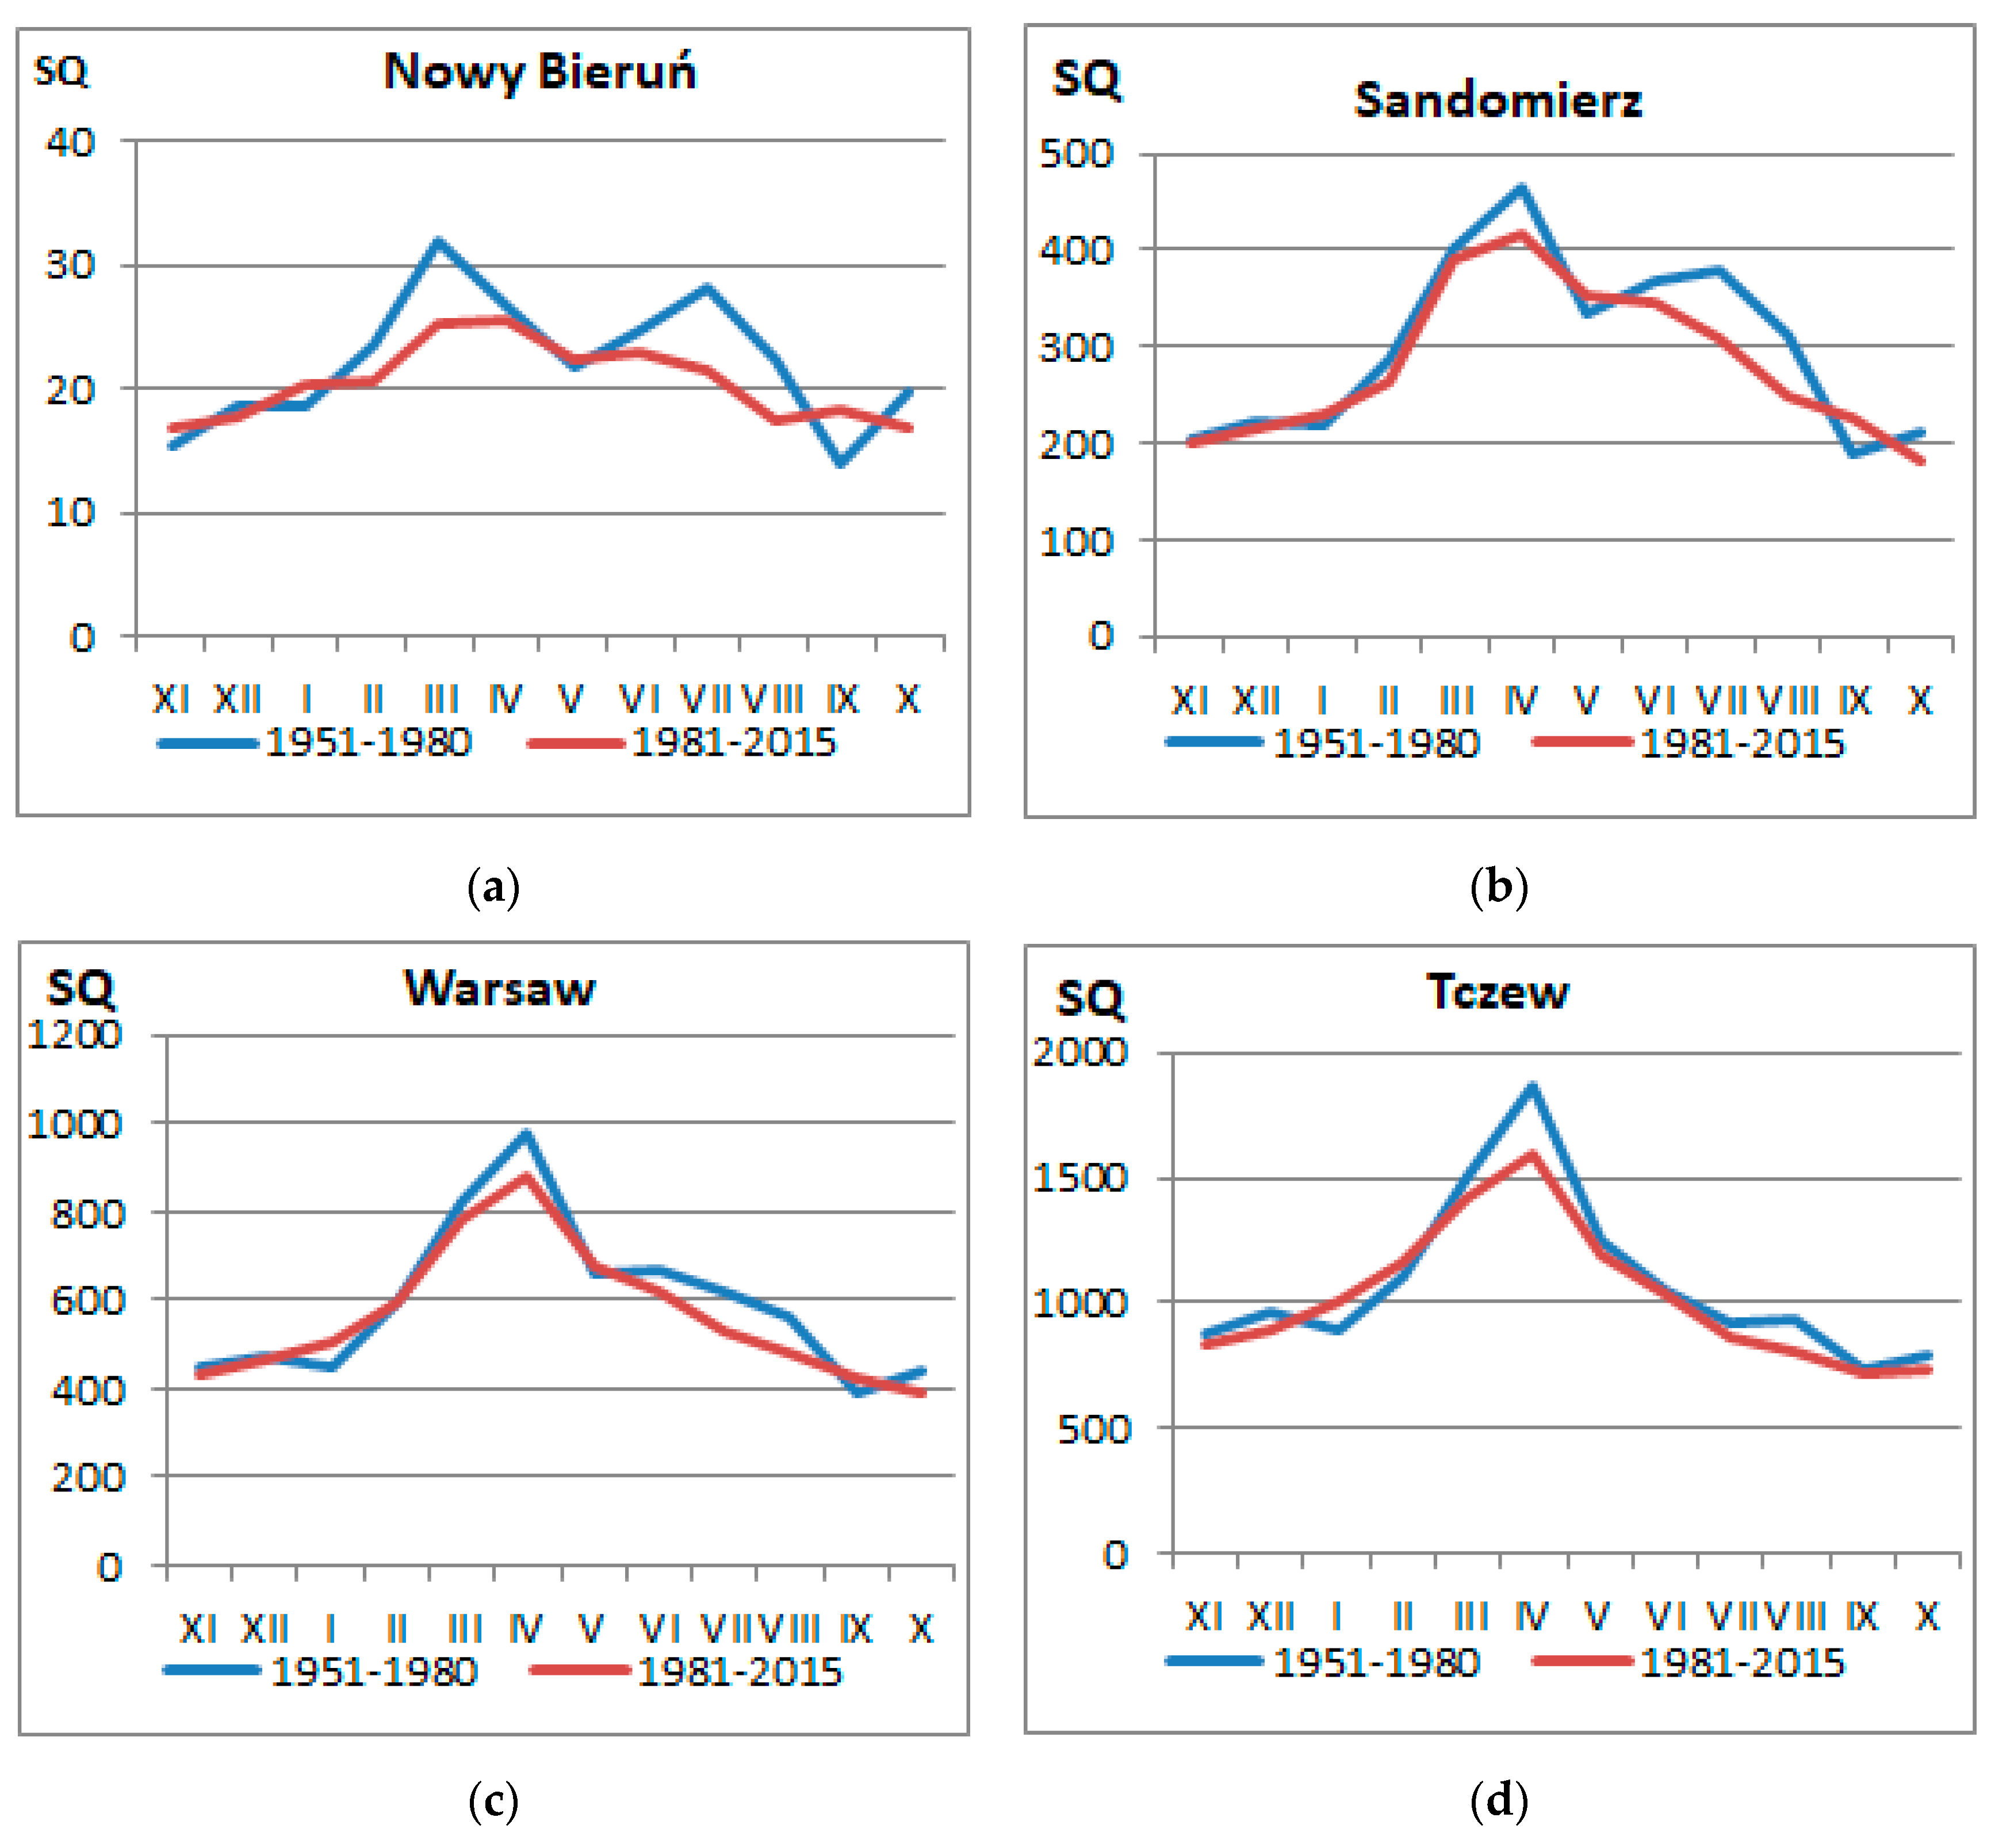
Figure 8 presents comparative analyses of average monthly Vistula outflows in 1981–2015 relative to 1951–1980. Outflows of the Vistula in the period 1951–1980 in the upper reaches of the Vistula (Nowy Bieruń) were highest in March and July, and lowest in September. As the catchment area grows progressively along the river’s course, the highest average monthly outflows shifted to April, while the average monthly outflows in summer decreased. On the lower section of the Vistula, there are practically no high average monthly outflows during the summer. In the years 1981–2015, average monthly outflows had lower amplitudes than in the years 1951–1980. The highest monthly outflows in New Bieruń and Sandomierz shifted to April and June. The lowest average monthly outflows shifted to October at the stations in the upper and middle course of the river. The exception was the minimum average outflow at the hydrological station in Tczew, which was recorded in September. It is noteworthy that the average monthly outflow in January was higher in 1981–2015 than in 1951–1980, which can be associated with air temperatures also being higher during the later period. This changes the form of precipitation from snow to rain and shortens the persistence of snow cover, which increases outflow in the winter half-year and decreases outflows in the summer half-year, since persistence of snow cover and gradual temperature changes result in the steady feeding of surface and ground waters, whereas rainfall and high air temperatures lead to rapid and short-lived supply to rivers.
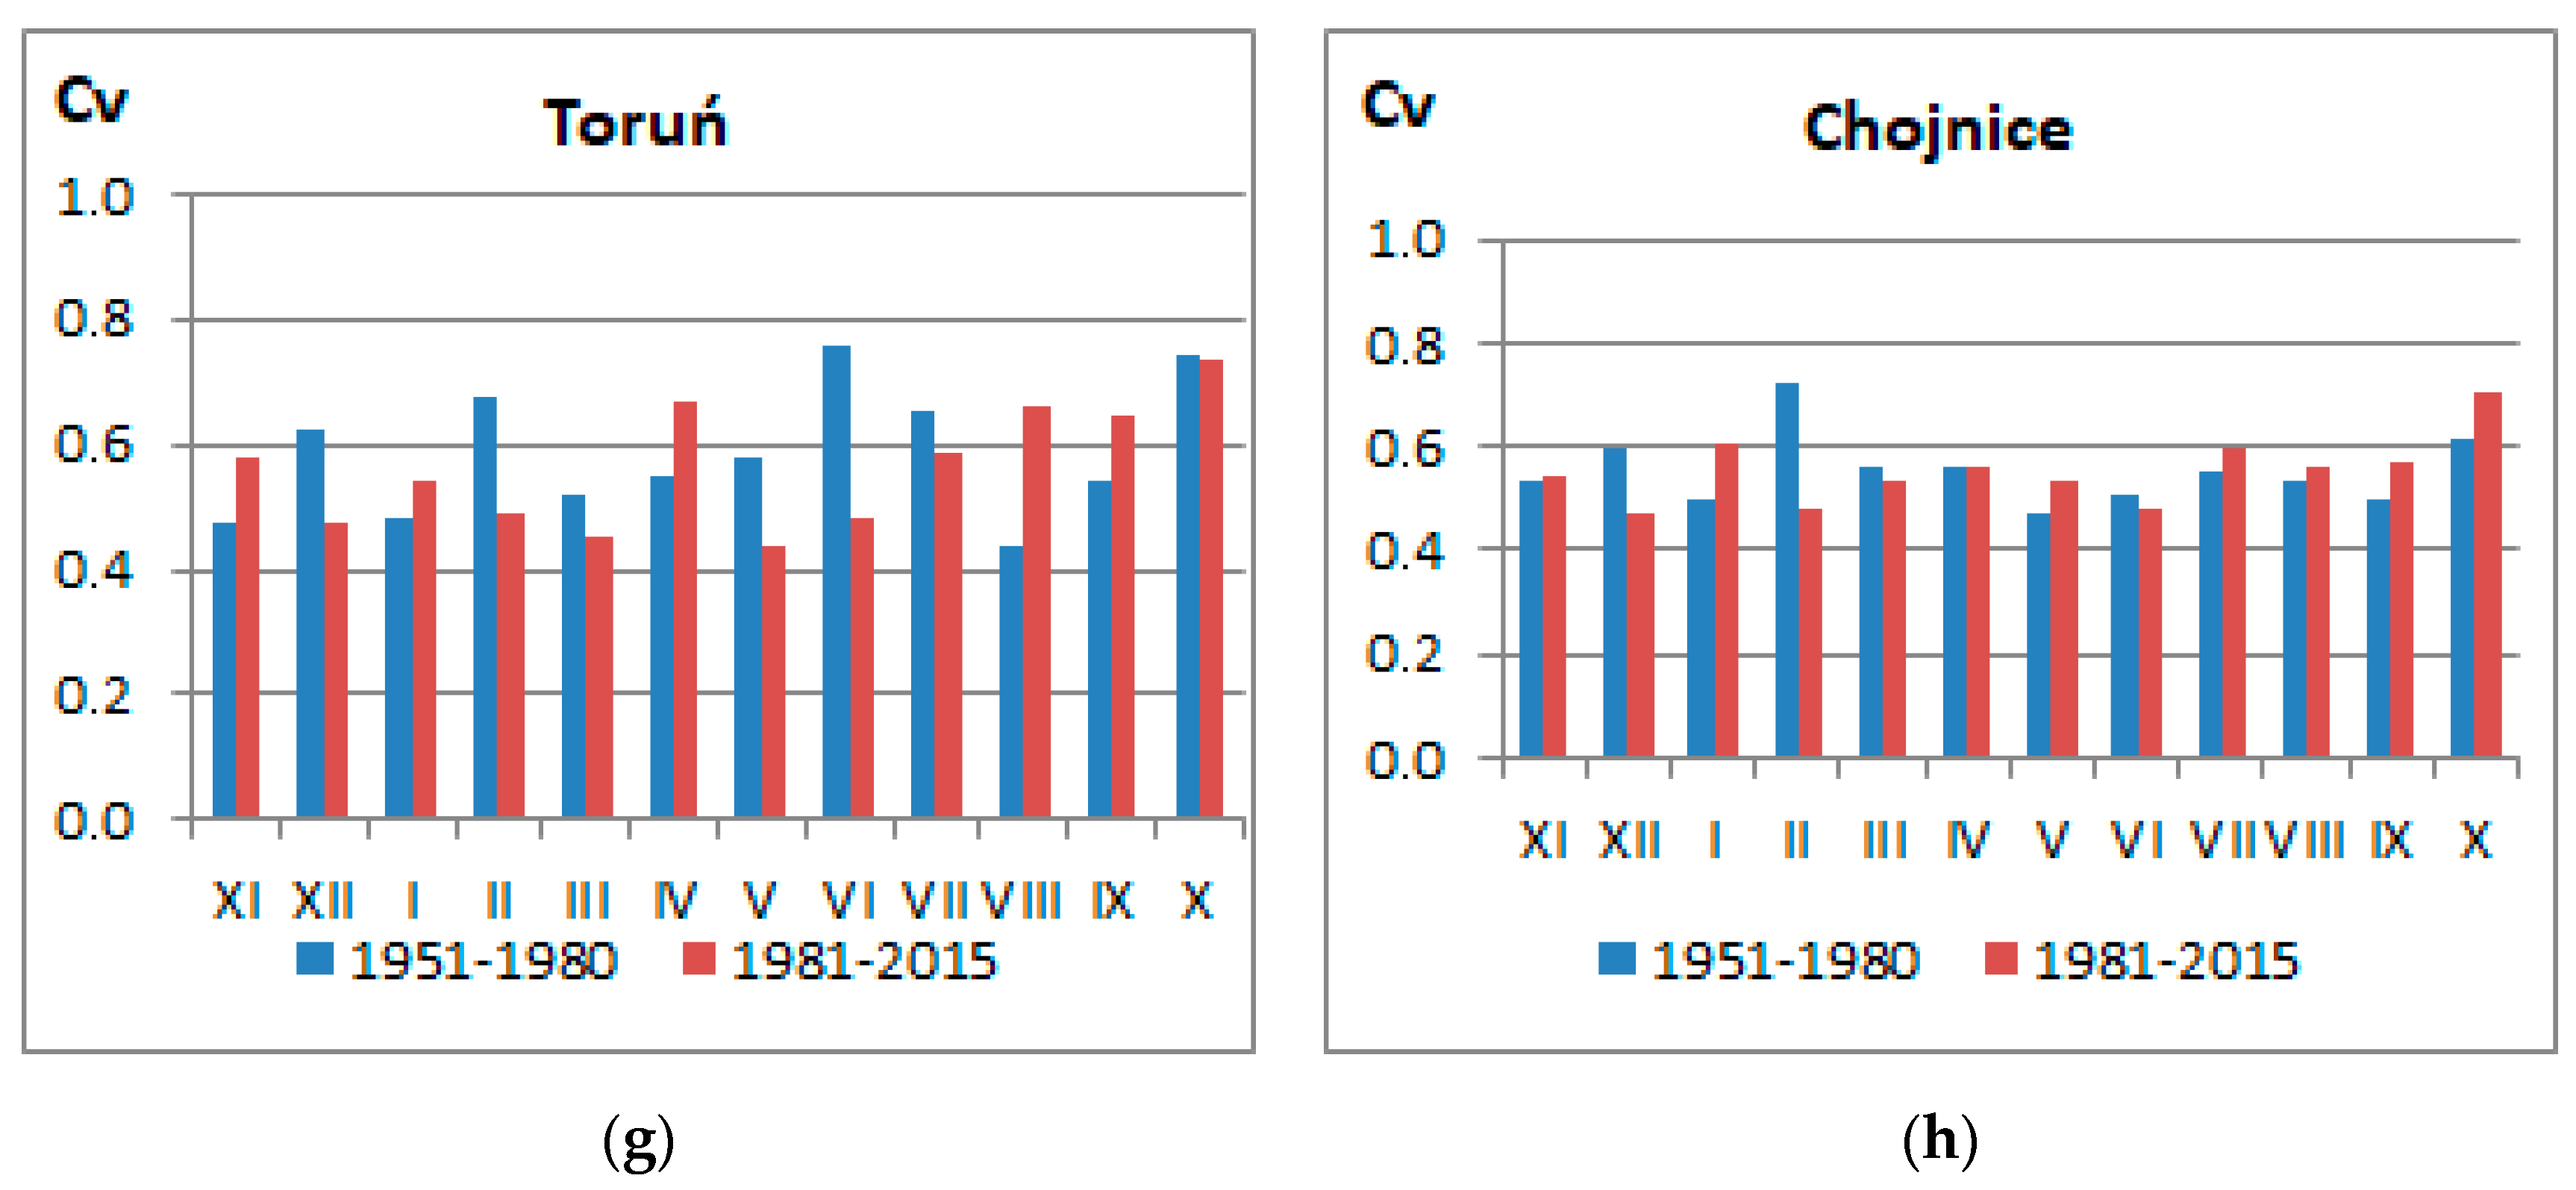
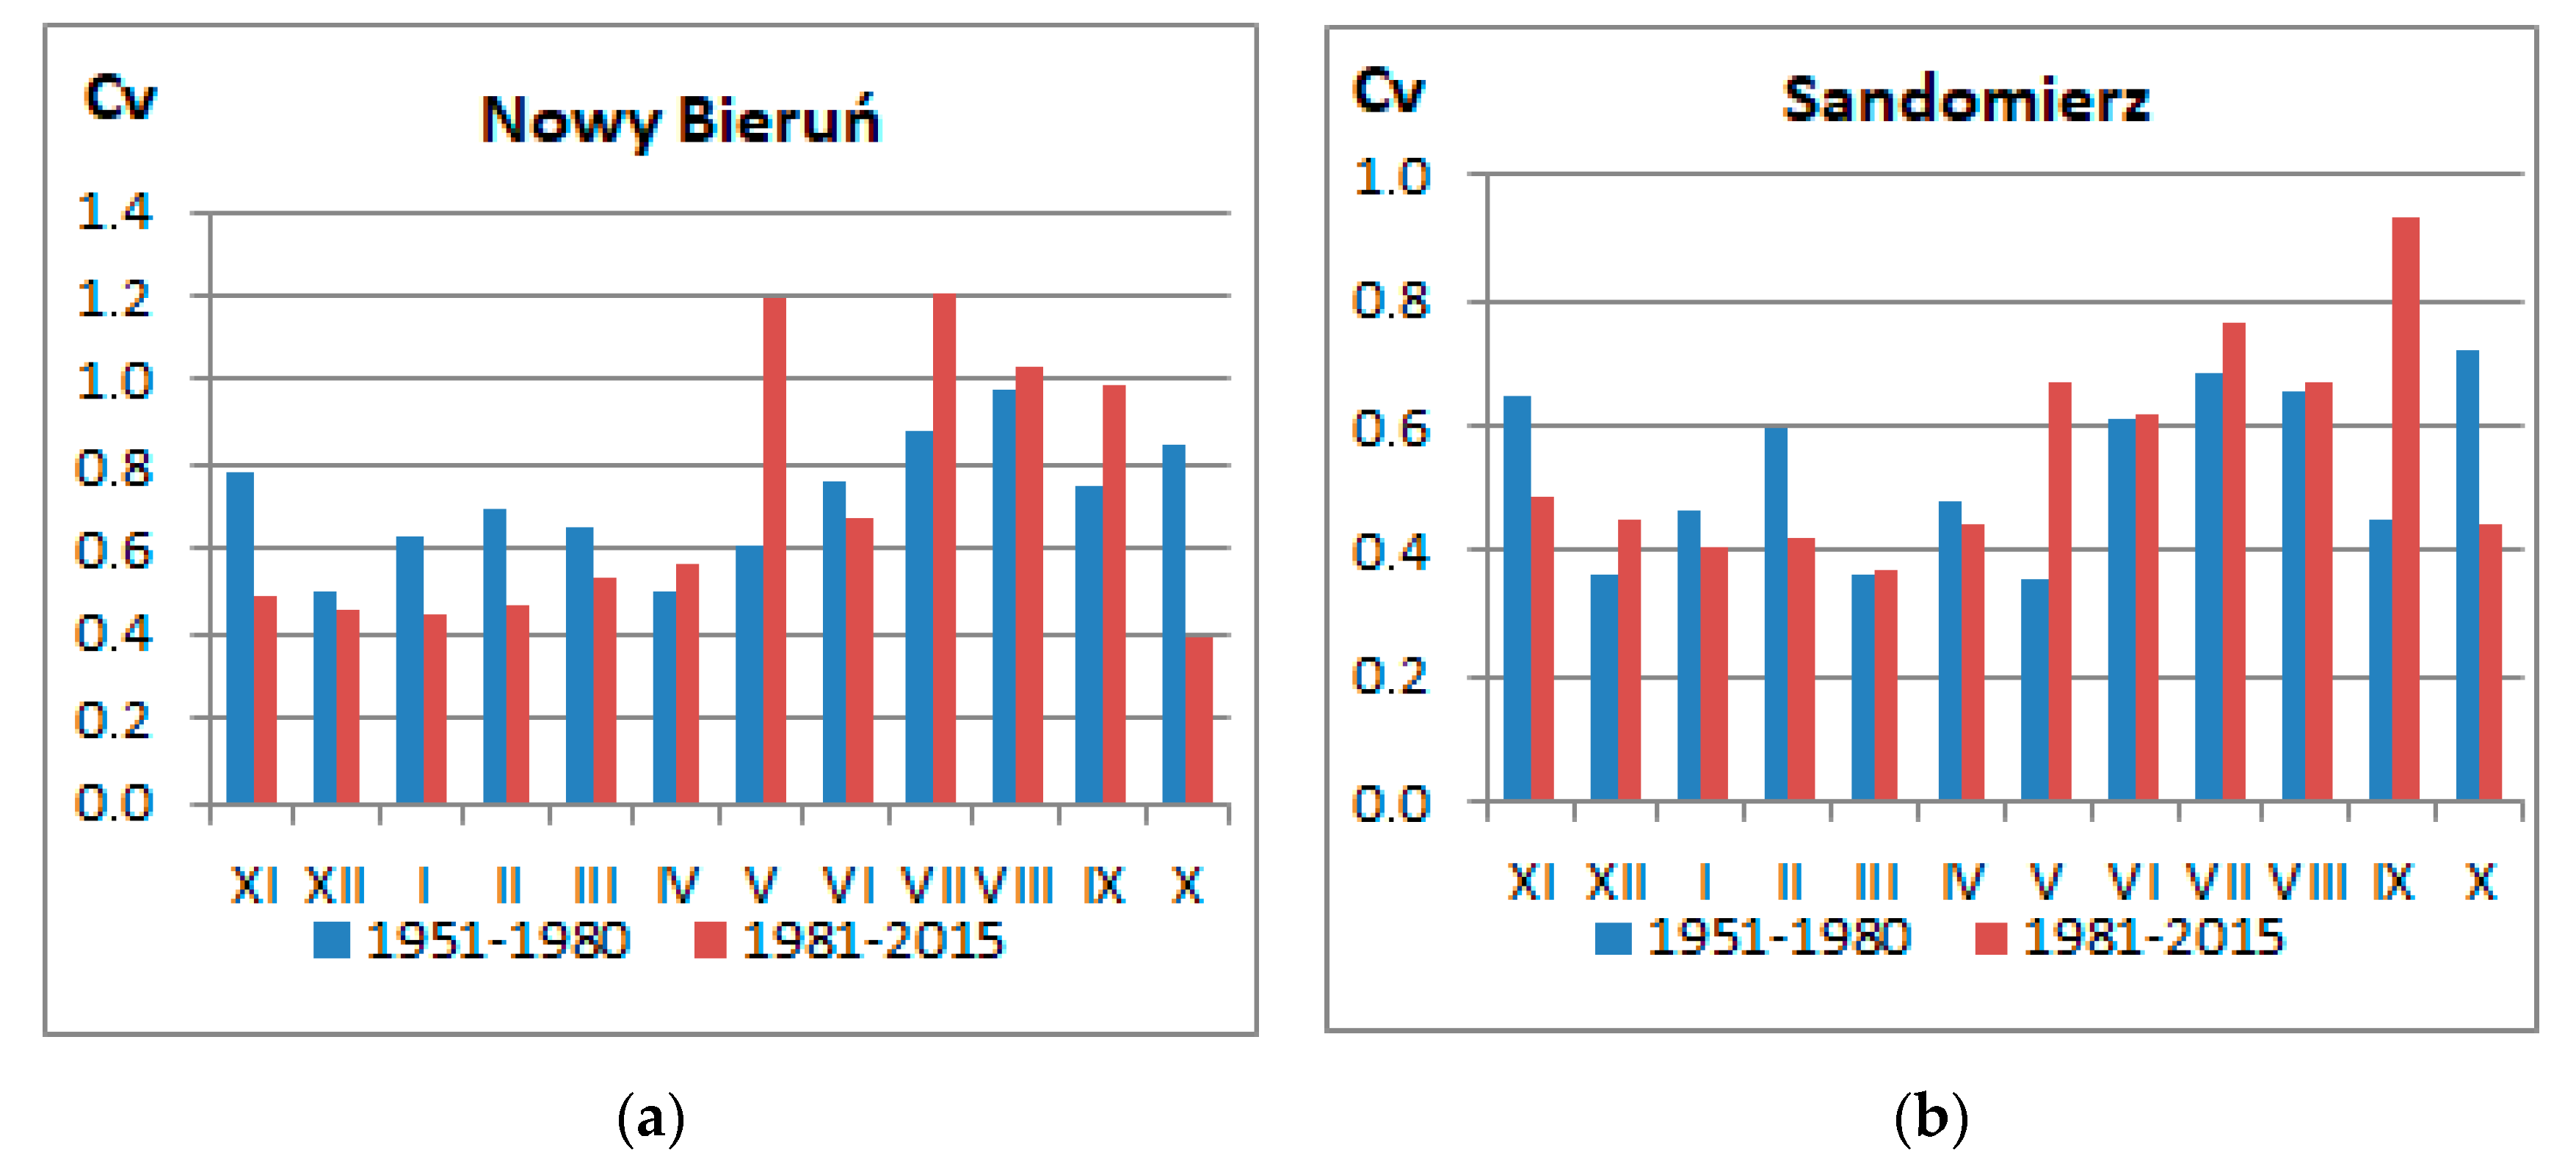
The highest variability of average monthly outflows (Cv) was recorded in the upper reaches of the Vistula, and decreased systematically along the river, reaching its lowest values at the station in Tczew (Figure 9). In the years 1951–1980 variability was greatest in the summer months from June to October and in November, while in the years 1981–2015 it was highest from May to September. This shift results from variability of precipitation in April and May being higher in 1981–2015 than in 1951–1980.
Monthly air temperatures were higher in 1981–2015 than in 1951–1980. Average monthly atmospheric precipitation was lower in the summer months (June–August) and more variable mainly in the upper part of the river basin, which resulted in higher fluctuations in outflows. The variability of outflows in winter months (November–April), which was associated with snowmelt floods, decreased.
4. Discussion
Two meteorological variables significantly influence the hydrological cycle: precipitation and air temperature. In the case of annual average sums of precipitation, there was a slight-to-zero upward trend in precipitation throughout the entire period of 1951–2015 at seven out of nine meteorological stations. In the years 1981–2015, a slight upward trend in precipitation was recorded at all the meteorological stations. During the year, precipitation totals in the summer half-year (May–October) dominated over precipitation in the winter half-year (November–April) in both sub-periods, though they differed in the distribution structure of monthly sums of precipitation. Precipitation in the summer half-year increased in the southern and eastern parts of the Vistula River basin, but fell in the central and northern parts. Studies conducted in Poland indicate that the maximum daily precipitation for the summer half-year increased at many meteorological stations in Poland, and increases are more numerous in the summer half-year than in the winter half-year [79]. A significant increase is also observed in the course of average and extreme air temperatures. The upward trend in air temperature was statistically significant at all analyzed meteorological stations in the years 1951–2015 and 1981–2015, as the statistics show. The results confirm the work of other authors [80,81,82,83] indicating a significant warming in recent years. The authors [84] noted downward trends in a series of annual number of days with frosts, and in the number and durations of cold waves. Analysis revealed symptoms of systematic and persistent warming. The growth rate ranges from 0.18 to 0.34 °C per decade, which indicates that the average annual air temperature in Poland has increased by 1.1–2.2 °C since 1951. Similar values (increases in Tmin of 0.20–0.30 °C per decade and Tmax of 0.26 °C per decade) were found by Kejna et al. [85] in some regions of Poland in the years 1951–2005. research on long-term measurement series of air temperature in Toruń (central Poland) for 1871–2010 showed that winters had shortened significantly (by 7%), and summers had lengthened by 3.8% [86]. It can be assumed that this has also occurred in the rest of Poland. This is demonstrated, for example, by the shift in the highest variability of air temperature from March in the period 1951–1980 to February in the period 1981–2015. Research carried out by the authors [87,88] has confirmed that the frequency of heat waves is increasing in Poland, mainly in July and August (maximum temperature ≥ 25 °C). Climate change in Poland manifests to the greatest extent in the temperature [89] and heat stress records [90]. High air temperatures have often been accompanied by a precipitation deficit, which has increased evaporation and, consequently, adversely affected the volume of water resources. Over the past three decades, meteorological droughts have been reported that have led to hydrological droughts, as exemplified by the 1992, 1994, 2003, 2006, 2008 and 2015 hydrological years [91]. Changes in meteorological conditions will adversely affect the volume of water resources and their temporal and spatial distribution, reducing the accessibility and availability of surface waters. While the average annual outflow remains unchanged or shows a slight decrease over longer research periods (1951–2015), seasonal changes show that there is a significant variability throughout the year. This is especially true of the summer months, when river outflows are usually low. The presented research results concur with seasonal changes in outflows in multi-year periods identified by other authors [39,41,65]. Seasonal variability was particularly evident towards the end of the 20th century and at the beginning of the 21st century. An analysis of the outflow trends from the Bieszczady river basin (in the Eastern Carpathians) in the years 1986–2015 showed significant upward trends in winter outflow and a fall in autumn outflow (in September). There was a clear upward trend in air temperature in the summer and autumn months, while the sum of precipitation did not change [92]. Research conducted in a small catchment of central Poland has shown a significant increase in air temperature in 1981–2015 and a systematic decrease in the average annual and minimum annual outflows [93]. The summer of 2015 was very hot and dry throughout the country, which led to outflow lows being recorded on many Polish rivers. Meanwhile, in the beds of some small watercourses not covered by systematic hydrological observations water outflow disappeared completely [94].
In the contemporary climate, many regions of Poland are frequently suffering from water deficits, especially during the growing season. In the future, this deficit may become even more serious because climate forecasts for Poland predict further warming and further changes in the spatial and seasonal distribution and amount of precipitation [78].
5. Conclusions
The study analyzed long-term trends in river outflows in two time intervals (1951–1980 and 1981–2015) at four selected hydrological stations along the Vistula River. In the full 1951–2015 research period, average annual outflow values fluctuated, which was related to variability in the volume of supply from precipitation. It is worth noting that in the 65 year research period a lack of statistically significant trends in outflow changes predominated. Against the background of the longer period of 1951–2015, the 1951–1980 sub-period stood out and was characterized by a statistically significant increase in annual average outflows. The noticeable downward trend in outflow volumes in the years 1981–2015 as compared to the years 1951–1980 was not statistically significant. This is the result of an increase in air temperature accompanied by a small increase in precipitation, leading to increased evapotranspiration. In the years 1981–2015 and 1951–2015 there was a clear and statistically significant upward trend in average annual air temperature. The annual sum of precipitation showed no significant upward or downward trend in either 1951–1980 or 1981–2015.
The variability in seasonal outflows is greater in the later sub-period than in the earlier period. The outflow of the Vistula River seems to be resilient to changing meteorological conditions. This may be due to the large hydrological inertia of the river, which is associated with the river basin’s large surface and large physiographic diversity. To accurately determine the causes of changes in water resources, changes in the water resources of the Vistula’s tributaries need to be analyzed, in conjunction with an analysis of changes in land use and the volume of water abstracted for economic purposes. If the falling trend in water resources continues in the coming years, preventive measures should be taken, which those managing river basins should consider. The results obtained are a warning signal that such action needs to be taken.
Funding
This research received no external funding.
Conflicts of Interest
The author declares no conflict of interest.
References
- Chattopadhyay, S.; Edwards, D.R. Long-term trend analysis of precipitation and air temperature for Kentucky, United States. Climate 2016, 4, 10. [Google Scholar] [CrossRef]
- Xu, F.; Jia, Y.; Niu, C.; Liu, J.; Hao, C. Changes in annual, seasonal and monthly climate and its impacts on runoff in the Hutuo River Basin, China. Water 2018, 10, 278. [Google Scholar] [CrossRef] [Green Version]
- Zeleňáková, M.; Purcz, P.; Blištan, P.; Vranayová, Z.; Hlavatá, H.; Diaconu, D.C.; Portela, M.M. Trends in precipitation and temperatures in Eastern Slovakia (1962–2014). Water 2018, 10, 727. [Google Scholar] [CrossRef] [Green Version]
- Grinevskiy, S.O.; Pozdniakov, S.P. A retrospective analysis of the impact of climate change on groundwater resources. Mosc. Univ. Geol. Bull. 2017, 72, 200–208. [Google Scholar] [CrossRef]
- Yan, T.; Bai, J.; Yi, A.L.Z.; Shen, Z. SWAT-Simulated Streamflow Responses to Climate Variability and Human Activities in the Miyun Reservoir Basin by Considering Streamflow Components. Sustainability 2018, 10, 941. [Google Scholar] [CrossRef] [Green Version]
- Bormann, H. Runoff regime changes in German rivers due to climate change. Erkunde 2010, 64, 257–279. [Google Scholar] [CrossRef]
- Hanel, M.; Rakovec, O.; Markonis, Y.; Máca, P.; Samaniego, L.; Kyselý, J.; Kumar, R. Revisiting the recent European droughts from a long-term perspective. Sci. Rep. 2018, 8, 9499. [Google Scholar] [CrossRef]
- Barbalić, D.; Kuspilić, N. Trends of indicators of hydrological alterations. Gradevinar 2014, 66, 613–624. [Google Scholar] [CrossRef] [Green Version]
- Croitoru, A.-E.; Minea, I. The impact of climate changes on rivers discharge in Eastern Romania. Theor. Appl. Clim. 2014, 120, 563–573. [Google Scholar] [CrossRef]
- Stonevičius, E.; Valiuškevičius, G.; Rimkus, E.; Kažys, J. Climate induced changes of Lithuanian Rivers runoff in 1960–2009. Water Resour. 2014, 41, 592–603. [Google Scholar] [CrossRef]
- Stagl, J.; Hattermann, F.F. Impacts of climate change on the hydrological regime of the Danube River and its tributaries using an ensemble of climate scenarios. Water 2015, 7, 6139–6172. [Google Scholar] [CrossRef]
- Radevski, I.; Gorin, S.; Taleska, M.; Dimitrovska, O. Natural regime of streamflow trends in Macedonia. Geografie 2018, 123, 1–20. [Google Scholar] [CrossRef] [Green Version]
- Jaagus, J.; Sepp, M.; Tamm, T.; Järvet, A.; Mõisja, K. Trends and regime shifts in climatic conditions and river runoff in Estonia during1951–2015. Earth Syst. Dyn. 2017, 8, 963–976. [Google Scholar] [CrossRef] [Green Version]
- Kubiak-Wójcicka, K. Flow Characteristics of the Vistula River at the Tczew Gauging Station in 1951–2010 Based on Flashiness Index, Proceedings of the 4rd International Conference Water Resources and Wetlands, Tulcea, Romania, 5–9 September 2018; Gastescu, P., Bretcan, P., Eds.; Romanian Limnogeographical Association: Târgovişte, Romania, 2018; pp. 119–129. [Google Scholar]
- Kubiak-Wójcicka, K.; Zelenakova, M.; Purcz, P.; Simovova, D. The use of a Standardized Runoff Indicator for hydrological characterization of selected rivers of Poland and Slovakia. Middle Pomeranian Sci. Soc. Environ. Prot. 2019, 21, 167–183. [Google Scholar]
- Stahl, K.; Hisdal, H.; Hannaford, J.; Tallaksen, L.; Van Lanen, H.; Sauquet, E.; Demuth, S.; Fendekova, M.; Jordar, J. Streamflow trends in Europe: Evidence from a dataset of near-natural catchments. Hydrol. Earth Syst. Sci. 2010, 14, 2367–2382. [Google Scholar] [CrossRef] [Green Version]
- Blöschl, G.; Hall, J.; Viglione, A.; Perdigão, R.A.P.; Parajka, J.; Merz, B.; Lun, D.; Arheimer, B.; Aronica, G.T.; Bilibashi, A.; et al. Changing climate both increases and decreases European river floods. Nature 2019, 573, 108–111. [Google Scholar] [CrossRef]
- Xu, Y.; Wang, S.; Bai, X.; Shu, D.; Tian, Y. Runoff response to climate change and human activities in a typical karst watershed, SW China. PLoS ONE 2018, 13, e0193073. [Google Scholar] [CrossRef]
- The Intergovernmental Panel on Climate Change (IPCC). Climate change 2013: The physical science basis. In Contribution of Working Group I to the 5th Assessment Report of the Intergovernmental Panel on Climate Change; Cambridge University Press: Cambridge, UK; New York, NY, USA, 2013. [Google Scholar]
- Watanabe, T.; Cullmann, J.; Pathak, C.S.; Turunen, M.; Emami, K.; Ghinnasi, G.; Siddiqi, Y. Management of climatic extremeswith focus on floods and droughts in agriculture. Irrig. Drain. 2018, 67, 29–42. [Google Scholar] [CrossRef]
- Lehner, B.; Döll, P.; Alcamo, J.; Henrichs, T.; Kaspar, F. Estimating the impact of global change on flood and drought risks in Europe: A continental integrated analysis. Clim. Chang. 2006, 75, 273–299. [Google Scholar] [CrossRef]
- Guerreiro, S.B.; Dawson, R.J.; Kilsby, C.; Lewis, E.; Ford, A. Future heat-waves, droughts and floods in 571 European cities. Environ. Res. Lett. 2018, 13, 034009. [Google Scholar] [CrossRef]
- Pińskwar, I. Changing floods in Europe. In Changes in Flood Risk in Europe; Kundzewicz, Z.W., Ed.; International Association of Hydrological Sciences; CRC Press: Boca Raton, FL, USA, 2012; pp. 83–96. [Google Scholar]
- Kundzewicz, Z.W. Adapting flood preparedness tools to changing flood risk condition the situation in Poland. Oceanologia 2014, 56, 385–407. [Google Scholar] [CrossRef] [Green Version]
- Hall, J.; Arheimer, B.; Borga, M.; Brázdil, R.; Claps, P.; Kiss, A.; Kjeldsen, T.R.; Kriaučiūnienė, J.; Kundzewicz, Z.W.; Lang, M.; et al. Understanding Flood Regime Changes in Europe: A state of the art assessment. Hydrol. Earth Syst. Sci. 2014, 18, 2735–2772. [Google Scholar] [CrossRef] [Green Version]
- Blöschl, G.; Gaál, L.; Hall, J.; Kiss, A.; Komma, J.; Nester, T.; Parajka, J.; Perdigão, R.A.P.; Plavcová, L.; Rogger, M.; et al. Increasing river floods: Fiction or reality? Wiley Interdiscip. Rev. Water 2015, 2, 329–344. [Google Scholar] [CrossRef] [PubMed]
- Kreibich, H.; Di Baldassarre, G.; Vorogushyn, S.; Aerts, J.C.J.H.; Apel, H.; Aronica, G.T.; Arnbjerg-Nielsen, K.; Bouwer, L.M.; Bubeck, P.; Caloiero, T.; et al. Adaptation to flood risk: Results of international paired flood event studies. Earth’s Future 2017, 5, 953–965. [Google Scholar] [CrossRef] [Green Version]
- Stahl, K.; Kohn, I.; Blauhut, V.; Urquijo, J.; De Stefano, L.; Acácio, V.; Dias, S.; Stagge, J.H.; Tallaksen, L.M.; Kampragou, E.; et al. Impacts of European drought events: Insights from an international database of text-based reports. Nat. Hazards Earth Syst. Sci. 2016, 16, 801–819. [Google Scholar] [CrossRef] [Green Version]
- Spinoni, J.; Naumann, G.; Vogt, J.V. Pan-European seasonal trends and recent changes of drought frequency and severity. Glob. Planet. Chang. 2017, 148, 113–130. [Google Scholar] [CrossRef]
- Hänsel, S.; Ustrnul, Z.; Łupikasza, E.; Skalak, P. Assessing seasonal drought variations and trends over Central Europe. Adv. Water Resour. 2019, 127, 53–75. [Google Scholar] [CrossRef]
- Szwed, M.; Karg, G.; Pińskwar, I.; Radziejewski, M.; Graczyk, D.; Kędziora, A.; Kundzewicz, Z.W. Climate change and its effect on agriculture, water resources and human health sectors in Poland. Nat. Hazards Earth Syst. Sci. 2010, 10, 1725–1737. [Google Scholar] [CrossRef]
- Kundzewicz, Z.W.; Matczak, P. Climate change regional review: Poland. Wires Clim. Chang. 2012, 3, 297–311. [Google Scholar] [CrossRef]
- Gutry-Korycka, M.; Sadurski, A.; Kundzewicz, Z.W.; Pociask-Karteczka, J.; Skrzypczyk, L. Water resources and their use. Nauka 2014, 1, 77–98. (In Polish) [Google Scholar]
- Kubiak-Wójcicka, K.; Kielik, M. Water and wastewater management condition in Poland. In Water Resources in Poland. Part II. Quality; Zeleňáková, M., Kubiak-Wójcicka, K., Negm, A., Eds.; Springer International Publishing: Cham, Switzerland, 2020; in press. [Google Scholar]
- Tomaszewski, E. Low-flow discharge deficits assessment, applying constant and variable low-flow threshold levels, as illustrated with the example of selected catchments in the Vistula river basin. Acta Sci. Pol. Form. Circumiectus 2018, 17, 205–216. [Google Scholar] [CrossRef]
- Dynowska, I. Types of River Regimes in Poland; Zeszyty Naukowe UJ, CCLXVIII, Prace Geogr.; UJ: Kraków, Poland, 1971; Volume 28, p. 150. (In Polish) [Google Scholar]
- Gutry-Korycka, M.; Rotnicka, J. The hydrological regime of rivers in the light of scenarios of global climatic change. Geogr. Pol. 1998, 71, 61–78. [Google Scholar]
- Tomaszewski, T. Multiannual and Seasonal Dynamics of Low-Flows in Rivers of Central Poland; Wydawnictwo Uniwersytetu Łódzkiego: Łódź, Poland, 2012. (In Polish) [Google Scholar]
- Jokiel, P.; Stanisławczyk, B. Long-term changes and variability in the seasonality of river discharge for selected Polish rivers. Czas. Geogr. 2016, 144, 9–133. (In Polish) [Google Scholar] [CrossRef]
- Stanisławczyk, B. Multiannual dynamics of characteristic runoff from selected Polish river catchments in the light of changes of the NAO index. Przegląd Geogr. 2017, 89, 413–428. [Google Scholar] [CrossRef] [Green Version]
- Wrzesiński, D.; Sobkowiak, L. Detection of changes in flow regime of rivers in Poland. J. Hydrol. Hydromech. 2018, 66, 55–64. [Google Scholar] [CrossRef] [Green Version]
- Banasik, K.; Hejduk, L. Long-term changes in runoff from a small agricultural catchment. Soil Water Res. 2012, 7, 64–72. [Google Scholar] [CrossRef] [Green Version]
- Somorowska, U.; Piętka, I. Streamflow changes in mesoscale lowland catchment under future climate conditions. Pap. Glob. Chang. 2012, 19, 53–65. [Google Scholar] [CrossRef]
- Somorowska, U. Climate-driven changes to streamflow patterns in a groundwater-dominated catchment. Acta Geophys. 2017, 65, 789–798. [Google Scholar] [CrossRef]
- Kubiak-Wójcicka, K.; Kornaś, M. Impact of hydrotechnical structures on hydrological regime of the Gwda and Drawa rivers. Quaest. Geogr. 2015, 34, 99–110. [Google Scholar] [CrossRef] [Green Version]
- Szcześniak, M.; Piniewski, M. Improvement of hydrological simulations by applying daily precipitation interpolation schemes in meso-scale catchments. Water 2015, 7, 747–779. [Google Scholar] [CrossRef]
- Wałęga, A.; Młyński, D.; Bogdał, A.; Kowalik, T. Analysis of the course and frequency of high water stages in selected catchments of the Upper Vistula Basin in the South of Poland. Water 2016, 8, 394. [Google Scholar] [CrossRef]
- Meresa, H.K.; Osuch, M.; Romanowicz, R. Hydro-meteorological drought projections into the 21-st Century for selected Polish Catchments. Water 2016, 8, 206. [Google Scholar] [CrossRef] [Green Version]
- Górnik, M.; Holko, L.; Pociask-Karteczka, J.; Bičárová, S. Variability of precipitation and runoff in the entire High Tatra Mountains in the period 1961–2010. Pr. Geogr. 2017, 151, 53–74. [Google Scholar] [CrossRef] [Green Version]
- Jokiel, P.; Tomalski, P. Seasonality of outflow in selected Carpathian catchments. Przegląd Geogr. 2017, 89, 29–44. (In Polish) [Google Scholar] [CrossRef] [Green Version]
- Piniewski, M.; Marcinkowski, P.; Kundzewicz, Z.W. Trend detection in river flow indices in Poland. Acta Geophys. 2018, 66, 347–360. [Google Scholar] [CrossRef] [Green Version]
- Kędra, M. Altered precipitation and flow patterns in the Dunajec River Basin. Water 2017, 9, 22. [Google Scholar] [CrossRef] [Green Version]
- Wrzesiński, D. Use of entropy in the assessment of uncertainty of river runoff regime in Poland. Acta Geophys. 2016, 64, 1825–1839. [Google Scholar] [CrossRef] [Green Version]
- Baran-Gurgul, K.; Bodziony, M.; Kołodziejczyk, K. Variability of the runoff coefficient for selected catchments in the upper Vistula river catchment. Acta Sci. Pol. Form. Circumiectus 2018, 18, 13–22. [Google Scholar] [CrossRef]
- Wrzesiński, D. Regional differences in the influence of the North Atlantic Oscillation on seasonal river runoff in Poland. Quaest. Geogr. 2011, 30, 127–136. [Google Scholar] [CrossRef] [Green Version]
- Ilnicki, P.; Farat, R.; Górecki, K.; Lewandowski, P. Long-term air temperature and precipitation variability in the Warta River catchment area. J. Water Land Dev. 2015, 27, 3–13. [Google Scholar] [CrossRef] [Green Version]
- Piniewski, M.; Szcześniak, M.; Huang, S.; Kundzewicz, Z.W. Projections of runoff in the Vistula and the Odra river basins with the help of the SWAT model. Hydrol. Res. 2018, 49, 2. [Google Scholar] [CrossRef]
- Central Statistical Office. Available online: https://bdl.stat.gov.pl/BDL/start (accessed on 5 June 2020).
- Kubiak-Wójcicka, K. Long-term variability of runoff of Vistula River in 1951–2015. In Proceedings of the “Air and Water—Components of the Environment” Conference Proceedings, Cluj-Napoca, Romania, 22–24 March 2019; pp. 109–120. [Google Scholar] [CrossRef]
- Habel, M. Dynamics of the Vistula River Channel Deformations Downstream of the Włocławek Reservoir; Kazimierz Wielki University Press: Bydgoszcz, Poland, 2013; p. 138. (In Polish) [Google Scholar]
- Gierszewski, P.J.; Habel, M.; Szmańda, J.; Luc, M. Evaluating effects of dam operation onflow regimes and riverbed adaptation to those changes. Sci. Total Environ. 2020, 710, 136202. [Google Scholar] [CrossRef] [PubMed]
- Kubiak-Wójcicka, K. Assessment of Water Resources in Poland. In Water Resources Management in Poland. Part II: Quality; Zeleňáková, M., Kubiak-Wójcicka, K., Negm, A., Eds.; Springer International Publishing: Cham, Switzerland, 2020; in press. [Google Scholar]
- Maciejewski, M.; Ostojski, M.S.; Walczykiewicz, T. (Eds.) The Vistula River Basin. Monograph of the Flood May–June 2010; IMGW-PIB: Warszawa, Poland, 2011. (In Polish) [Google Scholar]
- Bąk, B.; Kubiak-Wójcicka, K. Impact of meteorological drought on hydrological drought in Toruń (central Poland) in the period of 1971–2015. J. Water Land Dev. 2017, 32, 3–12. [Google Scholar] [CrossRef] [Green Version]
- Kubiak-Wójcicka, K.; Bąk, B. Monitoring of meteorological and hydrological droughts in the Vistula basin (Poland). Environ. Monit. Assess. 2018, 190, 691. [Google Scholar] [CrossRef] [PubMed] [Green Version]
- Acquaotta, F.; Fratianni, S.; Venema, V. Assessment of parallel precipitation measurements networks in Piedmont, Italy. Int. J. Climatol. 2016, 36, 3963–3974. [Google Scholar] [CrossRef] [Green Version]
- Fortin, G.; Acquaotta, F.; Fratianni, S. The evolution of temperature extremes in the Gaspé Peninsula, Quebec, Canada (1974–2013). Theor. Appl. Clim. 2017, 130, 163–172. [Google Scholar] [CrossRef]
- Baronetti, A.; González-Hidalgo, J.C.; Vicente-Serrano, S.M.; Acquaotta, F.; Fratianni, S. A weekly spatio-temporal distribution of drought events over the Po Plain (North Italy) in the last five decades. Int. J. Climatol. 2020, 40, 4463–4476. [Google Scholar] [CrossRef]
- Kruskal, W.H.; Wallis, W.A. Use of ranks in one-criterion variance analysis. J. Am. Stat. Assoc. 1952, 47, 583–621. [Google Scholar] [CrossRef]
- Mann, H.B. Non-parametric tests against trend. Econometrica 1945, 13, 245–259. [Google Scholar] [CrossRef]
- Kendall, M.G. Rank Correlation Measures; Charles Griffin: London, UK, 1975. [Google Scholar]
- Theil, H. A rank-invariant method of linear and poly-nomial regression analysis. Ned. Acad. Wet. 1950, 53, 386–392, 521–525, 1397–1412. [Google Scholar]
- Sen, P.K. Estimates of the regression coefficient based on Kendall’s tau. J. Am. Stat. Assoc. 1968, 63, 1379–1389. [Google Scholar] [CrossRef]
- Hannaford, J.; Buys, G.; Stahl, K.; Tallaksen, M. The influence of decadal-scale variability on trends in long European streamflow records. Hydrol. Earth Syst. Sci. 2013, 17, 2717–2733. [Google Scholar] [CrossRef] [Green Version]
- Ruiz-Villanueva, V.; Stoffel, M.; Wyżga, B.; Kundzewicz, Z.W.; Czajka, B.; Niedźwiedź, T. Decadal variability of floods in the northern foreland of the Tatra Mountains. Reg. Environ. Chang. 2016, 16, 603–615. [Google Scholar] [CrossRef]
- Górnik, M. Wieloletnie zmiany przepływów Wisły i Bugu (1951–2015) (Long term (1951–2015) changes in runoff along Poland’s Rivers Vistula and Bug. Przegląd Geogr. 2018, 90, 479–494. [Google Scholar] [CrossRef] [Green Version]
- Czarnecka, M.; Nidzgorska-Lencewicz, J. Wieloletnia zmienność sezonowych opadów w Polsce (Multiannual variability of seasonal precipitation in Poland). Water-Environ.-Rural Areas 2012, 12, 45–60. [Google Scholar]
- Szwed, M. Variability of precipitation in Poland under climate change. Theor. Appl. Clim. 2018, 135, 1003–1015. [Google Scholar] [CrossRef] [Green Version]
- Pińskwar, I.; Choryński, A.; Graczyk, D.; Kundzewicz, Z.W. Observed changes in extreme precipitation in Poland: 1991–2015 versus 1961–1990. Theor. Appl. Clim. 2019, 135, 773–787. [Google Scholar] [CrossRef] [Green Version]
- Żmudzka, E. Contemporary changes of climate of Poland. Acta Agrophysica 2009, 13, 555–568. (In Polish) [Google Scholar]
- Michalska, B. Tendencies of air temperature changes in Poland. Pr. I Stud. Geogr. 2011, 47, 67–75. (In Polish) [Google Scholar]
- Skowera, B.; Kopcińska, J.; Kopeć, B. Changes in thermal and precipitation conditions in Poland in 1971–2010. Ann. Wars. Univ. Life Sci.-SGGW. Land Reclam. 2014, 46, 153–162. [Google Scholar] [CrossRef]
- Ziernicka-Wojtaszek, A.; Krużel, J. The diversification of air temperature trends in Poland (1981–2010). Pol. J. Environ. Stud. 2016, 25, 2205–2209. [Google Scholar] [CrossRef]
- Owczarek, M.; Filipiak, J. Contemporary changes of thermal conditions in Poland, 1951–2015. Bull. Geogr. Phys. Geogr. Ser. 2016, 10, 31–50. [Google Scholar] [CrossRef] [Green Version]
- Kejna, M.; Araźny, A.; Maszewski, R.; Przybylak, R.; Uscka-Kowalkowska, J.; Vizi, Z. Daily minimum and maximum temperature in Poland in years 1951–2005. Bull. Geogr. Phys. Geogr. Ser. 2009, 2, 35–58. [Google Scholar] [CrossRef] [Green Version]
- Pospieszyńska, A.; Przybylak, R. Air temperature changes in Toruń (central Poland) from 1871 to 2010. Theor. Appl. Clim. 2019, 135, 707–724. [Google Scholar] [CrossRef] [Green Version]
- Wibig, J. Heat waves in Poland in the period 1951–2015: Trends, patterns and driving factors. Meteorol. Hydrol. Water Manag. 2018, 6, 37–45. [Google Scholar] [CrossRef]
- Wypych, A.; Sulikowska, A.; Ustrnul, Z.; Czekierda, D. Temporal Variability of Summer Temperature Extremes in Poland. Atmosphere 2017, 8, 51. [Google Scholar] [CrossRef] [Green Version]
- Graczyk, Z.; Pińskwar, I.; Kundzewicz, Z.W.; Hov, Ø.; Førland, E.J.; Szwed, M.; Choryński, A. The heat goes on changes in indices of hot extremes in Poland. Theor. Appl. Climatol. 2017, 129, 459–471. [Google Scholar] [CrossRef] [Green Version]
- Tomczyk, A.M.; Owczarek, M. Occurrence of strong and very strong heat stress in Poland and its circulation conditions. Theor. Appl. Clim. 2020, 139, 893–905. [Google Scholar] [CrossRef] [Green Version]
- Somorowska, U. Changes in Drought Conditions in Poland over the Past 60 Years Evaluated by the Standardized Precipitation-Evapotranspiration Index. Acta Geophys. 2016, 64, 2530–2549. [Google Scholar] [CrossRef] [Green Version]
- Mostowik, K.; Siwek, J.; Kisiel, M.; Kowalik, K.; Krzysik, M.; Plenzler, J.; Rzonca, B. Runoff trends in a changing climate in the Eastern Carpathians (Bieszczady Mountains, Poland). Catena 2019, 182, 104174. [Google Scholar] [CrossRef]
- Krajewski, A.; Sikorska-Senoner, A.E.; Ranzi, R.; Banasik, K. Long-term changes of hydrological variables in a small lowland watershed in Central Poland. Water 2019, 11, 564. [Google Scholar] [CrossRef] [Green Version]
- Solarczyk, A.; Kubiak-Wójcicka, K. The exhaustion of water resources in the Kuyavian-Pomeranian voivodeship in drought conditions in 2015. In Proceedings of the Research for Rural Development 2019: Annual 25th International Scientific Conference, Jelgava, Latvia, 15–17 May 2019; Volume 1, pp. 118–125. [Google Scholar] [CrossRef]
Figure 1.
Average annual sums of precipitation in the period 1951–2015 (own study based on data the Institute of Meteorology and Water Management—National Research Institute). Legend: 1—meteorological stations, 2—hydrological stations, 3—rivers, 4—river basin border, 5—average annual precipitation in mm.

Figure 2.
Average annual air temperature in the period 1951–2015 (own study based on data the Institute of Meteorology and Water Management—National Research Institute). Legend: 1—meteorological stations, 2—hydrological stations, 3—rivers, 4—river basin border, 5—average annual air temperature in °C.

Figure 3.
Average annual unit outflows of the Vistula at selected water gauge stations in hydrological years 1951–2015 (own study based on data the Institute of Meteorology and Water Management—National Research Institute).
Figure 3.
Average annual unit outflows of the Vistula at selected water gauge stations in hydrological years 1951–2015 (own study based on data the Institute of Meteorology and Water Management—National Research Institute).

Figure 4.
Average annual Vistula outflows at selected hydrological stations, 1951–2015 (own study based on data the Institute of Meteorology and Water Management—National Research Institute). Legend: SQ—average annual outflows in m3·s−1, SSQ 1951–1980—average annual outflows 1951–1980, SSQ 1981–2015 average annual outflows 1981–2015.


Figure 5.
Average monthly sums of precipitation (P in mm) and average air temperature (T in °C) at selected meteorological stations in two comparable periods 1981–2015 and 1951–1980.
Figure 5.
Average monthly sums of precipitation (P in mm) and average air temperature (T in °C) at selected meteorological stations in two comparable periods 1981–2015 and 1951–1980.


Figure 6.
Average monthly air temperature minimal (Tmin in °C) and maximal (Tmax in °C) at selected meteorological stations in two comparable periods 1981–2015 and 1951–1980.
Figure 6.
Average monthly air temperature minimal (Tmin in °C) and maximal (Tmax in °C) at selected meteorological stations in two comparable periods 1981–2015 and 1951–1980.


Figure 7.
Variability of average monthly precipitation sums (Cv) at selected meteorological stations in the two comparable periods 1981–2015 and 1951–1980.
Figure 7.
Variability of average monthly precipitation sums (Cv) at selected meteorological stations in the two comparable periods 1981–2015 and 1951–1980.


Figure 8.
Average monthly outflows (SQ in m3·s−1) of the Vistula at four water gauge stations: Nowy Bieruń, Sandomierz, Warsaw and Tczew in the two comparable periods 1951–1980 and 1981–2015.
Figure 8.
Average monthly outflows (SQ in m3·s−1) of the Vistula at four water gauge stations: Nowy Bieruń, Sandomierz, Warsaw and Tczew in the two comparable periods 1951–1980 and 1981–2015.

Figure 9.
Monthly variability of Vistula outflows at selected hydrological stations in the two comparable periods 1951–1980 and 1981–2015.
Figure 9.
Monthly variability of Vistula outflows at selected hydrological stations in the two comparable periods 1951–1980 and 1981–2015.


Table 1.
Characteristics of precipitation and air temperature at selected stations (own study based on data the Institute of Meteorology and Water Management—National Research Institute).
Table 1.
Characteristics of precipitation and air temperature at selected stations (own study based on data the Institute of Meteorology and Water Management—National Research Institute).
| Meteorological Stations | Longitude | Latitude | Annual Average Precipitation (mm) | Annual Average Air Temperature (°C) | ||||
|---|---|---|---|---|---|---|---|---|
| 1951–1980 | 1981–2015 | 1951–2015 | 1951–1980 | 1981–2015 | 1951–2015 | |||
| Bielsko-Biała | 19 00 04 | 49 48 29 | 1016.1 | 959.9 | 987.2 | 7.8 | 8.6 | 8.2 |
| Kraków | 19 48 07 | 50 04 49 | 679.0 | 661.7 | 669.7 | 7.7 | 8.6 | 8.2 |
| Kielce | 20 41 32 | 50 48 37 | 650.0 | 614.0 | 630.6 | 7.2 | 7.9 | 7.6 |
| Lublin | 22 23 37 | 51 13 01 | 600.8 | 576.6 | 587.8 | 7.4 | 7.9 | 7.7 |
| Łódź | 19 23 59 | 51 43 24 | 563.4 | 559.4 | 561.2 | 7.6 | 8.4 | 8.0 |
| Warsaw | 20 57 40 | 52 09 46 | 507.8 | 532.1 | 522.0 | 7.8 | 8.6 | 8.2 |
| Toruń | 18 35 43 | 53 02 31 | 527.7 | 529.7 | 528.9 | 7.6 | 8.6 | 8.1 |
| Białystok | 23 09 44 | 53 06 26 | 597.3 | 575.9 | 585.8 | 6.7 | 7.3 | 7.1 |
| Chojnice | 17 31 57 | 53 42 55 | 566.7 | 580.5 | 575.4 | 6.9 | 7.7 | 7.3 |
Table 2.
Characteristics of the Vistula flows (own study based on data the Institute of Meteorology and Water Management—National Research Institute).
Table 2.
Characteristics of the Vistula flows (own study based on data the Institute of Meteorology and Water Management—National Research Institute).
| Hydrological Stations | Basin Area | Km of River Section | Average Annual Outflow (m3·s−1)/Unit Outflow (dm3·s−1·km−2) | ||
|---|---|---|---|---|---|
| (km2) | 1951–1980 | 1981–2015 | 1951–2015 | ||
| Nowy Bieruń | 1780 | 919.8 | 21.9/12.3 | 20.4/11.5 | 21.1/11.8 |
| Sandomierz | 31,810 | 654.4 | 303.0/9.5 | 281.0/8.8 | 295.0/9.3 |
| Warsaw | 84,630 | 430.6 | 600.0/7.1 | 553.0/6.5 | 579.0/6.8 |
| Tczew | 193,923 | 32.8 | 1072.0/5.5 | 1020.0/5.3 | 1044.0/5.4 |
Table 3.
Statistical analysis of meteorological variables (own study based on data the Institute of Meteorology and Water Management—National Research Institute).
Table 3.
Statistical analysis of meteorological variables (own study based on data the Institute of Meteorology and Water Management—National Research Institute).
| Years | Precipitation | Temperature | ||||
|---|---|---|---|---|---|---|
| Trend mm/10 year | S Mann–Kendall Z Test Statistics | Normalized Z Test Statistics | Trend °C/10 Year | S Mann–Kendall Statistics | Normalized Z Test Statistics | |
| Bielsko-Biała | ||||||
| 1951–1980 | −12.70 | −13 | −0.214 | 0.12 | −22 | −0.375 |
| 1981–2015 | 42.50 | 84 | 1.179 | 0.44 | 203 | 2.869 |
| 1951–2015 | −6.25 | −158 | −0.889 | 0.25 | 753 | 4.257 |
| Kraków | ||||||
| 1951–1980 | 43.87 | 79 | 1.392 | −0.12 | −63 | −1.106 |
| 1981–2015 | 21.04 | 41 | 0.568 | 0.35 | 142 | 2.002 |
| 1951–2015 | 3.63 | 20 | 0.108 | 0.24 | 658 | 3.720 |
| Kielce | ||||||
| 1951–1980 | 8.11 | 5 | 0.071 | −0.20 | −89 | −1.570 |
| 1981–2015 | 27.71 | 108 | 1.520 | 0.40 | 184 | 2.599 |
| 1951–2015 | −3.14 | −20 | −0.108 | 0.19 | 555 | 3.136 |
| Lublin | ||||||
| 1951–1980 | 31.36 | 93 | 1.641 | −0.33 | −115 | −2.034 |
| 1981–2015 | 41.28 | 177 | 2.499 | 0.45 | 193 | 2.727 |
| 1951–2015 | 3.97 | 156 | 0.878 | 0.14 | 406 | 2.293 |
| Łódź | ||||||
| 1951–1980 | 35.23 | 103 | 1.820 | −0.05 | −41 | −0.714 |
| 1981–2015 | 15.70 | 73 | 1.203 | 0.35 | 142 | 2.002 |
| 1951–2015 | 5.01 | 114 | 0.640 | 0.24 | 685 | 3.872 |
| Warsaw | ||||||
| 1951–1980 | 36.31 | 105 | 1.855 | −0.09 | −50 | −0.874 |
| 1981–2015 | 27.79 | 139 | 1.960 | 0.43 | 180 | 2.542 |
| 1951–2015 | 13.08 | 358 | 2.021 | 0.25 | 688 | 3.889 |
| Białystok | ||||||
| 1951–1980 | 51.00 | 105 | 1.855 | −0.22 | −98 | −1.731 |
| 1981–2015 | 22.40 | 89 | 1.250 | 0.27 | 114 | 1.605 |
| 1951–2015 | 2.56 | 82 | 0.459 | 0.16 | 470 | 2.655 |
| Toruń | ||||||
| 1951–1980 | 51.00 | 92 | 1.624 | 0.05 | 4 | 0.054 |
| 1981–2015 | 16.84 | 53 | 0.738 | 0.30 | 110 | 1.548 |
| 1951–2015 | 8.02 | 193 | 1.087 | 0.27 | 752 | 4.252 |
| Chojnice | ||||||
| 1951–1980 | 16.10 | −7 | −0.107 | −0.14 | −17 | −0.321 |
| 1981–2015 | 33.00 | 132 | 1.860 | 0.36 | 159 | 2.244 |
| 1951–2015 | 8.71 | 177 | 0.996 | 0.25 | 751 | 4.246 |
Calculations for significance at 0.05.
Table 4.
Hydrological characteristics of the Vistula at selected water gauge stations (own study based on data the Institute of Meteorology and Water Management—National Research Institute).
Table 4.
Hydrological characteristics of the Vistula at selected water gauge stations (own study based on data the Institute of Meteorology and Water Management—National Research Institute).
| Hydrological Station | Average Outflow (m3·s−1)/Cv | Average Unit Outflow (dm3·s−1·km−2) | ||||
|---|---|---|---|---|---|---|
| 1951–1980 | 1981–2015 | 1951–2015 | 1951–1980 | 1981–2015 | 1951–2015 | |
| Nowy Bieruń | 21.9/0.26 | 20.4/0.32 | 21.1/0.29 | 12.3 | 11.5 | 11.9 |
| Sandomierz | 300.0/0.20 | 281.0/0.28 | 290.0/0.24 | 9.4 | 8.8 | 9.1 |
| Warsaw | 592.0/0.21 | 564.0/0.23 | 577.0/0.22 | 7.0 | 6.7 | 6.8 |
| Tczew | 1072.0/0.22 | 1020.0/0.21 | 1044.0/0.22 | 5.5 | 5.3 | 5.4 |
Table 5.
Statistical analysis of the outflow test.
| Years | Trend m3.s−1/10 year | S Mann–Kendall Statistics | Normalized Z Test Statistics | Probability/Trend |
|---|---|---|---|---|
| Nowy Bieruń | ||||
| 1951–1980 1981–2015 1951–2015 | 2.08 2.21 0.22 | 85 129 33 | 1.499 1.818 0.181 | Non-significant Non-significant Non-significant |
| Sandomierz | ||||
| 1951–1980 1981–2015 1951–2015 | 31.34 23.76 2.56 | 127 111 0 | 2.248 1.562 0 | Increasing Non-significant Non-significant |
| Warsaw | ||||
| 1951–1980 1981–2015 1951–2015 | 61.81 35.82 5.29 | 136 101 58 | 2.409 1.420 0.323 | Increasing Non-significant Non-significant |
| Tczew | ||||
| 1951–1980 1981–2015 1951–2015 | 154.22 6.78 4.32 | 166 6 15 | 2.944 0.071 0.079 | Increasing Non-significant Non-significant |
© 2020 by the author. Licensee MDPI, Basel, Switzerland. This article is an open access article distributed under the terms and conditions of the Creative Commons Attribution (CC BY) license (http://creativecommons.org/licenses/by/4.0/).
Share and Cite
MDPI and ACS Style
Kubiak-Wójcicka, K. Variability of Air Temperature, Precipitation and Outflows in the Vistula Basin (Poland). Resources 2020, 9, 103. https://0-doi-org.brum.beds.ac.uk/10.3390/resources9090103
AMA Style
Kubiak-Wójcicka K. Variability of Air Temperature, Precipitation and Outflows in the Vistula Basin (Poland). Resources. 2020; 9(9):103. https://0-doi-org.brum.beds.ac.uk/10.3390/resources9090103
Chicago/Turabian StyleKubiak-Wójcicka, Katarzyna. 2020. "Variability of Air Temperature, Precipitation and Outflows in the Vistula Basin (Poland)" Resources 9, no. 9: 103. https://0-doi-org.brum.beds.ac.uk/10.3390/resources9090103
Note that from the first issue of 2016, this journal uses article numbers instead of page numbers. See further details here.