
Dynamic Route Discovery Using Modified Grasshopper Optimization Algorithm in Wireless Ad-Hoc Visible Light Communication Network

 ,
,  and
and 
Abstract
:1. Introduction
2. Related Works
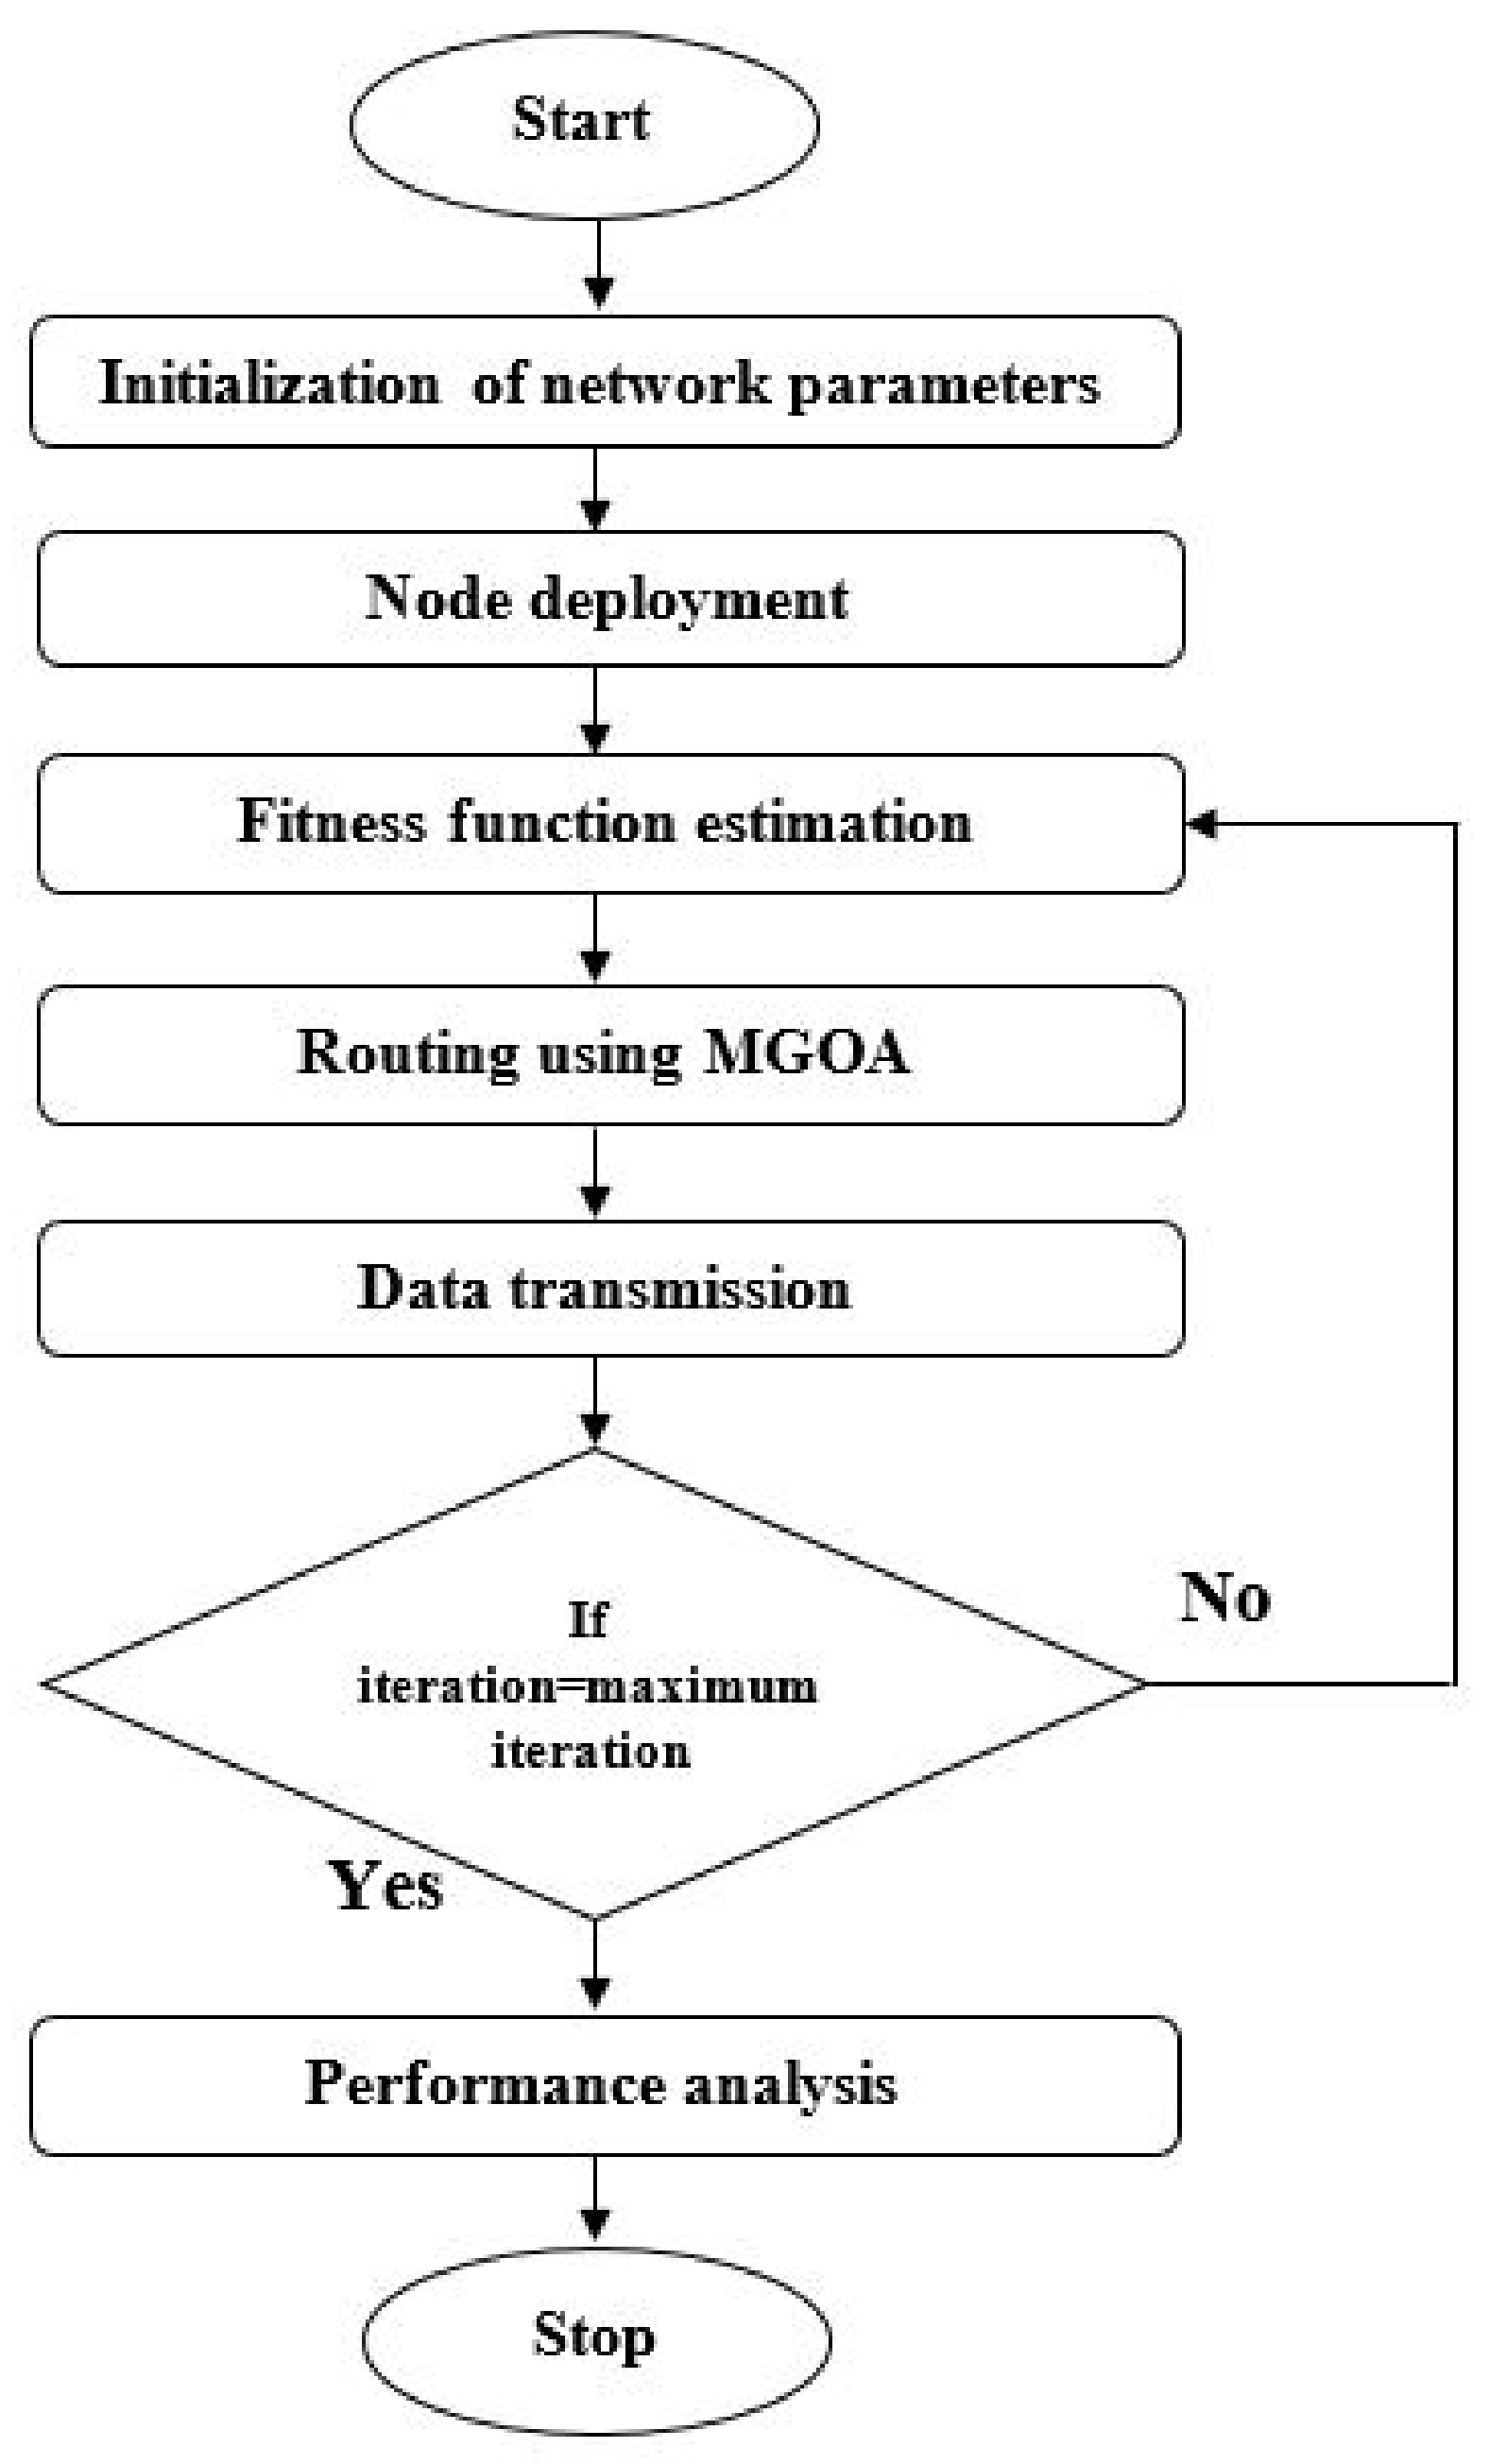
3. Methodology
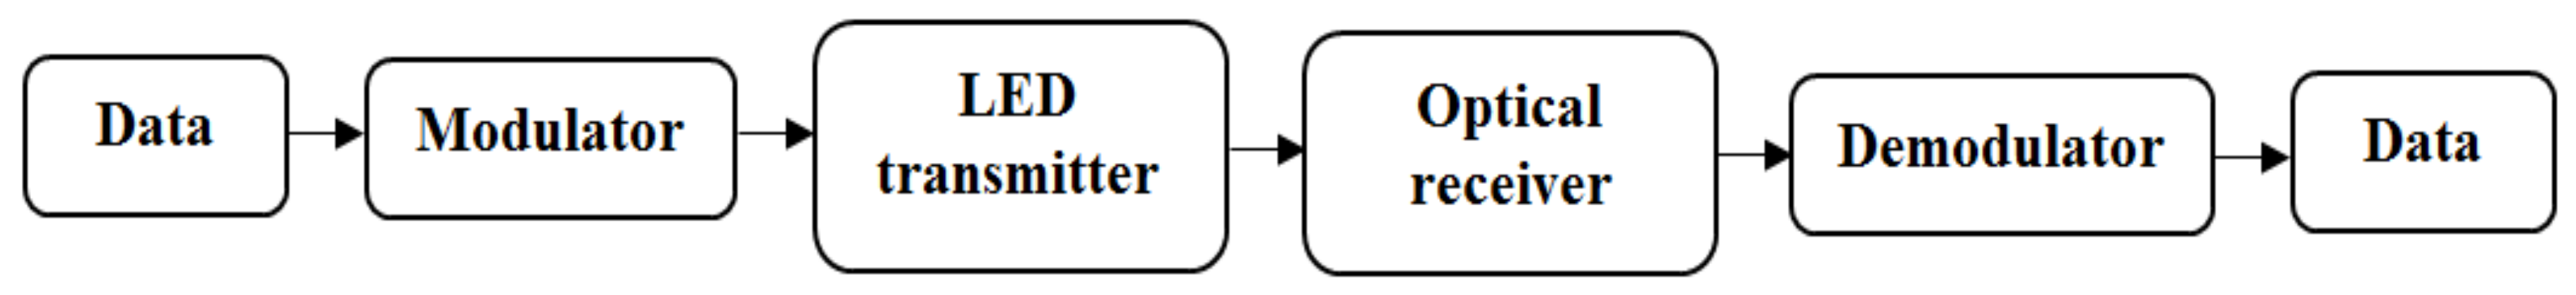
3.1. System Model
3.2. Overview of MGOA
| Algorithm 1 Pseudocode of MGOA |
| Initialize X(t), Maxitr, cmin and cmax |
| Analyze every solution by using random forest classifier |
| Set T as the better solution |
| While (t < Maxitr) |
| Update c using Equation (9) |
| For every solution |
| Normalize the separation of grasshoppers using Equation (5) |
| Update the current solution location using Equation (8) |
| Change the current solution, if the search space boundary violates |
| End for |
| If there is a better solution in the population, update T |
| t = t + 1 |
| End while |
| ReturnT |
| End |
3.3. Route Discovery Using MGOA
3.3.1. Grasshopper Representation
3.3.2. Grasshopper Initialization
3.3.3. Derivation of Fitness Function
4. Simulation Results
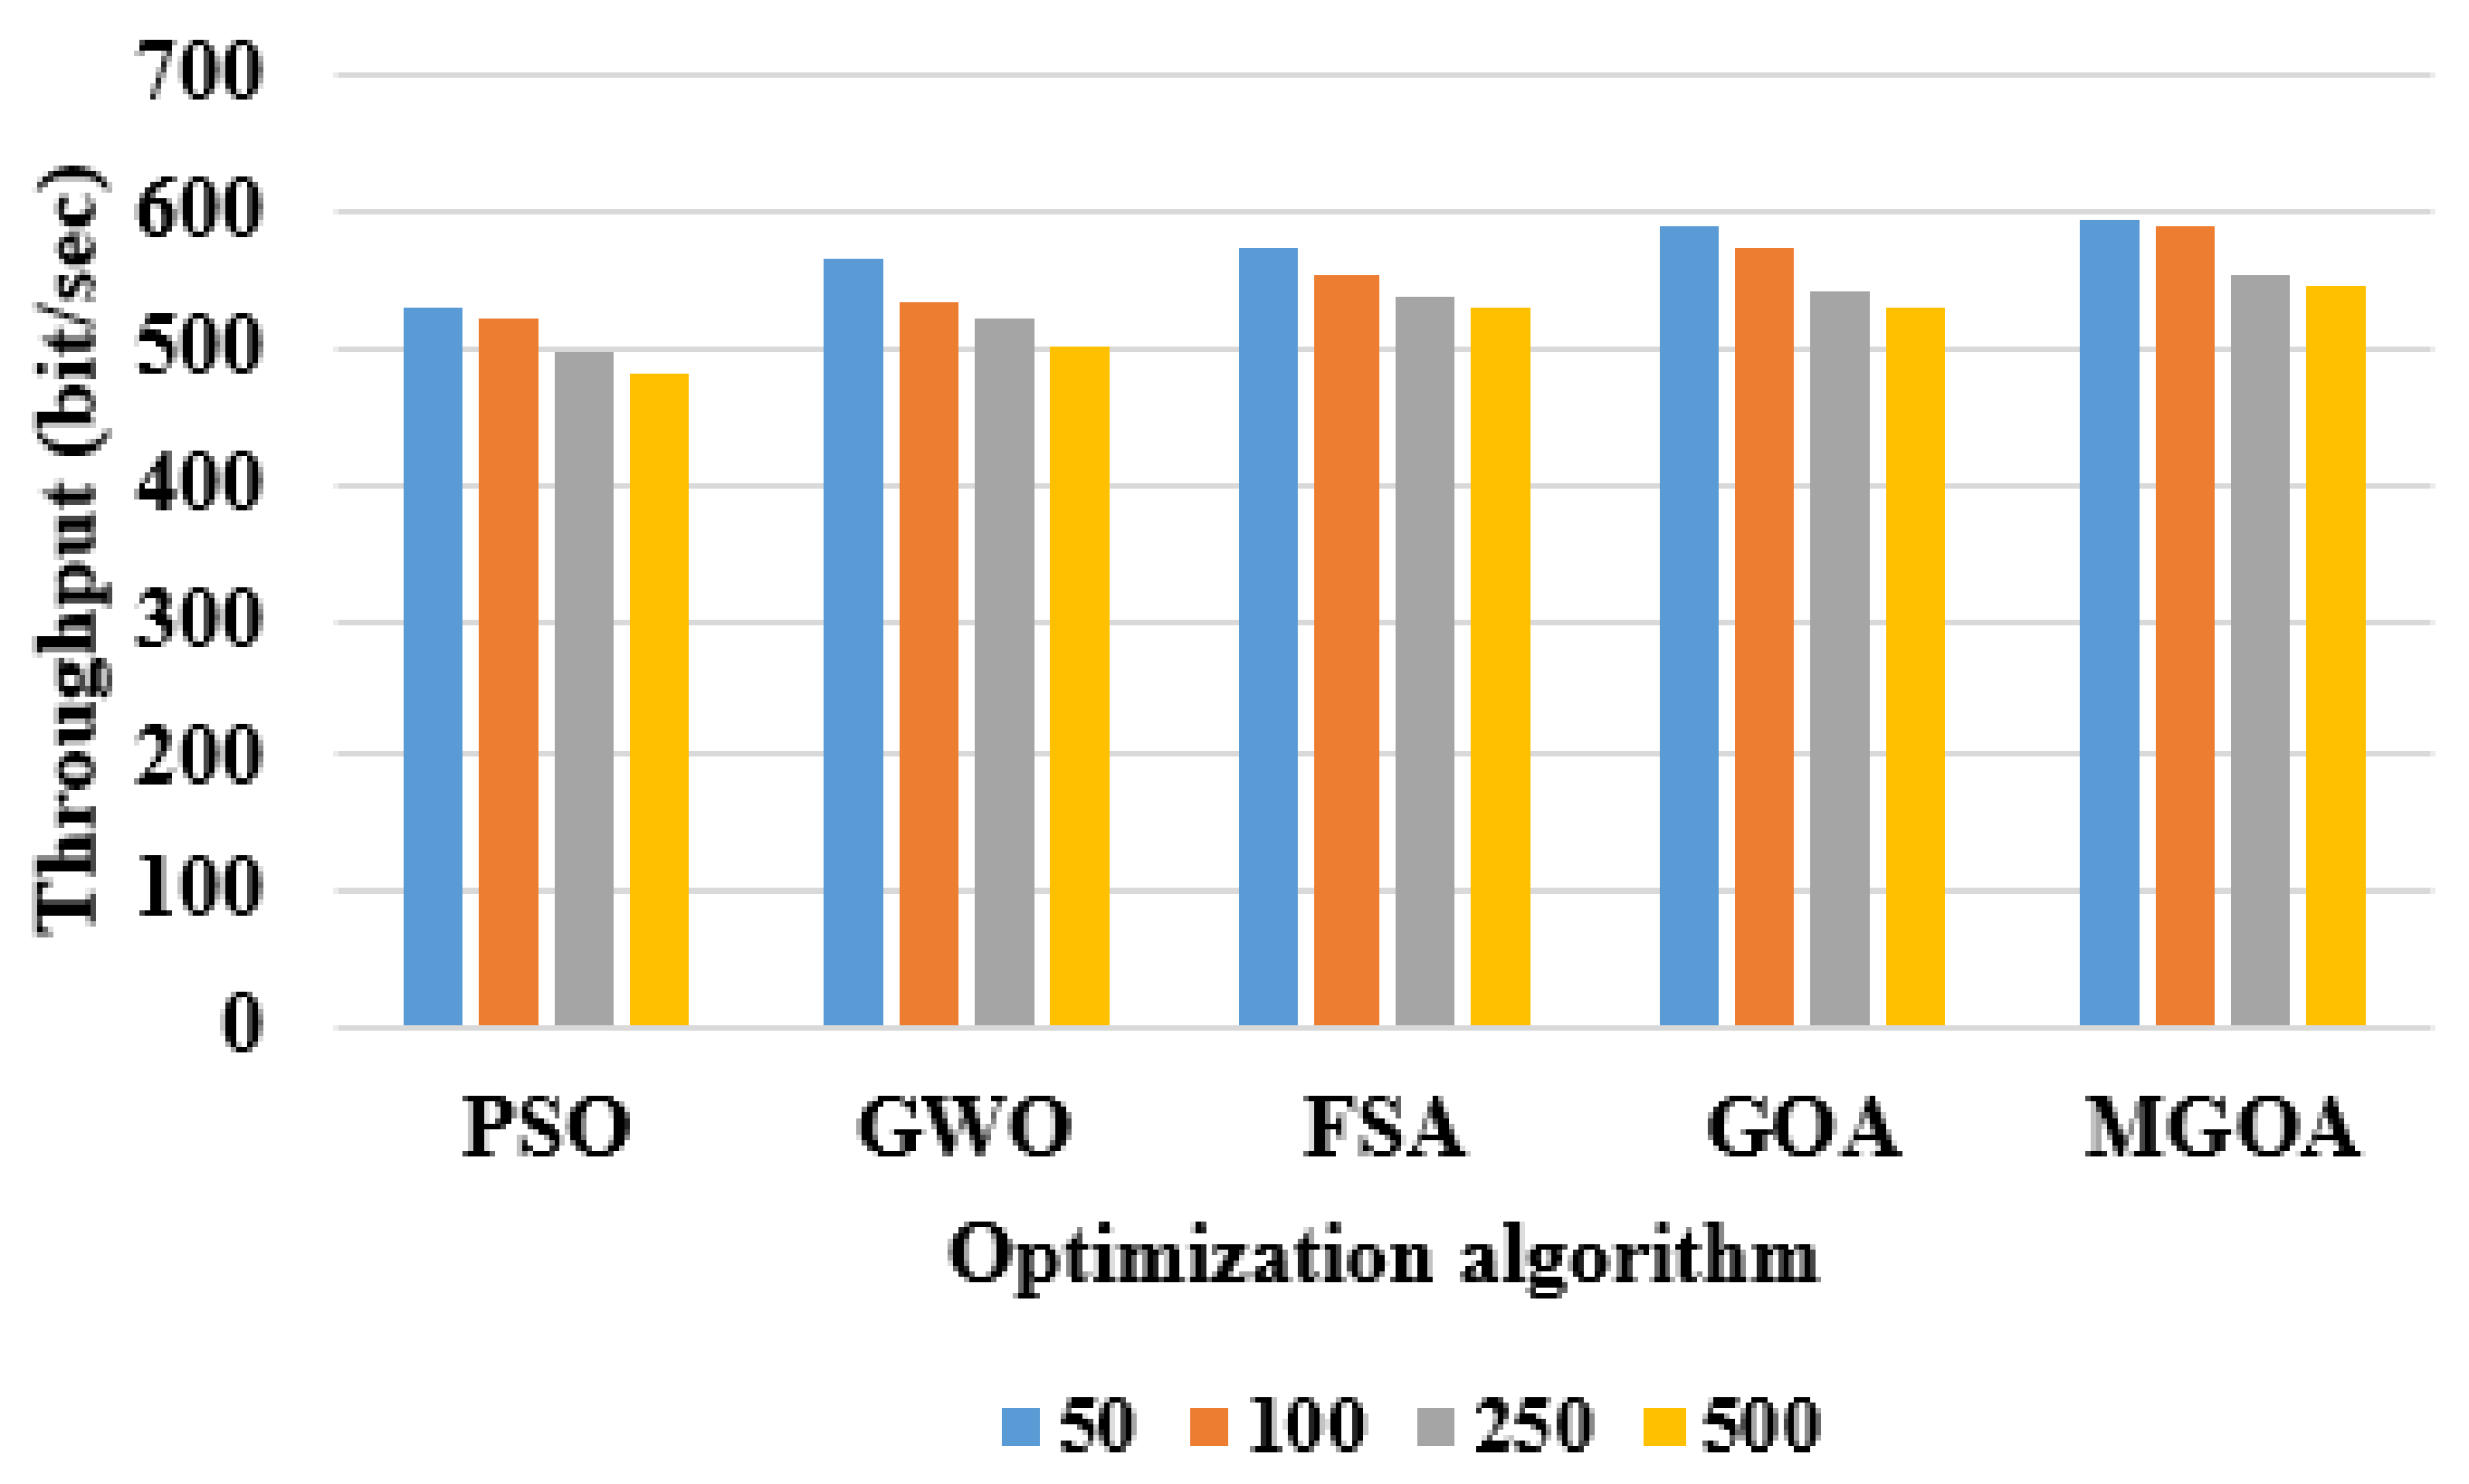
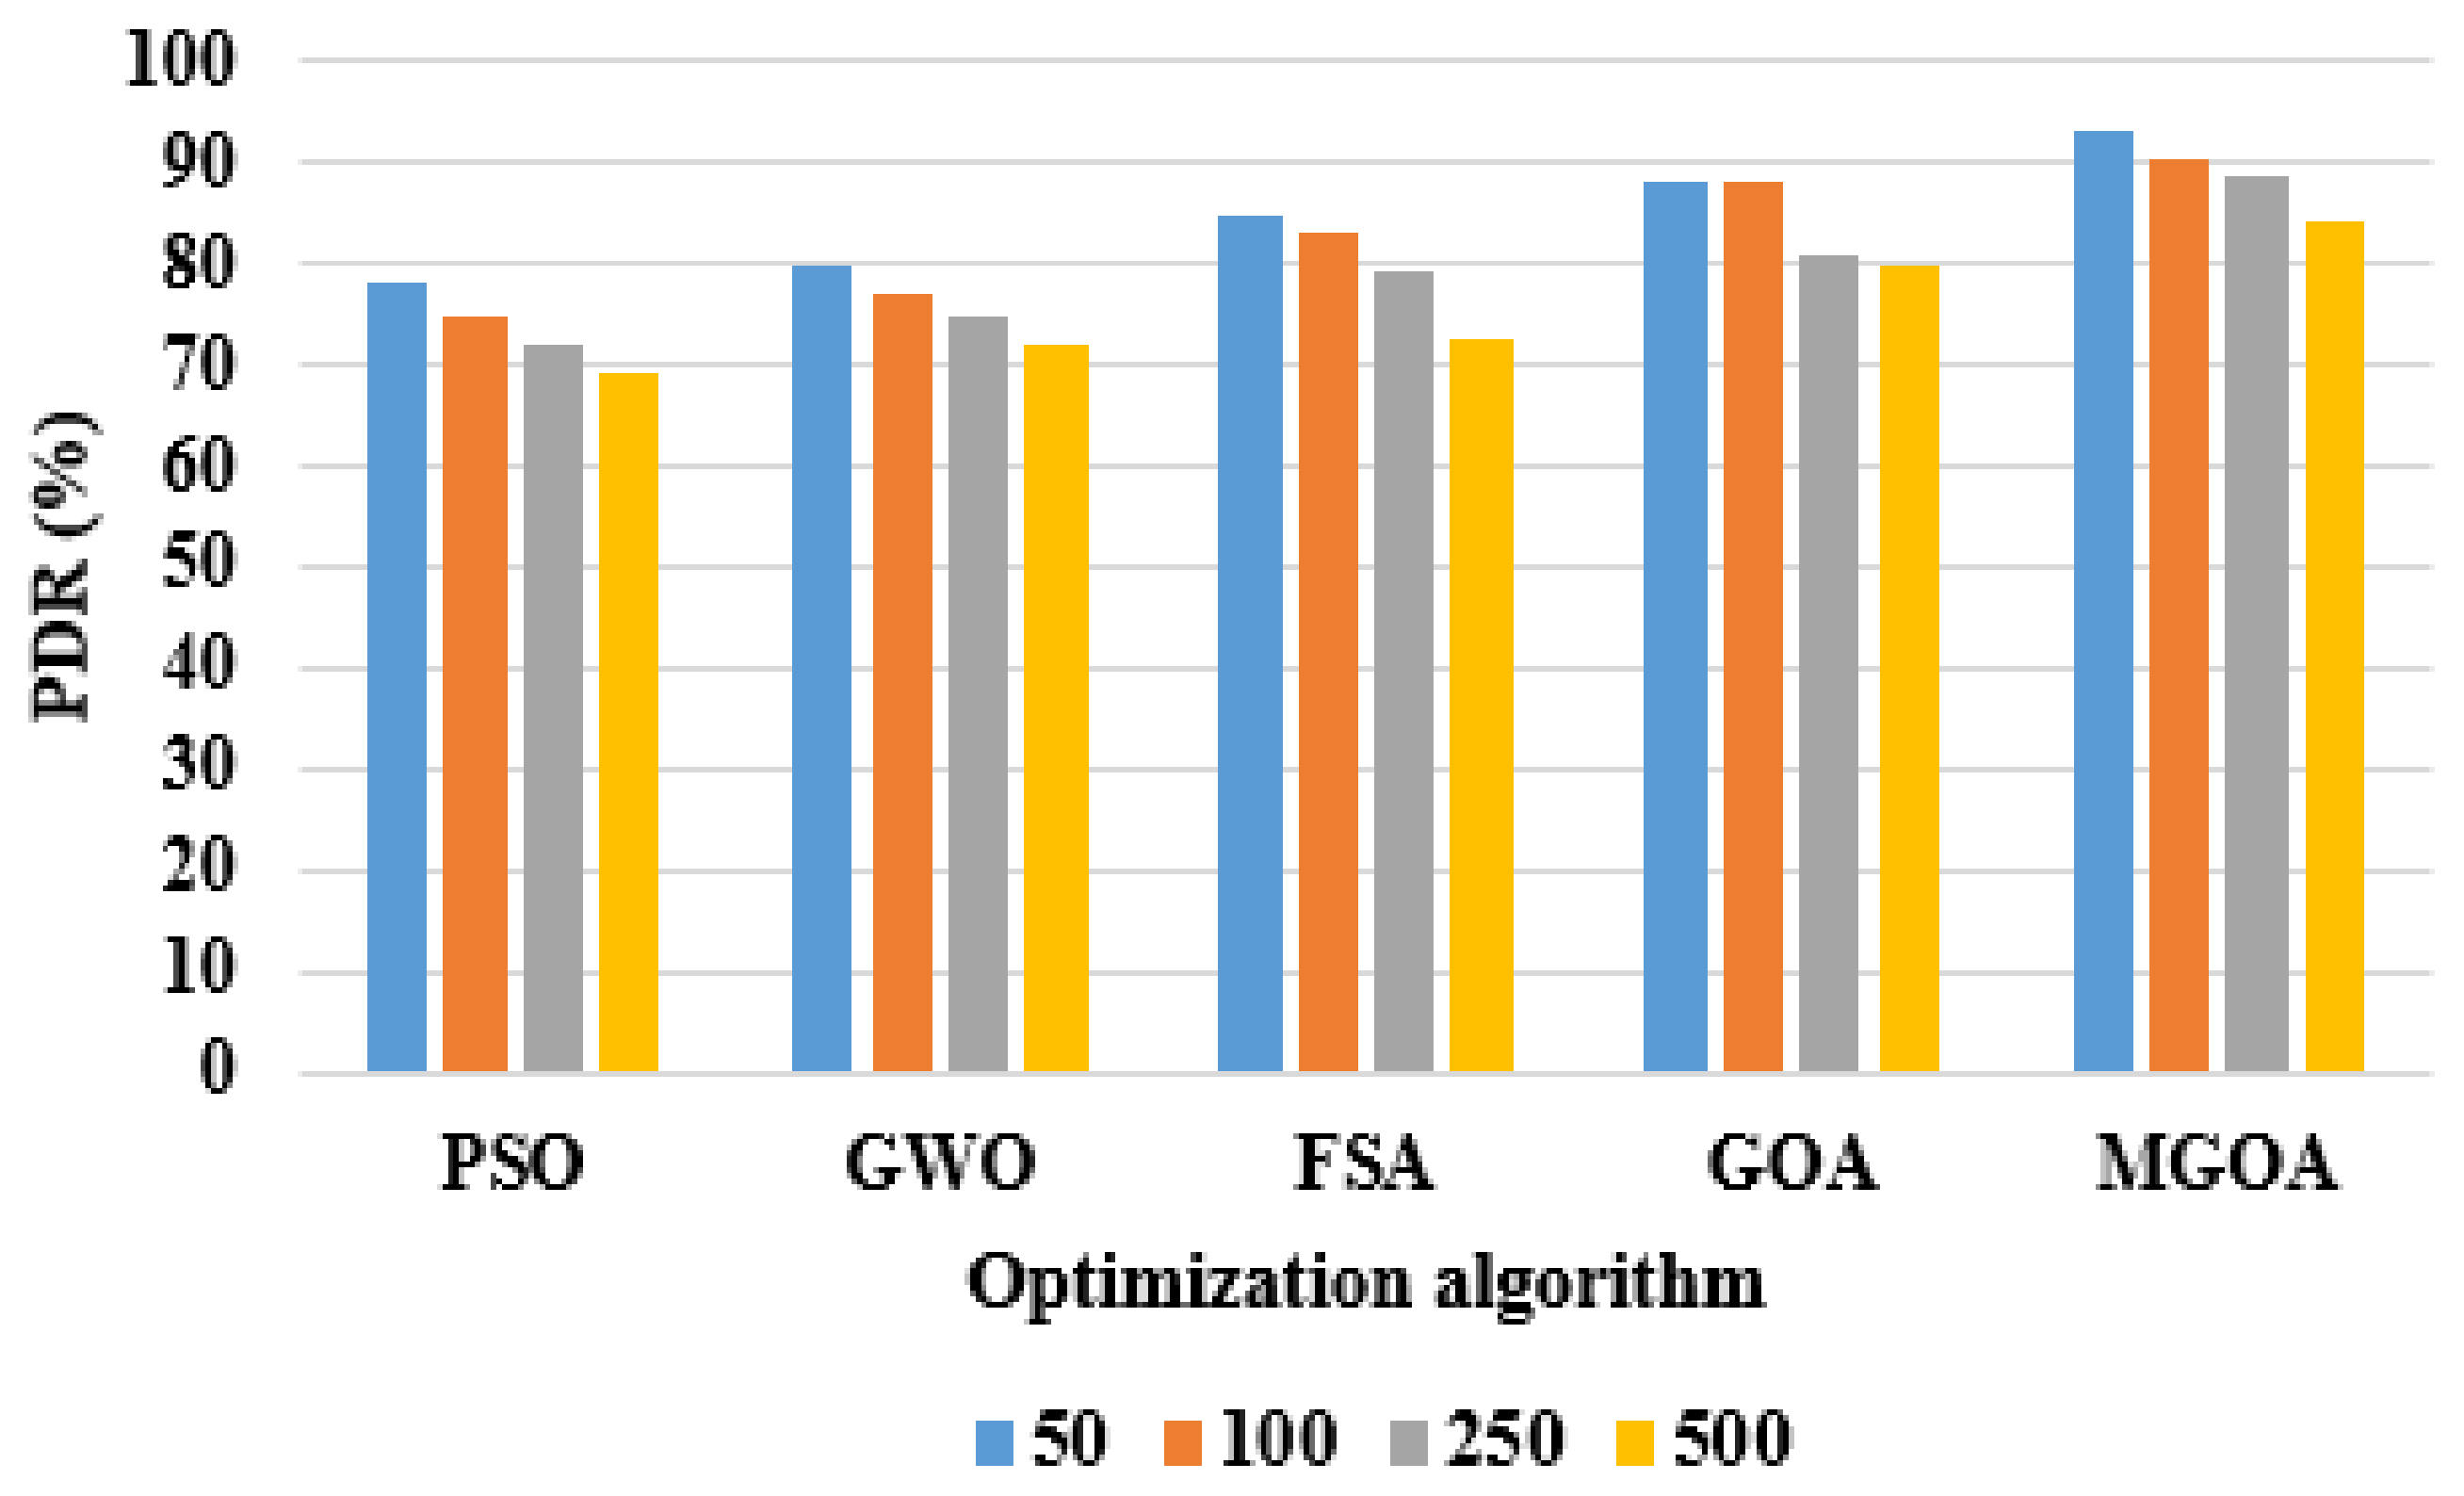
4.1. Quantitative Analysis
4.2. Comparative Analysis
5. Conclusions
Author Contributions
Funding
Conflicts of Interest
References
- Cai, Y.; Guan, W.; Wu, Y.; Xie, C.; Chen, Y.; Fang, L. Indoor high precision three-dimensional positioning system based on visible light communication using particle swarm optimization. IEEE Photonics J. 2017, 9, 1–20. [Google Scholar] [CrossRef]
- Zhang, M.; Li, F.; Guan, W.; Wu, Y.; Xie, C.; Peng, Q.; Liu, X. A three-dimensional indoor positioning technique based on visible light communication using chaotic particle swarm optimization algorithm. Optik 2018, 165, 54–73. [Google Scholar] [CrossRef]
- Jain, S.; Mitra, R.; Bhatia, V. Adaptive precoding-based detection algorithm for massive MIMO visible light communication. IEEE Commun. Lett. 2018, 22, 1842–1845. [Google Scholar] [CrossRef]
- Pau, G.; Collotta, M.; Maniscalco, V.; Choo, K.K.R. A fuzzy-PSO system for indoor localization based on visible light communications. Soft Comput. 2019, 23, 5547–5557. [Google Scholar] [CrossRef] [Green Version]
- Jain, S.; Mitra, R.; Bhatia, V. KLMS-DFE based adaptive post-distorter for visible light communication. Opt. Commun. 2019, 451, 353–360. [Google Scholar] [CrossRef]
- Wu, Y.; Liu, X.; Guan, W.; Chen, B.; Chen, X.; Xie, C. High-speed 3D indoor localization system based on visible light communication using differential evolution algorithm. Opt. Commun. 2018, 424, 177–189. [Google Scholar] [CrossRef]
- Saied, O.; Ghassemlooy, Z.; Rajbhandari, S.; Burton, A. Optical single carrier-interleaved frequency division multiplexing for visible light communication systems. Optik 2019, 194, 162910. [Google Scholar] [CrossRef]
- Chen, H.; Guan, W.; Li, S.; Wu, Y. Indoor high precision three-dimensional positioning system based on visible light communication using modified genetic algorithm. Opt. Commun. 2018, 413, 103–120. [Google Scholar] [CrossRef]
- Zheng, H.; Chen, J.; Yu, C.; Gurusamy, M. Inverse design of LED arrangement for visible light communication systems. Opt. Commun. 2017, 382, 615–623. [Google Scholar] [CrossRef]
- Shen, H.; Deng, Y.; Xu, W.; Zhao, C. Secrecy-oriented transmitter optimization for visible light communication systems. IEEE Photonics J. 2016, 8, 1–14. [Google Scholar] [CrossRef]
- Wang, L.; Wang, C.; Chi, X.; Zhao, L.; Dong, X. Optimizing SNR for indoor visible light communication via selecting communicating LEDs. Opt. Commun. 2017, 387, 174–181. [Google Scholar] [CrossRef]
- Liu, Y.; Peng, Y.; Liu, Y.; Long, K. Optimization of receiving power distribution using genetic algorithm for visible light communication. In AOPC 2015: Optical Fiber Sensors and Applications; SPIE: Bellingham, WA, USA, 2015; Volume 9679, p. 96790I. [Google Scholar]
- Martínez-Ciro, R.A.; López-Giraldo, F.E.; Betancur-Perez, A.F.; Luna-Rivera, J.M. Design and implementation of a multi-colour visible light communication system based on a light-to-frequency receiver. Photonics 2019, 6, 42. [Google Scholar] [CrossRef] [Green Version]
- Liu, H.; Zhu, P.; Chen, Y.; Huang, M. Power allocation for downlink hybrid power line and visible light communication system. IEEE Access 2020, 8, 24145–24152. [Google Scholar] [CrossRef]
- Ulkar, M.G.; Baykas, T.; Pusane, A.E. VLCnet: Deep learning based end-to-end visible light communication system. J. Lightwave Technol. 2020, 38, 5937–5948. [Google Scholar] [CrossRef]
- Matheus, L.M.; Vieira, A.B.; Vieira, M.A.; Vieira, L.F. DYRP-VLC: A dynamic routing protocol for wireless ad-hoc visible light communication networks. Ad Hoc Netw. 2019, 94, 101941. [Google Scholar] [CrossRef]
- Lou, S.; Gong, C.; Wu, N.; Xu, Z. Power optimization under brightness and communication requirements for visible light communication based on MacAdam ellipse. J. Commun. Inf. Netw. 2017, 2, 28–35. [Google Scholar] [CrossRef] [Green Version]
- Hong, W.X.; Wang, J.Q.; Li, W.Z. CSK hopping pattern model for visible light communication networks. Opt. Quantum Electron. 2019, 51, 1–17. [Google Scholar] [CrossRef]
- Sun, G.; Liu, Y.; Yang, M.; Wang, A.; Liang, S.; Zhang, Y. Coverage optimization of VLC in smart homes based on improved cuckoo search algorithm. Comput. Netw. 2017, 116, 63–78. [Google Scholar] [CrossRef]
- Biton, C.; Arnon, S. Improved multiple access resource allocation in visible light communication systems. Opt. Commun. 2018, 424, 98–102. [Google Scholar] [CrossRef]
- Li, F.; Wu, K.; Zou, W.; Chen, J. Analysis of energy saving ability in dimming VLC systems using LEDs with optimized SAHP. Opt. Commun. 2016, 361, 86–96. [Google Scholar] [CrossRef]
- Ding, J.P.; Ji, Y.F. Evolutionary algorithm-based optimization of the signal-to-noise ratio for indoor visible-light communication utilizing white light-emitting diode. IET Optoelectron. 2012, 6, 307–317. [Google Scholar] [CrossRef]
- Liu, H.; Wang, X.; Chen, Y.; Kong, D.; Xia, P. Optimization lighting layout based on gene density improved genetic algorithm for indoor visible light communications. Opt. Commun. 2017, 390, 76–81. [Google Scholar] [CrossRef]
- Liu, H.; Lin, Z.; Xu, Y.; Chen, Y.; Pu, X. Coverage uniformity with improved genetic simulated annealing algorithm for indoor Visible Light Communications. Opt. Commun. 2019, 439, 156–163. [Google Scholar] [CrossRef]
- Jiaan, W.; Ancheng, X.; Jintao, J.; Linyang, G. Optimization lighting layout of indoor visible light communication system based on improved artificial fish swarm algorithm. J. Opt. 2020, 22, 035701. [Google Scholar] [CrossRef]
- Yuksel, H.; Altunay, Ö. Host-to-host TCP/IP connection over serial ports using visible light communication. Phys. Commun. 2020, 43, 101222. [Google Scholar] [CrossRef]
- Faisal, A.; Alghamdi, R.; Dahrouj, H.; Sarieddeen, H.; Saeed, N.; Al-Naffouri, T.Y.; Alouini, M.S. Diversity Schemes in Multi-hop Visible Light Communications for 6G Networks. Procedia Comput. Sci. 2021, 182, 140–149. [Google Scholar] [CrossRef]
- Mao, W.; Xie, H.; Tan, Z.; Liu, Z.; Liu, M. High precision indoor positioning method based on visible light communication using improved Camshift tracking algorithm. Opt. Commun. 2020, 468, 125599. [Google Scholar] [CrossRef]
- Teng, D.; Zheng, Y.; Luo, M.; Luo, Y.; Jinyuan, W. Joint User Pairing and Subcarrier Allocation for NOMA-based Hybrid Power Line and Visible Light Communication Systems. J. Phys. Conf. Ser. 2020, 1693, 012159. [Google Scholar] [CrossRef]
- Wu, X.; Huang, Z.; Ji, Y. Deep neural network method for channel estimation in visible light communication. Opt. Commun. 2020, 462, 125272. [Google Scholar] [CrossRef]
- Dixit, V.; Kumar, A. Performance analysis of non-line of sight visible light communication systems. Opt. Commun. 2020, 459, 125008. [Google Scholar] [CrossRef]
- Wu, X.; Hu, F.; Zou, P.; Lu, X.; Chi, N. The performance improvement of visible light communication systems under strong nonlinearities based on Gaussian mixture model. Microw. Opt. Technol. Lett. 2020, 62, 547–554. [Google Scholar] [CrossRef]
- Begum, S.; Patil, N.B. An Optimal Route Discovery using Biogeography based Optimization for Vehicular Ad Hoc Networks. Int. J. Comput. Netw. Commun. 2021, 13. [Google Scholar] [CrossRef]
- Saremi, S.; Mirjalili, S.; Lewis, A. Grasshopper optimisation algorithm: Theory and application. Adv. Eng. Softw. 2017, 105, 30–47. [Google Scholar] [CrossRef] [Green Version]
- Goel, N.; Grover, B.; Gupta, D.; Khanna, A.; Sharma, M. Modified Grasshopper Optimization Algorithm for detection of Autism Spectrum Disorder. Phys. Commun. 2020, 41, 101115. [Google Scholar] [CrossRef]
- Yin, R.R.; Ghassemlooy, Z.; Zhao, N.; Yuan, H.; Raza, M.; Eso, E.; Zvanovec, S. A Multi-Hop Relay Based Routing Algorithm for Vehicular Visible Light Communication Networks. In Proceedings of the 12th International Symposium on Communication Systems, Networks and Digital Signal Processing (CSNDSP), Porto, Portugal, 20–22 July 2020; pp. 1–6. [Google Scholar]
- Lalwani, P.; Das, S.; Banka, H.; Kumar, C. CRHS: Clustering and routing in wireless sensor networks using harmony search algorithm. Neural Comput. Appl. 2018, 30, 639–659. [Google Scholar] [CrossRef]


| Parameters | Description | Value |
|---|---|---|
| Population size | 22 | |
| Lower bound value | 0 | |
| Upper bound value | 11 | |
| Minimum value of | 0.00002 | |
| Maximum value of | 1 | |
| Control number of nodes selected | 6 | |
| Problem dimension | 20 |
| Parameter | Value |
|---|---|
| Area | |
| Number of nodes | 50, 100, 250, and 500 |
| Transmission range | 15 m |
| Communication channel | WAVLCN |
| Routing protocol | MGOA |
| Packet size | 4000 bits |
| MAC protocol | CSMA/CA |
| Maximum transmission distance | 20 m |
| Throughput (bit/s) | ||||
|---|---|---|---|---|
| Optimization Algorithm | Number of Nodes | |||
| 50 | 100 | 250 | 500 | |
| PSO | 531 | 520 | 499 | 480 |
| GWO | 564 | 532 | 521 | 502 |
| FSA | 572 | 555 | 539 | 528 |
| GOA | 588 | 573 | 540 | 531 |
| MGOA | 594 | 589 | 553 | 544 |
| PDR (%) | ||||
|---|---|---|---|---|
| Optimization Algorithm | Number of Nodes | |||
| 50 | 100 | 250 | 500 | |
| PSO | 78 | 74.89 | 72.21 | 69 |
| GWO | 80 | 76.90 | 75 | 72 |
| FSA | 85 | 83.34 | 79 | 72.78 |
| GOA | 88 | 87.92 | 81 | 79.98 |
| MGOA | 93.28 | 90.12 | 88.90 | 84.10 |
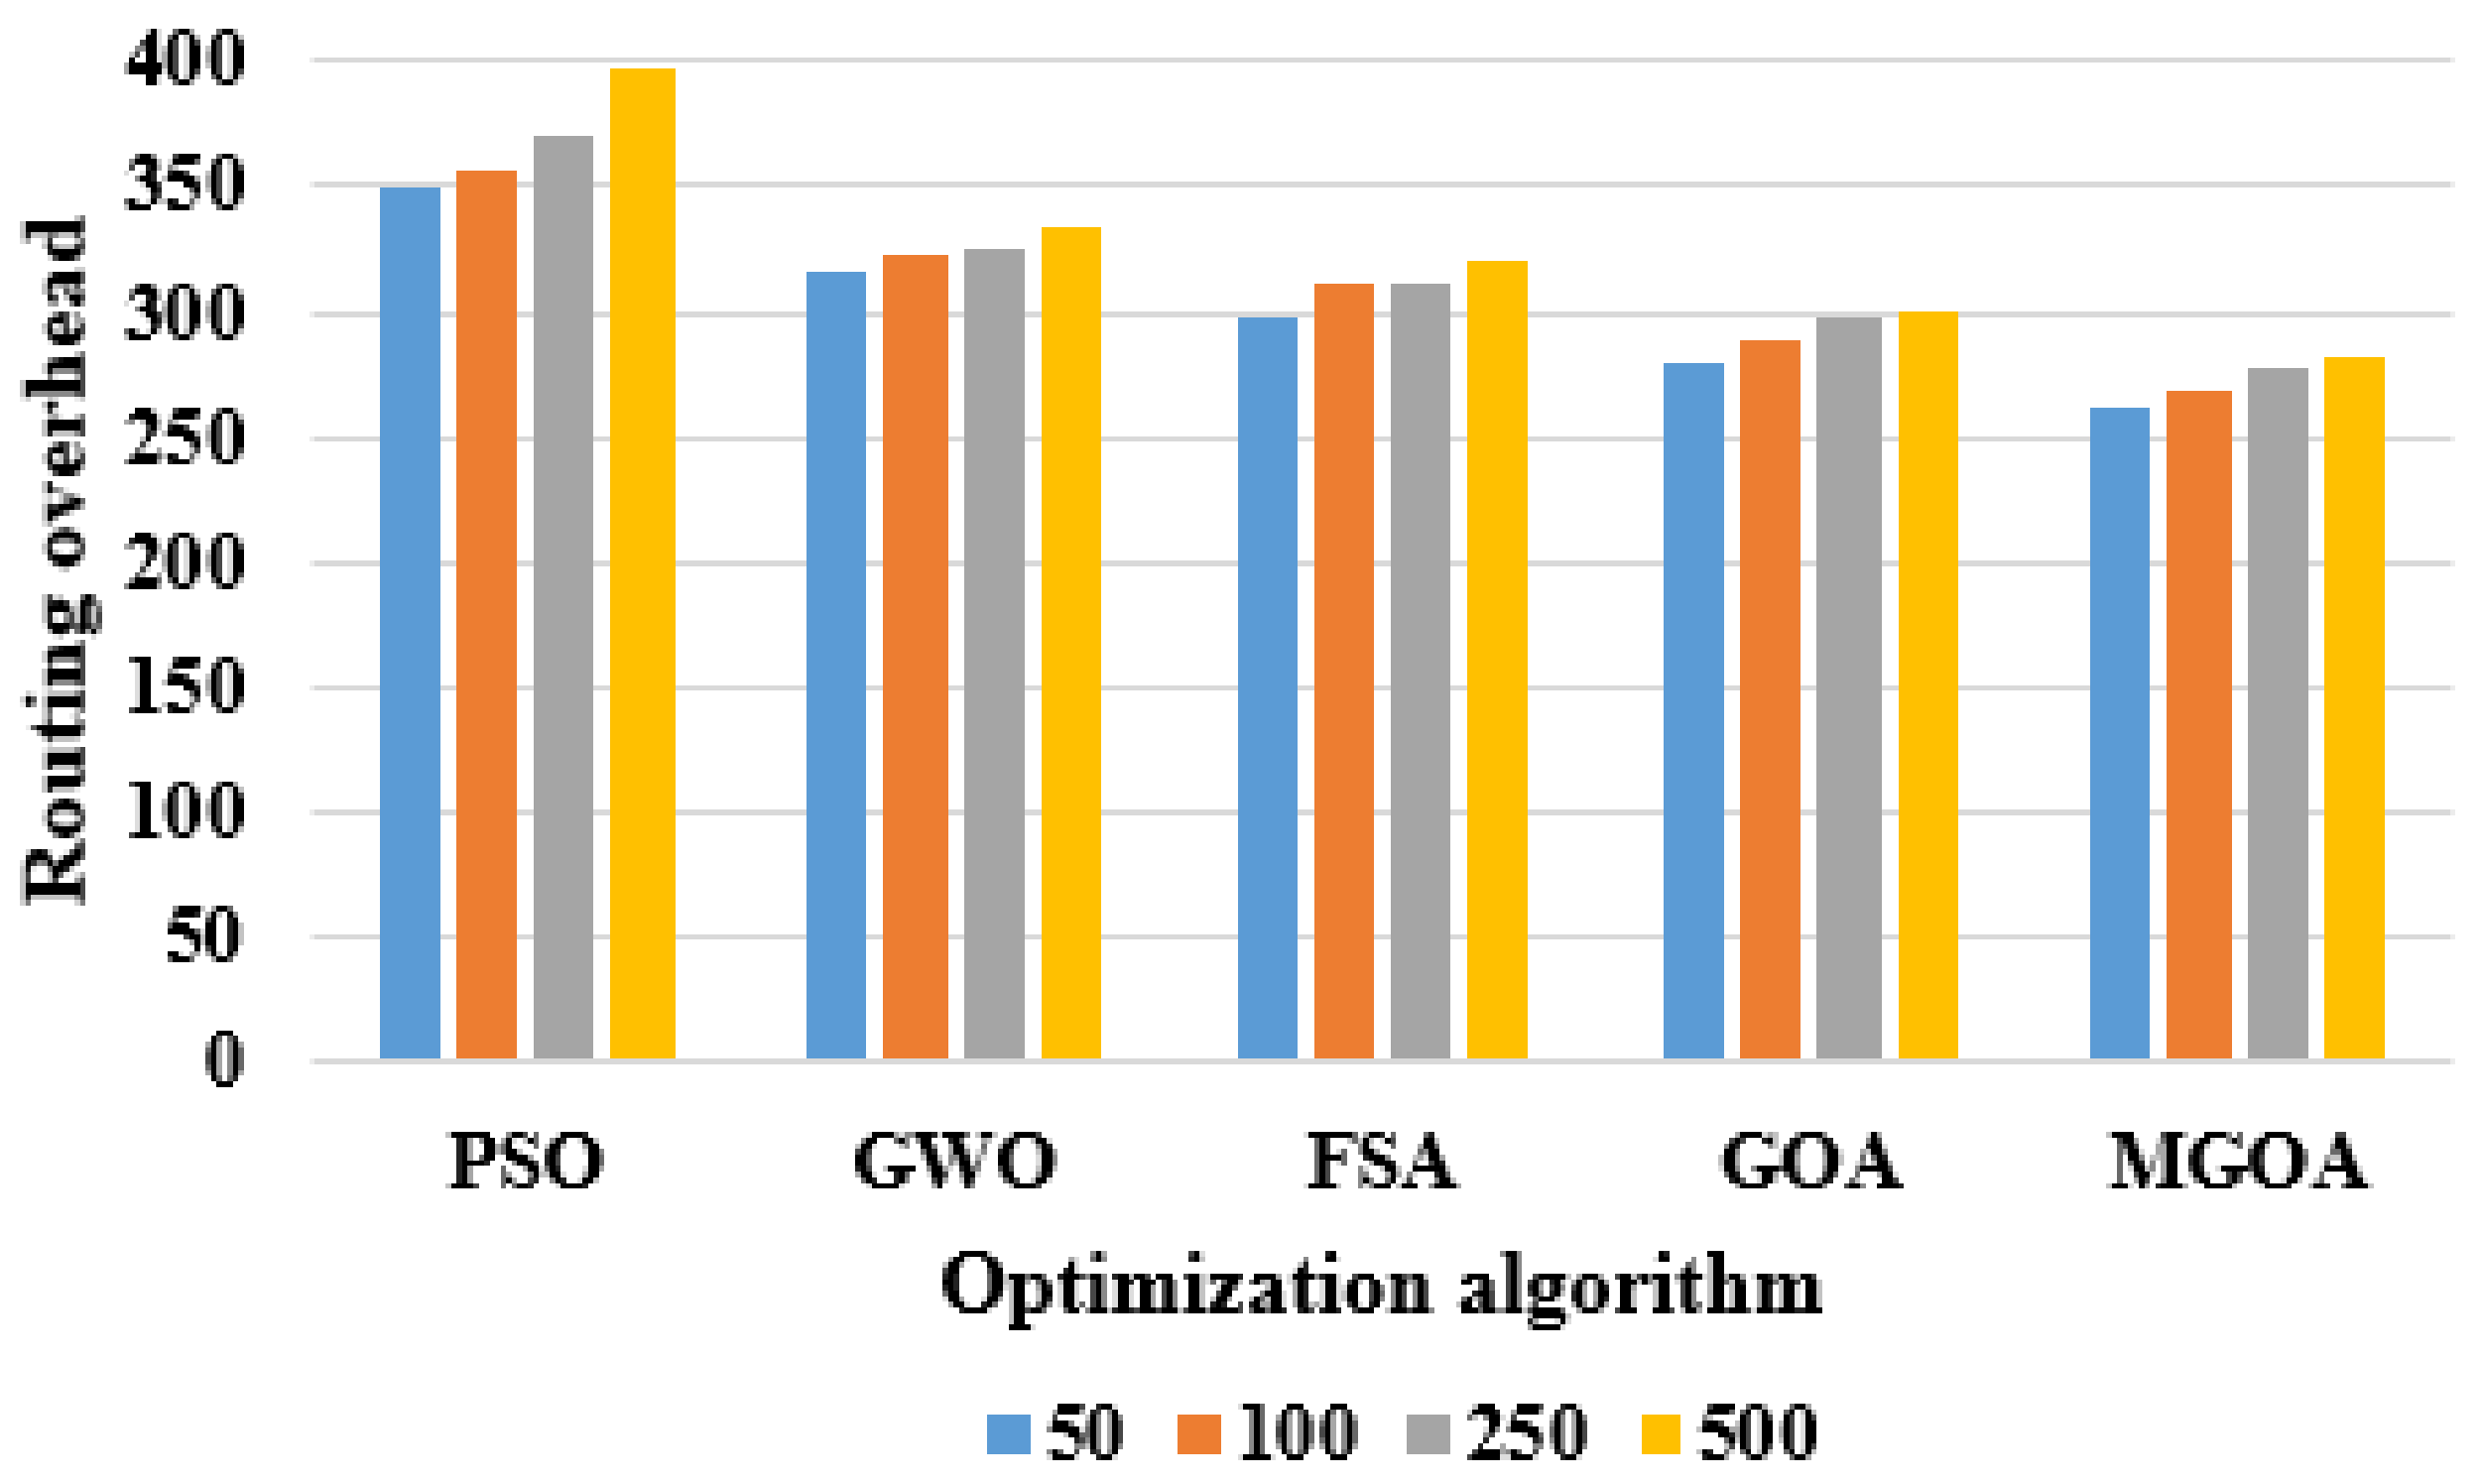
| Routing Overhead | ||||
|---|---|---|---|---|
| Optimization Algorithm | Number of Nodes | |||
| 50 | 100 | 250 | 500 | |
| PSO | 349 | 357 | 370 | 398 |
| GWO | 316 | 322 | 324 | 333 |
| FSA | 298 | 312 | 312 | 320 |
| GOA | 280 | 288 | 298 | 301 |
| MGOA | 262 | 269 | 278 | 283 |
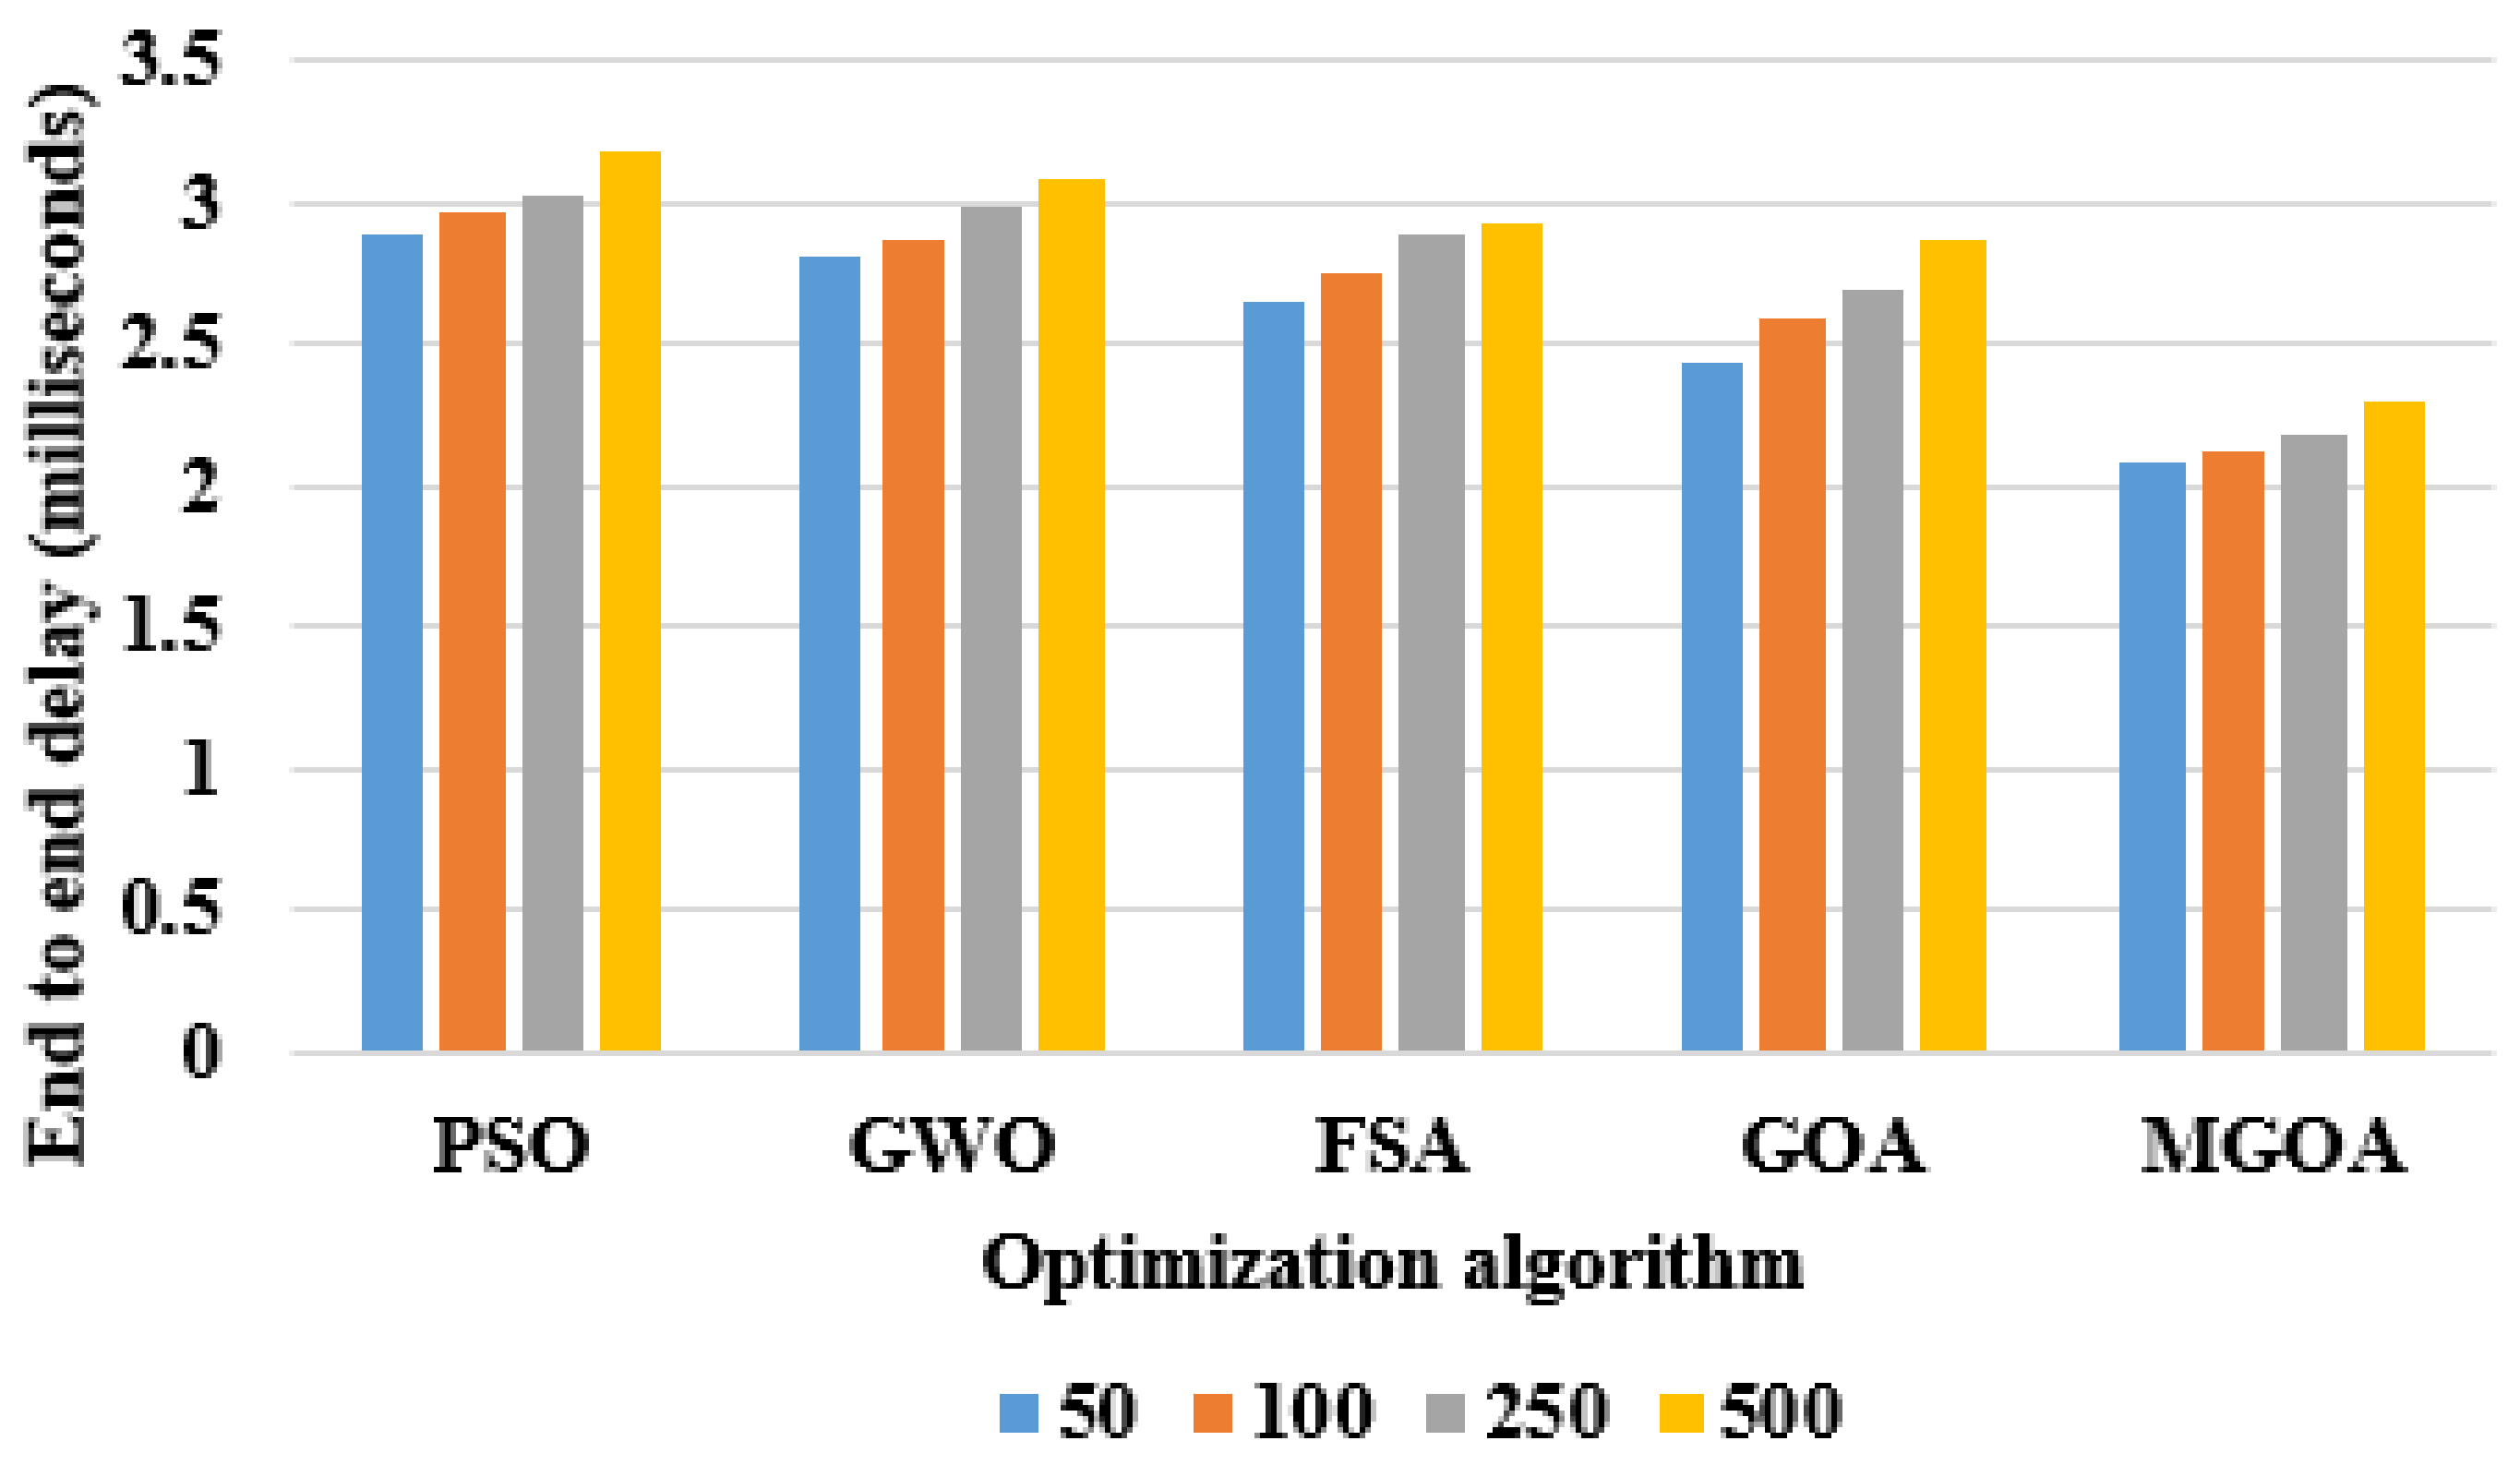
| End-To-End Delay (Milliseconds) | ||||
|---|---|---|---|---|
| Optimization Algorithm | Number of Nodes | |||
| 50 | 100 | 250 | 500 | |
| PSO | 2.89 | 2.97 | 3.02 | 3.18 |
| GWO | 2.81 | 2.86 | 2.99 | 3.09 |
| FSA | 2.65 | 2.76 | 2.88 | 2.92 |
| GOA | 2.44 | 2.59 | 2.70 | 2.86 |
| MGOA | 2.09 | 2.12 | 2.19 | 2.31 |
| Number of Nodes | Throughput (bit/s) | PDR (%) | Routing Overhead | End-To-End Delay (Milliseconds) | ||||
|---|---|---|---|---|---|---|---|---|
| DYRP-VLC [16] | MGOA-WAVLCN | DYRP-VLC [16] | MGOA-WAVLCN | DYRP-VLC [16] | MGOA-WAVLCN | DYRP-VLC [16] | MGOA-WAVLCN | |
| 50 | 546 | 594 | 90.74 | 93.28 | 279 | 262 | 2.39 | 2.09 |
| 100 | 507 | 589 | 86.33 | 90.12 | 283 | 269 | 2.46 | 2.12 |
| 250 | 486 | 553 | 80.74 | 88.90 | 296 | 278 | 2.52 | 2.19 |
| 500 | 439 | 544 | 78.11 | 84.10 | 304 | 283 | 2.64 | 2.31 |
Publisher’s Note: MDPI stays neutral with regard to jurisdictional claims in published maps and institutional affiliations. |
© 2021 by the authors. Licensee MDPI, Basel, Switzerland. This article is an open access article distributed under the terms and conditions of the Creative Commons Attribution (CC BY) license (https://creativecommons.org/licenses/by/4.0/).
Share and Cite
Vadivel, S.; Konda, S.; Balmuri, K.R.; Stateczny, A.; Parameshachari, B.D. Dynamic Route Discovery Using Modified Grasshopper Optimization Algorithm in Wireless Ad-Hoc Visible Light Communication Network. Electronics 2021, 10, 1176. https://0-doi-org.brum.beds.ac.uk/10.3390/electronics10101176
Vadivel S, Konda S, Balmuri KR, Stateczny A, Parameshachari BD. Dynamic Route Discovery Using Modified Grasshopper Optimization Algorithm in Wireless Ad-Hoc Visible Light Communication Network. Electronics. 2021; 10(10):1176. https://0-doi-org.brum.beds.ac.uk/10.3390/electronics10101176
Chicago/Turabian StyleVadivel, Sharmila, Srinivas Konda, Kavitha Rani Balmuri, Andrzej Stateczny, and B. D. Parameshachari. 2021. "Dynamic Route Discovery Using Modified Grasshopper Optimization Algorithm in Wireless Ad-Hoc Visible Light Communication Network" Electronics 10, no. 10: 1176. https://0-doi-org.brum.beds.ac.uk/10.3390/electronics10101176