Article

Automatic Identification Algorithm of Equivalent Electrochemical Circuit Based on Electroscopic Impedance Data for a Lead Acid Battery

by
Javier Olarte
1,2,3,
Jaione Martínez de Ilarduya
1,
Ekaitz Zulueta
3,
Raquel Ferret
2,
Unai Fernández-Gámiz
3 and
Jose Manuel Lopez-Guede
3,*
1
Bcare. C/Albert Einstein 48, 01510 Miñano, Álava, Spain
2
Centre for Cooperative Research on Alternative Energies (CIC energiGUNE), Basque Research and Technology Alliance (BRTA), Alava Technology Park, Albert Einstein 48, 01510 Vitoria-Gasteiz, Álava, Spain
3
UPV/EHU. C/Nieves Cano 12, 01006 Vitoria-Gasteiz, Álava, Spain
*
Author to whom correspondence should be addressed.
Submission received: 11 April 2021 / Revised: 28 May 2021 / Accepted: 4 June 2021 / Published: 6 June 2021
(This article belongs to the Special Issue Theory and Applications of Fuzzy Systems and Neural Networks)

Abstract

:
Obtaining tools to analyze and predict the performance of batteries is a non-trivial challenge because it involves non-destructive evaluation procedures. At the research level, the development of sensors to allow cell-level monitoring is an innovative path, and electrochemical impedance spectrometry (EIS) has been identified as one of the most promising tools, as is the generation of advanced multivariable models that integrate environmental and internal-battery information. In this article, we describe an algorithm that automatically identifies a battery-equivalent electrochemical model based on electroscopic impedance data. This algorithm allows in operando monitoring of variations in the equivalent circuit parameters that will be used to further estimate variations in the state of health (SoH) and state of charge (SoC) of the battery based on a correlation with experimental aging data corresponding to states of failure or degradation. In the current work, the authors propose a two-step parameter identification algorithm. The first consists of a rough differential evolution algorithm-based identification. The second is based on the Nelder–Mead Simplex search method, which gives a fine parameter estimation. These algorithm results were compared with those of the commercially available Z-view, an equivalent circuit tool estimation that requires expert human input.

1. Introduction

Batteries fulfill a vital function in many stationary applications, so any problem in a cell or module that could destabilize its energy storage capacity represents a significant expense. For instance, solutions based on the manual measurements of the state of health of the energy storage system involves high maintenance costs. If the review frequency is low, failures are not detected in time, the battery’s life expectancy is not maximized, and end-user has added expenses. In this framework, the integration of sensors at the cell level and the development and optimization of a Battery Management System (BMS) are important for creating batteries that can meet these requirements. The monitoring of the battery by the implementation of smart models and algorithms to the BMS permits the continuous collection of historical data, including the State of Charge (SoC) and State of Health (SoH), thereby minimizing battery failure. In addition, it can be identified continuously. This monitoring action would also reduce the maintenance costs associated with on-site visits. For example, the biggest challenge in lead-acid battery management is determining the health status of the battery throughout its life while optimizing operational and maintenance costs [1,2,3,4,5,6,7].
As the requirements of batteries increase in demand and complexity, the ability to understand, control, and predict battery performance becomes more important. It seems axiomatic that the identification and characterization of battery electrochemical models is crucial to predicting battery life and to controlling and understanding the battery itself. These models are based on interpreting electrochemical behavior with respect to a wide range of battery properties (performance, life span, and especially safety), and in this Electrochemical Impedance Spectroscopy (EIS) plays a remarkable role [6].
In summary, integration of smart EIS sensing and the extraction of key parameters produces a detailed understanding and evaluation of the battery, develops better energy management strategies, and enables smart SoC and SoH identification to improve performance. The review presented by Unguren et al. [8] includes a valuable updated comparison of the different types of models that have been used, mainly for electric mobility applications. This work focuses on the dynamic identification of electrochemical model parameters, as suggested by Kwiecien et al. [6]. The work of Lin et al. [9] includes an overview of the latest work in electric mobility, but there is still room to improve battery management algorithms, despite the enormous efforts made. Regarding possible improvements in the battery management system, thermal management is also important, as shown by the study by Jilte et al. [10]. Possibly one of the positive messages of this report is the importance of collecting as much experimental data as possible to implement incremental improvements in the models. Indeed, the more relevant models, which range from simple one-dimensional models to highly complex multi-dimensional coupled ones, as suggested by Olarte et al. [11], are be made by in operando electrochemical data, as in the case of this work.
The process of determining the SoC and SoH of batteries is challenging. Several imaginative monitoring approaches have been introduced that have generated a number of patents covering different technologies [12]. Over many years, this kind of research paid attention mainly to lead-acid technology to make it more accessible to customers. A number of advances in assessing the behavior of cell resistance upon cycling in Pb-acid batteries was made possible by the introduction of Electrochemical Impedance Spectroscopy (EIS), which evaluates the battery’s SoC and SoH by combining a set of direct measurements, namely, resistance, current pulse quantities, EIS, coulomb counting, and open circuit voltage-based approximations.
Numerous studies have reported different ways to estimate SoC and SoH variables, which can be divided into different categories: direct measurements, electrical and electrochemical models, and adaptive and machine learning methods [13,14,15,16]. For example, Chaturvedi et al. reviewed different algorithms for SoC and SoH indication and commercially available Battery Management Systems and concluded that SoC and SoH identification in vehicle batteries was still not accurate enough [13].
Among direct measurements, discharge test capacities can only be done at the beginning of a battery’s working life or for intermediate measurements of its SoH. However, this type of method, even if precise, cannot be incorporated into an intelligent diagnostic detection system by itself, as explained by Lukic et al. [17].
Some electrochemical models are based on coulomb counting, which can be very accurate but only if the initial input is valid, and for this high accuracy current sensors are required [18,19]. Open Circuit Voltage (OCV) measurement is used in lead-acid, lithium-ion or zinc/bromine batteries, which are based on the relation of the OCV to the SoC. The OCV is usually measured in off-line conditions, but it could be conducted on-line if the OCV is deduced from terminal voltage real values or suitable models.
Another method for making real-time predictions by interpreting parameters from the spectra is Electrochemical Impedance Spectroscopy (EIS). It is difficult to implement the electrochemical model because it depends on a specific technology [18], but it is expected to be very accurate. The last electrochemical model is Kalman filters, which can be implemented in all battery systems, although implementation entails a high level of difficulty.
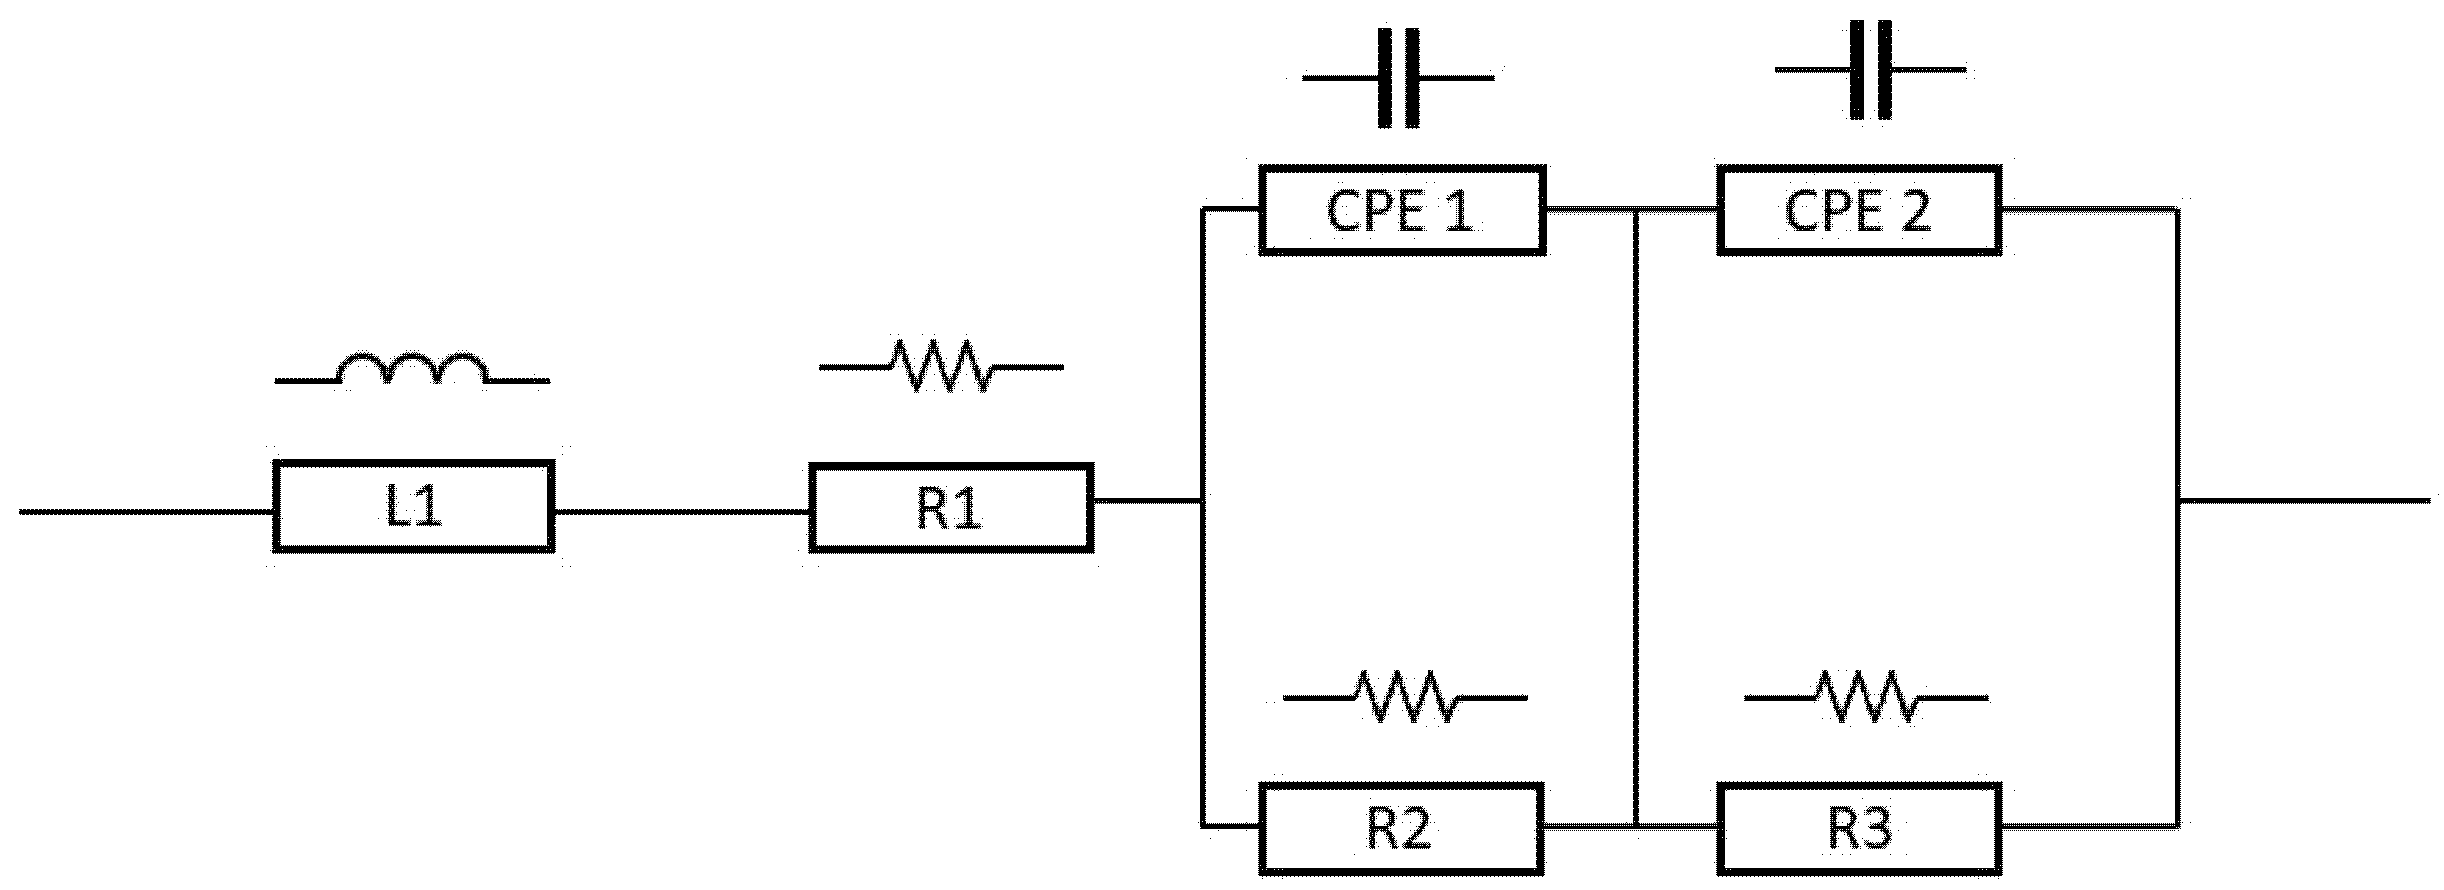
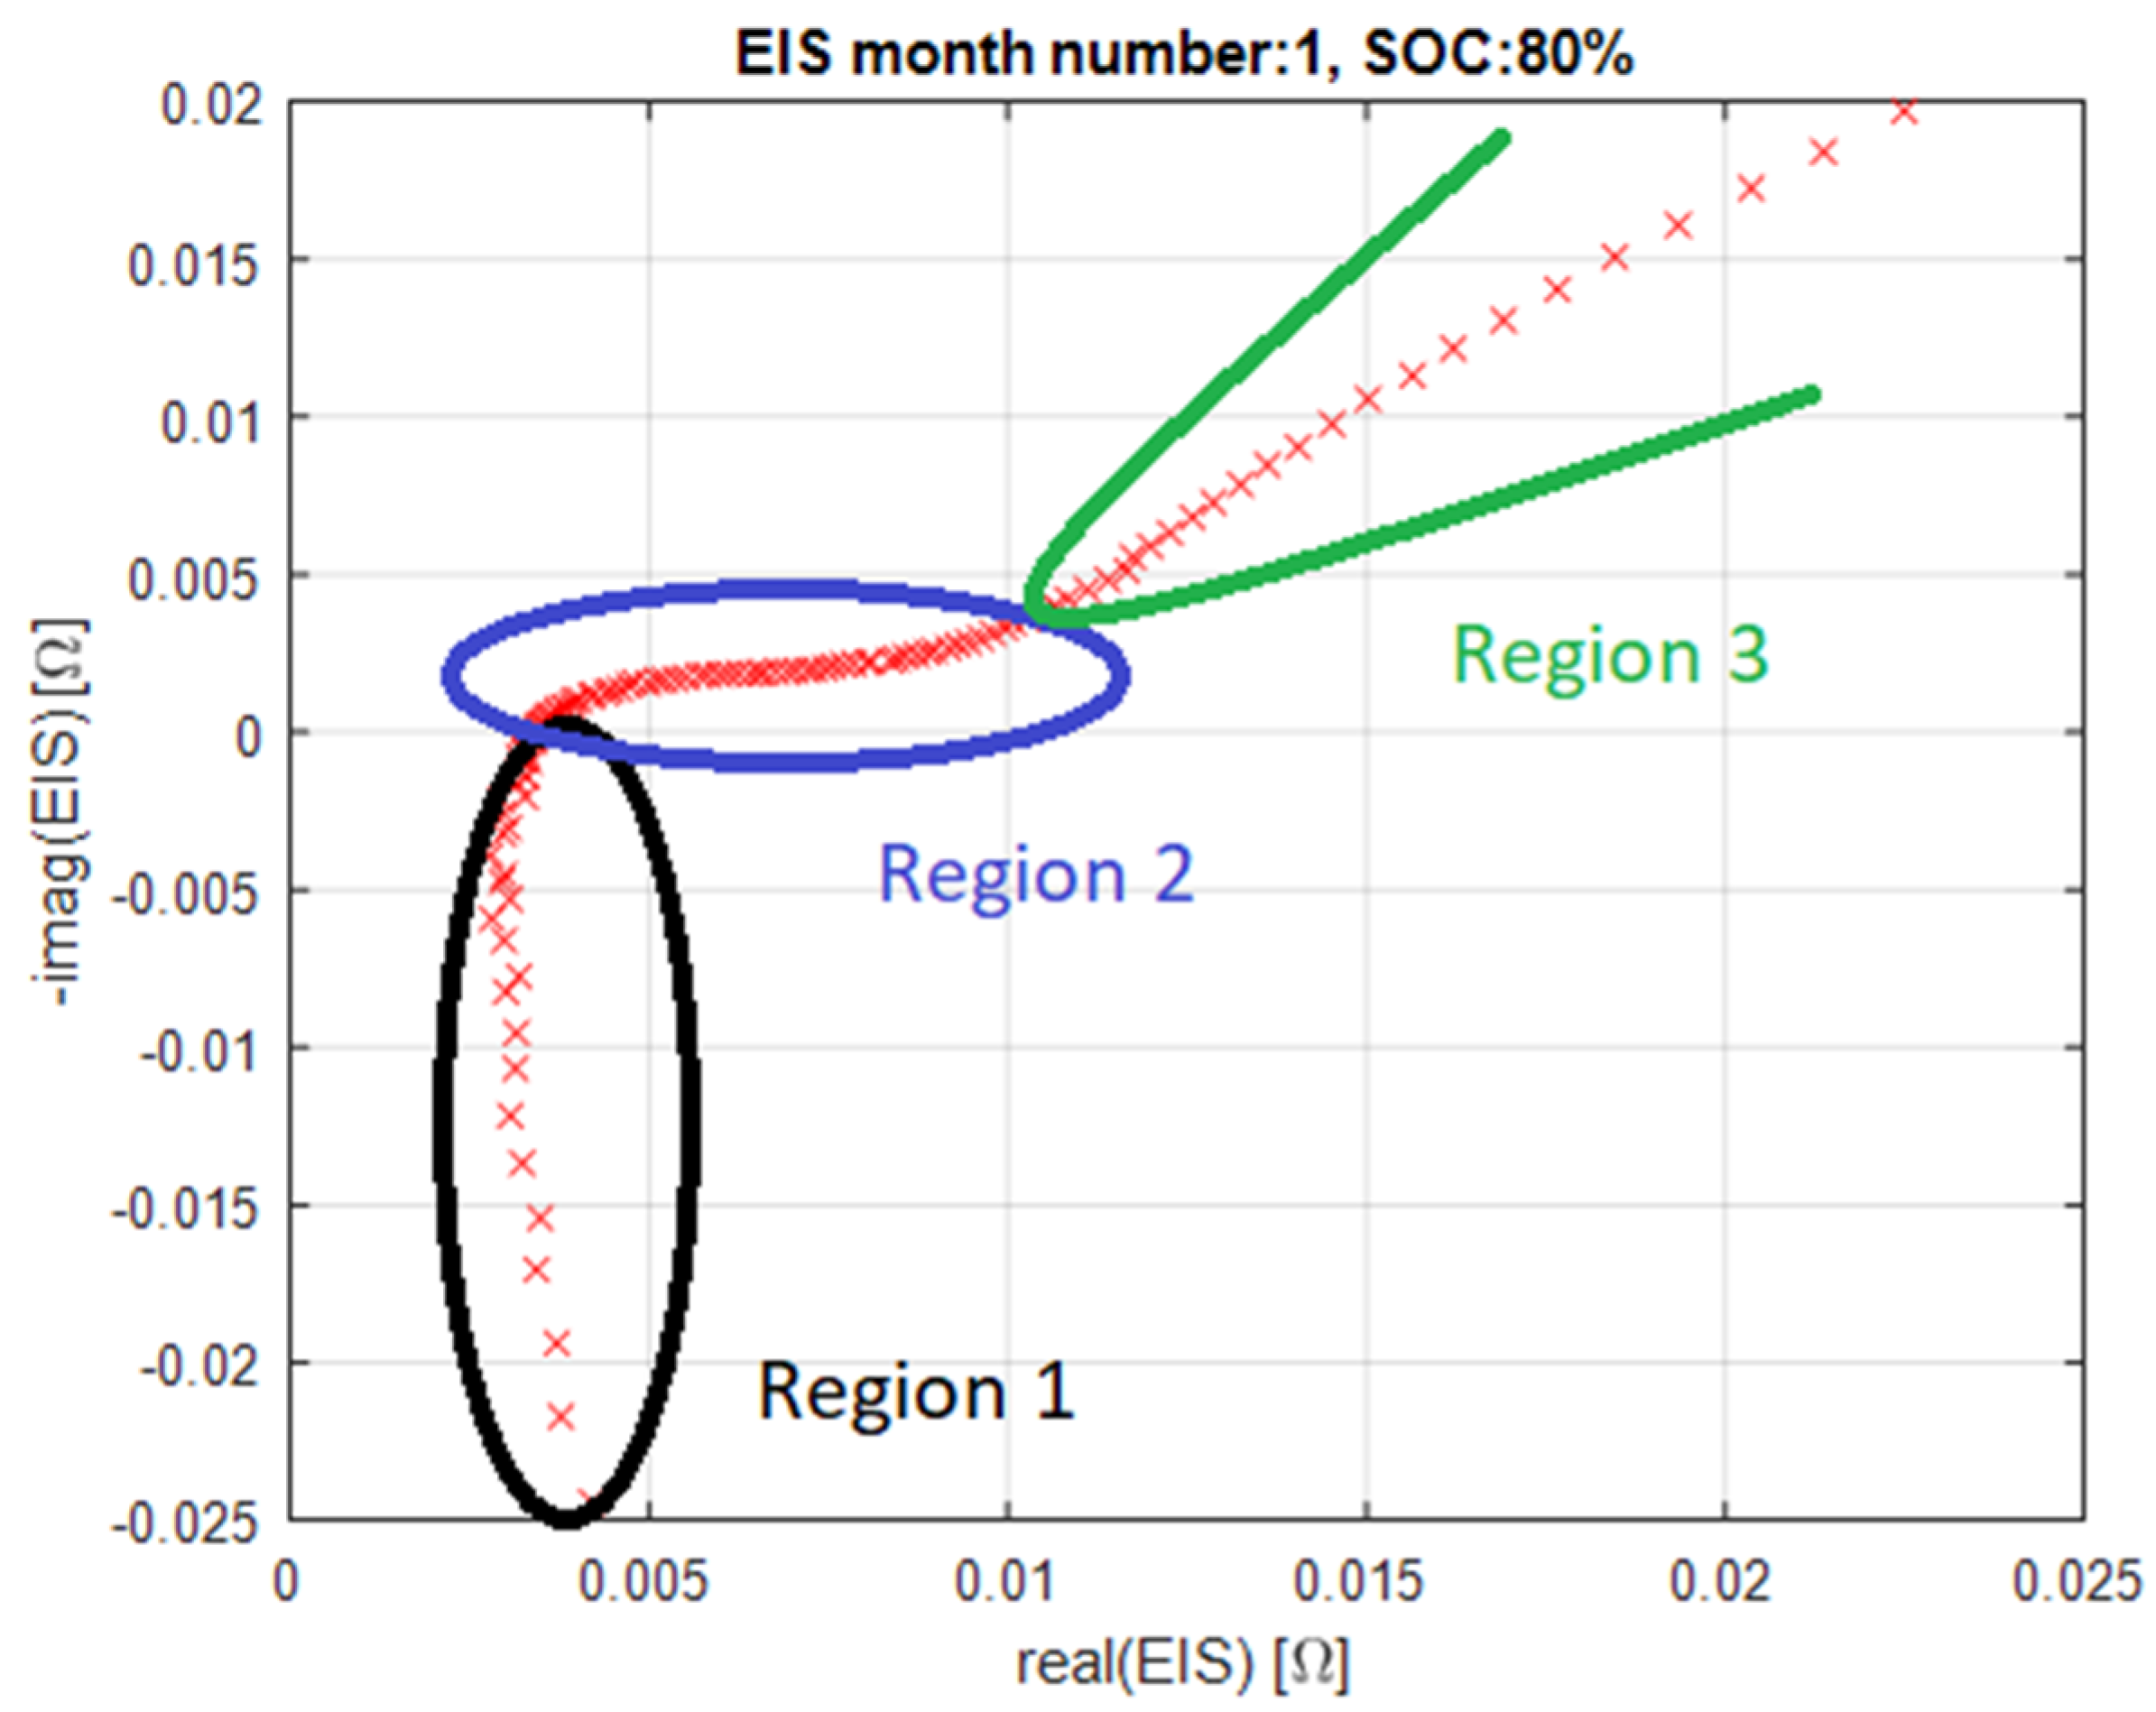
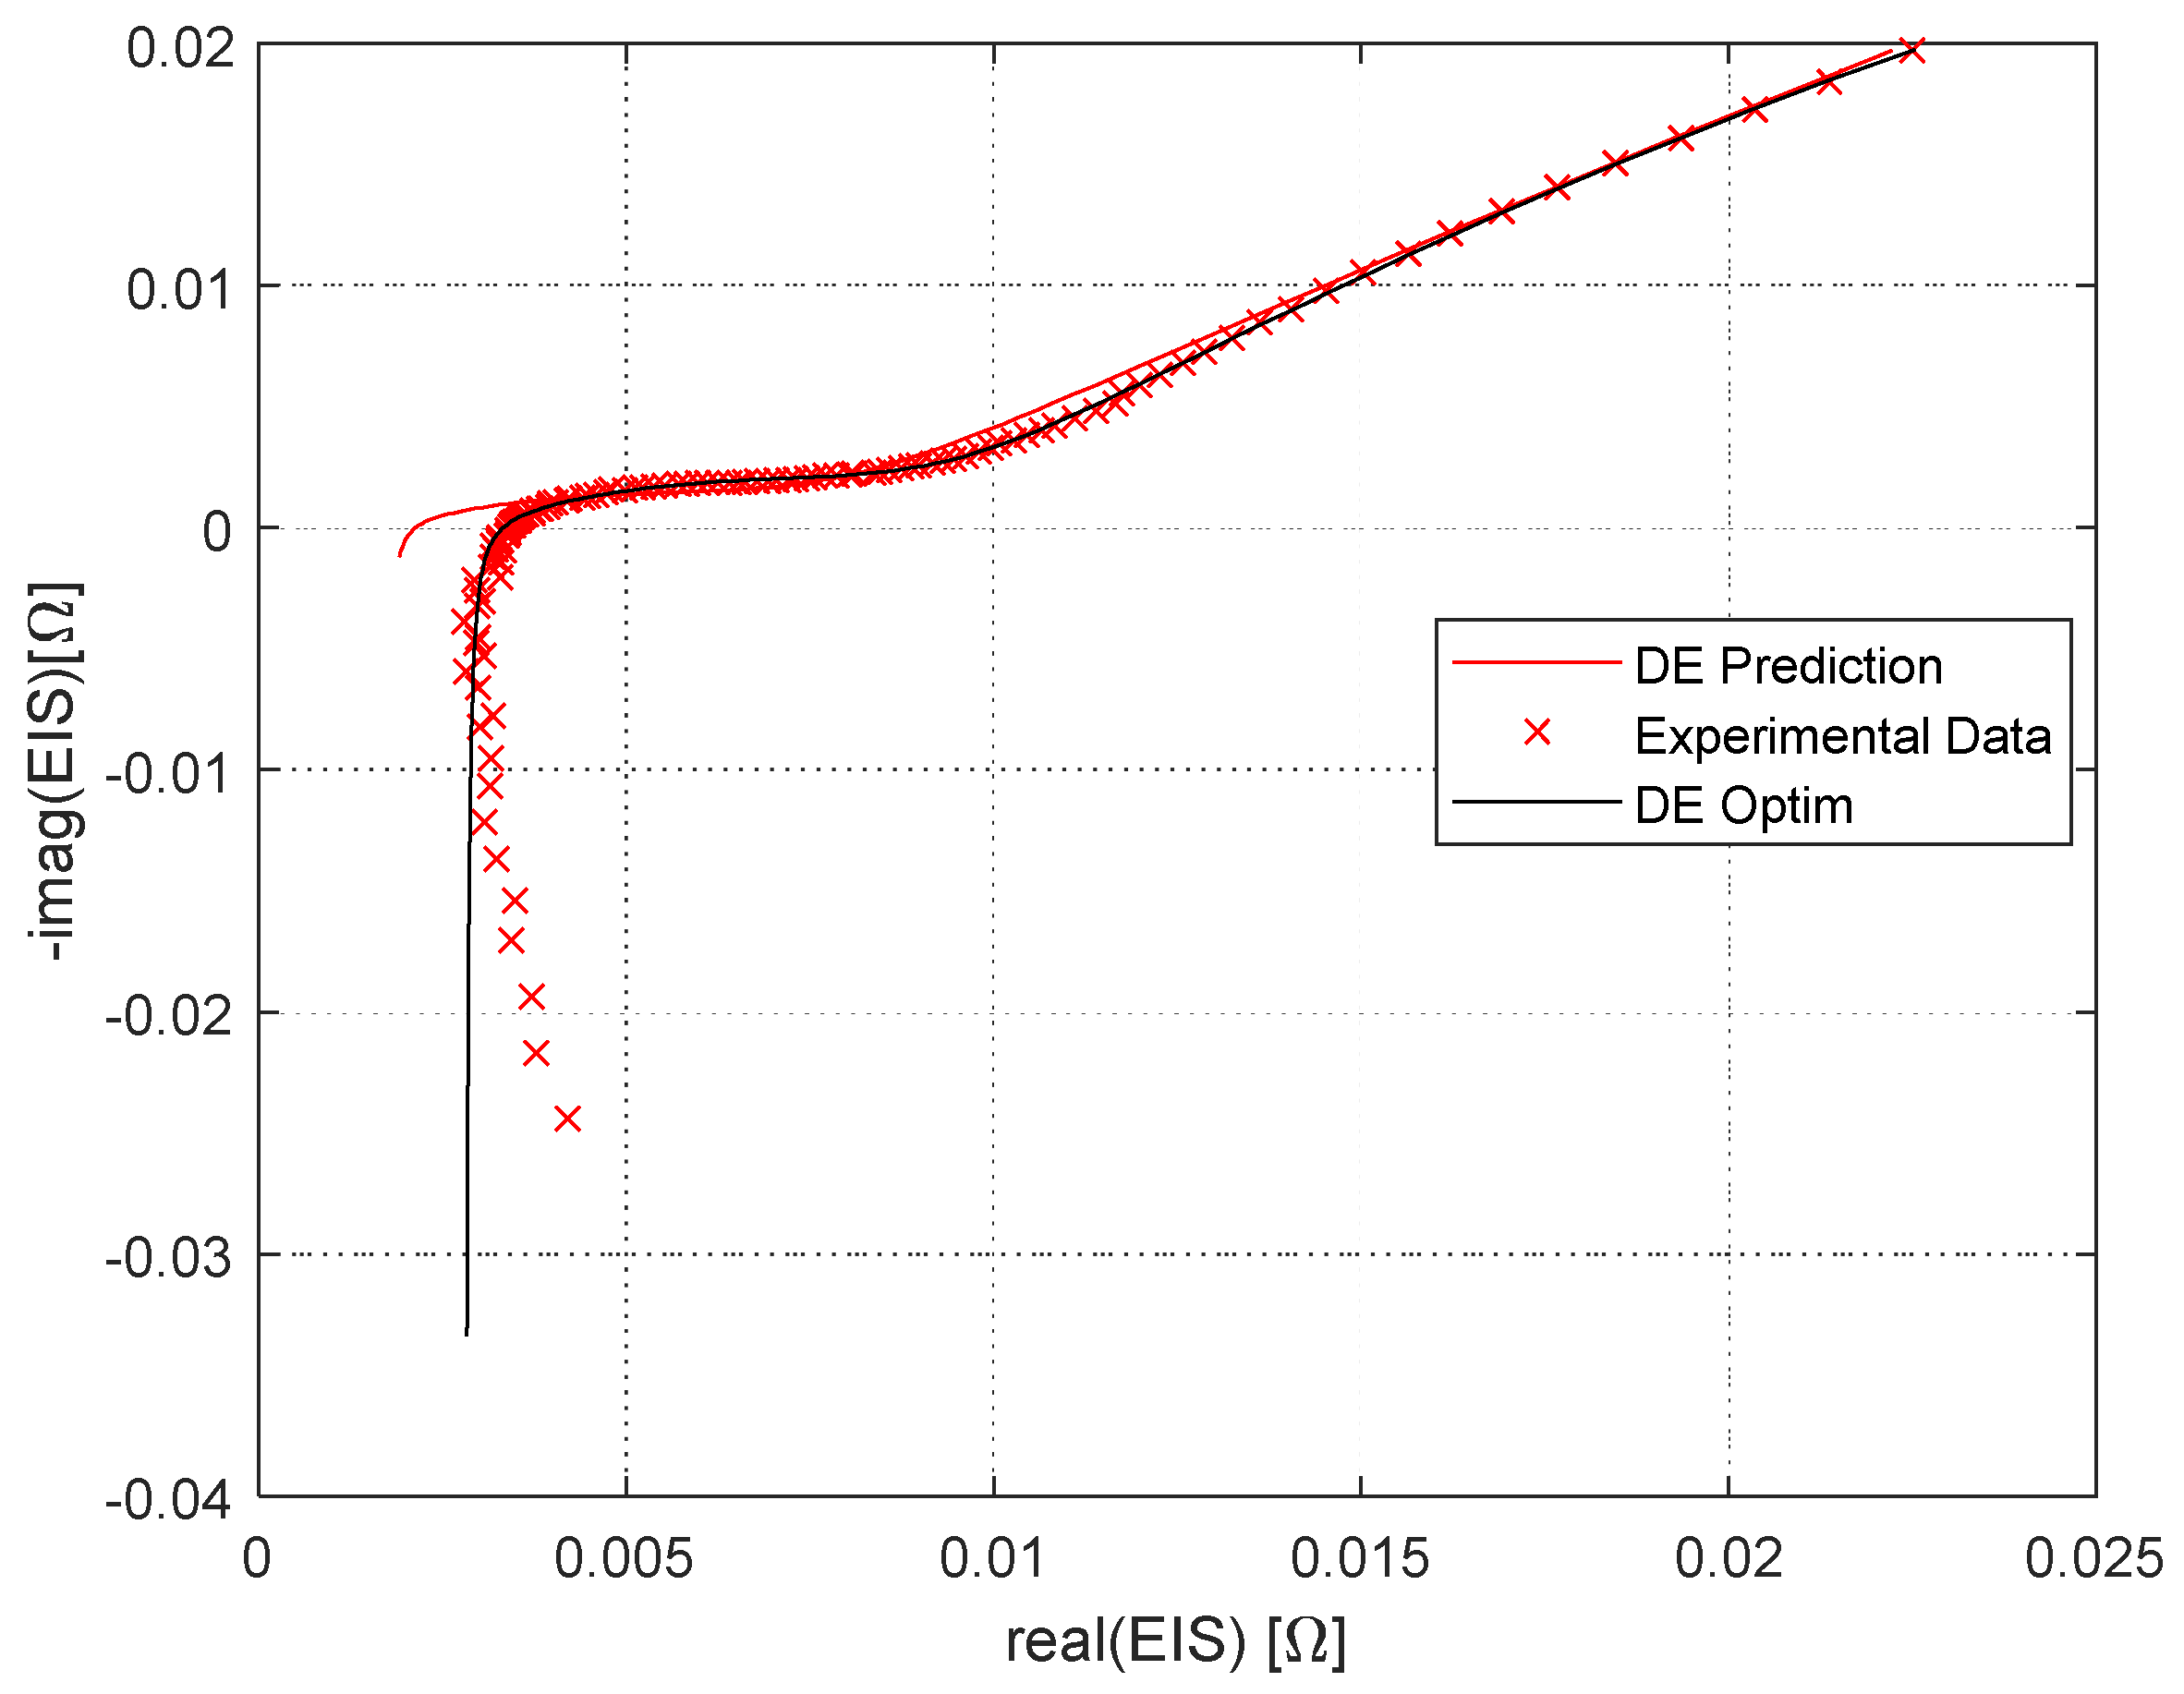
The difficulty in determining the parameters of the EIS spectrum lies in the development of an adequate and advanced algorithm that allows both automatic and reliable identification. There are different techniques for identifying system parameters, and the common laboratory approach consists of measuring the impedance spectrum of a cell’s frequency domain by means of a single sine-sweep signal. Then, the ECM parameters are fitted to the frequency domain. Among the authors who have developed work related to this topic, is Al Nazer et al., who presented a two-step method, although initial expert background to define the initial parameter values was necessary [20]. Nasser-Eddine et al. presented a two-step identification method combining chronopotentiometry and EIS [21]. Gonzalez et al. used a self-adaptive differential evolution algorithm for metal coating systems that had only been tested with experimental inputs [22]. On the other hand, the study of Alavi et al. [23] paid attention to the estimation of ECM parameters directly from data gathered in the time domain. That technique could have practical applications for parameter estimation in battery-powered vehicles. In addition, Zou et al. [24] presented a critical synopsis of fractional-order techniques for dealing with lead-acid batteries, lithium-ion batteries, and supercapacitors. In the study of Ramos et al. [25], an improvement in the gene expression programming of specific details of implementation was presented with pre-embedded knowledge to improve the efficiency of identifying circuits in impedance spectroscopy. On the other hand, a convolutional neural network (CNN) was used by Chun et al. [26] to predict or prevent problems by observing the inner states of lithium-ion batteries.
In this paper, direct measurements based on the analysis of EIS impedance spectra were used to determine the electric equivalent circuit (EEC) parameters. Changes or variations in value based on a correlation with experimental EIS data from aging batteries corresponding to known states of failure or degradation allowed the fast mapping to SoC and SoH in combination with additional historical operational data of the battery system. Regarding the EIS impedance measurement, different authors made comments. According to Baccouche et al. [19], this method is very reliable as it presents high accuracy; however, it could be very time consuming and hard to implement. According to Rivera-Barrera et al. [15], this estimation method is only suitable for identical charging conditions. According to Chang [14], impedance measurements are very versatile in that they give information about many parameters, such as SoC, battery degradation, and failure modes.
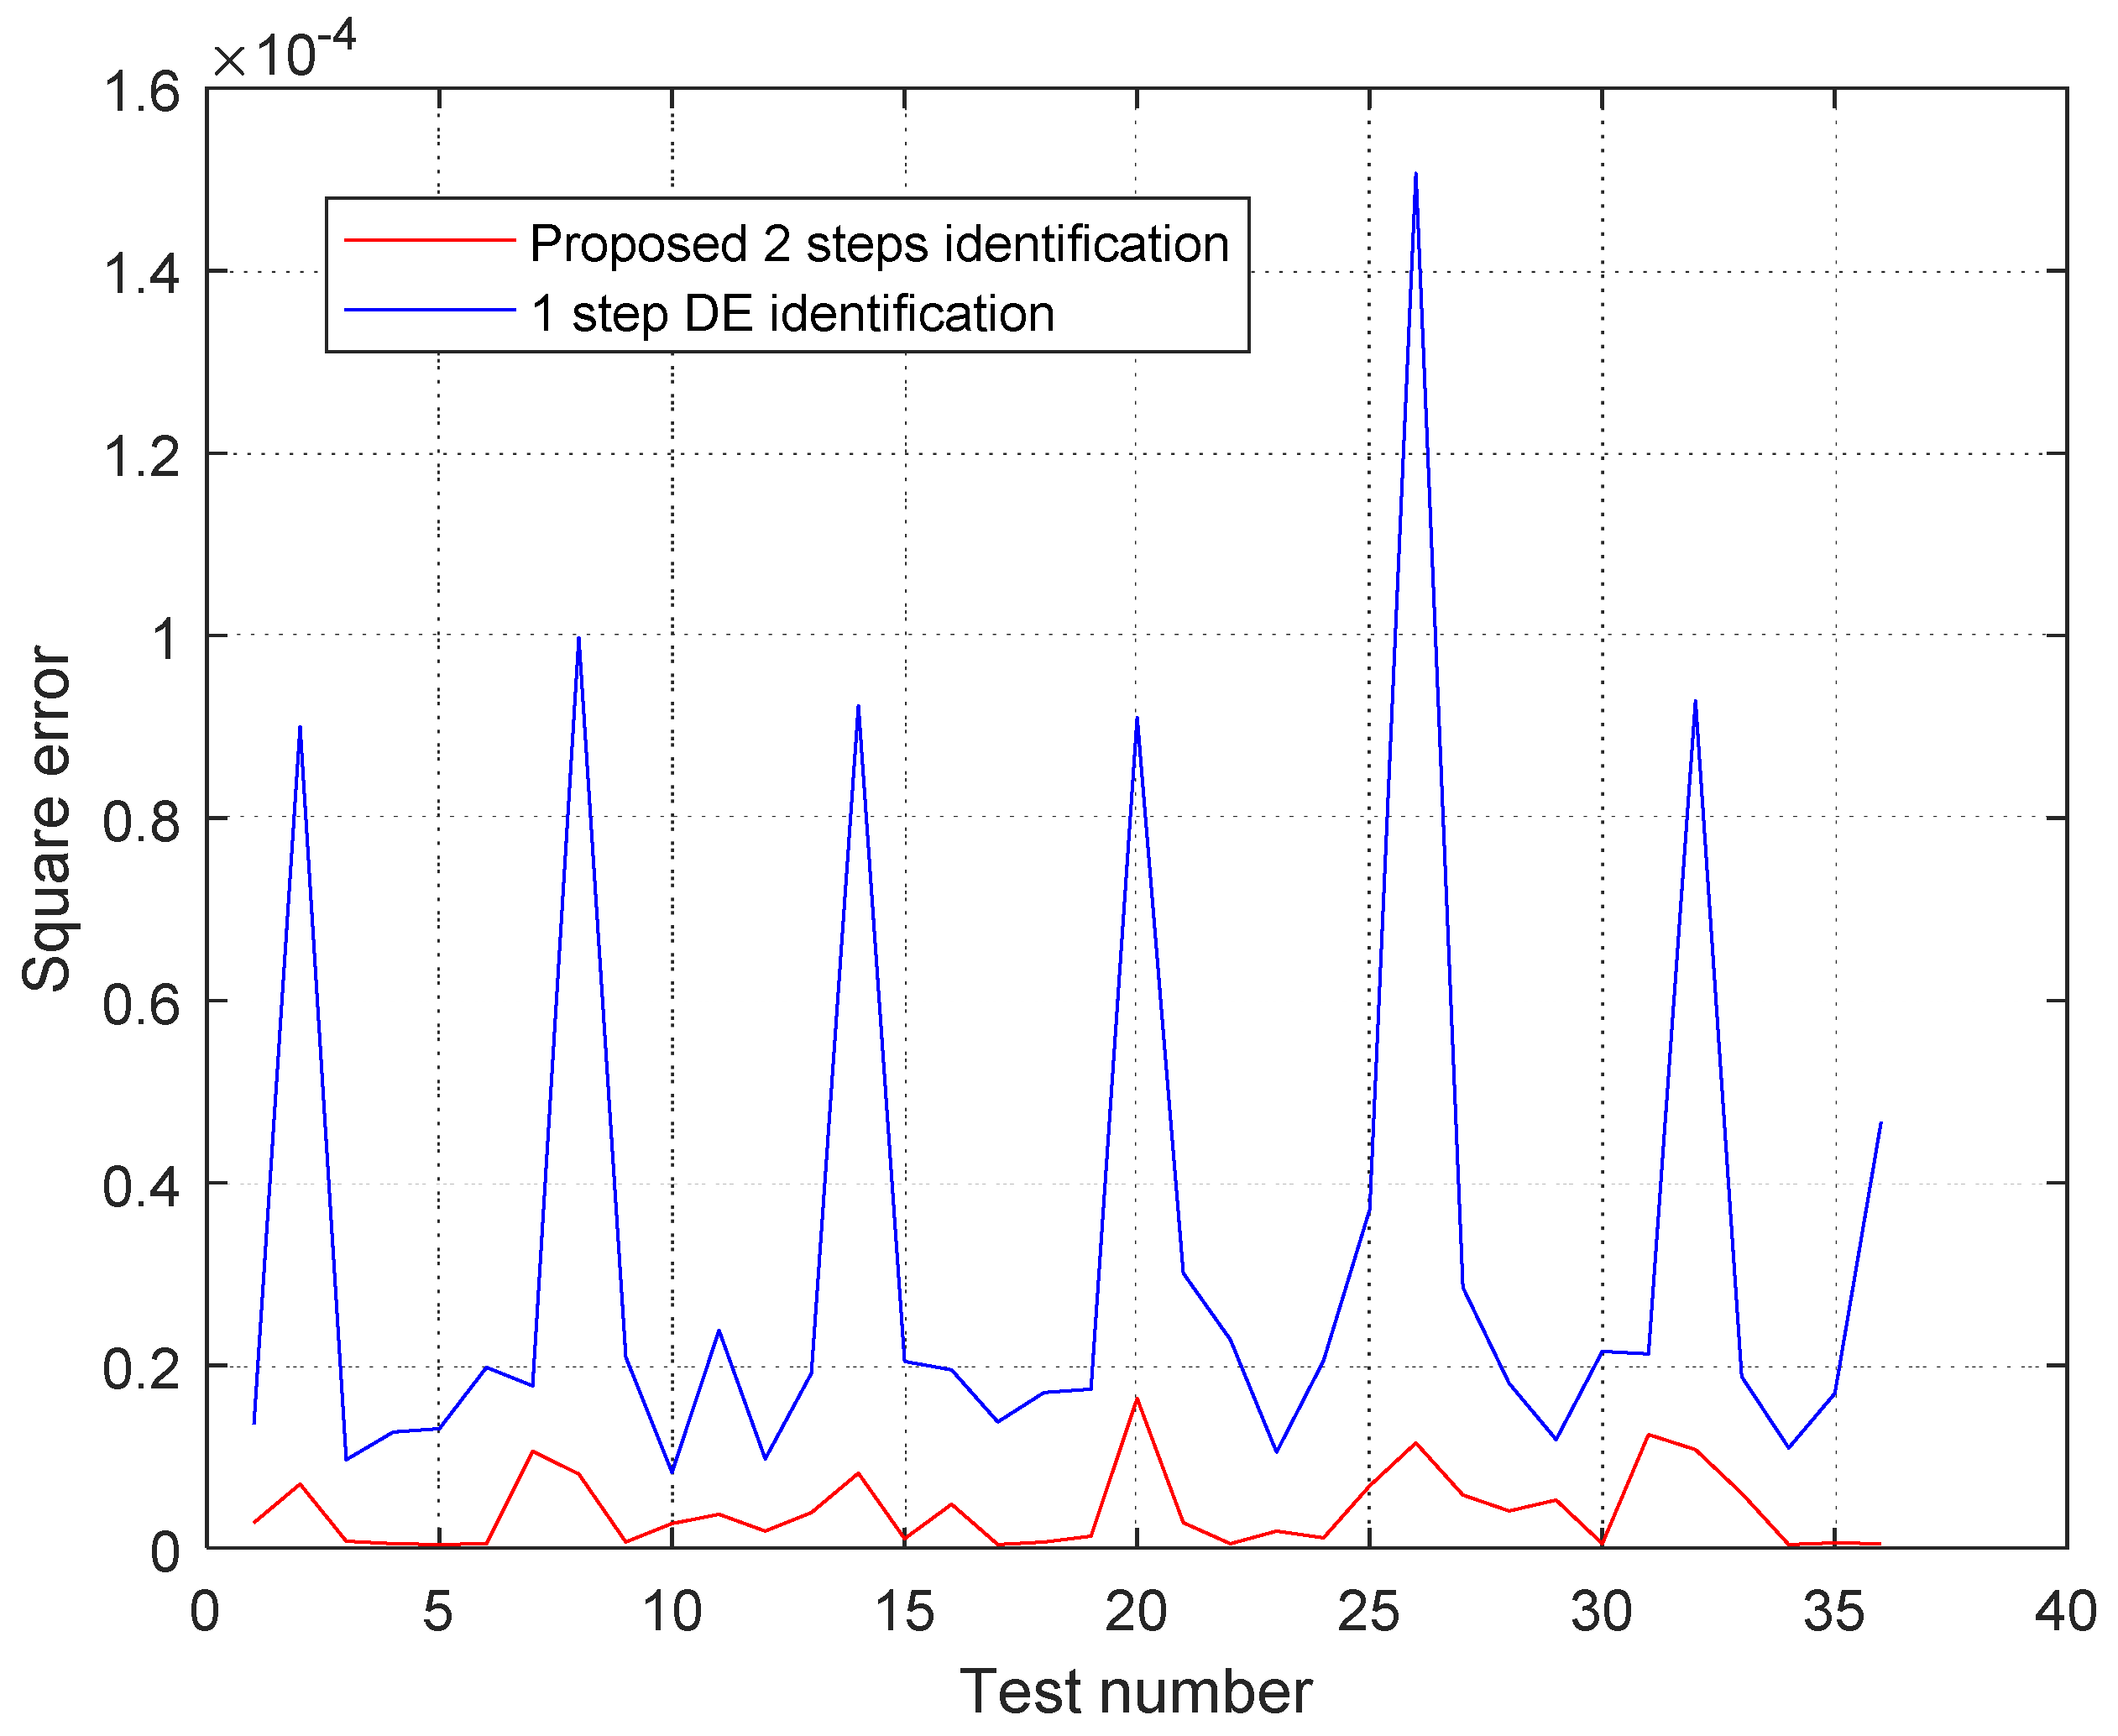
The main innovation of the present work consists of proposing a new model to improve the certainty of EEC parameter estimation from EIS. The process of identification and use of parameters is interactive, which allows for the integration of more experimental variables. As important as developing an efficient and highly accurate algorithm of battery EEC parameters may be, it must also be implemented economically in hardware integrated into an advanced Battery Management System (BMS). A valuable part of the work to be done is inspired by the guidelines defined by the European Commission [12], which shares the objective of this work, i.e., the development of economical and efficient sensors. In this manner, this work has directed efforts to implement a computationally efficient yet robust algorithm that can be used in a low-cost device. With the implementation of the present algorithm, lead-acid batteries may become zero-maintenance because the adjusted predictions of the remaining useful life (RUL) and historical data records would allow continuous improvement that would improve overall performance, cycling strategies, battery safety and operation, and maintenance costs.
The remainder of the manuscript is structured as follows: Section 2 describes the aging data and the identification methods used to characterize battery impedance. Section 3 presents the main results of the identification process setup and the set of identified parameters. Finally, the main conclusions and future directions are summarized in Section 4.

2. Aging Data and Identification Methods

2.1. Aging Tests and Electrochemical Data Logs

The work is based on the aging and measurements of four lead-acid battery models from different manufacturers. These have between 80 and 100 Ah and 12 V, with improved performance at high temperatures compared to standard lead-acid batteries. They contain an anode of metallic lead (Pb), while the cathode consists of a paste of lead oxide (PbO2). Between the electrodes is a porous separator impregnated with an electrolyte consisting of an aqueous acid solution of H2SO4. First, a standard characterization is performed to extract electrical parameters as inputs for the electrochemical model to characterize the SoC at standard C-rates, such as C/10. (The C-rate is a measure that governs the current at which a battery is charged and discharged. The capacity of a rechargeable battery is commonly rated at 1 C, meaning that a 1000 mAh battery should provide a current of 1000 mA for 1 h.)
Second, aging tests were developed based on the load profile for the stationary case application. These induced accelerated aging through a number of temperature profiles and modified cycling frequencies. In both type of tests, standard and aging characterization, the testing protocol included the constant current (CC) and constant voltage (CV) charge stages. Periodic impedance measurements were taken at different SoC levels and SoH stages (in the case of accelerated tests), at Δh% = 20. At each SoC level, a 12 h relaxation time was established before performing the impedance measurement under an excitation current of 50 mA and in a frequency range from 10 mHz to 10 kHz. From these accelerated aging tests, suitable parameters/signals from the electrochemical system were extracted for integration into the model to determine the SoH for the lead-acid batteries. This testing protocol included voltage, current, temperature, and EIS spectra identification at different operational conditions. Figure 1 illustrates the equivalent circuit model proposed by the authors because all experiments showed inductive behavior at high frequencies and a circular shape spectrum at medium frequencies. At low frequencies, another lager circular shape spectrum is shown. The EEC was selected to monitor variations in impedance and resistance as well as charge transfer and diffusion phenomena, to allow us to monitor or detect variations in battery failure modes. The algorithm proposed in this work can be used with other associated EECs to monitor other interpretations of the electrochemical processes and dynamics in other batteries.
During both tests, electrochemical data from the EIS spectra and EEC parameters are recorded in logs. Specifically, this EEC is selected with constant phase elements so that the experimental data can be adjusted. Non-ideal capacitive behavior of an electrode (suppressed semi-circles on the Nyquist plot) are taken into account, and a constant phase element (CPE) is used (see Equation (1)), which is a capacitor with a leakage parameter of α. If the parameter is 1, the element is a pure capacitor (see Aksal et al. [1]).
Z C P E = 1 C ( i ω ) α
Using the gathered data, tendencies are analyzed, and complete electrochemical models are developed for each lead-acid battery.

2.2. Data Processing, Proposed Intelligent Identification Algorithm, and Cost Function

EIS is a faster technique for identifying the SoH and the SoC of lead-acid batteries provided that the data sets have been interpreted using a convenient EEC model. This section explains the mathematic expression of the EIS based on an equivalent electrical circuit from the previous section. From circuit theory, it follows that the EIS of the battery is given by Equation (2):
Z E I S = Z R 1 + Z L 1 + Z R 2 | | C P E 1 + Z R 3 | | C P E 2
Taking into account that the EEC consists of the simple electrical circuit elements R, L (and in this case constant phase elements (CPEs)), Equation (2) can be expressed as Equation (3):
Z R 2 | | C P E 1 = R 2 ( R 2 C 1 ω α 1 · ( c o s π 2 α 1 j s i n c o s π 2 α 1 ) + 1 ) R 2 2 C 1 2 ω 2 α 1 + 2 R 2 C 1 ω α 1 c o s π 2 α 1 + 1
The same procedure is followed for CPE2:
Z R 3 | | C P E 2 = R 3 ( R 3 C 2 ω α 2 · ( c o s π 2 α 2 j s i n c o s π 2 α 2 ) + 1 ) R 3 2 C 2 2 ω 2 α 2 + 2 R 3 C 3 ω α 2 c o s π 2 α 2 + 1
To understand the previous equations, the following parameters need to be explained:
j = imaginary number (j2 = −1)
= angular frequency (rad/s)
α = constant phase angle of the CPE (rad)
R = resistance (Ω)
C = capacitance (F)
L = inductance (H)

2.3. Proposed Intelligent Identification Algorithm

There are different types of algorithms for solving complex problems, and because of them we have a better understanding of lead-acid battery behavior such as the SoC and SoH.
Current research proposes the so-called differential evolution (DE) algorithm, which was first proposed in 1997 [27]. As is the case with Particle Swarm Optimization (PSO), DE is a noncomplex but powerful population-based stochastic search technique. As presented in Aramendia et al. [28], different agent sets are proposed by DE, and all agents follow the same procedure to improve the resulting agent set, evaluation, crossing, mutation, and selection. The three main vectors are described as follows:
  • Target vector: The solution undergoing evolution used in mutation to generate a donor vector.
  • Donor vector: Undergoes recombination to obtain the trial vector.
  • Trial vector. An offspring formed by recombination of the donor with the target vector.
The set of variables to be optimized in this case were R 1 , L 1 , R 2 , C 1 , α 1 , R 3 , C 2 , and   α 2 , which were real, so they were arranged or codified in a vector. The length of the resulting vectors (N) was the same as the number of variables. The nomenclature X p g was used to define a vector, where p indicated the individual population (p = 1… NP), g was the corresponding generational number, and NP is the agent number. The candidate solutions are defined in Equation (5):
X p g = { x p , m 1 ,   ,   x p , m g }
where m = 1 … n. The DE algorithm is composed of four steps:

2.3.1. Initialization

The population was generated randomly without exceeding either the maximum or minimum limits, as described in Equation (6):
x p , m 1 = x m m i n + r a n d ( 0 , 1 ) · ( x m m a x x m m i n )
where p = 1 … NP and a uniformly distributed random variable within the range [0, 1] is represented by rand (0,1). This equation corresponded to generation 1 (g = 1).

2.3.2. Mutation

In the mutation operation, three random solutions ( X r 1 , X r 2 , X r 3 ) were selected from a population of solutions. These solutions could not be identical. The donor vector was achieved with Equation (7):
V p g = X r 3 + F · ( X r 1 X r 2 )
where p = 1 … NP; F is a scaling factor, a positive control parameter between (0,2) that scales the difference vector. For its target, X p ,   g , at generation g, the associated donor vector, V p g = { v p , g 1 ,   ,   v p , g m } , can be generated.

2.3.3. Recombination

This operation increases the diversity of the population. The crossover operator generates a trial vector, T p g = { t p , g 1 ,   ,   t p , g m } , out of each target vector, X p ,   g , and corresponding donor vector, V p ,   g . For simpler implementation, the DE algorithm employs a binomial (uniform) crossover operator, as defined in Equation (8)
t p , m g = { v p ,   m g   i f   r a n d ( [ 0 , 1 ] ) < G R x p , m g   i f   a n y   o t h e r   c a s e    
where m = 1 … n, p = 1 … NP, and GR is the crossover rate, which actually is a constant defined by the user and has a value constrained by the range that controls the fraction of parameter values copied from the donor vector; v p ,   m g is a variable of the donor vector, x p , m g is a variable of the target vector, and t p , m g is a variable of the trial vector.

2.3.4. Selection

The selection operation is determined by Equation (9):
X p g + 1 = { t p g   i f   f ( t p g ) f ( X p g ) X p g   o t h e r w i s e    
where f ( T p g ) is the objective function value of each trial vector and is compared to that of its corresponding target vector, f ( X p g ), with the current population. If the objective function value with the trial vector is less than or equal to the corresponding target vector, then the target vector will be replaced by the trial vector and enter into the next generation population. Otherwise, there will be no changes and the target vector will be kept for the next generation population. The previous three steps are repeated for an undetermined number of generations until specific termination criteria are reached.

2.4. Cost Function

As highlighted in the study of Martinez-Rico et al. [29], the optimization problem covers the objective of minimizing the loss of value. To know this loss of value, the following cost function, determined by Equation (10), is proposed:
J = µ = 1 µ = N s a m p l e s | | Z E I S e x p ( ω µ ) Z ( , ω µ ) | | 2
where = [ R 1 , L 1 , R 2 , C 1 , α 1 , R 3 , C 2 , α 2 ] and ω µ = angular frequency. This angular frequency vector has 121 different frequencies, as defined by N samples.
According to Equation (10), it is possible to know the difference between the experimental values and the values of the proposed battery model, both the real and the imaginary parts. The experimental values were obtained as a function of different frequencies. Instead, the electrochemical impedance spectroscopy (EIS) of the model depended on several parameters, specifically the parameters, which, as mentioned in the differential evolution algorithm part, were the ones that must be optimized to achieve the least possible loss of value.

2.5. Fine Parameter Identification Process

The Nelder–Mead Simplex method is a well-known optimization procedure. Its main disadvantage is that it must be near the optimal point because this algorithm can stop at local minima points. Nevertheless, the main advantage of this algorithm is its good convergence to a minimal point. Therefore, we combined it with DE to achieve a good set of identification parameters. This set was the initial value for the second step of parameter identification.

2.6. Test Definition

A total of 36 tests were performed over 5 months. The first was a discharge cycle test from 100 to 0% of the SoC. The exact SoCs evaluated were 100, 80, 60, 40, 20, and 0%. The battery was kept at 25 °C the whole time. Once the discharge cycle was finished, it was again charged to 100%, and the battery was kept in a floating state for a whole month. Afterwards, another discharge cycle started; therefore, the authors conducted 36 EIS experimental tests for each battery model after 5 months: 6 monthly tests with 6 SoCs. The tests had 121 frequencies with a logarithmic span as shown in Table 1.

3. Results

3.1. Identification Process Setup

The authors studied different optimization algorithms to match a parameter set-generated spectrum to the experimental spectrum. This issue was explained in Equation (10), and the corresponding frequencies are shown in Table 1. The first-step differential evolution algorithm options are included in Table 2, and the second-step Nelder–Mead Simplex algorithm options are in Table 3.
The parameters/variables ρ and χ correspond to the reflection and expansion coefficients, respectively. The values presented in Table 3 are well-known as the best values for the Nelder–Mead Simplex method given by Lagarias et al. [30].
To improve convergence, DE algorithms were normalized between 0 and 1, and in the second step, we conducted the same normalization. The identification of parameters to set maximum and minimum normalized values is included in Table 4. These parameter set values were proposed by the experience obtained from the test data.
The parameters shown in Table 4 are the outputs of the proposed identification process. They had to be set to match the experimental EIS test data and were usually identified using commercial standard software, which needed high human expertise to obtain reliable matches with the experimental EIS data tests.

3.2. Identified Parameter Sets

The authors compared the cost functions obtained from DE and from DE combined with the Nelder–Mead Simplex method to improve the optimization of cost function values. J D E p r e d i c t i o n is the optimization cost function value with unique DE optimization. J D E o p t i m is the two-step optimization. Figure 2 illustrates the square errors obtained from one-step DE-based identification and the two-step identification square errors. According to the results presented in Figure 2, the proposed identification improved significantly.
This optimization combined the exploration capability of DE with the fine convergence of the Nelder–Mead Simplex method as shown in Equation (11), where the improvement metric was defined. The authors compared these two methods with the mean square error. In Equation (10), the authors showed the applied metric. As the electrochemical impedance spectroscopy (EIS) data were complex-valued sample sets, the authors applied a complex number module to the error between the test and models data, which is the standard measurement technique for complex data. The authors reduced the ratio between the mean square errors obtained from the two-step identification and the one-step DE-based identification. The summary of all improved results is shown in Table 5.
In Figure 2, the x axis is the one-step DE-based identification RMSE and the two-step identification RMSE. The y axis is the test reference.
I m p r o v e m e n t   % = 100 · J D E p r e d i c t i o n J D E o p t i m J D E p r e d i c t i o n
In Table 5, the mean and standard deviation improvement values relating to one differential evolution optimization are shown. The improvement is related to the RMSE obtained from the two-step optimization compared with the RMSE obtained by only taking into account the first-step optimization using DE.
In all tests, two-step optimization results were an improvement over one-step optimization. The first step gave a good approximation, but after a good parameter value set was proposed, the second-step optimization made a fine parameter fitting. In fact, the second algorithm had a fast convergence if it started close to the optimal solution. This second algorithm needed fewer iterations to make a fine fitting and a suitable initialization point. Consequently, the authors propose using DE to obtain a good starting point for the second optimization step.
Figure 3 shows the EIS experiment results. This Nyquist diagram illustrates three different regions: Region 1 has the contribution of the inductance and the ohmic resistance (L1 and R1 parameters, see Table 4) with high frequency samples; Region 2 is related to the first CPE parallel to the R2 identification parameter, which is usual for characterizing a circular EIS spectrum with these two elements; Region 3 is characterized as a larger circular spectrum, and for this reason, a characterization with a second CPE element parallel to R3 was made. In total, 36 experiments were carried out and all spectra showed similar behavior with these three different regions. Consequently, the equivalent circuit schema described in Figure 1 was proposed.
Figure 4 represents the same experiment presented in Figure 3, with identification results added to the experimental samples represented by red crosses. The red line represents the DE optimization-based identification results, and the black line represents the two-step optimization-based identification results. Figure 4 shows that DE optimization gave a reasonably good parameter identification, but it was not fine enough (see red line). The parameter identification based on the two optimization steps represented by the black line gave a much better identification performance.
In Figure 4, authors show that the two-step identification-based model (black line) showed better performance than did the one-step identification model (red line). The experimental data are identified by red crosses. The one-step identification model did not match Region 1 at all (defined in Figure 3), but the two-step identification model matched Region 1′s data very well. In Region 2, both models were good enough to match the experimental data. Finally, in Region 3, the two-step identification model matched the experimental data very well, even in the transition between Region 2 and 3; however, the transition between Regions 1 and 2 did not match the one-step identification correctly.
Note that 36 figures with experimental data were added as supplementary material. In addition, another 36 figures with graphic comparisons between the one-step DE and the combined DE–Nelder–Mead Simplex method were added. To confirm the efficiency of the identification proposed, 36 EIS experimental tests for each battery model were conducted after 5 months for a total of 6 monthly tests with 6 SoCs (100, 80, 60, 40, 20, and 0%). In emf format files named OptimizationResults_month_X_SOC_Y, the authors showed the identification results and the experimental data in X month with Y SoC. In emf format files named month = X SOC = Y, the authors showed only the experimental data in X month with Y SoC.

4. Conclusions

In summary, we proposed the use of an automatic algorithm to identify variations in the parameters for a given EEC. Usually, conventional identification needs expert human support to guide the identification results. The proposed algorithm allows in operando monitoring of the variation of the EEC parameters to further estimate changes or variations in the battery’s state of charge (SoC) and state of health (SoH) based on a correlation with experimental aging data associated with states of failure or degradation. The authors proposed a reliable alternative for improving the parameter identification time of an EIS: A two-step optimization algorithm. In that way, the best characteristics of each algorithm were applied in the identification process.
Even though the proposed algorithm was shown to be robust enough, there is still room for improvement by gathering more experimental data and conducting a post-mortem analysis. These improvements will be based on the development of a complete SoH lead-acid battery supervisor that will gather both the proposed improved algorithm and the failure identification mode to apply preventive and corrective action to the complete battery system. This would not only be a significant advance in the field of predicting battery performance, but also be key to the development of remote monitoring systems.

Supplementary Materials

The following are available online at https://0-www-mdpi-com.brum.beds.ac.uk/article/10.3390/electronics10111353/s1: The authors have added 36 figures with experimental data, 36 other figures with graphic comparisons between Differential Evolution unique step, and the combinations of Differential Evolutions with Nelder–Mead Simplex method.

Author Contributions

Conceptualization, supervision, and methodology, J.O.; optimization of algorithm proposal, implementation, and validation, E.Z.; testing and data analysis, J.M.d.I.; formal analysis, R.F.; investigation and writing—original draft, review and editing, U.F.-G. and J.M.L.-G. All authors have read and agreed to the published version of the manuscript.

Funding

Special thanks should also be expressed for the Torres Quevedo (PTQ) 2019 Aid from the State Research Agency, within the framework of the State Program for the Promotion of Talent and its Employability in R + D + i, Ref. PTQ2019-010787 /AEI/10.13039/501100011033.

Acknowledgments

The authors would like to express their gratitude to CIC energiGUNE and Bcare for the access to their facilities.

Conflicts of Interest

The authors declare no conflict of interest.

Acronyms

EISElectrochemical Impedance Spectroscopy
SoCState of Charge
SoHState of Health
RULRemaining Useful Lifetime
ECMEquivalent Circuit Model
OCVOpen Circuit Voltage
CNNConvolutional Neural Net wok
EECElectric Equivalent Circuit
CPEConstant Phase Element
DEDifferential Evolution
ZCPEImpedance Constant Phase Element
PSOParticle Swarm Optimization
BMSBattery Management System

Greek and Other Symbols

iimaginary number (i2 = −1)
angular frequency (rad/s)
αconstant phase angle of the CPE (rad)
Rresistance (Ω)
Ccapacitance (F)
Linductance (H)
ρReflection coefficient of Nelder–Mead algorithm
χExpansion coefficient of Nelder–Mead algorithm
γCoefficient of Nelder–Mead algorithm
σCoefficient of Nelder–Mead algorithm

References

  1. Aksakal, C.; Şişman, A. On the Compatibility of Electric Equivalent Circuit Models for Enhanced Flooded Lead Acid Batteries Based on Electrochemical Impedance Spectroscopy. Energies 2018, 11, 118. [Google Scholar] [CrossRef] [Green Version]
  2. Andre, D.; Appel, C.; Soczka-Guth, T.; Sauer, D.U. Advanced mathematical methods of SOC and SOH estimation for lithium-ion batteries. J. Power Sources 2013, 224, 20–27. [Google Scholar] [CrossRef]
  3. Badeda, J.; Kwiecien, M.; Schulte, D.; Sauer, D.U. Battery State Estimation for Lead-Acid Batteries under Float Charge Conditions by Impedance: Benchmark of Common Detection Methods. Appl. Sci. 2018, 8, 1308. [Google Scholar] [CrossRef] [Green Version]
  4. Culpin, B.; Rand, D. Failure modes of lead/acid batteries. J. Power Sources 1991, 36, 415–438. [Google Scholar] [CrossRef]
  5. Dost, P.; Sourkounis, C. Generalized Lead-Acid based Battery Model used for a Battery Management System. Athens J. Technol. Eng. 2016, 3, 255–270. [Google Scholar] [CrossRef]
  6. Kwiecien, M.; Huck, M.; Badeda, J.; Zorer, C.; Komut, K.; Yu, Q.; Sauer, D.U. Variation of Impedance in Lead-Acid Batteries in the Presence of Acid Stratification. Appl. Sci. 2018, 8, 1018. [Google Scholar] [CrossRef] [Green Version]
  7. McKeon, B.B.; Furukawa, J.; Fenstermacher, S. Advanced Lead–Acid Batteries and the Development of Grid-Scale Energy Storage Systems. Proc. IEEE 2014, 102, 951–963. [Google Scholar] [CrossRef]
  8. Ungurean, L.; Cârstoiu, G.; Micea, M.V.; Groza, V. Battery state of health estimation: A structured review of models, methods and commercial devices: Battery State of Health Estimation: A Structured Review. Int. J. Energy Res. 2017, 41, 151–181. [Google Scholar] [CrossRef]
  9. Lin, Q.; Wang, J.; Xiong, R.; Shen, W.; He, H. Towards a smarter battery management system: A critical review on optimal charging methods of lithium ion batteries. Energy 2019, 183, 220–234. [Google Scholar] [CrossRef]
  10. Jilte, R.; Afzal, A.; Panchal, S. A novel battery thermal management system using nano-enhanced phase change materials. Energy 2021, 219, 119564. [Google Scholar] [CrossRef]
  11. Olarte, J.; Dauvergne, J.-L.; Herrán, A.; Drewett, N.; Bekaert, E.; Zulueta, E.; Ferret, R. Validation of thermal imaging as a tool for failure mode detection development. AIMS Energy 2019, 7, 646–659. [Google Scholar] [CrossRef]
  12. Inventing the Sustainable Batteries of the Future. Available online: https://battery2030.eu/digitalAssets/861/c_861350-l_1-k_roadmap-23march.pdf (accessed on 5 June 2021).
  13. Chaturvedi, B.K.; Neeta Khare, P.K. Fpga Design Scheme For Battery Soc & Soh Algorithms For Advanced Bms. Int. J. Eng. Sci. Res. Technol. 2017, 6, 263–277. [Google Scholar] [CrossRef]
  14. Chang, W.-Y. The State of Charge Estimating Methods for Battery: A Review. ISRN Appl. Math. 2013, 2013, 1–7. [Google Scholar] [CrossRef]
  15. Rivera-Barrera, J.P.; Muñoz-Galeano, N.; Maldonado, H.O.S. SoC Estimation for Lithium-ion Batteries: Review and Future Challenges. Electron. 2017, 6, 102. [Google Scholar] [CrossRef] [Green Version]
  16. Zhang, R.; Xia, B.; Li, B.; Cao, L.; Lai, Y.; Zheng, W.; Wang, H.; Wang, W. State of the Art of Lithium-Ion Battery SOC Estimation for Electrical Vehicles. Energies 2018, 11, 1820. [Google Scholar] [CrossRef] [Green Version]
  17. Lukic, S.M.; Cao, J.; Bansal, R.C.; Rodriguez, F.; Emadi, A. Energy Storage Systems for Automotive Applications. IEEE Trans. Ind. Electron. 2008, 55, 2258–2267. [Google Scholar] [CrossRef]
  18. Piller, S.; Perrin, M.; Jossen, A. Methods for state-of-charge determination and their applications. J. Power Sources 2001, 96, 113–120. [Google Scholar] [CrossRef]
  19. Baccouche, I.; Jemmali, S.; Mlayah, A.; Manai, B.; Amara NE, B. Implementation of an Improved Coulomb-Counting Algorithm Based on a Piecewise SOC-OCV Relationship for SOC Estimation of Li-Ion Battery. Int. J. Renew. Energy Res. IJRER March. 2018, 8, 10. Available online: https://www.ijrer.org/ijrer/index.php/ijrer/article/view/6686/0 (accessed on 5 June 2021).
  20. Nazer, R.A.; Cattin, V.; Granjon, P.; Montaru, M. A New Optimization Algorithm for a Li-Ion Battery Equivalent Electrical Circuit Identification. In Proceedings of the 9th International Conference of Modeling, Optimization and Simulation, Bordeaux, France, 6–8 June 2012; p. 8. [Google Scholar]
  21. Nasser-Eddine, A.; Huard, B.; Gabano, J.-D.; Poinot, T. A two steps method for electrochemical impedance modeling using fractional order system in time and frequency domains. Control. Eng. Pr. 2019, 86, 96–104. [Google Scholar] [CrossRef]
  22. Gonzalez, F.; Greiner, D.; Mena, V.; Souto, R.M.; Santana, J.J. Fitting procedure based on Differential Evolution to evaluate impedance parameters of metal-coating systems. Eng. Comput 2019, 36, 2960–2982. [Google Scholar] [CrossRef]
  23. Alavi, S.; Birkl, C.; Howey, D. Time-domain fitting of battery electrochemical impedance models. J. Power Sources 2015, 288, 345–352. [Google Scholar] [CrossRef]
  24. Zou, C.; Zhang, L.; Hu, X.; Wang, Z.; Wik, T.; Pecht, M. A review of fractional-order techniques applied to lithium-ion batteries, lead-acid batteries, and supercapacitors. J. Power Sources 2018, 390, 286–296. [Google Scholar] [CrossRef] [Green Version]
  25. Ramos, P.M.; Janeiro, F.M. Gene expression programming for automatic circuit model identification in impedance spectroscopy: Performance evaluation. Measurement 2013, 46, 4379–4387. [Google Scholar] [CrossRef]
  26. Chun, H.; Kim, J.; Han, S. Parameter identification of an electrochemical lithium-ion battery model with convolutional neural network. IFAC-PapersOnLine 2019, 52, 129–134. [Google Scholar] [CrossRef]
  27. Storn, R.; Price, K. Differential Evolution: A Simple and Efficient Adaptive Scheme for Global Optimization over Continuous Spaces. J. Glob. Optim. 1997, 11, 341–359. [Google Scholar] [CrossRef]
  28. Aramendia, I.; Zulueta, E.; Teso-Fz-Betoño, D.; Saenz-Aguirre, A.; Fernandez-Gamiz, U. Modeling of Motorized Orthosis Control. Appl. Sci. 2019, 9, 2453. [Google Scholar] [CrossRef] [Green Version]
  29. Martinez-Rico, J.; Zulueta, E.; Fernandez-Gamiz, U.; De Argandoña, I.R.; Armendia, M. Forecast Error Sensitivity Analysis for Bidding in Electricity Markets with a Hybrid Renewable Plant Using a Battery Energy Storage System. Sustainability 2020, 12, 3577. [Google Scholar] [CrossRef]
  30. Lagarias, J.C.; Reeds, J.A.; Wright, M.H.; Wright, P.E. Convergence Properties of the Nelder--Mead Simplex Method in Low Dimensions. SIAM J. Optim. 1998, 9, 112–147. [Google Scholar] [CrossRef] [Green Version]
Figure 1. Equivalent EIS circuit model.
Electronics 10 01353 g001
Figure 2. Square errors with proposed identification and with only DE algorithm identification.
Electronics 10 01353 g002
Figure 3. 80% SoC EIS experiment in first iteration (Pristine Battery).
Electronics 10 01353 g003
Figure 4. Comparison between one-step DE optimization-based identification result and two-step DE optimization-based identification results at 80% SoC.
Electronics 10 01353 g004
Table 1. Test frequencies.
Highest FrequencyLowest FrequencyUnits
10,0000.01Hertz
Table 2. First Step Differential Evolution algorithm options.
Agent NumberF OptionCR OptionNumber of Iterations 1
10,00010.50.011
1 First step’s options do not change much parameter identification cost.
Table 3. Second Step Nelder–Mead Simplex algorithm options.
ρχγσ
120.50.52
Table 4. Identification parameter set maximum and minimum values applied in normalization.
Identification
Parameter
Maximum ValueMinimal ValueUnits
R10.010.001Ohms
R20.020.002Ohms
R310.001Ohms
C1121F
α10.90.4-
C230040F
α20.80.4-
L110−610−8H3
Table 5. Mean and standard deviation improvement related to one differential evolution optimization.
Mean Improvement with Two-Step OptimizationStandard Deviation with Two-Step Optimization in %
85.131514.9142 2
2 “In %” refers to the cost function, J, of one-step DE optimization.
Publisher’s Note: MDPI stays neutral with regard to jurisdictional claims in published maps and institutional affiliations.

