Article

Deep Convolutional Neural Network with RNNs for Complex Activity Recognition Using Wrist-Worn Wearable Sensor Data

by
Sakorn Mekruksavanich
1 and
Anuchit Jitpattanakul
2,*
1
Department of Computer Engineering, School of Information and Communication Technology, University of Phayao, Phayao 56000, Thailand
2
Intelligent and Nonlinear Dynamic Innovations Research Center, Department of Mathematics, Faculty of Applied Science, King Mongkut’s University of Technology North Bangkok, Bangkok 10800, Thailand
*
Author to whom correspondence should be addressed.
Submission received: 29 May 2021 / Revised: 11 July 2021 / Accepted: 12 July 2021 / Published: 14 July 2021
(This article belongs to the Section Artificial Intelligence)

Abstract

:
Sensor-based human activity recognition (S-HAR) has become an important and high-impact topic of research within human-centered computing. In the last decade, successful applications of S-HAR have been presented through fruitful academic research and industrial applications, including for healthcare monitoring, smart home controlling, and daily sport tracking. However, the growing requirements of many current applications for recognizing complex human activities (CHA) have begun to attract the attention of the HAR research field when compared with simple human activities (SHA). S-HAR has shown that deep learning (DL), a type of machine learning based on complicated artificial neural networks, has a significant degree of recognition efficiency. Convolutional neural networks (CNNs) and recurrent neural networks (RNNs) are two different types of DL methods that have been successfully applied to the S-HAR challenge in recent years. In this paper, we focused on four RNN-based DL models (LSTMs, BiLSTMs, GRUs, and BiGRUs) that performed complex activity recognition tasks. The efficiency of four hybrid DL models that combine convolutional layers with the efficient RNN-based models was also studied. Experimental studies on the UTwente dataset demonstrated that the suggested hybrid RNN-based models achieved a high level of recognition performance along with a variety of performance indicators, including accuracy, F1-score, and confusion matrix. The experimental results show that the hybrid DL model called CNN-BiGRU outperformed the other DL models with a high accuracy of 98.89% when using only complex activity data. Moreover, the CNN-BiGRU model also achieved the highest recognition performance in other scenarios (99.44% by using only simple activity data and 98.78% with a combination of simple and complex activities).

Graphical Abstract

1. Introduction

Human-centered computing is a new area of study and application that focuses on understanding human behavior and combining users and their social backgrounds with digital technology. Human activity recognition (HAR), which attempts to recognize the behavior, features, and objectives of one or more persons from a temporal sequence of observations transmitted from one or more sensors, is required and subsumed by this [1]. Successful recognition of human activities can be extensively useful in ambient assisted living (AAL) applications [2] such as intelligent activity monitoring systems developed for elderly and disabled people in healthcare systems [3], automatic interpretation of hand gestures in sports [4], user identify verification for security systems using gait characteristics [5], and human–robot interactions through gesture recognition [6]. Typically, the objectives of HAR systems are to (1) determine (both online and offline) the ongoing actions/activities of an individual, a group of individuals, or even a community based on sensory observation data; (2) identify certain individual characteristics such as the identity of people in a particular frame, gender, age, and so on; and (3) increase awareness concerning the context in which observational interactions have actually been happening. The variety of sensory data used significantly influences the types of functionality, algorithms, architectures, and approaches used for research, so HAR systems can be categorized based on the modality of sensory data used [7,8]. In general, the following research and development types in HAR systems can be identified [9]: (1) HAR systems based on visual information (images and videos), (2) HAR systems based on motion inertial sensors like IMUs (inertial measurement units), and (3) HAR systems based on obtained signal strength from commodity networks in the surrounding area. The second methodology, sensor-based human activity recognition (S-HAR) [10], is the target of this ongoing study.
The concept behind an automated S-HAR design is to obtain data from a collection of sensors that are influenced by the motion characteristics of various body joints. Following this, several features are extracted based on these measurements to be used in the training of activity models, which will subsequently be used to identify these activities [11,12]. Activities of daily living (ADL) that individuals have the ability to do on a regular basis, such as dining, walking, washing, dressing, and so on, are good illustrations of such activities [13]. There are a variety of methodologies and data gathering systems for recognizing these actions, all of which are based on various sensory measurements [14]. Wearable devices are among the most effective tools in our conventional lifestyles, and they become more capable of meeting client needs and expectations as technology advances. Developers are always adding new features and components to the products to make these gadgets more practical and effective. Sensors play an important part in making wearable devices more functional and aware of their surroundings. Hence, most smart-wearable gadgets have a variety of integrated sensors, allowing for the collection of large amounts of data on the user’s simple human activities (SHA) and complex human activities (CHA). Almost all smart-wearable gadget makers use an accelerometer and a gyroscope as conventional sensors. Accelerometers are sensors that detect the acceleration of moving objects along referential axes. They are especially good at tracking simple human actions such as walking, jogging, resting, standing, and ascending since they entail repetitive body movements [15,16]. The data from the accelerometer can be analyzed to detect dramatic changes in motion. The gyroscope, which determines direction using gravity, is another sensor that has become common technology for smart-wearable devices. Signal data obtained by the gyroscope can be analyzed to determine the device’s position and alignment [17]. Most of the previous studies have been conducted on SHA recognition, whereas trivial research has been carried out on CHA recognition [18]. Many vital aspects (recognition accuracy, computational cost, energy consumption, privacy, mobility) need to be addressed in both areas to improve their viability.
HAR with wearable sensors has traditionally been viewed as a multivariant time-series classification challenge. Feature extraction is a critical step in solving the problem, and it may be done using the statistical methodology in both the time and frequency domains [19]. Traditional machine learning algorithms such as Naïve Bayes, decision trees, and support vector machines have effectively classified various kinds of human activities [20]. Handcrafted feature extraction, on the other hand, necessitates domain knowledge or expertise. As a result, statistical learning methods could not identify discriminative features that could appropriately differentiate complex activities. The architecture of a deep model with convolutional layers [21] has been used to achieve automatic feature extraction in a deep learning (DL) environment. Convolutional neural networks (CNNs) were used in the early stages of DL-based HAR research to solve sensor-based HAR by automatically extracting abstract characteristics from sensor data [22,23]. While CNNs can capture the spatial domain of sensor data and provide adequate performance for simple activities, they are unable to capture complex activities that require analysis of the wearable sensor data’s temporal characteristics [24]. Implementing diverse classifiers utilizing deep learning approaches to categorize complex human activities with high performance can be considered a significant challenge. As a result, in HAR [25], recurrent neural networks (RNNs) are applied, providing significance to temporal information from wearable sensor data. The RNN, on the other hand, has a vanishing or exploding gradient problem, making it difficult to train. Long short-term memory neural networks were developed to tackle this problem (LSTM). Many recent works in HAR have used LSTMs to improve performance [23,26]. Hybrid deep learning models have recently been developed to address the drawbacks of both CNN and RNN neural networks.
Learning spatial representation from sensor data is a strength of the CNN, but learning temporal representation from sensor data is a strength of the RNN. As a result, a hybrid model combines these two modules to enable the model to learn a rich representation of sensor input in spatial and temporal feature representation. HAR was performed using a CNN and LSTM in [27]. The input was entered into a CNN structure, which was then followed by LSTM modules. As a consequence, the hybrid model outperforms using only a CNN or RNN. From the sensor data provided, the model was capable of learning a detailed representation. A CNN and gated recurrent unit (GRU) model framework was presented in [28]. We have also recently seen several deep neural network methods applied in complicated human activity recognition. Researchers have used deep neural networks to determine how to solve the complex HAR issue. The former state-of-the-art models on the complex HAR were InceptionTime [29] and DeepCovnTCN [30]. Furthermore, after many years, the extraction of valuable characteristics was the most challenging part of the mobile and wearable sensor-based HAR pipeline [31]. It had an impact on categorization accuracy, computing speed, and complexity.
The literature mentioned above inspires us to learn the spatial and temporal features of each unit-level activity and then use these high-level abstract features to recognize complex human activities from both accelerometer and gyroscope data. In this research, the S-HAR framework to address CHA recognition is introduced. The proposed CNN-BiGRU model for activity recognition underwent several experiments with the UTwente dataset to determine the most effective window sizes and a DL approach that outperforms the CHA issue. With a score of 98.89%, the proposed approach surpasses previous DL models in terms of accuracy according to model validation using assessment criteria. As a result, the following are the primary contributions of this paper:
  • Different DL networks were implemented to analyze and classify complex human activity data.
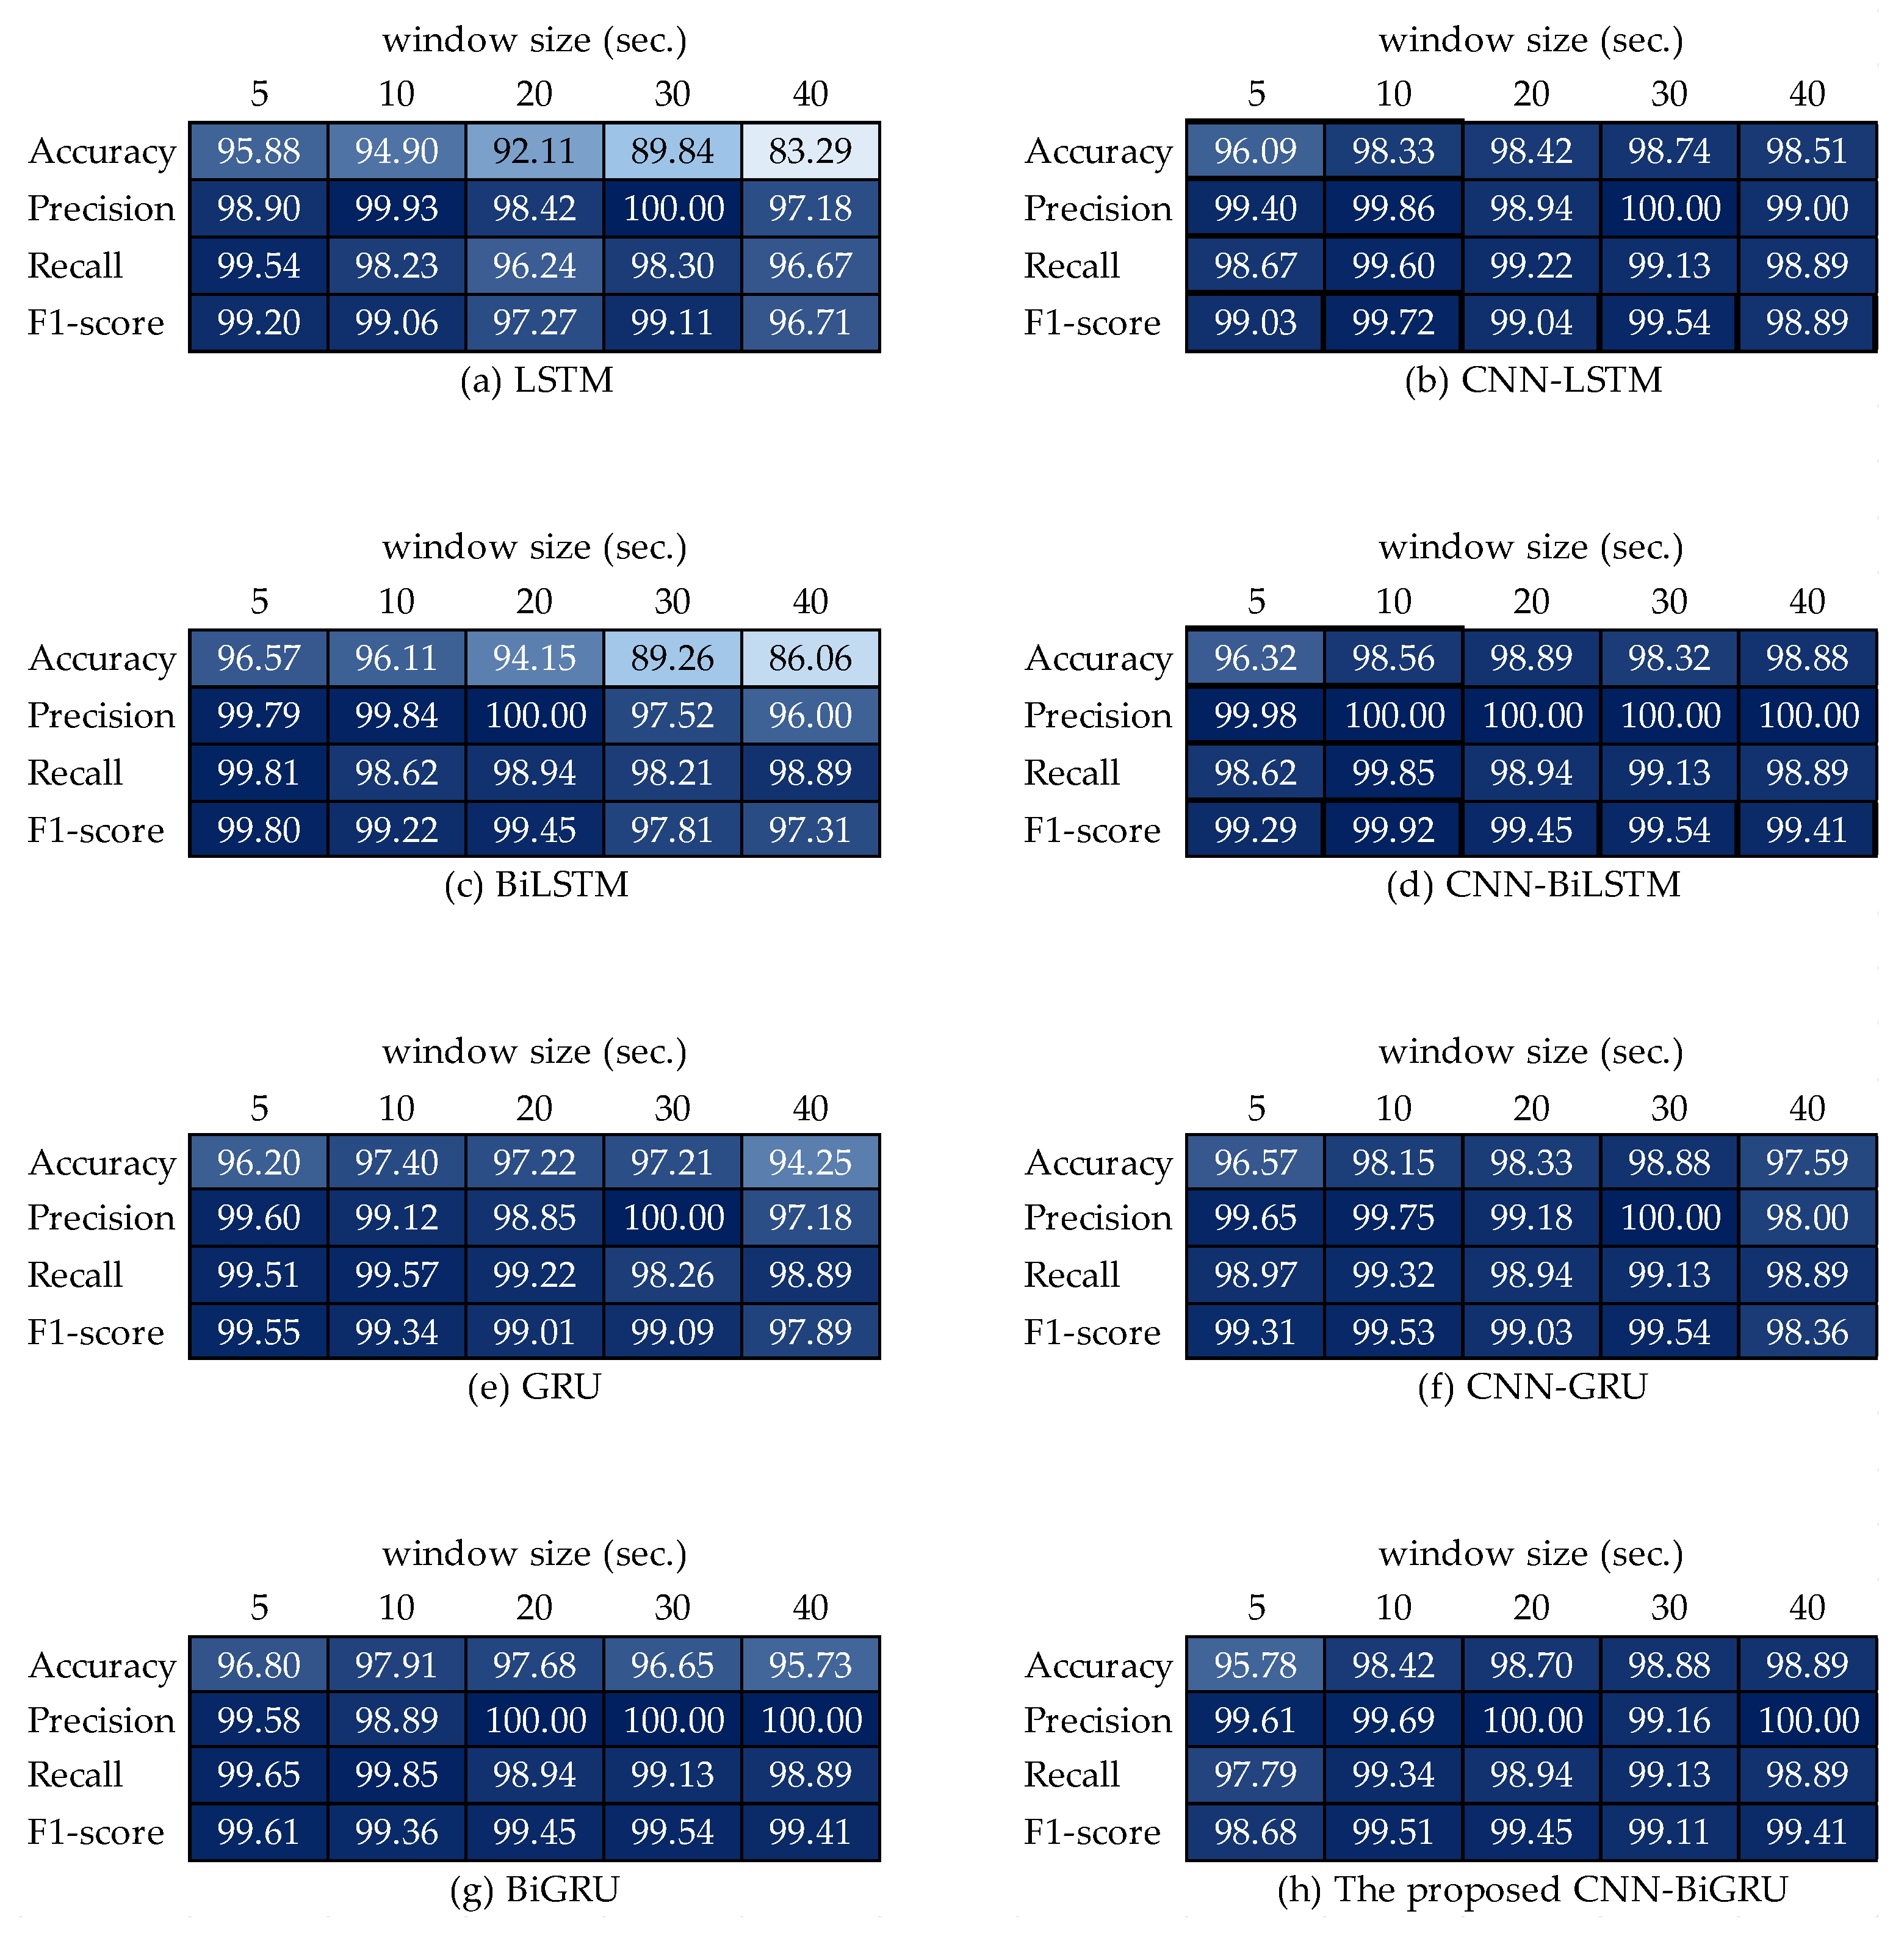
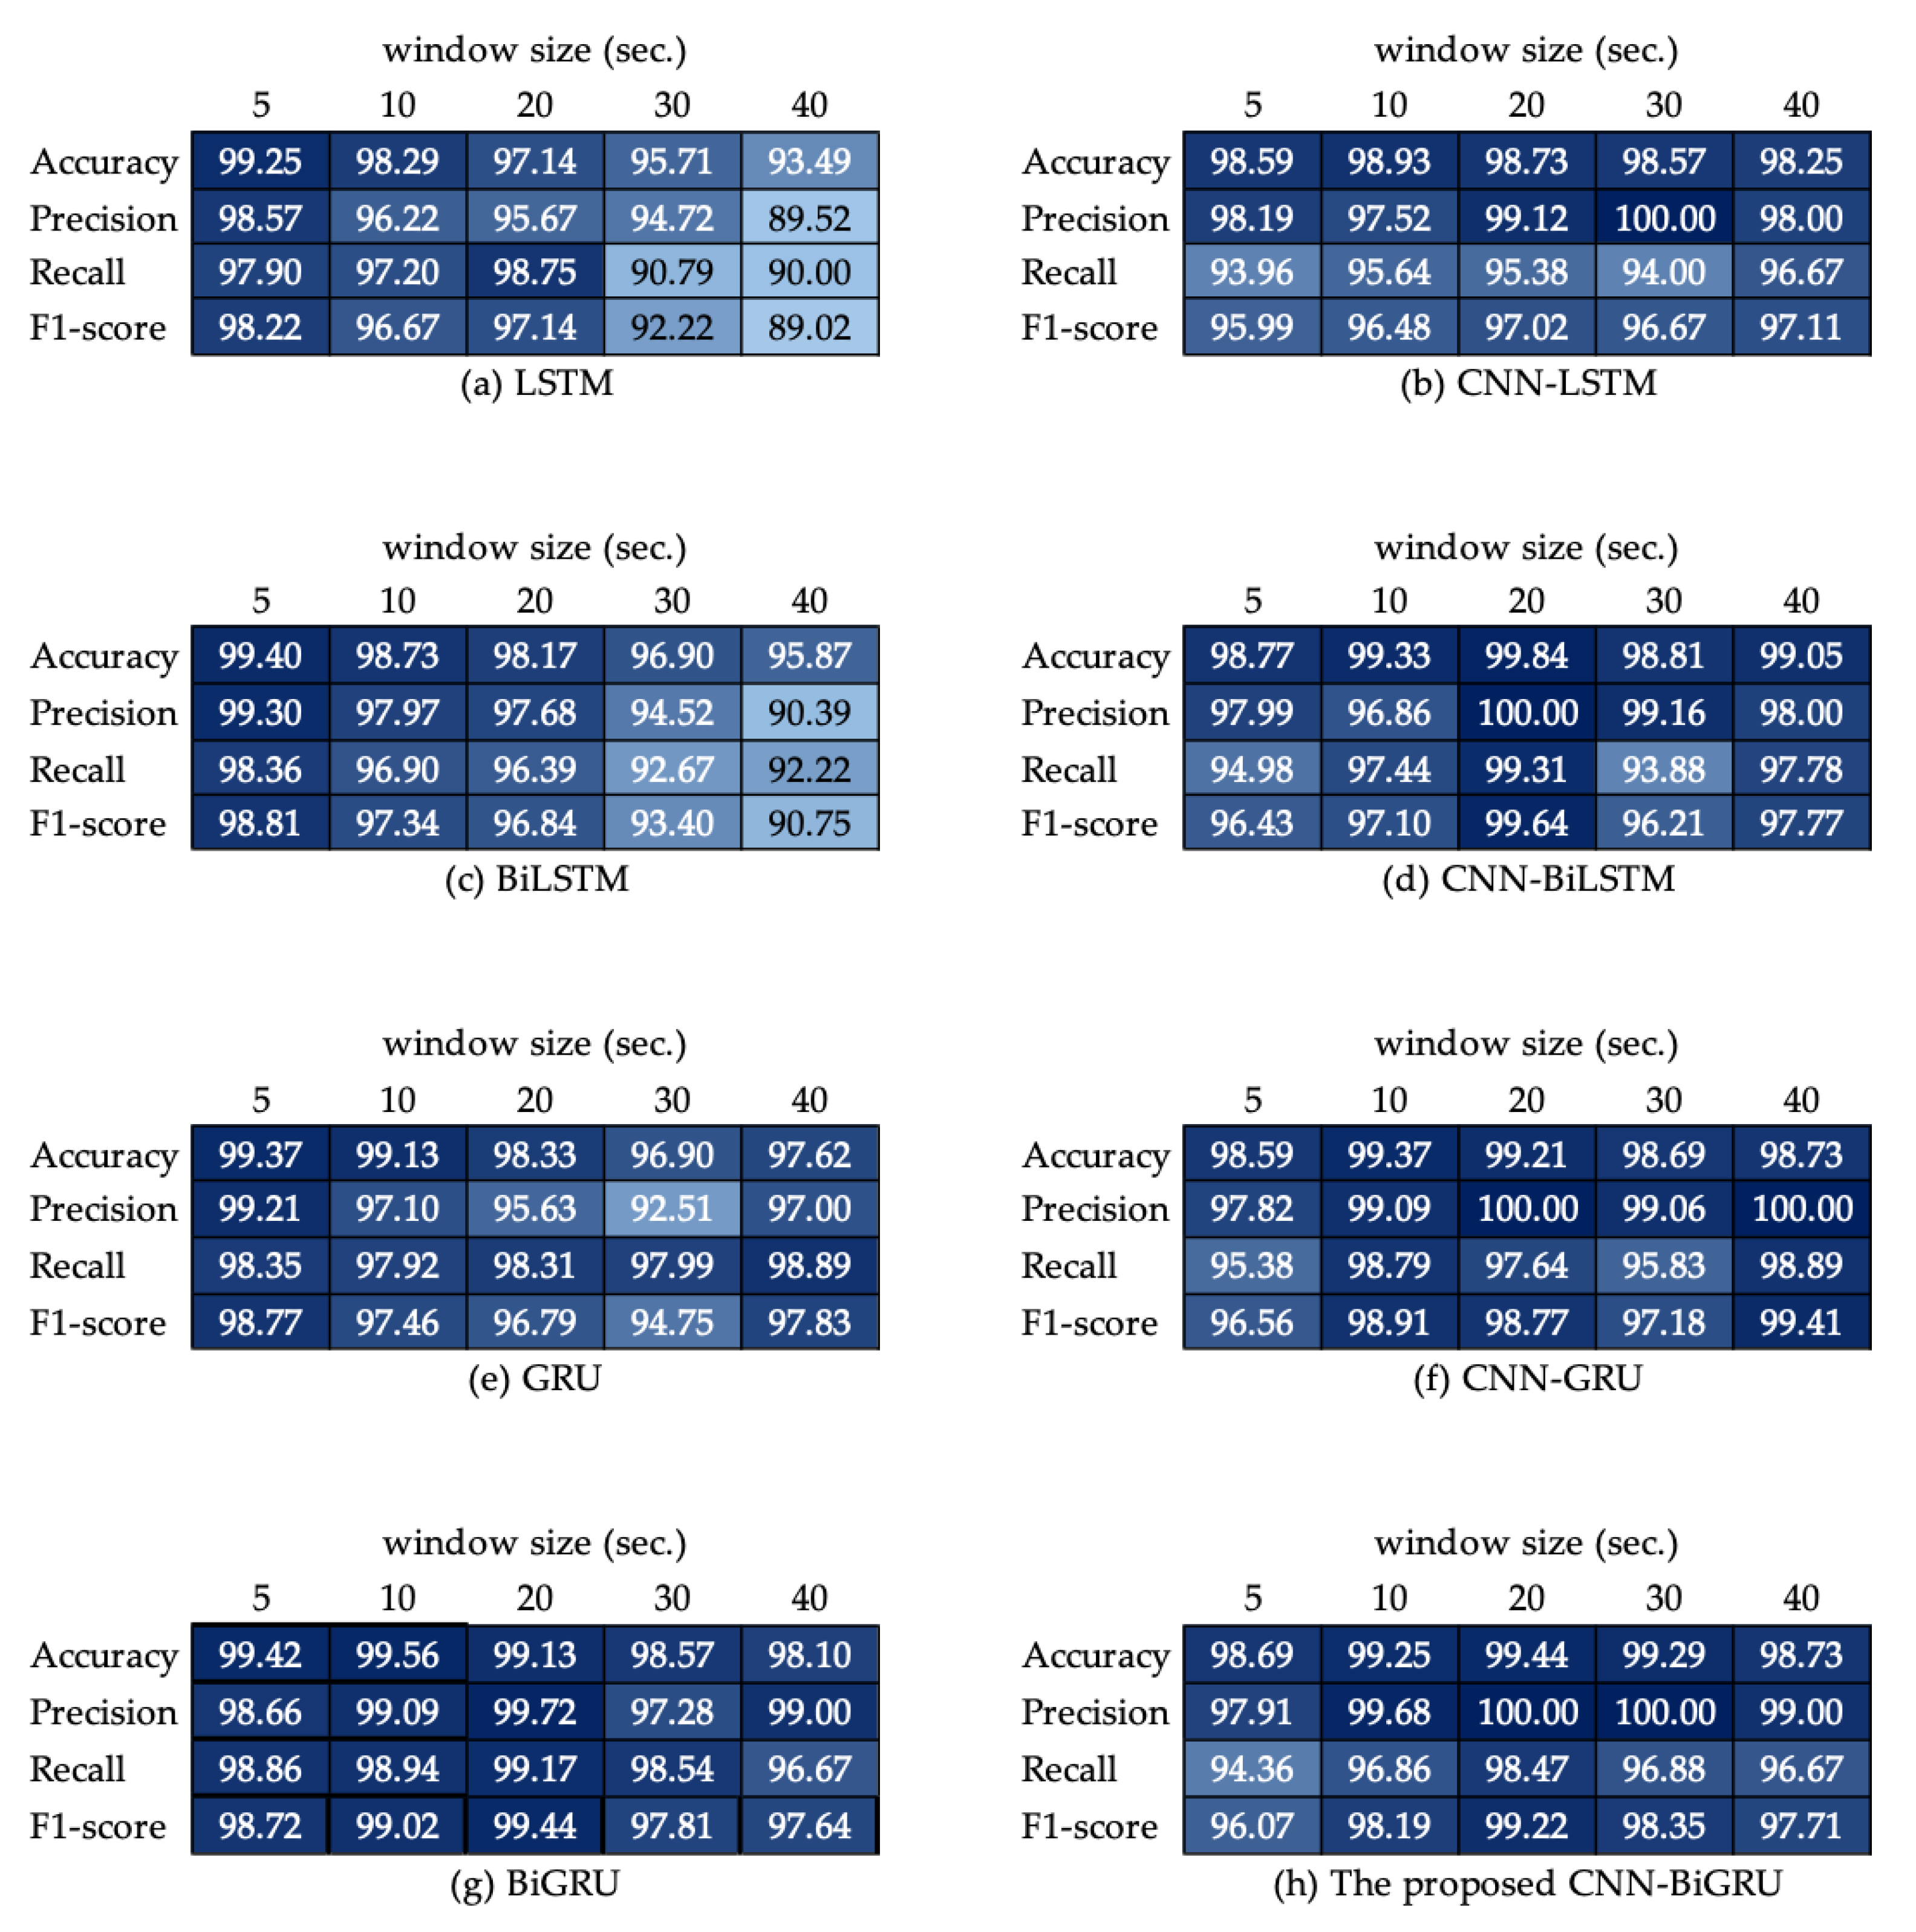
  • Using four baseline recurrent neural network (RNN) models (LSTMs, BiLSTMs, GRUs, and BiGRUs) and various hybrid DL models, we evaluated fundamental recognition performance indicators (accuracy, precision, recall, F1-score, and confusion matrix) for these DL models.
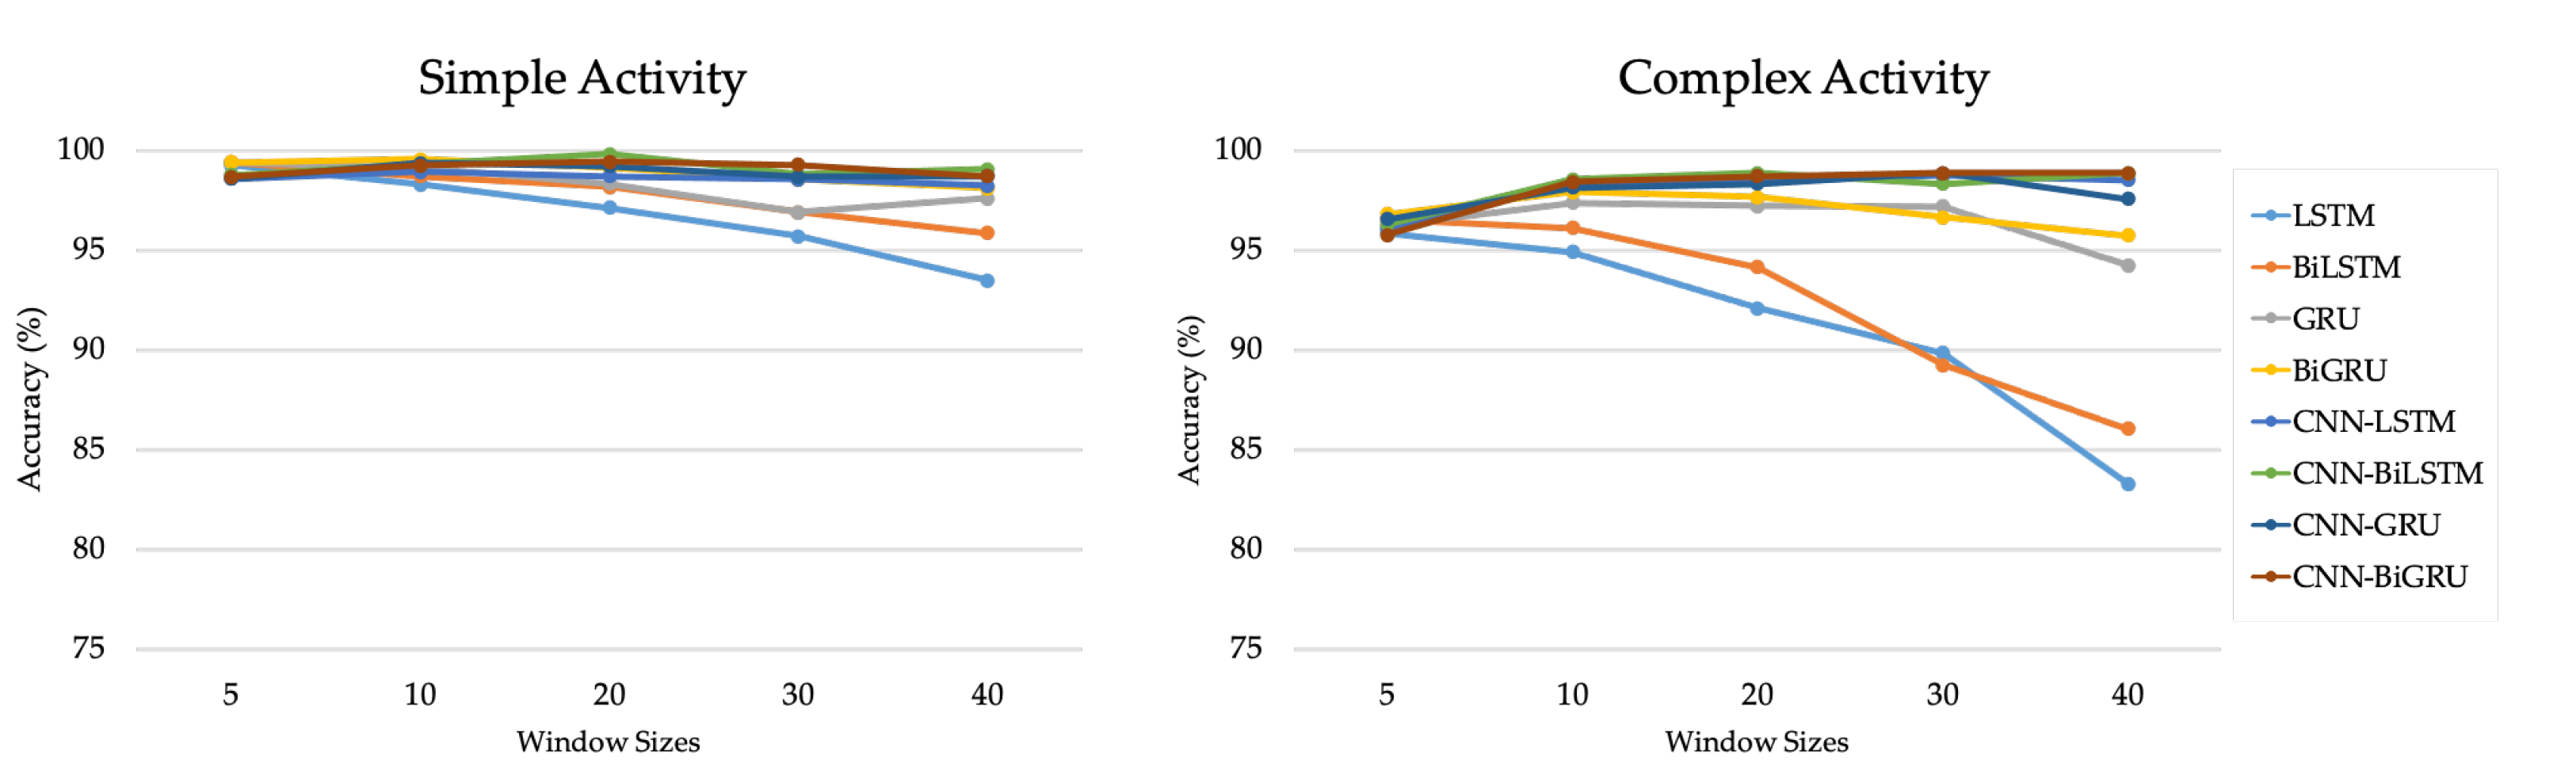
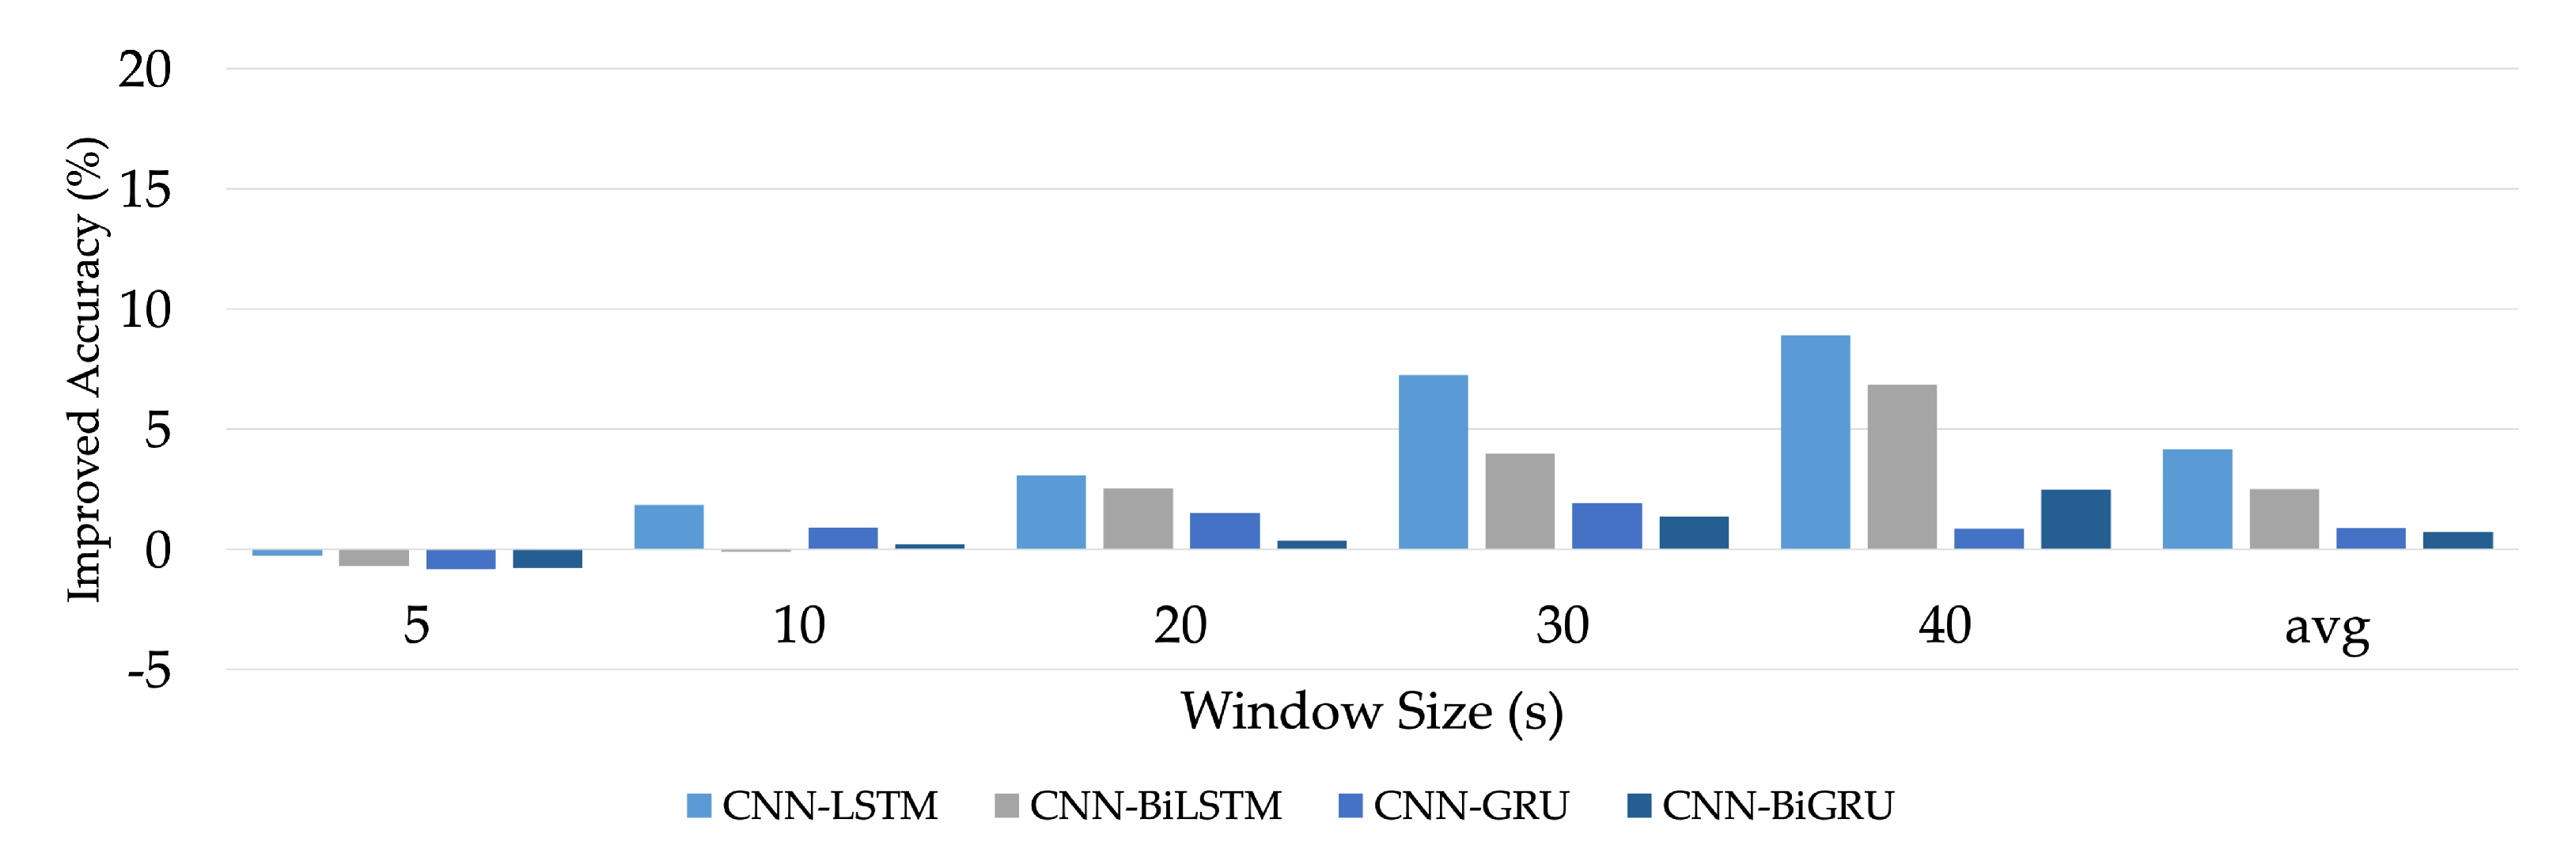
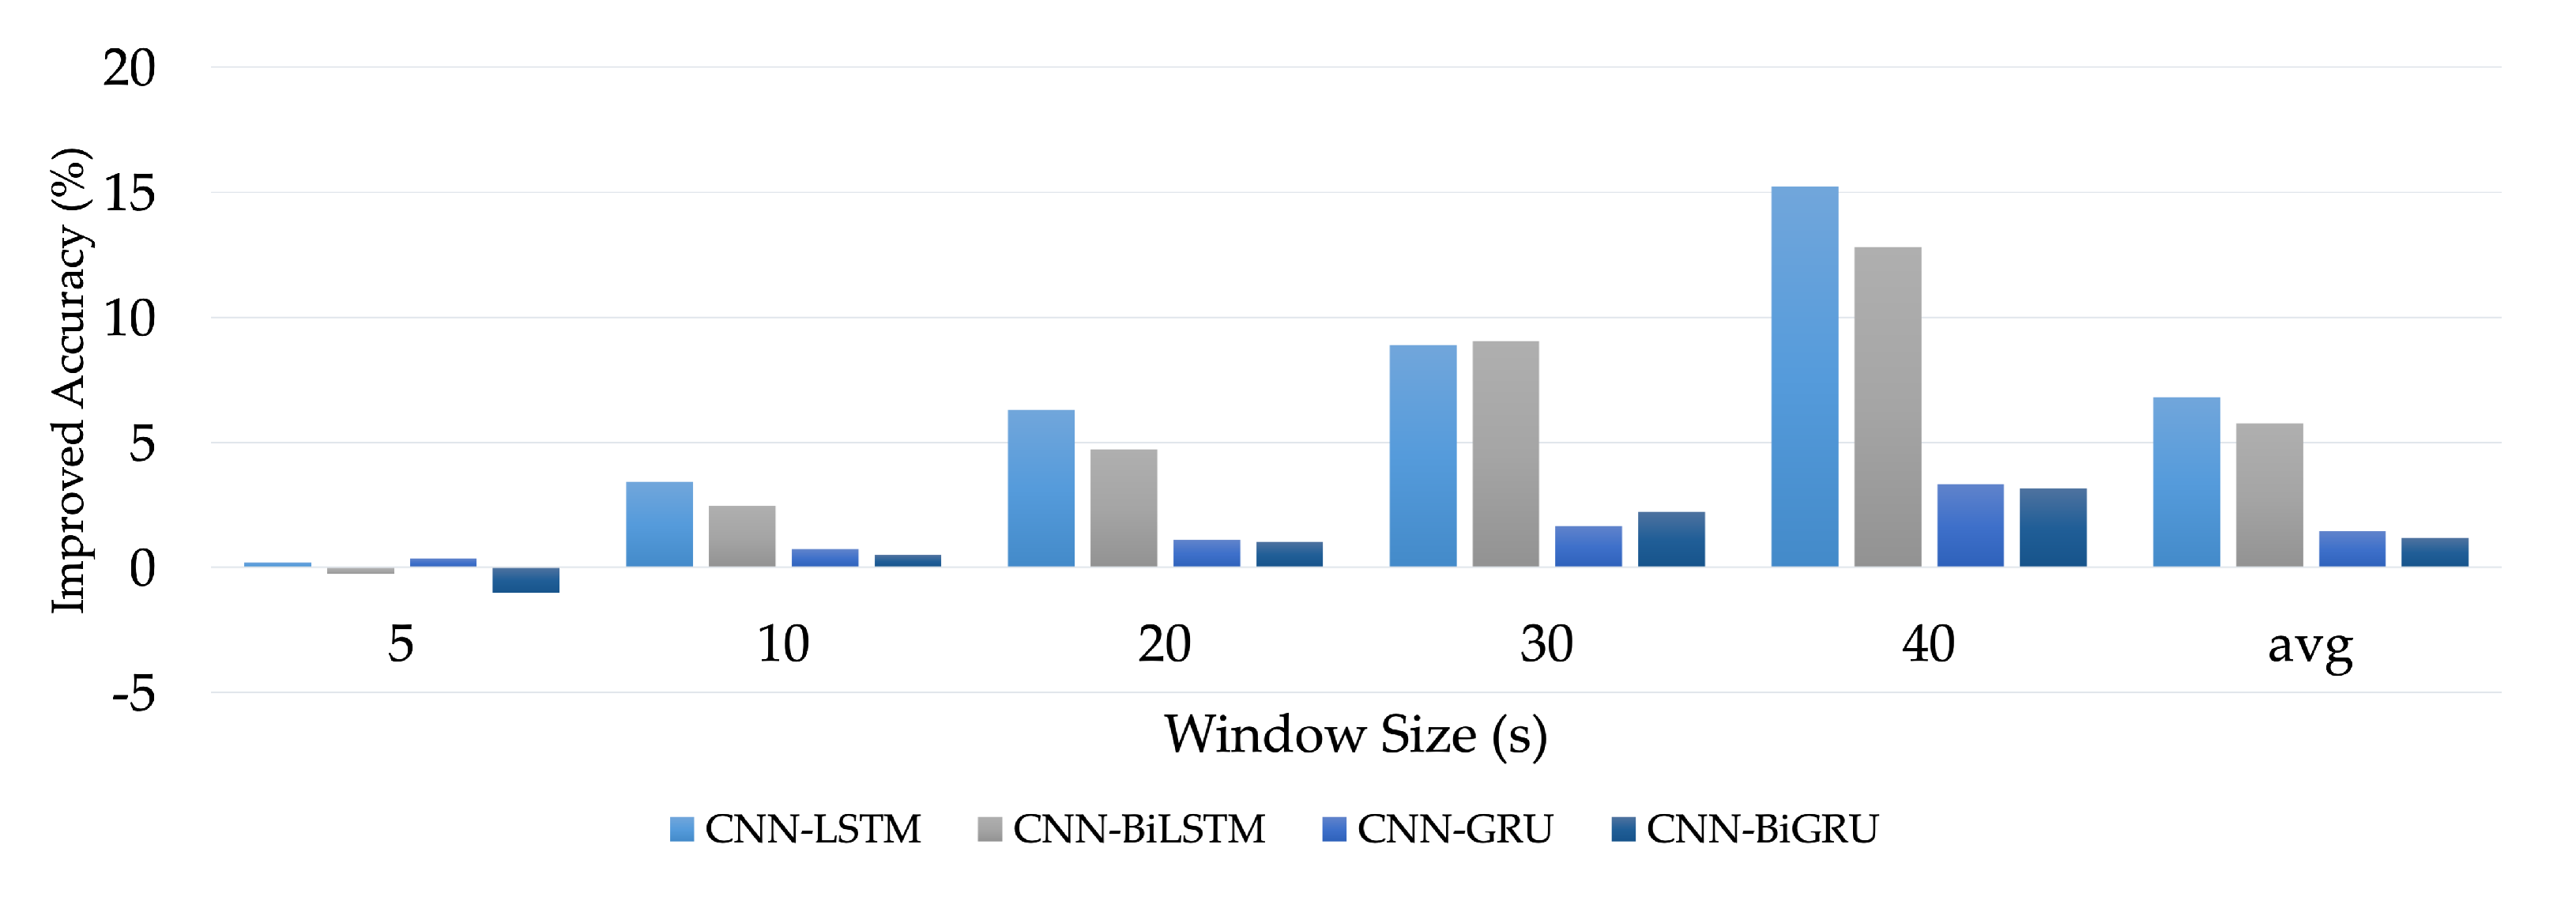
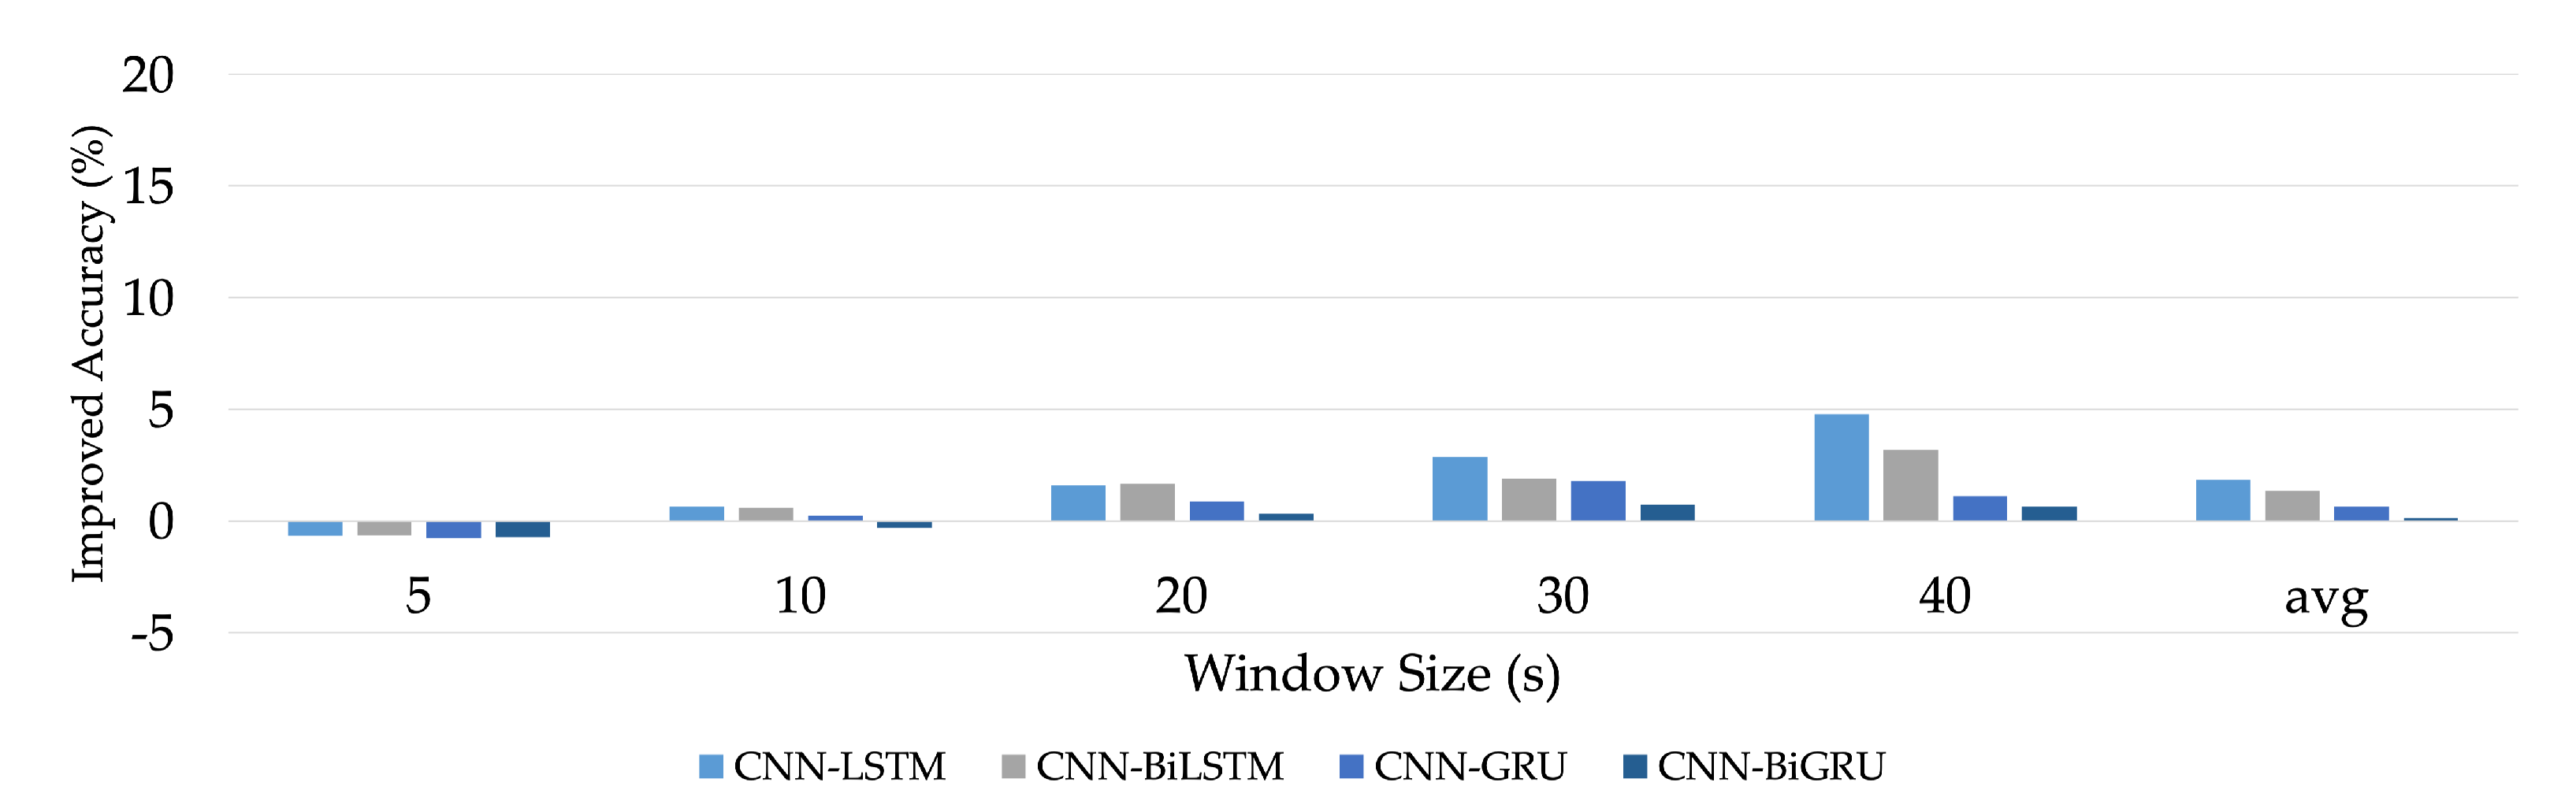
  • We analyzed the impacts of various aspects on the evaluation outcomes (window sizes, integrating with convolutional layers, and bidirectional method).
  • On the same complex human activity dataset, we compared the performance of the proposed model against that of other baseline DL methods.
The remainder of this paper is structured as follows: Section 2 presents an overview of related HAR concepts and DL approaches. Section 3 details the proposed S-HAR framework for complex human activity recognition. Section 4 presents research experiments conducted on the UTwente dataset, while the derived results are discussed in Section 5. A summary of the research study and possible future directions are concluded in Section 6.

2. Preliminary Concepts

2.1. Sensor-Based Human Activity Recognition

Sensor-based human activity recognition (or S-HAR) is a study that focuses on recognizing and analyzing what an individual person is doing based on sensor data. Recognizing what the person is doing gives useful visual features that can be used to assist user-centered applications in better adapting to the person’s demands in a variety of ways. Sport coaching, distance health monitoring, wellness self-management, military applications, entertainment, household member identification, gait analysis, and gesture recognition are just a few of the domains where HAR has been effectively developed [32,33].
Human activities can be categorized into two groups based on [18,19,20,34,35,36,37]: simple human activities (SHA) and complex human activities (CHA). Simple human activities, as defined by Shoaib et al. [20], are recurrent, natural actions that may be clearly identified using an accelerometer, such as walking, jogging, sitting, and standing. Simple human activities are less repetitive than complex human activities, and they frequently entail hand-related behaviors such as smoking, eating, and drinking. Additional sensors, such as a gyroscope, can be used to identify CHA. Because it is difficult to distinguish such activities with a single accelerometer, this study classifies activities involving stairs into the CHA group.
Alo et al. [34] classified human activities into two categories: simple and complex. Walking, running, sitting, standing, and jogging are examples of simple human activities that can be done in a short amount of time. Complex human activities, on the other hand, are comprised of a series of longer-duration activities, such as smoking, eating, taking medication, cooking, and writing. Peng et al. [19] classified human activities into simple activities (e.g., walking, running, or sitting) based on repeated motions or a single body position, which does not accurately reflect the activities in people’s daily lives. Complex activities, on the other hand, are more difficult and are made up of simple activities as well as several actions. Complex activities, such as “eating a meal”, “working”, and “buying”, frequently last for a long time and have high-level interpretations. They are more realistic representations of people’s daily lives. The aspects of human action, according to Liu et al. [35], are complex. A complex activity is a group of temporally and constructively associated atomic activities, whereas an atomic action is a unit-level action that cannot be broken down further under application interpretation. People frequently execute multiple actions in diverse ways, both sequentially and concurrently, rather than just one atomic activity. Chen et al. [36] classified human activities into two categories: simple and complex. SHA can be observed as a single recurring action that a single accelerometer can detect. CHA are rarely as repeatable as simple activities, and they frequently entail numerous concurrent or overlapping behaviors, which can only be detected with multimodal sensor data. Lara [18] investigated the taxonomy of human activities as defined by previous research. Human activities have also been divided into distinct types in other studies [37]. Table 1 summarizes the HAR research related to SHA and CHA.
We incorporated these concepts into our study and determined that SHA are repetitive motions without any hand gestures, whereas CHA are repetitive or non-repetitive movements with hand gestures. Walking, jogging, stairs, sitting, and standing activities are classified as SHA, while hand-oriented activities such as typing, writing, drinking, and eating are classified as CHA.
Activities could be segmented into motions or gestures or gathered together into a series of activities (SHA and CHA) depending on the granularity of the behavior being identified. In [1,8], a fundamental formulation for the HAR challenge was acquired, as well as an overview of previous strategies for solving it. The activity-related gathering of data from sensors while carrying out a task, the extraction of important features defining the sensor data, and the application of a learning approach that is trained on existing labeled data and applied to additional unknown data for activity identification are all typical processes in the main data flow for HAR [38]. The conventional activity recognition process, according to a similar study of previous HAR research studies, consists of the following activities: raw data acquisition, pre-processing, segmentation, feature extraction, and classification [7]. The reason for which features are identified and chosen has a significant impact on the system’s overall performance in HAR. To extract features from time series data, previous research used two different techniques: statistical and structural [39]. Both of these are handcrafted approaches for converting raw sensor information into specific predefined attributes or descriptors. Previously, shallow learning algorithms and hand-made features have been used to classify behaviors [40]. The low depth of intermediate learnable system directions between the input and output layers can be used to define shallow configurations. The relationship between the input features and the output level is learned in these learnable intermediate systems.
As the path’s depth increases, machine learning algorithms migrate to DL frameworks. DL approaches for HAR have become increasingly popular in recent years, providing unrivaled output in a variety of fields such as visual object recognition, natural language processing, and logic reasoning [41]. DL can significantly reduce the time taken on handcrafted feature design and can learn many more high-level and realistic features. DL methods can acquire complicated feature representations from raw sensor data and choose the right patterns to enhance recognition efficiency using multiple layers of abstraction [42]. Due to the hierarchical structure of human interactions, DL automatic feature learning, which uses various levels of abstraction, is quite well suited to HAR. Simple human actions or gestures are combined to produce basic activities, which are then connected to establish more complex activities. DL has the potential to solve the feature extraction challenge that plagues traditional machine learning. In the DL approach, feature extraction and model training processes are carried out concurrently. Instead of being handcrafted individually as in traditional machine learning methods, the features can be trained automatically across the network.

2.2. Deep Learning Models for Sensor-Based Human Activity Recognition

In S-HAR research, many have proposed various DL models to tackle the challenging recognition problem, as shown in the following subsection.

2.2.1. Convolutional Neural Network

DL is a form of machine learning in which models explicitly identify images, video, text, or speech [43,44]. The CNN is the most commonly used algorithm for DL. The CNN learns from the information automatically, classifies behaviors based on trends, and excludes the need for manual feature extraction. A CNN is mainly composed of many convolutional layers and a pooling layer (also known as a subsampling layer) in general. One or more completely linked layers follow at the top.
There are many studies in which the CNN has been applied to S-HAR problems. On two publicly available datasets, Ignatov [22] introduced a CNN for local feature extraction along with simple statistical characteristics that maintain information about the entire form of the time series. Although they had satisfactory accuracy for walking upstairs, walking downstairs, sitting, standing, and laying activity recognition, they did not achieve 100% recognition performance. The CNN was also used by Benavidez and McCreight [23] on the WISDM dataset with numerous activities. Using smartphone and watch sensors, they extracted features for 18 different activities, including hand-oriented and non-hand-oriented activities. A single CNN model yielded considerable results for the authors. Despite these promising outcomes, there is still opportunity for improvement, particularly as it relates to complex human activities.

2.2.2. Long Short-Term Memory

RNNs are special types of neural networks which are specially designed to tackle time-dependent sequences. However, the RNNs suffered from the vanishing gradient problem [45] that made them hard to train with acceptable performance. This was solved by the advent of LSTMs that add additional gates for information flow between different time points. LSTMs are very popular in the natural language processing domain where they are used for word prediction, language translation, etc., including in the HAR domain [46,47].
For internal and outer recurrence, input features and temporal dependencies including memory blocks of the DL LSTM model are special features [45]. LSTM layers are mainly made up of memory blocks that are continuously linked in a memory cell. These LSTM cells are made up of gates that decide when to ignore the memory cell’s prior hidden states and modify it again, allowing the network to use temporal information.
S-HAR was also addressed to the LSTM by Benavidez and McCreight [23], with significant improvements. Singh et al. [26] employ LSTMs to interpret data acquired by smart-home sensors on human behavior. In [48], the authors compare LSTMs to CNNs and standard machine learning models. According to their findings, LSTMs and CNNs outperform other machine learning approaches, with CNNs being considerably faster in training but less accurate than LSTMs.
The BiLSTM was introduced in 1997 by Schuster and Paliwal to increase the amount of knowledge available in the LSTM network [49]. The BiLSTM is linked to two hidden layers in different directions. This structure will simultaneously acquire knowledge from the previous and subsequent sequences. The BiLSTM does not need any input data reconfiguration and can enter future inputs in its present state. Alawneh et al. [50] provided comparison results of unidirectional and bidirectional long short-term memory models on sensor-based human activity data in their S-HAR work. The results demonstrated that the BiLSTM outperforms the unidirectional technique in terms of recognition efficiency.

2.2.3. Gated Recurrent Unit

Although LSTM has proven to be a viable option for avoiding the vanishing gradient problem of RNNs, the architecture’s memory cells lead to an increase in memory consumption. Cho et al. [51] introduced the gate recurrent unit (GRU) network, a novel RNN-based model, in 2014. The GRU is a basic version of the LSTM that does not have a separate memory cell in its structure [52]. In the network of a GRU, there is an update and reset gate that deals with the modification degree of each hidden state. That is, it determines which knowledge needs to be transferred to the next state and which does not [53,54]. Okai et al. [55] established a robust DL model based on the GRU network for addressing the S-HAR problem through data augmentation. The GRU model outperformed and was more resilient than LSTM models in this study’s comparisons.
One important limitation of such a network is that it is unidirectional, i.e., apart from the current input, the output at a particular time step depends only on the past information in the input sequence. In certain situations, however, it may be beneficial to look not only at the past but also at the future to make the predictions [56]. Alsarhan et al. [57] proposed a bidirectional gated recurrent units (BiGRU) model for recognizing human activities. The results indicated that employing the BiGRU model to recognize human actions using sensor data is also rather effective.

2.2.4. Convolutional RNN-Based Network

When dealing with one-dimensional sequence data, the CNN is extremely successful at extracting and achieving features [58]. Furthermore, the CNN model can be used in a hybrid configuration with an RNN backend, in which the CNN interprets the input sub-sequences, which are then transferred in series to the RNN model for even further comprehension. As shown in Figure 1, the hybrid is defined as the CNN-RNN model, and its structure makes use of CNN layers to extract features from the input data, while the RNN portion handles sequence estimation. The CNN-RNN model can interpret sub-sequences obtained from the main sequence in the form of blocks by interpreting the major features from each block first, before the RNN defines such features. Wang et al. [59] stated that a CNN might be used to extract only the spatial data for each frame in order to tackle the HAR problem, and the researchers developed two types of LSTM networks to investigate temporal features in subsequent video frames. Nan et al. [60] enhanced various models in their study, including the 1D-CNN, a multichannel CNN, a CNN-LSTM, and a multichannel CNN-LSTM model. The computational efficiency and accuracy of the various models were compared, and the well-developed multichannel CNN-LSTM model was finally determined to be the best strategy for investigating long-term activity recognition in older people.
Many DL models, such as InceptionTime [29], temporal transformer networks [61], and LSTM-FCNs [62], have been presented in the last year to solve specialized problems in time-series categorization. In an HAR study, InceptionTime outperformed ResNets and CNNs by using a real-world dataset to classify transportation-related behaviors using inertial sensor data from a smartphone [61]. In [63], a modified InceptionTime model called Inception-ResNet was presented to perform on the HAR challenge and achieve meaningful results. The InceptionTime model, on the other hand, necessitates a significant amount of training data and a large number of hyperparameter optimizations. This work stands out from earlier research in that it proposes a unified DL strategy for recognizing complicated activities. Human activity aspects that are complex are typical of people’s daily lives and are more difficult to recognize. For designing wearable applications for real-time S-HAR, it is important to recognize CHAs. The motivation for the proposed model is to improve the recognition performance of the existing HAR model and to analyze the impacts of various aspects in the recognition of complex activities according to considerable variability in human motions. To our knowledge, this is the first study to show the impact of several learning parameters on DL techniques, such as sliding window sizes, convolution layer combinations, and the bidirectional methodology. This study reports extensive studies to compare the recognition performance of the four baseline DL models with our suggested hybrid DL models, named CNN-BiGRUs, in various learning settings in order to achieve the purpose of our research.

3. The Proposed S-HAR Framework

This section presents an S-HAR framework for addressing the study’s goal of CHA recognition. Using signal data gathered from wrist-worn sensors, the S-HAR framework developed in this research leverages DL algorithms to explore the activity conducted by the wearable device’s user.
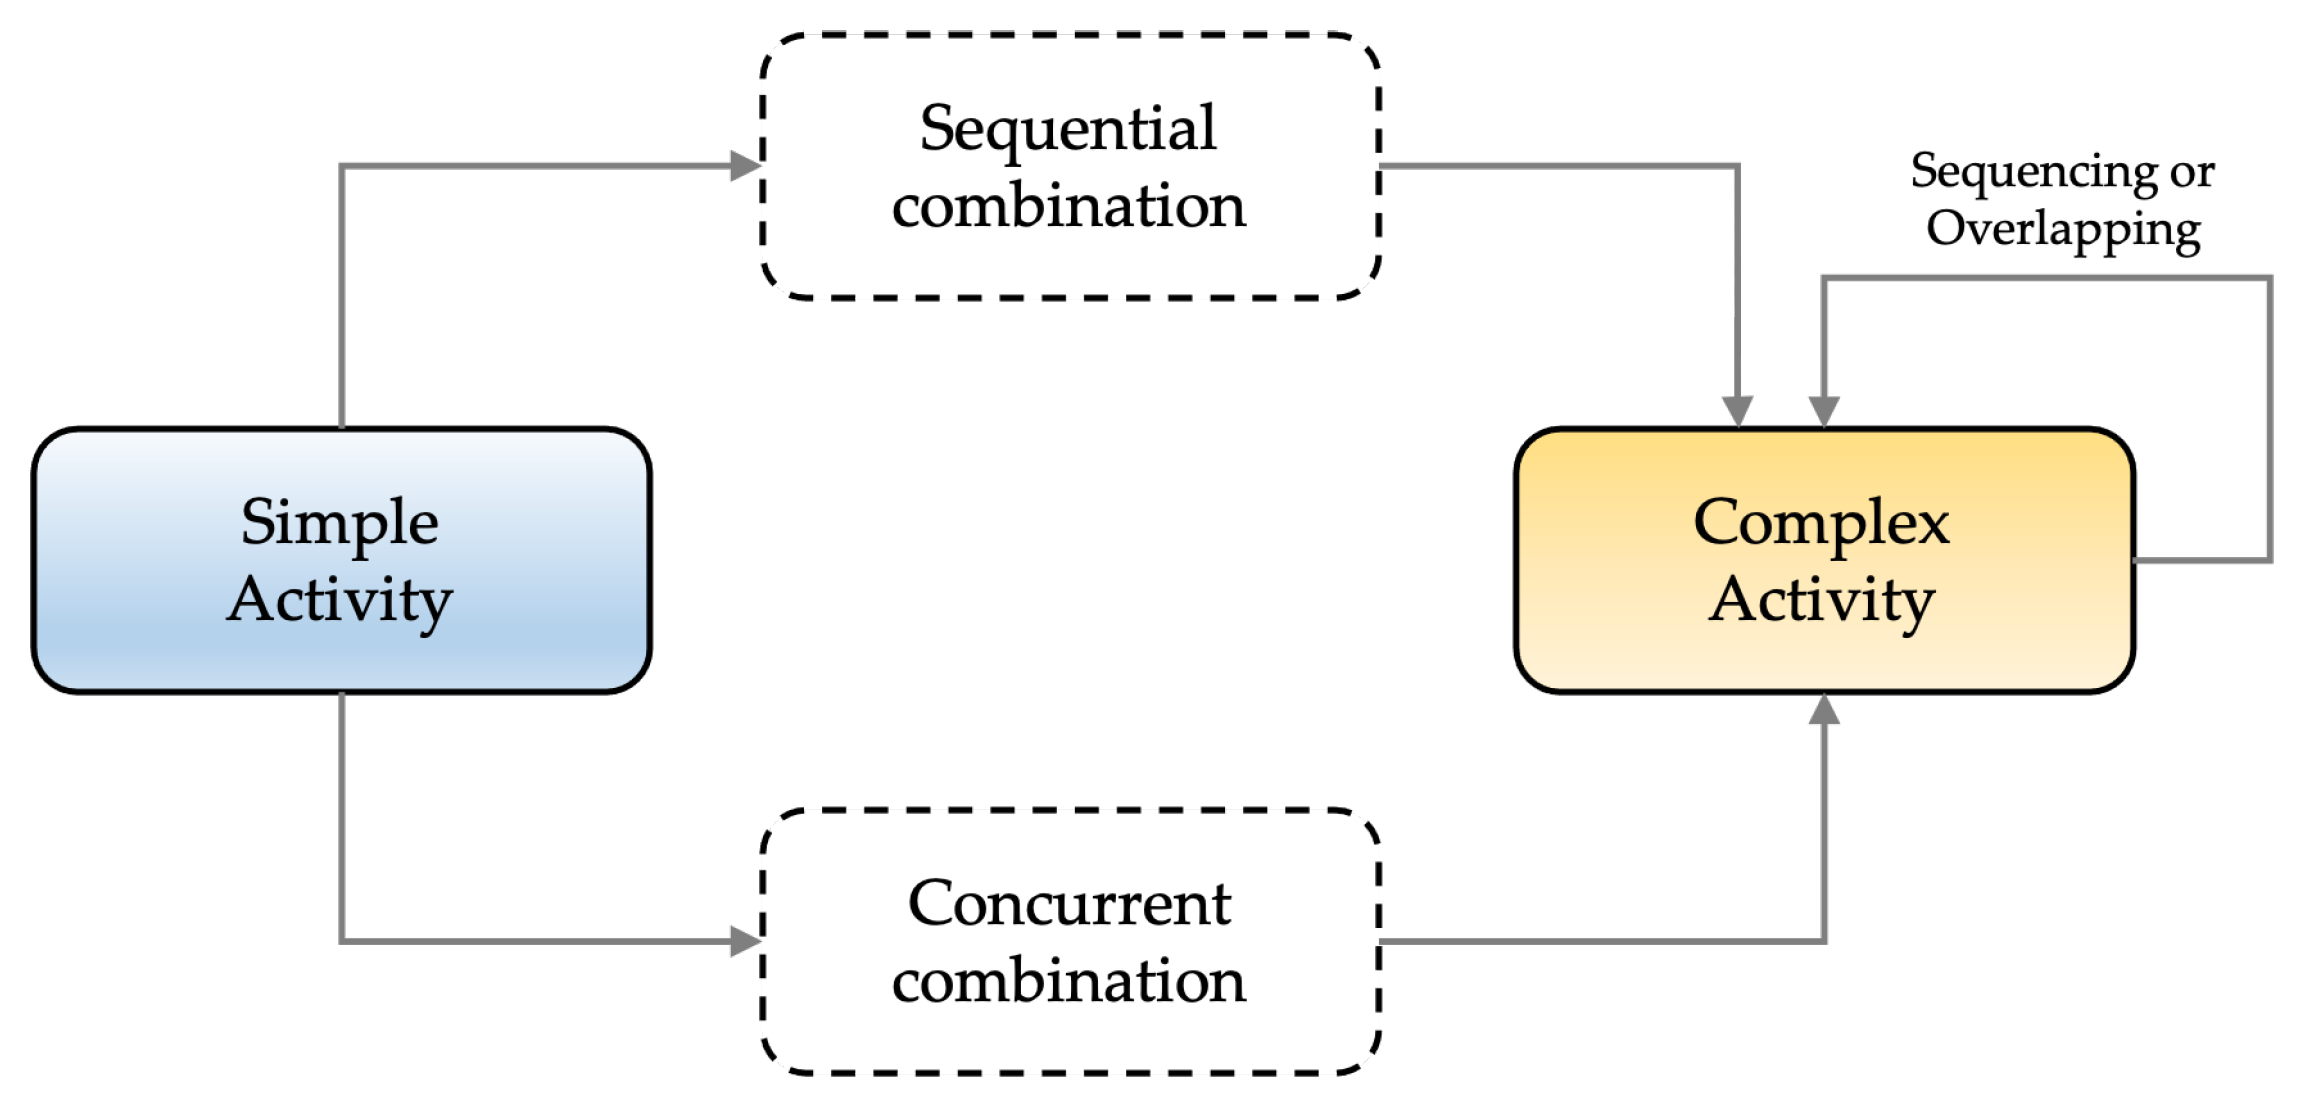
To address the problem of complex human recognition, we explored activity taxonomies [19,35,64] and classified human activity into two classes, simple and complex, using the SC 2 taxonomy paradigm [35] as shown in Figure 2.
  • A simple activity is a unit-level human behavior that is defined by body motion or posture and cannot be further dissected. For example, “walking”, “standing”, and “sitting” can all be described as simple activities because they cannot be further deconstructed into other unit-level activities.
  • A complex activity is a high-level human process which involves a sequence or overlapping of simple human activities, sequential activities, or other complex activities. The recursive definition of complex activity can be used to depict a variety of complex circumstances. For example, “sitting and sipping a cup of coffee” is a simultaneous combination of two unit-level activities: “sitting” and “raising a cup to drink”.

3.1. Overview of the S-HAR Framework

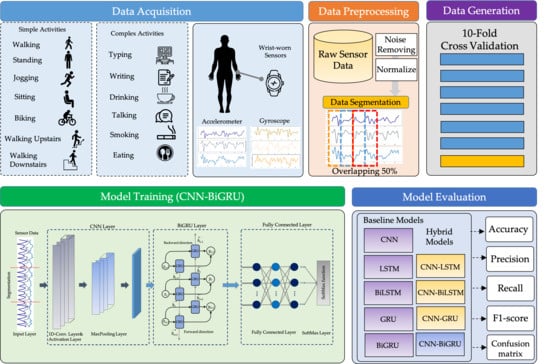
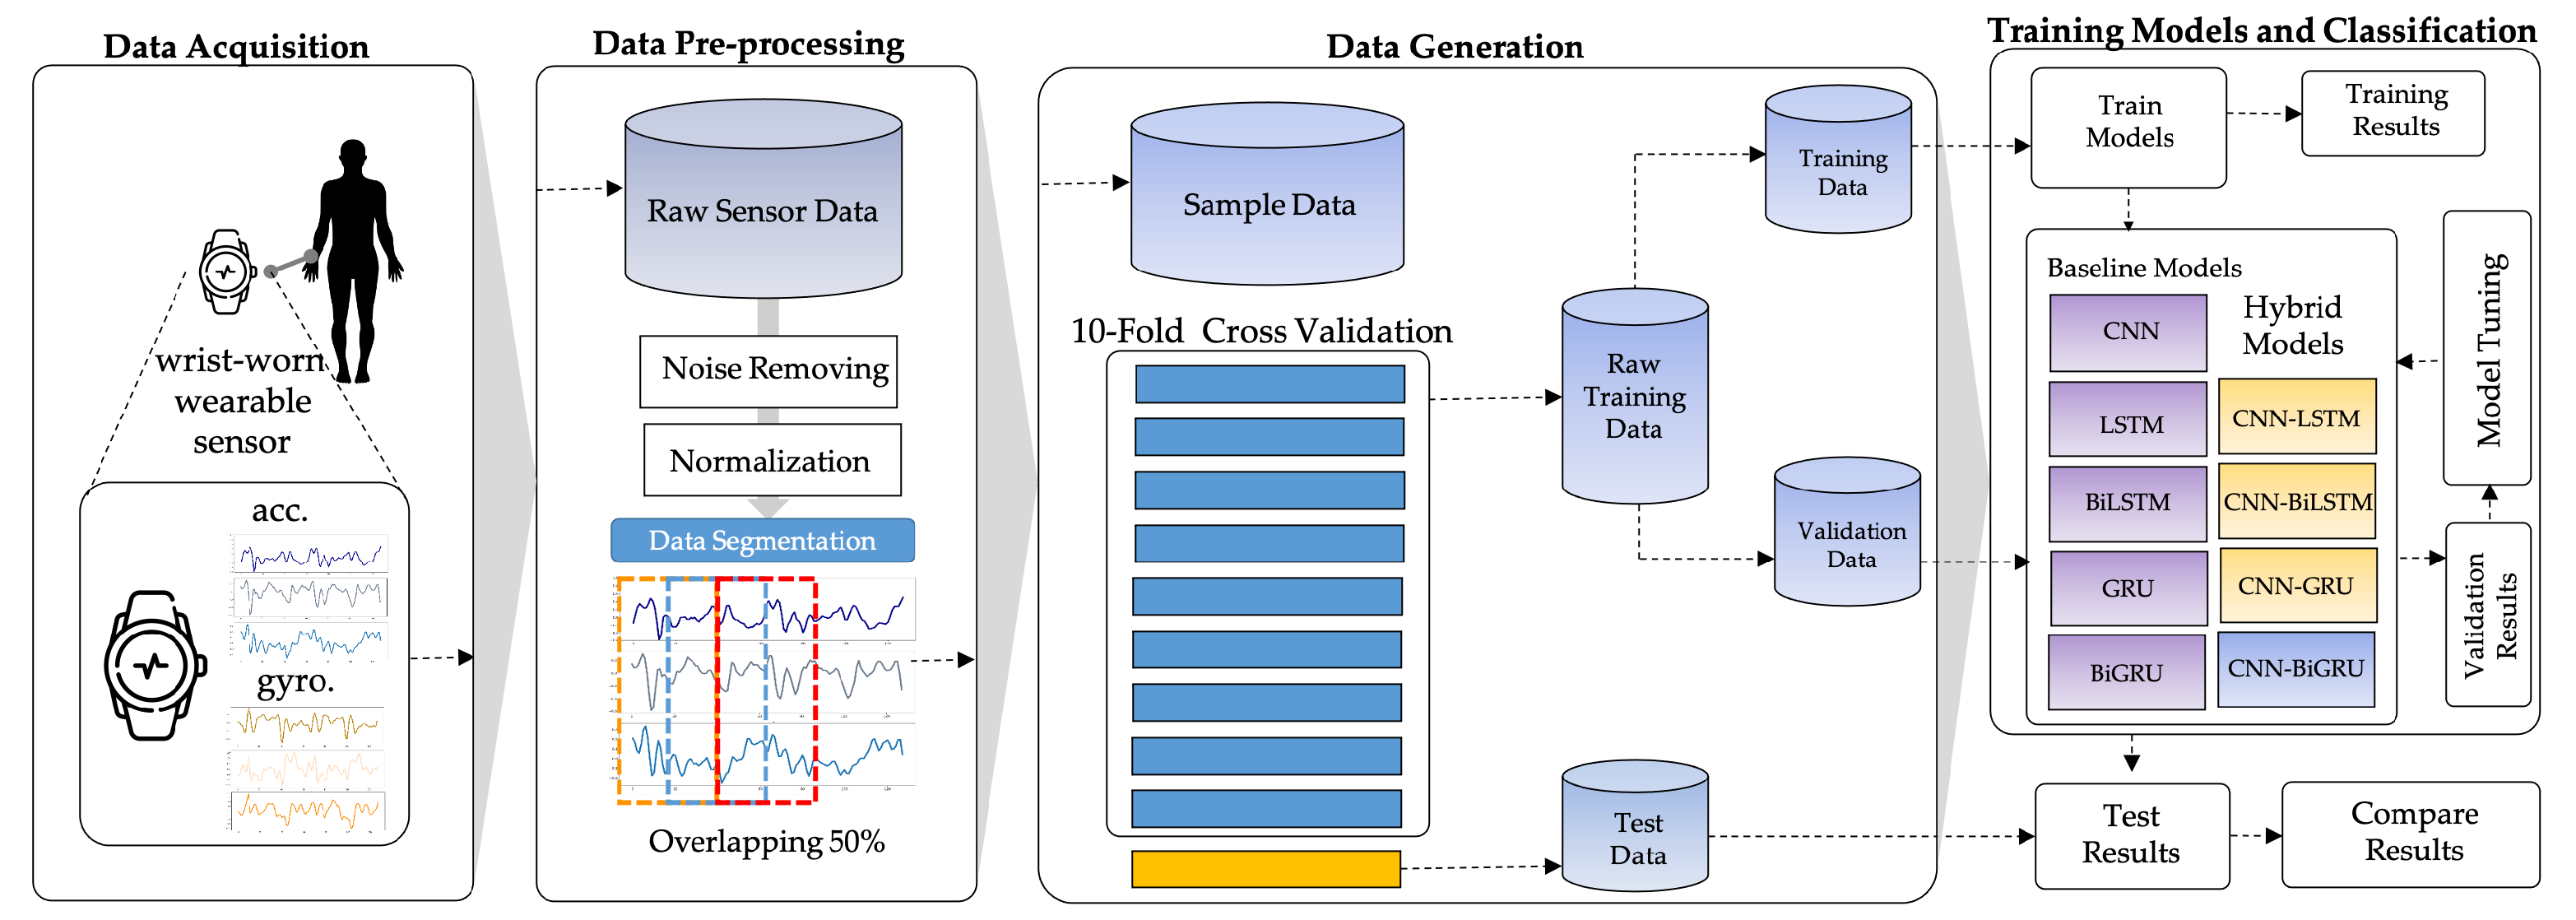
This section summarizes the entire configuration of the proposed S-HAR framework. Data acquisition, which includes data gathering from wrist-worn sensors, is the first step in the process. The next step is data pre-processing, which includes noise reduction, missing data filling, and data normalization. Data segmentation is also required in this procedure to convert multi-dimensional sensor data into sample data in suitable conditions for model training. This covers the definition of temporal windows, the overlap of temporal windows, and the class assignment and labeling. Following this, the sample data are separated into training and test data using the 10-fold cross validation approach in the data generation stage. DL model training with variations of DL models is the next step. Four RNN-based DL models (LSTM, BiLSTM, GRU, and BiGRU) and hybrid DL models are included in our proposed CNN-BiGRU model. Finally, performance evaluation criteria such as accuracy, precision, recall, F1-score, and confusion matrix are used to validate these models. As a result, a confusion matrix is used to compare the results of each DL model. Figure 3 shows the workflow for the proposed S-HAR framework.

3.2. Data Acquisition

In this paper, we select a public wrist-worn dataset to study, which is a public benchmark dataset called “Complex Human Activities using smartphones and smartwatch sensors” (shortly, UTwente dataset) [20]. This dataset was publicly released by a pervasive system research group, Twente University, in late 2016. They gathered a dataset for 13 human activities from 10 healthy participants, as shown in Table 2. All 10 participants were asked to carry two Samsung Galaxy S2 mobile phones in their right pants pockets and on their right wrists, thereby emulating a smartwatch. To collect sensor-based activity data, they were asked to perform seven daily-life basic activities for three minutes. Seven of these ten participants were asked to perform additional complex activities including eating, typing, writing, drinking coffee, and talking for 5–6 min. Six of the ten participants were smokers and were asked to perform smoking one cigarette. To create a balanced class distribution, the authors used 30 min of data for each activity from each participant. The data were captured for an accelerometer, a linear acceleration sensor, a gyroscope, and a magnetometer at a rate of 50 Hz.
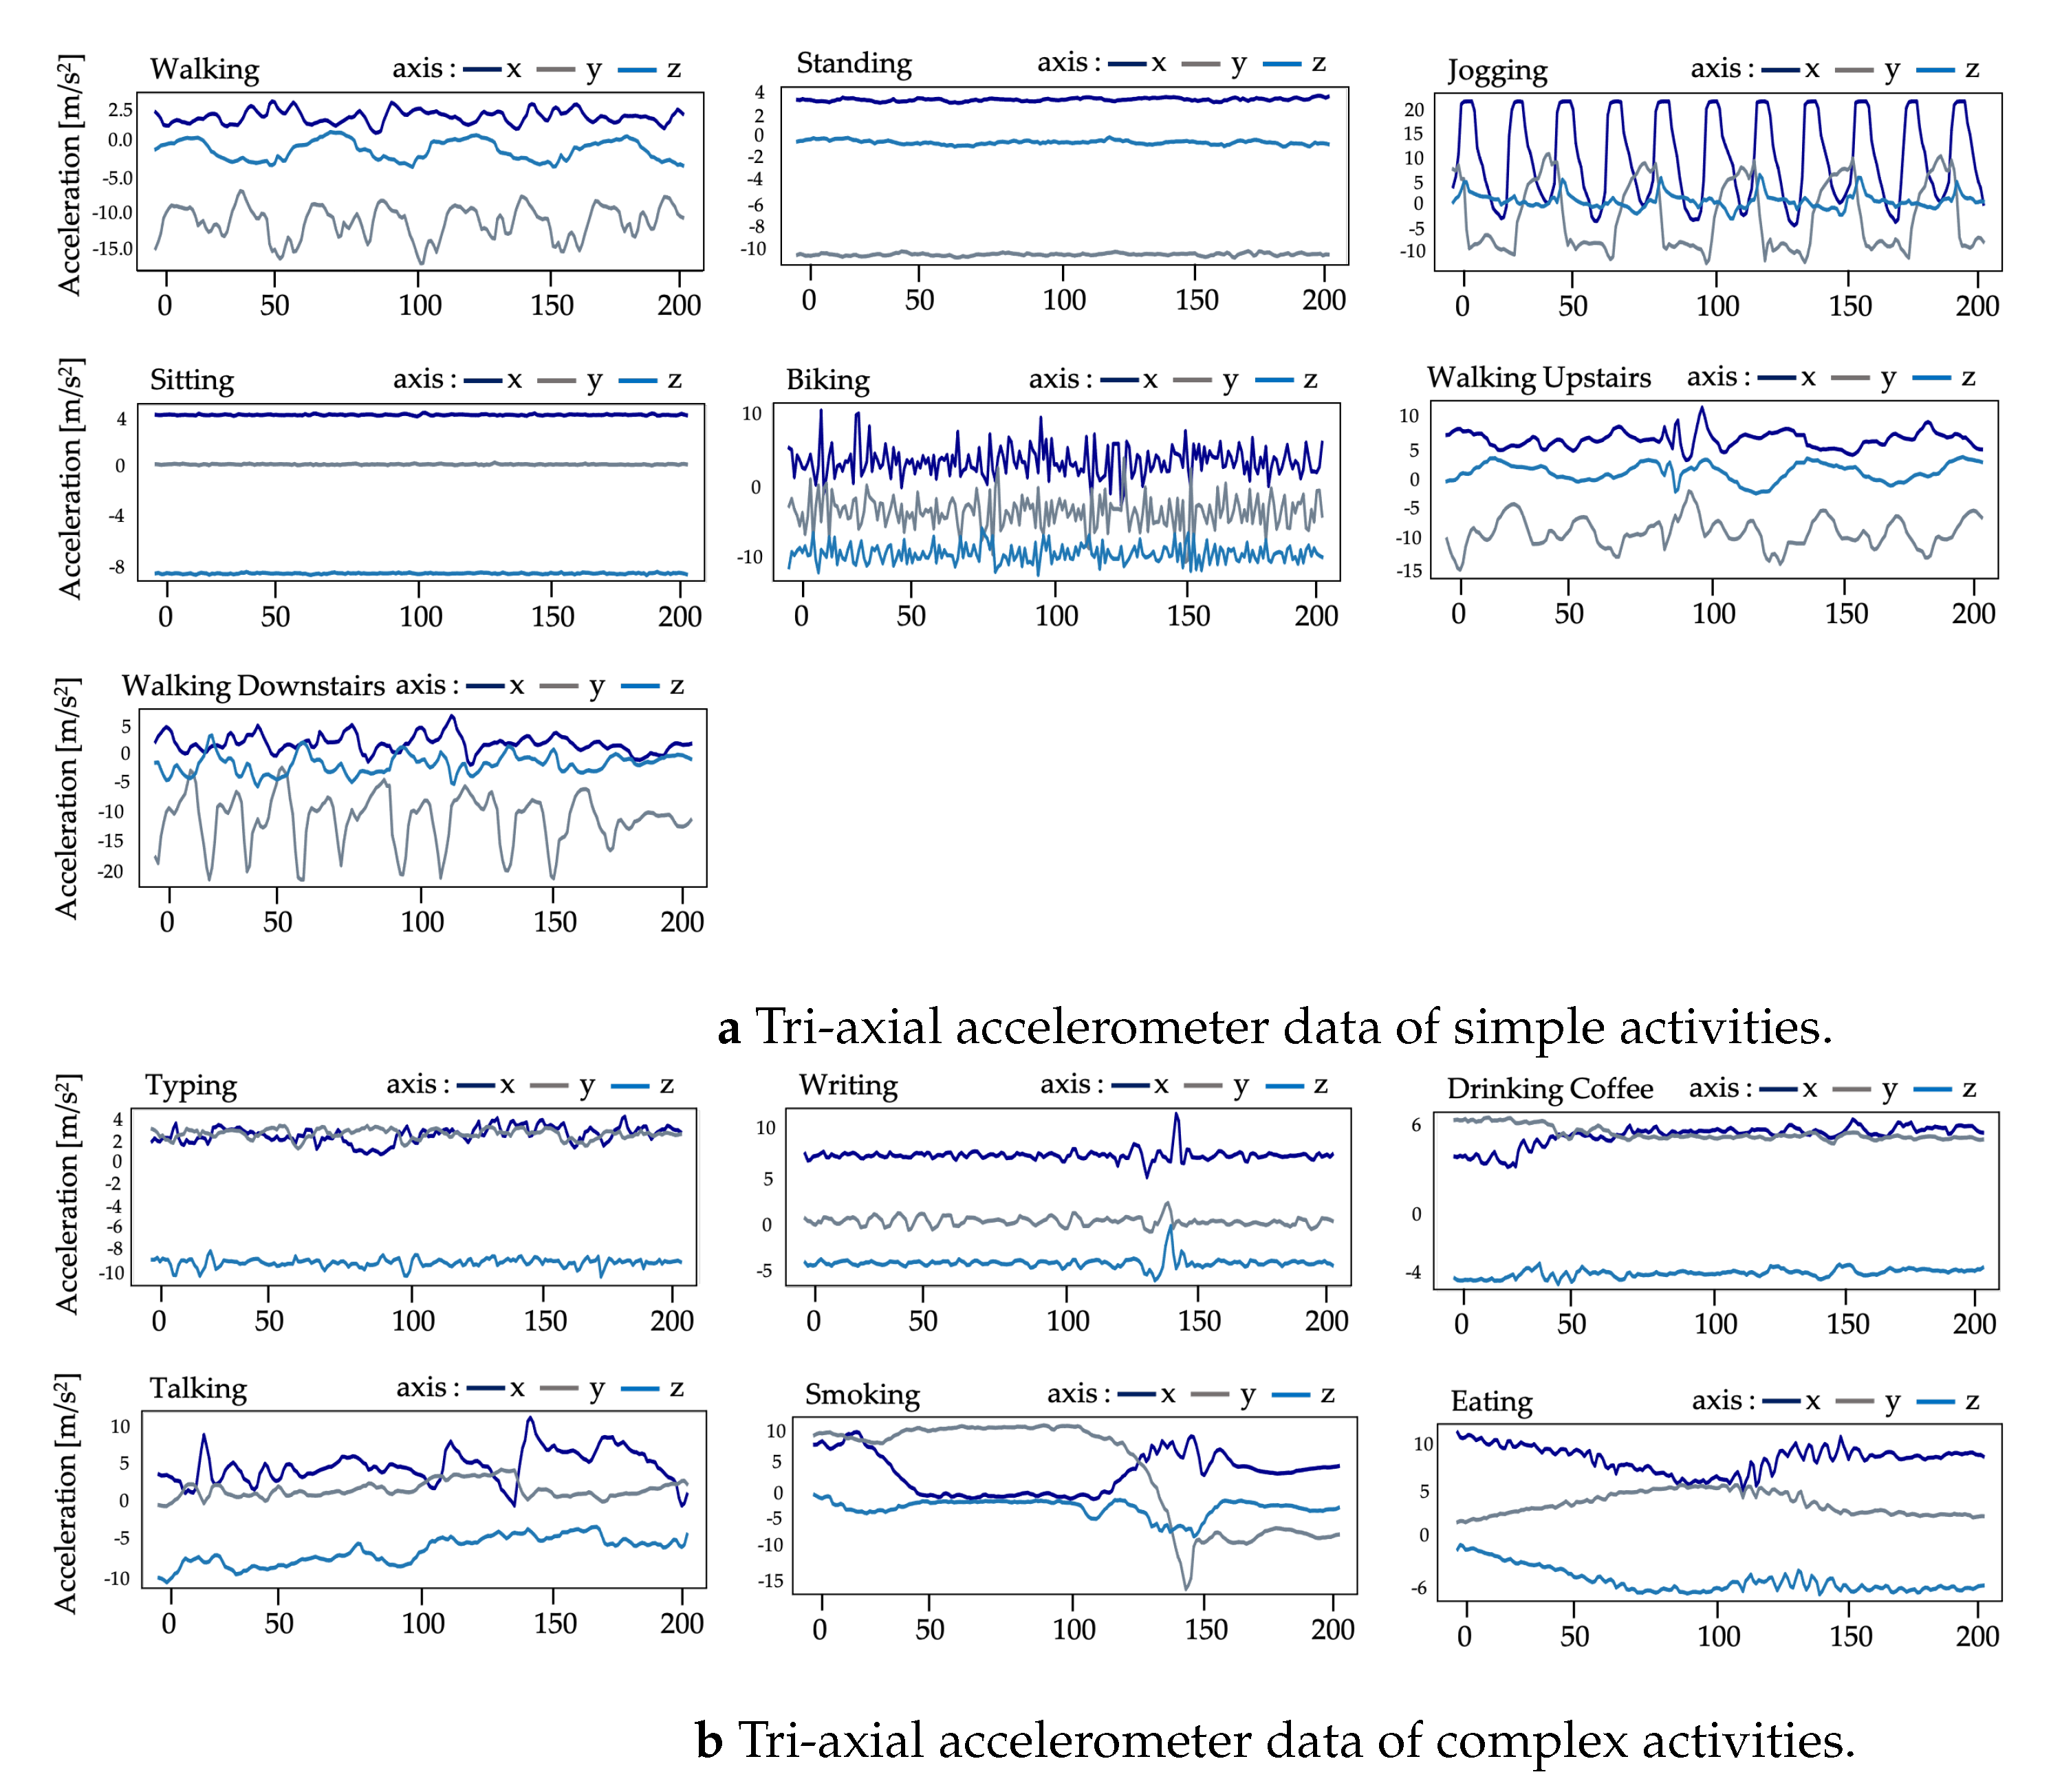
The graphical plots of accelerometer and gyroscope data from some activity samples in the UTwente dataset are demonstrated in Figure 4 and Figure 5, respectively.
Figure 4 shows graphical plots of the tri-axial accelerometer data for seven activities categorized as simple, including “Walking”, “Standing”, “Jogging”, “Sitting”, “Biking”, “Walking Upstairs”, and “Walking Downstairs”. We can observe that most of the sensor data are repetitive and stable. The accelerometer data are distinguishable from the six activities categorized as complex, including “Typing”, “Writing”, “Drinking Coffee”, “Talking”, “Smoking”, and “Eating”, as shown in Figure 4b. As mentioned in Section 2, the complex activities are hand-related. The accelerometer data of complex activities can be perceived as being non-repetitive.
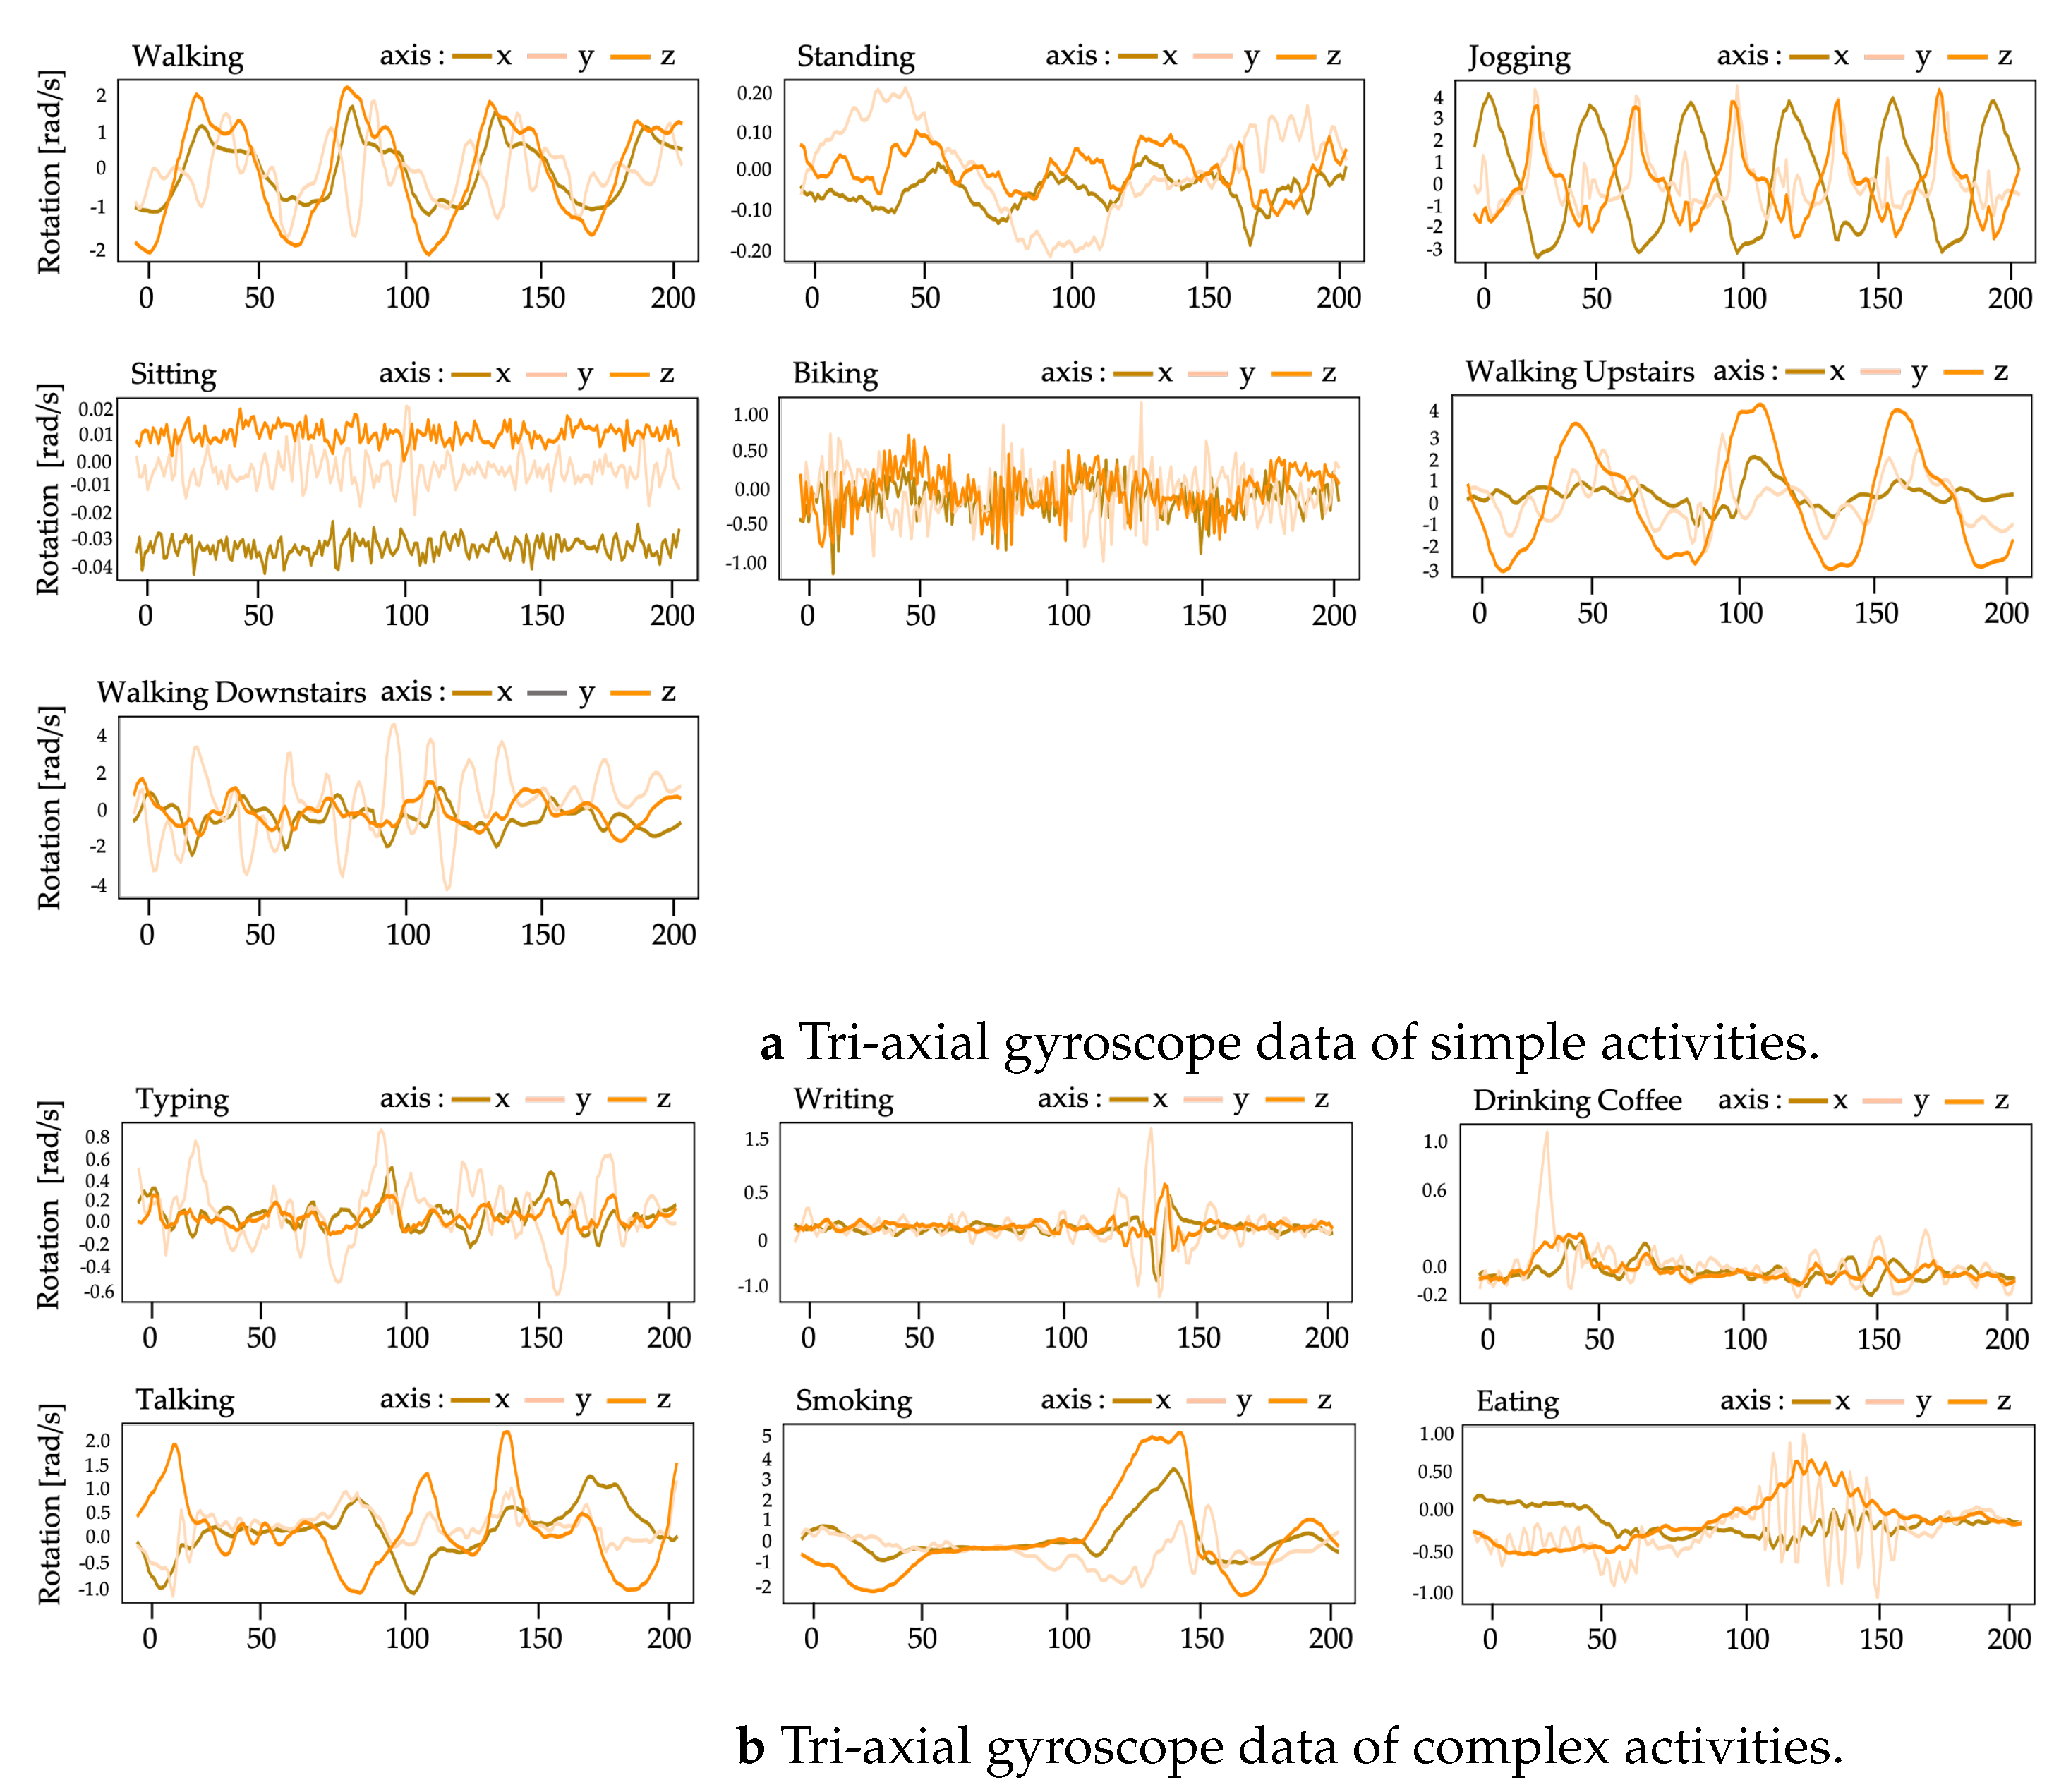
Figure 5 shows graphical plots of the tri-axial gyroscope data for simple human activities (Figure 5a) and complex human activities (Figure 5b). The angular velocity (in radians per second) of each axis is measured by the gyroscope. The gyroscope data for the simple activities illustrated in Figure 5a show that the majority of them are visibly repeated. The gyroscope data for complex actions, on the other hand, are non-repetitive, as seen in Figure 5b.

3.3. Data Pre-Processing

The data collected by the wearable sensors are filtered and standardized in this step, resulting in a dataset that is consistent and suitable for training an identification model. In this method, all incomplete and outlier data values are discarded, as follows:
  • The imputation approach with the linear interpolation method is used to fill in uncompleted values in sensor data;
  • Noises have been eliminated. A median filter and a third-order low-pass Butterworth filter with a 20 Hz cutoff frequency were employed to reduce noise in the sensor data used in this study. Because 99% of the energy in human body movement is held below 15 Hz, this rate is adequate for collection [65];
  • To transform each piece of sensor data with mean and standard derivation, a normalization procedure is used [66].
For the normalization procedure, a min-max technique is employed in this work to make a linear modification of the raw sensor data. The dataset that has been cleaned and normalized is the eventual input for the data generation and model training processes. The data are separated according to the method in order to train the classifier. The second set is used as a test set to evaluate the trained classifier’s performance.
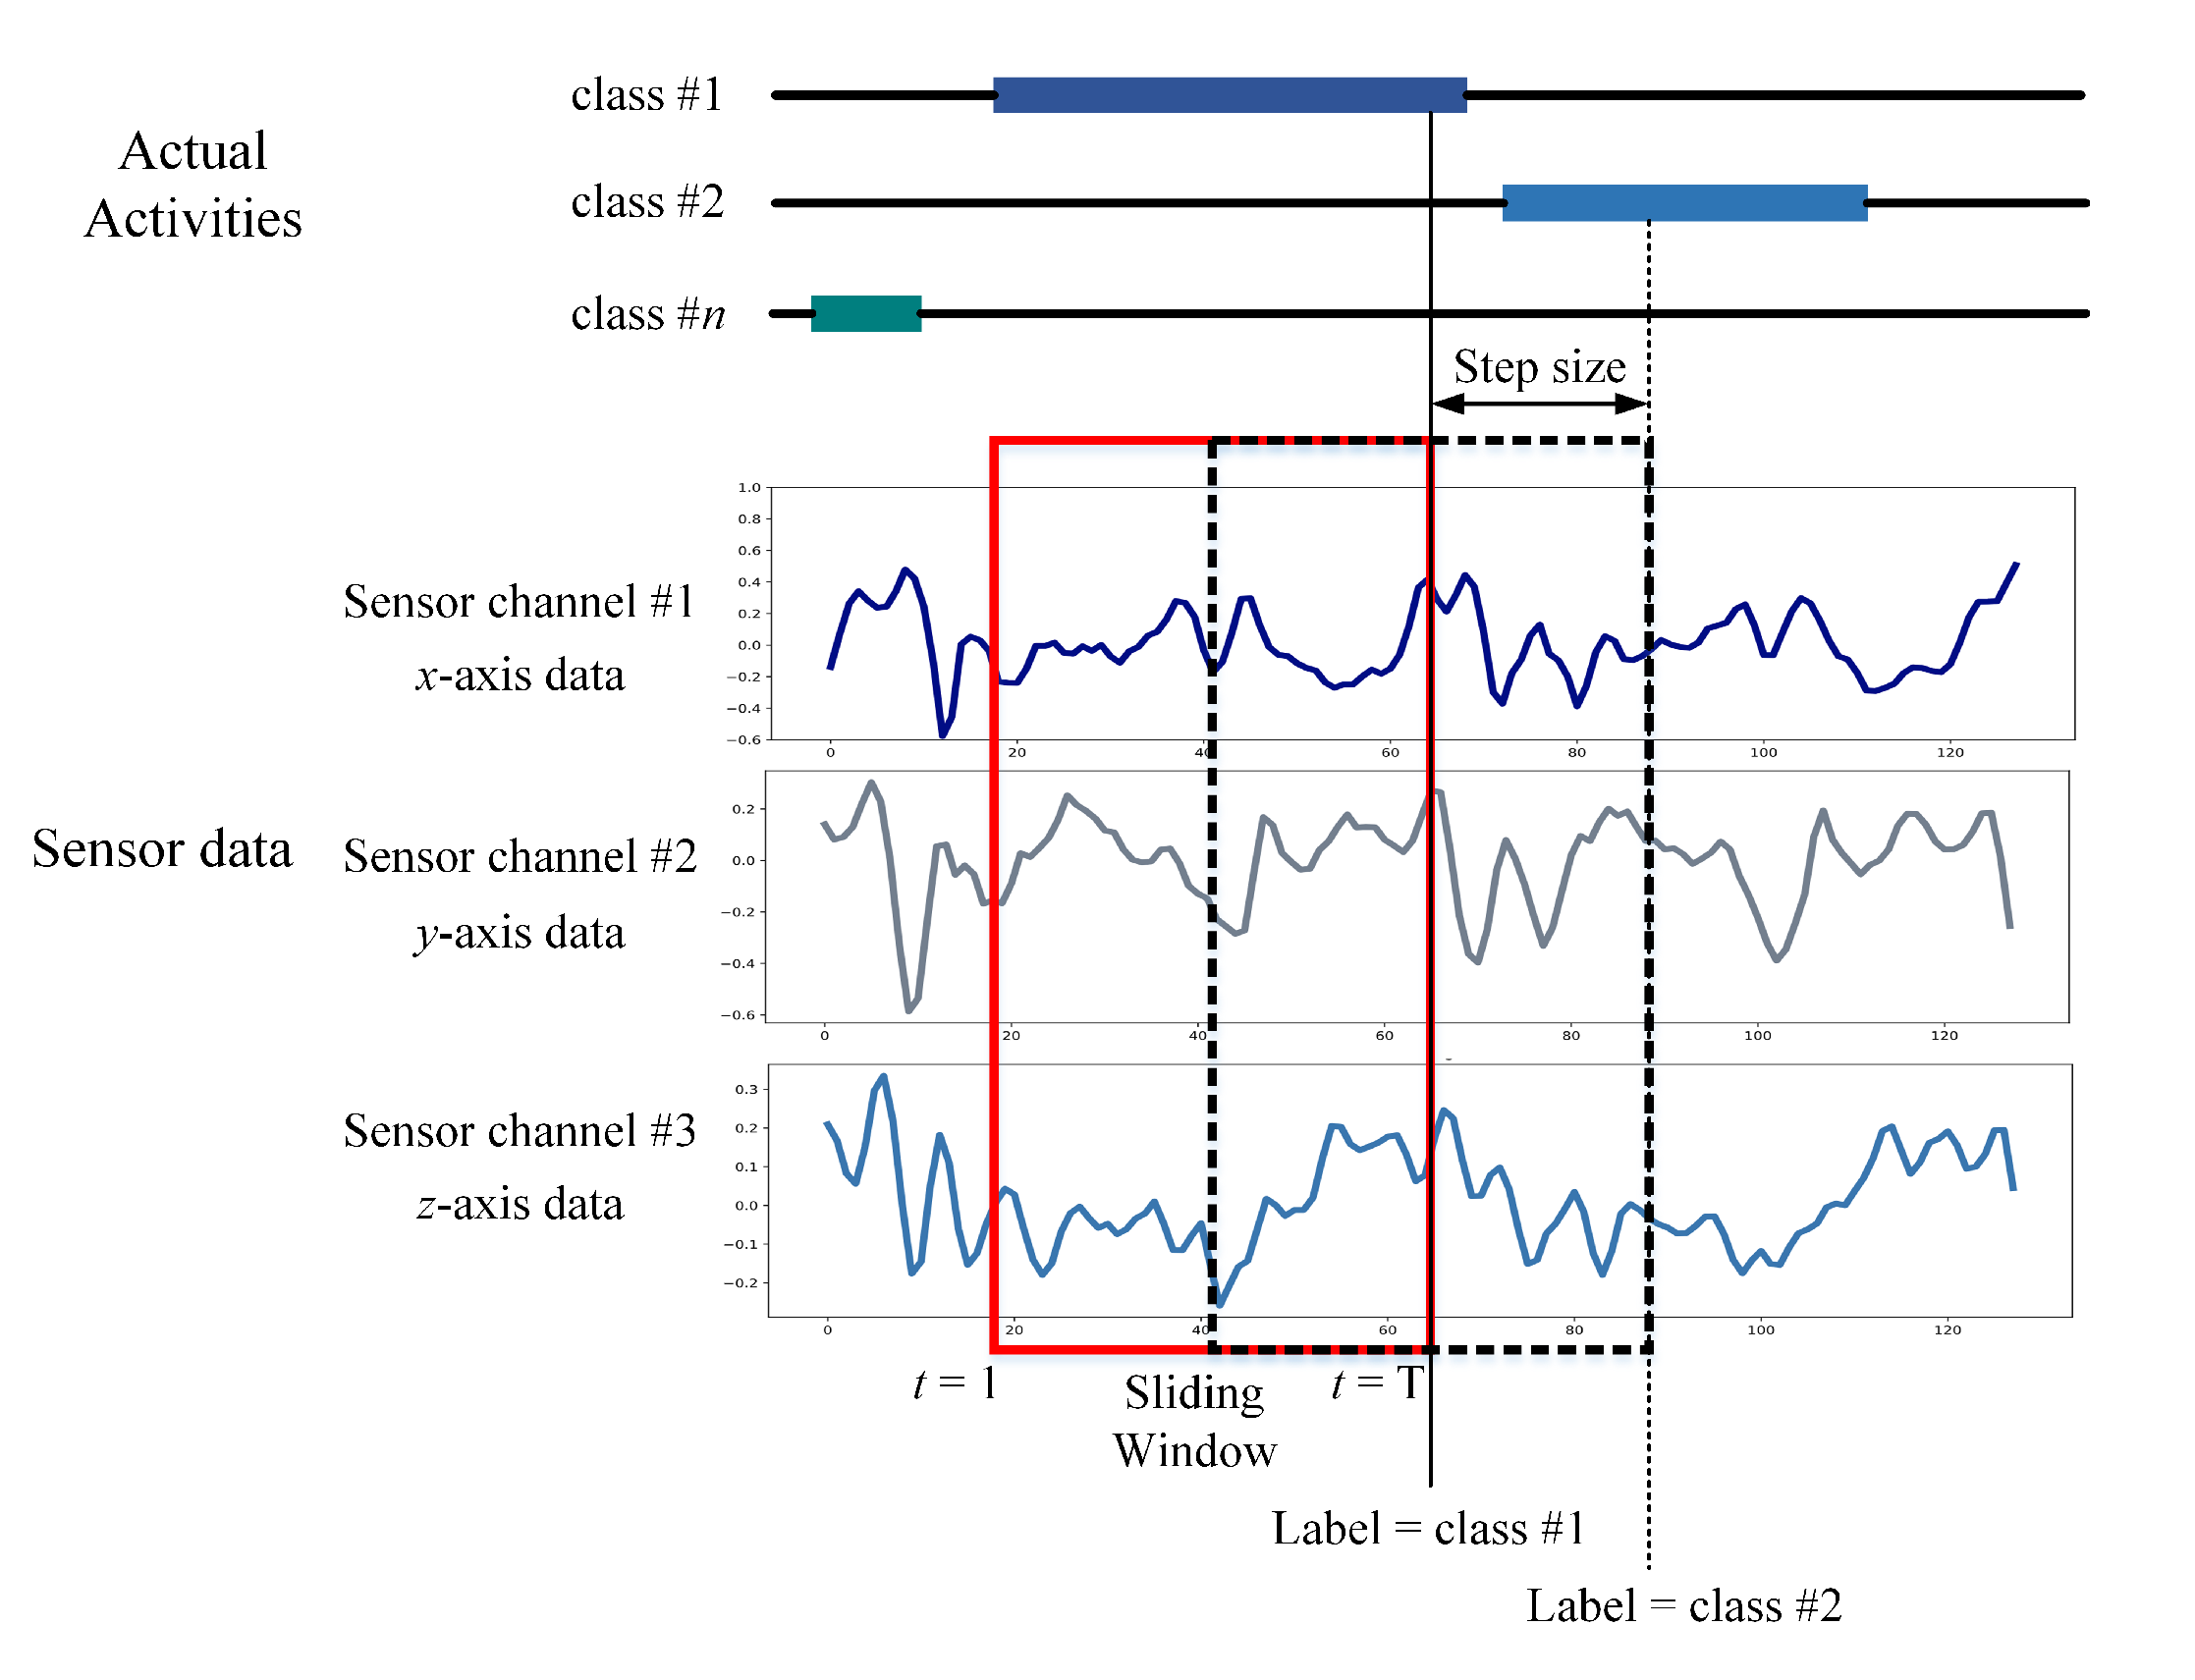
The next step of the proposed S-HAR is to create data samples from the raw sensor data. The raw data was segmented into small windows of the same size, known as temporal windows, in this method. Before training a DL model, raw time-series data recorded from wrist-worn wearable sensors are split into temporal segments. The sliding approach is frequently used and has been demonstrated to be useful for handling flowing data. Figure 6 depicts a data segmentation scheme with an example of sensor data segmentation, where X, Y, and Z represent the three components of a tri-axial wrist-worn sensor. All time intervals are the same as Δ t, defined as the window size. The D t refers to the reading of X, Y, and Z in the period [t, Δ t]. The method is known as an overlapped temporal window and involves applying a fixed-size window to the sensor data sequence to generate data samples. With a 50% overlap proportion, the OW scheme is commonly utilized in S-HAR research [24]. In the proposed S-HAR, the wrist-worn data were segmented with window sizes of 5, 10, 20, 30, and 40 s with the overlapping of 50% in this process.

3.4. Data Generation

In this process, data samples are segmented into training data, while the temporal windows from the signals are used to learn a model and test the data to validate the learned model. Cross validation is used as the standard technique, whereby the data are separated into training and test data [67]. To split the data for training and testing, several techniques can be utilized, such as k-fold cross validation [68]. The goal of this step is to assess the learning algorithm’s ability to generalize new data. For this step, we employ 10-fold cross validation in the S-HAR framework.

3.5. The Proposed CNN-BiGRU Model

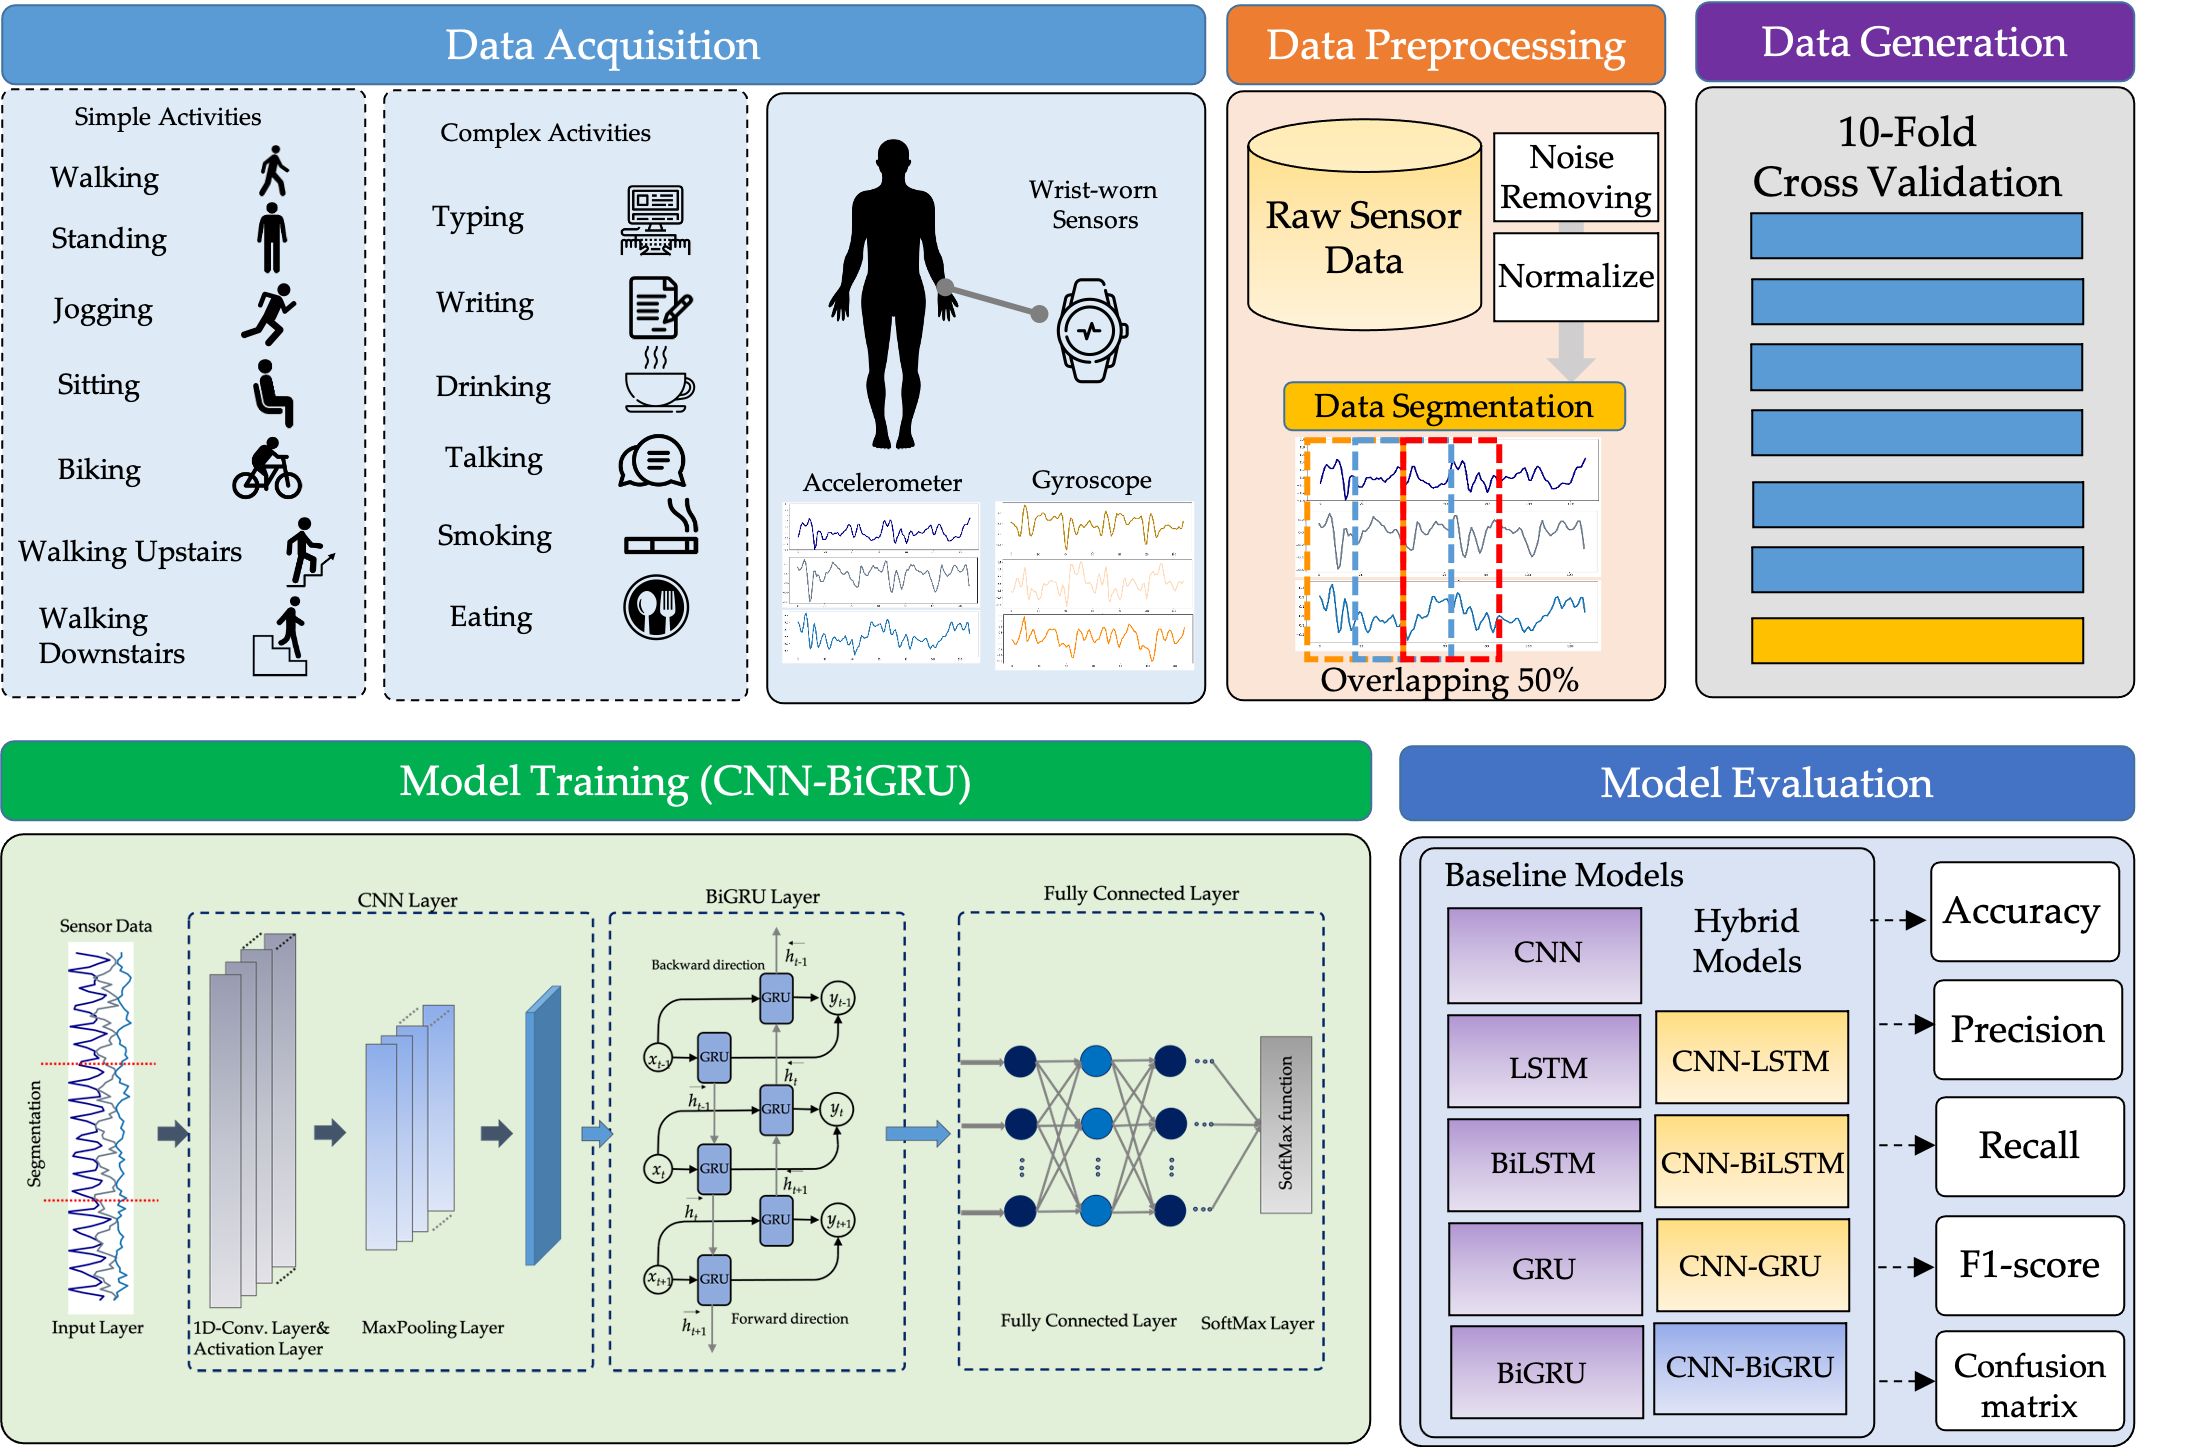
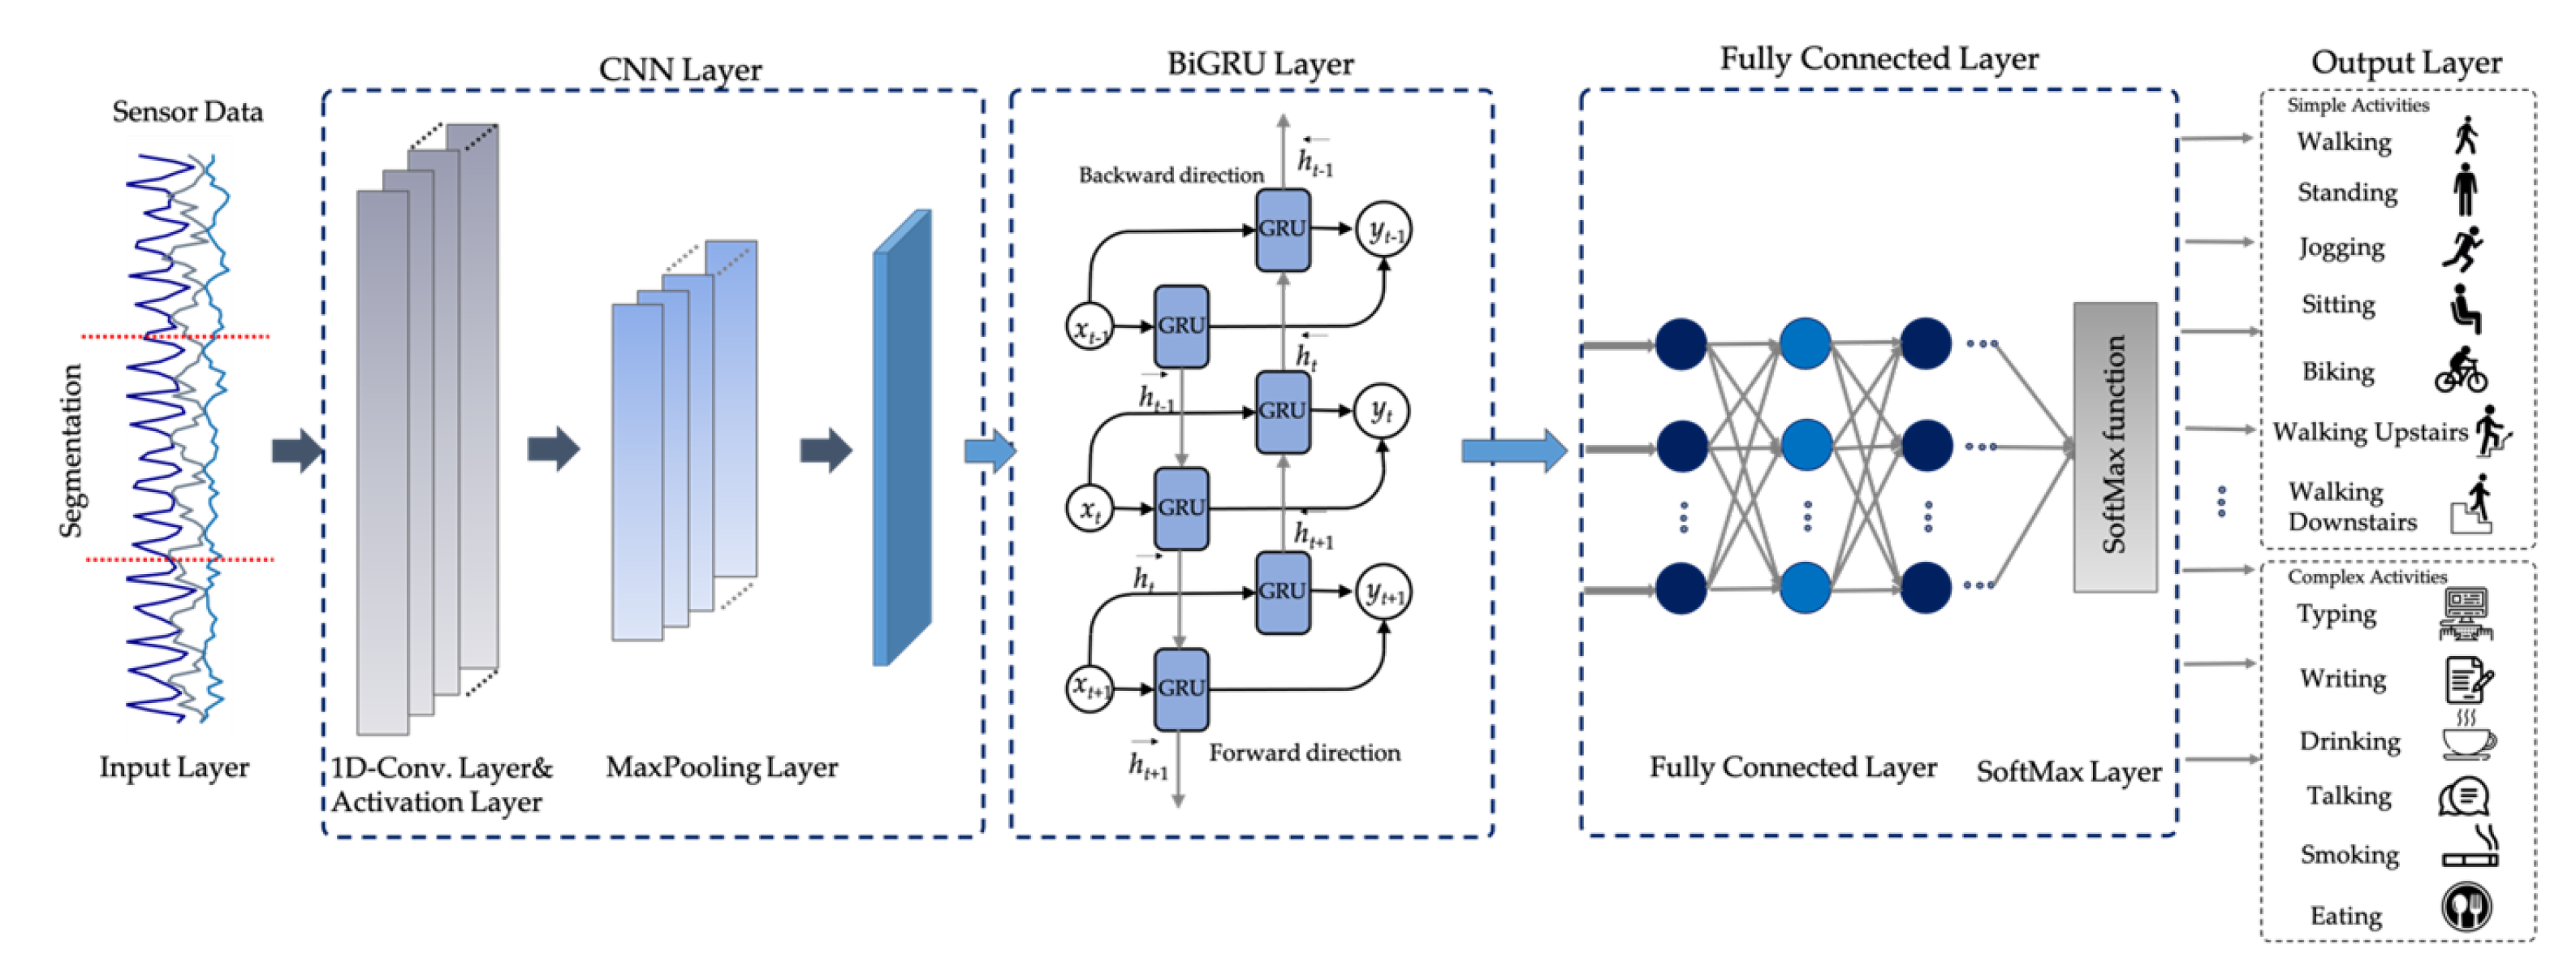
The architecture for the proposed CNN-BiGRU model is illustrated in Figure 7. The main design of the proposed DL model to solve the CHA problem involves employing CNN and BiGRU to automatically extract spatio-temporal features.
The input for the proposed DL model is the time-series in a time window of size T from N sensors. Let the input time series be X = { x 0 , x 1 , x 2 ,…, x t , x t + 1 ,…} where x t R is the input at time point t. It consists of three sub-modules: (1) an embedding layer consisting of multiple one-dimensional convolutional layers to learn locally spatial features from the inputs of wearable sensors; (2) an encoder consisting of one or more bidirectional gated recurrent unit (BiGRU) layers to extract long temporal features from the abstract information in the preceding CNN layer; and (3) a fully connected module composed of hidden layers of a deep neural network. Each hidden layer is composed of neural nodes which relate to the neural nodes of the previous layer. We add a SoftMax classification layer on top of these sub-modules.
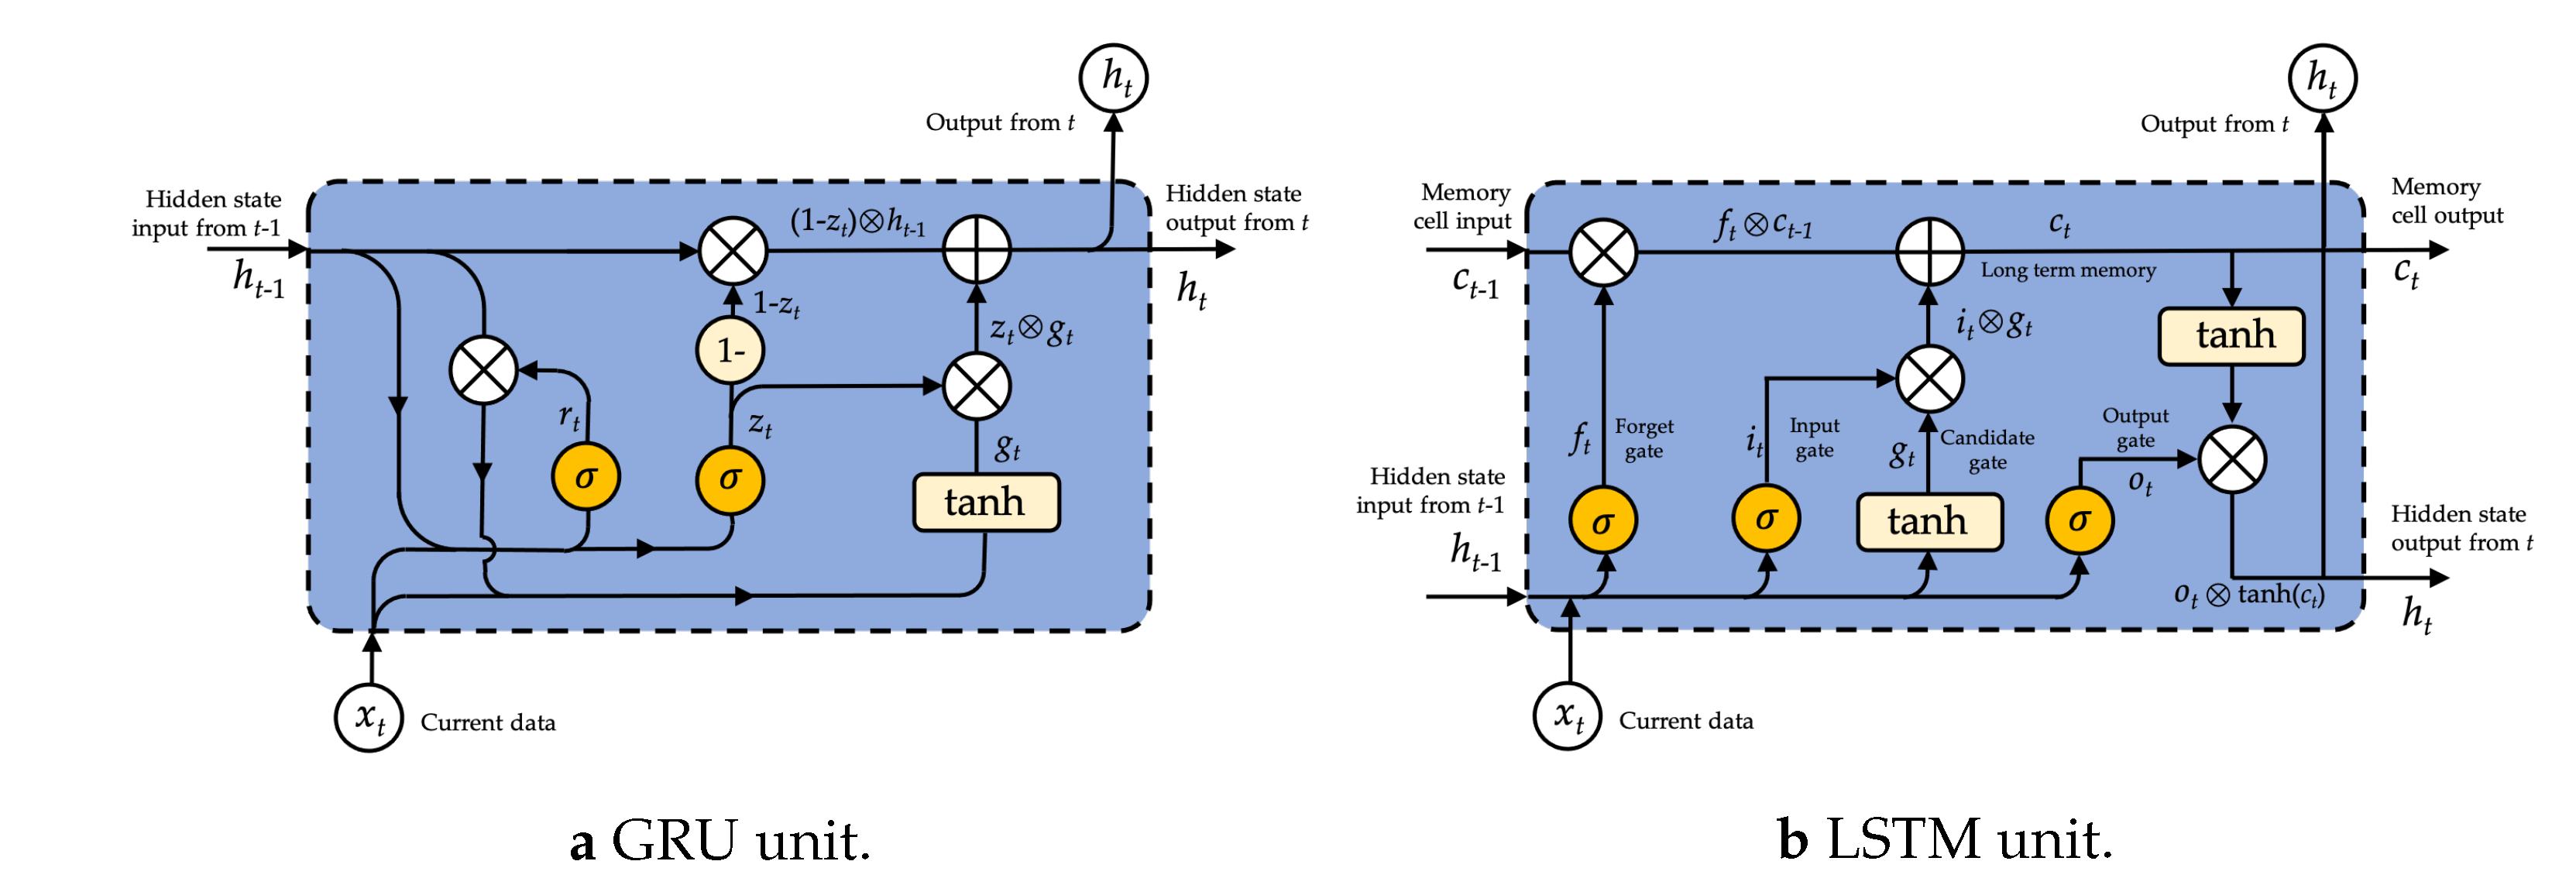
The GRU is an improved version of the LSTM that does not have a separate memory cell in its structure [52]. In the network of a GRU, there is an update and reset gate that deals with the modification degree of each hidden state as shown in Figure 8. That is, it determines which knowledge needs to be transferred to the next state and which does not [53,54]. GRU considers hidden state h t at time t from the output of the update gate z t , reset gate r t , current input x t , and previous hidden state h t 1 , determined as
z t = σ ( W z x t U z h t 1 )
r t = σ ( W r x t U r h t 1 )
g t = tanh ( W g x t ) U g ( r t h t 1 )
h t = ( ( 1 z t ) h t 1 ) ( z t g t )
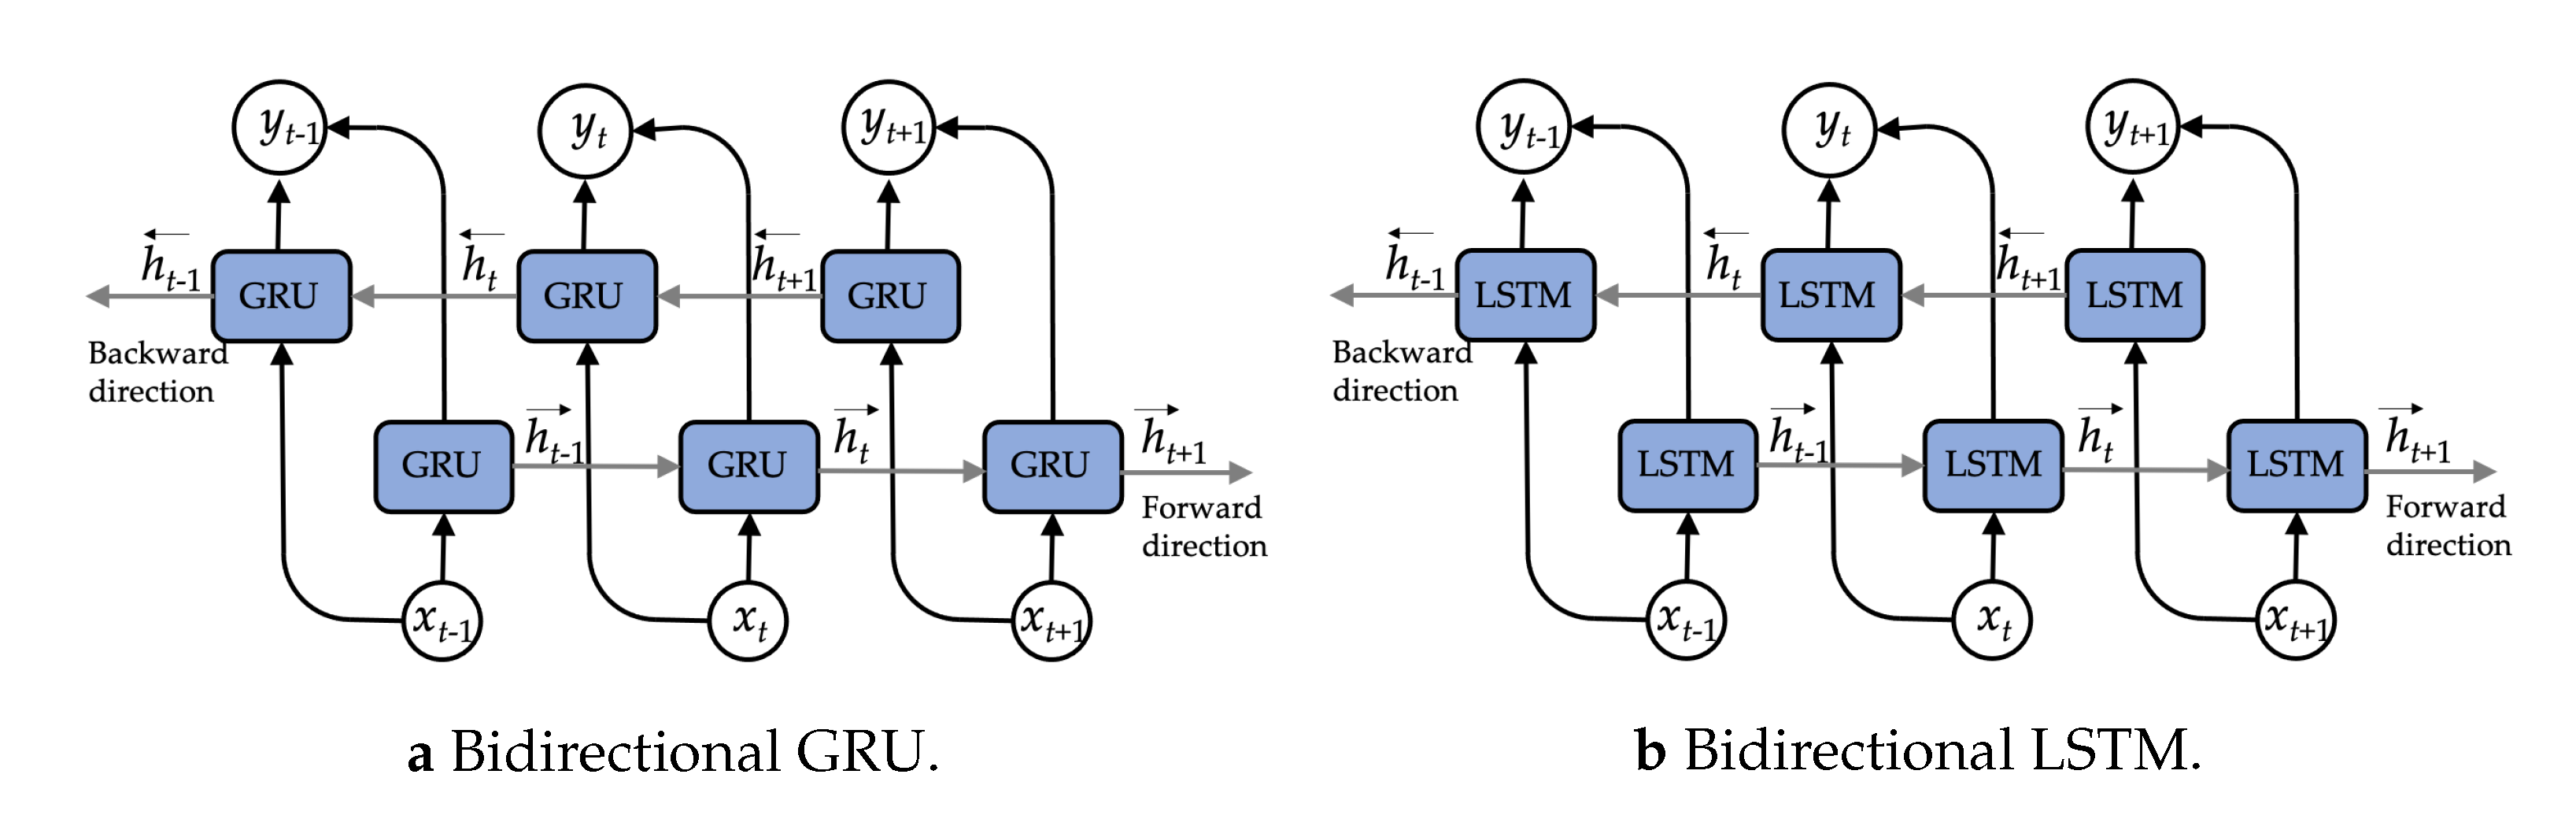
The GRU can be accomplished using a bidirectional network called a BiGRU which is presented next as shown in Figure 9. The BiGRU is linked to two hidden layers in different directions. This structure will simultaneously acquire knowledge from the previous and subsequent sequences. The BiGRU does not need any input data reconfiguration and can enter future inputs in its present state. Figure 9a illustrates the architecture of the BiGRU. The front of GRU networks ( h t ) and reverse GRU networks ( h t ) determine the features of the input data. The BiGRU network generates vector P t at time phase t. These related details are formulated as follows:
h t = G R U ( h t 1 , x t , c t 1 )
h t = G R U ( h t + 1 , x t , c t + 1 )
P t = [ h t , h t ]
A summary of the hyperparameters for the proposed CNN-BiGRU networks in this work is presented in Table 3.

3.6. Performance Measurement Criteria

The proposed DL model is evaluated in the 10-fold cross validation step to assess the effectiveness of activity recognition. The following equations represent the mathematical expressions for all five measures:
A c c u r a c y = T P + T N T P + T N + F P + F N
P r e c i s i o n = T P T P + F P
R e c a l l = T P T P + F N
F 1 s c o r e = 2 × R e c a l l × P r e c i s i o n R e c a l l + P r e c i s i o n
These are the most prominent assessment criteria used in HAR study. A true positive (TP) identification for the designated class and a true negative (TN) identification for all other classes are used to classify the recognition. It is possible that activity sensor data from one class are misclassified as data from another, resulting in a false positive (FP) identification of that class, though activity sensor data from another class may also be incorrectly identified as belonging to that class, resulting in a false negative (FN) identification of that class.
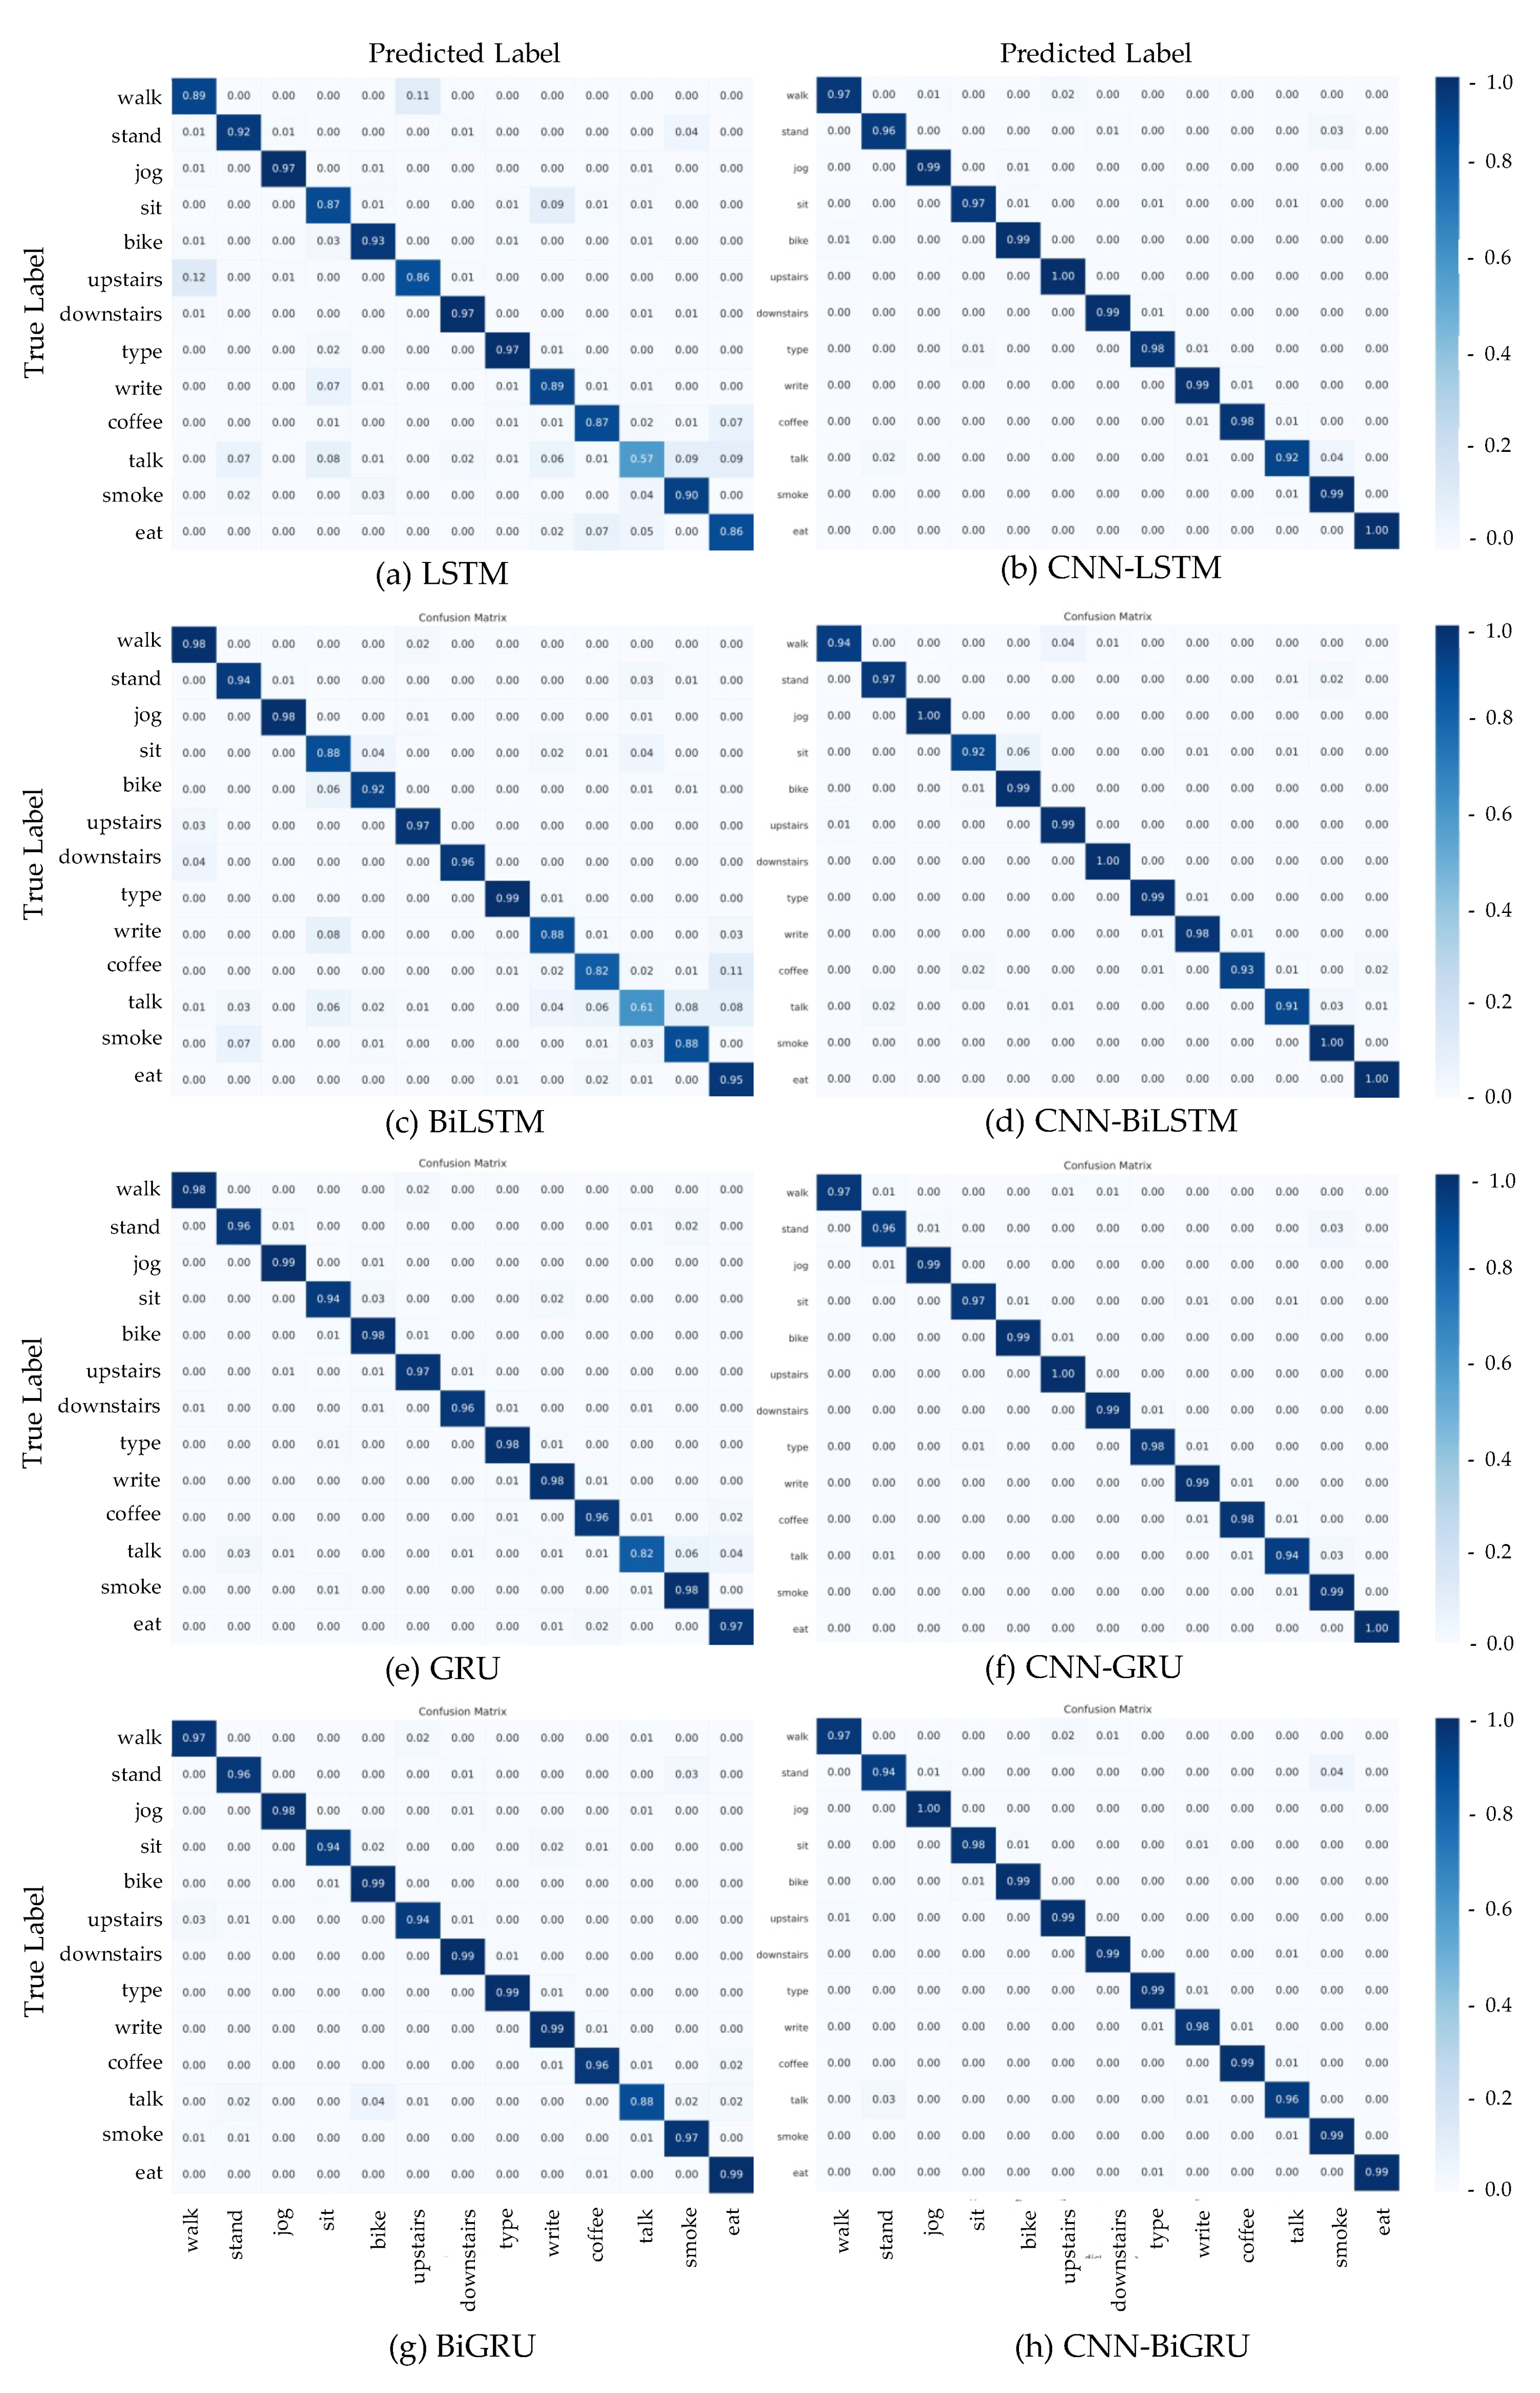
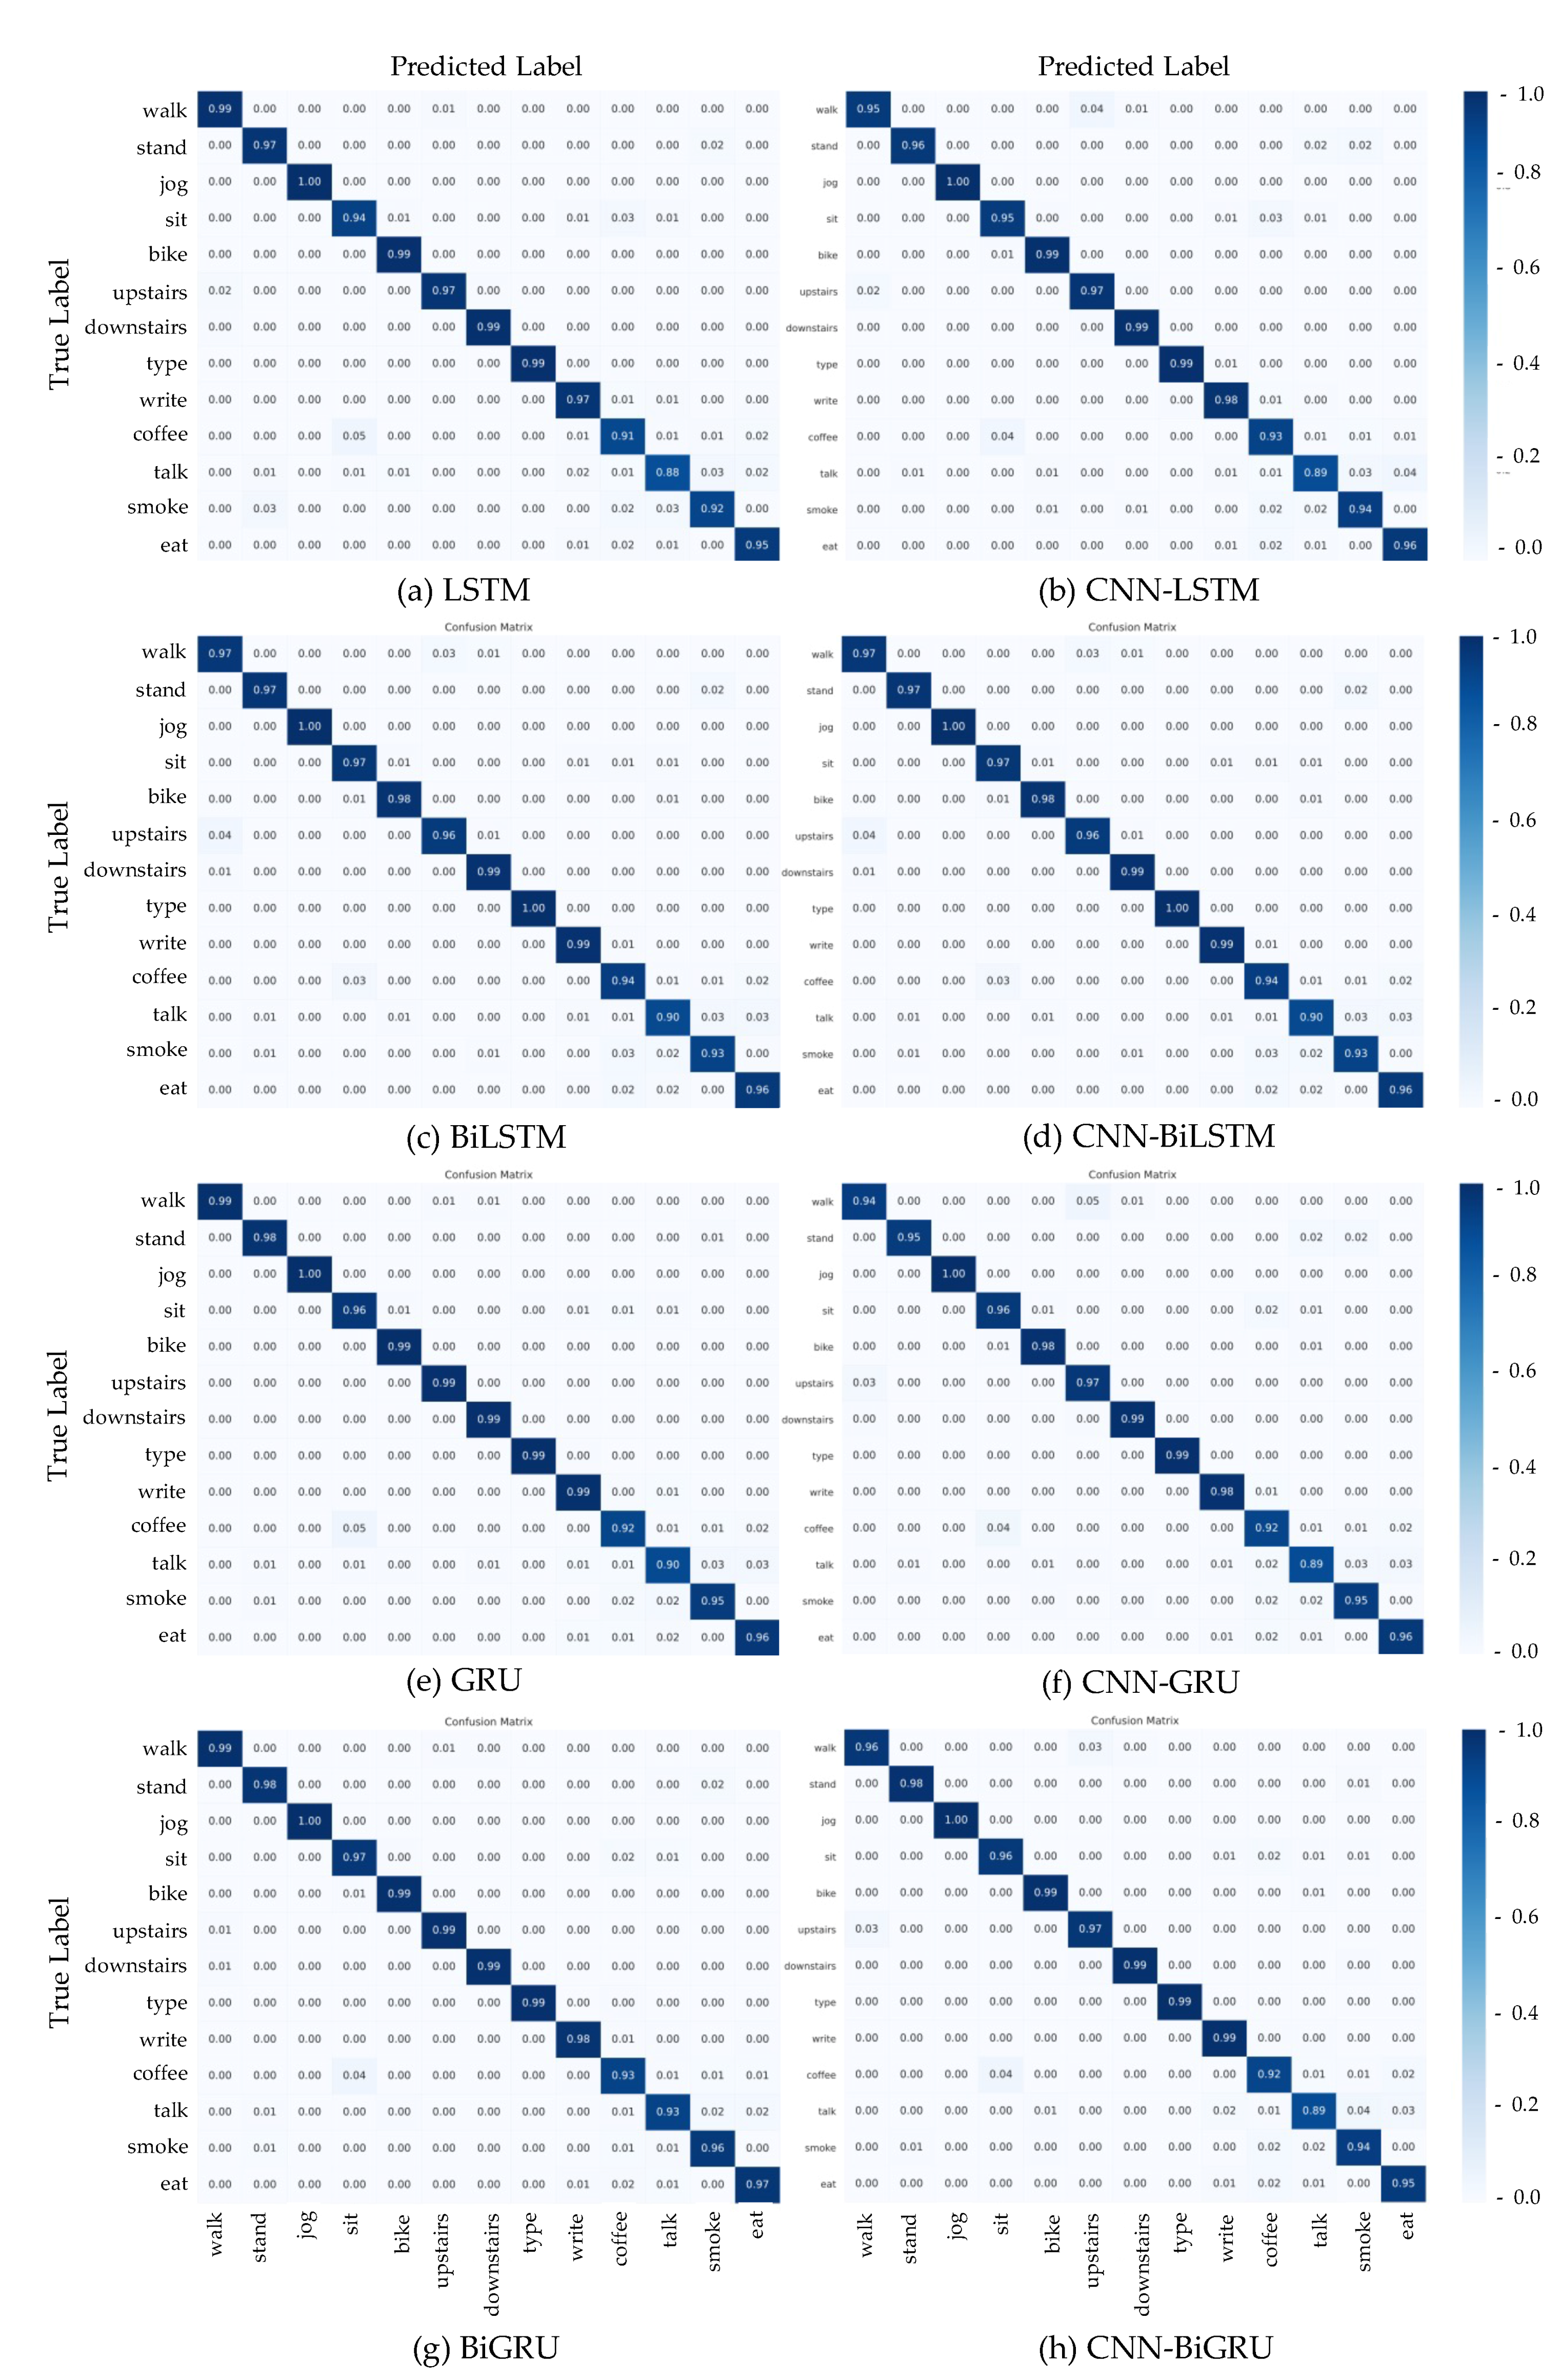
Moreover, the DL models studied in this work were evaluated for their performance with a confusion matrix. The confusion matrix is a square matrix with a k number of classes that is used to provide detailed findings from a multiclass classification issue. The confusion matrix gives a more comprehensive and fine-grained analysis of the supervised learning-based models’ properly and incorrectly categorized classes. A given element c i , j of the matrix is the number of instances belonging to class C i , classified as class C j . The confusion matrix also provides information on categorization errors.
Let C be a confusion matrix obtained under the same procedure of experiments. In these expressions, C 1 , C 2 , C 3 , …, C k are the k categories of activities in a HAR dataset, and n = Σ Σ c i , j the total number of data elements classified for the matrix C. Moreover, diagonal elements indicate the concordant elements which are the elements classified in the same category, whereas c i , j and i j indicate the number of discordant elements that are in C i but are classified as class C j . The confusion matrix C is expressed as follows:
Predicted   Class         C 1           C 2           C j           C k C = True   Class C 1 C 2 C i C k [ c 1 , 1 c 1 , 2 c 1 , j c 1 , k c 2 , 1 c 2 , 2 c 2 , j c 2 , k c i , 1 c i , 2 c i , j c i , k c k , 1 c k , 2 c k , j c k , k ]

4. Experiments and Results

We present the experimental setup and results used to investigate four baseline DL models (LSTM, BiLSTM, GRU, and BiGRU) and hybrid DL models, including the proposed CNN-BiGRU for sensor-based HAR in this section. All hyperparameter settings of these models are shown in Appendix A.

4.1. Experiments

Every experiment in this study is run on the Google Colab Pro platform with a Tesla V100. Python 3.6.9, TensorFlow 2.2.0, Keras 2.3.1, Scikit-Learn, Numpy 1.18.5, and Pandas 1.0.5 libraries are also used to develop the Python programming language.

4.2. Experimental Results

The recognition performance of the proposed CNN-BiGRU model for complex human activity recognition is evaluated in this section. We divided activity data of the UTwente dataset into three categories: all activity, complex activity, and simple activity. Four RNN baseline models and hybrid DL models were separately applied to each category by using the 10-fold cross validation protocol.

4.2.1. Experiment I: Using All Activity in UTwente Dataset

The first experiment presented the recognition performance of various DL models, including four RNN-based models and hybrid RNN-based models, including the proposed CNN-BiGRU model. These DL models were trained by all activity data in the UTwente dataset with different window sizes of 5, 10, 20, 30, and 40 s, as shown in Figure 10.
From the results in Figure 10, the proposed CNN-BiGRU outperforms the other DL models with the highest accuracy of 98.78% at the window size of 30 s. Using all activities that combine both simple and complex activities, the recognition performance of four hybrid DL models was better than all baseline DL models for every large window size (20, 30, and 40 s).

4.2.2. Experiment II: Using Only Complex Activities in UTwente Dataset

To evaluate the recognition performance of the eight models, only complex activities from the UTwente dataset were used to train the DL models and test these models with the 10-fold cross validation technique. The experimental outcomes are presented in Figure 11.
From Figure 11, these results show the recognition performance of the eight RNN-based models, including baseline RNN-based models and hybrid RNN-based models. The proposed CNN-BiGRU had the highest accuracy of 98.89%, outperforming other RNN-based models using a window size of 40 s.

4.2.3. Experiment III: Using Only Simple Activities in UTwente Dataset

In this experimentation, we selected only simple activities from the UTwente dataset to train and test the DL models on different sizes of sliding windows of 5, 10, 20, 30, and 40 s. The experimental results are presented in Figure 12.
According to the results of the experiments, the CNN-BiLSTM model had the highest recognition efficiency with 99.84% accuracy and a window size of 20 s. At the same window size, the proposed CNN-BiGRU achieved a high accuracy of 99.44%. Figure 13 and Figure 14 illustrate the confusion matrix of the models used in this study at different sizes of sliding windows of 5 and 40 s, respectively.
Figure 13 and Figure 14 present the confusion matrices of the RNN baseline models and hybrid DL models used to compare recognition performance of complex activity recognition at window sizes of 5 and 40 s, respectively. When considering these matrices, it is demonstrated that the proposed CNN-BiGRU model is the most suitable for discriminating complex activities with the window size of 40 s. While utilizing a small size of the sliding window, all eight DL models achieved acceptable accuracy rates of at least 95% for all simple activities (walking, walking upstairs, walking downstairs, jogging, sitting, standing, and biking). In contrast, the small size cannot be effectively applied to distinguish complex activities (typing, writing, drinking, talking, smoking, and eating) with high performance as shown in Figure 14. Specifically, the recognition of the talking activity with low performance is indicated in every DL model.
To classify CHA with high performance, a larger size of sliding windows was used in this work to segment for generating sample data for training DL models. The confusion matrix in Figure 13 shows that the four hybrid DL models achieved an acceptable accuracy rate of at least 95% to classify simple activities. Moreover, these hybrid models were also employed to distinguish complex activity with high accuracy. From the results in the confusion matrices, it can be concluded that the proposed CNN-BiGRU outperforms DL models for CHA recognition.

4.3. Statistical Analysis

Statistical evidence regarding the efficiency and reliability of the outperforming CNN-BiGRU model’s recognition performance is provided in this section. In more detail, we utilized the non-parametric Friedman aligned ranking (FAR) test [69] to reject the null hypothesis H 0 that all DL models performed equally well for given activity data. In addition, the Finner post hoc test [70] was applied with a significance level of α = 0.05 in order to examine whether the difference in the performance of the models was statistically significant.
Table 4 reports the statistical analysis, performed by non-parametric multiple comparison, relative to performance metrics with accuracy values of the DL models used in this work. The statistical comparison results show evidence that the CNN-BiGRU significantly outperformed the RNN baseline models (LSTM, BiLSTM, GRU, and BiGRU).

4.4. Comparison with Previous Works

The CNN-BiGRU model, proposed to address CHA recognition, was compared with previous works using the same activity dataset (UTwente dataset). The first comparable work [20] used wrist-worn sensor data from the dataset that were segmented by seven different window sizes (2–30 s) with an overlapping proportion of 50% to solve CHA recognition by three machine learning classifiers (Naïve Bayes, k-nearest neighbor, and decision tree). The work showed that the Naïve Bayes classifier outperformed the k-nearest neighbor and decision tree classifiers [20]. The second comparable work [34] proposed a DL model called a deep stacked autoencoder (DSAE) to address the CHA recognition with the UTwente dataset. This work also implemented three other learning-based classifiers (Naïve Bayes, support vector machine, and linear discriminant analysis) to compare with the DSAE models. To compare the proposed CNN-BiGRU with other classifiers proposed in previous work, the comparative results are summarized in Table 5.
From comparative results in Table 5, the proposed CNN-BiGRU achieved the highest recognition performance on CHA with an average F1-score of 0.978. However, to show the comparative performance with statistical analysis, the FAR test [69] and the Finner post hoc test [70] were computed, and their ranks and p-values were compared, as shown in Table 6.
The statistical results from Table 6 show that recognition performance of the CNN-BiGRU model is better than the other models and outperforms the Naïve Bayes and support vector machine significantly for complex activity recognition using accelerometer and gyroscope data.
The comparative results in Table 7 and statistical analysis in Table 8 show evidence that our proposed CNN-BiGRU model significantly outperforms other classifiers used in previous works with using only accelerometer data.

4.5. Comparison with State-of-the-Art Models

In addition, we compared the proposed CNN-BiGRU to other state-of-the-art DL-based models that were reported to have outperforming results in HAR. The first model is the InceptionTime model proposed in [29] that combines a modified Inception model with a gated recurrent unit and residual connections to improve recognition performance of imbalance datasets in HAR. The second model is the DeepConvTCN model proposed in [30]. The DL model is an end-to-end DL network composed of deep convolutional neural networks (DeepConv) and temporal convolutional networks (TCN). We compared the two DL models to the proposed CNN-BiGRU model on three complex human activity datasets (UTwente, PAMAP2, and WISDM-HARB).
Using wrist-worn sensor data from the UTwente dataset that we described in the Section 3.2, the comparative results showed that recognition performance of the proposed CNN-BiGRU model is better than the other two DL models as shown in Table 9.

4.5.1. PAMAP2 Dataset

Furthermore, this study makes use of the PAMAP2 [71] physical activity monitoring dataset, which is openly accessible from the University of California, Irvine (UCI) Machine Learning Repository. The data were collected from nine people (one woman and eight men) ranging in age from 27.2 ± 3.3 years to 25.1± 2.6 kg/m 2 , with an average BMI of 25.1 ± 2.6 kg/m 2 . While the subjects performed 13 protocol activities, three wireless IMUs were placed on their domain wrist, ankle, and chest (nine simple activities and three complex activities). A tri-axial acceleration sensor, a tri-axial gyroscope sensor, a tri-axial magnetometer sensor, and temperature and orientation sensors were all included in each IMU. The sampling frequency of the IMUs was 100 Hz. We employed wrist-worn sensor data segmented by a sliding window of 30 s to train models and evaluate them in these additional results, as shown in Table 10.
From comparative results in Table 10, the proposed CNN-BiGRU achieved a higher recognition performance, with an F1-score of 0.855.

4.5.2. WISDM-HARB Dataset

The “WISDM Human Activity Recognition and Biometric Dataset” (WISDM-HARB Dataset) from the UCI Repository [72] is another complex human activity dataset used in this study. Fordham University released this dataset to the public in late 2019. It gathered tri-axial accelerometer and tri-axial gyroscope data captured at a rate of 20 Hz from smartphones running Android 6.0 (Google Nexus 5/5X and Samsung Galaxy S5), as well as a smartwatch running Android Wear 1.5 (LG G Watch). The data from 51 respondents’ smartwatch sensors was obtained for 18 physical human activities in regular living, including six non-hand-oriented activities, seven hand-oriented activities, and five eating-related activities. Each activity was carried out for roughly 3 min at a rate of 20 Hz. To segment smartwatch sensor data for training and assessing models, we employed a sliding window of 30 s. The comparative results, as shown in Table 11, were identical to the previous two comparative results utilizing the UTwente and PAMAP2 datasets.

5. Discussion of the Results

The role of key considerations in the identification of various activities is discussed in this section.

5.1. Influence of Window Size on Recognition Results

In the process of S-HAR, both machine learning and DL windowing methods are commonly used for data segmentation. Naturally, a reduced window size allows for faster computation while also reducing resource and energy consumption. Enhanced data windows, on the other hand, are often involved with the identification of complex activities [73]. Since simple tasks like walking, jogging, riding, standing, sitting, walking upstairs, and walking downstairs are repetitive, the results obtained in Section 4 reveal that a window size of 5 s is adequate for recognizing them [20]. We realize, however, that a small window size may be insufficient to recognize the patterns of complex activities such as typing, writing, drinking coffee, chatting, smoking, and eating. In this study, we focus on how changing the window size (5, 10, 20, 30, and 40 s) affects the training of different DL issues in various situations. Moreover, we realize enhanced recognition performance is likely achieved as the size of the window increases, particularly for complex activities, as shown in Figure 15.

5.2. Influence of a Convolutional Layer on Recognition Results

We compared the recognition efficiency of the suggested hybrid DL models to that of standard DL models without the convolutional layer to show the benefits of integrating a convolutional layer with RNN-based models. The baseline DL models have the same structure and configurations as the hybrid DL models, with the exception of the convolutional layer. As a result, any output variances are directly related to architectural disparity rather than any particular optimization or customization. Figure 16 shows the effects of using all operations from the UTwente dataset to improve recognition efficiency using a convolutional layer on hybrid DL models.
The findings demonstrate that the convolutional layer improves performance in all models, particularly the CNN-LSTM model with a window size of 40 s, which had the greatest improvement of 8.91%. Moreover, we observe that the BiGRU model is not improved significantly, with average improvement of only 0.71%. This means that the BiGRU achieved high recognition performance with every window size. To investigate the effect of improvement by the convolutional layer in more detail, we analyze the experimental results of Scenario II wherein only complex activities were used to train and test DL models. Figure 17 presents the results of improving the recognition performance by a convolutional layer on the hybrid DL models using all activity from the UTwente dataset.
As shown in the results in Figure 17, combining a convolutional layer with the LSTM model achieved the highest improvement of accuracy in every window size compared to other hybrid DL models. In contrast, the CNN-BiGRU model does not exhibit any effect from combining the convolutional layer, similar to Scenario I. Considering Scenario II, we found that the improvement is similar to Scenario I and Scenario II as shown in Figure 18.

5.3. Impact of a Bidirectional Strategy on Recognition Performance

In this work, we applied various DL models to solve CHA recognition. RNN-based DL models (i.e., LSTM, BiLSTM, GRU, and BiGRU) were selected as four RNN baseline DL models to build hybrid DL models, including the proposed CNN-BiGRU model by combining a CNN layer in the first layer. The results of the investigation showed that each model had a higher level of accuracy than the accuracy achieved by employing either CNNs or RNNs separately. We compared the predicted results of a model containing bidirectional RNNs and unidirectional RNNs, as illustrated in Figure 19, to examine the influence of the bidirectional method.
Overall, the results in Figure 19 indicate that the model including bidirectional RNNs performs better than ones based on unidirectional RNNs. Because the data were processed both from the past to the future and from the future to the past using a bidirectional strategy, the results are acceptable. This benefit, however, comes at the cost of increased computing time.

5.4. Convergence Process

On the Utwente dataset, Figure 20 describes the convergence processes of four RNN baseline models and four hybrid DL models, including the proposed CNN-BiGRU model. These DL models were trained using data from accelerometers and gyroscopes that were divided into 30s windows. It can be seen that the convolutional layer improved the convergence process of the four hybrid RNN-based models (CNN-LSTM, CNN-BiLSTM, CNN-GRU, and CNN-BiGRU). When LSTM-based models were compared to GRU-based models, the loss rate of GRU-based models (Figure 20e–h) reduced gradually, while the accuracy rate increased consistently without any apparent dilemma. This demonstrates that the GRU-based model learns correctly and without any overfitting problems. The CNN-BiGRU is the most accurate of these models, with an average accuracy of 98.78%.

6. Conclusions and Future Works

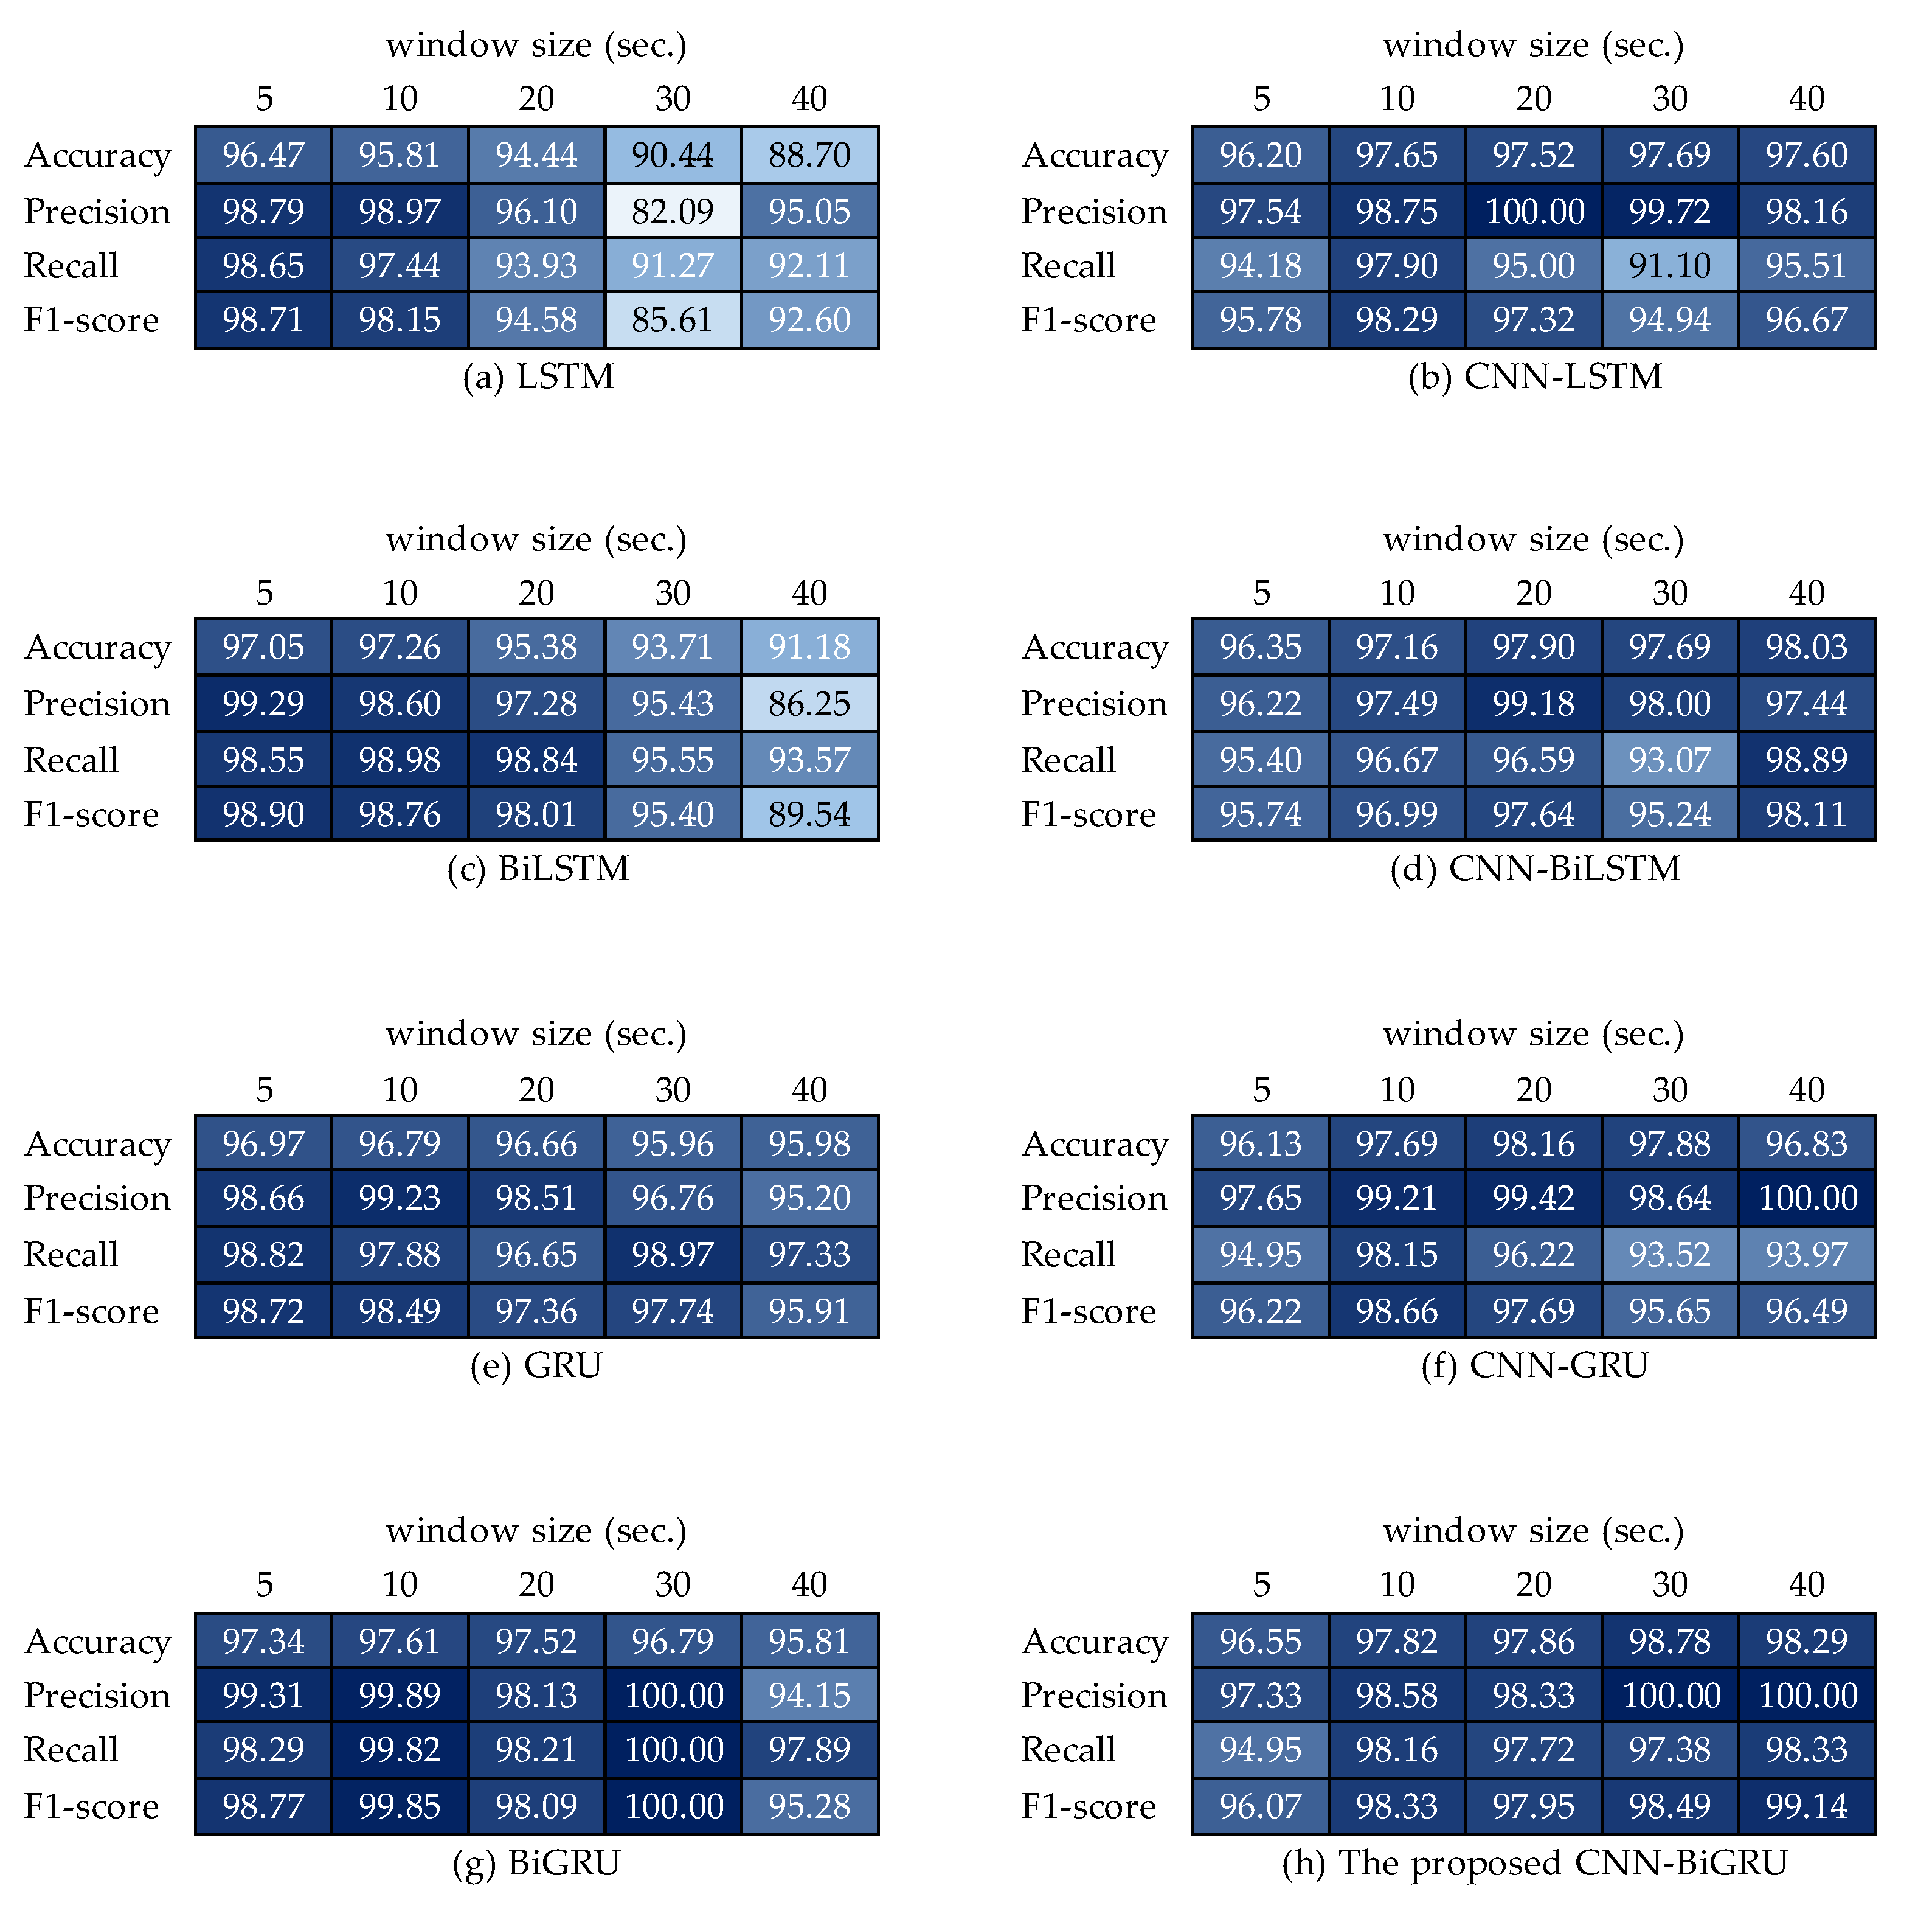
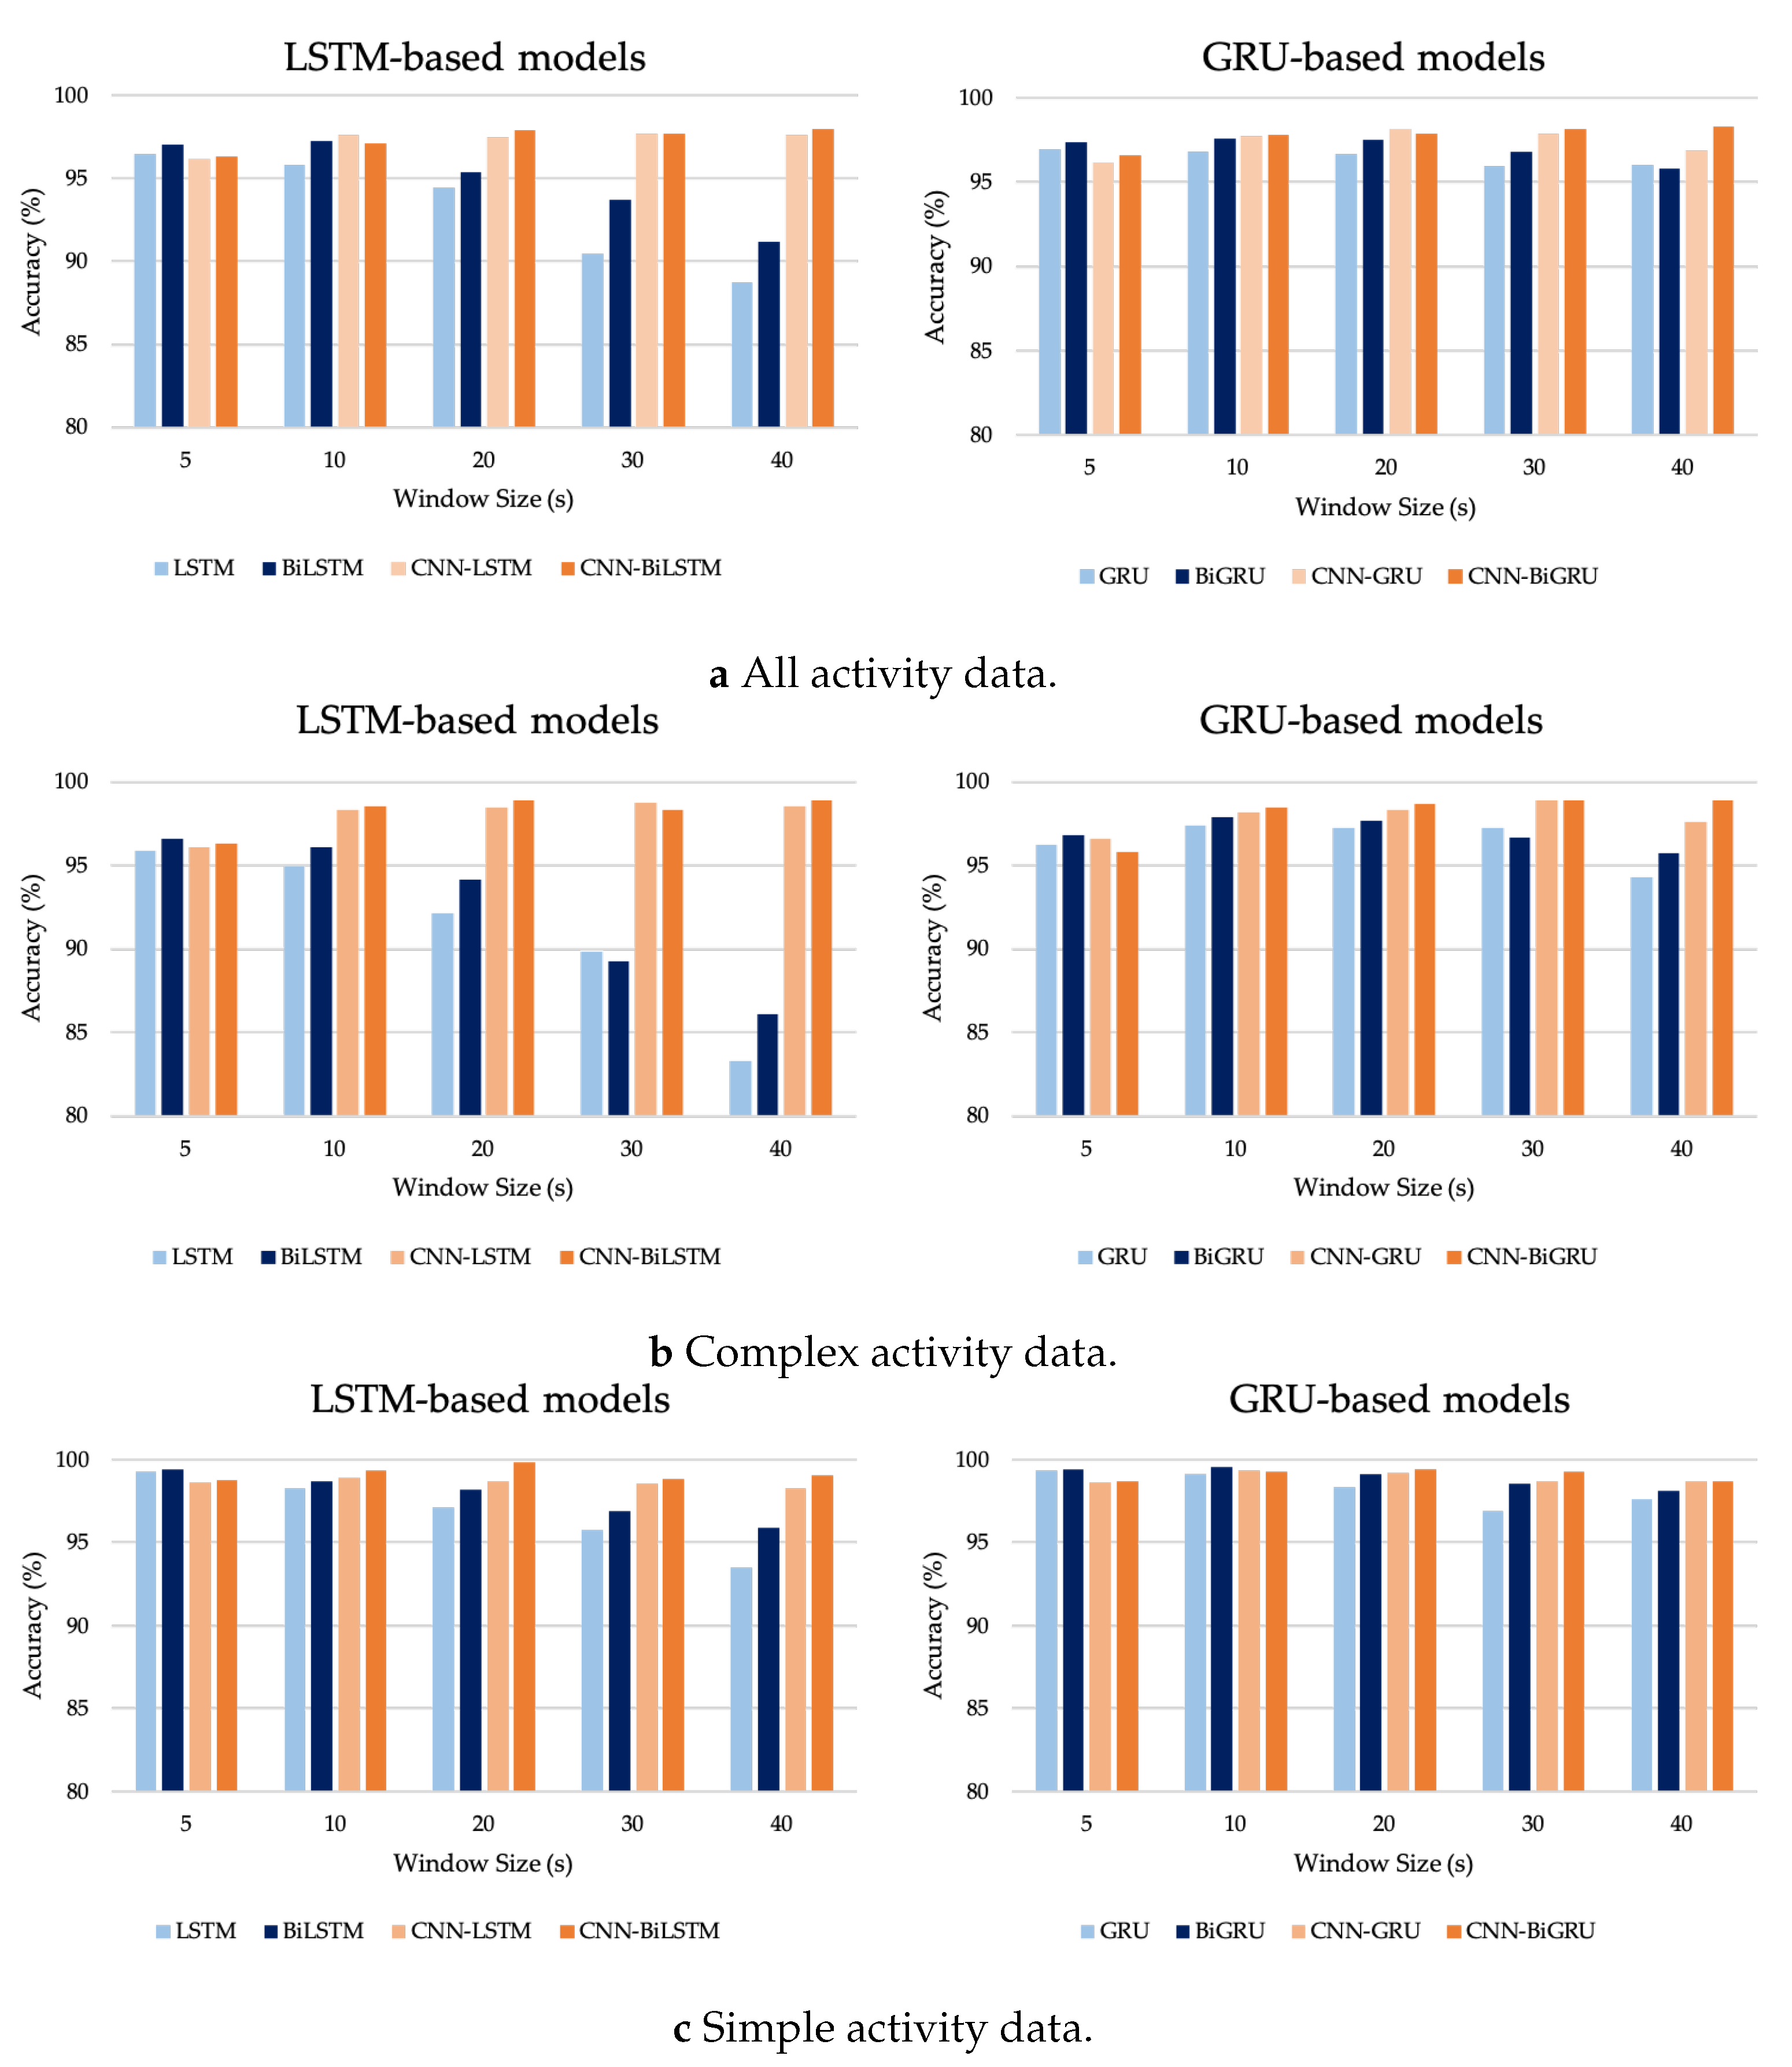
In this research, we introduced a framework for S-HAR to address the problem of the recognition of CHA by using wrist-worn wearable sensors. With tri-axial accelerometer and tri-axial gyroscope data, we investigated different types of DL models that are RNN-based models and hybrid DL models, including the proposed CNN-BiGRU model. We implemented these DL models and compared their predicted accuracy in terms of a publicly accessible dataset called the UTwente dataset, as well as other performance metrics including precision, recall, F1-score, and confusion matrix with 10-fold cross validation. The experimental results showed that the CNN-BiGRU model outperformed the other baseline DL models with a high accuracy of 98.78% in the combination of simple and complex activities. Moreover, the CNN-BiGRU network performs with the highest accuracy of 98.89% when using only complex human activity data. The statistical results with FAR and Finner post hoc tests based on the accuracy metric indicate that the CNN-BiGRU significantly outperformed other RNN-based models.
In the future, we plan to improve the CNN-BiGRU model and study it with various hyperparameters, such as learning rate, batch size, optimizer, and many others. We also aim to introduce our model to more complicated activities in order to address other DL models and S-HAR concerns by assessing it on other publicly available complex activity datasets (OPPORTUNITY, MHEALTH, etc.).

Author Contributions

Conceptualization and model analysis, S.M.; resource and data curation, A.J.; methodology and validation, S.M.; data visualization and graphic improvement, A.J.; discussion and final editing, S.M.; writing-review and editing, S.M.; funding acquisition, A.J. and S.M. Both authors have read and agreed to the published version of the manuscript.

Funding

This research was funded by University of Phayao with Grant No. FF64-UoE008 and the Thailand Science Research and Innovation Fund and King Mongkut’s University of Technology North Bangkok with Contract No. KMUTNB-BasicR-64-33-2.

Conflicts of Interest

The authors declare no conflict of interest.

Abbreviations

The following abbreviations are used in this manuscript:
AALAmbient assisted living
ADLActivities of daily living
BiLSTMBidirectional long-short-term memory
BiGRUBidirectional gated recurrent unit
CHAComplex human activity
CNNConvolutional neural network
DeepConvDeep convolutional neural network
DLDeep learning
DNNDeep neural network
FNFalse negative
FPFalse positive
GRUGate recurrent unit
HARHuman activity recognition
IMUInertial measurement unit
LSTMLong short-term memory
RNNRecurrent neural network
SHASimple human activity
S-HARSensor-based human activity recognition
TCNTemporal convolutional network
TNTrue negative
TPTrue positive

Appendix A. The Summary of Model Hyperparameters Used in This Work

Table A1. The summary of hyperparameters for the LSTM network used in this work.
StageHyperparametersValues
ArchitectureLSTM Unit128
Dropout0.25
Dense128
TrainingLoss FunctionCross-entropy
OptimizerAdam
Batch Size64
Number of Epochs200
Table A2. The summary of hyperparameters for the BiLSTM network used in this work.
StageHyperparametersValues
ArchitectureBiLSTM Unit128
Dropout0.25
Dense128
TrainingLoss FunctionCross-entropy
OptimizerAdam
Batch Size64
Number of Epochs200
Table A3. The summary of hyperparameters for the GRU network used in this work.
StageHyperparametersValues
ArchitectureGRU Unit128
Dropout0.25
Dense128
TrainingLoss FunctionCross-entropy
OptimizerAdam
Batch Size64
Number of Epochs200
Table A4. The summary of hyperparameters for the BiGRU network used in this work.
StageHyperparametersValues
ArchitectureBiGRU Unit128
Dropout0.25
Dense128
TrainingLoss FunctionCross-entropy
OptimizerAdam
Batch Size64
Number of Epochs200
Table A5. The summary of hyperparameters for the CNN-LSTM network used in this work.
StageHyperparameterValue
ArchitectureConvolutionKernel Size8
Stride1
Filters64
Dropout-1 0.25
Maxpooling 2
Flatten -
LSTM Unit 128
Dropout-2 0.25
Dense 128
TrainingLoss Function Cross-entropy
Optimizer Adam
Batch Size 64
Number of Epochs 200
Table A6. The summary of hyperparameters for the CNN-BiLSTM network used in this work.
StageHyperparameterValue
ArchitectureConvolutionKernel Size8
Stride1
Filters64
Dropout-1 0.25
Maxpooling 2
Flatten -
BiLSTM Unit 128
Dropout-2 0.25
Dense 128
TrainingLoss Function Cross-entropy
Optimizer Adam
Batch Size 64
Number of Epochs 200
Table A7. The summary of hyperparameters for the CNN-GRU network used in this work.
StageHyperparameterValue
ArchitectureConvolutionKernel Size8
Stride1
Filters64
Dropout-1 0.25
Maxpooling 2
Flatten -
GRU Unit 128
Dropout-2 0.25
Dense 128
TrainingLoss Function Cross-entropy
Optimizer Adam
Batch Size 64
Number of Epochs 200

References

  1. Fu, B.; Damer, N.; Kirchbuchner, F.; Kuijper, A. Sensing Technology for Human Activity Recognition: A Comprehensive Survey. IEEE Access 2020, 8, 83791–83820. [Google Scholar] [CrossRef]
  2. Damaševičius, R.; Vasiljevas, M.; Šalkevičius, J.; Woźniak, M. Human Activity Recognition in AAL Environments Using Random Projections. Comput. Math. Methods Med. 2016, 2016, 4073584. [Google Scholar] [CrossRef] [PubMed] [Green Version]
  3. Maskeliūnas, R.; Damaševičius, R.; Segal, S. A Review of Internet of Things Technologies for Ambient Assisted Living Environments. Future Internet 2019, 11, 259. [Google Scholar] [CrossRef] [Green Version]
  4. Žemgulys, J.; Raudonis, V.; Maskeliūnas, R.; Damaševičius, R. Recognition of basketball referee signals from videos using Histogram of Oriented Gradients (HOG) and Support Vector Machine (SVM). Procedia Comput. Sci. 2018, 130, 953–960. [Google Scholar] [CrossRef]
  5. Damaševičius, R.; Maskeliūnas, R.; Venčkauskas, A.; Woźniak, M. Smartphone User Identity Verification Using Gait Characteristics. Symmetry 2016, 8, 100. [Google Scholar] [CrossRef]
  6. Han, H. Residual Learning Based CNN for Gesture Recognition in Robot Interaction. J. Inf. Process. Syst. 2021, 17, 385–398. [Google Scholar] [CrossRef]
  7. Jobanputra, C.; Bavishi, J.; Doshi, N. Human Activity Recognition: A Survey. Procedia Comput. Sci. 2019, 155, 698–703. [Google Scholar] [CrossRef]
  8. Minh Dang, L.; Min, K.; Wang, H.; Jalil Piran, M.; Hee Lee, C.; Moon, H. Sensor-based and vision-based human activity recognition: A comprehensive survey. Pattern Recognit. 2020, 108, 107561. [Google Scholar] [CrossRef]
  9. Ibrahim, O.T.; Gomaa, W.; Youssef, M. CrossCount: A Deep Learning System for Device-Free Human Counting Using WiFi. IEEE Sens. J. 2019, 19, 9921–9928. [Google Scholar] [CrossRef]
  10. Zebin, T.; Scully, P.J.; Ozanyan, K.B. Human activity recognition with inertial sensors using a deep learning approach. In Proceedings of the 2016 IEEE SENSORS, Orlando, FL, USA, 30 October–3 November 2016; pp. 1–3. [Google Scholar] [CrossRef] [Green Version]
  11. Mekruksavanich, S.; Jitpattanakul, A. LSTM Networks Using Smartphone Data for Sensor-Based Human Activity Recognition in Smart Homes. Sensors 2021, 21, 1636. [Google Scholar] [CrossRef] [PubMed]
  12. Mekruksavanich, S.; Jitpattanakul, A. Biometric User Identification Based on Human Activity Recognition Using Wearable Sensors: An Experiment Using Deep Learning Models. Electronics 2021, 10, 308. [Google Scholar] [CrossRef]
  13. Katz, S.; Jackson, B.A.; Jaffe, M.W.; Littell, A.S.; Turk, C.E. Multidisciplinary studies of illness in aged persons—VI: Comparison study of rehabilitated and nonrehabilitated patients with fracture of the hip. J. Chronic Dis. 1962, 15, 979–984. [Google Scholar] [CrossRef]
  14. Pires, I.M.; Garcia, N.M.; Pombo, N.; Flórez-Revuelta, F. From Data Acquisition to Data Fusion: A Comprehensive Review and a Roadmap for the Identification of Activities of Daily Living Using Mobile Devices. Sensors 2016, 16, 184. [Google Scholar] [CrossRef] [PubMed]
  15. Santos, G.L.; Endo, P.T.; Monteiro, K.H.D.C.; Rocha, E.D.S.; Silva, I.; Lynn, T. Accelerometer-Based Human Fall Detection Using Convolutional Neural Networks. Sensors 2019, 19, 1644. [Google Scholar] [CrossRef] [PubMed] [Green Version]
  16. Mekruksavanich, S.; Jitpattanakul, A.; Youplao, P.; Yupapin, P. Enhanced Hand-Oriented Activity Recognition Based on Smartwatch Sensor Data Using LSTMs. Symmetry 2020, 12, 1570. [Google Scholar] [CrossRef]
  17. Zhan, Y.; Miura, S.; Nishimura, J.; Kuroda, T. Human Activity Recognition from Environmental Background Sounds for Wireless Sensor Networks. In Proceedings of the 2007 IEEE International Conference on Networking, Sensing and Control, London, UK, 15–17 April 2007; pp. 307–312. [Google Scholar] [CrossRef]
  18. Lara, O.D.; Labrador, M.A. A Survey on Human Activity Recognition using Wearable Sensors. IEEE Commun. Surv. Tutor. 2013, 15, 1192–1209. [Google Scholar] [CrossRef]
  19. Peng, L.; Chen, L.; Ye, Z.; Zhang, Y. AROMA: A Deep Multi-Task Learning Based Simple and Complex Human Activity Recognition Method Using Wearable Sensors. Proc. ACM Interact. Mob. Wearable Ubiquitous Technol. 2018, 2. [Google Scholar] [CrossRef]
  20. Shoaib, M.; Bosch, S.; Incel, O.D.; Scholten, H.; Havinga, P.J.M. Complex Human Activity Recognition Using Smartphone and Wrist-Worn Motion Sensors. Sensors 2016, 16, 426. [Google Scholar] [CrossRef] [PubMed]
  21. Qin, Z.; Zhang, Y.; Meng, S.; Qin, Z.; Choo, K.K.R. Imaging and fusing time series for wearable sensor-based human activity recognition. Inf. Fusion 2020, 53, 80–87. [Google Scholar] [CrossRef]
  22. Ignatov, A. Real-time human activity recognition from accelerometer data using Convolutional Neural Networks. Appl. Soft Comput. 2018, 62, 915–922. [Google Scholar] [CrossRef]
  23. Benavidez, S.; McCreight, D. A Deep Learning Approach for Human Activity Recognition Project Category: Other (Time-Series Classification); Stanford University: Stanford, CA, USA, 2019. [Google Scholar]
  24. Wang, K.; He, J.; Zhang, L. Attention-Based Convolutional Neural Network for Weakly Labeled Human Activities’ Recognition With Wearable Sensors. IEEE Sens. J. 2019, 19, 7598–7604. [Google Scholar] [CrossRef] [Green Version]
  25. Murad, A.; Pyun, J.Y. Deep Recurrent Neural Networks for Human Activity Recognition. Sensors 2017, 17, 2556. [Google Scholar] [CrossRef] [PubMed] [Green Version]
  26. Singh, D.; Merdivan, E.; Psychoula, I.; Kropf, J.; Hanke, S.; Geist, M.; Holzinger, A. Human Activity Recognition Using Recurrent Neural Networks. In Machine Learning and Knowledge Extraction; Holzinger, A., Kieseberg, P., Tjoa, A.M., Weippl, E., Eds.; Springer International Publishing: Cham, Switzerland, 2017; pp. 267–274. [Google Scholar]
  27. Ordóñez, F.J.; Roggen, D. Deep Convolutional and LSTM Recurrent Neural Networks for Multimodal Wearable Activity Recognition. Sensors 2016, 16, 115. [Google Scholar] [CrossRef] [Green Version]
  28. Xu, C.; Chai, D.; He, J.; Zhang, X.; Duan, S. InnoHAR: A Deep Neural Network for Complex Human Activity Recognition. IEEE Access 2019, 7, 9893–9902. [Google Scholar] [CrossRef]
  29. Ismail Fawaz, H.; Lucas, B.; Forestier, G.; Pelletier, C.; Schmidt, D.; Weber, J.; Webb, G.; Idoumghar, L.; Muller, P.; Petitjean, F. InceptionTime: Finding AlexNet for time series classification. Data Min. Knowl. Discov. 2020, 34, 1936–1962. [Google Scholar] [CrossRef]
  30. Aparecido Garcia, F.; Mazzoni Ranieri, C.; Aparecida Francelin Romero, R. Temporal Approaches for Human Activity Recognition Using Inertial Sensors. In Proceedings of the 2019 Latin American Robotics Symposium (LARS), 2019 Brazilian Symposium on Robotics (SBR) and 2019 Workshop on Robotics in Education (WRE), Rio Grande, Brazil, 22–25 October 2019; pp. 121–125. [Google Scholar] [CrossRef]
  31. Lane, N.D.; Georgiev, P. Can Deep Learning Revolutionize Mobile Sensing? In Proceedings of the 16th International Workshop on Mobile Computing Systems and Applications, Santa Fe, NM, USA, 12–13 February 2015; HotMobile ’15. Association for Computing Machinery: New York, NY, USA, 2015; pp. 117–122. [Google Scholar] [CrossRef] [Green Version]
  32. Fridriksdottir, E.; Bonomi, A.G. Accelerometer-Based Human Activity Recognition for Patient Monitoring Using a Deep Neural Network. Sensors 2020, 20, 6424. [Google Scholar] [CrossRef] [PubMed]
  33. Zhou, X.; Liang, W.; Wang, K.I.K.; Wang, H.; Yang, L.T.; Jin, Q. Deep-Learning-Enhanced Human Activity Recognition for Internet of Healthcare Things. IEEE Internet Things J. 2020, 7, 6429–6438. [Google Scholar] [CrossRef]
  34. Alo, U.R.; Nweke, H.F.; Teh, Y.W.; Murtaza, G. Smartphone Motion Sensor-Based Complex Human Activity Identification Using Deep Stacked Autoencoder Algorithm for Enhanced Smart Healthcare System. Sensors 2020, 20, 6300. [Google Scholar] [CrossRef] [PubMed]
  35. Liu, L.; Peng, Y.; Liu, M.; Huang, Z. Sensor-based human activity recognition system with a multilayered model using time series shapelets. Knowl.-Based Syst. 2015, 90, 138–152. [Google Scholar] [CrossRef]
  36. Chen, L.; Liu, X.; Peng, L.; Wu, M. Deep learning based multimodal complex human activity recognition using wearable devices. Appl. Intell. 2021, 51, 1–14. [Google Scholar] [CrossRef]
  37. Dernbach, S.; Das, B.; Krishnan, N.C.; Thomas, B.L.; Cook, D.J. Simple and Complex Activity Recognition through Smart Phones. In Proceedings of the 2012 Eighth International Conference on Intelligent Environments, Guanajuato, Mexico, 26–28 June 2012; pp. 214–221. [Google Scholar] [CrossRef] [Green Version]
  38. Xia, K.; Huang, J.; Wang, H. LSTM-CNN Architecture for Human Activity Recognition. IEEE Access 2020, 8, 56855–56866. [Google Scholar] [CrossRef]
  39. Amara, M.; Zidi, K.; Ghedira, K. Structural and Statistical Feature Extraction Methodology for the Recognition of Handwritten Arabic Words. In Hybrid Intelligent Systems; Madureira, A.M., Abraham, A., Gandhi, N., Varela, M.L., Eds.; Springer International Publishing: Cham, Switzerland, 2020; pp. 570–580. [Google Scholar]
  40. Sargano, A.B.; Angelov, P.; Habib, Z. A Comprehensive Review on Handcrafted and Learning-Based Action Representation Approaches for Human Activity Recognition. Appl. Sci. 2017, 7, 110. [Google Scholar] [CrossRef] [Green Version]
  41. Ni, B.; Pei, Y.; Moulin, P.; Yan, S. Multilevel Depth and Image Fusion for Human Activity Detection. IEEE Trans. Cybern. 2013, 43, 1383–1394. [Google Scholar] [CrossRef]
  42. Ihianle, I.K.; Nwajana, A.O.; Ebenuwa, S.H.; Otuka, R.I.; Owa, K.; Orisatoki, M.O. A Deep Learning Approach for Human Activities Recognition From Multimodal Sensing Devices. IEEE Access 2020, 8, 179028–179038. [Google Scholar] [CrossRef]
  43. Almabdy, S.; Elrefaei, L. Deep Convolutional Neural Network-Based Approaches for Face Recognition. Appl. Sci. 2019, 9, 4397. [Google Scholar] [CrossRef] [Green Version]
  44. Polat, H.; Danaei Mehr, H. Classification of Pulmonary CT Images by Using Hybrid 3D-Deep Convolutional Neural Network Architecture. Appl. Sci. 2019, 9, 940. [Google Scholar] [CrossRef] [Green Version]
  45. Hochreiter, S.; Schmidhuber, J. Long Short-Term Memory. Neural Comput. 1997, 9, 1735–1780. [Google Scholar] [CrossRef] [PubMed]
  46. Hochreiter, S. The Vanishing Gradient Problem During Learning Recurrent Neural Nets and Problem Solutions. Int. J. Uncertain. Fuzziness Knowl.-Based Syst. 1998, 6, 107–116. [Google Scholar] [CrossRef] [Green Version]
  47. Chen, Y.; Zhong, K.; Zhang, J.; Sun, Q.; Zhao, X. LSTM Networks for Mobile Human Activity Recognition. In Proceedings of the 2016 International Conference on Artificial Intelligence: Technologies and Applications, Bangkok, Thailand, 24–25 January 2016. [Google Scholar] [CrossRef] [Green Version]
  48. Singh, D.; Merdivan, E.; Hanke, S.; Kropf, J.; Geist, M.; Holzinger, A. Convolutional and Recurrent Neural Networks for Activity Recognition in Smart Environment. In Towards Integrative Machine Learning and Knowledge Extraction; Holzinger, A., Goebel, R., Ferri, M., Palade, V., Eds.; Springer International Publishing: Cham, Switzerland, 2017; pp. 194–205. [Google Scholar]
  49. Schuster, M.; Paliwal, K. Bidirectional recurrent neural networks. IEEE Trans. Signal Process. 1997, 45, 2673–2681. [Google Scholar] [CrossRef] [Green Version]
  50. Alawneh, L.; Mohsen, B.; Al-Zinati, M.; Shatnawi, A.; Al-Ayyoub, M. A Comparison of Unidirectional and Bidirectional LSTM Networks for Human Activity Recognition. In Proceedings of the 2020 IEEE International Conference on Pervasive Computing and Communications Workshops (PerCom Workshops), Austin, TX, USA, 23–27 March 2020; pp. 1–6. [Google Scholar] [CrossRef]
  51. Cho, K.; van Merriënboer, B.; Bahdanau, D.; Bengio, Y. On the Properties of Neural Machine Translation: Encoder—Decoder Approaches. In Proceedings of the SSST-8, Eighth Workshop on Syntax, Semantics and Structure in Statistical Translation; Association for Computational Linguistics, Doha, Qatar; 2014; pp. 103–111. [Google Scholar] [CrossRef]
  52. Chung, J.; Gulcehre, C.; Cho, K.; Bengio, Y. Empirical evaluation of gated recurrent neural networks on sequence modeling. In Proceedings of the NIPS 2014 Workshop on Deep Learning, Montreal, QC, Canada, 8–13 December 2014. [Google Scholar]
  53. Quadrana, M.; Cremonesi, P.; Jannach, D. Sequence-Aware Recommender Systems. ACM Comput. Surv. 2018, 51. [Google Scholar] [CrossRef] [Green Version]
  54. Rendle, S.; Freudenthaler, C.; Schmidt-Thieme, L. Factorizing Personalized Markov Chains for Next-Basket Recommendation. In WWW ’10, Proceedings of the 19th International Conference on World Wide Web; Association for Computing Machinery: New York, NY, USA, 2010; pp. 811–820. [Google Scholar] [CrossRef] [Green Version]
  55. Okai, J.; Paraschiakos, S.; Beekman, M.; Knobbe, A.; de Sá, C.R. Building robust models for Human Activity Recognition from raw accelerometers data using Gated Recurrent Units and Long Short Term Memory Neural Networks. In Proceedings of the 2019 41st Annual International Conference of the IEEE Engineering in Medicine and Biology Society (EMBC), Berlin, Germany, 23–27 July 2019; pp. 2486–2491. [Google Scholar] [CrossRef]
  56. Lynn, H.M.; Pan, S.B.; Kim, P. A Deep Bidirectional GRU Network Model for Biometric Electrocardiogram Classification Based on Recurrent Neural Networks. IEEE Access 2019, 7, 145395–145405. [Google Scholar] [CrossRef]
  57. Alsarhan, T.; Alawneh, L.; Al-Zinati, M.; Al-Ayyoub, M. Bidirectional Gated Recurrent Units For Human Activity Recognition Using Accelerometer Data. In Proceedings of the 2019 IEEE SENSORS, Montreal, QC, Canada, 27–30 October 2019; pp. 1–4. [Google Scholar] [CrossRef]
  58. Chow, T.; Fang, Y. A recurrent neural-network-based real-time learning control strategy applying to nonlinear systems with unknown dynamics. IEEE Trans. Ind. Electron. 1998, 45, 151–161. [Google Scholar] [CrossRef]
  59. Wang, L.; Xu, Y.; Cheng, J.; Xia, H.; Yin, J.; Wu, J. Human Action Recognition by Learning Spatio-Temporal Features With Deep Neural Networks. IEEE Access 2018, 6, 17913–17922. [Google Scholar] [CrossRef]
  60. Nan, Y.; Lovell, N.H.; Redmond, S.J.; Wang, K.; Delbaere, K.; van Schooten, K.S. Deep Learning for Activity Recognition in Older People Using a Pocket-Worn Smartphone. Sensors 2020, 20, 7195. [Google Scholar] [CrossRef] [PubMed]
  61. Naseeb, C.; Saeedi, B.A. Activity Recognition for Locomotion and Transportation Dataset Using Deep Learning; UbiComp-ISWC ’20; Association for Computing Machinery: New York, NY, USA, 2020; pp. 329–334. [Google Scholar] [CrossRef]
  62. Karim, F.; Majumdar, S.; Darabi, H.; Harford, S. Multivariate LSTM-FCNs for time series classification. Neural Netw. 2019, 116, 237–245. [Google Scholar] [CrossRef] [PubMed] [Green Version]
  63. Ronald, M.; Poulose, A.; Han, D.S. iSPLInception: An Inception-ResNet Deep Learning Architecture for Human Activity Recognition. IEEE Access 2021, 9, 68985–69001. [Google Scholar] [CrossRef]
  64. Kim, E.; Helal, S.; Cook, D. Human Activity Recognition and Pattern Discovery. IEEE Pervasive Comput. 2010, 9, 48–53. [Google Scholar] [CrossRef] [PubMed] [Green Version]
  65. Garcia-Gonzalez, D.; Rivero, D.; Fernandez-Blanco, E.; Luaces, M.R. A Public Domain Dataset for Real-Life Human Activity Recognition Using Smartphone Sensors. Sensors 2020, 20, 2200. [Google Scholar] [CrossRef] [Green Version]
  66. Pires, I.M.; Hussain, F.; Garcia, N.M.; Zdravevski, E. Improving Human Activity Monitoring by Imputation of Missing Sensory Data: Experimental Study. Future Internet 2020, 12, 155. [Google Scholar] [CrossRef]
  67. Hastie, T.; Tibshirani, R.; Friedman, J. The Elements of Statistical Learning: Data Mining, Inference, and Prediction; Springer series in statistics; Springer: Berlin/Heidelberg, Germany, 2009. [Google Scholar]
  68. Arlot, S.; Celisse, A. A Survey of Cross Validation Procedures for Model Selection. Stat. Surv. 2009, 4. [Google Scholar] [CrossRef]
  69. Hodges, J.L.; Lehmann, E.L. Rank Methods for Combination of Independent Experiments in Analysis of Variance. Ann. Math. Stat. 1962, 33, 482–497. [Google Scholar] [CrossRef]
  70. Finner, H. On a Monotonicity Problem in Step-Down Multiple Test Procedures. J. Am. Stat. Assoc. 1993, 88, 920–923. [Google Scholar] [CrossRef]
  71. Reiss, A.; Stricker, D. Introducing a New Benchmarked Dataset for Activity Monitoring. In Proceedings of the 2012 16th International Symposium on Wearable Computers, Newcastle, UK, 18–22 June 2012; pp. 108–109. [Google Scholar] [CrossRef]
  72. Weiss, G.M.; Yoneda, K.; Hayajneh, T. Smartphone and Smartwatch-Based Biometrics Using Activities of Daily Living. IEEE Access 2019, 7, 133190–133202. [Google Scholar] [CrossRef]
  73. Banos, O.; Galvez, J.M.; Damas, M.; Pomares, H.; Rojas, I. Window Size Impact in Human Activity Recognition. Sensors 2014, 14, 6474–6499. [Google Scholar] [CrossRef] [Green Version]
Figure 1. CNN-RNN architecture.
Electronics 10 01685 g001
Figure 2. SC 2 taxonomy model used to categorize simple and complex activities used in this work.
Electronics 10 01685 g002
Figure 3. The proposed framework of S-HAR for CHA recognition.
Electronics 10 01685 g003
Figure 4. Graphical plots of some samples of accelerometer data from UTwente dataset.
Electronics 10 01685 g004
Figure 5. Graphical plots of some samples of gyroscope data from UTwente dataset.
Electronics 10 01685 g005
Figure 6. The scheme of data segmentation by overlapping temporal window used in the S-HAR framework.
Electronics 10 01685 g006
Figure 7. The architecture of the proposed CNN-BiGRU.
Electronics 10 01685 g007
Figure 8. Comparison of (a) GRU unit and (b) LSTM unit.
Electronics 10 01685 g008
Figure 9. Bidirectional sequence learning models with one hidden layer in the unfold form: (a) Bidirectional GRU and (b) Bidirectional LSTM..
Electronics 10 01685 g009
Figure 10. Recognition performance of DL models trained by all activity from UTwente dataset.
Electronics 10 01685 g010
Figure 11. Recognition performance of DL models trained by only complex activities from UTwente dataset.
Electronics 10 01685 g011
Figure 12. Recognition performance of DL models trained by only simple activities from UTwente dataset.
Electronics 10 01685 g012
Figure 13. Confusion matrix of models used in this study at sliding window size of 40 s.
Electronics 10 01685 g013
Figure 14. Confusion matrix of models used in this study at sliding window size of 5 s.
Electronics 10 01685 g014
Figure 15. Enhancement of DL recognition performance as the window size increases.
Electronics 10 01685 g015
Figure 16. Percentages of improved accuracy of hybrid DL models using all activity from UTwente dataset.
Electronics 10 01685 g016
Figure 17. Percentages of improved accuracy of hybrid DL models using complex activities from UTwente dataset.
Electronics 10 01685 g017
Figure 18. Percentages of improved accuracy of hybrid DL models using simple activities from UTwente dataset.
Electronics 10 01685 g018
Figure 19. Comparison of bidirectional approach and unidirectional approach of DL models using different activity data.
Electronics 10 01685 g019
Figure 20. The change of model accuracy and loss in the training and test data of DL models studied in this work.
Electronics 10 01685 g020
Table 1. The summary of HAR research related to SHA and CHA problems.
ReferenceYearSensor TypesMethodSHACHA
Liu et al. [35]2015Accelerometer and Gyroscopeshapelet-based approachsitting, standing, lying, ascending, descending, moving, walking, exercising, cycling, rowing, and jumpingrelax, coffee time, early morning, clean up, sandwich time, set-shot, jump-shot, lay-up, run dribbling, blocking, and walk dribbling
Shoaib et al. [20]2016Accelerometer and GyroscopeNaïve Bayes, decision tree, k-nearest neighborwalking, jogging, biking, writing, typing, sitting, and standingeating, drinking coffee, smoking, and giving a talk, stairs
Peng et al. [19]2018Accelerometer Gyroscope and MagnetometerAROMA model (a deep hybrid model of CNNs and LSTMs)walking, running, and sittinghaving a meal, working, attending a meeting, commuting, shopping, recreating, house cleaning, exercising, and sleeping
Alo et al. [34]2020Accelerometer Gyroscope and Magnetometerdeep stacked autoencodersitting, standing, walking, jogging, and bikingwalking upstairs, walking downstairs, eating, typing, writing, drinking coffee, smoking, and giving talks
Chen et al. [36]2020Accelerometer Gyroscope and MagnetometerDEBONAIR model (a deep hybrid model of CNNs and LSTMs)walking, sitting, and standingcommuting, eating, and house cleaning
Table 2. Activity list of the UTwente dataset.
ActivityCategoryDescription
WalkingSimpleIndoor walking
StandingSimpleStanding without doing anything
JoggingSimpleIndoor jogging
SittingSimpleSitting without doing anything
BikingSimpleBiking outside
Walking UpstairsSimpleWalking upstairs five floors
Walking DownstairsSimpleWalking downstairs five floors
TypingComplexTyping some text on a computer while sitting on a chair
WritingComplexWriting some text on a paper while sitting on a chair
Drinking CoffeeComplexDrinking out of a cup while sitting in an office
TalkingComplexTalking in a room while standing
SmokingComplexSmoking one cigarette while standing
EatingComplexUsing a spoon for eating a cup of soup
Table 3. The summary of hyperparameters for the CNN-BiGRU network used in this work.
StageHyperparameterValue
ArchitectureConvolutionKernel Size8
Stride1
Filters64
Dropout-1 0.25
Maxpooling 2
Flatten -
BiGRU Unit 128
Dropout-2 0.25
Dense 128
TrainingLoss Function Cross-entropy
Optimizer Adam
Batch Size 64
Number of Epochs 200
Table 4. FAR test and Finner post hoc test based on the accuracy metrics of DL models.
AlgorithmFARFinner Post Hoc Test
p-ValueH 0
CNN-BiGRU1.745--
CNN-GRU2.4670.364accepted
CNN-LSTM3.9820.188accepted
CNN-BiLSTM4.9500.189accepted
BiGRU6.1140.023reject
GRU6.2290.002reject
BiLSTM6.5850.0008reject
LSTM7.1010.0013reject
Table 5. F1-score of comparison results of the proposed CNN-BiGRU and other classifiers from previous works using accelerometer and gyroscope data from UTwente dataset.
TypeActivityNaïve Bayes [20]Support Vector
Machine [34]
Deep Stacked
Autoencoder [34]
The Proposed
CNN-BiGRU
SimpleWalking1.000.930.980.93
Standing0.960.830.980.97
Jogging0.971.001.000.99
Sitting0.900.870.980.97
Biking0.970.991.000.99
Walking Upstairs0.980.900.960.99
Walking Downstairs1.000.930.961.00
ComplexTyping0.940.960.980.99
Writing0.920.890.980.99
Drinking Coffee0.930.930.990.97
Talking0.880.860.940.94
Smoking0.950.880.951.00
Eating0.920.940.990.99
Average0.9470.9160.9760.978
Table 6. FAR test and Finner post hoc test based on the accuracy metrics of DL models.
AlgorithmFARFinner Post Hoc Test
p-ValueH 0
CNN-BiGRU1.844--
DSAE [34]3.7910.77429accepted
Naïve Bayes [20]6.0230.01416reject
Support Vector Machine [34]6.1720.00042reject
Table 7. F1-score of comparison results of the proposed CNN-BiGRU and other classifiers from previous work using only accelerometer data from UTwente dataset.
TypeActivityNaïve Bayes [20]Support Vector
Machine [34]
Deep Stacked
Autoencoder [34]
The Proposed
CNN-BiGRU
SimpleWalking0.840.830.970.97
Standing0.910.780.940.96
Jogging0.981.001.001.00
Sitting0.800.670.780.94
Biking0.740.970.990.99
Walking Upstairs0.740.770.930.99
Walking Downstairs0.830.910.930.99
ComplexTyping0.990.860.950.99
Writing0.880.630.820.98
Drinking Coffee0.750.720.750.97
Talking0.770.770.880.89
Smoking0.760.840.891.00
Eating0.860.900.960.99
Average0.8350.8190.9070.974
Table 8. FAR test and Finner post hoc test based on the accuracy metrics of DL models.
AlgorithmFARFinner Post Hoc Test
p-ValueH 0
CNN-BiGRU2.361--
DSAE [34]2.8980.00910reject
Naïve Bayes [20]5.2540.00006reject
Support Vector Machine [34]7.3180.00001reject
Table 9. F1-score of comparison results of the proposed CNN-BiGRU and SOTA models using wrist-worn wearable sensor data from UTwente dataset.
TypeActivityDeepConvTCN [30]InceptionTime [29]The Proposed
CNN-BiGRU
SimpleWalking0.910.870.93
Standing0.870.860.97
Jogging0.970.970.99
Sitting0.890.980.97
Biking0.900.980.99
Walking Upstairs0.980.990.99
Walking Downstairs0.970.971.00
ComplexTyping0.920.950.99
Writing0.980.910.99
Drinking Coffee0.820.850.97
Talking0.890.820.94
Smoking0.870.841.00
Eating0.970.990.99
Average0.9180.9220.978
Table 10. F1-score of comparison results of the proposed CNN-BiGRU and SOTA models using wrist-worn wearable sensor data from PAMAP2 dataset.
TypeActivityDeepConvTCN [30]InceptionTime [29]The Proposed
CNN-BiGRU
SimpleLying0.820.850.94
Sitting0.750.820.88
Standing0.880.860.89
Walking0.820.860.87
Running0.750.720.80
Cycling0.950.900.97
Nordic Walking0.780.760.82
Walking Upstairs0.900.880.87
Walking Downstairs0.900.850.81
ComplexVacuum Cleaning0.720.730.88
Ironing0.810.790.83
Rope Jumping0.730.710.70
Average0.8180.8110.855
Table 11. F1-score of comparison results of the proposed CNN-BiGRU and SOTA models using wrist-worn wearable sensor data from UTewente dataset.
TypeActivityDeepConvTCN [30]InceptionTime [29]The Proposed
CNN-BiGRU
SimpleWalking0.960.930.94
Jogging0.980.730.97
Stairs0.880.980.92
Sitting0.780.800.77
Standing0.820.910.85
ComplexTyping0.880.800.92
Brushing Teeth0.980.980.94
Eating Soup0.860.870.83
Eating Chips0.750.730.77
Eating Pasta0.820.830.86
Drinking0.870.860.85
Eating Sandwich0.620.730.71
Kicking0.900.810.90
Catching a ball0.930.900.94
Dribbling0.940.900.94
Writing0.860.720.89
Clapping0.980.860.94
Folding0.870.880.94
Average0.870.850.88
Publisher’s Note: MDPI stays neutral with regard to jurisdictional claims in published maps and institutional affiliations.

