Article

Office Room Channel Modeling and Object Attenuation at Sub-THz Frequencies

1
Department of Information Technology, Ghent University/IMEC, 9052 Ghent, Belgium
2
IMEC, 3001 Leuven, Belgium
*
Author to whom correspondence should be addressed.
Submission received: 24 June 2021 / Revised: 14 July 2021 / Accepted: 16 July 2021 / Published: 18 July 2021

Abstract

:
Large bandwidths are needed to meet the high-throughput requirements of future wireless communication systems. These larger bandwidths are available at mmWave and sub-THz frequencies, such as the V-band ranging from 50 to 75 GHz and the D-band ranging from 110 to 170 GHz. In this paper, we present channel measurements in an office environment, covering the full D-band. Line-of-Sight (LOS) path loss (PL) is modeled as a function of frequency and distance. Both a single-frequency floating-intercept and multi-frequency alpha-beta-gamma model provide a good fit to the measured LOS PL data. Attenuation due to blockage of the LOS path by various desk objects, such as computer peripherals and cables, is determined, as well as attenuation due to plant obstructions. Attenuation due to an obstructed LOS path ranges from 3 dB for a single universal serial bus (USB) cable, and up to 25 dB for a laptop power supply, computer mouse, computer monitor, or plant. Because of a higher diffraction angle, the measured attenuation is higher when the distance between the antennas decreases. We measure diffraction around a computer monitor for dual polarization and verify whether communication via the reflected non Line-of-Sight path makes high-throughput wireless communication possible when the LOS path is blocked.

1. Introduction

It is expected that future wireless communication systems will require higher throughputs than the data rates attainable today. Therefore, new frequency spectra need to be explored. In the D-band, ranging from 110 to 170 GHz, plenty of bandwidth is available for short and medium-range wireless communication. A wireless hub is a possible application for high-throughput wireless communication in an office environment. A laptop can establish a high-throughput link to a hub that is placed on the desk and use the wireless link for sending video streams, data files, and for connecting peripherals, but it can also connect to a hub that is fixed at the ceiling and acts as a high-throughput access point. The latter is characterized by distances up to a few meters and a low probability of Line-of-Sight (LOS) blockage, whereas, for the former, the distance is in sub-meter range, and there is a higher probability that the LOS path is obstructed by desk objects.
Indoor channel modeling at millimeter wave (mmWave) frequencies below 100 GHz has been extensively studied [1,2,3,4,5,6,7,8,9]. Surveys of mmWave communication for 5G applications are provided by Niu et al. [1] and Rappaport et al. [2]. Penetration loss measurements are performed by Isa et al. for a frequency range of 30 to 60 GHz [3] and by Ryan et al. for a frequency of 73 GHz [4]. Propagation measurements at 28 GHz and 73 GHz in an office environment are presented by MacCartney et al. [5], providing different path loss (PL) models and favoring a simple close-in model for indoor large-scale PL modeling over a frequency dependent model. Wu et al. performed channel modeling for an indoor office environment at 60 GHz [6], characterizing multipath components and showing the dependence of the environment and antenna placement on azimuthal channel properties. Based on 60 GHz measurements in an office environment, Liu et al. study capacity and symbol error probability for a multiple-input-multiple output model [7]. Dual-polarized double-directional indoor channel measurements are performed by Ling et al. for frequencies 70 to 77 GHz [8], confirming the dependence of the channel characteristics on room geometry, antenna placement, and polarization configuration. Senic et al. discuss indoor PL models at 83.5 GHz [9], proposing a maximum-power PL model for mmWave communication based on directional channel measurements, rather than an omnidirectional model.
Research on channel modeling at sub-THz frequencies above 100 GHz is ongoing. Rappaport et al. provide approaches and applications for sixth generation (6G) wireless networks using frequencies above 100 GHz [10]. Xing et al. compare a vector network analyzer (VNA)-based channel sounder to a sliding correlator-based sounder and present indoor PL and penetration loss measurements at 140 GHz [11], concluding that the fitted close-in PL model is close to a free space model. The full D-Band is characterized by Kim et al. for indoor applications [12], resulting in a floating-intercept PL model, a reflection loss of about 3 dB for an aluminum plate and 15 dB for fiberboard. Attenuation measurements of a glass, ceramic, and plastic cup are also provided, showing a loss of respectively 11 dB, 40 dB, and 3 dB. Nguyen et al. compare the 28 and 140 GHz radio channels in a shopping mall [13] and Pometcu et al. consider non-Line-of-Sight (NLOS) indoor scenarios for frequencies ranging from 126 to 156 GHz [14]. A comparison of indoor PL models at frequencies 30, 140, and 300 GHz is performed by Cheng et al. [15]. Indoor reflection, penetration, and PL measurements at 28, 73, and 140 GHz are performed by Xing et al. [16]. Propagation measurements in an office environment at frequencies 28 and 140 GHz are performed by Olsson et al. [17], considering reflection and penetration as well as coverage measurements. They confirmed that penetration loss in the D-band is clearly higher than at 28 GHz, but reflection losses are less frequency dependent. The ITU-R P.1238 recommendation provides an indoor propagation model for frequencies ranging from 300 MHz up to 450 GHz [18]. However, the model is only validated above 100 GHz for frequencies 250, 275, 300, and 325 GHz.
In this paper, we perform LOS measurements in an office environment for distances up to 3.5 m, characterizing the full D-band, as well as obstructed LOS and reflected NLOS measurements. Instead of calculating partition and reflection losses via Fresnel’s equations, which would not only require the knowledge of the index of refraction at D-band frequencies but also a detailed model of the object, we obtain reflection and obstruction loss via path loss measurements. The novelty of this paper is not only the evaluation of attenuation due to typical office room objects and plant obstructions at D-band frequencies, but we also measure diffraction around a computer monitor and consider measurements with dual polarizations. The results allow for predicting the wireless link quality when the LOS path is obstructed and will be used for a ray tracer implementation. We use the channel sounder presented and validated in [19] for the characterization of the D-band’s 60 GHz bandwidth.
The outline of this paper is as follows. In Section 2, we first present the D-band channel sounder and discuss the various measurement scenarios, including the LOS measurements, attenuation measurements of desk objects, and monitor and plant obstruction. The channel modeling results follow in Section 3, and Section 4 concludes this paper.

2. Methodology

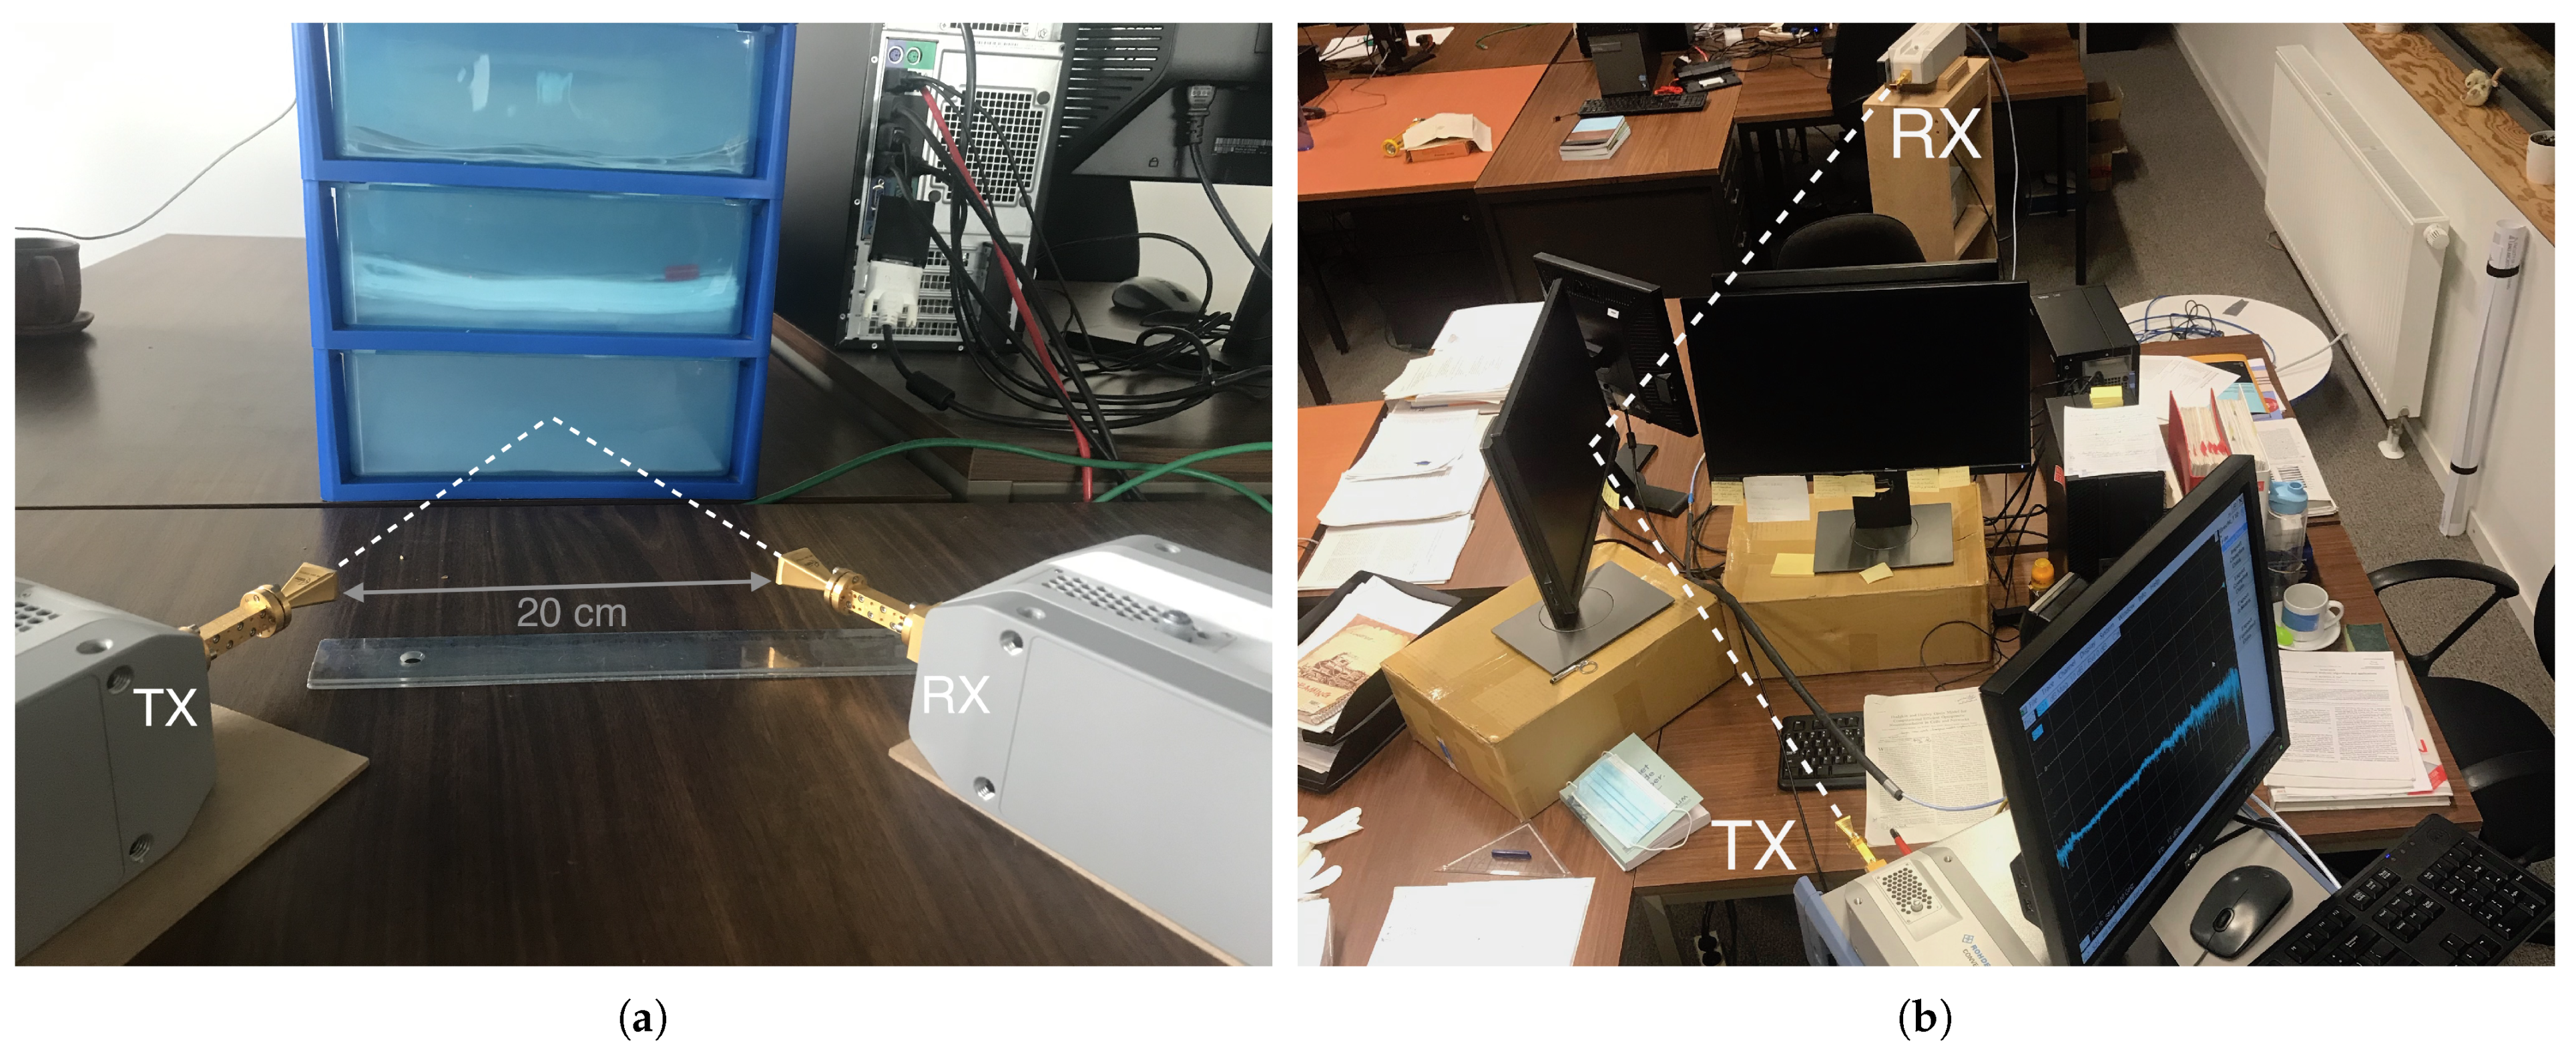
2.1. D-Band Channel Sounder

The channel sounding equipment consists of a VNA, signal generator, frequency convertors, and standard gain horn antennas; it is presented and validated in our previous work [19]. The VNA generates a radio frequency source in a range of 9.2 to 14.2 GHz, which is up-converted to the D-band via a frequency multiplication. A harmonic mixer uses a local oscillator signal in a frequency range of 11 to 17 GHz generated by an external signal generator to down-convert the D-band signal. Each convertor has a WR-6 waveguide to which a D-band horn antenna is connected, with a midband gain of 23 dBi, an H-plane half power beamwidth (HPBW) ranging from 13.2° for 110 GHz to 12° for 170 GHz and an E-plane HPBW ranging from 12° to 8.8°. A frequency sweep of 3001 frequency points is triggered, covering the full 60 GHz bandwidth, resulting in a frequency step size of 20 MHz. The temporal resolution is 0.0167 ns, and the maximum resolvable time domain is 50 ns. The intermediate frequency measurement bandwidth is 100 Hz, and the transmit power is set to 16 dBm, which results in a dynamic range of 60 dB and a maximum measurable PL of 105 dB. A normalized forward calibration is performed before the measurements.

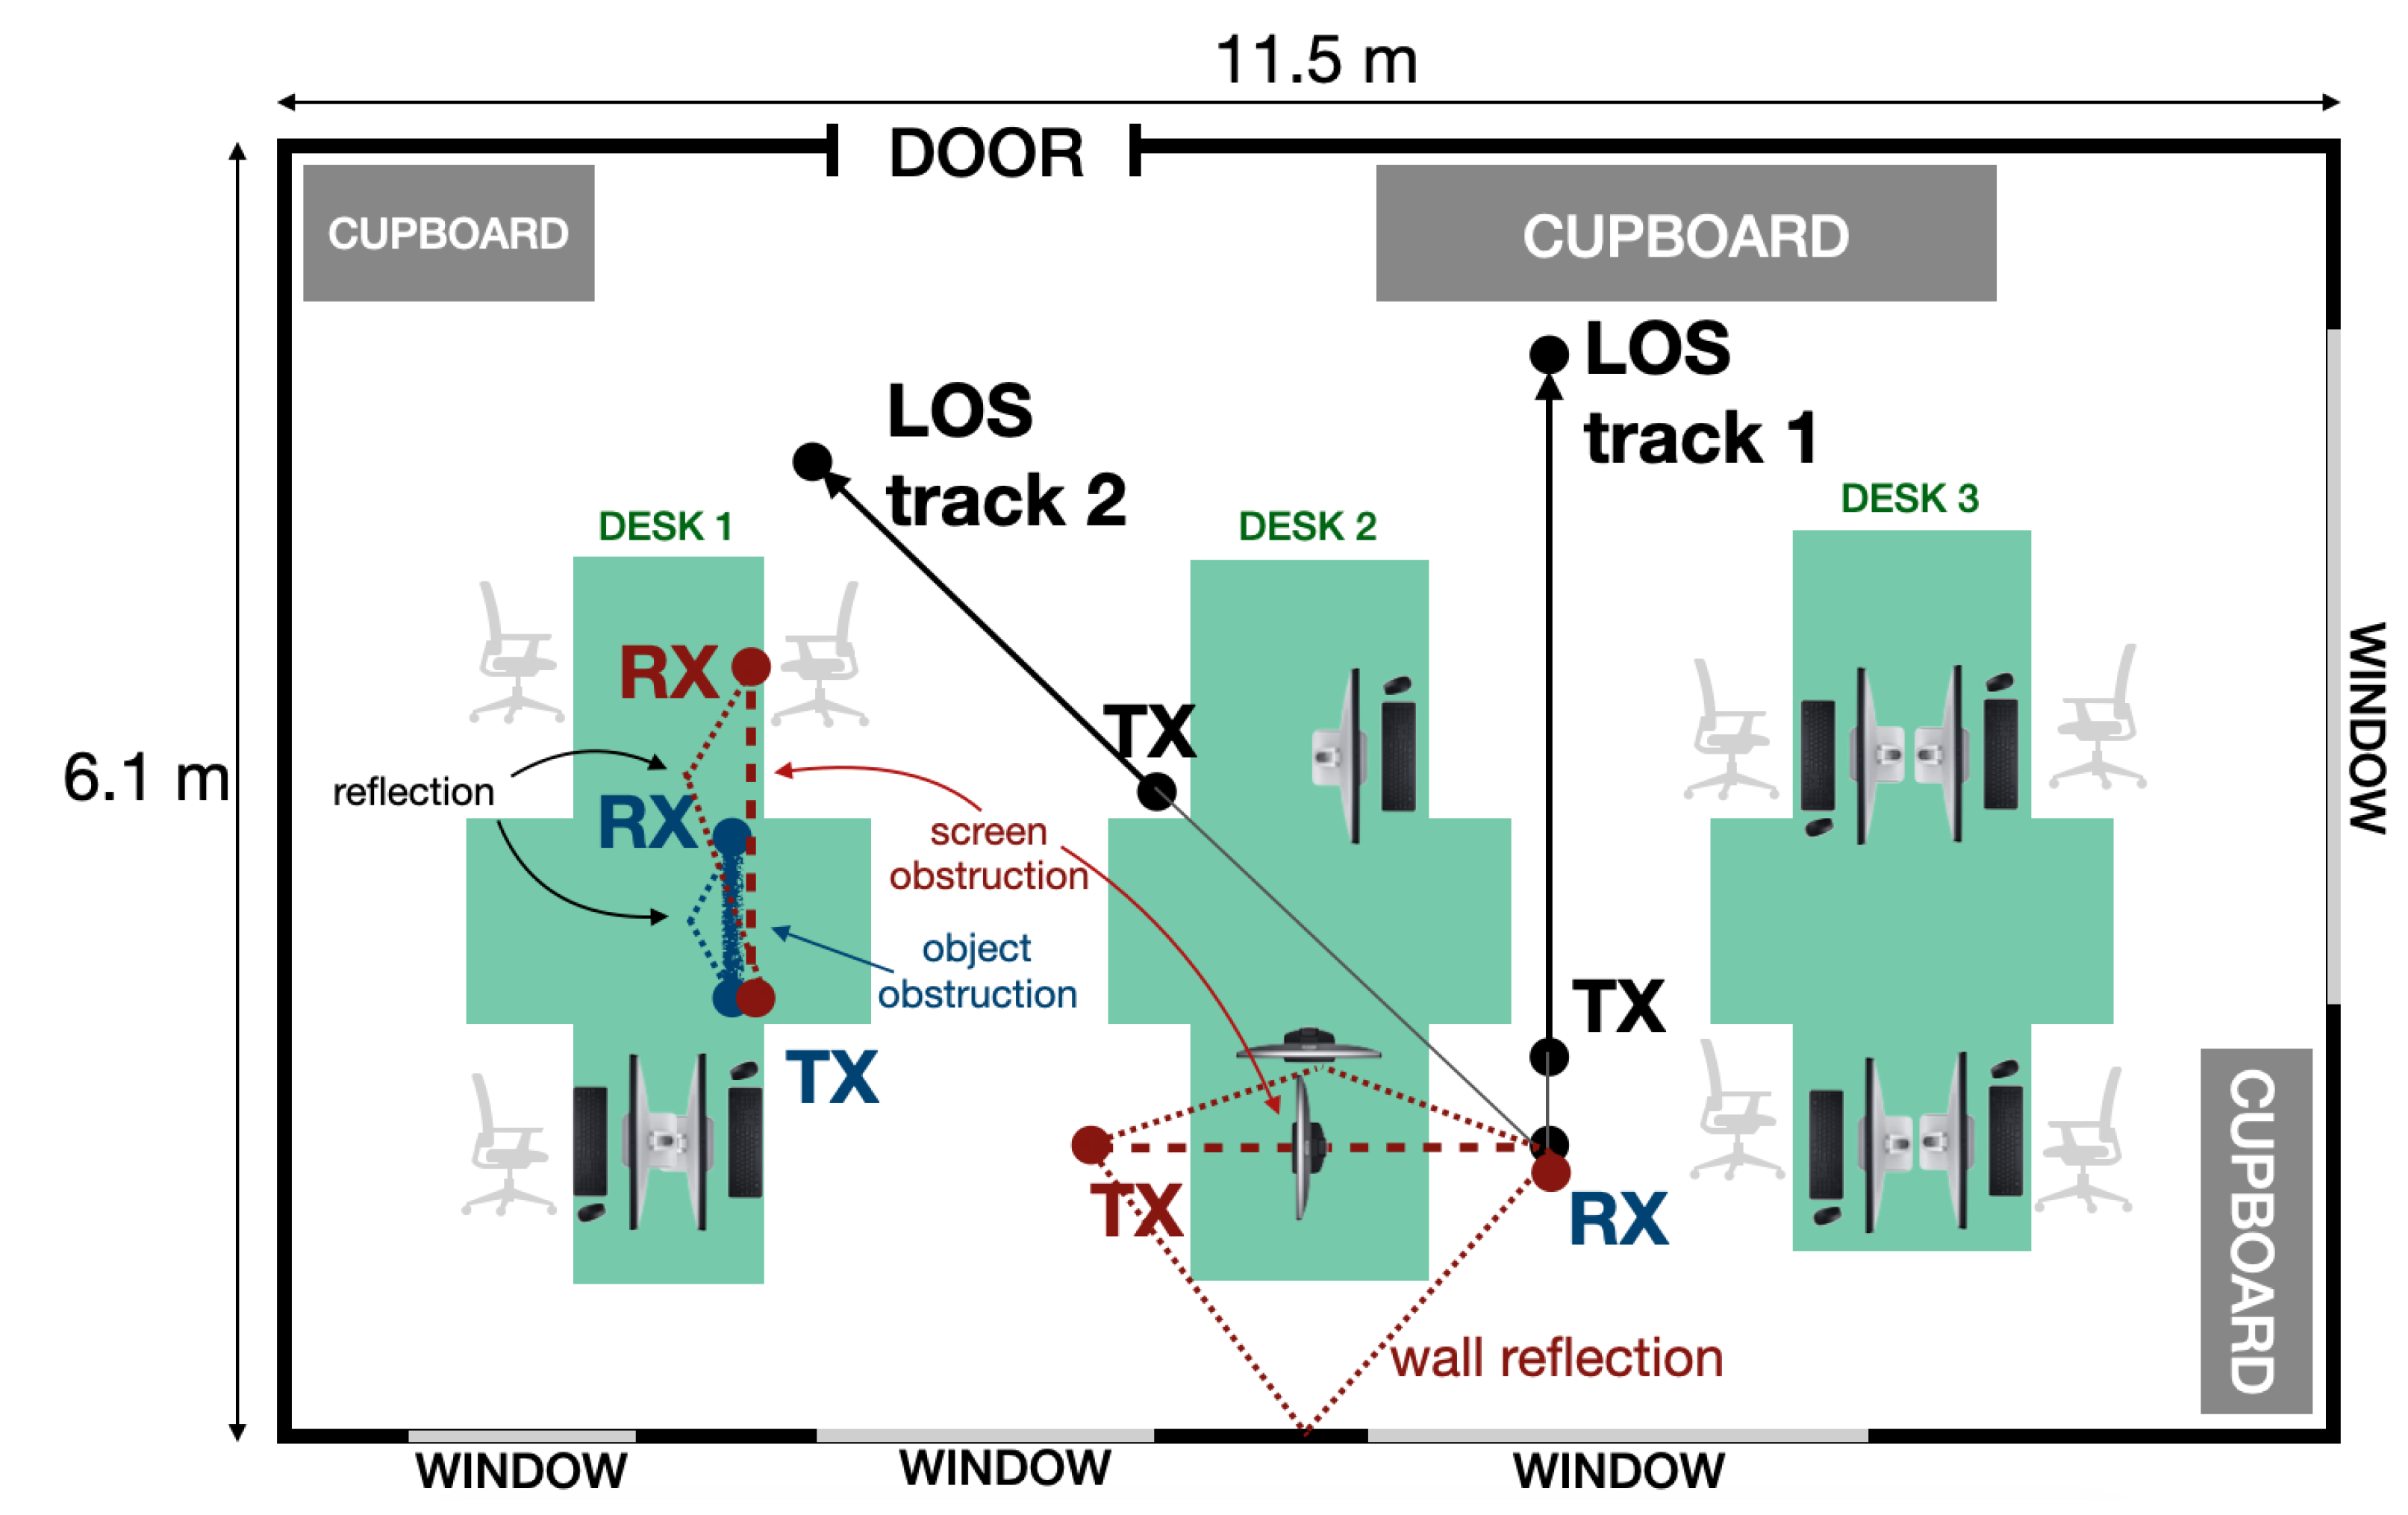
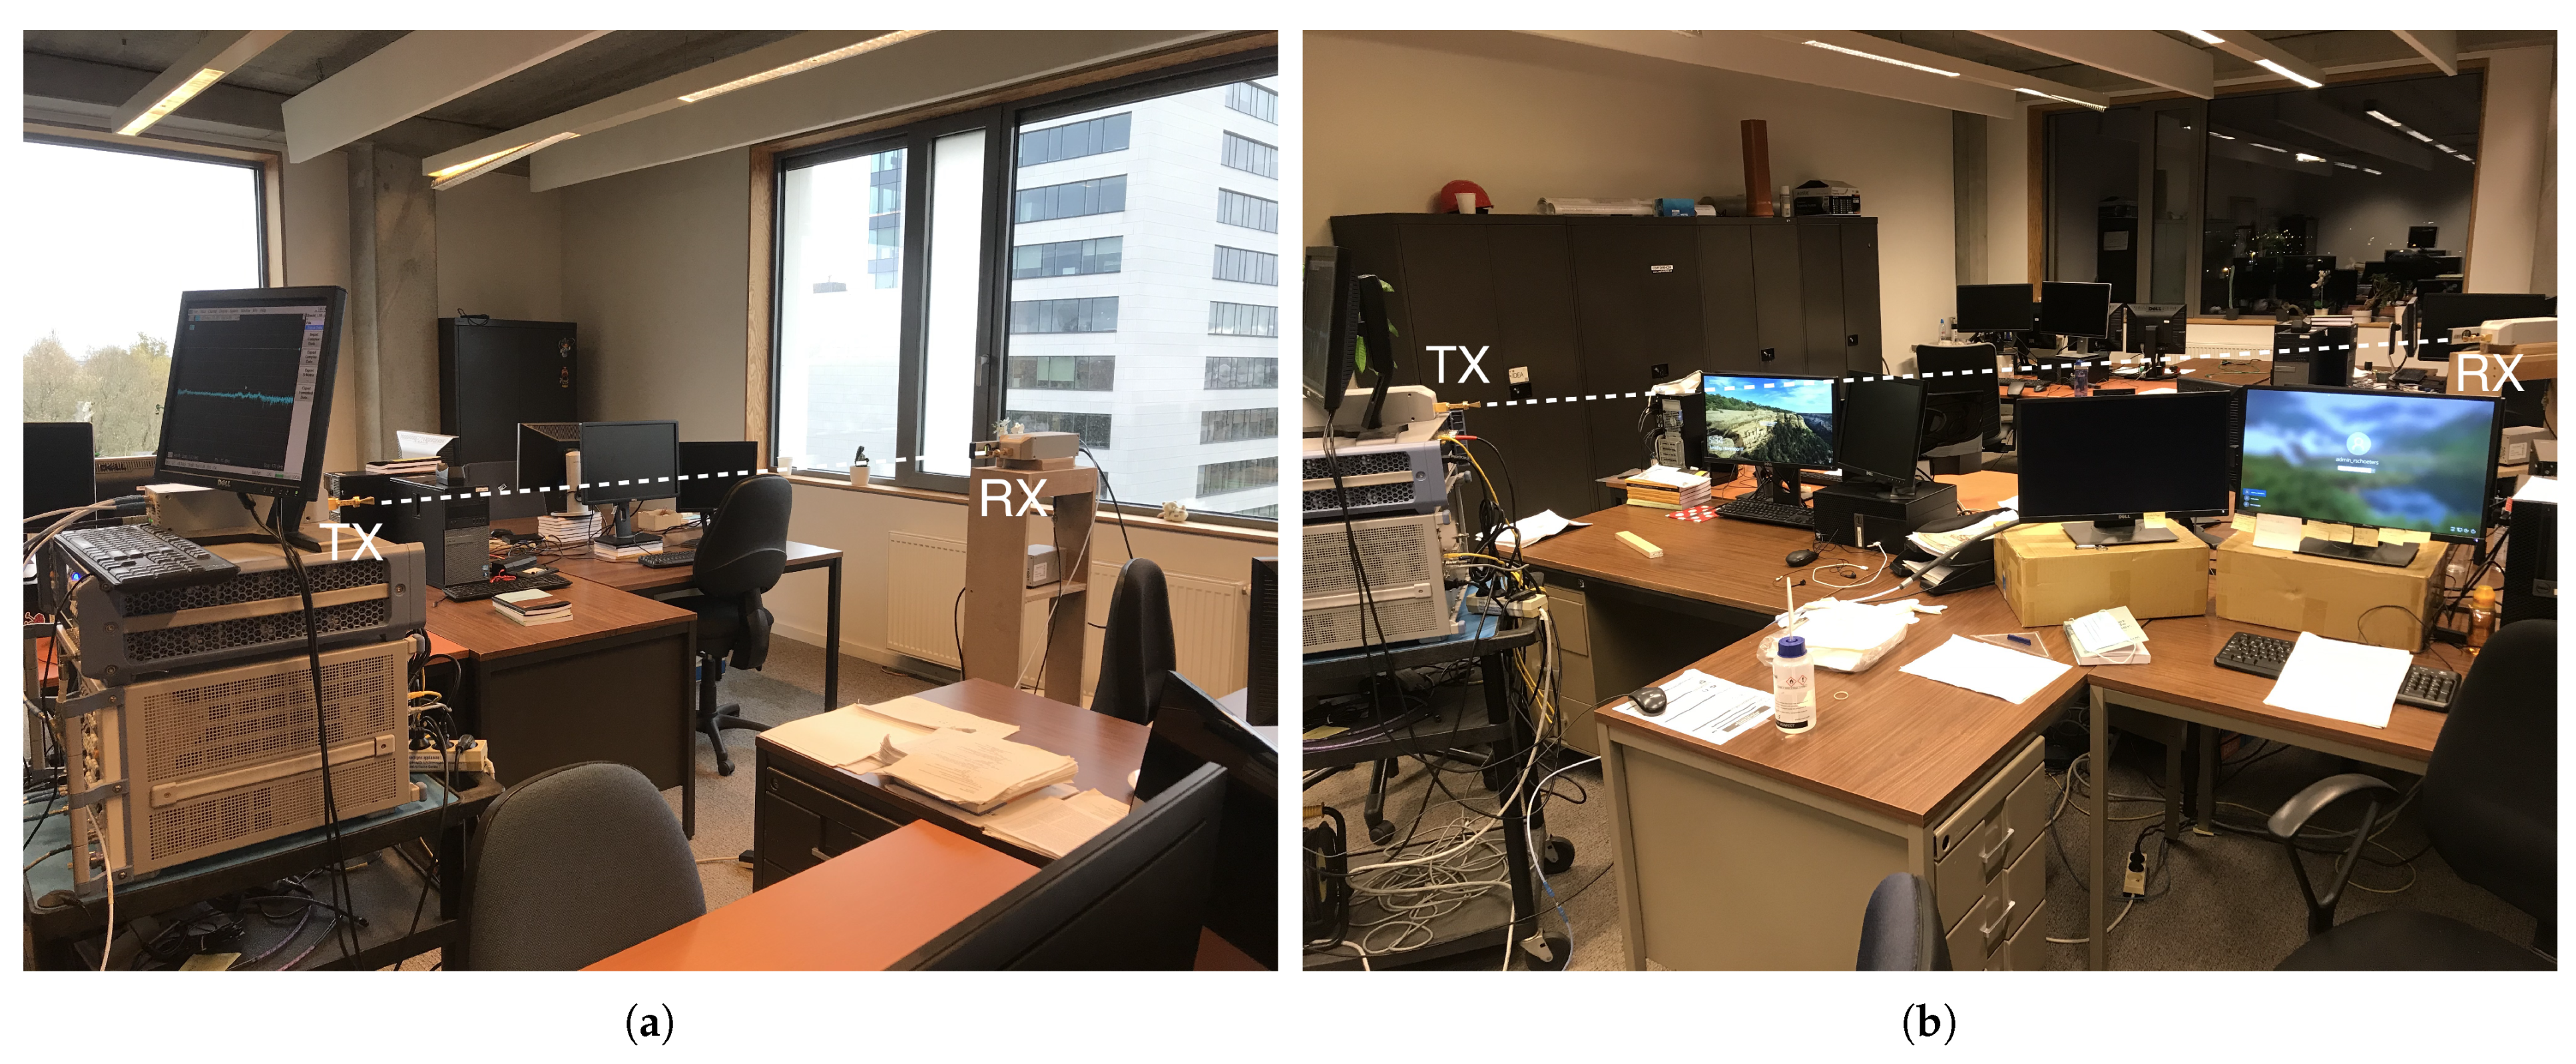
2.2. Measurement Environment and Scenarios

We performed measurements in an office room measuring 11.5 m by 6.1 m. The environment is assumed to be static, as no people were present in the office during the measurements. We performed unobstructed LOS measurements, obstructed LOS measurements with desk objects and plants obstructing the LOS path, and reflected NLOS measurements. A schematic overview of the different measurements is presented in Figure 1.

2.2.1. Line-of-Sight Path

LOS measurements are performed along two tracks, as shown in Figure 1, with distances ranging from 0.3 to 3.5 m between the two antennas, by moving the TX antenna away from the RX antenna in steps of 10 cm. For each distance, two frequency sweeps are performed and averaged. A picture of each measurement track is shown in Figure 2. Track 1 is in between desks 2 and 3, whereas track 2 is a LOS track above desk 2, i.e., with both antennas at a height higher than the monitors that are placed on the desk.
The measured LOS PL values of the two observations are averaged over 1 GHz subbands and fitted to two different path loss models, the single-frequency floating-intercept (FI) model from (1) and a multi-frequency alpha-beta-gamma (ABG) model from (2).
PL FI , dB ( d , f ) = P L 0 ( f ) + 10 n ( f ) log 10 ( d / 1 m ) + χ σ
PL ABG , dB ( d , f ) = α + 10 β log 10 d 1 m + 10 γ log 10 f 1 GHz + χ σ .
In (1), d is the distance in meters between the antennas, P L 0 ( f ) is the reference PL in dB at 1 m, n ( f ) is the dimensionless PL exponent, and χ σ is the shadow fading term in dB, based on a zero-mean normal distribution with standard deviation σ in dB. In (2), α is the floating intercept in dB, β is the dimensionless PL exponent, γ presents the dependence of PL on frequency, and χ σ is the shadow fading term in dB.

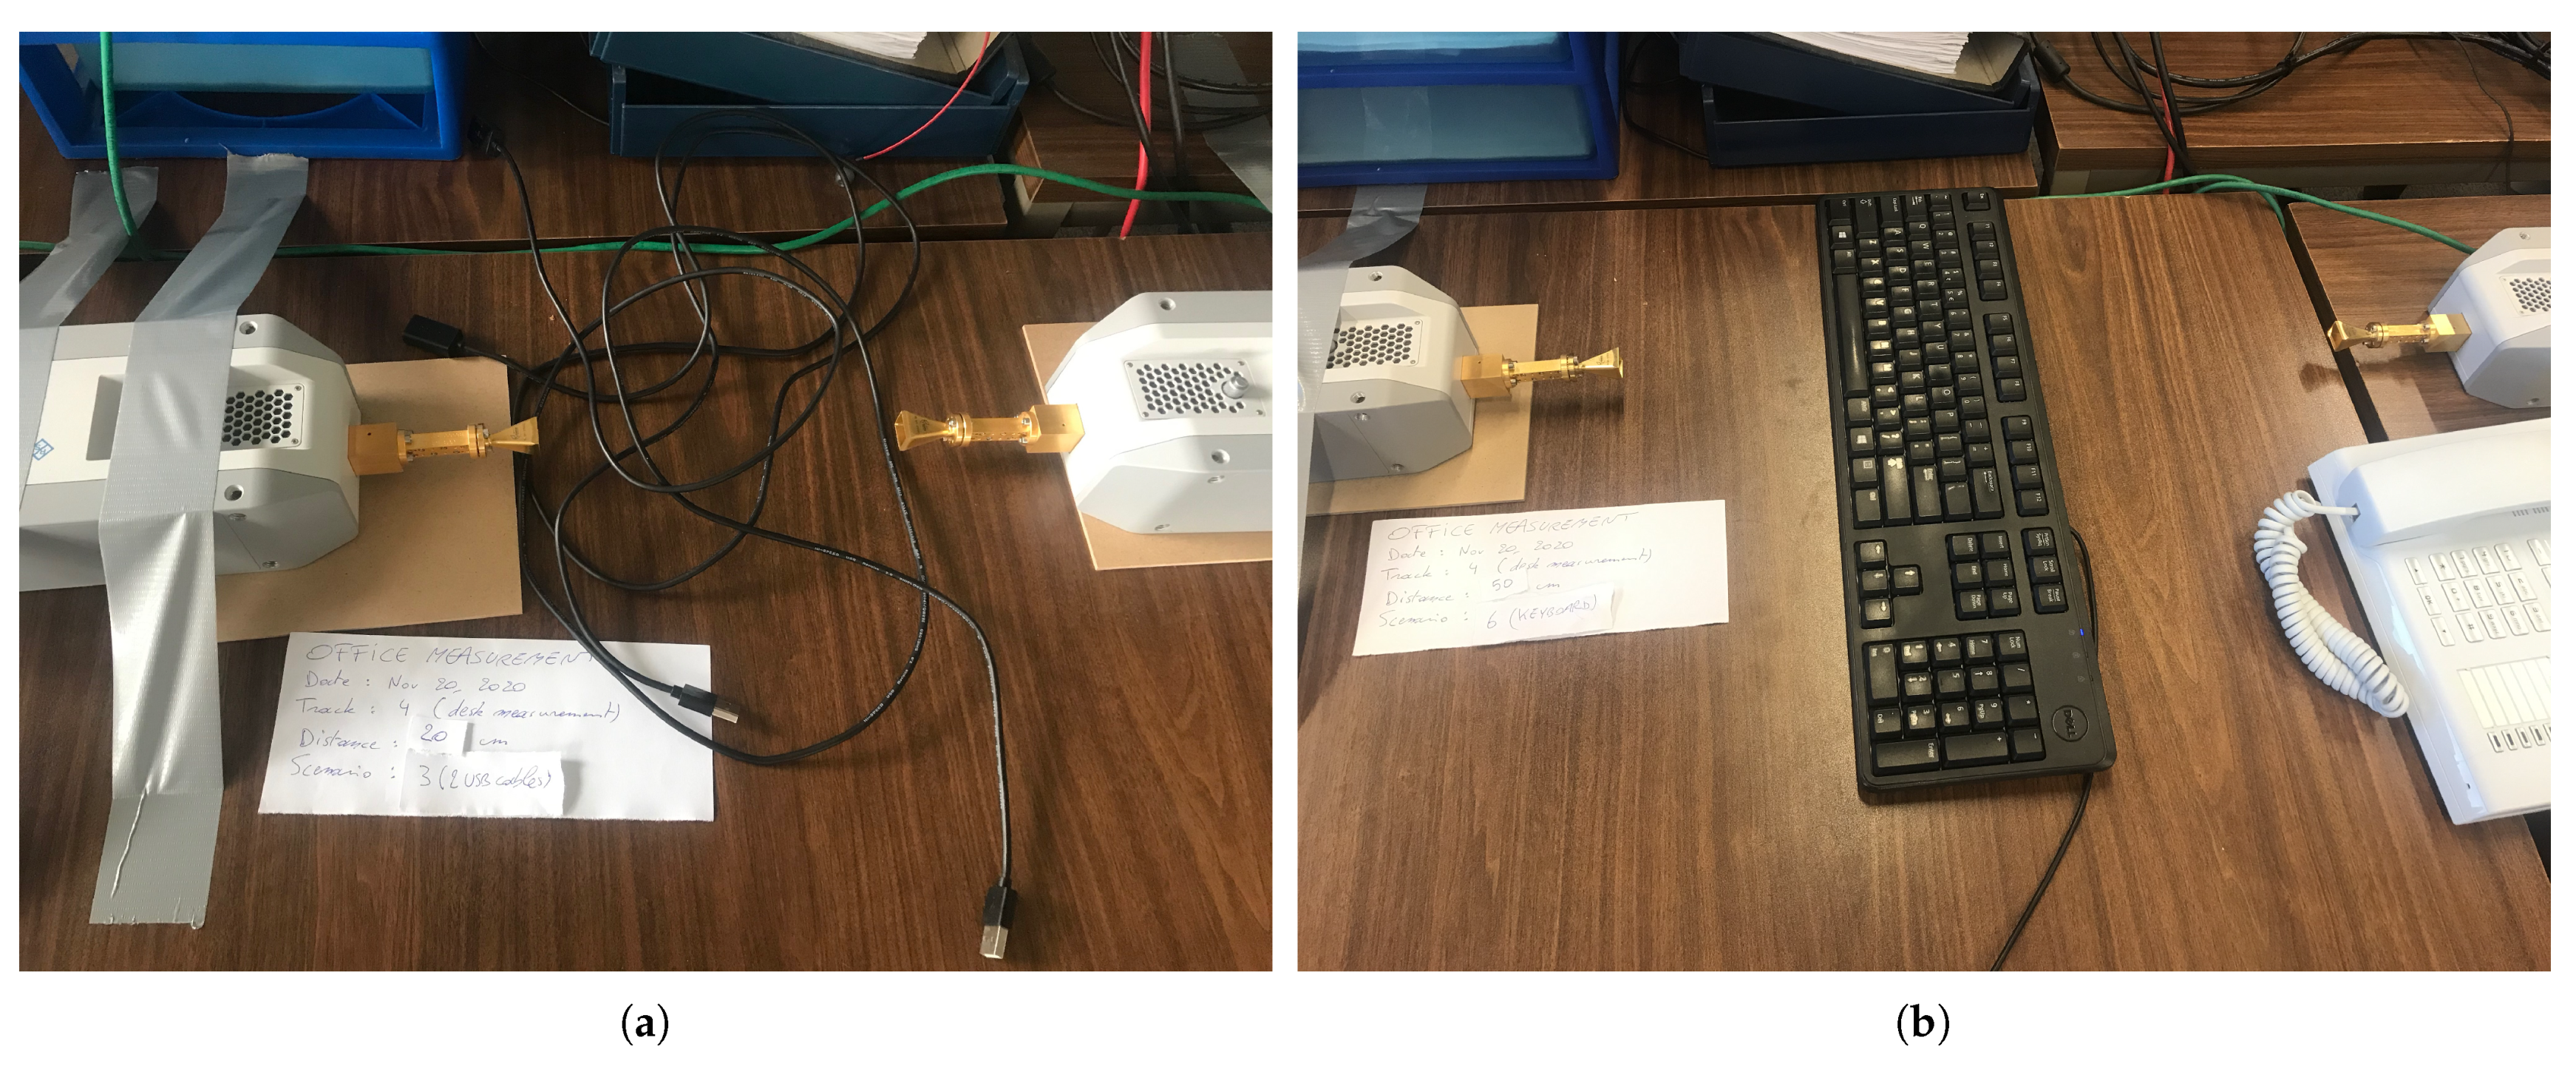
2.2.2. Desk Object Obstruction

We measure the attenuation when desk objects obstruct the LOS path. The considered desk objects, which could possibly obstruct the LOS path in a wireless hub application, are a single universal serial bus (USB) cable, multiple USB cables, a telephone cable, a computer mouse and keyboard, a laptop power supply unit, a stack of business cards, and a hole puncher. We performed measurements with a distance of 20 cm as well as 50 cm between the vertically polarized antennas, and the desk object positioned in the center in a way that the first Fresnel zone is approximately 40–50% blocked. The Fresnel radius r F is found via (3), with d the distance between the antennas in meter, c the speed of light in m/s, and f the frequency in Hz.
r F = 1 2 c d f
The Fresnel radius at center frequency 140 GHz for distance d = 20 cm is 1 cm, whereas it is 1.6 cm for distance d = 50 cm. A picture of the measurement setup for the USB cables and the computer keyboard obstruction is shown in Figure 3.

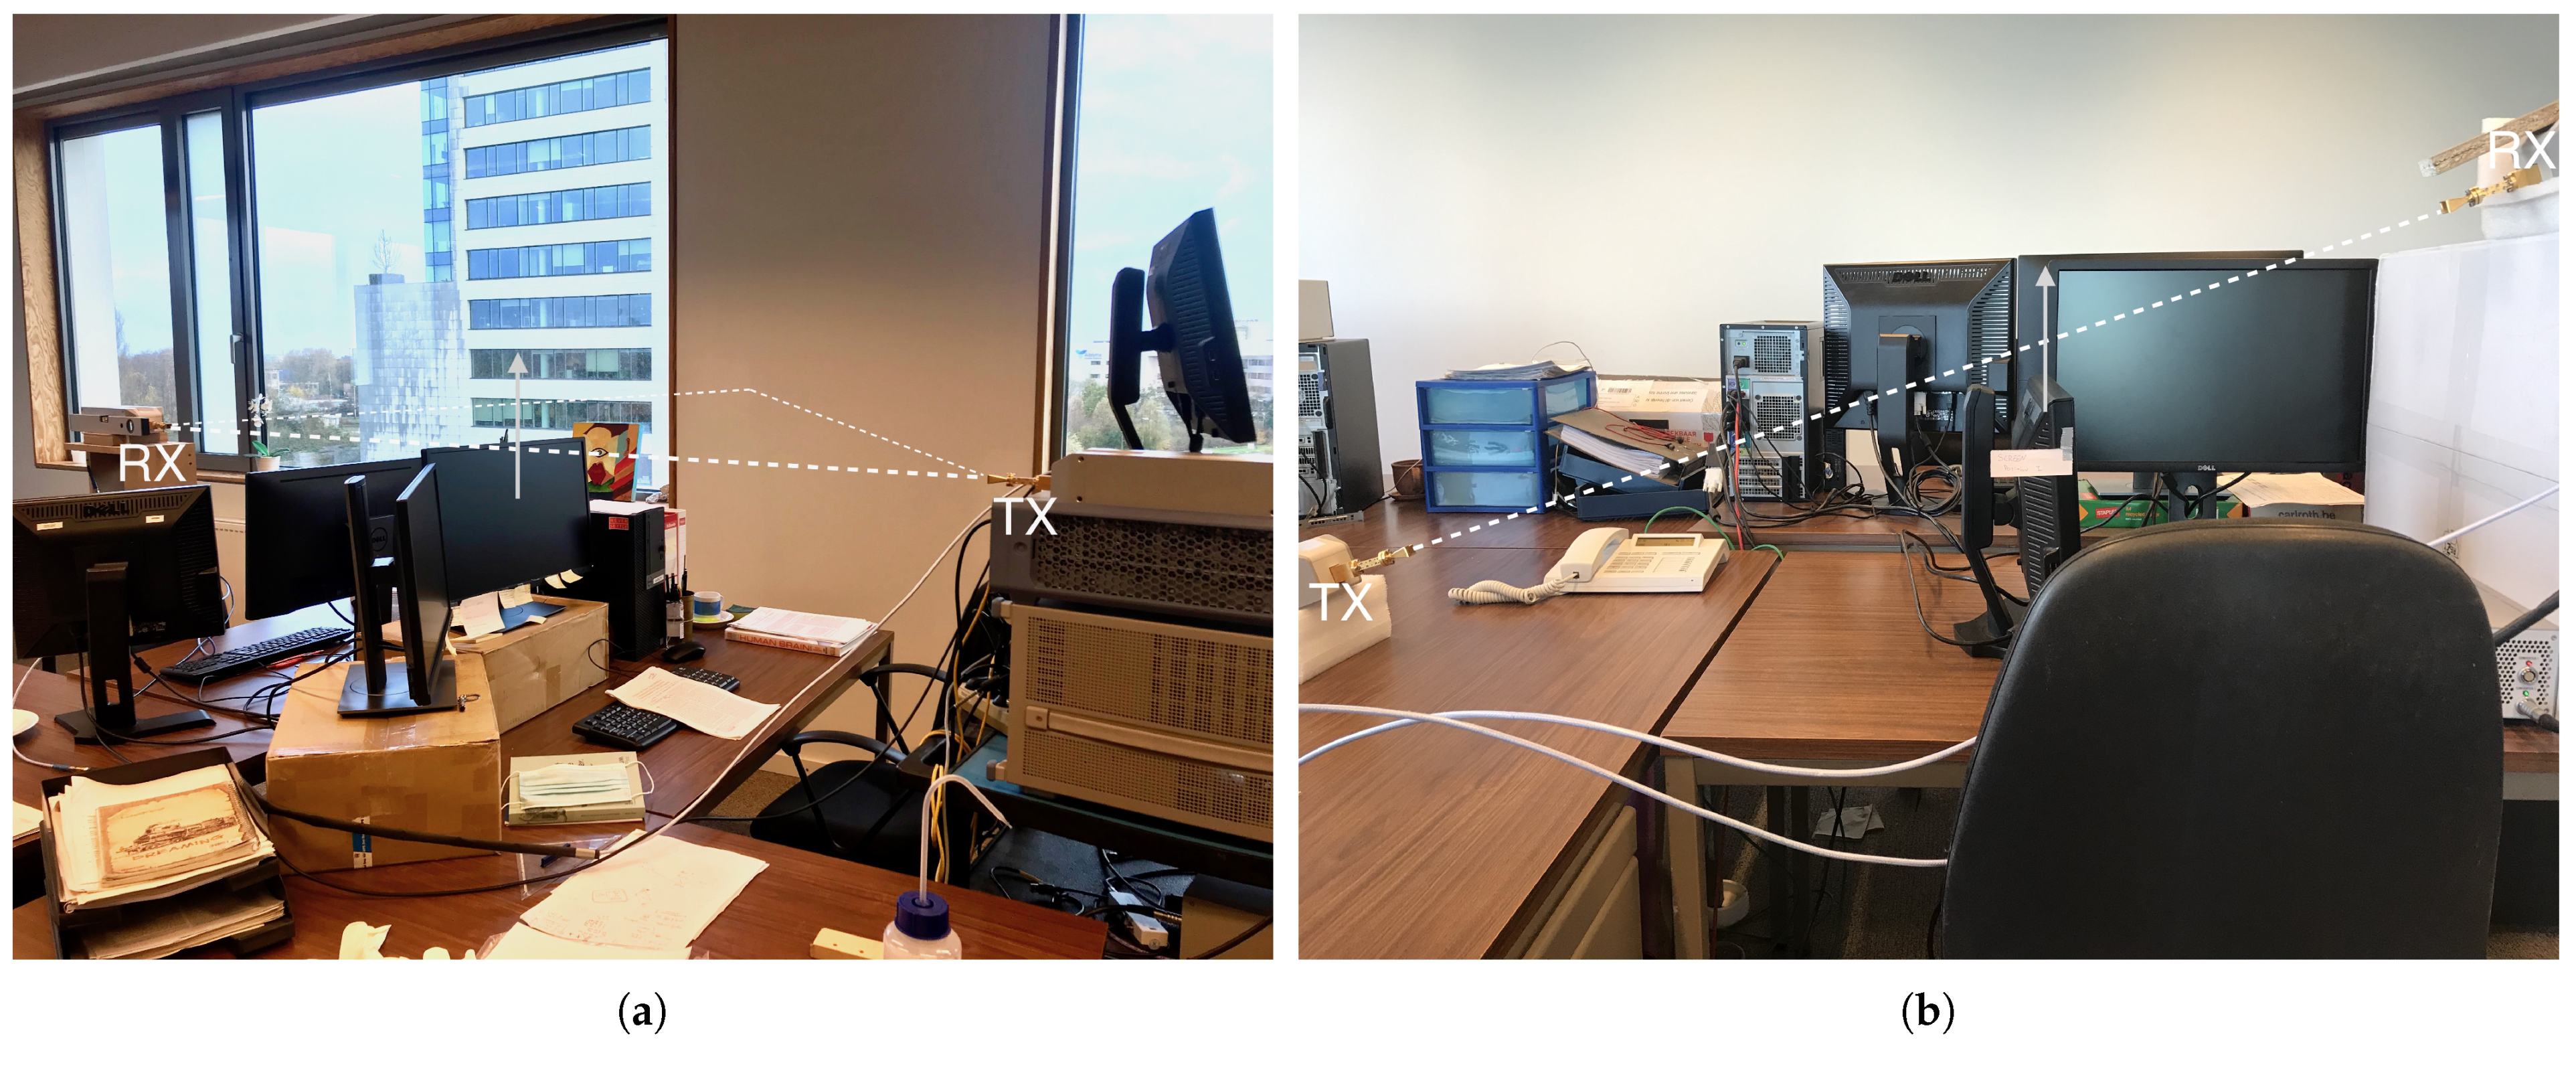
2.2.3. Monitor Obstruction

The computer monitor is another possible obstruction in an office environment. In order to assess the influence of the monitor obstructing the LOS path, we performed measurements with a monitor in between the TX and RX antenna, from which the height is adjusted in steps of 1 cm, ranging from a non-obstructed LOS path to a fully blocked path. The monitor obstruction measurement locations are presented by dashed lines in Figure 1. For the first measurement setup, at desk 2 and shown in Figure 4a, both antennas are vertically polarized and at the same height with a distance of 2.24 m between the antennas, whereas, for the second measurement setup, both antennas are at a different height but pointing towards each other, with a distance of 1.27 m between the antennas. For this second setup, at desk 1 and shown in Figure 4b, we also considered a horizontal co-polarization of TX and RX antennas, by rotating the frequency convertors, to which the antennas are connected, by 90 degrees.

2.2.4. Reflected Non-Line-of-Sight Path

For the scenarios with an obstructed LOS path, we also measured path loss of the best reflected NLOS path in order to assess whether a fallback path is available when communication via the LOS path is not possible. For this, we point the two antennas towards a nearby reflection point, as can be seen in Figure 5. The reflected paths are represented by a dotted line in Figure 1 and a dashed line in Figure 5. For the desk clutter obstructions, we consider reflection on a nearby personal computer (PC) enclosure (flat metallic surface), a nearby plastic box, and the back of a nearby computer monitor (curved metallic surface). For the monitor obstruction scenario, we consider reflection on the wall and a nearby monitor. Similar to the desk object obstructions, we define the attenuation as the difference between measured PL of the reflected path and theoretic free space path loss (FSPL) of the non-obstructed direct LOS path. This attenuation includes an additional path loss, due to the longer path length, and a reflection loss.

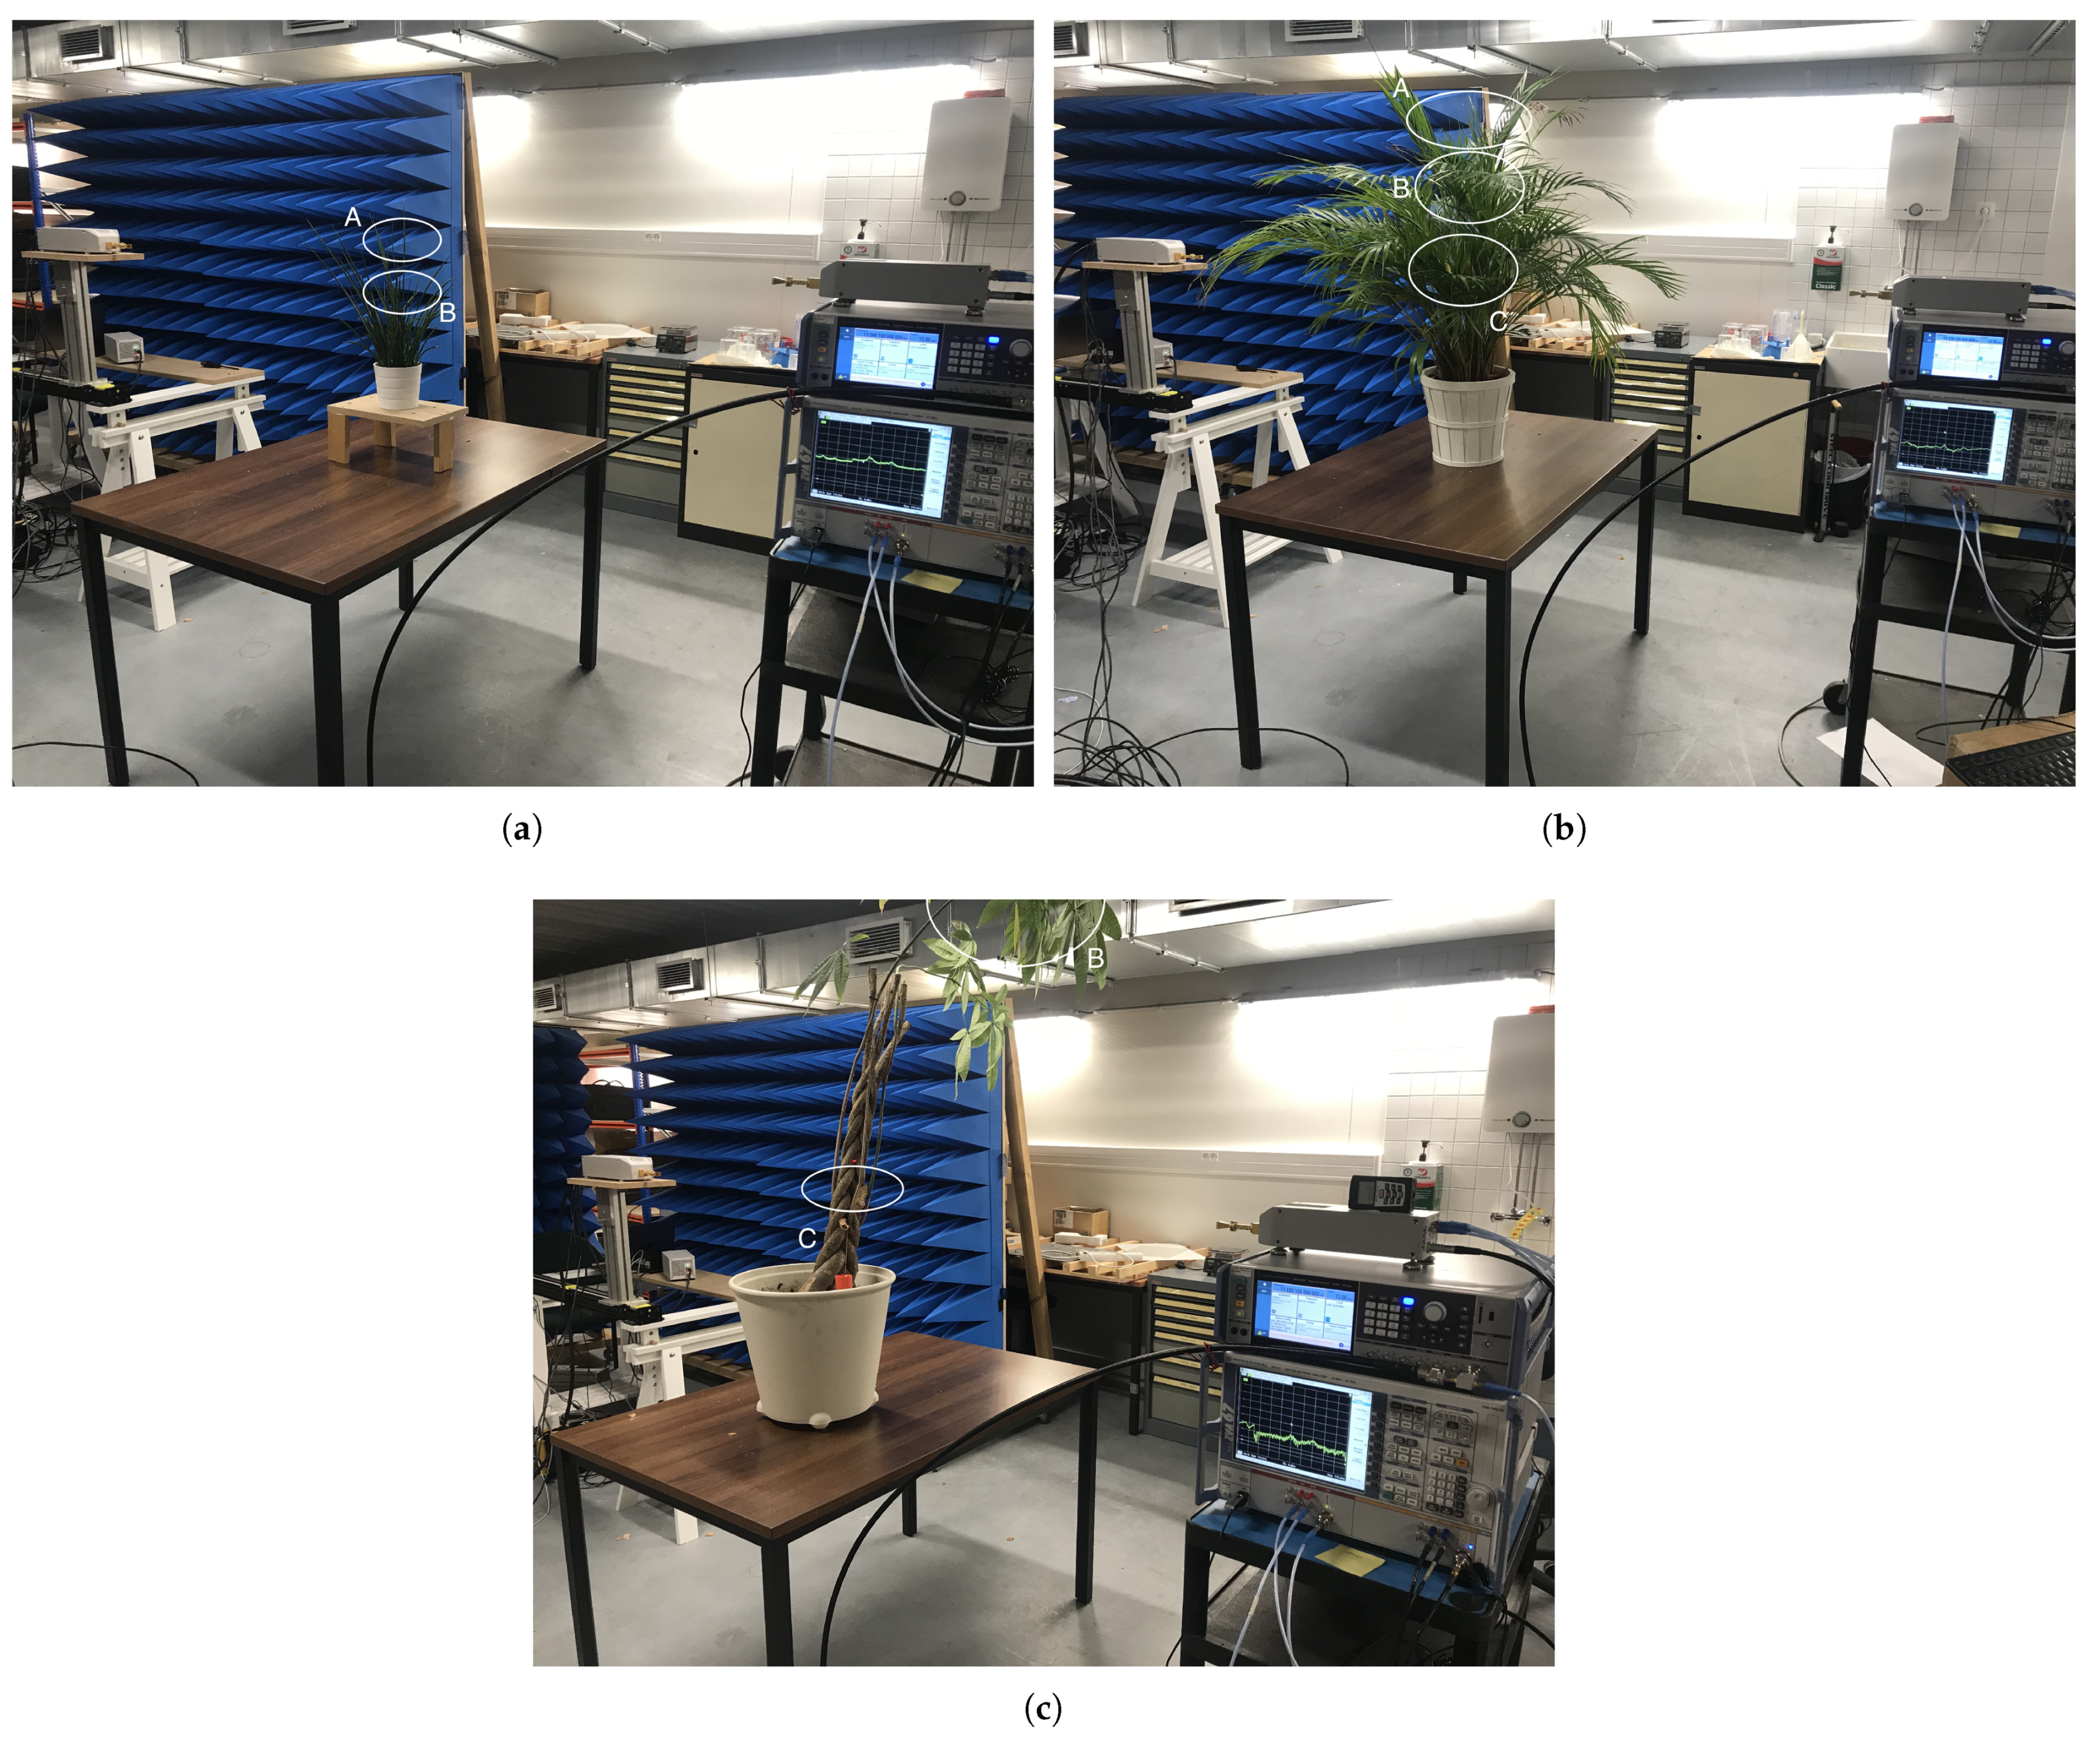
2.2.5. Plant Attenuation

In addition to desk objects obstructing the LOS path, we also measured attenuation due to plants obstructing the LOS path. We considered three different plant types, presented in Figure 6. The distance between the antennas is 2 m, and the plant is placed right in the middle, with multiple heights being considered, resulting in different intersection locations labeled A (light obstruction) to C (dense obstruction). For every plant type and height, three measurements are performed for small scale fading (SSF) averaging. The plant is slightly moved and rotated before each measurement to average out the influence of specific leaves and gaps.

2.3. Data Processing

The measurements result in a channel transfer function H ( f ) , from which we obtain PL via (4), with f c the center frequency and B the number of frequency samples with step size Δ F equal to 20 MHz over which we average, N the number of channel observations for each given scenario and setup, G a the frequency-dependent antenna gain from the data sheet, and C a correction term based on validation measurements [19]:
PL dB ( f c ) = 10 · log 10 1 B f = f c B 2 Δ F f c + B 2 Δ F 1 N i = 1 N | H i ( f ) | 2 + 2 G a ( f c ) + C ( f c )
The attenuation A ( f c ) , in dB, due to different objects blocking the LOS path is found by subtracting FSPL from the measured PL via (5), with d the LOS distance between the two antennas, f c the center frequency of the considered subband, and c the speed of light:
A dB ( f c ) = PL dB ( f c ) 20 · log 10 4 π d f c / c
We also investigate the power delay profiles (PDP) of the different measurements by performing an inverse discrete Fourier transformation (IDFT) after applying a Hann windowing function W , as can be seen in (6), with Δ τ the time resolution of 0.0167 ns:
PDP ( k Δ τ ) = 1 N i = 1 N | IDFT ( W ( f ) · H i ( f ) ) | 2

3. Results

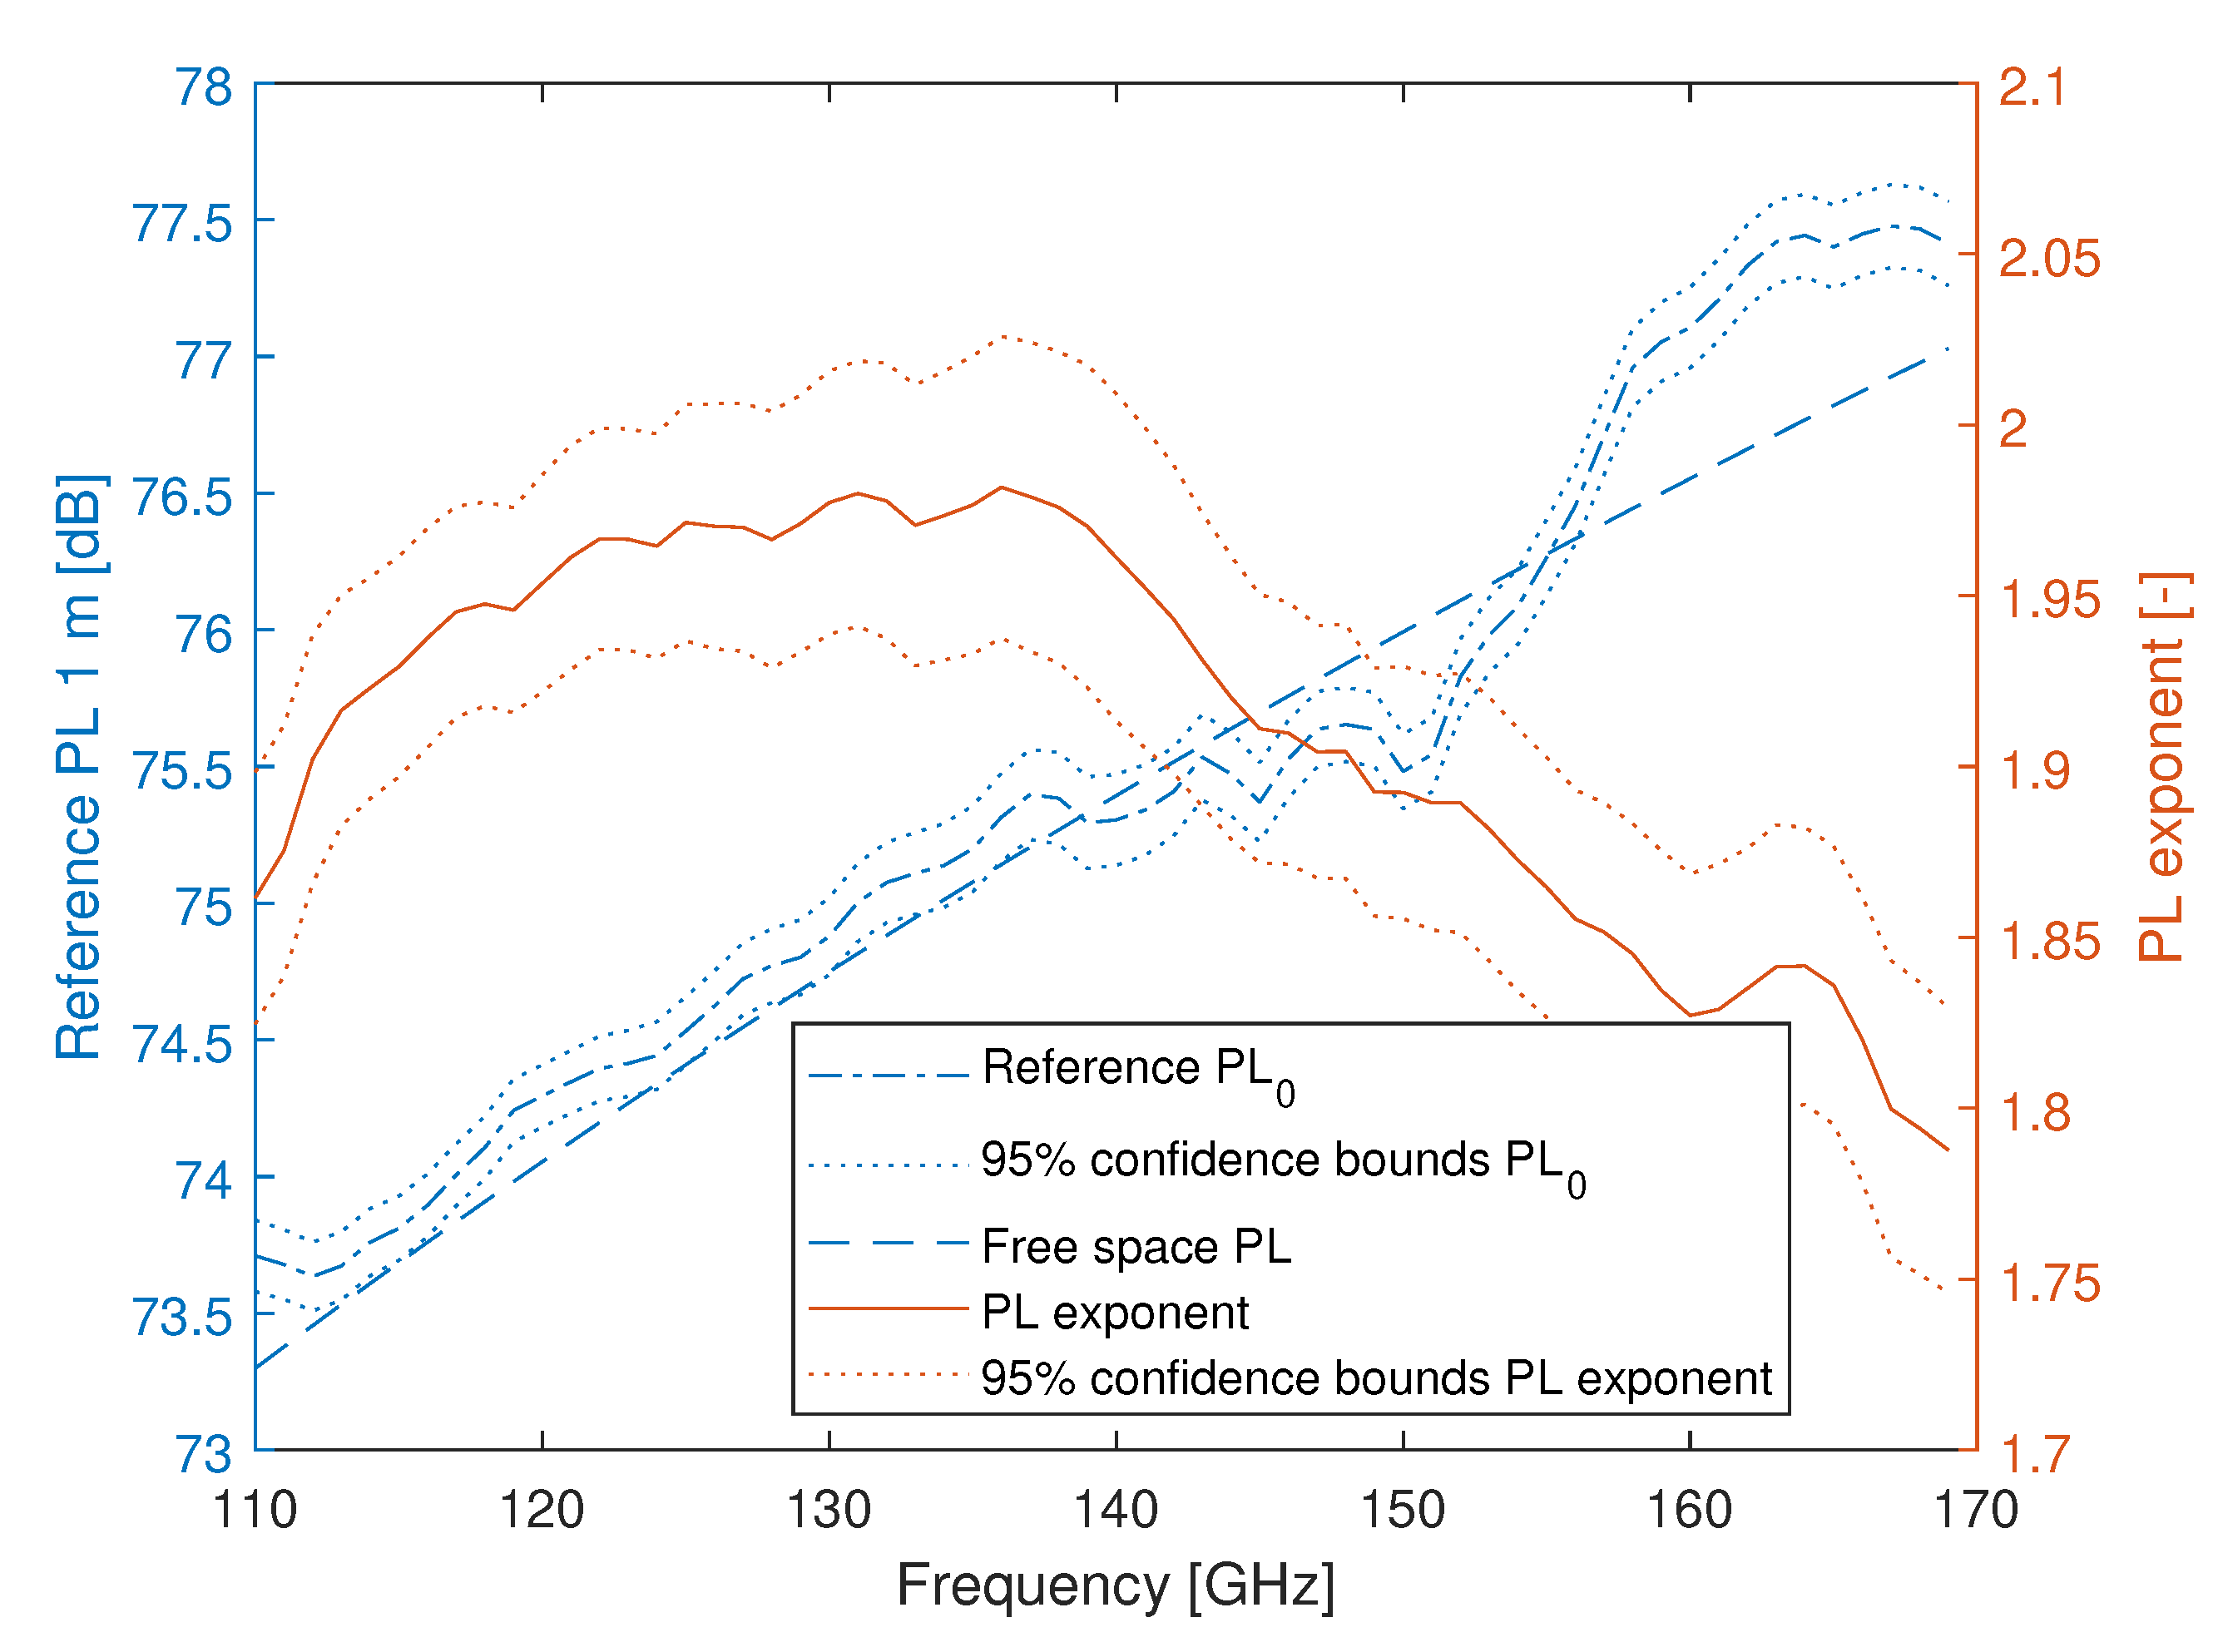
3.1. Line-of-Sight Path Loss Model

The FI model parameters as a function of frequency are visualized in Figure 7, with an indication of the 95% confidence interval (CI) for both regression parameters. The mean and median of the root mean squared error (RMSE) between measurement samples and the fitted model, over the full band, is 0.32 dB and the coefficient of determination R2 is above 0.995 for every 1 GHz subband. p-values for both regression parameters are below 10 3 for all frequencies. The reference PL is on average 0.3 dB higher than the calculated FSPL, whereas the PL exponent n is just below the FSPL exponent of 2. This is in line with the findings from Xing et al. that a fitted close-in PL model agrees well with a FSPL model [11].
Fitting the measured PL samples to the ABG model from (2) results in an intercept value α of 34.2 dB with 95% CI [33.3, 35.0] dB, a PL exponent β of 1.91 with CI [1.90, 1.92], and a frequency dependence γ of 1.93, with CI [1.89, 1.97]. The RMSE between measurement samples and fitted model is 0.53 dB and the coefficient of determination R2 of the fit is 0.99. This is in line with the conclusion from Cheng et al. [15] that the multi-frequency ABG model has a lower accuracy, and a higher standard deviation, compared to single-frequency models such as the FI model. However, the accuracy of the ABG model is good enough and its simplicity is an advantage.

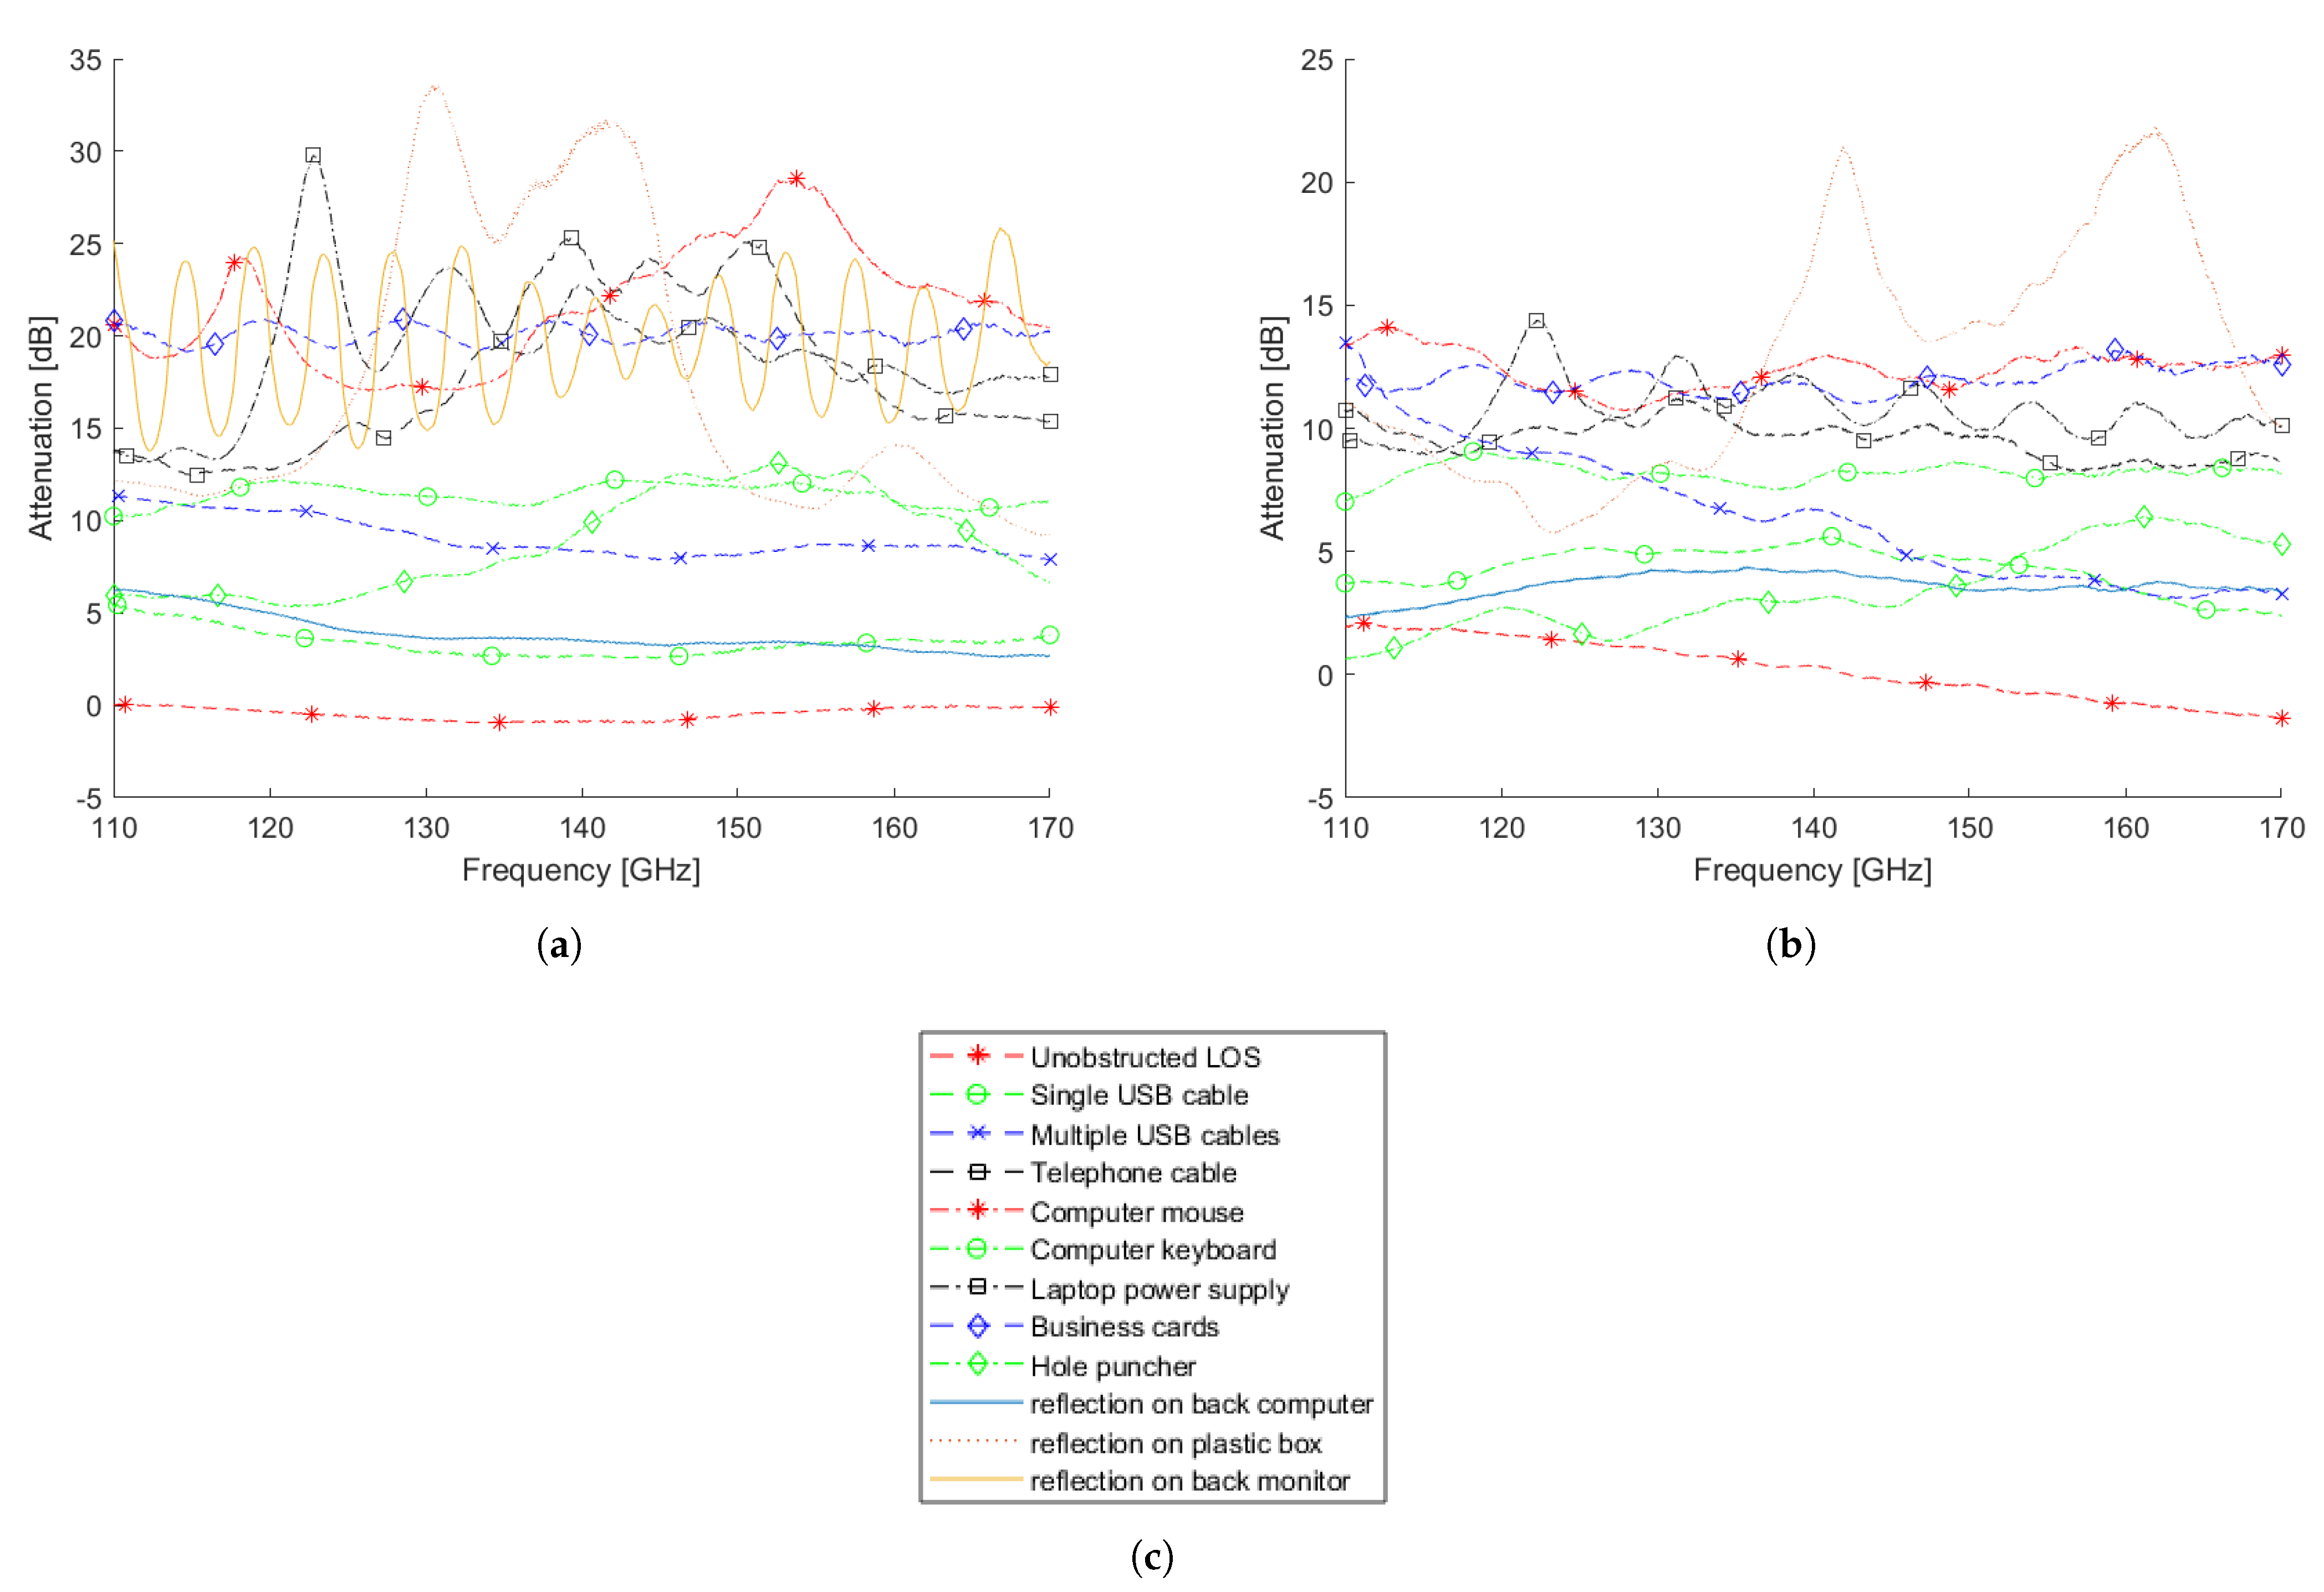
3.2. Object Attenuation

The attenuation values, averaged over 10 GHz subbands, of the different objects for the two measurements distances between the antennas, are listed in Table 1. Figure 8 shows the attenuation of different objects as a function of frequency. Attenuation due to a single USB cable obstructing the LOS path ranges from 3 to 5 dB. When multiple USB cables are obstructing the LOS path, the attenuation increases to 4 to 12 dB, and, for the coiled telephone cable, the attenuation further increases to 10 to 24 dB.
For most objects, especially the keyboard, mouse, power supply and business cards stack, the measured attenuation is clearly lower for a higher distance between the antennas. When the antennas are spaced 50 cm apart, the attenuation due to a computer mouse obstructing the LOS path is 13 dB, but this attenuation increases to 20 dB when the antennas are moved closer. For a keyboard obstructing the LOS path, there is 3 dB more attenuation when the antennas are spaced 20 cm apart, compared to measurements with a distance of 50 cm between the antennas showing an attenuation of 8 dB. For the business cards stack, the difference in attenuation between the two distances is 8 dB. This can be explained as follows. The Fresnel radius increases from 1 cm at 20 cm to 1.6 cm at 50 cm for midband frequency 140 GHz, and the object height, which is not exactly the center of the aperture, causes a larger blockage for the lower distance. Furthermore, diffraction angles increase when the antennas are closer to each other, resulting in a higher diffraction loss. For the laptop power supply and stack of business cards, there is a periodic pattern corresponding to a knife-edge diffraction model with negative incident angles.
In addition, Table 1 and Figure 8 show the added attenuation of the reflected path compared to the unobstructed LOS path for different reflecting surfaces, i.e., the metallic back of a desktop PC, the curved back of a desktop monitor, and the plastic box from Figure 5a. The back of the desktop PC, with an added attenuation of about 5 dB, clearly provides an excellent fall-back path compared to the obstructed LOS path. This corresponds to the reflection measurements using an aluminum plate, resulting in an added attenuation of 3 dB [12]. With attenuations in between 10 and 25 dB, the plastic box and screen monitor provide usable fall-back paths when the LOS path would be completely blocked. The larger attenuation for a distance of 20 cm compared to a distance of 50 cm is caused by the smaller incident angle, resulting in a larger reflection loss, and a larger relative path length difference between the LOS and NLOS paths.
Figure 9 presents the PDP for a USB cable obstructing the LOS path. The main peak at 0.9 ns corresponds to the obstructed LOS path, given the path length of 20 cm. There is a second peak at 3.5 ns which corresponds to a round-trip reflection on the measurement equipment with an additional attenuation of 18.5 dB. For objects with a higher attenuation, such as the computer mouse, the second peak is even more attenuated.
In conclusion, attenuation values ranging from 5 dB for a single USB cable up to 25 dB for a laptop power supply need to be taken into account for D-band link budget calculations. There is no linear relationship with frequency, but there is a variation in attenuation over the full D-band of 5 dB for a computer mouse and up to 15 dB for a laptop power supply. The variation of path loss over the full band is also seen in the obstructed LOS measurements performed by Kim et al. [12].

3.3. Computer Monitor Obstruction

Next, for desk object obstructions, we measured monitor obstruction with different monitor heights, adjusted in steps of 1 cm. Figure 10 shows the attenuation, compared to FSPL at 140 GHz, as a function of monitor position, for the measurements with the vertically polarized antennas at the same height (at desk 2), as well as the measurements with the antennas at different heights, but pointing towards each other (at desk 1). For the latter, we measured both vertical and horizontal co-polarized path loss. When the top of the monitor is clearly below the LOS path between TX and RX antennas, the measured PL equals FSPL. With increasing monitor height, the attenuation increases up to a constant value of 24 dB.
The monitor position at which the attenuation starts to increase depends on the measurement setup, but the measurement results from Figure 10 do not correspond to a diffraction model, as propagation through the display will also contribute to the received power. This explains why the attenuation values flatten at around 24 dB for increasing screen height for the different setups. However, the diffracted and (obstructed) direct paths cannot be resolved in the time domain. The time resolution of 0.0167 ns allows resolution of multipath components (MPCs) with a path difference of 0.5 cm, whereas, based on the geometry of the measurement setup, the diffracted path is only 0.4 cm longer than the direct path. The delay difference between the obstructed LOS and diffracted paths further decreases due to the higher dielectric permittivities of the materials used in the monitor, causing a larger delay of the obstructed LOS path. Indeed, relative permittivity for glass goes up to 3.8 at frequencies ranging from 70 to 120 GHz [20]; for liquid crystal polymers, the permittivity is found to be above 3 for mmWave and D-band frequencies [21,22,23].
Investigation of the PDPs shows that MPCs can be resolved for the horizontal co-polarized measurement setup. For positions 1 to 25 of the horizontally polarized measurements, the PDP has one single peak with power −34.5 dBm at a delay of 4.67 ns, which corresponds to a path length of 1.27 m and an antenna group delay of 0.433 ns. Starting at position 25, the power of the peak at 4.67 ns decreases due to the obstructed LOS, but a second peak appears with power −68.2 dBm at delay 5.25 ns. For subsequent positions, the power and delay of the second peak remains constant, whereas the power of the first peak decreases. As an example, Figure 11 shows the PDP for the horizontally polarized antenna measurement at monitor position 27. The second peak corresponds to a reflected path on the desk which is obstructed for the lower monitor positions. This is confirmed by a calculation of the path length of the reflected path. The reflected path length of 1.45 m results in an additional delay of 0.6 ns, which corresponds to the delay between the two peaks. Even though Figure 10 shows no distinct difference between the horizontal and vertical co-polarized attenuation measurements, this reflected component is not apparent for the vertically polarized setups. This is caused by the smaller E-plane HPBW compared to the antennas’ H-plane HPBW, i.e., for a vertical co-polarized setup, the beam is narrower in the vertical plane.
In order to assess whether a reflected NLOS path provides a valid alternative in case the LOS path is fully blocked, we measured path loss for NLOS paths using reflection on the wall or a nearby desk computer or monitor. Figure 12 shows the attenuation, compared to FSPL, using the monitor and desktop reflection at desk 1 and using the wall and monitor reflection at desk 2. The additional attenuation of the reflected path on a nearby monitor is limited to 3 dB, due to the limited additional path length, 2.45 m of the NLOS path compared to LOS distance 2.24 m, and the large incidence angle of 66° which results in a low reflection loss. A much higher attenuation is measured for the wall reflection, where the longer path length results in an added 4 dB PL and the reflection loss of drywall with an incident angle of 38° results in an added attenuation of about 7.5 dB [16]. Reflection on a desktop computer results in an added attenuation of 5 dB, with a path length of 1.27 m for the direct path and 1.50 m for the reflected path. This is in line with the reflected NLOS measurement for the desk object measurement setup from Section 3.2. The horizontal co-polarized reflection measurement on a nearby screen, with a reflected path length of 1.5 m compared to the LOS path of 1.27 m, results in an added attenuation of 7.5 dB.

Plant Attenuation

The vegetation loss values for the different intersect locations and plant types are listed in Table 2. When only the tip of plant # 1 is obstructing the LOS path, the vegetation loss is already up to 5 dB. This attenuation increases up to 20 dB when the plant is placed higher and the LOS path gets more obstructed. Plant # 2 is less dense and has a vegetation loss between 4 and 14 dB. If the plant is placed higher, and therefore obstructs the LOS path even more, the attenuation increases up to 25 dB. A similar loss is found for the crown of plant # 3. When this plant is placed higher, the diffraction around the plant’s trunk results in an oscillating pattern between 10 and 18 dB.
We conclude that attenuation, in addition to FSPL, goes up to 5 dB for a plant slightly obstructing the LOS path. When the plant blocks the LOS path, the attenuation increases up to 14 dB for light foliage, up to 20 dB for medium foliage and up to 25 dB for dense foliage.

4. Conclusions

This paper presents a D-band measurement campaign in an office environment, characterizing LOS, obstructed LOS, and reflected NLOS paths. The LOS measurements confirm the analysis of previous research, i.e., LOS PL is close to an FSPL model. Both a single-frequency FI model and multi-frequency ABG model are a good fit. For a data kiosk application, with a small distance between the antennas, we considered the effect of LOS obstruction due to typical desk objects such as cables and computer input devices. Attenuation values range from 3 dB up to 25 dB. For the same object and antenna heights, the attenuation increases with decreasing distance between the antennas. The reflected NLOS path via a desktop computer enclosure offers a fallback path with an added PL of 5 dB compared to the LOS path, whereas reflection on a plastic box results in an additional PL of 10 to 30 dB for distances of 50 and 20 cm, respectively. A monitor obstructing the LOS path results in an attenuation up to 24 dB. The attenuation highly depends on the exact screen height, as a 1 cm height increase results in up to 5 dB added attenuation. Depending on the antenna beamwidth, reflections on the desk are captured. Attenuation due to plant obstructions range from 5 dB for a light obstruction to up to 25 dB for dense foliage. First-order reflections provide a fallback path, with additional attenuation of 3 to 5 dB on a nearby reflector with large incident angle, and up to 10 dB for reflection on a wall, with a smaller incident angle.
Future work includes the implementation of the channel model and attenuation values in a ray-tracer solution which can be used to predict the wireless link quality of high capacity links.

Author Contributions

Conceptualization, B.D.B. and C.D.; methodology, B.D.B.; formal analysis, B.D.B. and E.T.; investigation, B.D.B.; resources, A.B.; writing—original draft preparation, B.D.B.; writing—review and editing, W.J., E.T., D.P. and C.D.; visualization, B.D.B.; supervision, W.J.; project administration, W.J.; funding acquisition, W.J. All authors have read and agreed to the published version of the manuscript.

Funding

This research received no external funding.

Acknowledgments

This work was executed within the imec AAA D-band channel modeling research project (D-BARC) and EOS project multi-service wireless network (MUSE-WINET). D-BARC received support from Flanders Innovation and Entrepreneurship.

Conflicts of Interest

The authors declare no conflict of interest.

Abbreviations

The following abbreviations are used in this manuscript:
5GFifth Generation mobile network
ABGAlpha-Beta-Gamma model
CIConfidence Interval
FIFloating-Intercept model
HHHorizontal co-polarized
HPBWHalf-Power Beamwidth
IDFTInverse Discrete Fourier Transform
LOSLine-of-Sight
MDPIMultidisciplinary Digital Publishing Institute
MPCMultipath Component
NLOSnon-Line-of-Sight
PCPersonal Computer
PDPPower Delay Profile
PLPath Loss
RMSERoot Mean Squared Error
RXReceiving Antenna
SSFSmall Scale Fading
TXTransmit Antenna
USBUniversal Serial Bus
VNAVector Network Analyzer
VVVertical Co-polarized

References

  1. Niu, Y.; Li, Y.; Jin, D.; Su, L.; Vasilakos, A.V. A survey of millimeter wave communications (mmWave) for 5G: Opportunities and challenges. Wirel. Netw. 2015, 21, 2657–2676. [Google Scholar] [CrossRef]
  2. Rappaport, T.S.; Xing, Y.; MacCartney, G.R.; Molisch, A.F.; Mellios, E.; Zhang, J. Overview of Millimeter Wave Communications for Fifth-Generation (5G) Wireless Networks—With a Focus on Propagation Models. IEEE Trans. Antennas Propag. 2017, 65, 6213–6230. [Google Scholar] [CrossRef]
  3. Isa, A.K.M.; Nix, A.; Hilton, G. Impact of diffraction and attenuation for material characterisation in millimetre wave bands. In Proceedings of the 2015 Loughborough Antennas Propagation Conference (LAPC), Loughborough, UK, 2–3 November 2015; pp. 1–4. [Google Scholar] [CrossRef]
  4. Ryan, J.; MacCartney, G.R.; Rappaport, T.S. Indoor office wideband penetration loss measurements at 73 GHz. In Proceedings of the 2017 IEEE International Conference on Communications Workshops (ICC Workshops), Paris, France, 21–25 May 2017; pp. 228–233. [Google Scholar] [CrossRef] [Green Version]
  5. MacCartney, G.R.; Rappaport, T.S.; Sun, S.; Deng, S. Indoor Office Wideband Millimeter-Wave Propagation Measurements and Channel Models at 28 and 73 GHz for Ultra-Dense 5G Wireless Networks. IEEE Access 2015, 3, 2388–2424. [Google Scholar] [CrossRef]
  6. Wu, X.; Wang, C.; Sun, J.; Huang, J.; Feng, R.; Yang, Y.; Ge, X. 60-GHz Millimeter-Wave Channel Measurements and Modeling for Indoor Office Environments. IEEE Trans. Antennas Propag. 2017, 65, 1912–1924. [Google Scholar] [CrossRef]
  7. Liu, P.; Blumenstein, J.; Perović, N.S.; Di Renzo, M.; Springer, A. Performance of Generalized Spatial Modulation MIMO Over Measured 60GHz Indoor Channels. IEEE Trans. Commun. 2018, 66, 133–148. [Google Scholar] [CrossRef]
  8. Ling, C.; Yin, X.; Müller, R.; Häfner, S.; Dupleich, D.; Schneider, C.; Luo, J.; Yan, H.; Thomä, R. Double-Directional Dual-Polarimetric Cluster-Based Characterization of 70–77 GHz Indoor Channels. IEEE Trans. Antennas Propag. 2018, 66, 857–870. [Google Scholar] [CrossRef]
  9. Senic, J.; Gentile, C.; Papazian, P.B.; Remley, K.A.; Choi, J.K. Analysis of E-Band Path Loss and Propagation Mechanisms in the Indoor Environment. IEEE Trans. Antennas Propag. 2017, 65, 6562–6573. [Google Scholar] [CrossRef] [PubMed]
  10. Rappaport, T.; Xing, Y.; Kanhere, O.; Ju, S.; Madanayake, A.; Mandal, S.; Alkhateeb, A.; Trichopoulos, G. Wireless communications and applications above 100 GHz: Opportunities and challenges for 6G and beyond. IEEE Access 2019, 7, 78729–78757. [Google Scholar] [CrossRef]
  11. Xing, Y.; Rappaport, T.S. Propagation Measurement System and Approach at 140 GHz-Moving to 6G and Above 100 GHz. In Proceedings of the 2018 IEEE Global Communications Conference (GLOBECOM), Abu Dhabi, United Arab Emirates, 9–13 December 2018; pp. 1–6. [Google Scholar]
  12. Kim, S.; Khan, W.T.; Zajić, A.; Papapolymerou, J. D-Band Channel Measurements and Characterization for Indoor Applications. IEEE Trans. Antennas Propag. 2015, 63, 3198–3207. [Google Scholar] [CrossRef]
  13. Nguyen, S.L.H.; Järveläinen, J.; Karttunen, A.; Haneda, K.; Putkonen, J. Comparing radio propagation channels between 28 and 140 GHz bands in a shopping mall. In Proceedings of the 12th European Conference on Antennas and Propagation (EuCAP 2018), London, UK, 8–13 April 2018; pp. 1–5. [Google Scholar]
  14. Pometcu, L.; D’Errico, R. Channel Model Characteristics in D-Band for NLOS Indoor Scenarios. In Proceedings of the 2019 13th European Conference on Antennas and Propagation (EuCAP 2019), Krakow, Poland, 30 March–5 April 2019; pp. 1–4. [Google Scholar]
  15. Cheng, C.; Kim, S.; Zajić, A. Comparison of path loss models for indoor 30 GHz, 140 GHz, and 300 GHz channels. In Proceedings of the 2017 11th European Conference on Antennas and Propagation (EUCAP 2017), Paris, France, 19–24 March 2017; pp. 716–720. [Google Scholar]
  16. Xing, Y.; Kanhere, O.; Ju, S.; Rappaport, T. Indoor Wireless Channel Properties at Millimeter Wave and Sub-Terahertz Frequencies. In Proceedings of the 2019 IEEE Global Communications Conference (GLOBECOM), Waikoloa, HI, USA, 9–13 December 2019; pp. 1–6. [Google Scholar] [CrossRef] [Green Version]
  17. Olsson, B.E.; Larsson, C.; Johansson, M.N.; Nguyen, S.L.H. Radio Propagation in an Office Environment at 140 GHz and 28 GHz. In Proceedings of the 2021 15th European Conference on Antennas and Propagation (EuCAP 2021), Dusseldorf, Germany, 22–26 March 2021; pp. 1–5. [Google Scholar] [CrossRef]
  18. ITU-R-P.1238-10. Propagation Data and Prediction Methods for the Planning of Indoor Radiocommunication Systems and Radio Local Area Networks in the Frequency Range 300 MHz to 450 GHz; Technical Report; 2019; Available online: https://www.itu.int/rec/R-REC-P.1238 (accessed on 12 July 2021).
  19. De Beelde, B.; Plets, D.; Tanghe, E.; Joseph, W. Directional Sub-THz Antenna-Channel Modeling for Indoor Scenarios. In Proceedings of the 2021 15th European Conference on Antennas and Propagation (EuCAP 2021), Dusseldorf, Germany, 22–26 March 2021; pp. 1–4. [Google Scholar]
  20. Chen, S.; Nguyen, K.N.; Afsar, M.N. Complex Dielectric Permittivity Measurements of Glasses at Millimeter Waves and Terahertz Frequencies. In Proceedings of the 2006 European Microwave Conference, Manchester, UK, 10–15 September 2006; pp. 384–387. [Google Scholar] [CrossRef]
  21. Thompson, D.; Tantot, O.; Jallageas, H.; Ponchak, G.; Tentzeris, M.; Papapolymerou, J. Characterization of liquid crystal polymer (LCP) material and transmission lines on LCP substrates from 30 to 110 GHz. IEEE Trans. Microw. Theory Tech. 2004, 52, 1343–1352. [Google Scholar] [CrossRef] [Green Version]
  22. Khan, W.T.; Donado Morcillo, C.A.; Ulusoy, A.C.; Papapolymerou, J. Characterization of liquid crystal polymer from 110 GHz to 170 GHz. In Proceedings of the 2014 IEEE Radio and Wireless Symposium (RWS), Newport Beach, CA, USA, 19–23 January 2014; pp. 157–159. [Google Scholar] [CrossRef]
  23. Ji, Y.; Bai, Y.; Liu, X.; Jia, K. Progress of liquid crystal polyester (LCP) for 5G application. Adv. Ind. Eng. Polym. Res. 2020, 3, 160–174. [Google Scholar] [CrossRef]
Figure 1. Overview of the different measurements performed in an office environment.
Electronics 10 01725 g001
Figure 2. Line-of-Sight measurement tracks in office environment. (a) Track 1 with a distance of 2 m; (b) Track 2 with a distance of 2.9 m.
Electronics 10 01725 g002
Figure 3. Measurement setup of attenuation due to desk objects obstructing the Line-of-Sight path. (a) Multiple universal serial bus (USB) cables, d = 20 cm; (b) computer keyboard, d = 50 cm.
Electronics 10 01725 g003
Figure 4. Computer monitor obstructing the Line-of-Sight path. (a) Horizontal placement of transmit and receive antennas with distance 2.24 m; (b) transmit and receive antennas at different heights with a distance of 1.27 m.
Electronics 10 01725 g004
Figure 5. Reflected non Line-of-Sight path. (a) reflected path via plastic box for desk clutter obstructed measurements at desk 1; (b) reflected path via nearby monitor for monitor obstruction at desk 2.
Electronics 10 01725 g005
Figure 6. Picture of the different plants we considered for plant attenuation measurements with an indication of the intersect locations, categorized from light (A) to dense (C) obstruction. (a) Plant # 1; (b) Plant # 2; (c) Plant # 3.
Electronics 10 01725 g006
Figure 7. Line-of-Sight Floating Intercept path loss model parameters as a function of frequency.
Electronics 10 01725 g007
Figure 8. Attenuation due to desk objects obstructing the Line-of-Sight path and attenuation of the reflected non-Line-of-Sight path using reflection on a plastic box and the back of a desktop computer and monitor. (a) Distance 20 cm; (b) distance 50 cm; (c) legend.
Electronics 10 01725 g008
Figure 9. Power delay profile of a universal serial bus cable obstructing the Line-of-Sight path between two antennas spaced 20 cm, with a first peak corresponding to the obstructed Line-of-Sight path, and a second peak corresponding to a round-trip reflection on the measurement equipment.
Electronics 10 01725 g009
Figure 10. Attenuation as a function of monitor position at 140 GHz for vertical (VV) and horizontal (HH) co-polarizations when the Line-of-Sight path is obstructed due to a monitor screen. The start position is the lowest possible screen position. For subsequent positions, the height is increased in 1 cm steps. The antennas are placed at a different height at desk 1 (VV and HH) and placed at the same height at desk 2 (VV). For the VV measurement at desk 1, the monitor starts obstructing the Line-of-Sight path at position 11; for the HH measurement at desk 1, the obstruction starts at position 24.
Electronics 10 01725 g010
Figure 11. Power delay profile of a horizontal co-polarized measurement with antennas at different height, and a monitor obstructing the Line-of-Sight path.
Electronics 10 01725 g011
Figure 12. Attenuation when using the reflected path for vertically co-polarized (VV) and horizontally co-polarized (HH) setups at desks 1 (with antennas at different heights) and 2 (with antennas at the same height).
Electronics 10 01725 g012
Table 1. Attenuation in dB due to desk objects obstructing the Line-of-Sight path and of reflected non Line-of-Sight path, averaged over 10 GHz subbands, for distances 20 cm (left) and 50 cm (right), with ‘-’ for missing measurement data.
Object115 GHz125 GHz135 GHz145 GHz155 GHz165 GHz
Single USB cable4.73.83.44.92.75.12.75.03.34.33.52.8
Multiple USB cables10.910.710.08.78.66.88.15.48.53.98.43.3
Telephone cable13.09.714.410.020.610.323.29.820.48.915.68.6
Computer mouse20.913.518.011.318.811.923.712.226.412.821.912.6
Computer keyboard11.08.311.88.411.17.812.08.311.78.210.88.3
Power supply14.19.522.511.921.311.920.710.918.610.217.510.3
Business cards20.012.020.211.920.111.620.111.620.112.320.112.6
Hole puncher5.91.65.92.07.82.811.63.212.55.19.05.9
Reflection desktop6.12.55.43.04.53.63.84.03.64.23.64.2
Reflection plastic box11.910.211.88.213.56.523.37.329.28.628.313.3
Reflection monitor19.8-19.6-19.1-18.6-19.0-19.3-
Table 2. Attenuation in dB for different plant types obstructing the Line-of-Sight path at different intersect locations, categorized from light to dense obstruction, with ’-’ for missing measurement data.
Intersect LocationPlant # 1Plant # 2Plant # 3
A (light)50-
B (medium)10–204–1410–18
C (dense)-16–2520–25
Publisher’s Note: MDPI stays neutral with regard to jurisdictional claims in published maps and institutional affiliations.

