
Content Dependent Representation Selection Model for Systems Based on MPEG DASH

Department of Communications, Faculty of Electrical Engineering, Computer Science and Information Technology Osijek, Josip Juraj Strossmayer University of Osijek, Kneza Trpimira 2b, 31000 Osijek, Croatia
*
Author to whom correspondence should be addressed.
Electronics 2021, 10(15), 1843; https://0-doi-org.brum.beds.ac.uk/10.3390/electronics10151843
Submission received: 6 May 2021
/
Revised: 24 July 2021
/
Accepted: 27 July 2021
/
Published: 31 July 2021
(This article belongs to the Special Issue Immersive Quality of Experience Management and Evaluation)
Abstract
:A standard called MPEG Dynamic Adaptive Streaming over HTTP (MPEG DASH) ensures the interoperability between different streaming services and the highest possible video quality in changing network conditions. The solutions described in the available literature that focus on video segmentation are mostly proprietary, use a high amount of computational power, lack the methodology, model notation, information needed for reproduction, or do not consider the spatial and temporal activity of video sequences. This paper presents a new model for selecting optimal parameters and number of representations for video encoding and segmentation, based on a measure of the spatial and temporal activity of the video content. The model was developed for the H.264 encoder, using Structural Similarity Index Measure (SSIM) objective metrics as well as Spatial Information (SI) and Temporal Information (TI) as measures of video spatial and temporal activity. The methodology that we used to develop the mathematical model is also presented in detail so that it can be applied to adapt the mathematical model to another type of an encoder or a set of encoding parameters. The efficiency of the segmentation made by the proposed model was tested using the Basic Adaptation algorithm (BAA) and Segment Aware Rate Adaptation (SARA) algorithm as well as two different network scenarios. In comparison to the segmentation available in the relevant literature, the segmentation based on the proposed model obtains better SSIM values in 92% of cases and subjective testing showed that it achieves better results in 83.3% of cases.
1. Introduction
The development of the Internet, as well as hardware that supports novel Internet technologies, created the increased need for network and bandwidth resources. To fulfill the user’s needs for streaming services at home as well as on the go, and taking into account different devices and their capabilities, several solutions based on Hypertext Transfer Protocol (HTTP) were developed. In adaptive bitrate (ABR) streaming solutions like Microsoft Smooth Streaming, Apple HTTP Adaptive Streaming, and Adobe HTTP Dynamic Streaming, user devices had to support a proprietary client protocol. Furthermore, these solutions were not interoperable since they used different formats of segments and manifest files [1].
MPEG Dynamic Adaptive Streaming over Hypertext Transfer Protocol (MPEG DASH) was developed in order to simplify the application maintenance, reduce development costs, and ensure interoperability. Every system developed in compliance with MPEG DASH provides smooth playback due to an adaptation algorithm that selects appropriate video segments encoded with different spatial resolutions and target coding bitrates based on the client’s device characteristics and the state in a heterogeneous network [2]. The smooth playback is ensured by monitoring the available bandwidth and the rate at which the encoded content is downloaded. To prevent the buffer underflow and stalling events in case of network bandwidth decrease, the client application can select the appropriate video segments with lower quality. The client can also select a stream with a higher target coding bitrate if the download rate is greater than the target coding bitrate of the current stream [3]. Adaptation logic in DASH systems aims to provide the highest possible Quality of Experience (QoE) by taking into account parameters like available bandwidth and buffer occupancy [4].
A client and server in DASH systems communicate using HTTP GET requests and operate over proxy and firewall servers [5]. Apart from adaptation logic, the client application consists of several modules like a player module, Media Presentation Description (MPD) parser module, segment acquisition and distribution module and the buffer (Figure 1). The server is used to store MPD files and segmented video sequences. MPEG DASH standard does not define parameters of the video segmentation and presentations, the communication between the server and the client and it does not define client behavior. MPEG DASH defines only the format of the segments and the MPD file. MPD is a manifest file that provides information about available adaptation and representation sets. It can be transported using HTTP, broadcast, e-mail, or other available communication channels.
After obtaining the MPD file, the client stores information about available adaptation and representation sets and the HTTP GET request for the initialization segment can be sent. The initialization segment is used to initialize the media decoder on the client side. Except for the initializing segment, all other segments consist of one group of pictures (GOP) and start with an I-frame, following by multiple P and B frames. When encoding, the GOP length value is set to a value corresponding to the product of the desired video segment duration and the video temporal resolution. In this way, video segments are made to be self-contained, so when the representation for the next video segment changes, the video playback can be continued without the need to download additional data. Each segment is described in the MPD file with an URL address, ID and duration (sometimes it also contains start time and segment size) [6,7]. As it can be seen in Figure 1, video segments are organized in representation and adaptation sets. There can be one or more adaptation sets stored on the server for a certain video sequence.
Adaptation sets can differ by spatial resolution or by type of the multimedia component (audio, subtitle). Within one adaptation set, there are usually multiple representation sets (10–20), which consist of video sequences encoded on different target bitrates and typically with lower spatial resolutions for lower bitrates. It should be noted that target coding bitrates can differ from the achieved values depending on the encoding parameters [1,7].
The duration of the video segments is usually a few seconds (most frequently, between 2 and 10 s). The choice of segment duration has an impact on QoE and depends on network conditions. Segments with shorter duration have shorter GOP and consequently smaller sizes, thus they can be downloaded faster (which results in faster buffer filling) and are more suitable for systems with sudden changes in network conditions and available bandwidth. Therefore, video segments that have short duration are better performance-wise when the buffer occupancy is low, especially in cases when there is low available bandwidth, considering that buffer underflow leads to stalling and cutoff events. On the other hand, the problem related to segments with a short duration is the increased number of HTTP signaling messages that can be reduced by requesting multiple segments with a single HTTP request. This solution is especially interesting for the application in live video streaming services where novel applications use segments shorter than one second [8,9,10].
Segments with longer durations have more problems when changes in network conditions are abrupt, as they need more time to complete the download and consequently to change the quality level in order to align with current network performance. However, in stable network conditions, longer segments perform better than shorter ones because they have a larger number of P and B frames; thus, they need a lower encoding bitrate to achieve the given video quality. It can be concluded that the choice of segment optimal duration depends on the network characteristics and although a dynamic change of the segment duration can improve the quality of video streaming, existing solutions use segments of the same and constant duration for all quality levels in order to avoid the increase of complexity [7,11].
The client side of MPEG DASH systems has been thoroughly investigated since the standard announcement but the server side has not yet been investigated enough, especially the coding and segmentation process. First solutions were based on fixed coding parameters and representation set parameters that were proven to be insufficient for video sequences with different spatial and temporal activity. Thus, representation sets with different parameters for each content genre were proposed [12]. Several available papers use these fixed representation set parameters mostly recommended by streaming providers [13,14]. In recent research, there are various solutions with parameters for representation sets being determined by multiple precoding of each video sequence [2,15].
Considering that most of the available solutions are proprietary, demand high computational power or do not consider the spatial and temporal activity of video sequences, there is room for improvement regarding the selection of optimal representation sets for MPEG DASH. In this article, a new model for selecting the parameters for representations that can be used in systems based on MPEG DASH is presented. The mathematical model is based on Spatial (SI) and Temporal Information (TI) of video sequences as measures of spatial and temporal video activity. The idea was to simplify the process for the selection of optimal representation sets taking into account the video content and to eliminate the need for multiple precoding. Furthermore, the methodology used to develop the mathematical model is presented in detail, so that it can be applied to adapt the model to any type of an encoder or a set of encoding parameters.
An overview of currently available research regarding the models and systems that can be used for selecting the parameters for representation sets is given in Section 2. The test setup, analysis of selected video content, video coding and conclusions from our research that precedes the model proposed in this paper are presented in Section 3. The methodology and the notation of the proposed model are given in Section 4. Section 5 presents model testing results acquired using the adaptive streaming algorithms, followed by a conclusion.
2. Related Work
In comparison to the client side of MPEG DASH systems, very few research that focus on video coding parameters, selection of optimal parameters for representation sets, and consequently, the development of databases with video sequences prepared for MPEG DASH are available.
The database presented in [12] is the most complete available database, but two of three videos do not include the initialization segment. References [16,17] consist of only one video sequence each. References [4,18] have only 3 and 4 videos longer than 20 s, respectively, and for testing QoE parameters like initial delay, stalling, number and depth of switching events, they should be at least 60–120 s long. All other available datasets do not provide videos segmented for MPEG DASH with the initialization segment and/or the corresponding MPD files. Moreover, none of these databases have additional information in the MPD such as the segment size needed for novel adaptation algorithms nor are the videos selected according to the content activity. And most importantly, there is no information about the selection process for parameters of representations used in coding the available datasets besides the [12] that specifies that the parameters for the representation sets are determined based on the Peak Signal-to-Noise Ratio (PSNR).
One of the solutions for the problem of selecting the optimal parameters for representation sets that considers the content is presented in [14,19]. The video content is in this solution categorized as cartoon, documentary, movie and sport, which does not give enough information about the spatial and temporal activity of video sequences. Integer Linear Program and Video Quality Metric are used to specify the optimal parameters for representation sets based on the network characteristics and QoE parameters. Considering that, at the time, there was only a recommendation for fixed parameters for representation sets defined by streaming providers, this solution outperformed them but at a cost of using a large amount of computational power. In addition, this solution, as well as [15], does not provide all information needed for reproducing results.
Several research focus on encoding complexity like [20]. In the proposed method, the parameters for representation sets are selected based on the content-encoding complexity and Video Multimethod Assessment Fusion (VMAF) values. The span of possible bitrates was determined by content-encoding complexity, while the number of representations was determined by a uniform distribution of bitrates based on VMAF values. Even though the proposed method considers encoding complexity, Ref. [20] does not list all parameters needed for results reproduction it does not give the notation of the presented model.
There are two solutions available in the literature that focus on obtaining the Rate-Quality (RQ) curves for each video sequence by precoding them [15,21]. Both solutions use PSNR to determine RQ curves after precoding video sequences with a set of spatial resolutions and target coding bitrates. In [15], a constraint optimization problem was used to determine the target coding bitrates while taking into account the available bandwidth and distributions of the client’s viewport size. The optimal parameters for representation sets were selected based on RQ curves. The solution proposed in [21] conducts a multi-pass encoding and measures the bitrate of every segment. The number of representations is selected so that adjacent representations are one Just Noticeable Difference (JDN) apart and that the increment in target coding bitrates is around 5%. Both solutions that use RQ curves require precoding for each video content that is segmented for streaming purposes, which consumes a large amount of computing power.
The model for selecting the optimal parameters for representation sets described in [22] focuses on Mean Squared Error and complexity–rate distortion attributes that occur in the bitrate control mechanism. Unfortunately, the estimation of the number of representations is not clearly presented.
There are also application-specific models like [23] that investigate the optimal parameters for representation sets for 3D scenes. An integer linear programming problem with a limited computational complexity is used to model the representation set. The proposed solution can determine an optimal set for most of 3D scenes while reducing the consumption of computational power.
Another interesting solution was proposed in [24]. It was developed for 360 VR (virtual reality) video sequences and uses multi-quality tiles, i.e., small rectangular segments of a video sequence. The authors assume that video sequences are precoded in a predefined set of representations that correspond to quality levels which were determined by considering the user’s quality requirements. Although multi-quality tile segmentation is proven to be efficient in 360 VR and is widely used for 360 VR (head-mounted devices), panoramic video sequences [25] and unmanned aerial vehicles [26], it is not applicable for mobile services and commonly used streaming systems, for example, the ones used by video streaming providers.
As can be seen from related work, most of the aforementioned solutions for selecting optimal parameters for representation sets use a lot of computational resources due to precoding and are proprietary or do not provide all parameters needed for reproduction. Initial research also do not take into account the content-encoding complexity. Moreover the available methods do not give the notation and needed information for determining the number of representations.
3. Test Setup
Considering that the spatial and temporal activity of video sequences have a great impact on the coding complexity, fourteen video sequences with distinguishing spatial (SI) and temporal (TI) information were selected from the databases [12,20] for experiments presented in this paper. Spatial and temporal information for these video sequences were calculated based on Equations (1) and (2) for the Y color component of original video sequences in YUV format.
The meantime in Equations (1) and (2) stands for time average, stdspace for the space standard deviation, Sobel represents the Sobel operator and Ft represents the t-th video frame in the observed video signal. SI and TI were determined according to expressions (1) and (2) as time averages and not as maximum values as defined in recommendations ITU-T P.910 [27]. Namely, the maximum values of these parameters can be much higher than the average values and can appear in a very short fraction of the video signal, which will not significantly affect the average quality of the encoded signal. Therefore, averaging these values over the entire video signal is a better choice for research related to adaptive video streaming.
SI and TI values, as well as SITI = SI·TI, for video sequences selected for developing a model for determining optimal representation sets, are given in Table 1. Video sequences were selected in order to cover a wide range of SI and TI values, as well as SITI as a joint measure of temporal and spatial activity. Big Buck Bunny (BBB) [28], Elephants Dream (ED) [29] and Tractor (TR) [29] video sequences were not used in the modeling process but were later used for the model testing.
In order to develop the content-aware model for the selection of optimal representation sets, we encoded the chosen video sequences on different bitrates and selected spatial resolutions. For testing purposes, the range of target coding bitrates 50 kbps to 8 Mbps was used as in [12], as well as spatial resolutions 240p, 360p, 480p, 720p, and 1080p. Original video sequences that are available in YUV or Y4M formats were scaled from 1080p spatial resolution to four lower spatial resolutions using the open-source program FFmpeg [30]. Each of the resulting video sequences were then encoded by H.264 codec at 32 target coding bitrates in the range of 50 kbps to 8 Mbps. Coding parameters are listed in Table 2. The coding process was explained in detail in [31].
After encoding, FFmpeg was used to scale all encoded video sequences to 1080p spatial resolution, the original spatial resolution of encoded video sequences in order to calculate Structural Similarity Index (SSIM) [32] values.
SSIM was selected to measure the quality of encoded video sequences due to the research presented in [33], where SSIM achieved the best correlation with Mean Opinion Score (MOS) values for encoded sequences with different spatial resolutions.
From the measurement results available in [33] it can be concluded that, for given coding parameters, SSIM outperforms PSNR, VMAF, Mean Sum of Differences, Visual Signal-to-Noise Ratio, Mean Sum of Absolute Differences and Mean Squared Error considering it realizes higher values of Pearson Linear Correlation Coefficient (PLCC) [34] when analyzing achieved MOS.
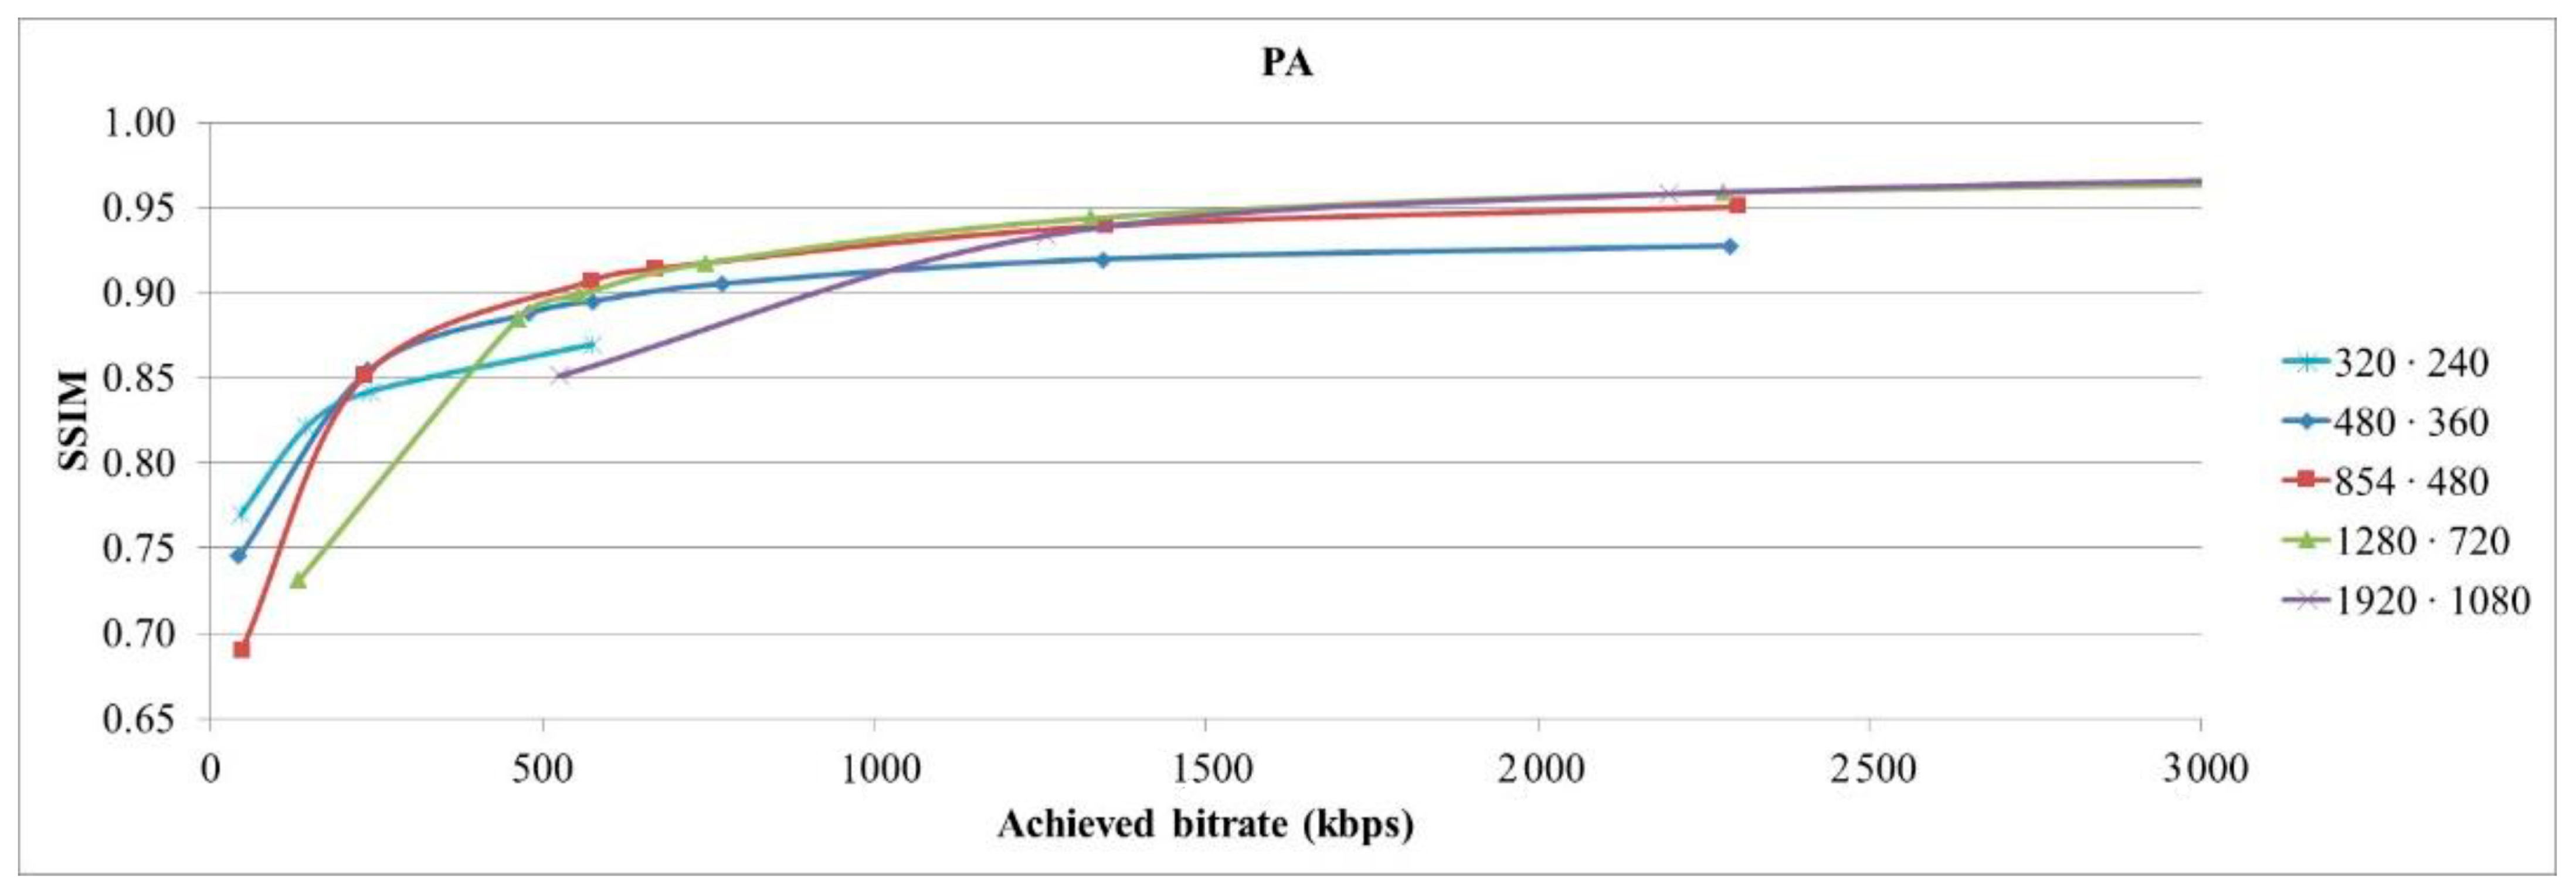
Based on calculated SSIM values, curves for every spatial resolution for each video sequence, depending on the achieved bitrate, were obtained. SSIM-achieved bitrate curves for PedestrianArea video sequence are depicted in Figure 2. It is given as an example of obtained curves for every spatial resolution.
Based on the obtained curves, a model for selecting optimal switching points to a higher spatial resolution was developed and presented in [35].
To improve the segmentation process even further, the model for selecting the optimal number of representations and bitrates while eliminating the need for precoding is proposed in this paper.
4. Representation Selection Model
4.1. Model Development
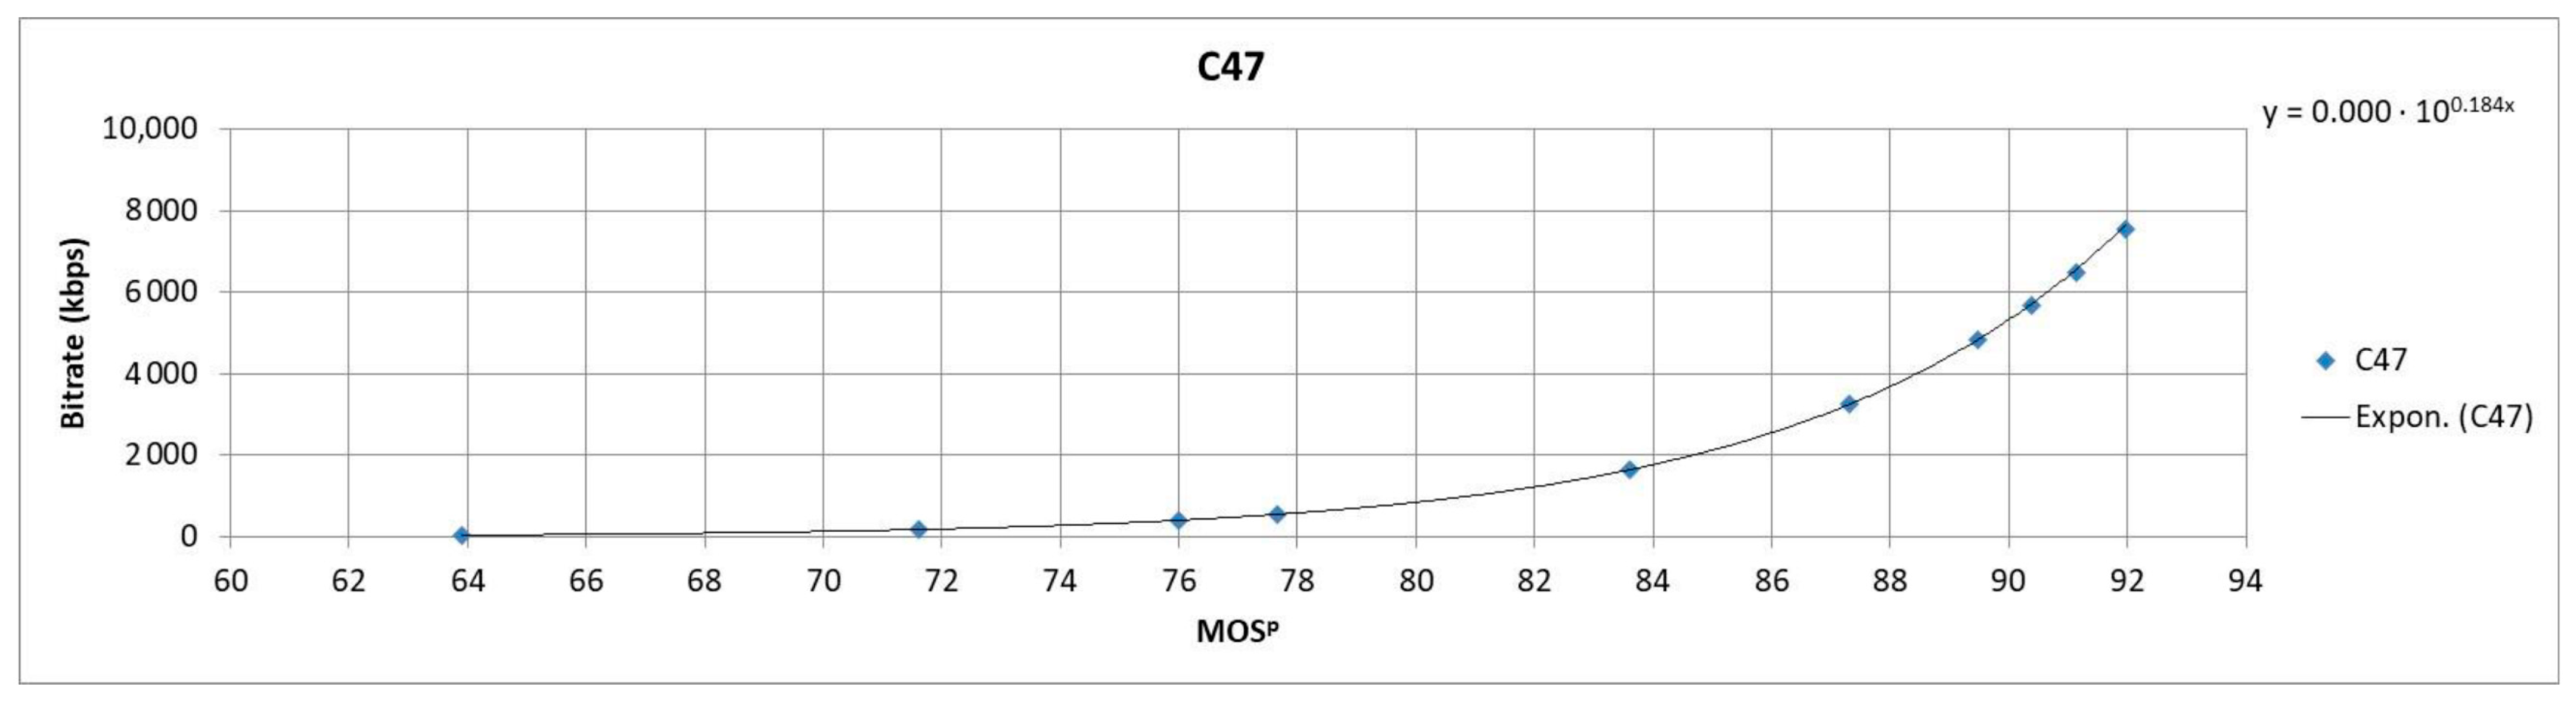
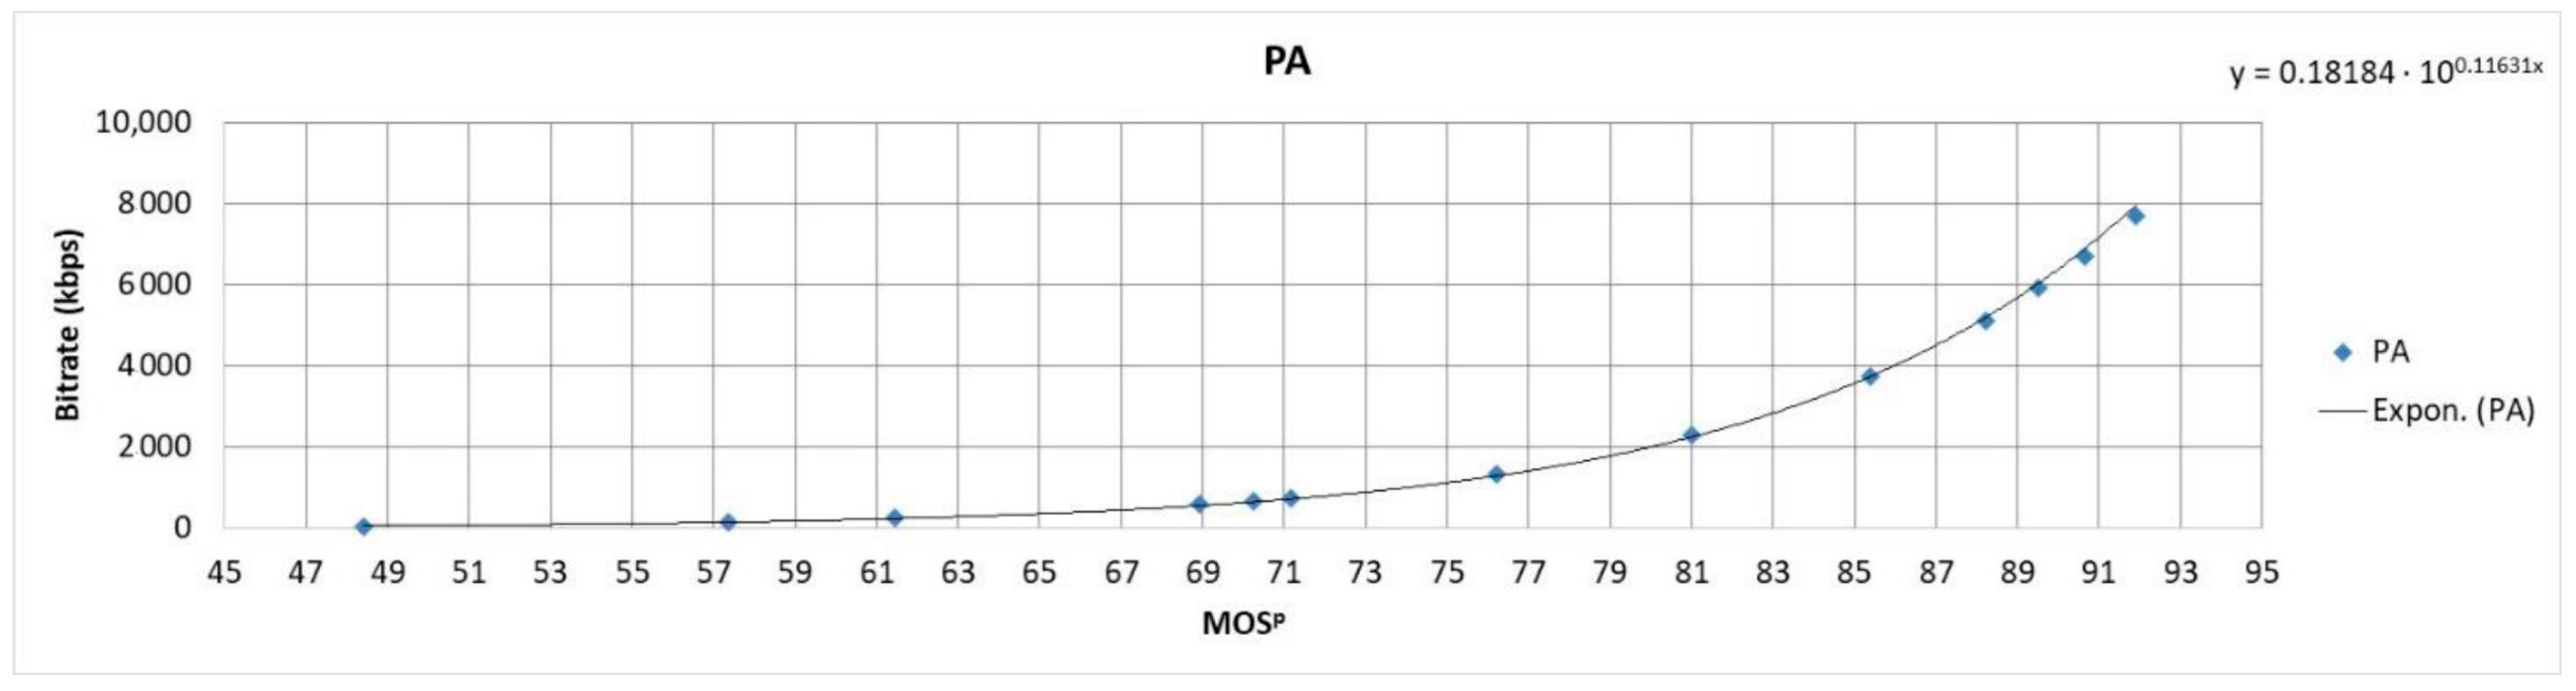
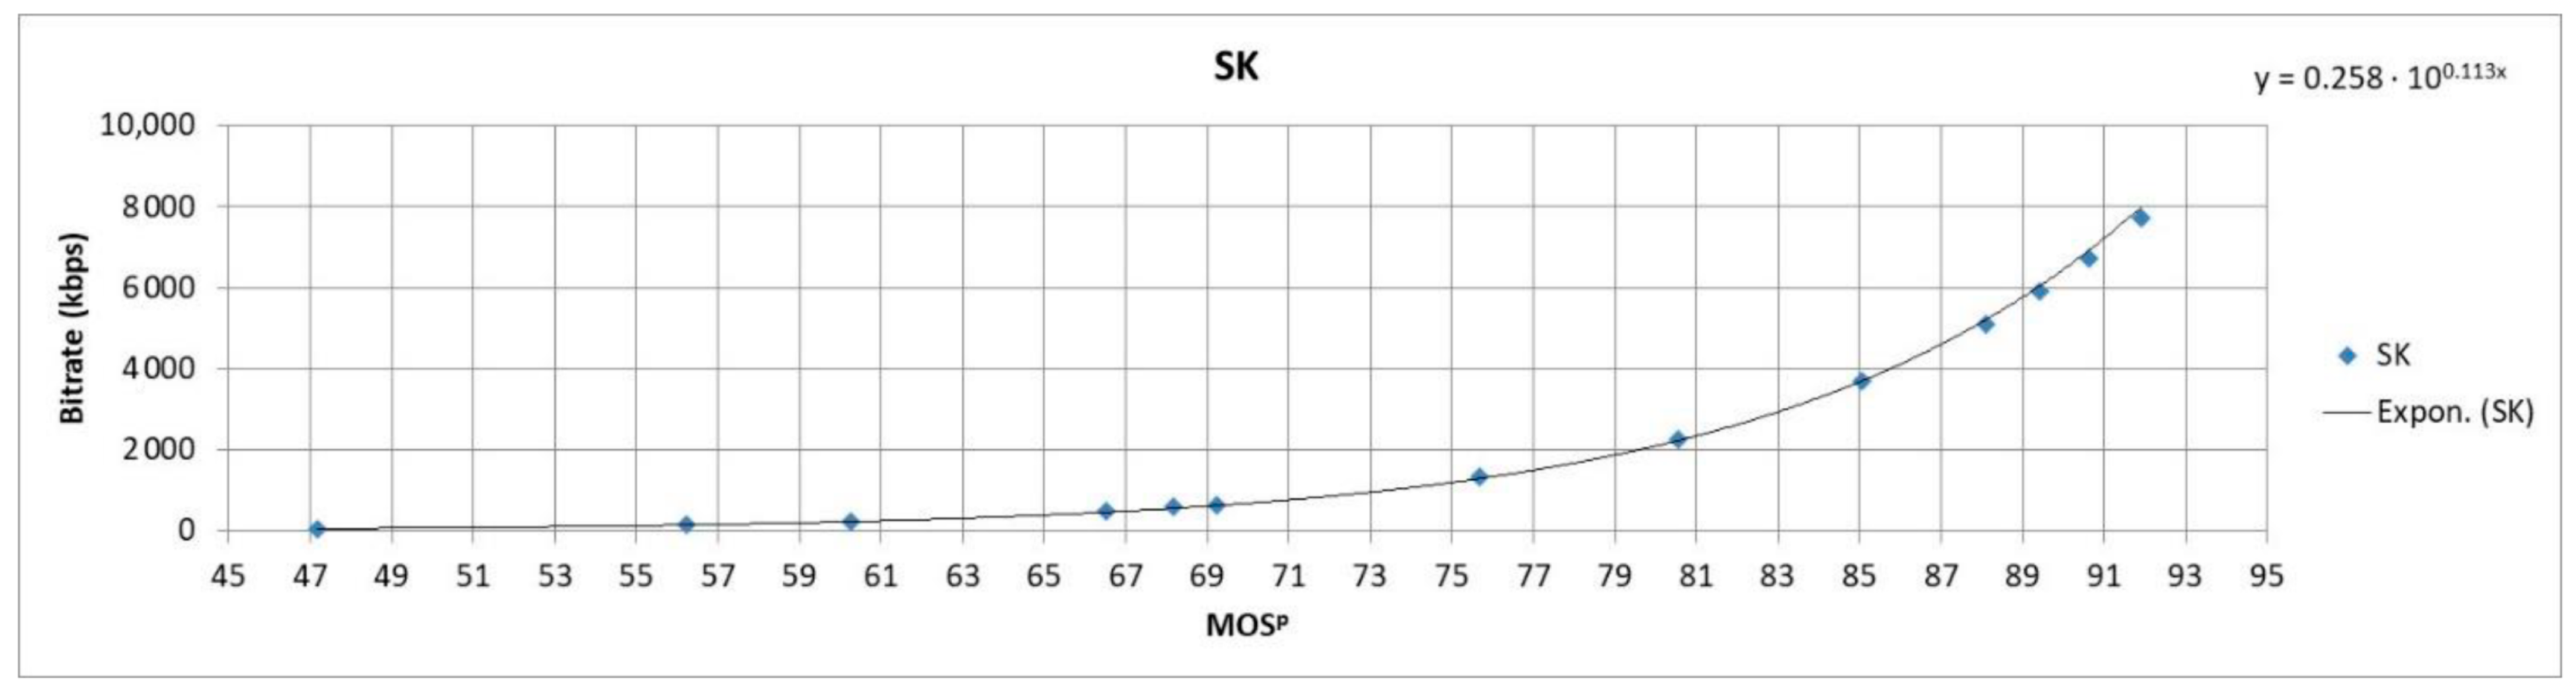
This chapter presents the process of the representation selection model development. It started by determining the data points of envelopes of SSIM-achieved bitrate curves (Figure 2) obtained for every video sequence. In doing so, the SSIM value for a given bitrate is taken for the resolution for which it is the highest. The points gathered in this way were used to construct the SSIMenv–bitrate curve by using a nonlinear function given with Equation (3).
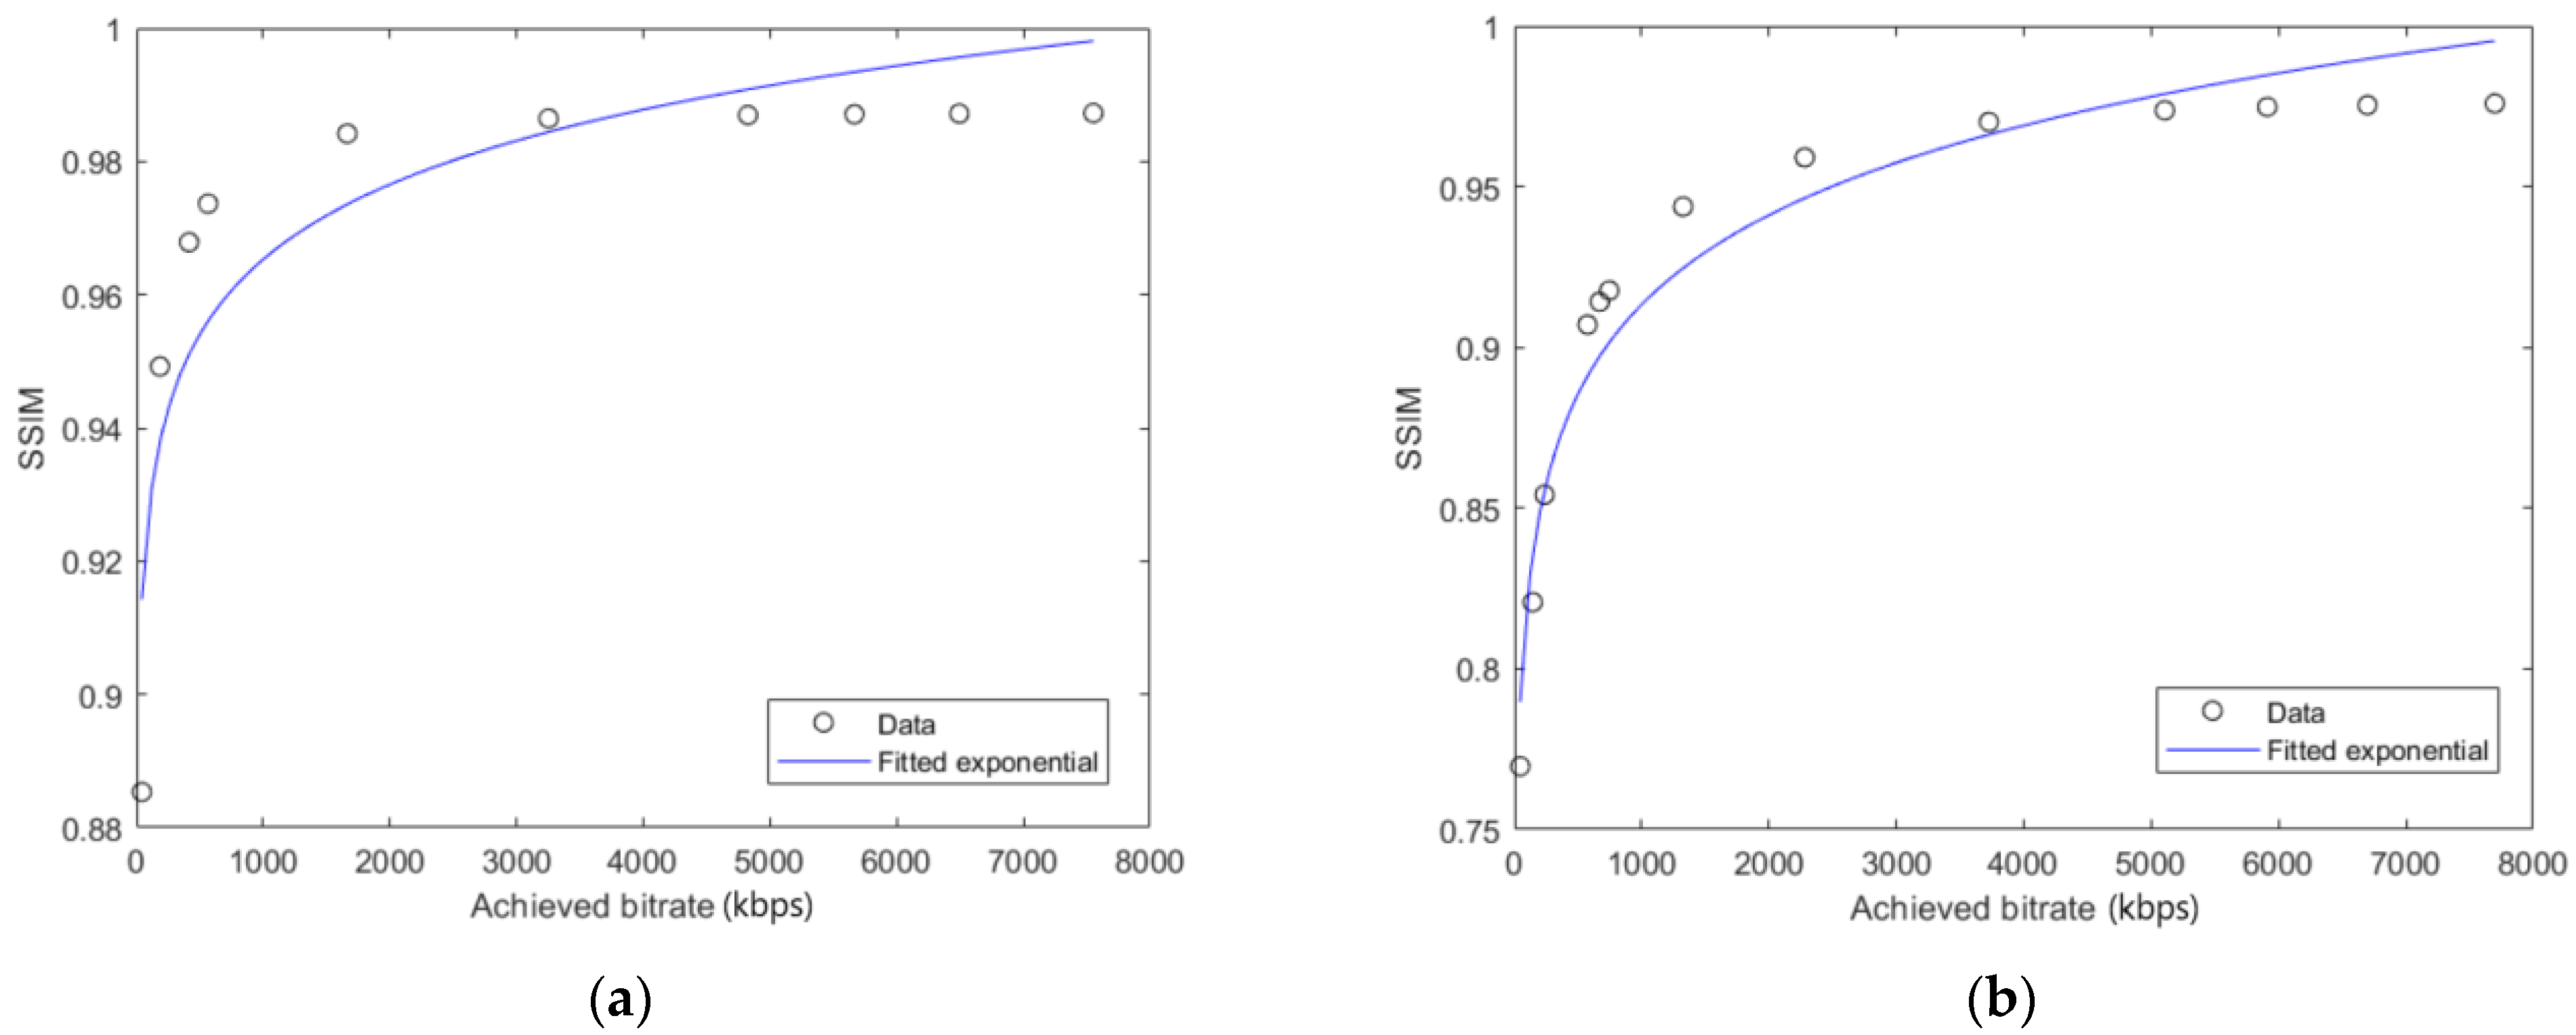
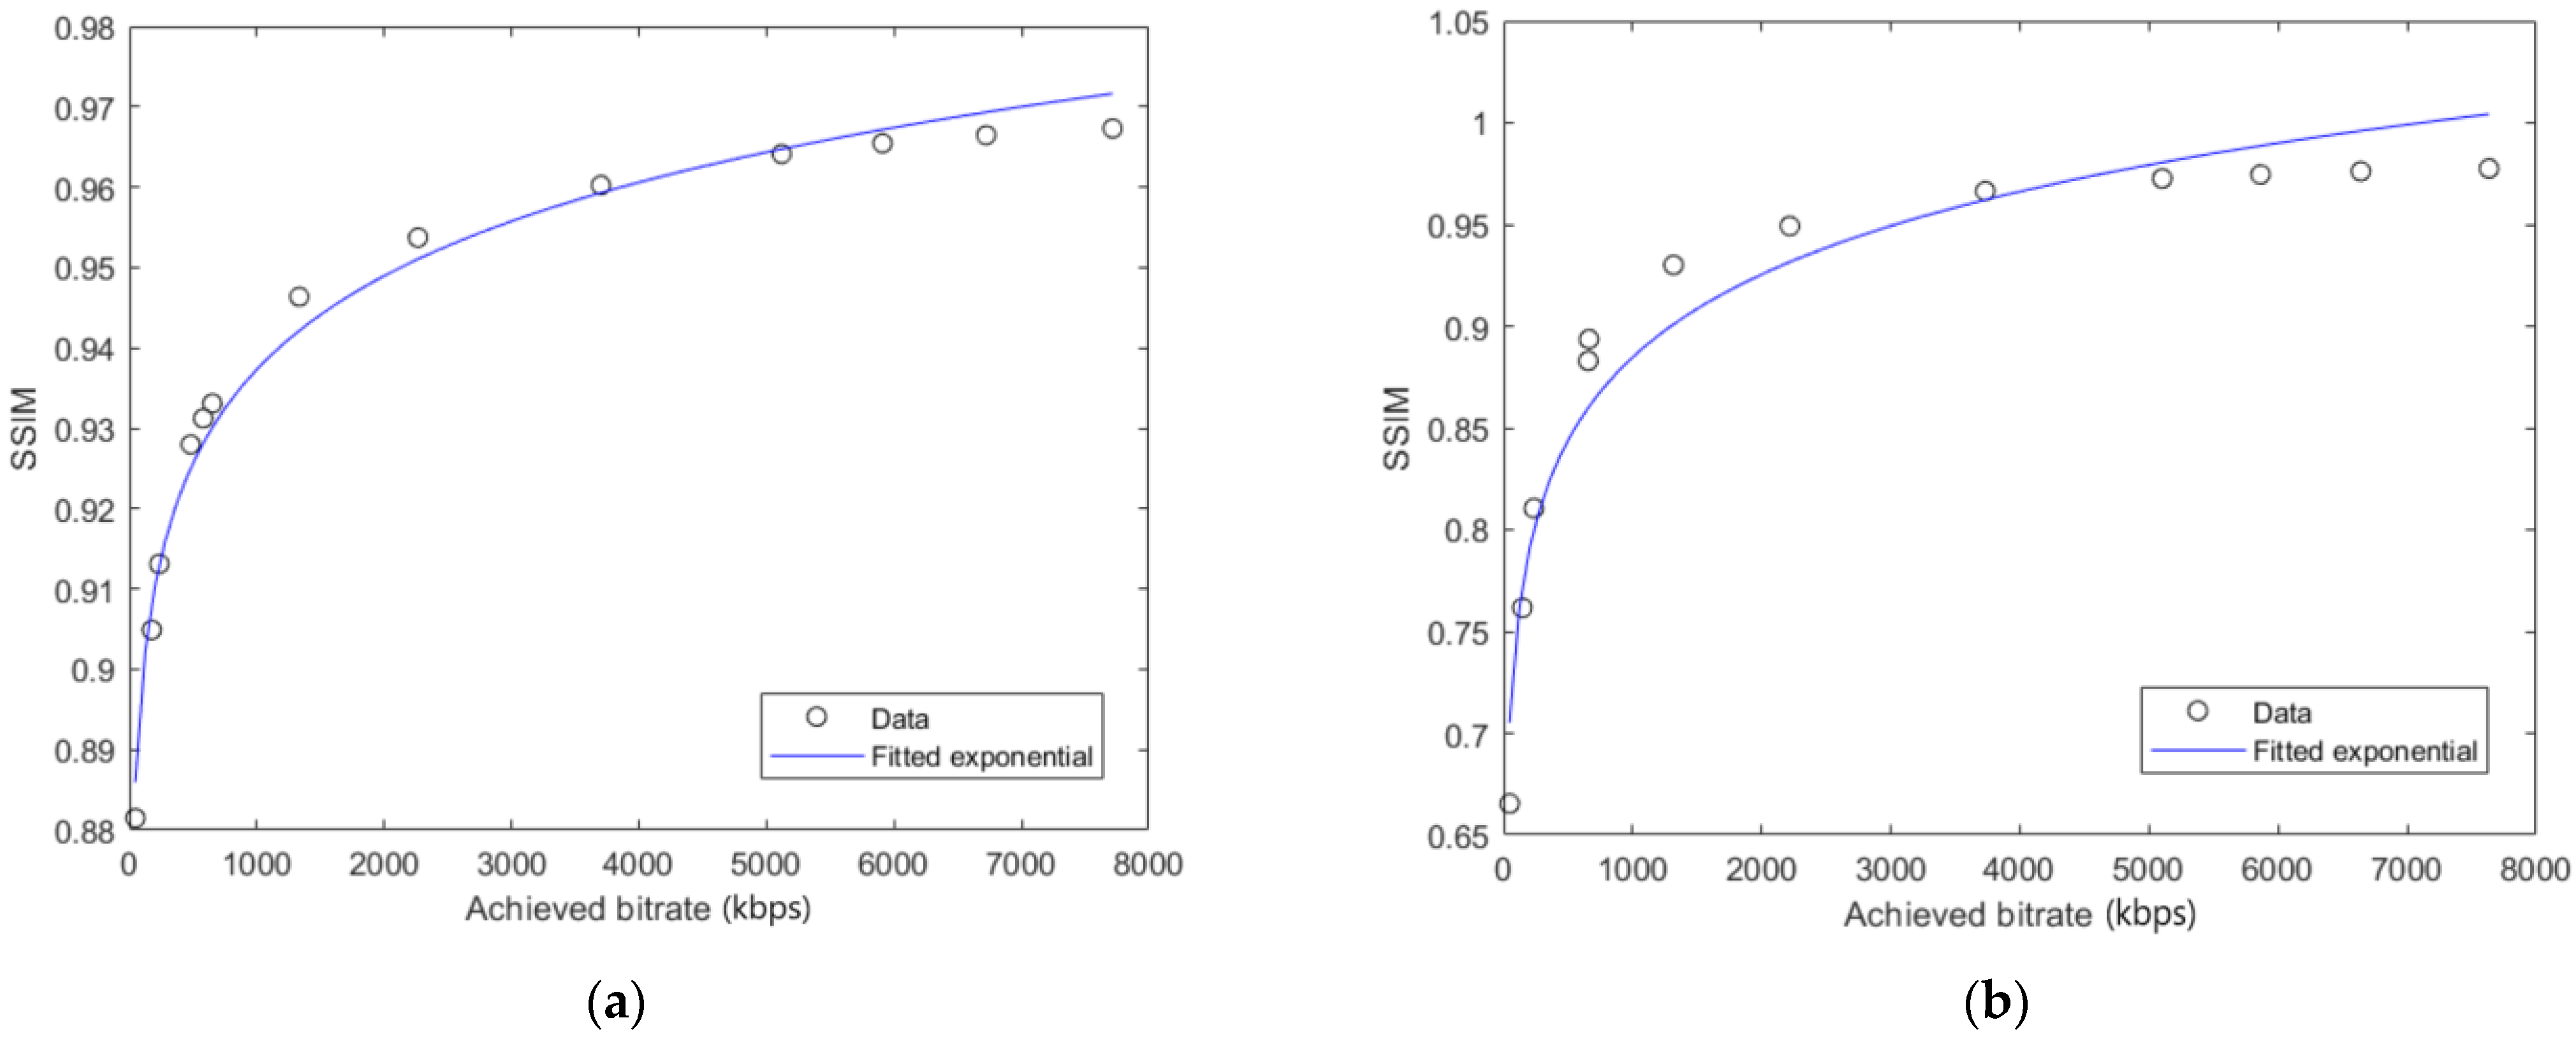
Coefficients A and B were determined for every video sequence by using the lscurvefit function in Matlab R2018b (Natick, MA, USA) that uses least-squares to fit the measured data to a nonlinear curve. The fitted curves for video sequences C47, PA, SK and EM are presented in Figure 3 and Figure 4. Figure 3 and Figure 4 show that the resulting fitted curves can be used to estimate the SSIMenv values based on the encoding bitrate values for a certain video sequence.
Values of coefficients A and B as well as PLCC values determined for every video sequence used in the modeling process are given in Table 3. PLCC values were calculated to analyze the correlation between the measured SSIM values and the modeled values of SSIMenv. The mean value of PLCC for all video sequences is 0.953, i.e., the model achieves adequate results compared to measured values.
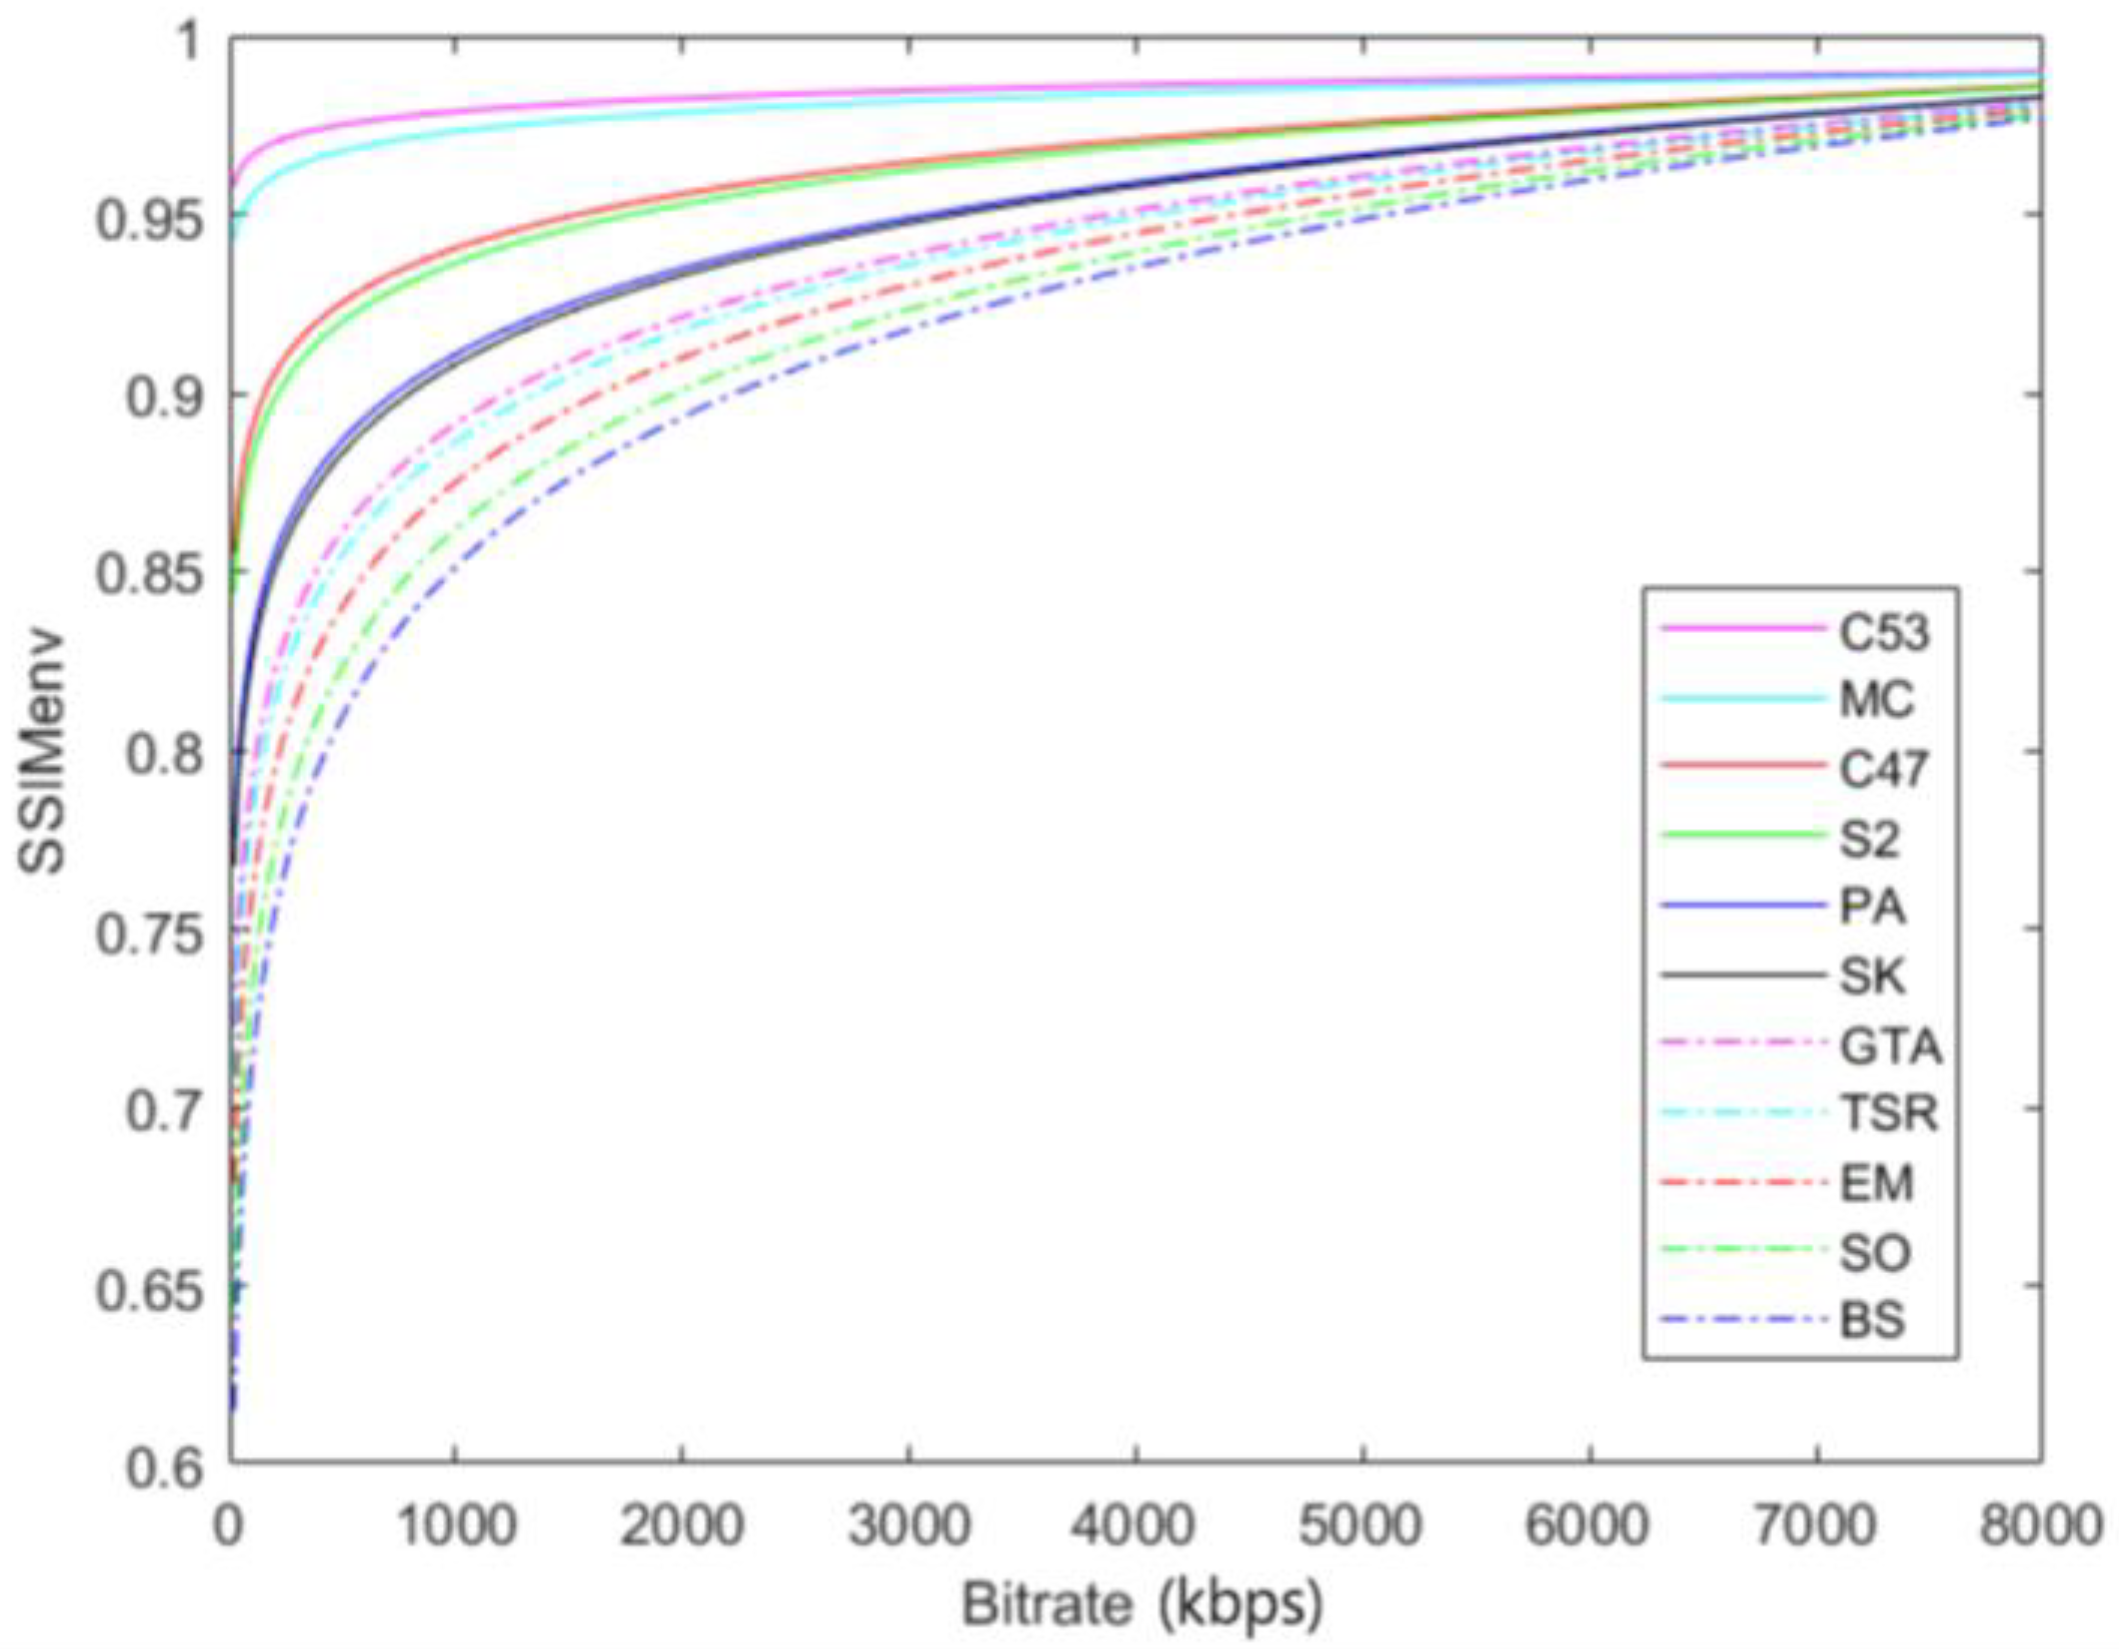
Figure 5 presents SSIMenv–bitrate curves for all sequences used for modeling. It can be seen that SSIMenv values are lower for video sequences with a higher SITI for given bitrates. This is to be expected since videos with a higher level of spatial and temporal activity are more difficult to encode and for a given quality level, the degree of compression is lower than for sequences of less complexity.
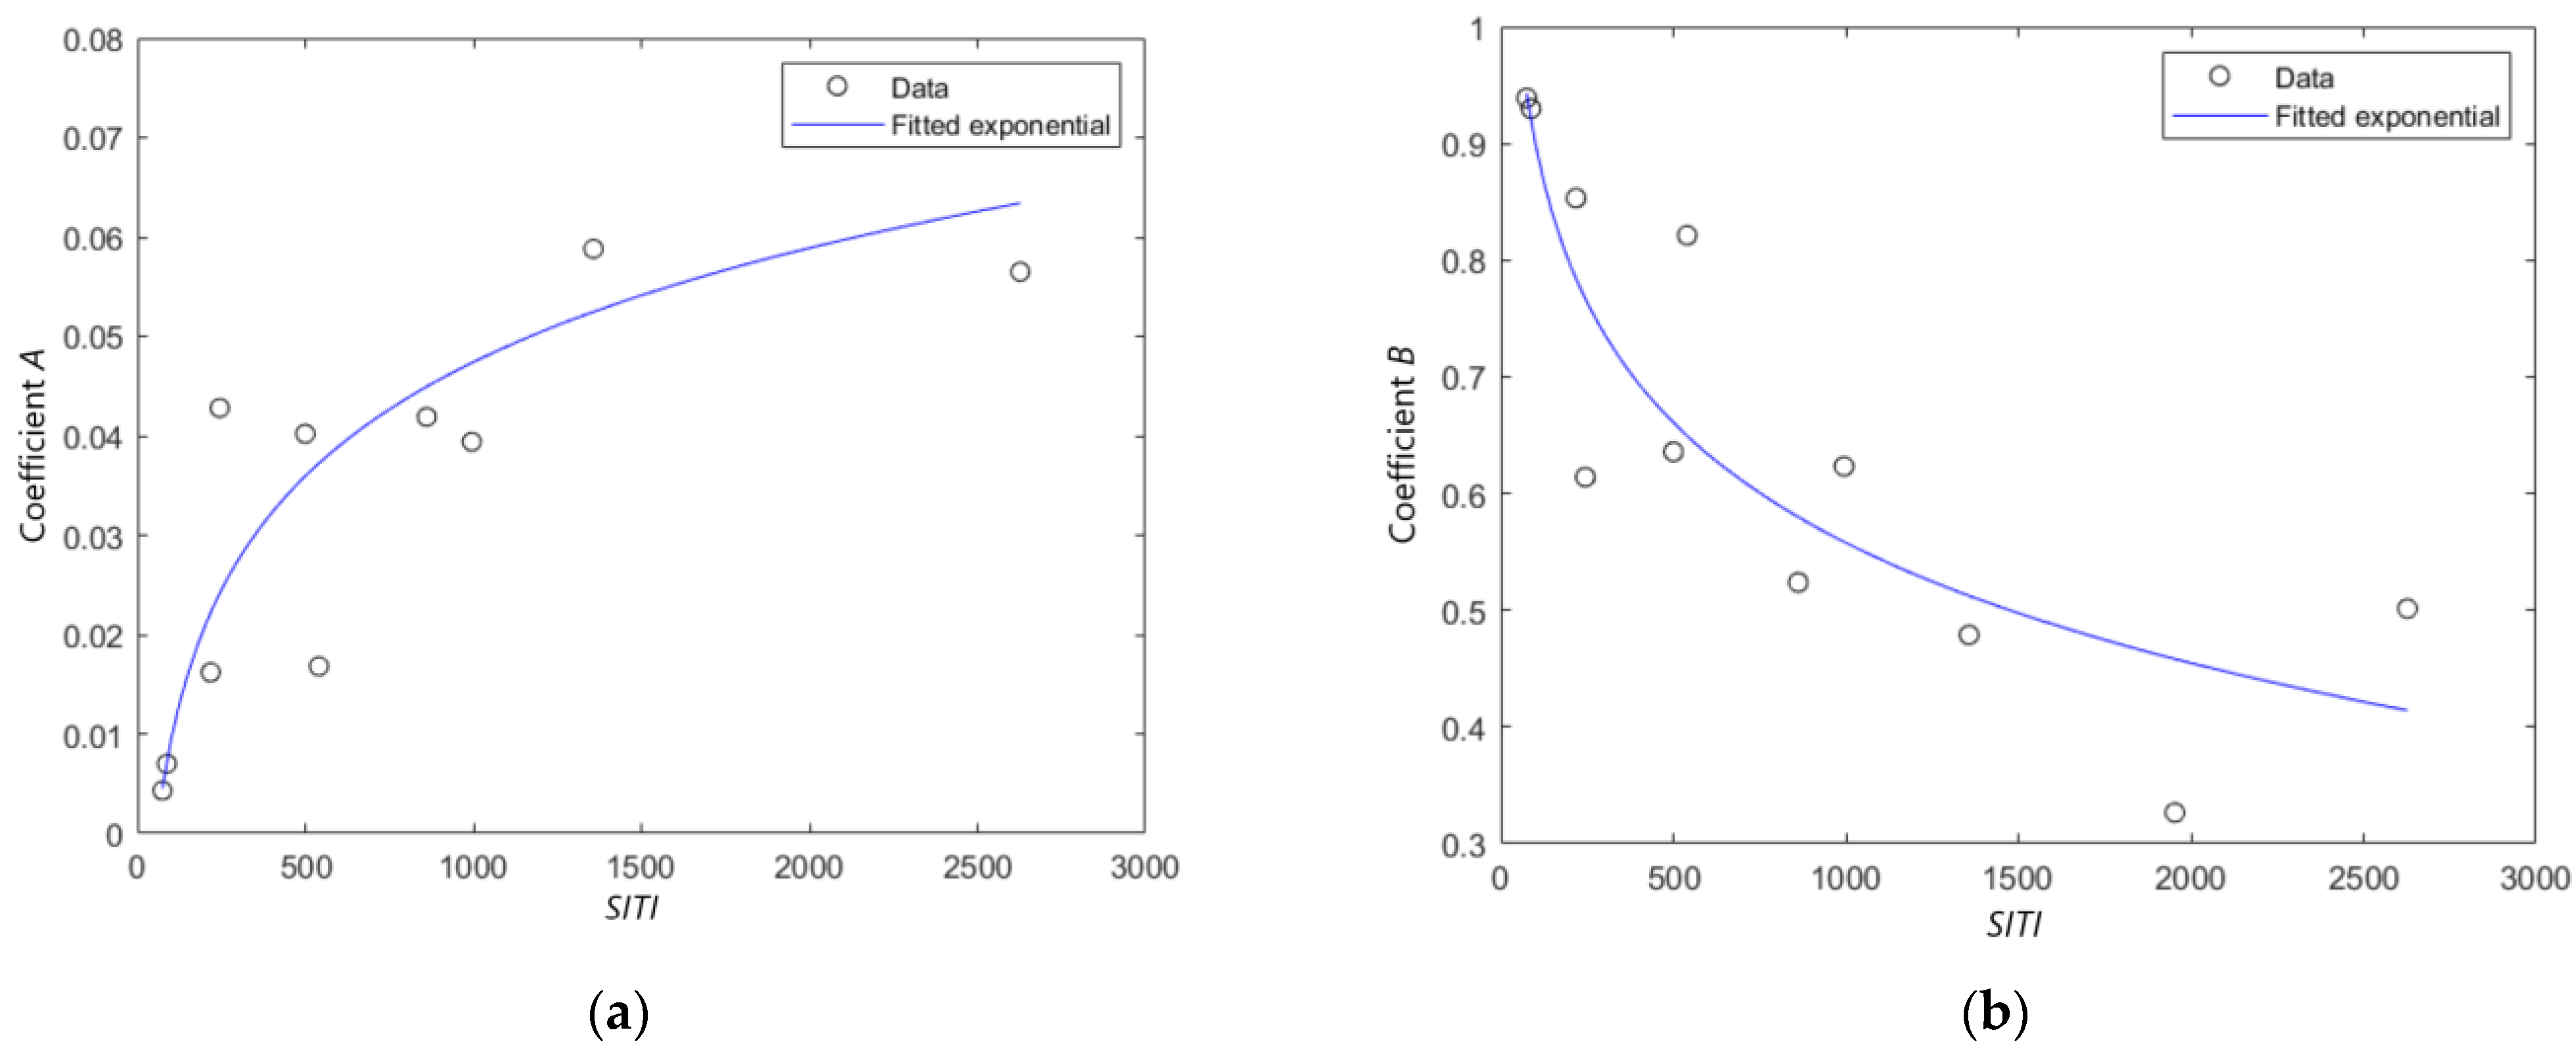
The question arises as to whether the observed behavior can be expressed as a functional relationship between SSIMenv(BR) and SITI. Seeking an answer to this question, we found that the relationship between A and SITI (A(SITI)) as well as B and SITI (B(SITI)) can be expressed by Equation (4).
Equation (4) is used for both A(SITI) and B(SITI), but with different parameters, X and Y. SITI has proven to be an adequate measure that can be used to describe the spatial and temporal activity of video sequences and consequently their encoding complexity [35]. The nonlinear least-squares curve-fitting was done using the lscurvefit function in Matlab and the resulting coefficients X and Y, as well as PLCC values, are given in Table 4.
Figure 6 depicts the fitted curves obtained for A(SITI) and B(SITI). As it can be seen from Figure 6, as well as from PLCC values, the obtained fitted curves give an accurate functional relationship between the coefficients A, B, and SITI.
By using (3) and (4), the SSIMenv values can be presented as a function of bitrate (BR) and SITI values for a given sequence, as given with Equation (5).
Equation (5) is a basic mathematical expression for the representation selection model and can be used to estimate the SSIM value for a video sequence encoded to a specific bitrate BR, only knowing the SITI value for that video sequence.
For the correct application of this model, the optimal spatial resolution for the given bitrate and SITI must be selected according to Equation (6) presented in [35].
If SITI is lower than or equal to 500, values of coefficients C, D, E, F, G, and H are 4.582, 5.421, 0, 0, 0.435, and 0.188, respectively. If SITI is higher than 500, values of coefficients C, D, E, F, G, and H are 0, 0, 27,416.1, −0.332, 0.198, and 0.238, respectively. The accuracy of the model was analyzed by comparing the SSIMenv values calculated with Equation (5) and the measured SSIM values for each coded video sequence. That comparison of SSIM and SSIMenv values was done using video sequences encoded at 32 different bitrates ranging from 50 kbps to 8 Mbps. The results for fourteen videos used for modeling, as well as for three videos not used in the modeling process, are given in Table 5. It can be seen that the mean difference is only 4.28% for the first group of the videos and 5.84% for the second group of the videos. PLCC values are higher than 0.91 for both groups of video sequences.
4.2. Optimal Representation Set Selection
The model presented by Equation (5) can be used to determine the optimal set of representations but we chose to first map the SSIMenv values to a subjective MOS (Mean Opinion Score) scale by using the mapping presented in [36].
Mapping SSIM values to the 0–100 MOS scale was done by using Equation (7).
where represents the estimation of the user-perceived quality predicted by an SSIMenv value [36]. It should be noted that through SSIMenv, is also the function of BR and SITI.
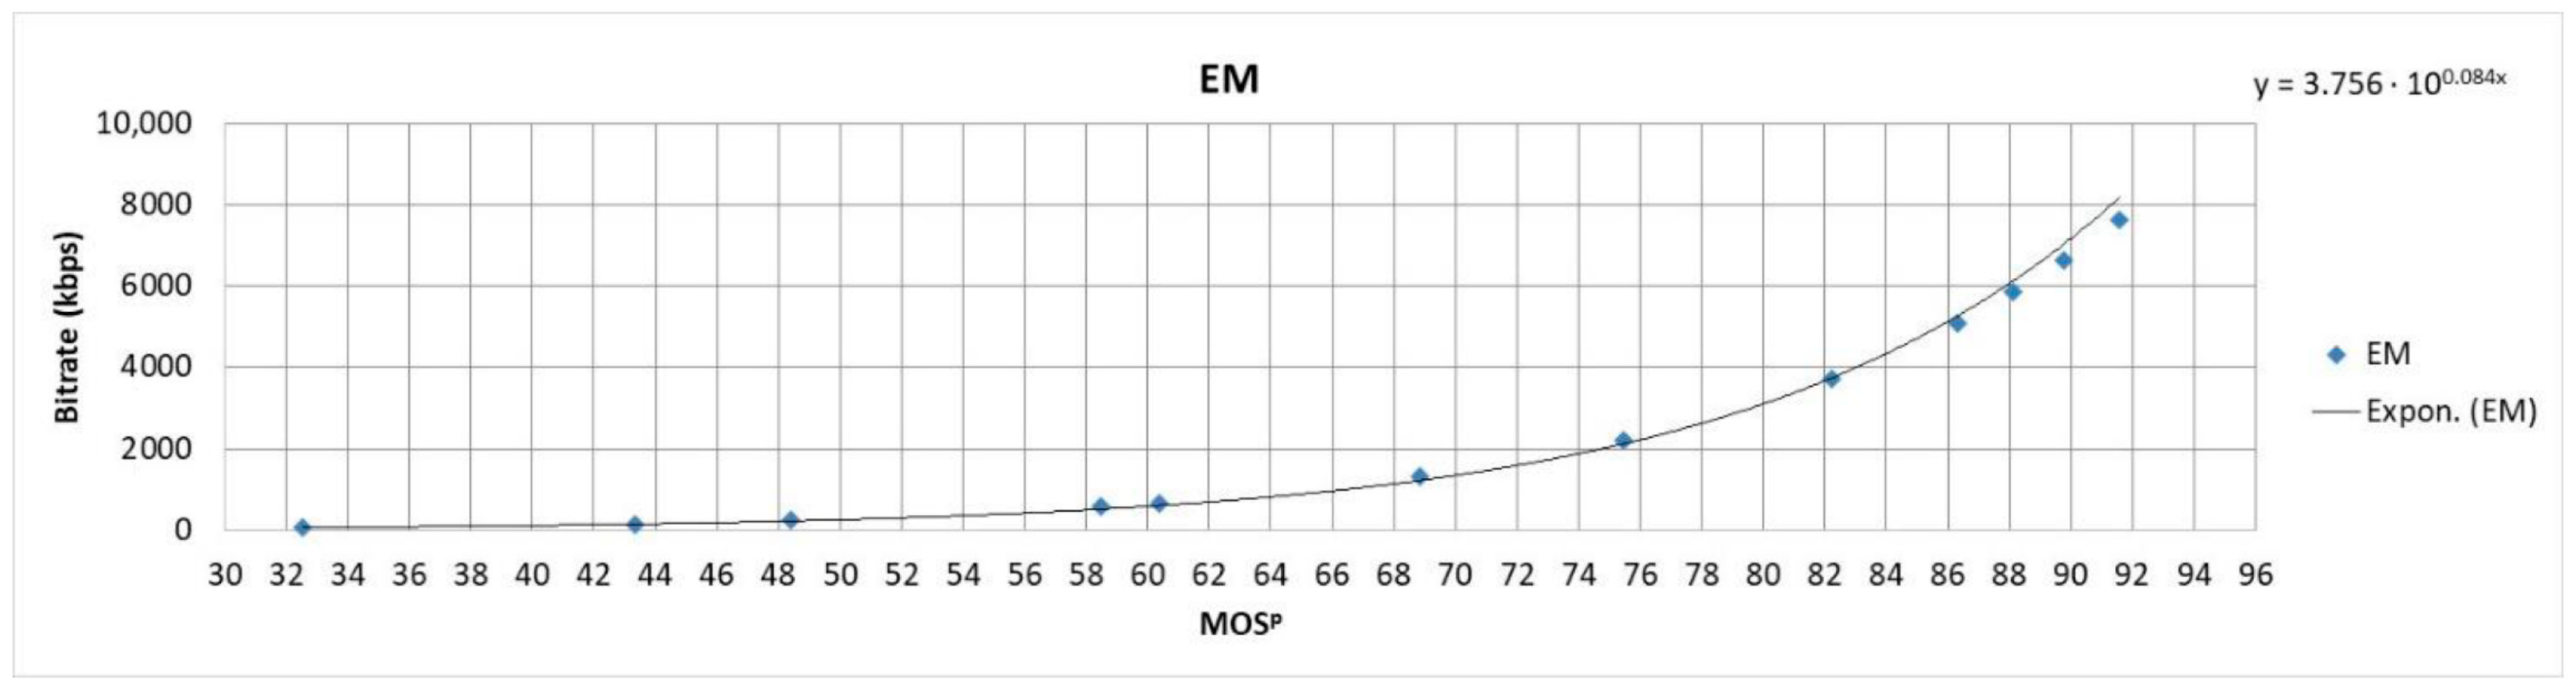
To determine the bitrates to which a video sequence should be encoded to form well-balanced representation sets, another step needs to be taken. By using (5) and (7), we were able to express bitrates as a function of values for the given SITI, as presented by the curves in Figure 7, Figure 8, Figure 9 and Figure 10 as well as by the function in Equation (8).
Coefficients and calculated for each sequence are given in Table 6. The mean value of PLCC for all video sequences used in the modeling process is 0.997.
Based on the acquired function (8), it is now possible to determine the optimal values of bitrates for representation sets for each video sequence based on the SITI and values. Well-balanced representation sets should have neither too many nor too few quality levels (i.e., bitrates) to provide optimal adaptability to the video streaming client. Furthermore, it is logical that the video sequence encoding bitrates are selected so that the change in the predicted subjective quality () from level to level is constant. Based on these assumptions, as well as the bitrate- curves shown in Figure 5, it can be concluded that the number of quality levels for sequences with lower SITI will be lower than for sequences with higher SITI. In order to obtain a sufficient number of quality levels for sequences with a lower SITI, should be lower.
According to our experience, for generating a representation set, it is advisable to select encoding bitrates for video sequences with SITI lower than 100 by using , for video sequences with SITI higher than 100 and lower than 500 by and for video sequences with SITI higher than 500 by .
Furthermore, for 1080p sequences and encoding by H.264 codec, it is not advisable to use the bitrates that correspond to values lower than 40 and to use encoding bitrate lower than 50 kbps. By using the advised steps between representation levels, the optimal number of representations shall be obtained, ranging from 7 to 19.
5. Testing of the Representation Selection Model
5.1. Testing of the Optimal Representation Set Using Adaptive Streaming Algorithms
The efficiency of the segmentation made by the proposed model was tested in a video streaming environment by using two adaptive streaming algorithms in two different network scenarios. For this testing, we used a Big Buck Bunny video sequence that was not used in the modeling process or to determine the model parameters. In this way, it was checked whether the proposed model is suitable for application on video content outside the set of contents used in the development of the model. The first step in this experiment was a selection of optimal representations according to the model for BBB video sequence as well as its segmentation.
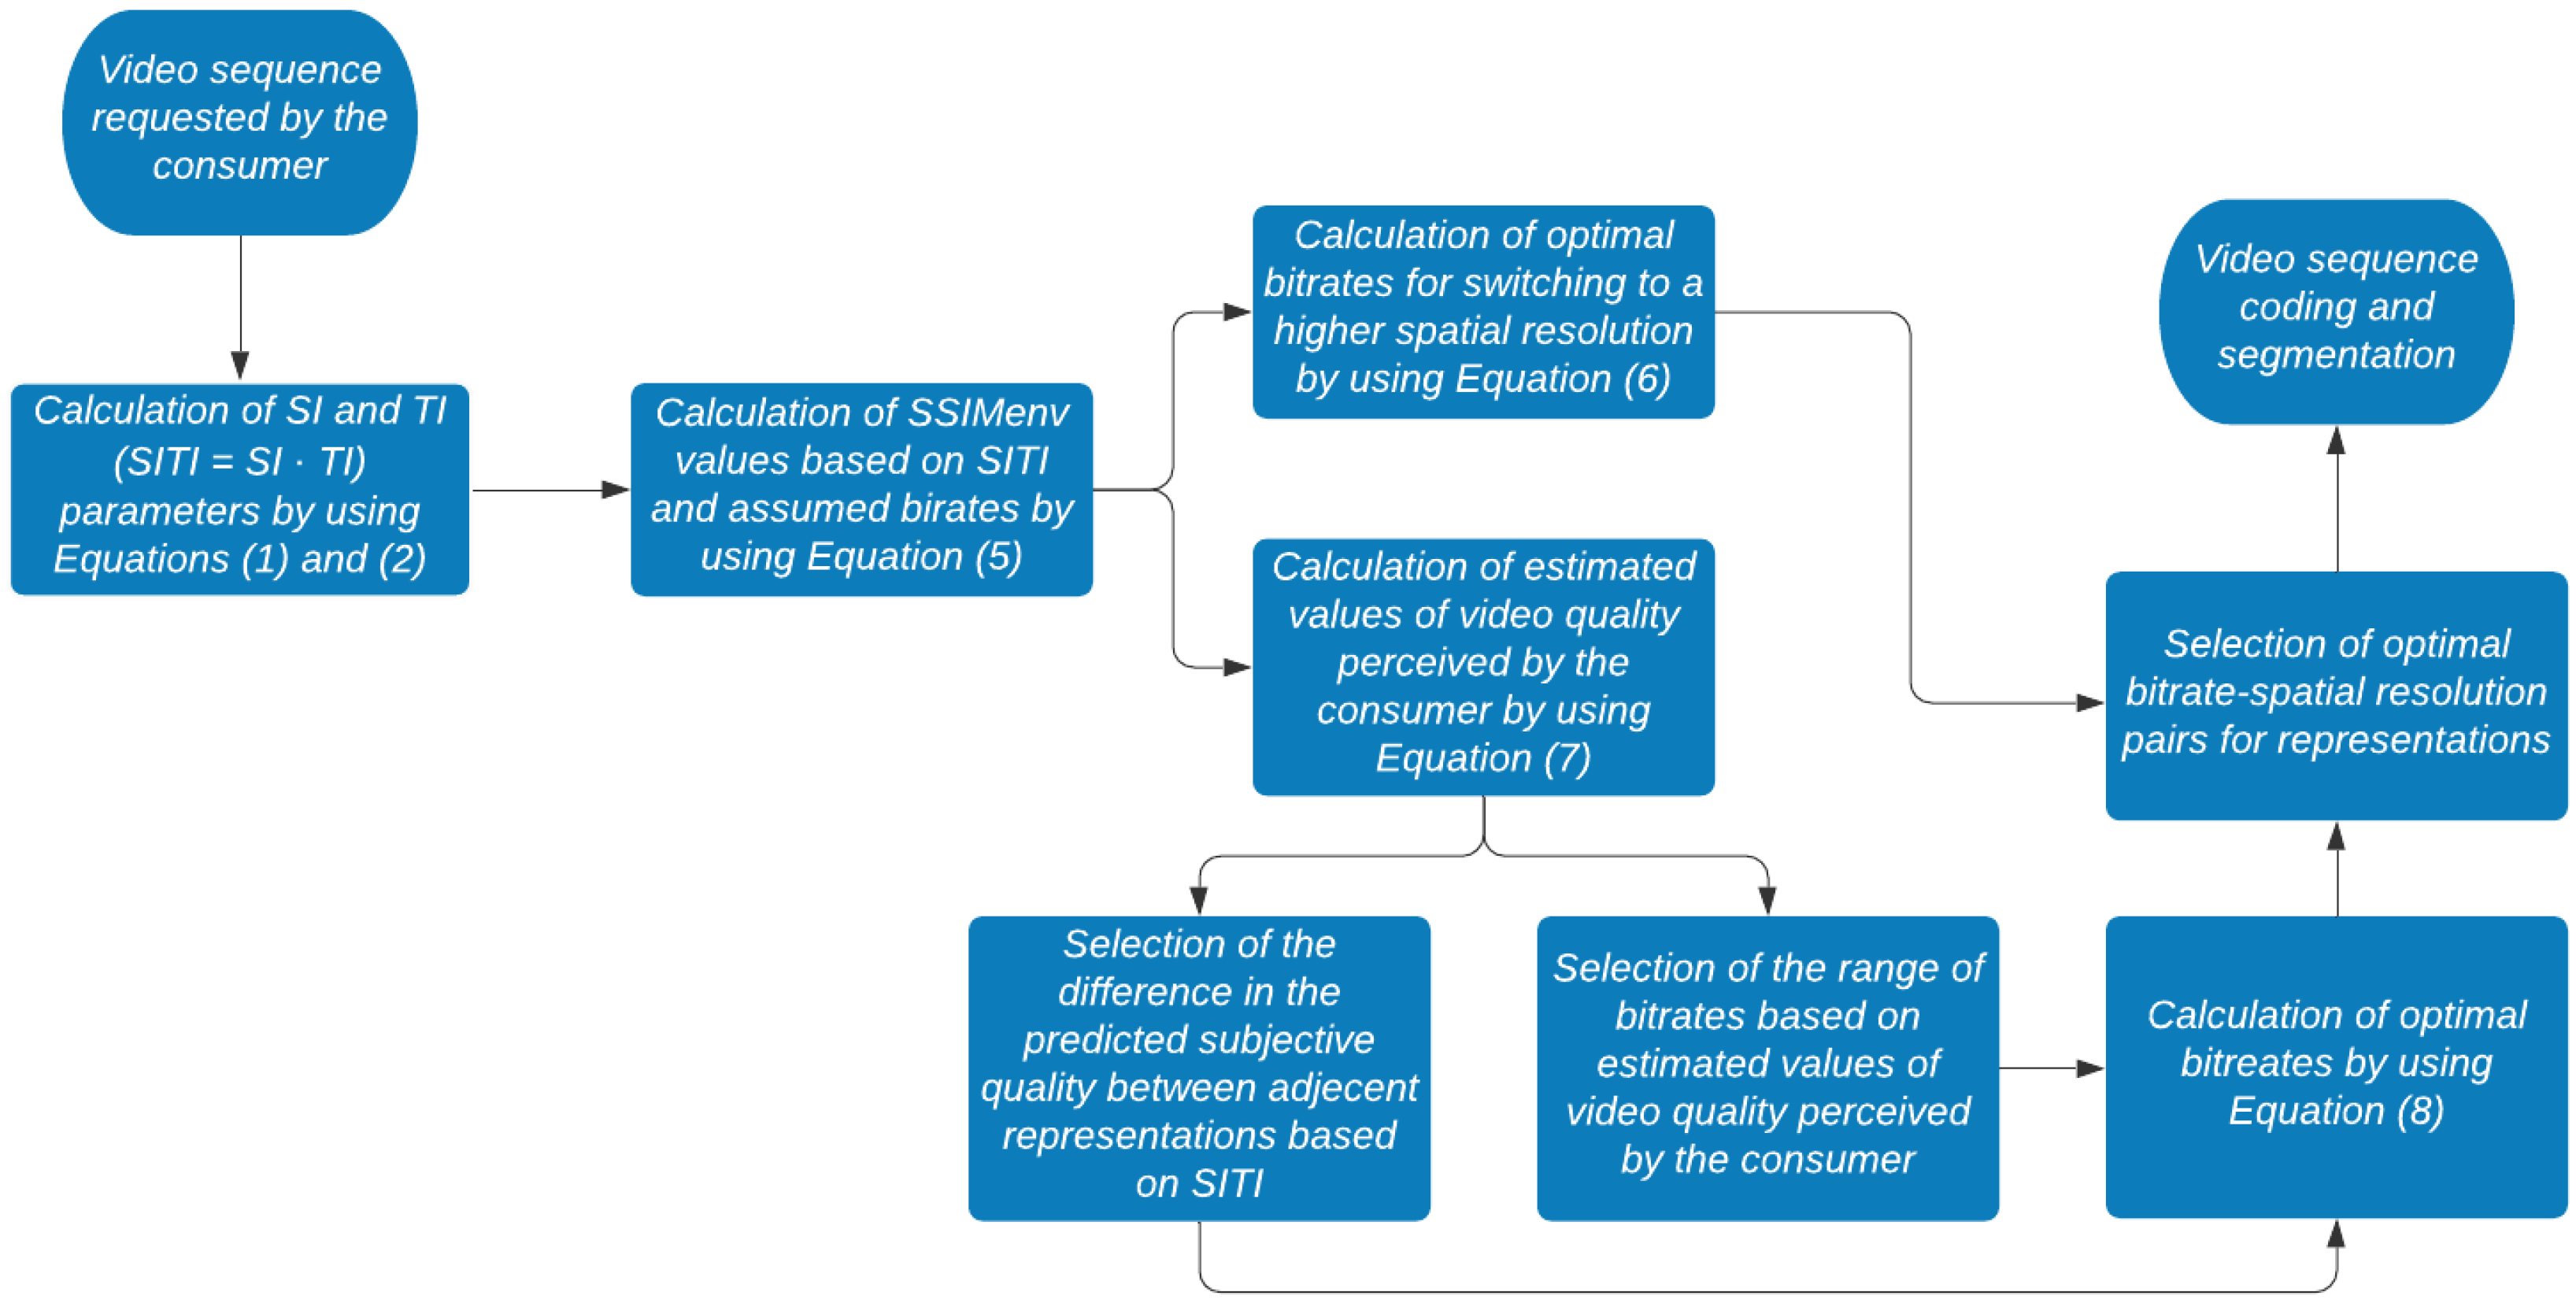
The selection of optimal representations for a video sequence using the proposed model consists of several steps as shown in Figure 11.
First, as depicted in Figure 11, SI and TI values for the BBB video sequence were calculated. Optimal bitrates for switching to a higher spatial resolution were calculated using Equation (6). The range of bitrates and the number of representations for BBB were determined based on Equations (5) and (7). The desired range of bitrates was set from 50 kbps to 10 Mbps in order to achieve the satisfactory MOS values. Considering that the advised step between the representation levels for BBB is , the selected video sequence was segmented into 16 representations. Finally, the optimal bitrate for each representation was calculated using Equation (8). Spatial resolutions and bitrates used in this testing as well as values used for defining the representations for the proposed segmentation are listed in Table 7. Moreover for testing purposes, BBB was segmented using segment duration of 2, 6 and 10 s.
5.2. Experimental Framework
The proposed segmentation was tested using two different network scenarios and two adaptive streaming algorithms, namely Basic Adaptation Algorithm (BAA) and Segment Aware Rate Adaptation (SARA) algorithm.
BAA [37] has two phases when selecting the representation for the following segment. In the first phase, when the available bandwidth is higher by a predefined factor than the bitrate of a current representation, the first adjacent representation with a higher bitrate is selected. In the second phase, when the available bandwidth is lower by a predefined factor than the bitrate of a current representation, the most appropriate representation with a lower bitrate is selected.
SARA algorithm [38] selects the representation of the following segment based on the available bandwidth, segment size and buffer occupancy. The first segment is always requested from the representation with the lowest bitrate, i.e., while the buffer occupancy is lower than the first threshold. When the available bandwidth is higher than the bitrate of a current representation, but the buffer occupancy is between the first and second threshold, the first adjacent representation with a higher bitrate is selected. When the buffer occupancy increases over the second threshold, the next representation can be increased by more than one step. When the buffer occupancy increases over the third threshold, SARA introduces a delay until the buffer occupancy falls below the third threshold.
In the first testing network scenario, the available network bandwidth had a mean value of 7 Mbps, while in the second testing scenario, the available bandwidth had a mean value of 4 Mbps. In comparison to the first scenario where the changes in the available bandwidth were gradual, the second scenario had more sudden changes in the available bandwidth. Network test scenarios were set up using the open-source network bandwidth limiting program called Wonder Shaper [39].
A-Stream [40] is a Python-based emulated video player which supports BAA and SARA adaptive streaming algorithms. It was used for streaming the BBB video sequence, which was segmented according to the proposed model. For testing purposes, A-Stream was also used to stream segmented video sequence BBB available in the database [12].
5.3. Experimental Results
Upon streaming, received video segments were combined into video sequences that were scaled to the original 1080p spatial resolution in order to calculate the SSIM values as a measure of resulting video quality. Calculated SSIM values are listed in Table 8. Based on the SSIM values, it can be concluded that the proposed segmentation produces higher values of SSIM compared to [12] in 92% cases. Therefore, the proposed segmentation presents an improvement to previously available segmentations, exclude the necessity for precoding while still introducing the content-based segmentation with optimal representation sets. It should be noted that the improvement was achieved with a smaller number of representations, which means fewer memory requirements on the server.
To additionally confirm the accuracy of the proposed model, the coded video signals for segmentation presented in [12] and the proposed segmentation were evaluated using a subjective method for evaluating the video quality. Subjective testing was performed for 24 encoded video sequences after video streaming and the original video signal. The experimental part of the subjective testing was conducted with 32 inexperienced viewers in a controlled environment following the ITU-T Recommendation P.913 [41]. Prior to testing, all participants were tested for visual acuity and color recognition, and all participants were introduced to the type of assessment and the range of grades. The ACR-HR method was used as the test procedure.
After removing the hidden reference, PLCC was calculated for each viewer’s ratings according to the respective average ratings of all viewers as rejection criteria. Since the achieved PLCC values for six viewers were less than 0.75, the collected scores of the remaining 26 viewers were used to calculate the MOS values for each video signal (Table 9). As can be seen from Table 9, subjective testing of the quality of encoded video sequences showed that the proposed method of selecting the number and parameters of representations achieves better results compared to the segmentation presented in [12] in 83.3% cases. The average MOS value for the proposed segmentation was higher by 0.263 compared to the MOS values achieved for the segmentation presented in [12].
6. Conclusions
MPEG DASH is a standard for adaptive streaming that defines the format of video segments and the manifest file thus ensuring the interoperability between different streaming services and client protocols. Before streaming, in order to be used on systems based on MPEG DASH, all video sequences need to be encoded at predefined representation sets and segmented. The encoding and segmentation process have a great impact on the user’s QoE. In comparison to adaptive streaming algorithms, the segmentation of video sequences for DASH systems has not yet been investigated enough. Solutions described in the available research that address the problem of defining the optimal representation sets are mostly proprietary and do not ensure all needed information for reproducting presented results. Moreover they do not provide model methodology and notation; they need a large amount of computational power or they do not take the spatial and temporal activity of video sequences into account.
This paper presents a model that can be used to determine representation sets based only on spatial (SI) and temporal information (TI) of selected video sequences. The SI and TI parameters need to be calculated only once, for the original sequence, and then the optimal encoding bitrates can be selected based on a simple procedure. The ease of use of this model for the selection of representation sets is its greatest advantage over existing methods, which mostly involve multiple precoding and quality calculations of encoded video sequences. Considering that this model was developed based on the analysis of sequences encoded by a specific encoder (H.264), the presented model parameters cannot be used for other encoders like H.265 or V9. However, the presented methodology ensures that the presented model can be easily adapted to any other encoding. Furthermore, the model uses the SSIM video quality measure but can be adjusted for any other objective quality metric.
Author Contributions
Conceptualization, J.V. and S.R.-D.; methodology, J.V. and S.R.-D.; software, J.V.; validation, J.V., S.R.-D. and D.Ž.; formal analysis, J.V., S.R.-D. and D.Ž.; investigation, J.V.; resources, J.V.; data curation, J.V.; writing—original draft preparation, J.V.; writing—review and editing, J.V., S.R.-D. and D.Ž.; visualization, J.V.; supervision, S.R.-D. and D.Ž. All authors have read and agreed to the published version of the manuscript.
Funding
This research received no external funding.
Conflicts of Interest
The authors declare no conflict of interest.
References
- Sodagar, I. The MPEG-DASH Standard for Multimedia Streaming Over the Internet. IEEE Multimed. 2011, 18, 62–67. [Google Scholar] [CrossRef]
- Katsenou, A.V.; Zhang, F.; Swanson, K.; Afonso, M.; Sole, J.; Bull, D. VMAF-Based Bitrate Ladder Estimation for Adaptive Streaming. 2021. Available online: https://arxiv.org/pdf/2103.07564.pdf (accessed on 2 May 2021).
- Reznik, Y.; Lillevold, K.; Jagannath, A.; Greer, J.; Corley, J. Optimal Design of Encoding Profiles for ABR Streaming. In Proceedings of the 23rd Packet Video Workshop, Amsterdam, The Netherlands, 12–15 June 2018; Association for Computing Machinery: New York, NY, USA, 2018; pp. 43–47. [Google Scholar]
- Zabrovskiy, A.; Feldmann, C.; Timmerer, C. Multi-codec DASH dataset. In Proceedings of the 9th ACM Multimedia Systems Conference, Amsterdam, The Netherlands, 12–15 June 2018; Cesar, P., Zinc, M., Murray, N., Eds.; Association for Computing Machinery: New York, NY, USA, 2018; pp. 438–443. [Google Scholar]
- Seufert, M.; Egger, S.; Slanina, M.; Zinner, T.; Hoßfeld, T.; Tran-Gia, P. A Survey on Quality of Experience of HTTP Adaptive Streaming. IEEE Commun. Surv. Tutor. 2015, 17, 469–492. [Google Scholar] [CrossRef]
- Huang, T.Y.; Johari, R.; McKeown, N.; Trunnell, M.; Watson, M. A buffer-based approach to rate adaptation: Evidence from a large video streaming service. Comput. Commun. Rev. 2015, 44, 187–198. [Google Scholar] [CrossRef]
- Bedogni, L.; Di Felice, M.; Bononi, L. Dynamic segment size selection in HTTP based adaptive video streaming. In Proceedings of the IEEE Conference on Computer Communications Workshops, Atlanta, GA, USA, 1–4 May 2017; Li, M., Yu, S., Eds.; IEEE: Atlanta, GA, USA, 2017; pp. 665–670. [Google Scholar]
- Wilk, S.; Stohr, D.; Effelsberg, W. A content-aware video adaptation service to support mobile video. ACM Trans. Multimed. Comput. Commun. Appl. 2016, 12, 1–23. [Google Scholar] [CrossRef]
- Schwarzmann, S.; Zinner, T.; Geissler, S.; Sieber, C. Evaluation of the Benefits of Variable Segment Durations for Adaptive Streaming. In Proceedings of the Tenth International Conference on Quality of Multimedia Experience, Sardinia, Italy, 29 May–1 June 2018; pp. 1–6. [Google Scholar]
- Luis, G.; Satoru, I.; Toru, A.; Takuo, S. SAND/3: SDN-Assisted Novel QoE Control Method for Dynamic Adaptive Streaming over HTTP/3. Electronics 2019, 8, 864. [Google Scholar]
- Hassan, Y.M.; Helmy, A.; Rehan, M.M. Effect of varying segment size on DASH streaming quality for mobile user. In Proceedings of the International Conference on Engineering and Technology, Cairo, Egypt, 19–20 April 2014; pp. 1–4. [Google Scholar]
- Lederer, S.; Miller, C.; Tinnnerer, C. Dynamic adaptive streaming over HTTP dataset. In Proceedings of the 3rd Multimedia Systems Conference, Chapel Hill, NC, USA, 22–24 February 2012; Association for Computing Machinery: New York, NY, USA, 2012; pp. 89–94. [Google Scholar]
- Thang, T.C.; Le, H.; Pham, A.; Ro, Y.M. An Evaluation of Bitrate Adaptation Methods for HTTP Live Streaming. IEEE J. Sel. Areas Commun. 2014, 32, 693–705. [Google Scholar] [CrossRef]
- Toni, L.; Aparicio-Pardo, R.; Pires, K.; Simon, G.; Blanc, A.; Frossard, P. Optimal Selection of Adaptive Streaming Representations. ACM Trans. Multimed. Comput. Commun. Appl. 2015, 11, 1–26. [Google Scholar] [CrossRef]
- De Cock, J.; Li, Z.; Manohara, M.; Aaron, A. Complexity-based consistent-quality encoding in the cloud. In Proceedings of the IEEE International Conference on Image Processing, Phoenix, AZ, USA, 25–28 September 2016; pp. 1484–1488. [Google Scholar]
- Lederer, S.; Mueller, C.; Timmerer, C. Distributed DASH dataset. In Proceedings of the 4th ACM Multimedia Systems Conference, Oslo, Norway, 28 February–1 March 2013; Association for Computing Machinery: New York, NY, USA, 2013; pp. 131–135. [Google Scholar]
- Le Feuvre, J.; Thiesse, J.M.; Parmentier, M.; Raulet, M.; Daguet, C. Ultra high definition HEVC DASH data set. In Proceedings of the 5th ACM Multimedia Systems Conference, Singapore, 19–21 March 2014; Association for Computing Machinery: New York, NY, USA, 2014; pp. 7–12. [Google Scholar]
- Kreuzberger, C.; Posch, D.; Hellwagner, H. A Scalable Video Coding Dataset and Toolchain for Dynamic Adaptive Streaming over HTTP. In Proceedings of the 6th ACM Multimedia Systems Conference, Portland, OR, USA, 18–20 March 2015; Association for Computing Machinery: New York, NY, USA, 2015; pp. 213–218. [Google Scholar]
- Duanmu, Z.; Rehman, A.; Wang, Z. A Quality-of-Experience Database for Adaptive Video Streaming. IEEE Trans. Broadcasting 2018, 64, 474–487. [Google Scholar] [CrossRef]
- Bampis, C.G.; Li, Z.; Katsavounidis, I.; Huang, T.Y.; Ekanadham, C.; Bovik, A.C. Towards Perceptually Optimized Adaptive Video Streaming -A Realistic Quality of Experience Database. IEEE Trans. Image Process. 2021. accepted for publishing. [Google Scholar] [CrossRef] [PubMed]
- Li, C.; Toni, L.; Frossard, P.; Xiong, H.; Zou, J. Complexity constrained representation selection for dynamic adaptive streaming. In Proceedings of the Visual Communications and Image Processing, Chengdu, China, 27–30 November 2016; pp. 1–4. [Google Scholar]
- Toni, L.; Aparicio-Pardo, R.; Simon, G.; Blanc, A.; Frossard, P. Optimal set of video representations in adaptive streaming. In Proceedings of the 5th ACM Multimedia Systems Conference, Singapore, 19–21 March 2014; Association for Computing Machinery: New York, NY, USA, 2014; pp. 271–282. [Google Scholar]
- Toni, L.; Frossard, P. Optimal Representations for Adaptive Streaming in Interactive Multiview Video Systems. IEEE Trans. Multimed. 2017, 19, 2775–2787. [Google Scholar] [CrossRef] [Green Version]
- Guo, C.; Zhao, L.; Cui, Y.; Liu, Z.; Ng, D.W.K. Power-Efficient Wireless Streaming of Multi-Quality Tiled 360 VR Video in MIMO-OFDMA Systems. IEEE Trans. Wirel. Commun. 2021. accepted for publishing. [Google Scholar] [CrossRef]
- Tu, Z.; Zong, T.; Xi, X.; Ai, L.; Jin, Y.; Zeng, X.; Fan, Y. Content adaptive tiling method based on user access preference for streaming panoramic video. In Proceedings of the IEEE International Conference on Consumer Electronics, Las Vegas, NV, USA, 12–15 January 2018; Institute of Electrical and Electronics Engineers: Piscataway, NJ, USA, 2018; pp. 1–4. [Google Scholar]
- Zhan, C.; Hu, H.; Sui, X.; Liu, Z.; Wang, J.; Wang, H. Joint Resource Allocation and 3D Aerial Trajectory Design for Video Streaming in UAV Communication Systems. IEEE Trans. Circuits Syst. Video Technol. 2020. accepted for publishing. [Google Scholar] [CrossRef]
- ITU-T P.910: Subjective Video Quality Assessment Methods for Multimedia Applications, Telecommunication Standardization Sector of ITU. Available online: https://www.itu.int/rec/T-REC-P.910-200804-I (accessed on 2 May 2021).
- Big Buck Bunny Movie. Available online: http://www.bigbuckbunny.org (accessed on 2 May 2021).
- Xiph.org Video Test Media. Available online: https://media.xiph.org/video/derf/ (accessed on 2 May 2021).
- Ffmpeg. Available online: https://www.ffmpeg.org (accessed on 2 May 2021).
- Vlaović, J.; Rimac-Drlje, S.; Žagar, D. Influence of Segmentation Parameters on Video Quality in Dynamic Adaptive Streaming. In Proceedings of the International Symposium ELMAR, Zadar, Croatia, 14–15 September 2020; pp. 37–40. [Google Scholar]
- Wang, Z.; Bovik, A.C.; Sheikh, H.; Simoncelli, E. Image quality assessment: From error visibility to structural similarity. IEEE Trans. Image Process. 2004, 13, 600–612. [Google Scholar] [CrossRef] [PubMed] [Green Version]
- Vlaovic, J.; Žagar, D.; Rimac-Drlje, S.; Vranješ, M. Evaluation of objective video quality assessment methods on video sequences with different spatial and temporal activity encoded at different spatial resolutions. Int. J. Electr. Comput. Eng. Syst. 2021, 12, 1–9. [Google Scholar]
- Kirch, W. Pearson’s Correlation Coefficient; Springer: Dordrecht, The Netherlands, 2008. [Google Scholar]
- Vlaović, J.; Rimac-Drlje, S.; Žagar, D. Content dependent spatial resolution selection for MPEG DASH segmentation. J. Ind. Inf. Integr. 2021. accepted for publishing. [Google Scholar] [CrossRef]
- Moldovan, A.; Ghergulescu, I.; Muntean, C.H. VQAMap: A Novel Mechanism for Mapping Objective Video Quality Metrics to Subjective MOS Scale. IEEE Trans. Broadcasting 2016, 62, 610–627. [Google Scholar] [CrossRef]
- Liu, C.; Bouazizi, I.; Gabbouj, M. Rate adaptation for adaptive HTTP streaming. In Proceedings of the Second Annual ACM Conference on Multimedia Systems, San Jose, CA, USA, 23–25 February 2011; Association for Computing Machinery: New York, NY, USA, 2011; pp. 169–174. [Google Scholar]
- Juluri, P.; Tamarapalli, V.; Medhi, D. SARA: Segment Aware Rate Adaptation Algorithm for Dynamic Adaptive Streaming over HTTP. In Proceedings of the IEEE International Conference on Communication Workshop, London, UK, 8–12 June 2015; pp. 1765–1770. [Google Scholar]
- Hubert, B.; Geul, J.; Séhier, S. The Wonder Shaper. Available online: https://github.com/magnific0/wondershaper (accessed on 2 May 2021).
- AStream: A Rate Adaptation Model for DASH. Available online: https://github.com/pari685/AStream (accessed on 2 May 2021).
- ITU-T P.913: Methods for the Subjective Assessment of Video Quality, Audio Quality and Audiovisual Quality of Internet Video and Distribution Quality Television in Any Environment, Telecommunication Standardization Sector of ITU. Available online: https://www.itu.int/rec/dologin_pub.asp?lang=e&id=T-REC-P.913-201603-I!!PDF-E&type=items (accessed on 2 May 2021).
Figure 1.
Overview of a system based on MPEG DASH.

Figure 2.
SSIM-achieved bitrate curves for Pedestrian Area video sequence.

Figure 3.
Fitted curves of data points presenting the envelope of SSIM-achieved bitrate curves for video sequences: (a) Chimera 1102347 (C47); (b) Pedestrian Area (PA).
Figure 3.
Fitted curves of data points presenting the envelope of SSIM-achieved bitrate curves for video sequences: (a) Chimera 1102347 (C47); (b) Pedestrian Area (PA).

Figure 4.
Fitted curves of data points presenting the envelope of SSIM-achieved bitrate curves for video sequences: (a) Skateboarding (SK); (b) El Fuente Mask (EM).
Figure 4.
Fitted curves of data points presenting the envelope of SSIM-achieved bitrate curves for video sequences: (a) Skateboarding (SK); (b) El Fuente Mask (EM).

Figure 5.
SSIMenv–bitrate curves for all sequences used for modeling.

Figure 6.
Fitted curves of data points presenting the functional relationship (a) coefficient A and SITI and (b) coefficient B and SITI.
Figure 6.
Fitted curves of data points presenting the functional relationship (a) coefficient A and SITI and (b) coefficient B and SITI.

Figure 7.
Bitrate- curves for C47 video sequence.

Figure 8.
Bitrate- curves for PA video sequence.

Figure 9.
Bitrate- curves for SK video sequence.

Figure 10.
Bitrate- curves for EM video sequence.

Figure 11.
Selection of optimal representations diagram.


Table 1.
Spatial (SI) and temporal information (TI) of video sequences used for modeling and testing purposes.
Table 1.
Spatial (SI) and temporal information (TI) of video sequences used for modeling and testing purposes.
| Video Sequence | SI | TI | SITI |
|---|---|---|---|
| Chimera 1102353 (C53) | 13.63 | 5.51 | 75.07 |
| Meridian Conversation (MC) | 28.39 | 3.10 | 87.86 |
| Chimera 1102347 (C47) | 43.12 | 5.06 | 218.36 |
| Station 2 (S2) | 32.72 | 7.50 | 245.40 |
| Pedestrian Area (PA) | 32.32 | 15.47 | 500.11 |
| Skateboarding (SK) | 26.72 | 20.23 | 540.48 |
| Grand Theft Auto (GTA) | 47.63 | 18.09 | 861.65 |
| Tears Of Steel Robot (TSR) | 44.78 | 22.22 | 995.02 |
| El Fuente Mask (EM) | 54.92 | 24.71 | 1357.14 |
| Soccer (SO) | 79.06 | 24.71 | 1953.52 |
| BlueSky (BS) | 78.64 | 33.41 | 2627.31 |
| Big Buck Bunny (BBB) | 31.84 | 7.22 | 229.88 |
| Elephants Dream (ED) | 50.93 | 8.75 | 445.64 |
| Tractor (TR) | 34.99 | 18.83 | 658.69 |
Table 2.
Selected encoding parameters.
| Parameter Name | Value |
|---|---|
| Preset | Slow |
| Adaptive keyframe decision | Disabled |
| The maximum rate of the video buffering verifier | Double value of the bitrate |
| Buffer size of the video buffering verifier | Quadruple value of the bitrate |
| Constant Rate Factor (CRF) | 23 |
| Number of passes | 1 |
| Quantizer curve compression | 0.6 |
| Encoding | Context-adaptive binary arithmetic coding (CABAC) |
Table 3.
Values of A and B coefficients for every video sequence used in the modeling process. PLCC values present the correlation between the fitted curves and the measured values.
Table 3.
Values of A and B coefficients for every video sequence used in the modeling process. PLCC values present the correlation between the fitted curves and the measured values.
| Video Sequence | A | B | PLCC |
|---|---|---|---|
| C53 | 0.0043 | 0.939 | 0.9095 |
| MC | 0.007 | 0.9299 | 0.859 |
| C47 | 0.0162 | 0.8533 | 0.8903 |
| S2 | 0.0428 | 0.6141 | 0.9515 |
| PA | 0.0402 | 0.6359 | 0.9748 |
| SK | 0.0168 | 0.8213 | 0.9937 |
| GTA | 0.0419 | 0.5239 | 0.9955 |
| TSR | 0.0394 | 0.6234 | 0.9943 |
| EM | 0.0588 | 0.4789 | 0.9732 |
| SO | 0.0741 | 0.3265 | 0.994 |
| BS | 0.0565 | 0.5014 | 0.9496 |
Table 4.
Values of X and Y coefficients that resulted from fitting the values of A, B, and SITI. PLCC values present the correlation between the fitted curves and the measured values.
Table 4.
Values of X and Y coefficients that resulted from fitting the values of A, B, and SITI. PLCC values present the correlation between the fitted curves and the measured values.
| Coefficient | X | Y | PLCC |
|---|---|---|---|
| A | 0.0165 | −0.0668 | 0.8715 |
| B | −0.1485 | 15.843 | 0.8789 |
Table 5.
Comparison between the measured SSIM and SSIMenv values for video sequences used in modeling (C53, MC, C47, S2, PA, SK, GTA, TSR, EM SO and BS) as well as for video sequences not used in the modeling process (BBB, ED and TR).
Table 5.
Comparison between the measured SSIM and SSIMenv values for video sequences used in modeling (C53, MC, C47, S2, PA, SK, GTA, TSR, EM SO and BS) as well as for video sequences not used in the modeling process (BBB, ED and TR).
| Video Sequences Used in Modeling | Video Sequences Not Used in Modeling | ||
|---|---|---|---|
| Mean difference | 0.0343 | Mean difference | 0.0448 |
| Mean difference (%) | 4.2832 | Mean difference (%) | 5.8393 |
| RMSE | 0.0428 | RMSE | 0.0594 |
| PLCC | 0.9188 | PLCC | 0.9377 |
Table 6.
Values of and coefficients used to describe the functional relationship between the bitrate and values for every video sequence used in the modeling process, as well as for BBB.
Table 6.
Values of and coefficients used to describe the functional relationship between the bitrate and values for every video sequence used in the modeling process, as well as for BBB.
| Video Sequence | ||
|---|---|---|
| C53 | 0.8946 | |
| MC | 0.5658 | |
| C47 | 0.00036 | 0.1835 |
| S2 | 0.0014 | 0.1691 |
| PA | 0.1818 | 0.1163 |
| SK | 0.2579 | 0.1125 |
| GTA | 1.7773 | 0.0887 |
| TSR | 1.8674 | 0.0913 |
| EM | 3.7564 | 0.0839 |
| SO | 7.1434 | 0.0772 |
| BS | 10.7114 | 0.0731 |
| BBB | 0.00067 | 0.1768 |
Table 7.
Parameters for representation sets for the BBB video sequence from [12] and for the proposed segmentation.
Table 7.
Parameters for representation sets for the BBB video sequence from [12] and for the proposed segmentation.
| Segmentation [12] | Proposed Segmentation | |||
|---|---|---|---|---|
| Spatial Resolution | Target Coding Bitrate (kbps) | Spatial Resolution | Target Coding Bitrate (kbps) | |
| 20 × 240 | 50 | 320 × 240 | 50 | 63 |
| 320 × 240 | 100 | 480 × 360 | 70 | 65 |
| 320 × 240 | 150 | 480 × 360 | 100 | 67 |
| 480 × 360 | 200 | 480 × 360 | 150 | 69 |
| 480 × 360 | 250 | 854 × 480 | 250 | 71 |
| 480 × 360 | 300 | 854 × 480 | 350 | 73 |
| 480 × 360 | 400 | 854 × 480 | 500 | 75 |
| 480 × 360 | 500 | 1280 × 720 | 700 | 77 |
| 854 × 480 | 600 | 1280 × 720 | 950 | 79 |
| 854 × 480 | 700 | 1920 × 1080 | 1500 | 81 |
| 1280 × 720 | 900 | 1920 × 1080 | 2000 | 83 |
| 1280 × 720 | 1200 | 1920 × 1080 | 3000 | 85 |
| 1280 × 720 | 1500 | 1920 × 1080 | 4000 | 87 |
| 1280 × 720 | 2000 | 1920 × 1080 | 5500 | 89 |
| 1920 × 1080 | 2500 | 1920 × 1080 | 7500 | 91 |
| 1920 × 1080 | 3000 | 1920 × 1080 | 10,500 | 93 |
| 1920 × 1080 | 4000 | - | - | - |
| 1920 × 1080 | 5000 | - | - | - |
| 1920 × 1080 | 6000 | - | - | - |
| 1920 × 1080 | 8000 | - | - | - |
Table 8.
SSIM values obtained using the SARA and BBA adaptive streaming algorithms, two network test cases while BBB was segmented using the segmentation available in [12] and the proposed segmentation.
Table 8.
SSIM values obtained using the SARA and BBA adaptive streaming algorithms, two network test cases while BBB was segmented using the segmentation available in [12] and the proposed segmentation.
| Segment Duration | |||||
|---|---|---|---|---|---|
| Test case | Algorithm | 2 | 6 | 10 | |
| Segmentation [12] | CASE 1 | SARA | 0.953 | 0.942 | 0.942 |
| BAA | 0.927 | 0.933 | 0.933 | ||
| CASE 2 | SARA | 0.902 | 0.897 | 0.913 | |
| BAA | 0.908 | 0.908 | 0.915 | ||
| Test case | Algorithm | 2 | 6 | 10 | |
| Proposed segmentation | CASE 1 | SARA | 0.962 | 0.948 | 0.937 |
| BAA | 0.965 | 0.950 | 0.937 | ||
| CASE 2 | SARA | 0.934 | 0.935 | 0.929 | |
| BAA | 0.953 | 0.943 | 0.929 | ||
Table 9.
MOS values obtained using the SARA and BBA adaptive streaming algorithms, two network test cases while BBB was segmented using the segmentation available in [12] and the proposed segmentation.
Table 9.
MOS values obtained using the SARA and BBA adaptive streaming algorithms, two network test cases while BBB was segmented using the segmentation available in [12] and the proposed segmentation.
| Segment Duration | |||||
|---|---|---|---|---|---|
| Test Case | Algorithm | 2 | 6 | 10 | |
| Segmentation [12] | CASE 1 | SARA | 4.46 | 3.38 | 3.35 |
| BAA | 4.27 | 3.15 | 3.31 | ||
| CASE 2 | SARA | 3.12 | 3.08 | 3.42 | |
| BAA | 3.69 | 3.12 | 3.54 | ||
| Test case | Algorithm | 2 | 6 | 10 | |
| Proposed Segmentation | CASE 1 | SARA | 4.77 | 3.77 | 3.15 |
| BAA | 4.62 | 3.54 | 3.46 | ||
| CASE 2 | SARA | 4.00 | 3.42 | 3.27 | |
| BAA | 4.31 | 3.46 | 3.62 | ||
Publisher’s Note: MDPI stays neutral with regard to jurisdictional claims in published maps and institutional affiliations. |
© 2021 by the authors. Licensee MDPI, Basel, Switzerland. This article is an open access article distributed under the terms and conditions of the Creative Commons Attribution (CC BY) license (https://creativecommons.org/licenses/by/4.0/).
Share and Cite
MDPI and ACS Style
Vlaović, J.; Rimac-Drlje, S.; Žagar, D. Content Dependent Representation Selection Model for Systems Based on MPEG DASH. Electronics 2021, 10, 1843. https://0-doi-org.brum.beds.ac.uk/10.3390/electronics10151843
AMA Style
Vlaović J, Rimac-Drlje S, Žagar D. Content Dependent Representation Selection Model for Systems Based on MPEG DASH. Electronics. 2021; 10(15):1843. https://0-doi-org.brum.beds.ac.uk/10.3390/electronics10151843
Chicago/Turabian StyleVlaović, Jelena, Snježana Rimac-Drlje, and Drago Žagar. 2021. "Content Dependent Representation Selection Model for Systems Based on MPEG DASH" Electronics 10, no. 15: 1843. https://0-doi-org.brum.beds.ac.uk/10.3390/electronics10151843
Note that from the first issue of 2016, this journal uses article numbers instead of page numbers. See further details here.