1. Introduction
Identifying the potential cybersecurity threat capability in real-time is a crucial activity. It helps provide practical information about the threat in a network that allows cybersecurity practitioners to take suitable action to mitigate the risk in a network [
1]. Elaborating all the information about the potential cybersecurity threats of an organisation is typically achieved manually by the existing models and methodology. Threat assessment is implemented in an automated manner with the help of machine learning techniques and various real-time models [
2]. The behaviours of threat agents are erratic, and the goals of threat agents change with time. Threat agent groups change their behaviour to penetrate a network based on motivation, opportunity, and capability [
3,
4]. The motivation of the threat agent constantly changes with time depends on the financial gain, revenge from an organisation, etc., and the type of environment targeted. Profiling is a process that generates a profile for the threat agents based on the historical information extracted from the Packet Capture Application Programming Interface (PCAP) files captured in a network with the help of penetration testing phases. The profile can be populated by having suitable, ample, and precise information about the threat agent like behaviour, source I.P. address, destination I.P. address, number of open ports, number of packets generated, location of the threat agent, and time spent on the network with minimal user intervention [
5]. The user has minimal intervention because of the footprints captured by the capturing data tool like LibPcap, WinPcap, PCAPng, NPcap, etc., during threat assessment in the form of PCAP files that cannot be altered by the potential threat agent while traversing an organisation’s network. The threat agent cannot alter because once they generate the packets in the network, they cannot erase the footprint of generating the packets because of the accessing property of the network. This research attempts to recognise the aspects of profiling and deliver solutions by implementing the profiling of threat agents. Threat profiling is an essential aspect of performing threat assessment for an organisation. Suppose we have the threat profile for the historically identified threat agents from the network of an organisation. In that case, we can use these profiles as references while executing the threat assessment for the situational awareness data captured from the network. The model can address the recent threat agent effectively identified from a network with optimised complexity.
It has been accepted that continuous threat assessments practice mitigate the risks for any organisation and business [
6]. However, in the modern, socially driven, virtual computing era, threat assessments are hindered by a lack of resources, complexity, and data size [
7]. Information Environments are large heterogeneous infrastructures, hosting a large amount of data collected from different types of sensors and platforms [
8]. To cope with a large amount of data, decision aid tools should understand the situational awareness property of data and threat assessments required for an organisation. University computer emergency response team (CMU-CERT) groups determined three critical groups of threat agents, i.e., the technology of organisation sabotage, compromising with intellectual property, and data stream fraud [
9]. The number of growing cases highlighted by internet media in recent years revealed that both business organisations and government organisations suffered a similar experience. In contrast, the priority information has been filtrated by the organisation’s internal users and shared with the threat agents [
10]. The threat agents require serious attention from both users and organisations.
Referencing to the COVID-19 pandemic nowadays, organisations and businesses share their file and documents frequently with the help of the internet to run their business. It is now standard practice for users of the organisation to have admittance to large repository documents which are electronically warehoused on distributed file servers. Many organisations offer company laptops and desktops to the users for work while using e-mail to organise and schedule/rescheduling meetings. Amenities such as video conferencing are repeatedly used for holding meetings throughout the world, and users of an organisation are continuously connected to the internet. The electronic nature of the files and records of an organisation on the internet makes it easier for the threat agents to attack the organisation. On the advantageous side of continuous threat assessment, an organisation can easily capture the activity logs of the internal threat agent while analysing their captured packets [
11]. However, practically analysing such activity logs is infeasible due to the high volume of activities performed by the user every day.
In this work, we present an efficient model for threat detection and analysis based on the conception of anomaly detection. The proposed model implements the threat agent profiles from the PCAP files and determines the cyber threat intelligence based on evaluating motivation, opportunity, and capability of threats. With the help of these profiles, comparisons can be populated that show the current observations fluctuate from the previous observations. To assess the performance of the tactic, we extracted the valuable information from the PCAP files in a semi-automated manner, and output has been generated in the form of an Excel sheet which consists of various attributes of threat agents identified in the next to the real-world information environment. The system executed expressively soundly for detecting the attacks, and the visualisation of reports enabled us to remember which attributes help determine M, O, C factors for the threat agents. This paper illustrates all the threats identified in a network captured during the penetration testing against the ESXi server of the University of Hertfordshire, UK.
The rest of this paper is as follows.
Section 2 discusses the related work.
Section 3 labels the necessities of analysis, the experimental set-up of the proposed system, and describes how to evaluate motivation, capability, and opportunity of threat agents.
Section 4 presents the actual results from practical experimentation of the system, and
Section 5 concludes this paper.
2. Related Work
The field of threat agents profiling and analysis of cyber threat intelligence has recently received ample attention. Researchers have proposed an assortment of different models and methodologies designed to detect or prevent attacks [
12,
13]. Likewise, Vidalis et al. [
8] briefly addresses the TAME (Threat Assessments Model For EPS) methodology for threat assessments in real-time informational environments and provides a high-level overview of its phases and process while performing threat assessments. They compare the TAME (Threat Assessments Model For EPS) methodology with other existing methods based on the number of parameters as sting, effectiveness, and understanding of information security from the threat. TAME is the upgraded version of METEORE 2000 for the micropayment system (MPS). In the initial phases, the authors analyse the number of methodologies like Alberts 1999, 2001, Baker 1998, Bayne 2002, Blyth 2003, Dimitrakos 2001, Forte 2000, Hancock 1998, Jones 2002, Nichols 2001, etc., and they found that all are working on the waterfall model principle, but such approach is not suitable for the Micro Payment System (MPS). So, they developed a new methodology i.e., TAME (Threat Assessments Model For EPS) which has ability to resolve the issues related to Micro Payment System (MPS). TAME (Threat Assessments Model For EPS) is working simultaneously in four phases named as:
- (a)
Scope of Assessments.
- (b)
Threat Agent and Vulnerability Analysis.
- (c)
Scenario Construction and System Modelling.
- (d)
Evaluation.
According to these phases, TAME determined how much security is required for a particular organisation and business of the system. All four stages are working simultaneously, and one input from a phase becomes the output of another degree. Similarly, the vice-versa of inputs and outputs are generated from the TAME, and it depends on the requirements of threat assessments. The authors conclude the TAME by using the assessor as an asset for better understanding and analysing an organisation’s systems.
Morakis et al. [
14] measure vulnerabilities and their exploitation cycle by various tools such as COPS, NESSUS, SYSTEM SCANNER, RETINA, NET RECON, WHISKER, and CYBER COB. In this work, the authors address a problem faced by a large amount of data in the informative environment is cyber-attacks. The authors propose a vulnerability tree analysis to address such issues faced by several organisations for a long time. They believe in constructing knowledge information concerning a specific domain in an object-oriented hierarchy tree and building a formal model to analyse them concerning possible scenarios of attacks faced by the computer systems. The primary purpose of this is to provide a depth classification of vulnerabilities, find why such attacks happened on a particular data/asset, and analyse footprints and scenarios of threat agents to exploit vulnerabilities. The main aim of the vulnerability tree analysis is to identify the attacks in the early stages and address them before severe damage to real-world informational systems. Here, the authors illustrate the various tools capable of analysing the vulnerability of complex organisational environments; such tools are COPS, NESSUS, SYSTEM SCANNER, RETINA, NET RECON, WHISKER, and CYBER COB, etc. However, these are not adequate in today’s modern electronic era of cyber-crime because they cannot address hazards like fault-tree analysis, checklists, event-tree analysis, cause-consequences analysis, etc. To cope with such hazards, the authors combine these tools of vulnerabilities tree analysis with object-oriented trees (O.O.) and adequately address such hazards concerning Boolean Mathematics.
Gerald L. et al. [
15] briefly explain about threat agents regarding how they can have unauthorised access to the computer systems of real-world informational environments and from where they got the motivation, capability, and opportunity to perform such damage in the networks systems. Here, they also illustrate the threat agents and their attributes, function, and impact on a network of informational systems. The authors also analyse the digital attacks that occured in 2002 in several countries. They identify that the threat agents of real-world informational environments consist of:
- (a)
Threat agent catalogue.
- (b)
Historical data.
- (c)
Technical report enterprises.
- (d)
Reports of business environments.
- (e)
Reports of physical environments.
- (f)
Recent knowledge/information.
- (g)
Current knowledge of stakeholders.
- (h)
Current knowledge of the staff.
- (i)
List of stakeholders.
The authors evaluate the capabilities, motivation, opportunities, and impact with the help of 3-dimension matrix mathematics. They assess each factor with the help of metrics and ESA (Empowered Small Agents) threat agents. They identify that because of threat agents in 2002, the European union’s worldwide economic damage is USD 35 million. So, as the damage cost is relatively more, the system security officer needs to require all knowledge and information about the threat agents or risk management to secure the system from damage done by cyber-attacks in informational environments.
Adetorera Sogbesan et al. [
16] developed a model to identify the MERIT (Management & Education of Risk of Insider Threat) based on the study of insider threat concerning the institute of CERT/USSS. This MERIT provides the facility to mitigate the insider threat of an organisation, and the key finding is to make the case study of individual threat agents, i.e., collision threat. MERIT models the case studies on the insider threat for an organisation, and based on that, threat assessments have been conducted to determine the impact of danger on the business. They also show some figures for losses based on studies done by USSS/CERT. They categorise the insider attack based on the ex-employee, or the financial gain of any vital position held by an employee in an organisation. Based on the number of organisations, 69% of companies measured stated data theft events (not external attacks). These threats were originated from inside the organisation. At the same time, a massive 91% of companies testified not having operative detection systems for recognising an insider threat. The MERIT model has a limitation/shortcoming in analysing compressive pattern analysis based on motivation and behavioural characteristics. The motivation factor of collusion attack is not able to be addressed by the MERIT model. This model is not able to explain the capability of an insider threat.
Casillo, M. et al.’s study [
17] “Embedded Intrusion Detection System for Detecting Attacks over CAN-BUS” designs a model based on AIC (availability, integrity, and confidentiality). The authors address the issues related to cyber-attacks on the automotive vehicle system. They introduce the automotive IDS embedded method for the CAN (controlled area network) BUS. Referencing the Bayesian network approaches, identifying malicious messages to the connected devices to the vehicles is accomplished. In this paper, the authors identify the snag for the IoT devices connected to automotive vehicles and their attacks while using automation. They suggest machine learning approaches, particularly the Bayesian network approach to cope with the cyber-attacks on the CAB bus. The authors used the CARLA simulator to provides the solution. The PYTHON library and several APIs were cast off for clustering the data and FPGA techniques for developing the model’s architecture.
Lombardi, M. et al.’s research [
18] “EIDS: Embedded intrusion detection system using machine learning to detect attack over the can-bus” introduced an IDS approach to identify the threats in the automated vehicles, particularly CAN (controlled area network) bus. The authors cast off the development of an IDS approach with the help of machine learning techniques through the Bayesian network approach to detect possible attacks on the CAN bus. The main benefit of developing an IDS approach was using the embedded framework for designing and determining the non-linear messages flow. The castigate faced by the connected IoT devices and the intelligent device for self-driving vehicles was identified with the help of an introduce IDS approach in the research.
These related works draw an intense observation that access to a real-world data stream is enormously challenging. Thus, researchers synthesise data into several groups based on the threat agents identified in a network. The existing model and methodology did threat assessment manually, due to which their complexity is exorbitant. This research predominantly wants to epitomise the volume and variety of data analysed in a modern real-world information environment and display how this could be pooled to form an overall threat assessment for each PCAP file. We also want to exhibit a wide range of threat scenarios as epitomised by our data collected from a real-world in a specific environment and show how our profiling and CTI system of threat agents would detect the different attacks based on the patterns identified.
3. Experiment Set-Up and Evaluation of MCO Attributes
The work described in this research has been carried out as part of a more comprehensive interdisciplinary project that includes computer security researchers and cyberpsychology experts. CTI data–driven threat agent profiling can be used for determining the motivation, opportunity, and capabilities attributes of threat agents under the context of a continuous threat assessment [
19]. The threat remains of budding apprehension to governments and businesses organisation, and it becomes an acute necessity for practical tools to help mitigate the threat posed. The modern risk assessment models recognise a need to perform several threat assessments to identify and analyse various threats in the contemporary information environment. If we conduct iterative threat assessment for the network, then with the help of designing the profiling prepared by practitioners, a new type of threat agents identified in situational awareness data will be addressed quickly. The continuous threat assessments help generate the paradox of warning to the cyber operations performed in the information environment. This paper identifies the research gap in semi-automated information environments, which consists of large heterogeneous infrastructures, hosting a large amount of data collected from different types of platforms or environments [
20]. The different types of platforms mean different kinds of environment and the conditions used by the threat agent to attack the particular network. To identify the solution for such a large amount of data, decision aid tools should understand situational awareness and critical intelligence feeds of the threats in real-time information environments.
In the modern knowledge-based, socially driven, virtual computing era, threat assessments are hindered by lack of resources, complexity, and data size. Information environments are large heterogeneous infrastructures, hosting a large amount of data collected from different platforms with the help of many tools. The purpose of the research paper is to introduce a novel approach that will enable us to take advantage of the vast amount of data collected by the large number of platforms designed to identify suspicious traffic, malicious intentions, and network attacks in an automated manner. State of the art on threat assessment models and methodologies will be considered in this project, while procedural and technology issues will be resolved by applying cyber analytics principles [
21].
3.1. Experimental Environment of the System
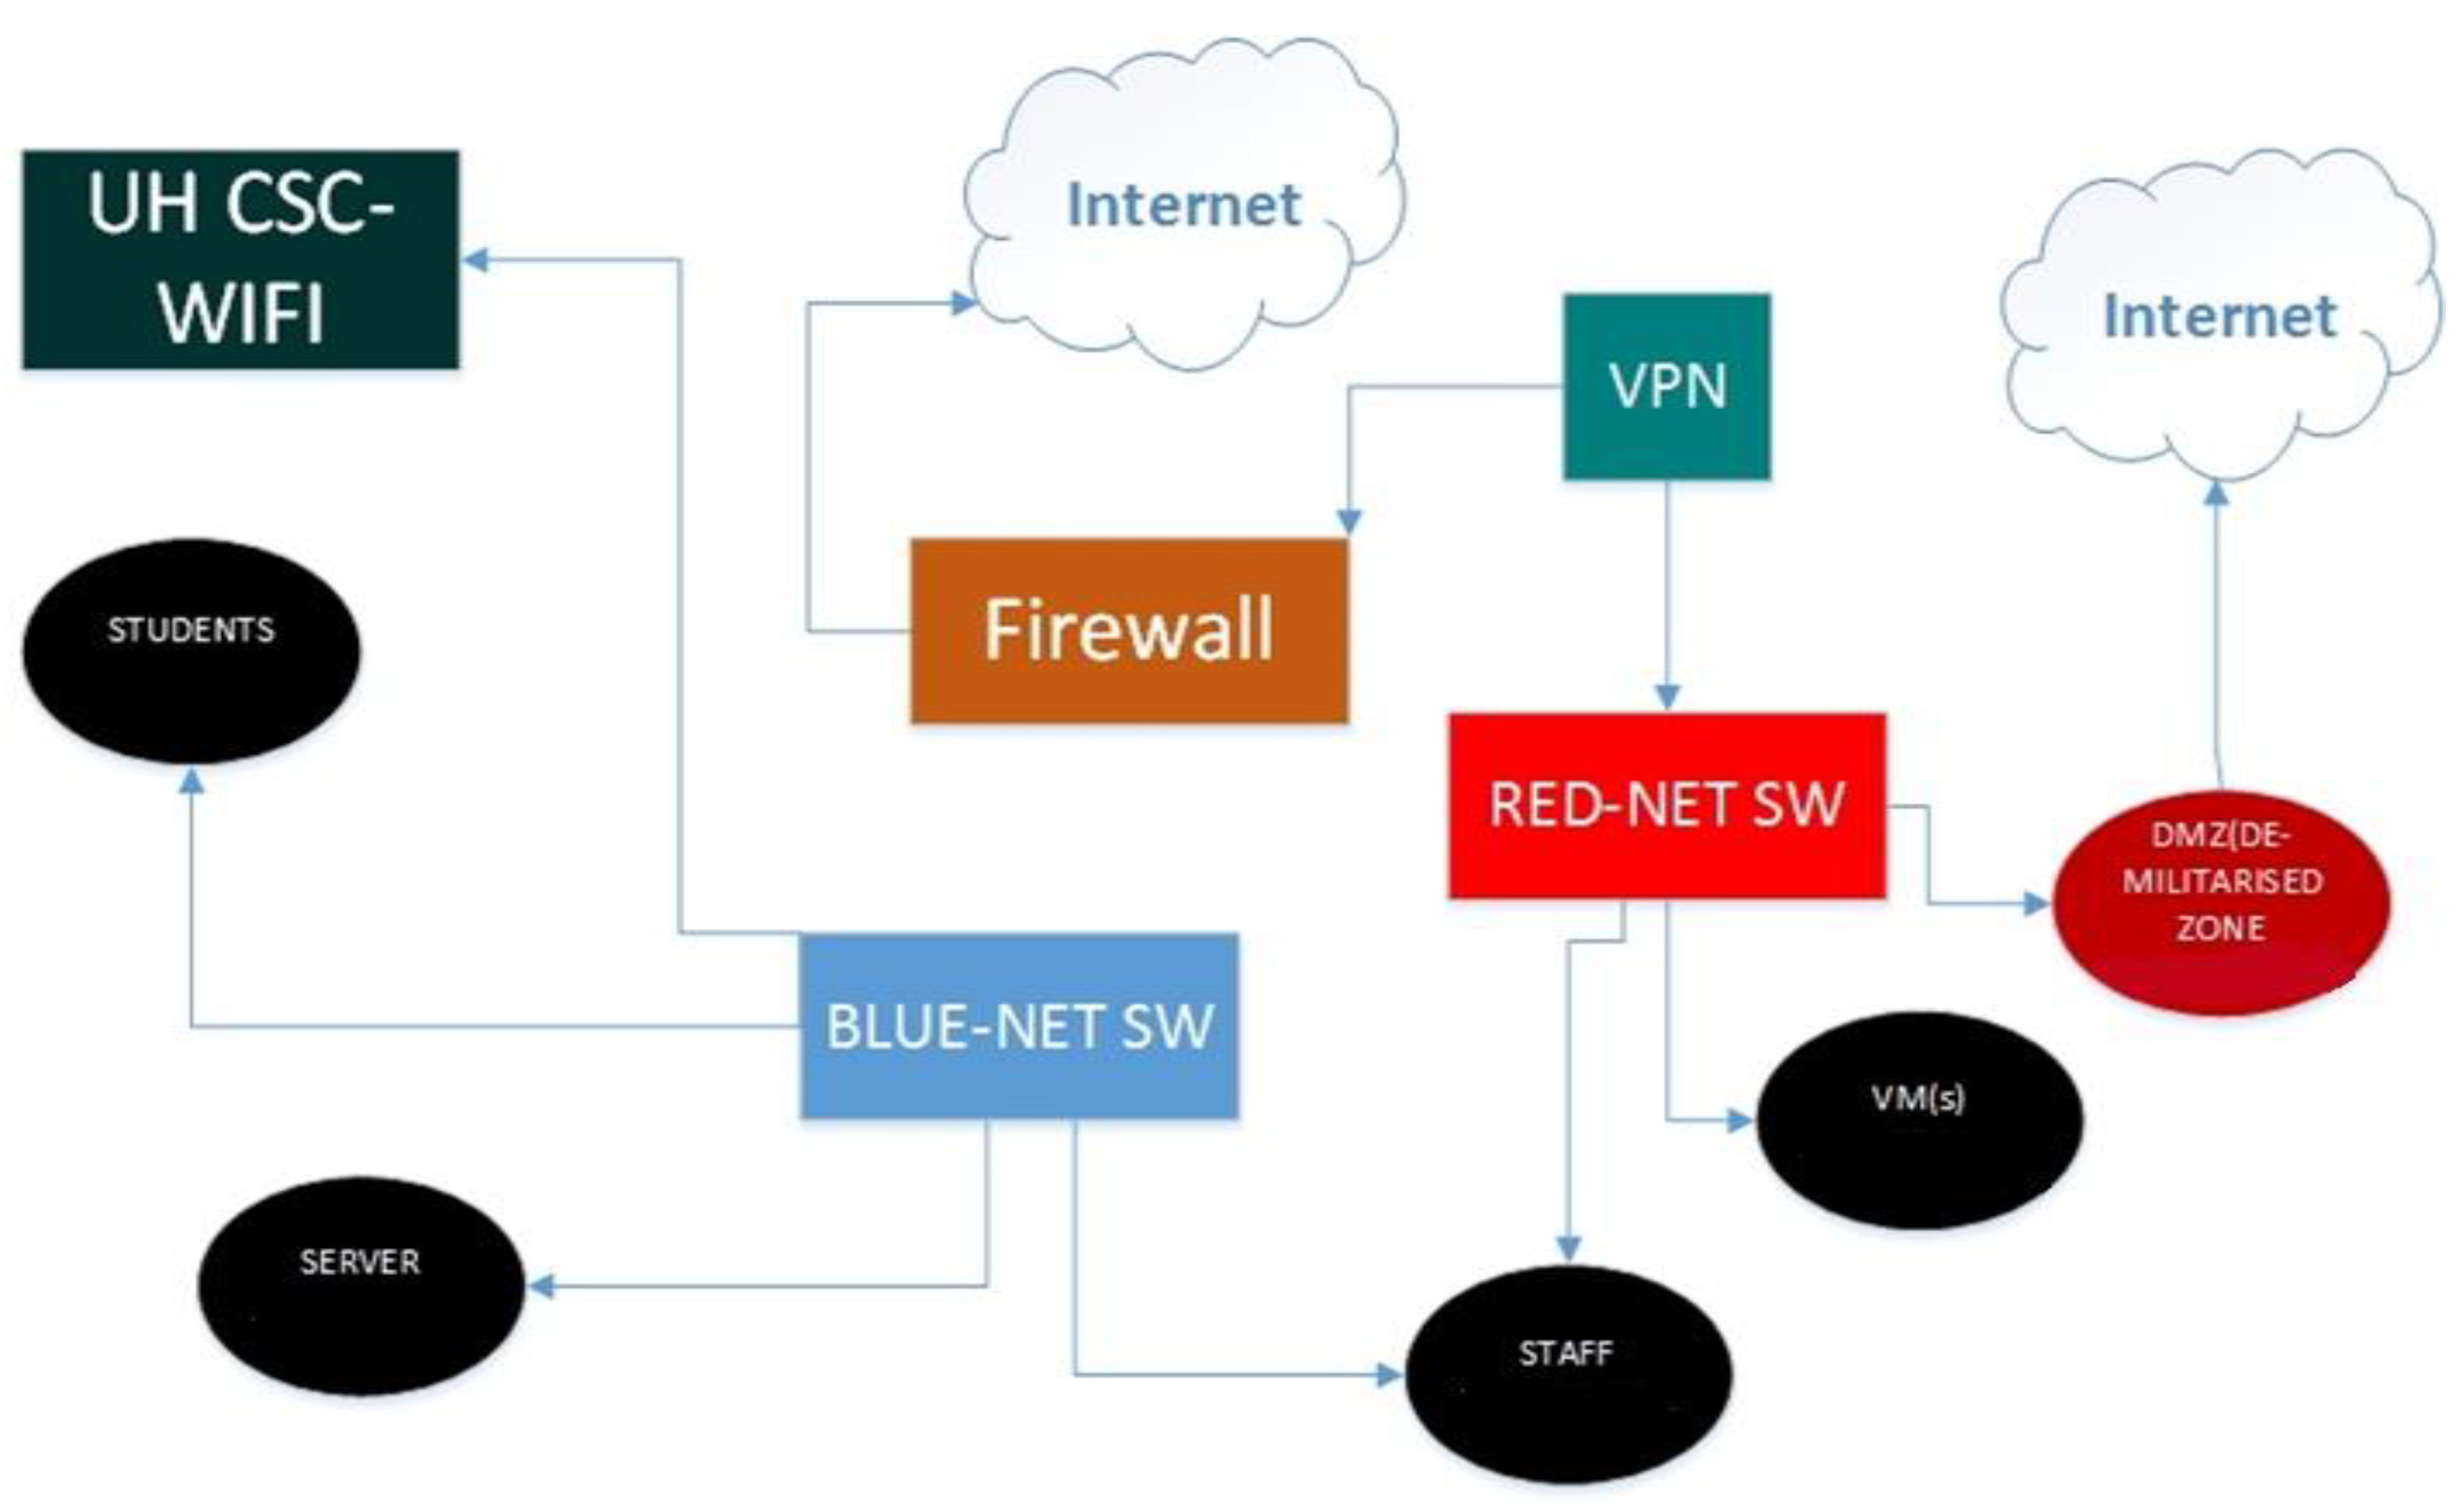
Figure 1 shows the testing set-up through which we execute the penetration testing against the specific condition of the platform or environment. The number of VPNs used to connect with the REDNET network and connect through the firewall saves the data from unauthorised access. Further, REDNET connects to DMZ (Demilitarized Zone), the number of V.M.s, and public I.P. of staff to control the activities. BLUENET connects to the user’s V.M.’s I.P.s, ESXi server, UH CSC WIFI (University of Hertfordshire Wi-Fi), and public I.P. of staff. In this environment, the PCAP files are collected from the server with the help of the Wireshark tool [
22]. Other tools like SolarWinds Deep Packet Inspection and Analysis, Paessler Packet Capture, ManageEngine NetFlow Analyzer, Omnipeek Network Protocol Analyzer, TCPdump, and WinDum, etc. are also available. Still, Wireshark is more efficient in extracting useful information from PCAP files and provides the advantage of saving the information in CSV formats.
Figure 1 shows the source of the attack I.P. address and the destination of the attack I.P. address through which penetration is executing on the network. The role of DMZ is to stop the hacker at the threshold point, and henceforth, no one is allowed to do access excluded the administrator of the server [
23]. The BLUENET refers to the internal security team that defends against real-world attackers. Red Teams of REDNET are internal/external entities dedicated to testing the effectiveness of a security program by emulating the tools and techniques of likely attackers in the most realistic way possible.
3.2. The Architecture of System
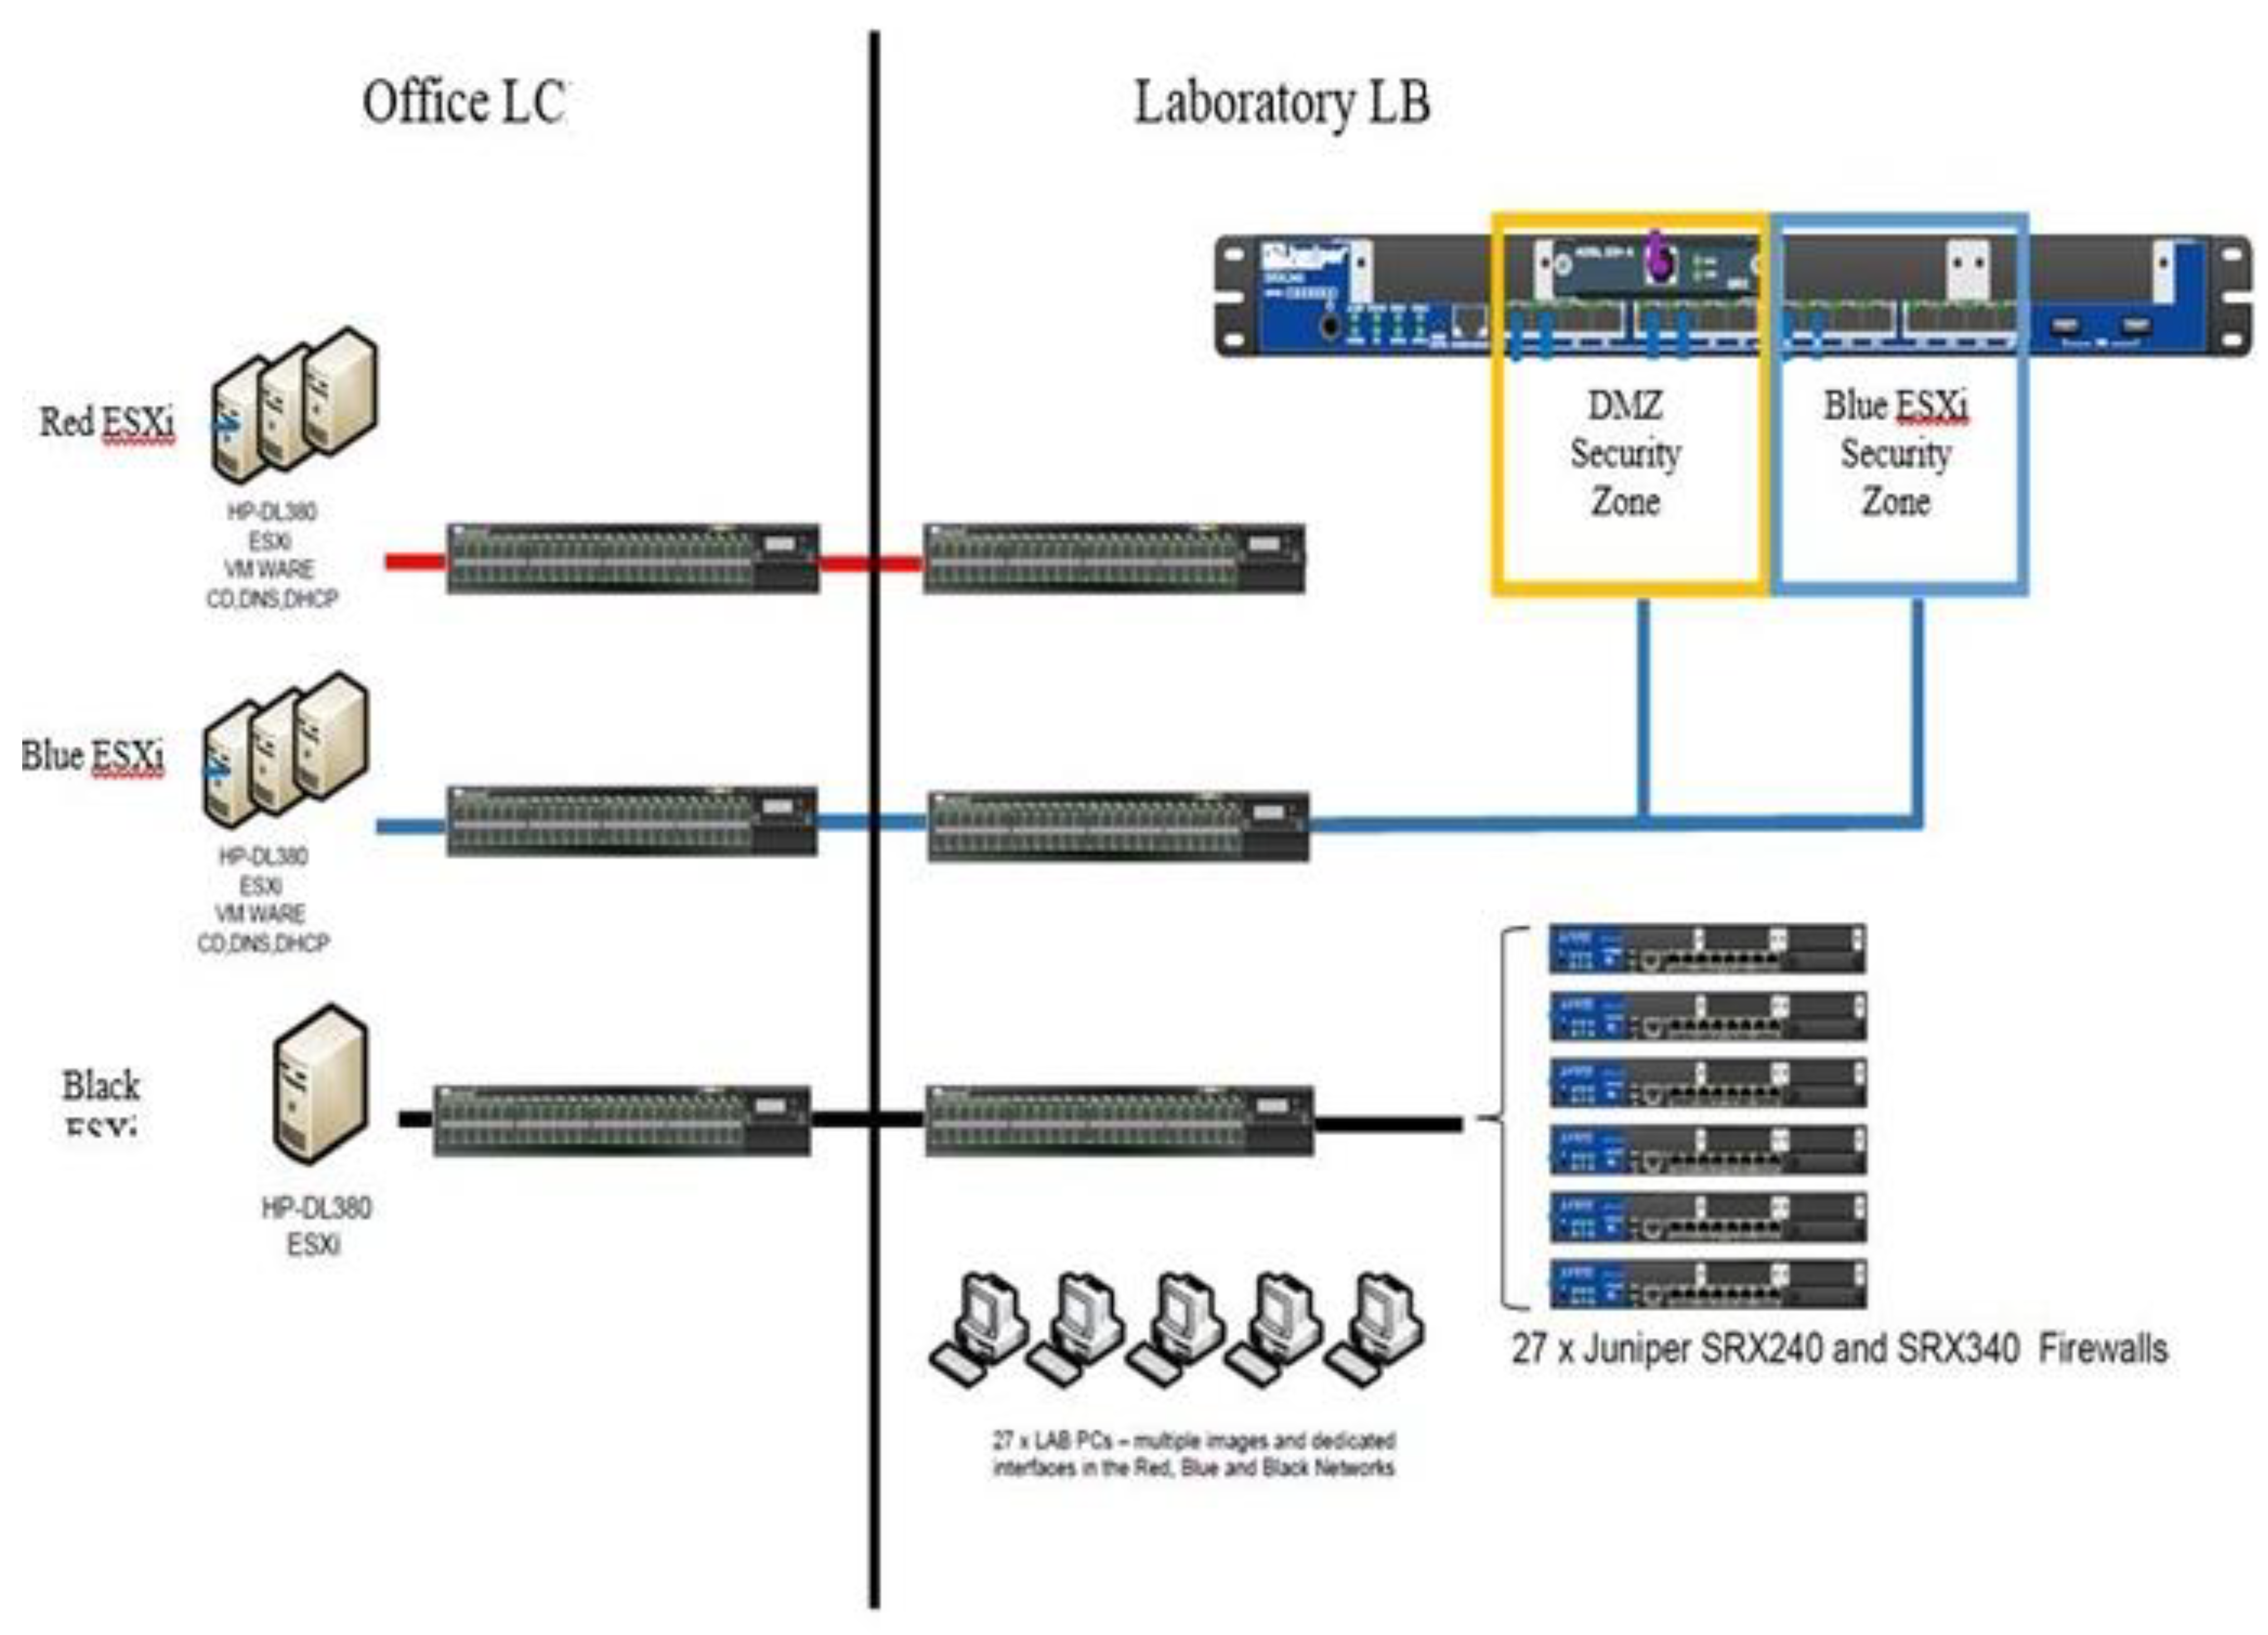
The primary purpose of
Figure 2 is to understand how the attacker groups generate traffic in the network, increase a delay time to upload the web page and extract useful information from the server such as user credentials, webpages I.P. addresses, and accessing the files from the databases. The architecture in
Figure 2 shows that the ESXi server consists of RED, BLUE, and BLACK NET HP-DL380 ESXi VM WARE CD, DNS, DHCP, which is further connected to the Blue ESXi security zone, and DMZ (Demilitarised Security Zone). In this server, all the data and information of the University of Hertfordshire are available, and a dedicated environment installed on V.M.s is available for the attackers. Black ESXi connected to 27 x juniper srx240 and srx340 firewalls via 27 x lab system multiple images of the environment and dedicated interface in red, blue, and black networks. DMZ’s role is to stop the hacker at the threshold point to control further damage by the attacker groups.
3.3. Evaluation of Motivation, Capability, and Opportunity
The threat assessment is a continuous process to collect the PCAP files from the network in an informative environment. The evaluation of the impact of threat agent groups on the organisation or the business, determining the value of assets, vulnerability identification, and threat agent’s footprint attributes play a prominent role in the calculation [
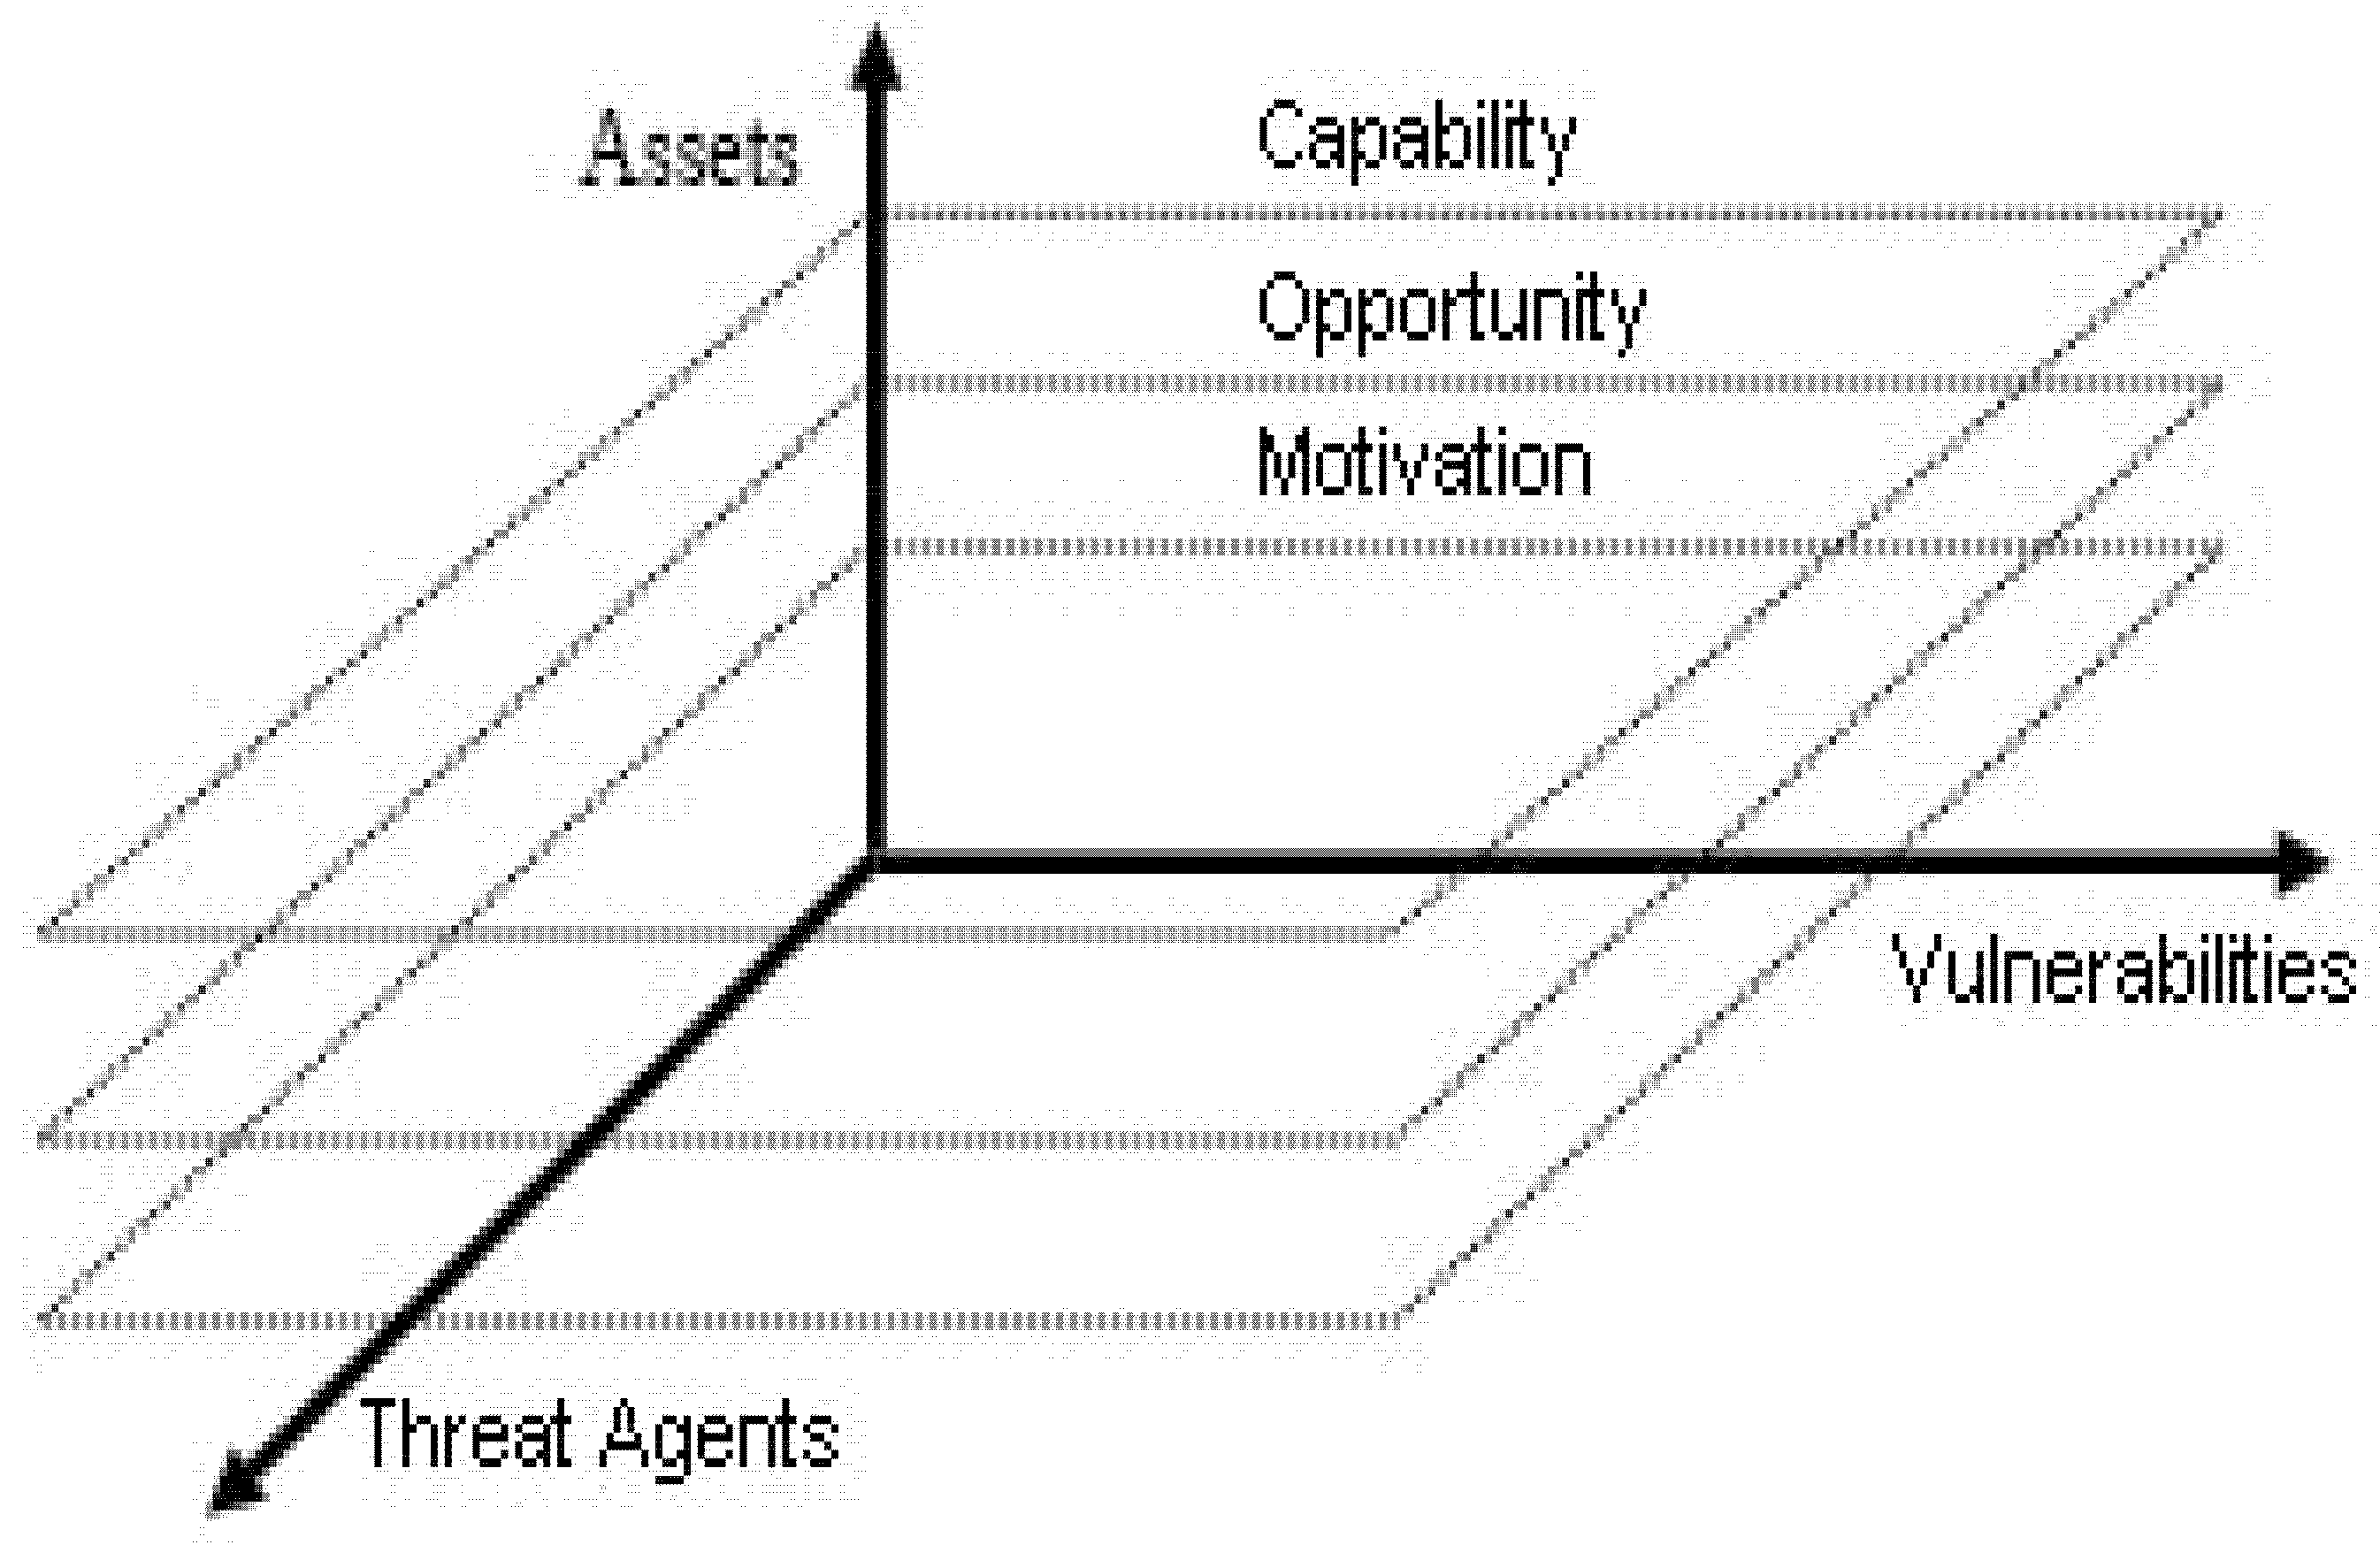
24]. In
Figure 3, the representation of main characteristics in a 3-dimensional matrix is shown, which needs to be addressed by the model while performing threat assessments of the real-time network.
A threat assessment is a statement of threats related to vulnerabilities of company assets and threat agents and a message of believed capabilities that those threat agents possess. In Equation (1), the function threat can be calculated with the help of the threat agent’s motivation, capability, opportunity, and the impact of the successful attacks on an organisation of the nation.
The threat can be evaluated in the above Equation (1) when the extracted attribute from the PCAP files is analysed. Then, based on the analysis of characteristics, motivation evaluation can be achieved. Similarly, when the model identifies the open port and the vulnerable ports from the extracted attributes, opportunity can be evaluated. In the same way, the model amalgamating all the information of motivation and opportunity leads to assess the capability and impact on the assets by the threats. So, the function (
f) can be evaluated using motivation, opportunity, capability, and impact of acquisitions.
From Equation (2), the function F(X) represents the threat assessment of the model for all the captured files, Cap stands for capabilities, Opp is an opportunity of the threat agent, Mto is motivation, (VIA) stands for the value of intangible assets, is for threat assessments, and stands for time complexity.
The threat assessment can be evaluated by amalgamating all results determined by the function for the motivation, opportunity, capability of threat agents, and value of intangible assets of environments. Similarly, vulnerability exploitation of assets concerning the CVE list available on the Nation Institute of standard and technology (NIST) database, the impact of threat agents on an organisation’s assets, and the time complexity to evaluate all the parameters of the threat agents can be assessed.
3.3.1. Motivation
The evaluation of motivation for threats is the problematic part. It could be determined with the help of analysis of hacktivism branded attacks by groups of assessment models and the network’s vulnerability in next to real-time semi-automated information environments. The motivations of attackers are constantly changing, and it could be noticed by the growing rate of hacktivism attacks by different groups of people. It can also see differences in unique motivations based on each group. Motivation is the degree to which a threat agent is prepared to implement a threat. The motivational factors are the elements that drive a threat agent to consider attacking a computer system. Some common motivations for threats include [
25]:
3.3.2. Capability
The capability of threats is determined by analysing risk assessment models and the network vulnerability in a next to real-time semi-automated information environment [
15].
In Equation (3), the risk of the threat agent can be evaluated by the combination of threats, the vulnerability identified for the threat concerning the CVE list of the NIST database and identified consequences of the threat agents.
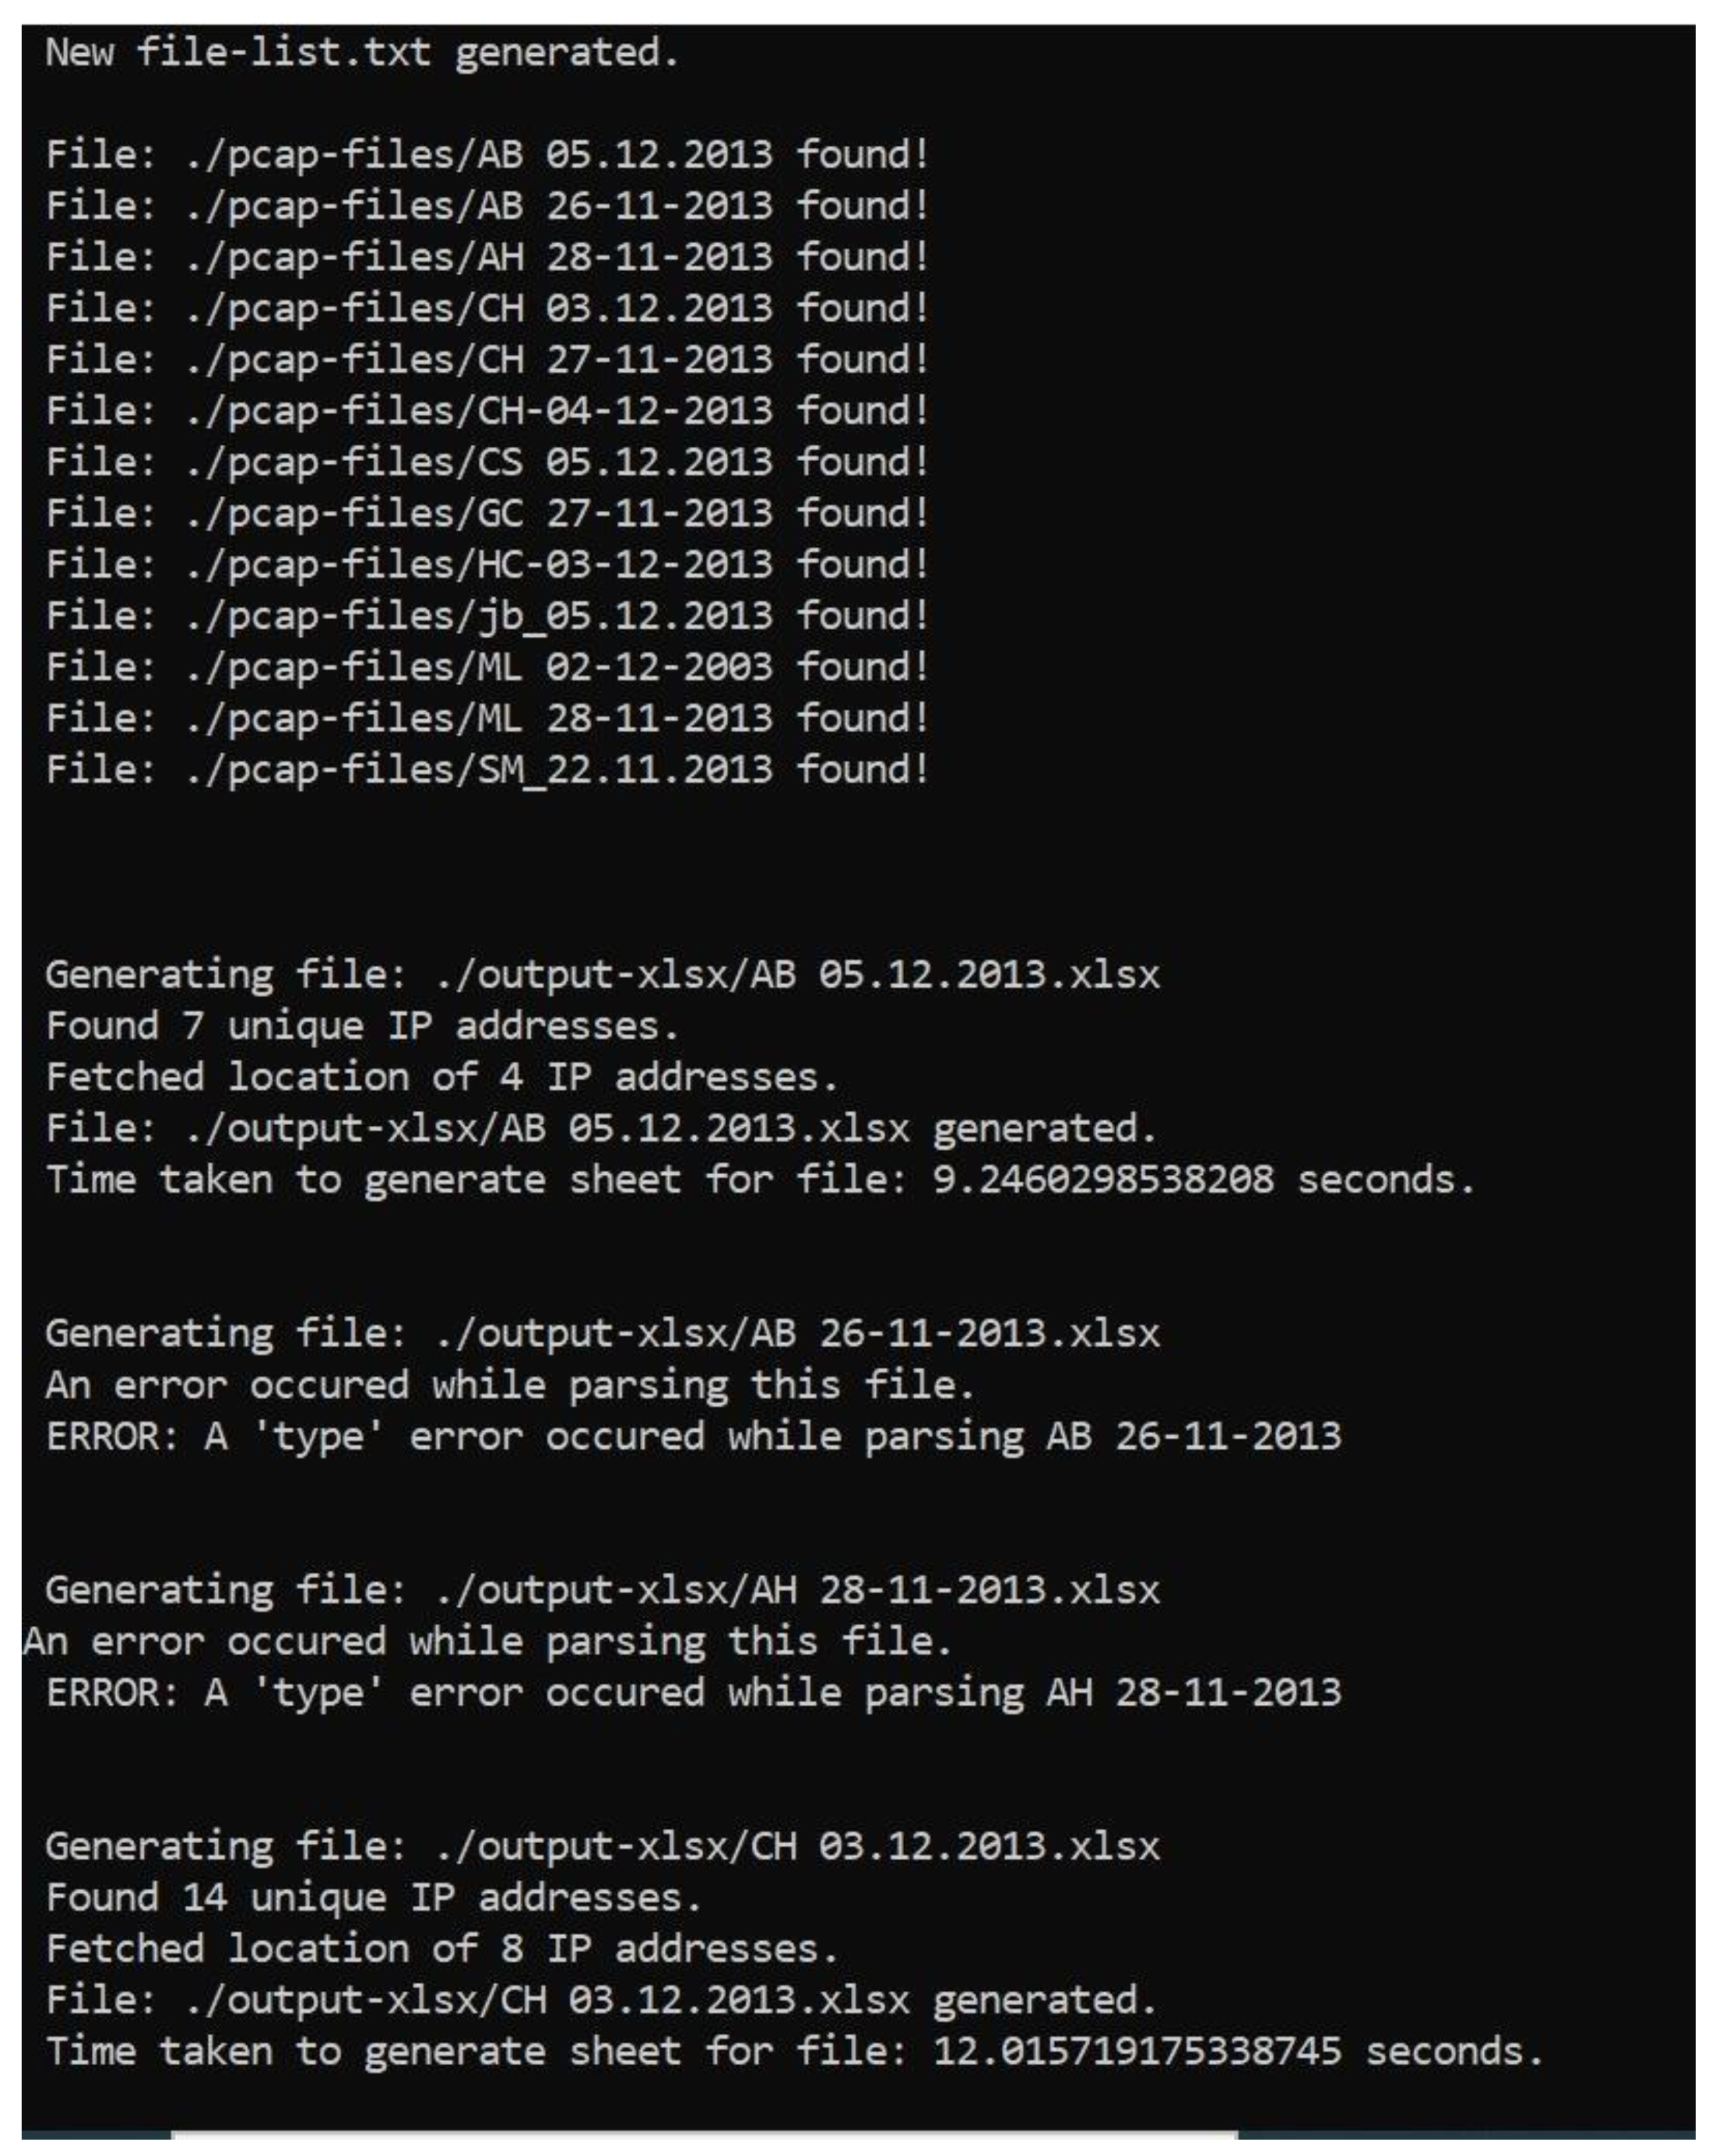
Similarly, in Equation (4), the capability of the threat will be evaluated by the multiplication of intention of the threat agents determined by the model and the overall capability of the threat agent. Further, vulnerability exploitation is achieved with the help of several kali Linux tools such as NESSUS, SAINTS, WHISKER, SARA, etc. The initial phase of the automatic version of the threat assessment model is collecting the DataStream/ PCAP files from the server, which has been achieved by the administration of the server between 2012 to 2019. This data mainly consists of PCAP files, which will be extracted in a semi-automatic manner with the help of a machine learning PYTHON tool library available on Tensorflow. The information extracted from these PCAP files having some unique attributes such as Time (in min), Highest Protocol, TCP protocol, Source I.P. Address, Destination I.P. Address, Source port, Destination port, Total Packet Length, City, Region, Country, Latitude, Longitude, and Internet Service Provider. The large number of PCAP files collected from the server will be converted into a large number of Excel sheets based on the unique attributes. These Excel sheets consist of all the valuable information available about the threat in the PCAP files, such as time spent on the network, location of their I.P.s, and environment used by them while penetrating the server.
A large amount of information about the threats can be profiled based on their activities performed on the network or specific environment or Protocol used to achieve their goal. We use all this information to extract all critical threat intelligence (CTI) from these threats to determine the threats’ capability, opportunity, and motivation. This CTI can also be used to identify the new threat in-network and extracted all information by taking previously identified CTI as a reference. As shown in
Figure 3, the motivation of these threat agent groups can be calculated based on the environment used by them, the type of activities executing during the process, factors responsible for digging information, and data from the server.
In the first phase of the model, an algorithm was executed against the PCAP files captured from the ESXi server and extracted the unique attributes from the PCAP files I.P. addresses, such as time (in min), Highest Protocol, TCP protocol, Source I.P. Address, Destination I.P. Address, Source port, Destination port, Total Packet Length, City, Region, Country, Latitude, Longitude, and Internet Service Provider. When the model has all this information about the attacker, the next phase model extracts the location of the threat agents from where they generate the traffic in the network. The model considers only those threat agents for location identification who have generated more than 1000 packets in the network. The model considers the threshold point based on the level of skill or knowledge the threat agent showing while traversing the network. Likewise, if considered less than 1000 packets generated I.P. address of threat agent, then the exploitation of vulnerable port is significantly less or can be ignorable. It is the primary reason for a semi-automatic model to provide the optimised time complexity for threat assessment of an organisation.
3.3.3. Opportunity
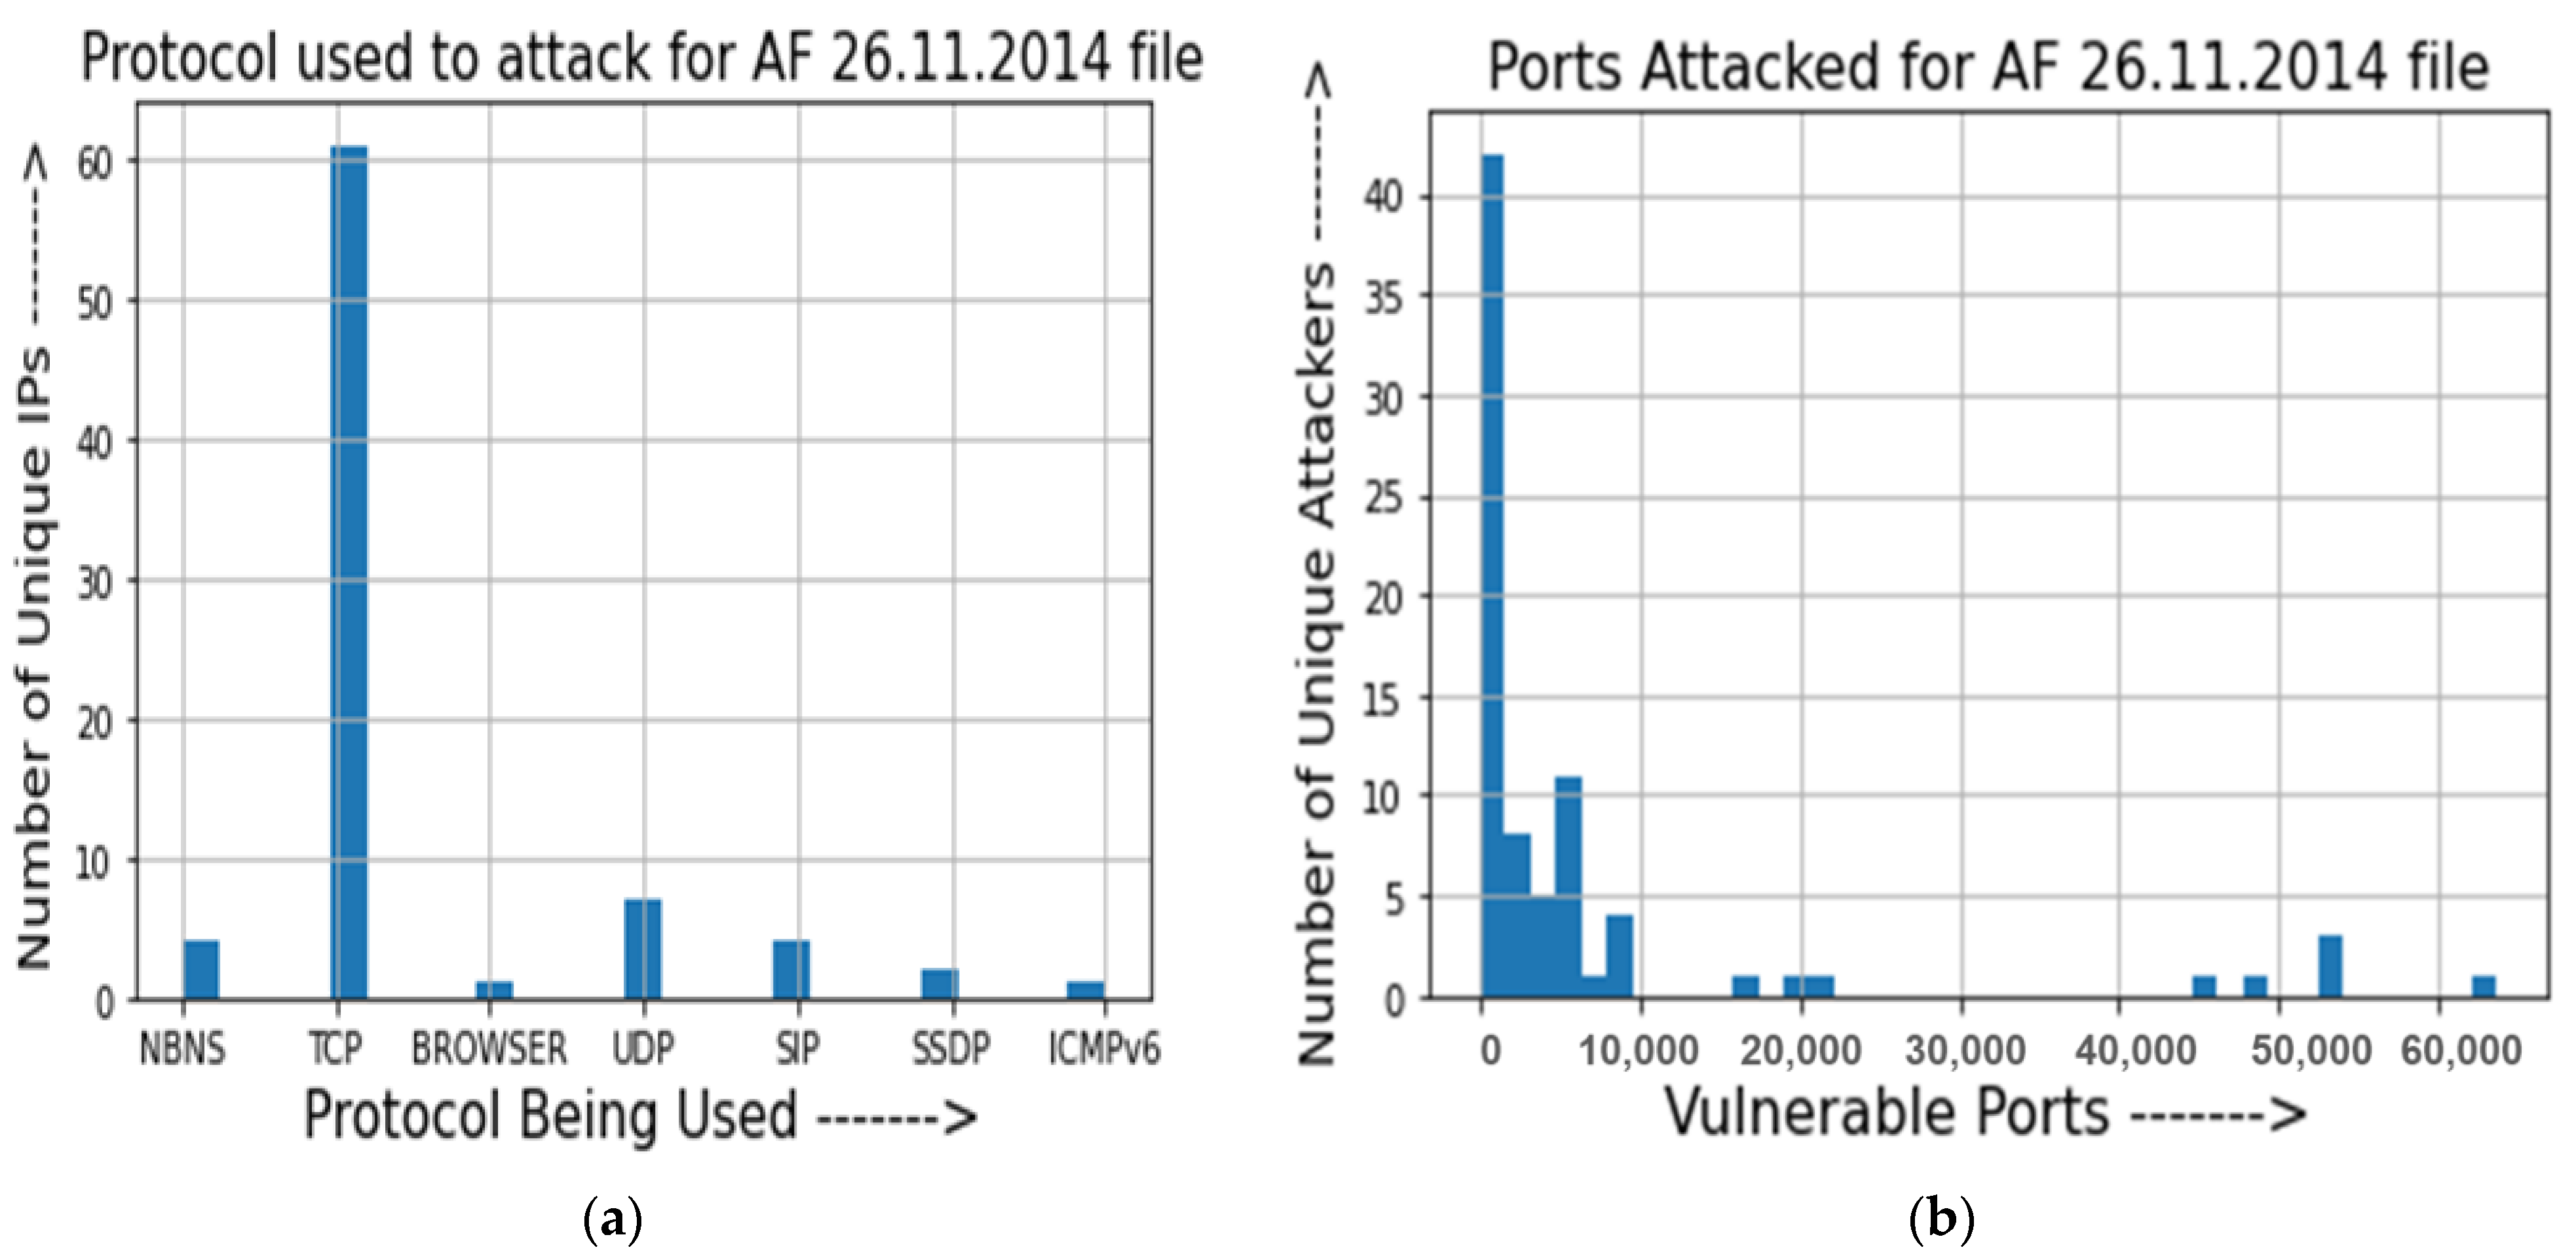
Similarly, opportunity can be calculated by identifying the number of open ports, the number of protocols that have unrestricted access and would be vulnerable, and what other factors help a hacker do unauthorised access to the server. The model will evaluate all this information by initialising the PCAP file captured by the model. The model will determine the open ports with the help of various tools like NMAP, NS-LOOKUP, DIPScan, etc. The combination of all the information about such attributes led to the evaluation of the opportunity of the threat agent groups.


