
Determination of Traffic Characteristics of Elastic Optical Networks Nodes with Reservation Mechanisms


1
Institute of Communication and Computer Networks, Faculty of Computing and Telecommunications, Poznan University of Technology, ul. Polanka 3, 60-965 Poznań, Poland
2
Institute of Microwave and Photonic Engineering, Faculty of Electrical and Information Engineering, Graz University of Technology, Inffeldgasse 12/I, A-8010 Graz, Austria
*
Author to whom correspondence should be addressed.
Electronics 2021, 10(15), 1853; https://0-doi-org.brum.beds.ac.uk/10.3390/electronics10151853
Submission received: 30 June 2021
/
Revised: 28 July 2021
/
Accepted: 29 July 2021
/
Published: 1 August 2021
(This article belongs to the Special Issue 10th Anniversary of Electronics: Advances in Networks)
Abstract
:With the ever-increasing demand for bandwidth, appropriate mechanisms that would provide reliable and optimum service level to designated or specified traffic classes during heavy traffic loads in networks are becoming particularly sought after. One of these mechanisms is the resource reservation mechanism, in which parts of the resources are available only to selected (pre-defined) services. While considering modern elastic optical networks (EONs) where advanced data transmission techniques are used, an attempt was made to develop a simulation program that would make it possible to determine the traffic characteristics of the nodes in EONs. This article discusses a simulation program that has the advantage of providing the possibility to determine the loss probability for individual service classes in the nodes of an EON where the resource reservation mechanism has been introduced. The initial assumption in the article is that a Clos optical switching network is used to construct the EON nodes. The results obtained with the simulator developed by the authors will allow the influence of the introduced reservation mechanism on the loss probability of calls of individual traffic classes that are offered to the system under consideration to be determined.
1. Introduction
The amount of data transmitted over backbone networks is on a continuous increase due to the growing variety and popularity of the services provided in networks of new generation. At present, the significant increase in traffic can be observed for on-line video meeting applications, video conferencing, voice transmission and video streaming [1]. This is caused by the increase in the number of users who make use of the Internet network to interact with others on a daily basis to work, educate and entertain. Each of the services executed in telecommunications networks requires different transmission rates to minimalise the phenomenon of bitrate mismatch between the data stream related to a specific service and the optical layer of the backbone network; it is necessary to appropriately allocate available spectral resources to these services. For this purpose, EONs are used, which have the propriety of elastic bandwidth and adaptive gap between channels [2], and the channel width can be changed dynamically according to the requirements of the transmission bitrate that is necessary for a given service to be executed in the network. This helps improve the spectral efficiency, diminish the wastage of the spectrum and is conducive to better use of spectral resources. As a result, depending on the required bitrate related to a given service class, an appropriate number of spectral units will be assigned. These units are called frequency slots [3]. Other contributing factors to the number of allocated frequency slot units (FSUs) include the modulation technique, distance and the quality of the connection path [3,4,5,6,7].
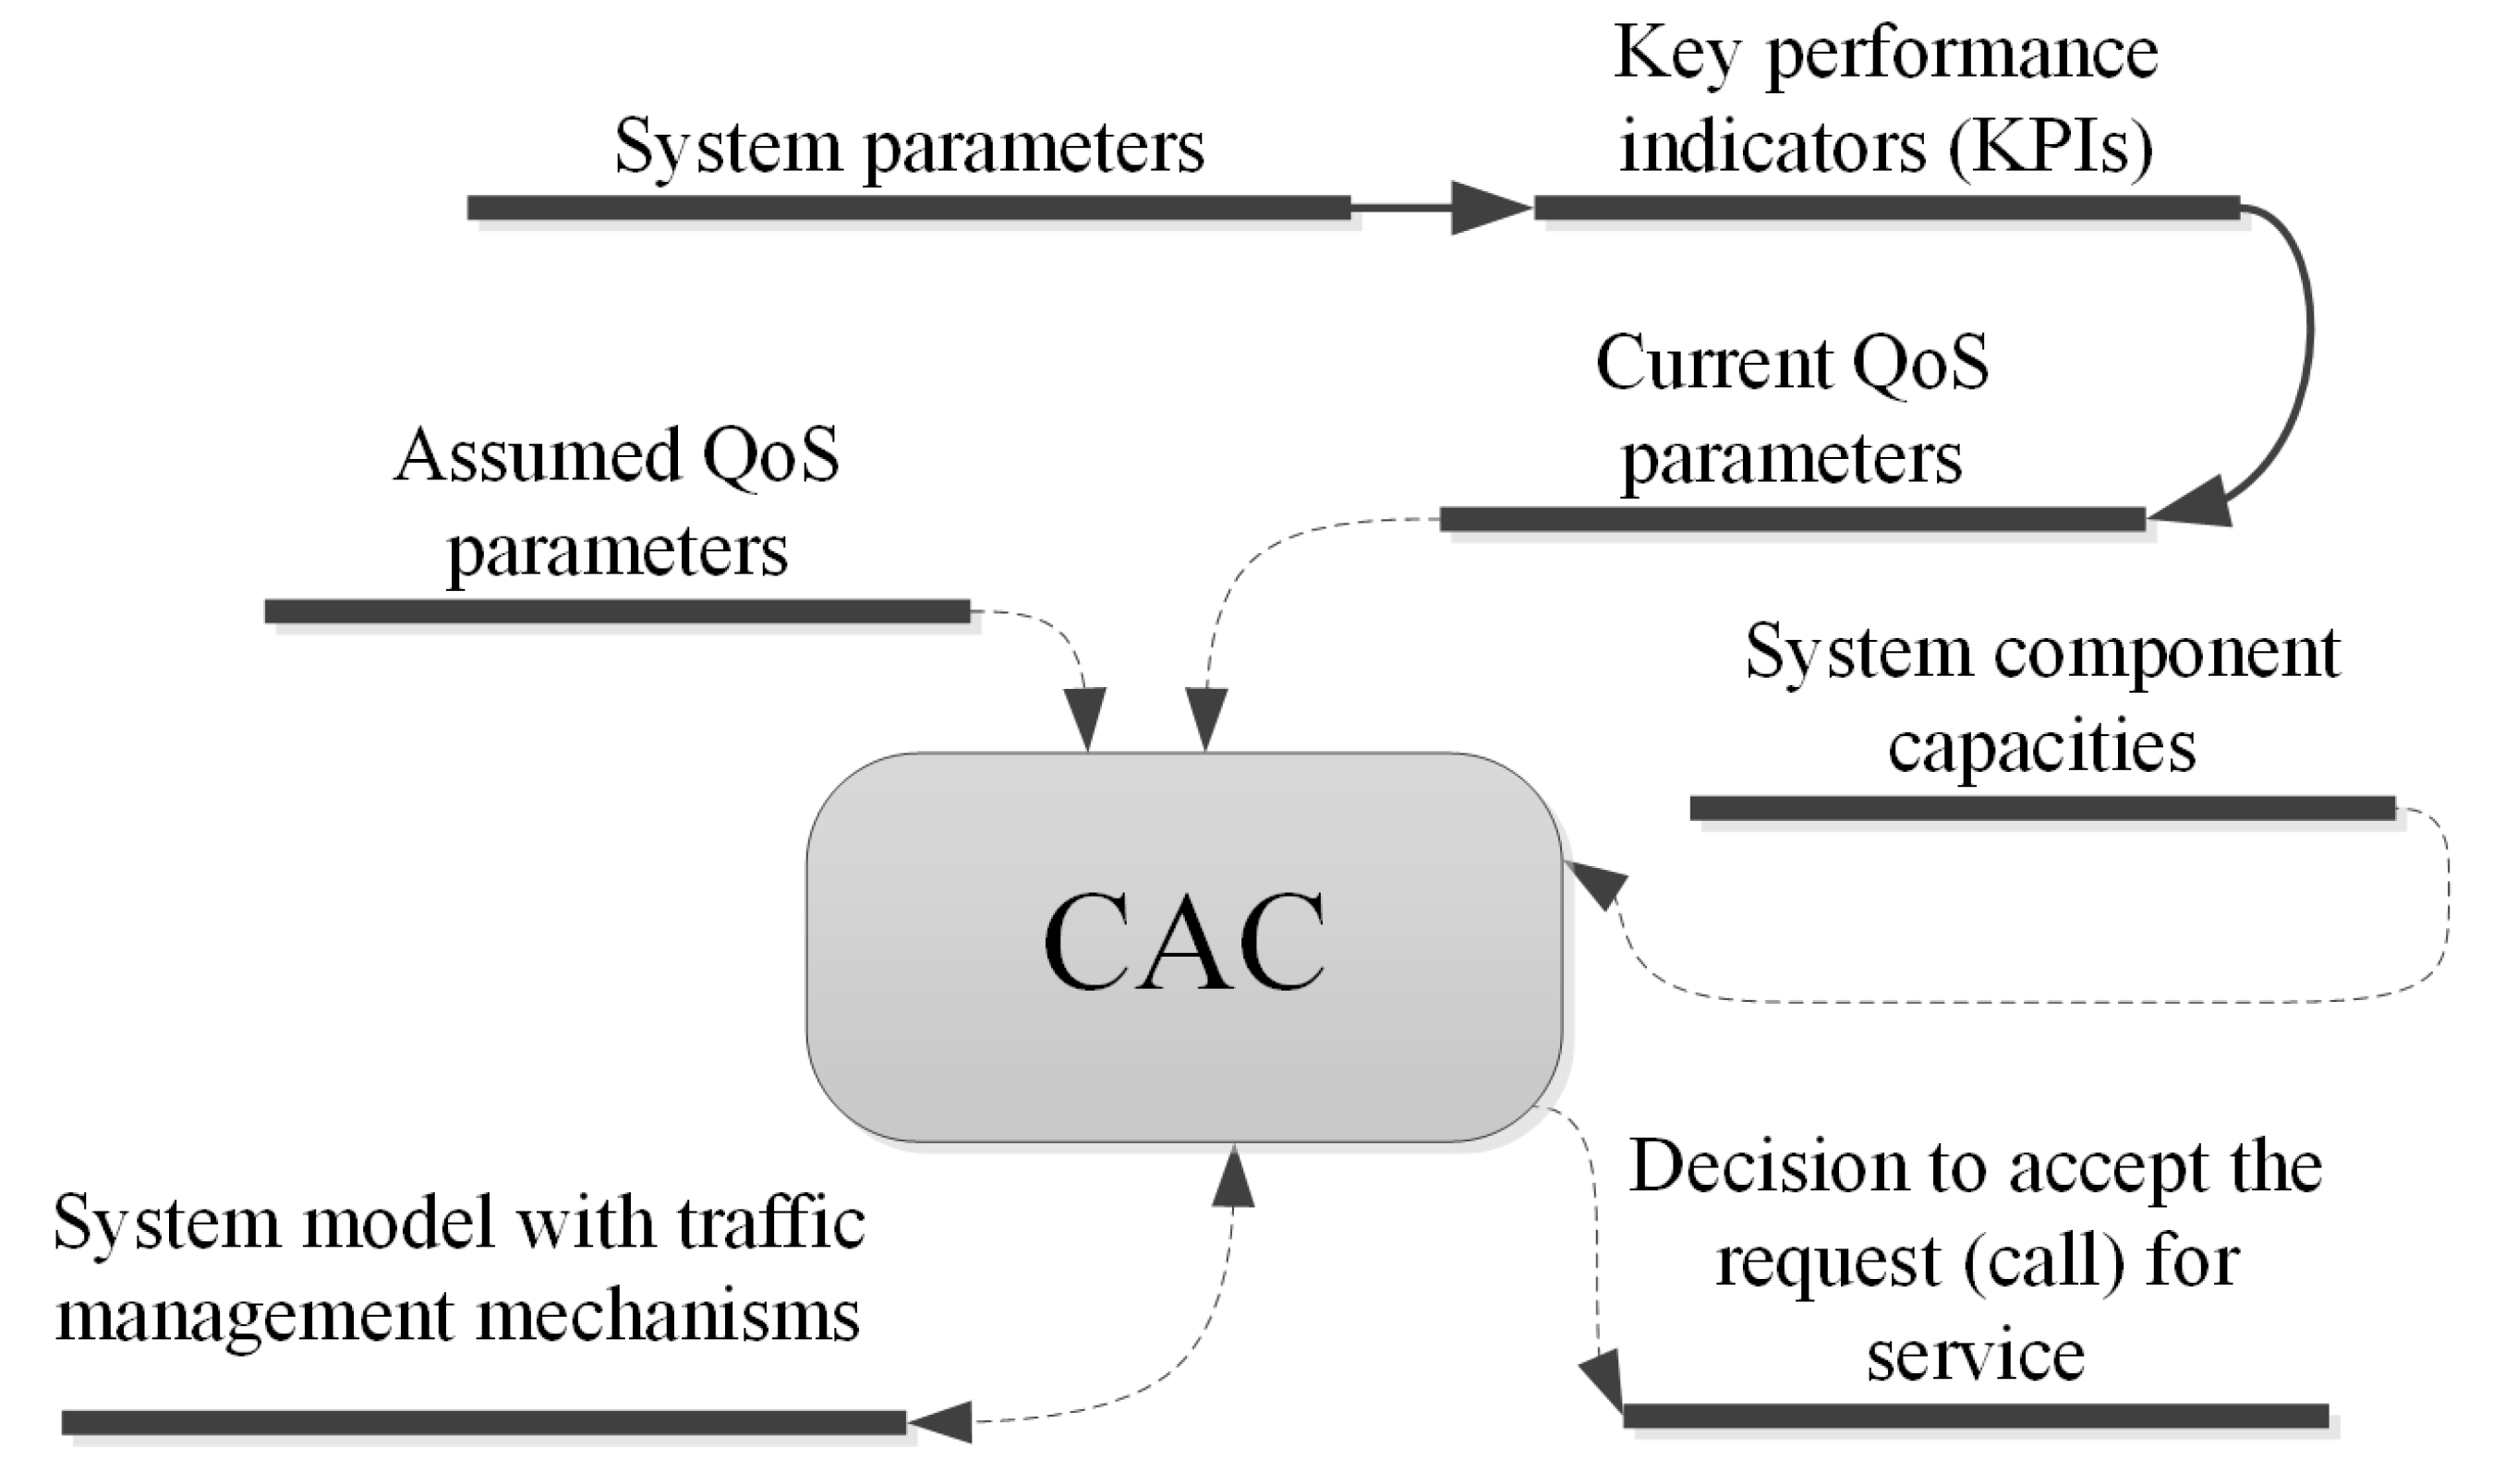
Over the recent years, the growing number of offered services executed with the application of network resources is clearly observable. Consequently, this causes an increase in network traffic, which in turn defines one of the main traffic problems related to the provision of optimal access to network resources for demands (calls) of different traffic classes. A decision as to the admittance of a new call is made by the call admission control (CAC) function on the basis of the traffic parameters and the demanded QoS (Quality of Service) parameters of both the arriving call and those calls that are already being serviced (Figure 1). The efficiency of the CAC function is associated with the assumed allocation algorithm for the allocation of the network resources to particular calls of different traffic classes. One of the possible and most effective strategies of the CAC function is resource reservation [8,9,10] for pre-defined traffic classes. As a result, its application can provide appropriate and required service quality for the traffic streams that are related to a given traffic class.
When using the reservation mechanism in EONs, it should be stressed that one of the most commonly used structures of switching networks for EONs is the 3-stage W-S-W (wavelength-space-wavelength) switching networks [11,12,13]. The reservation mechanism introduced in such a network makes decisions on the admittance of a new call for service on the basis of the current load of the system. A determination of traffic characteristics of switching networks for EON aims to verify if the implemented reservation mechanism is managing tasks in the best optimal way and a determination of the influence of the mechanism on the loss probability for individual call classes. This article presents a description of the appropriate simulation program and discusses the results of the loss probabilities for calls of individual traffic classes obtained using the developed simulation program.
The remaining part of the article has the following structure. Section 2 provides a description of the structure of a 3-stage W-S-W network. In Section 3, the structure of traffic offered to the switching network is defined. Section 4 describes the operation of the reservation mechanism. The path selection algorithms for point-to-group and point-to-point connections are presented in Section 5. Section 6 includes a brief description of the simulation program. Section 7 presents the results of the study and their analysis. Finally, Section 8 sums up the article.
2. Structure of W-S-W Network
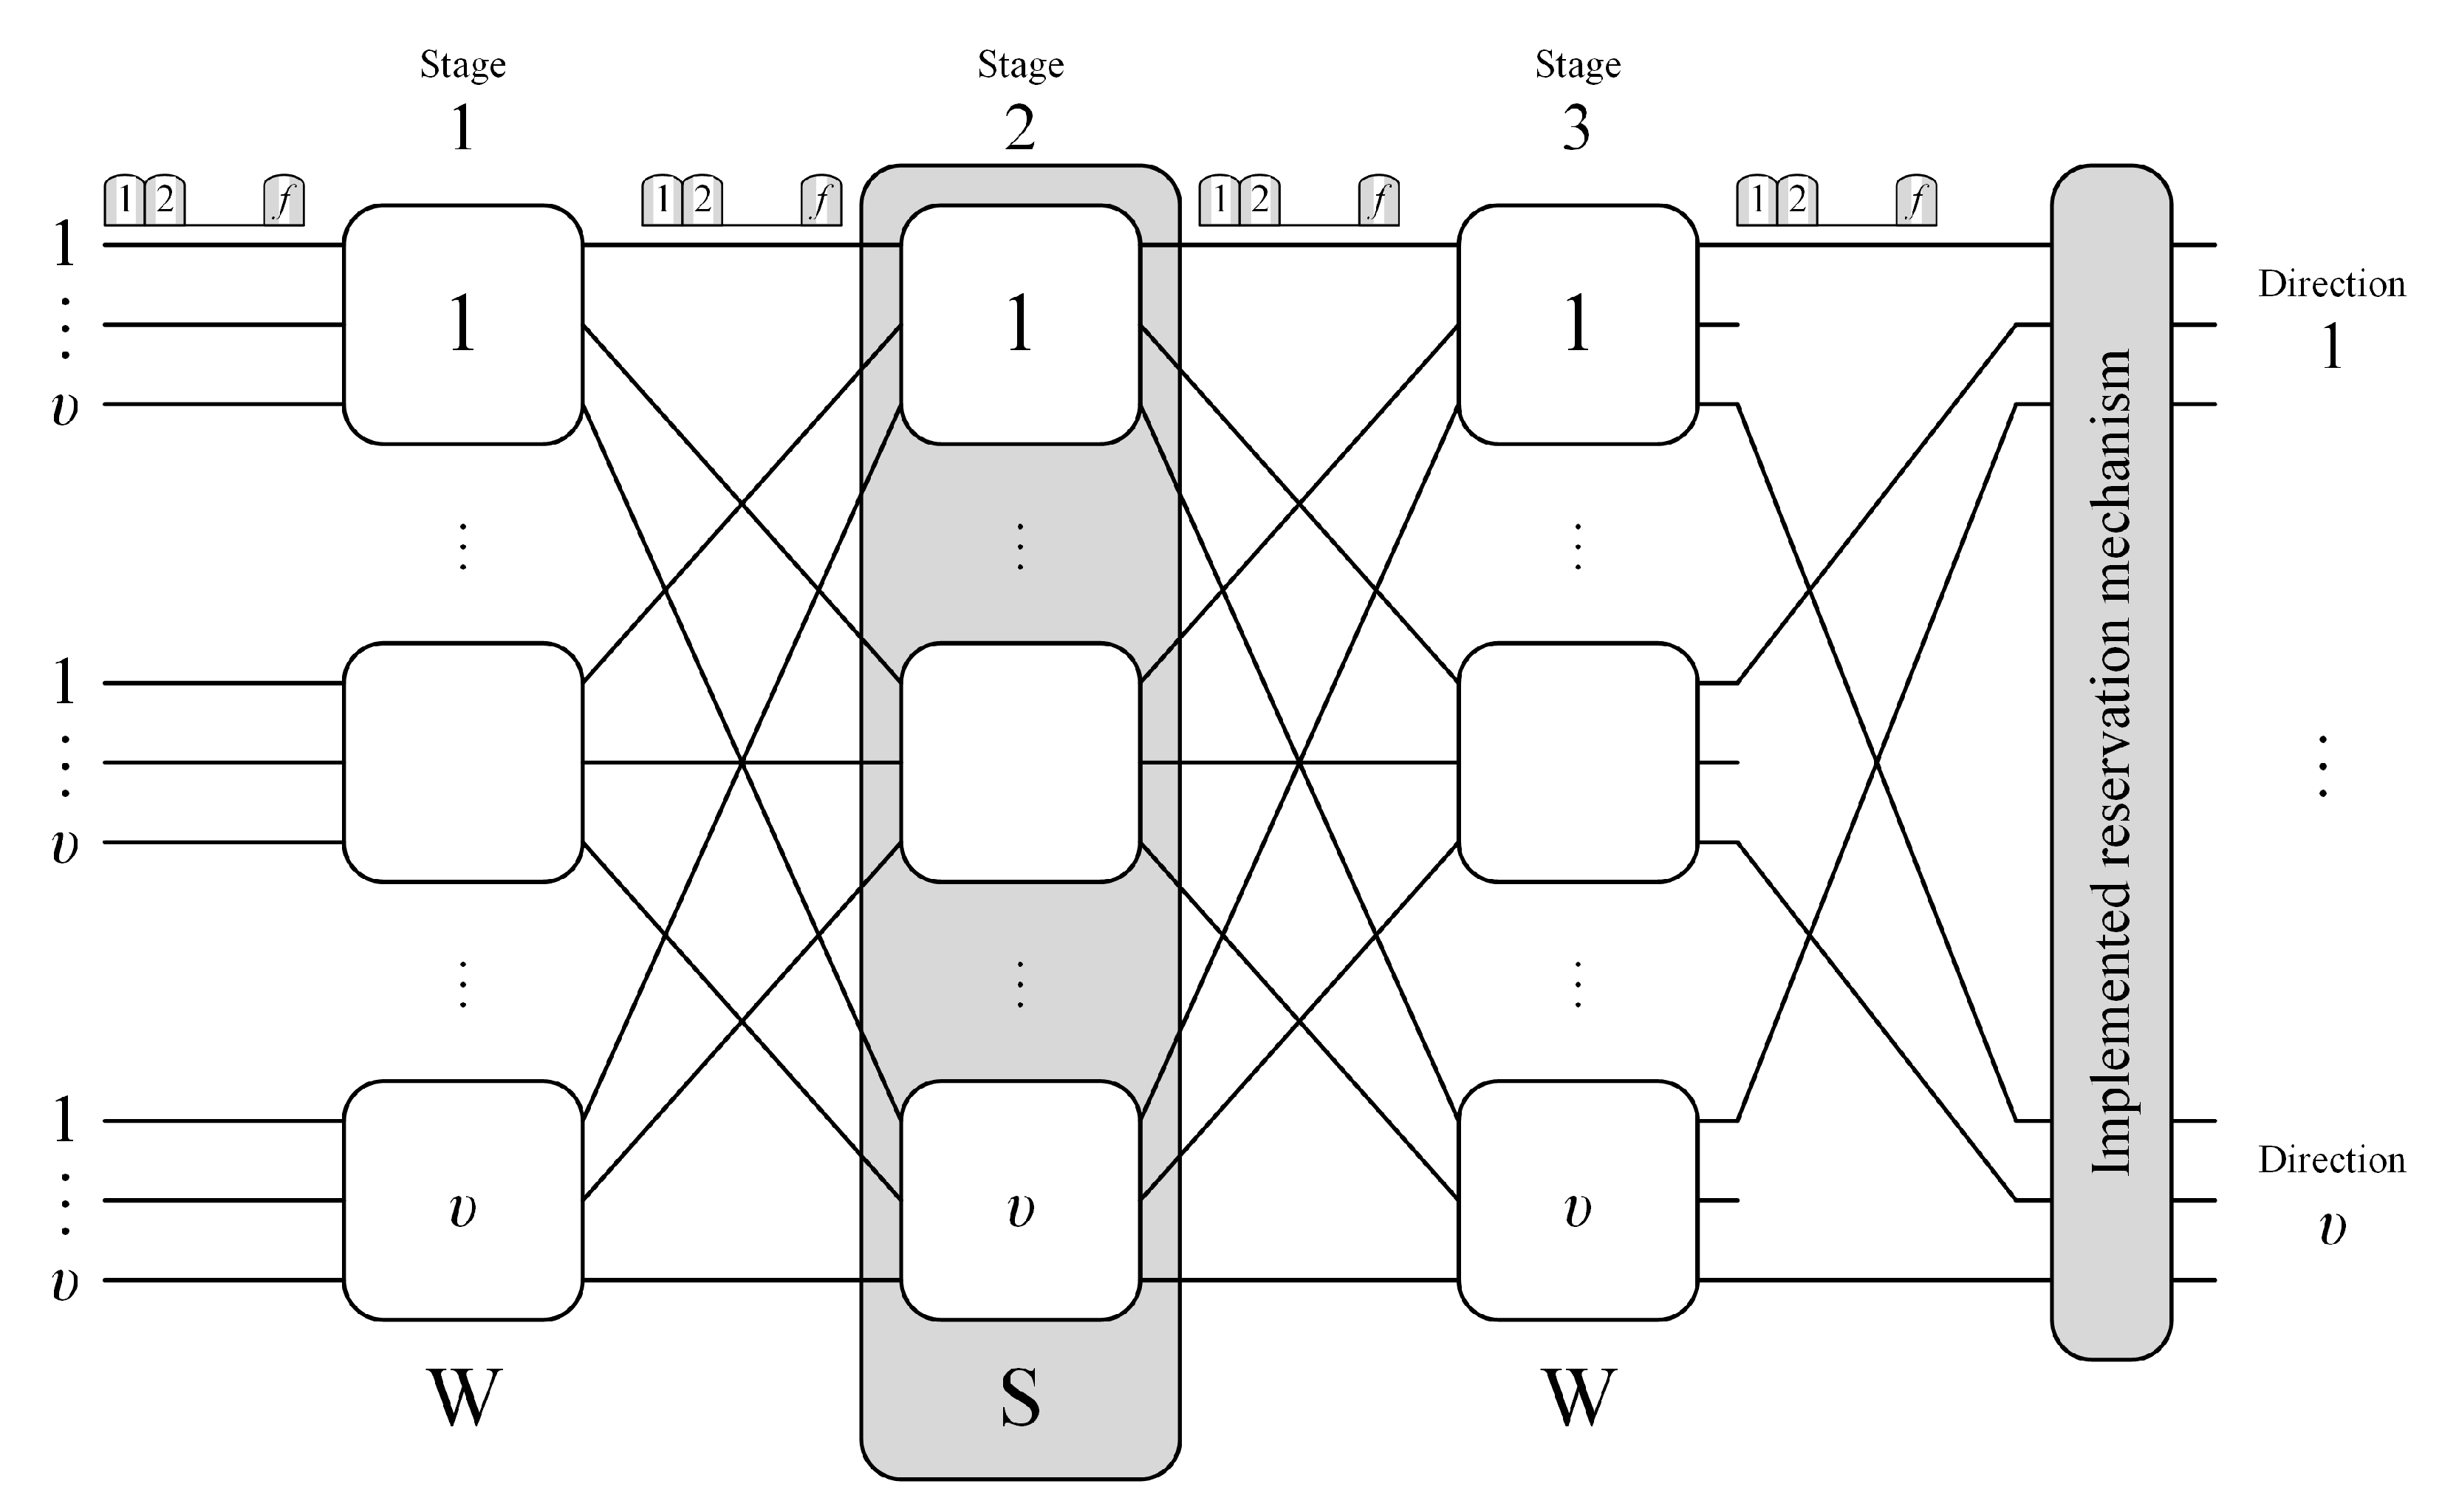
One of the most widely used structures of switching networks in EONs is the 3-stage W-S-W network with Clos structure (Figure 2). The considered switching network consists of square switches with inputs and outputs. Each of the three stages of the network contains switches. The input, output and inter-stage links of the W-S-W network under consideration have the capacities of f FSUs. In addition, the output links of the switches of the last stage are grouped into directions. Each direction consists of one output link from each switch of the third stage.
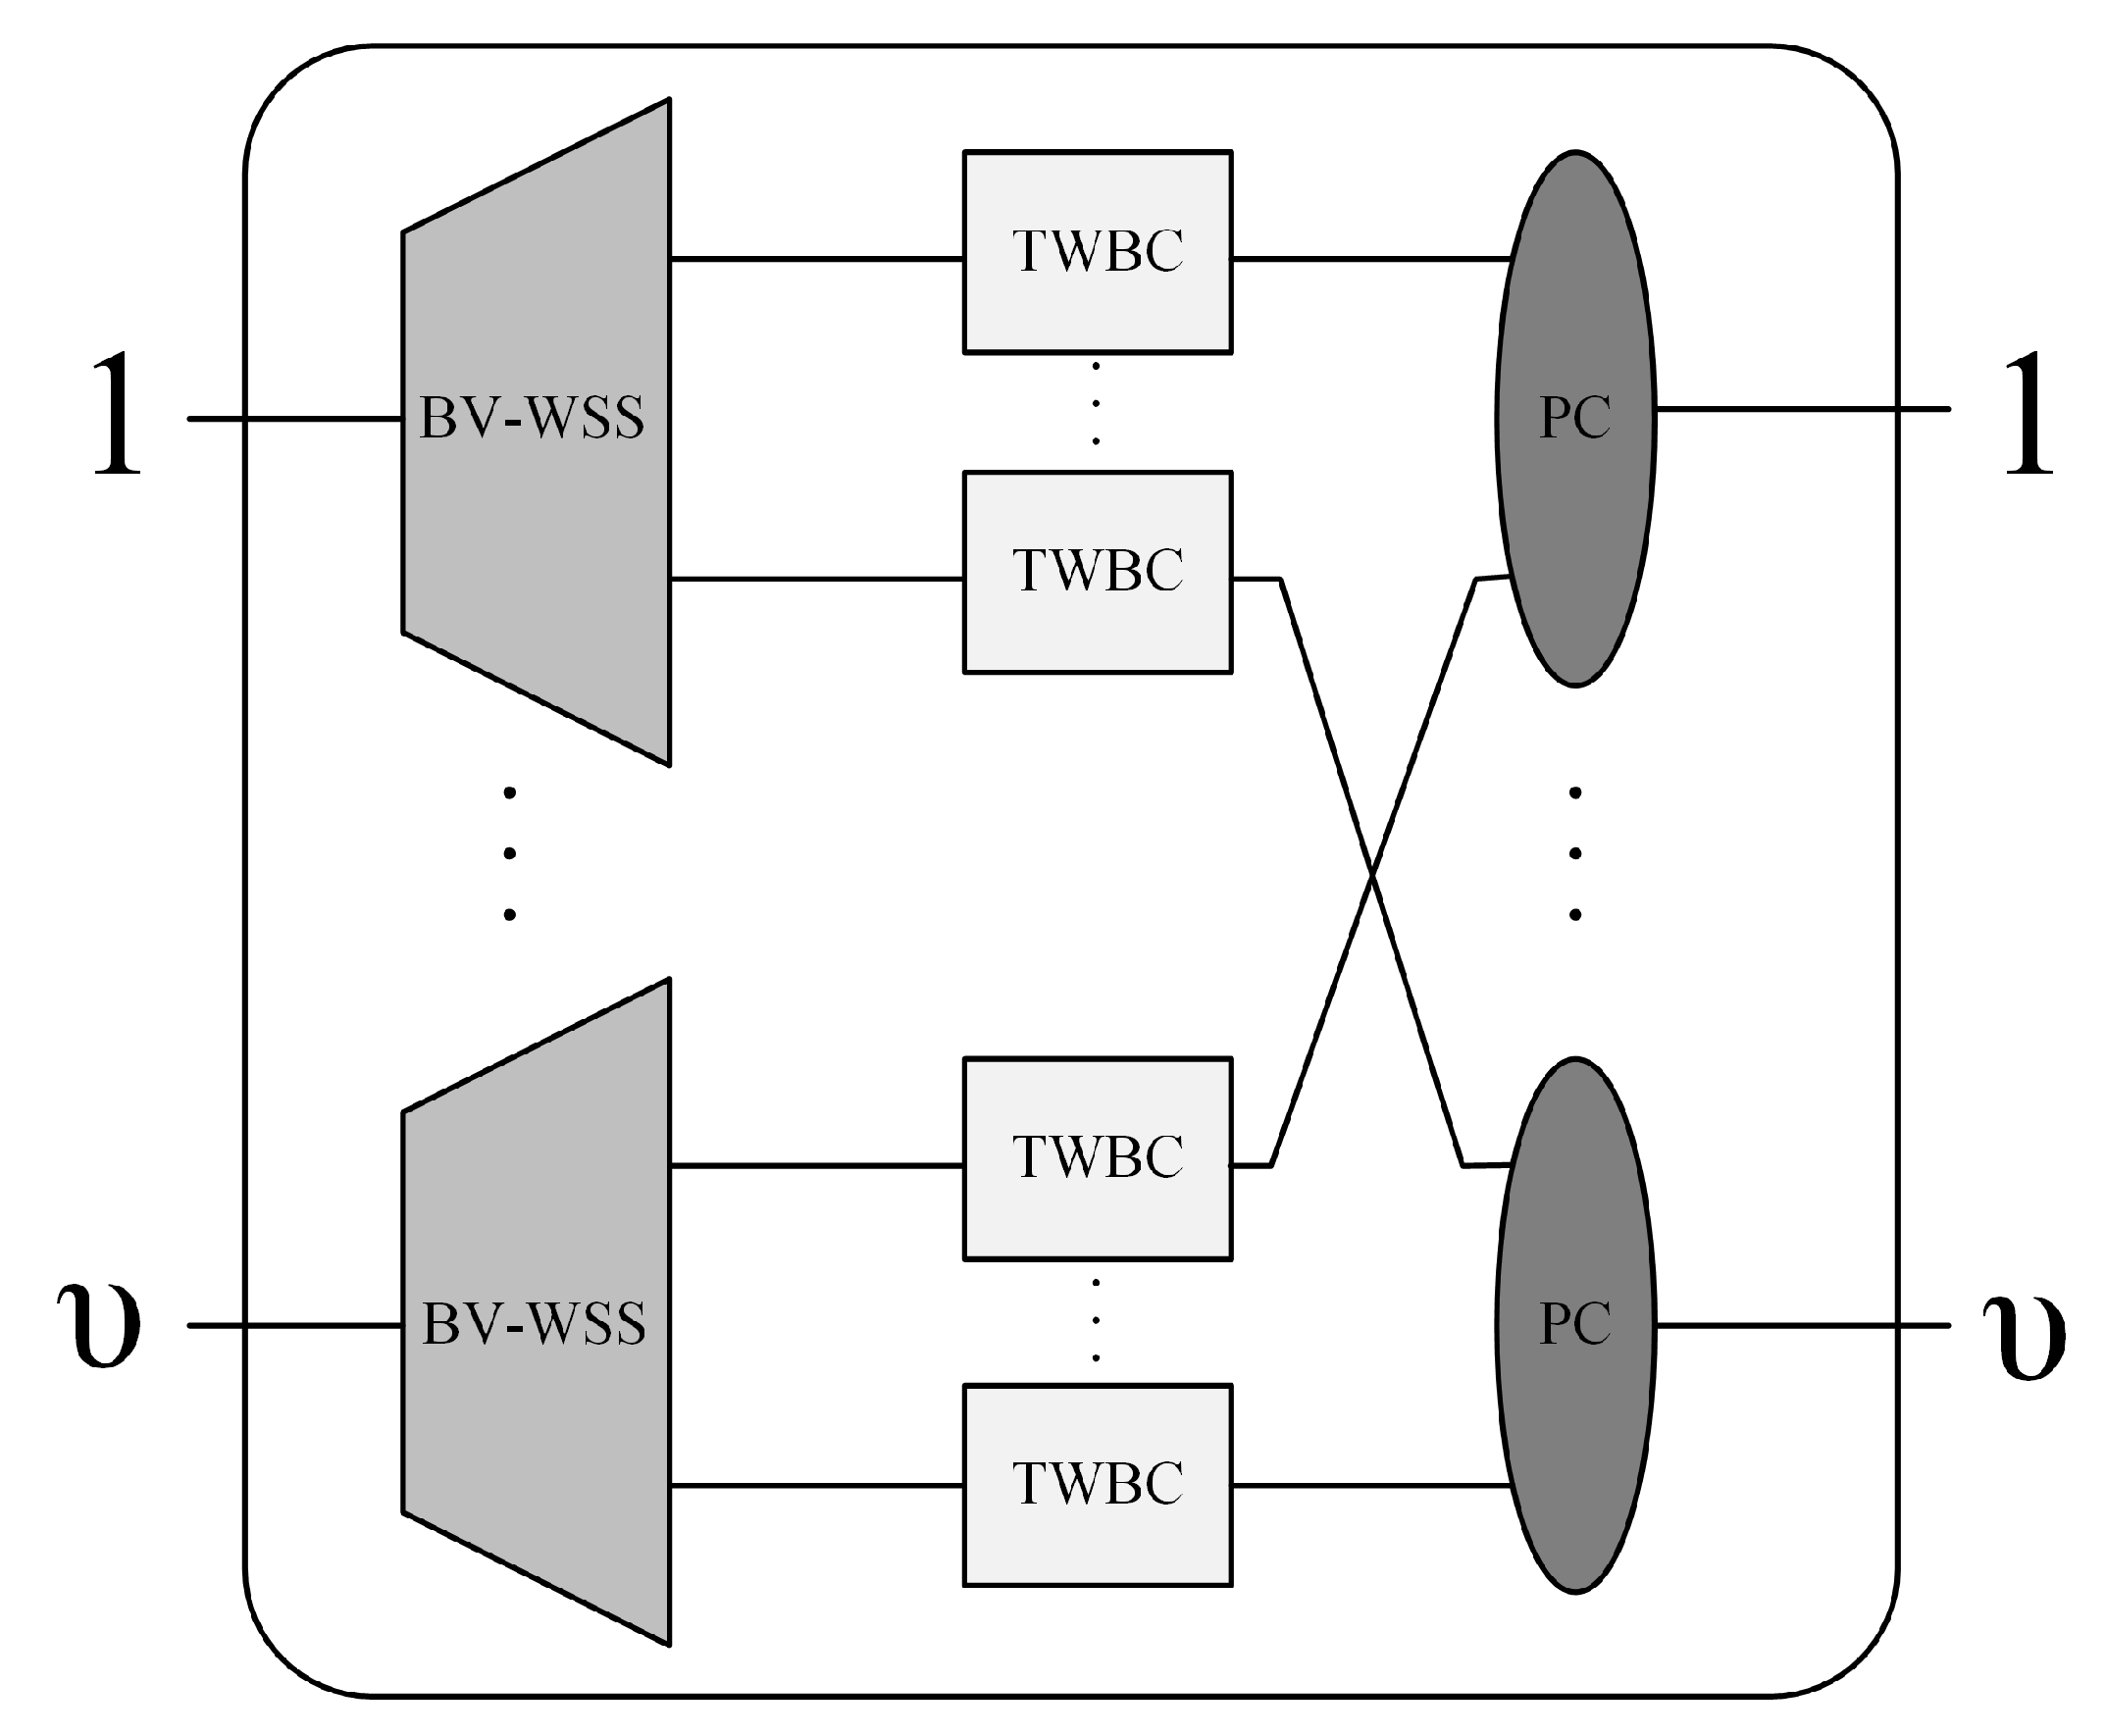
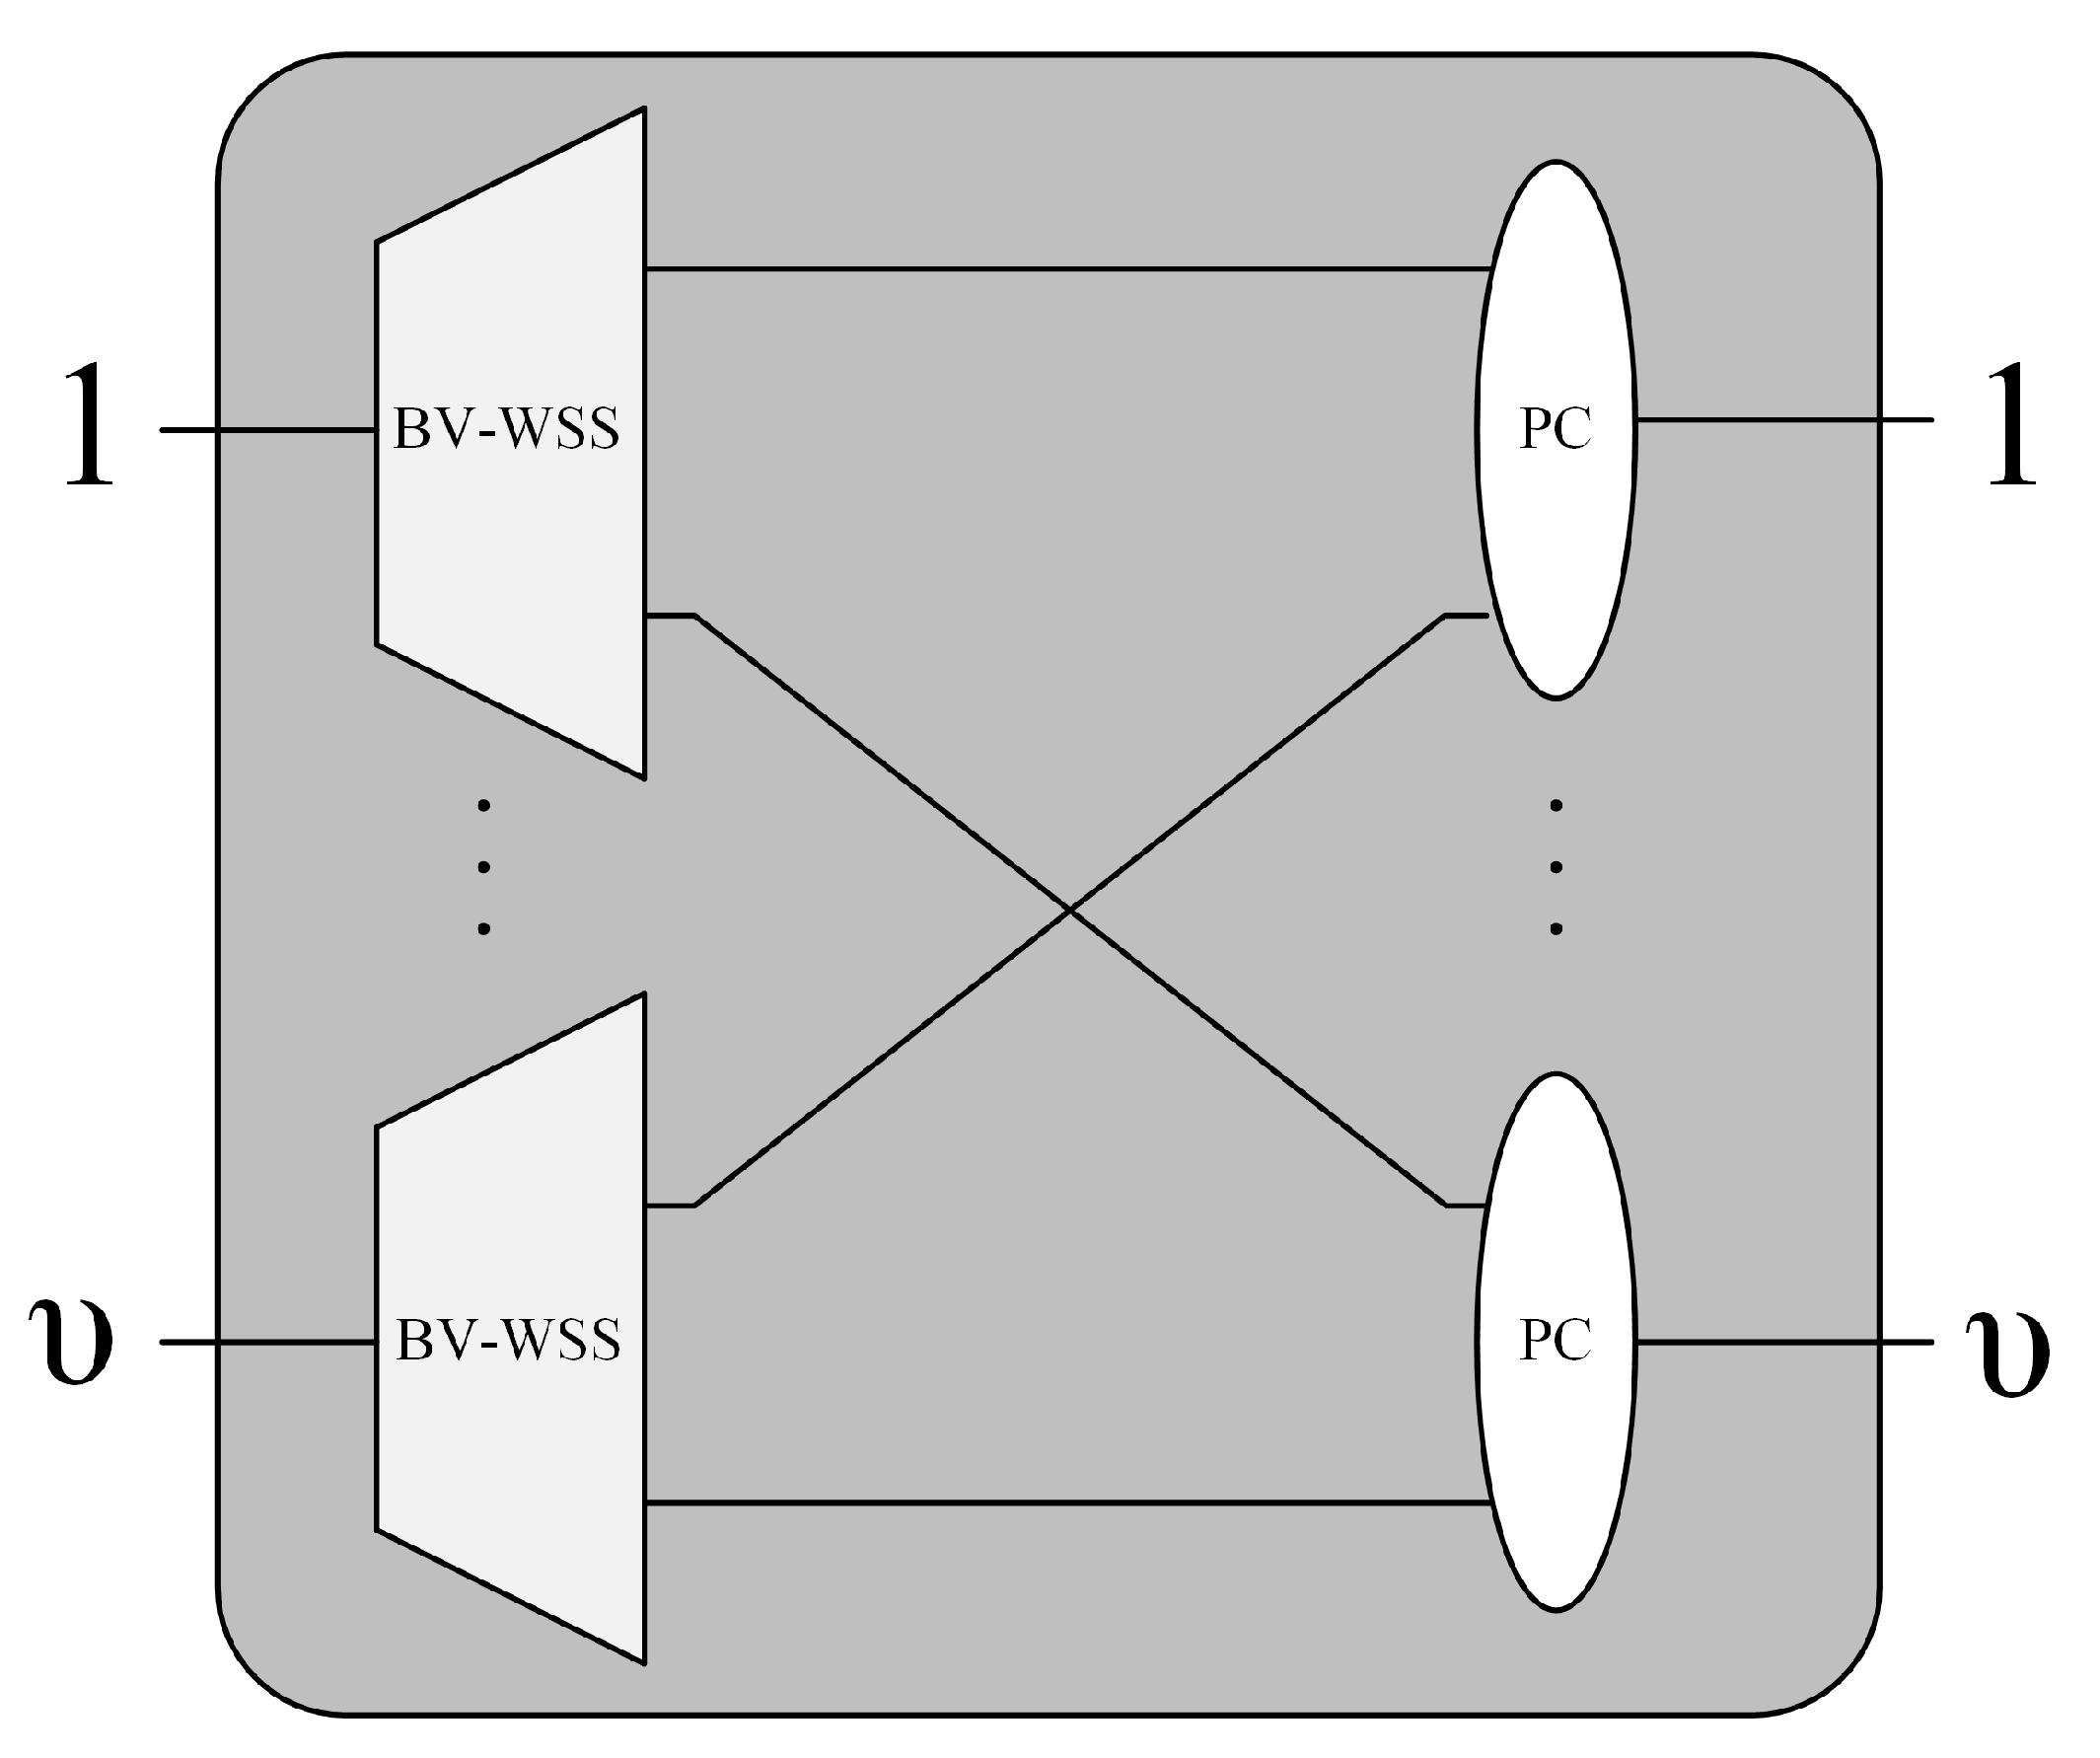
A more accurate description of the structure of the W-S-W network would reveal that the first and third stages of the network are constructed using Bandwidth-Variable Wavelength converting Switches (BV-WSs) (Figure 3) [11,14], while the second stage of the network is constructed using Bandwidth-Variable wavelength selective Space Switches (BV-SSs) (Figure 4) [11,14].
The switches used to construct the first and third stages have the advantage of changing both the wavelength and the output link (optical fibre). As for the switches of the second stage, only the alternation of the output link is possible, whereas the wavelength remains unchanged at all times.
3. Structure of Traffic Offered to W-S-W Network
The switching network are offered three types of traffic streams (Erlang, Engset and Pascal). Each traffic stream can be generated by calls of several traffic classes that are pre-defined in the system.
Traffic classes for which its sources generate calls that form the Erlang traffic stream are defined by the given parameters:
- Number of traffic classes: ;
- Index determining any traffic class: i;
- Intensity of arrival of new calls: ;
- Number of demanded FSUs: ;
- Average service time for calls: .
Traffic classes within the Engset stream can be defined by the following parameters:
- Number of traffic classes: ;
- Index determining any traffic class: j;
- Intensity of arrival of new calls: ;
- Number of demanded FSUs: ;
- Average service time for calls: ;
- Number of traffic sources: .
For Pascal traffic classes, the parameters that define individual classes are the following:
- Number of traffic classes: ;
- Index determining any traffic class: k;
- Intensity of arrival of new classes: ;
- Number of demanded FSUs: ;
- Average call service time: ;
- Number of traffic sources: .
In the case of the Erlang stream, the intensity of new calls does not depend on the occupancy state of the system. In the case of the Engset traffic stream, the intensity of new calls decreases along with the increase in the system load. In the case of Pascal stream, we observe the opposite situation.
Consequently, the sum of all classes offered to the switching network can be expressed by the following formula.
The additional assumption in the present considerations is that the index c will determine any traffic class regardless of the type of traffic stream.
4. Reservation Mechanism
The reservation mechanism was implemented in the considered W-S-W network. The reservation mechanism was applied to the classes that are included in the set . For a given class c that belonged to the set , the reservation threshold was introduced to determine the occupancy state of the system above which calls of class c could not be serviced. This means that, for the remaining traffic classes, all resources of the system will be available. In the case of the switching network under consideration, the reservation threshold determines the occupancy state of the output directions. From the QoS perspective, one can state then that the classes for which no reservation mechanism has been introduced (i.e., those that belong to the set ) can be treated as privileged classes.
5. Path Choice Algorithm in the Switching Network
5.1. Point-Group
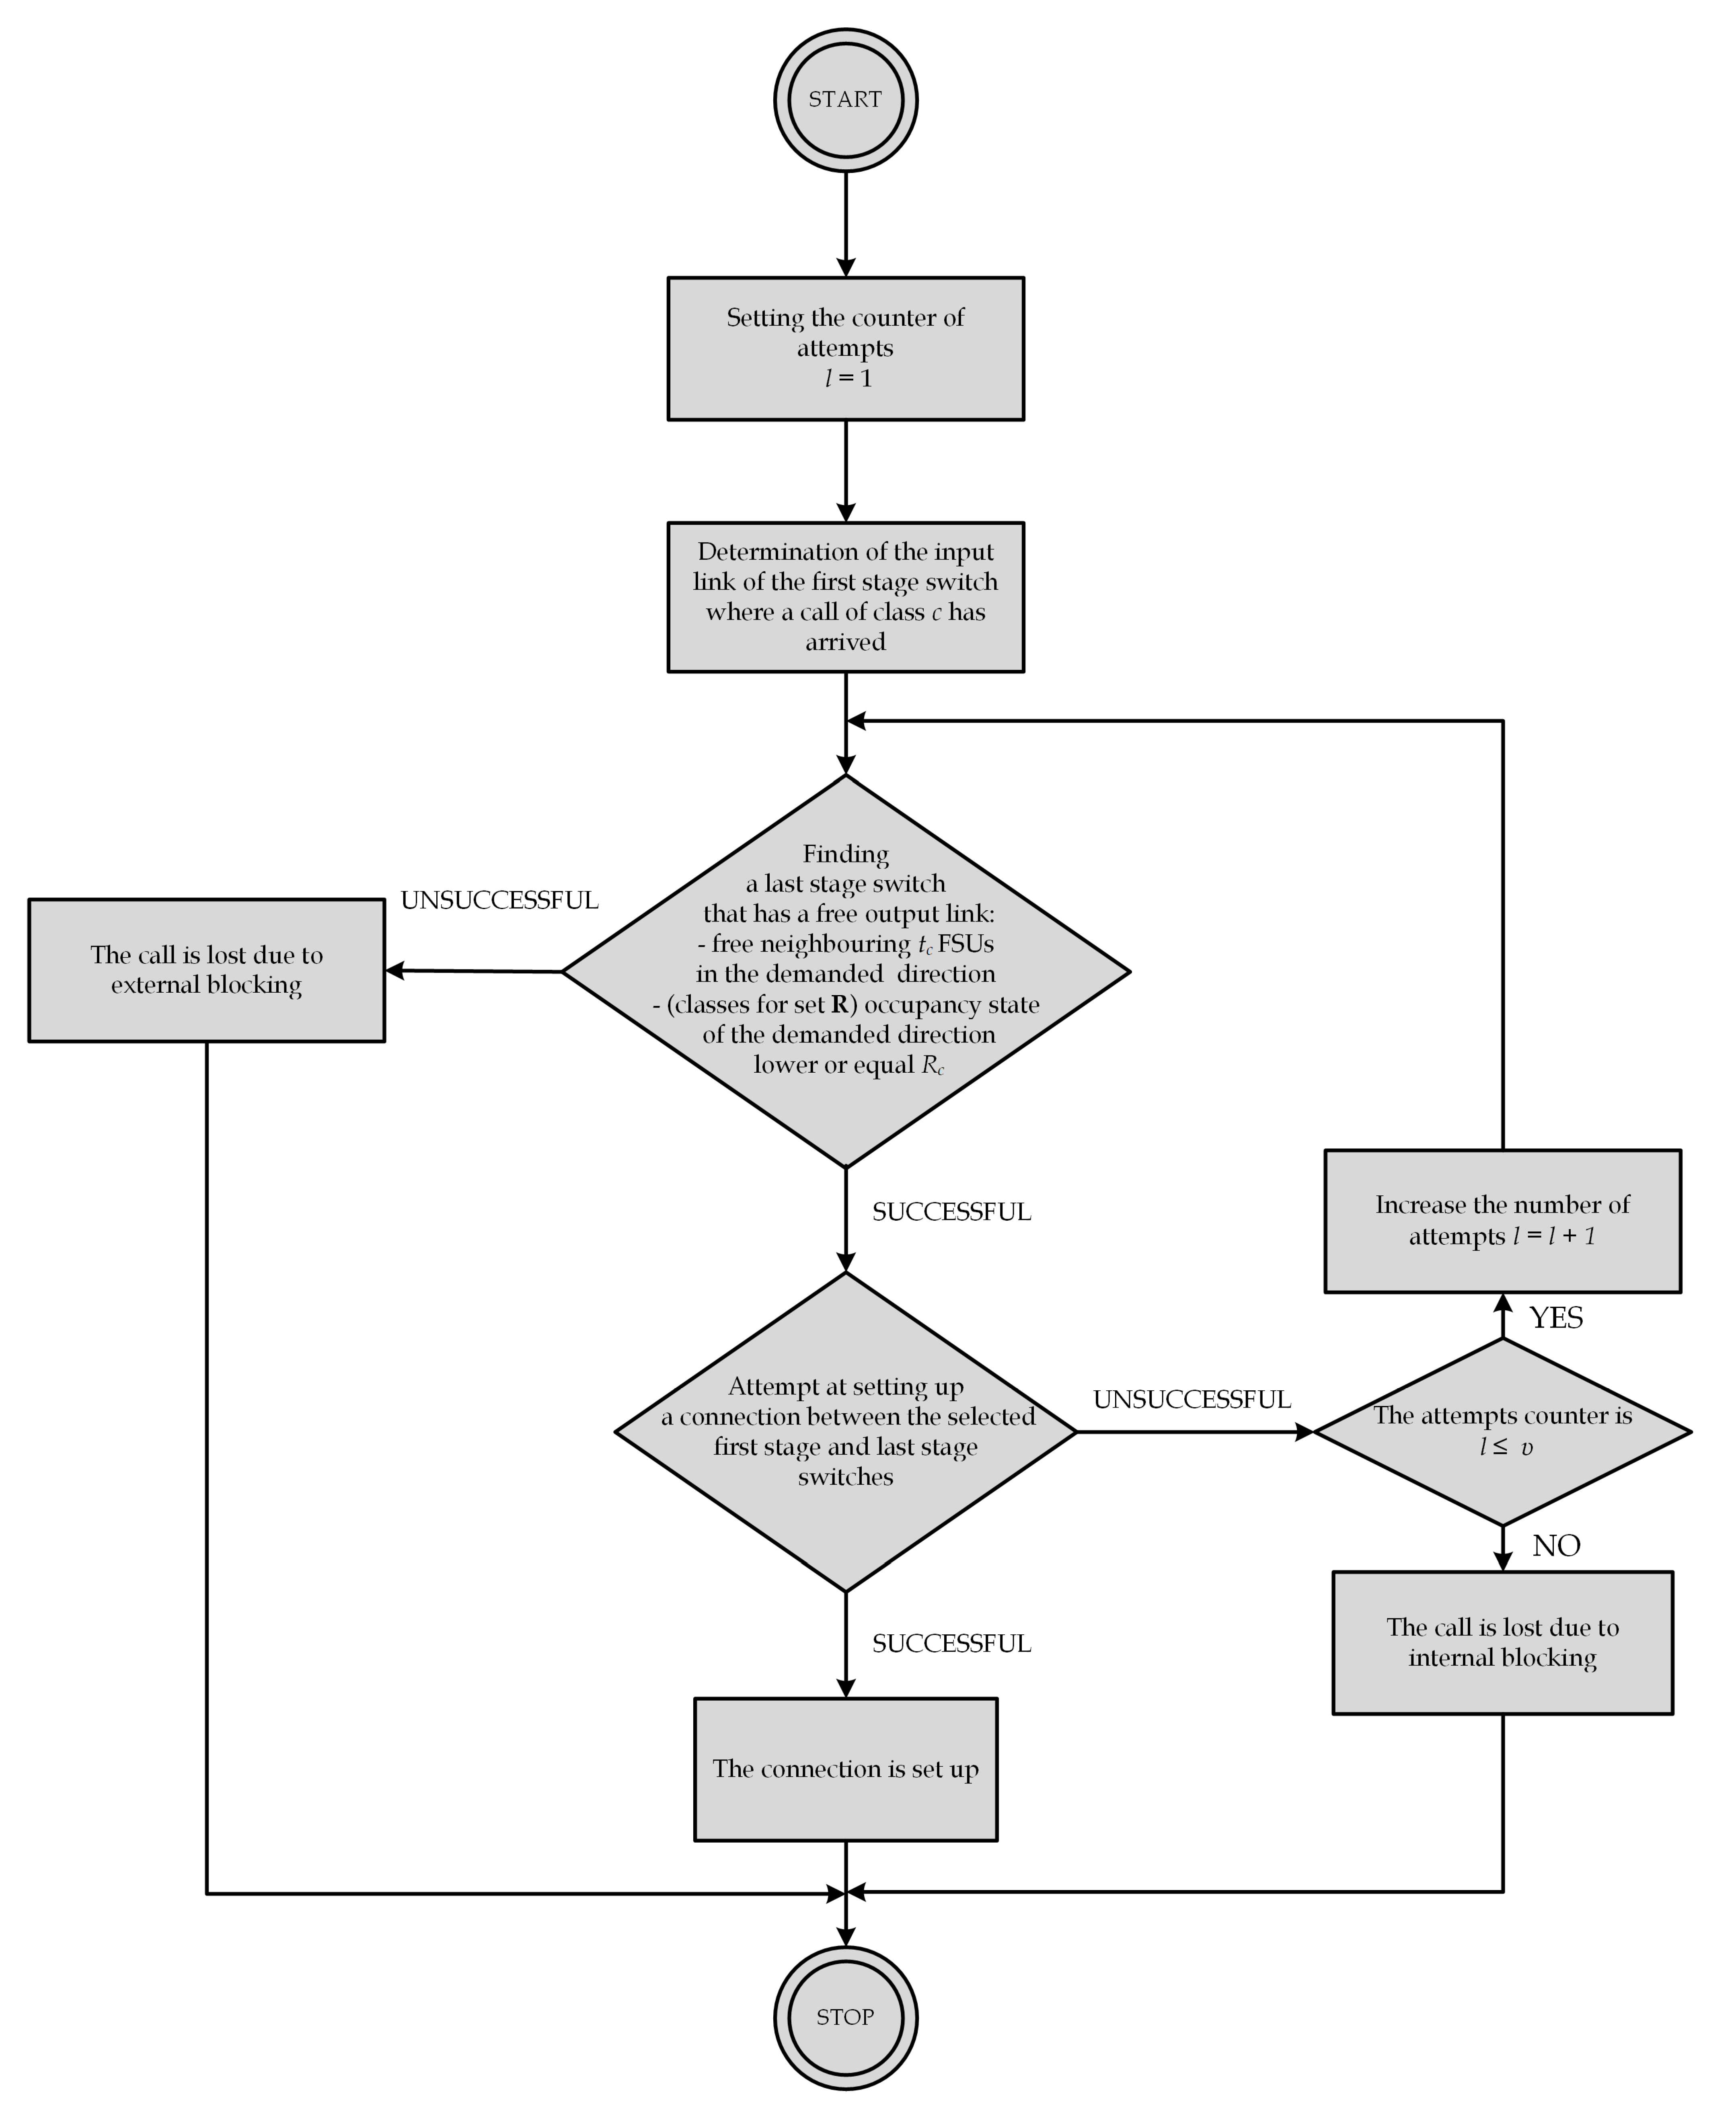
Two path selection algorithms were implemented in the switching network: point-to-group and point-to-point. With the point-to-group algorithm, the connection path is set up inside the network between a switch of the first stage at the input of which the call arrived and any switch of the last stage that has free resources in the selected direction. The reservation mechanism for the classes that are in implemented in the output directions introduces additional conditions to the determination of a free output link in the demanded direction. In addition to checking whether the output link has free neighbouring FSUs, the current occupancy of the system is also checked. This occupancy must be lower or equal to the reservation threshold . Figure 5 shows a block diagram of the point-to-group algorithm for setting up connections.
5.2. Point-to-Point
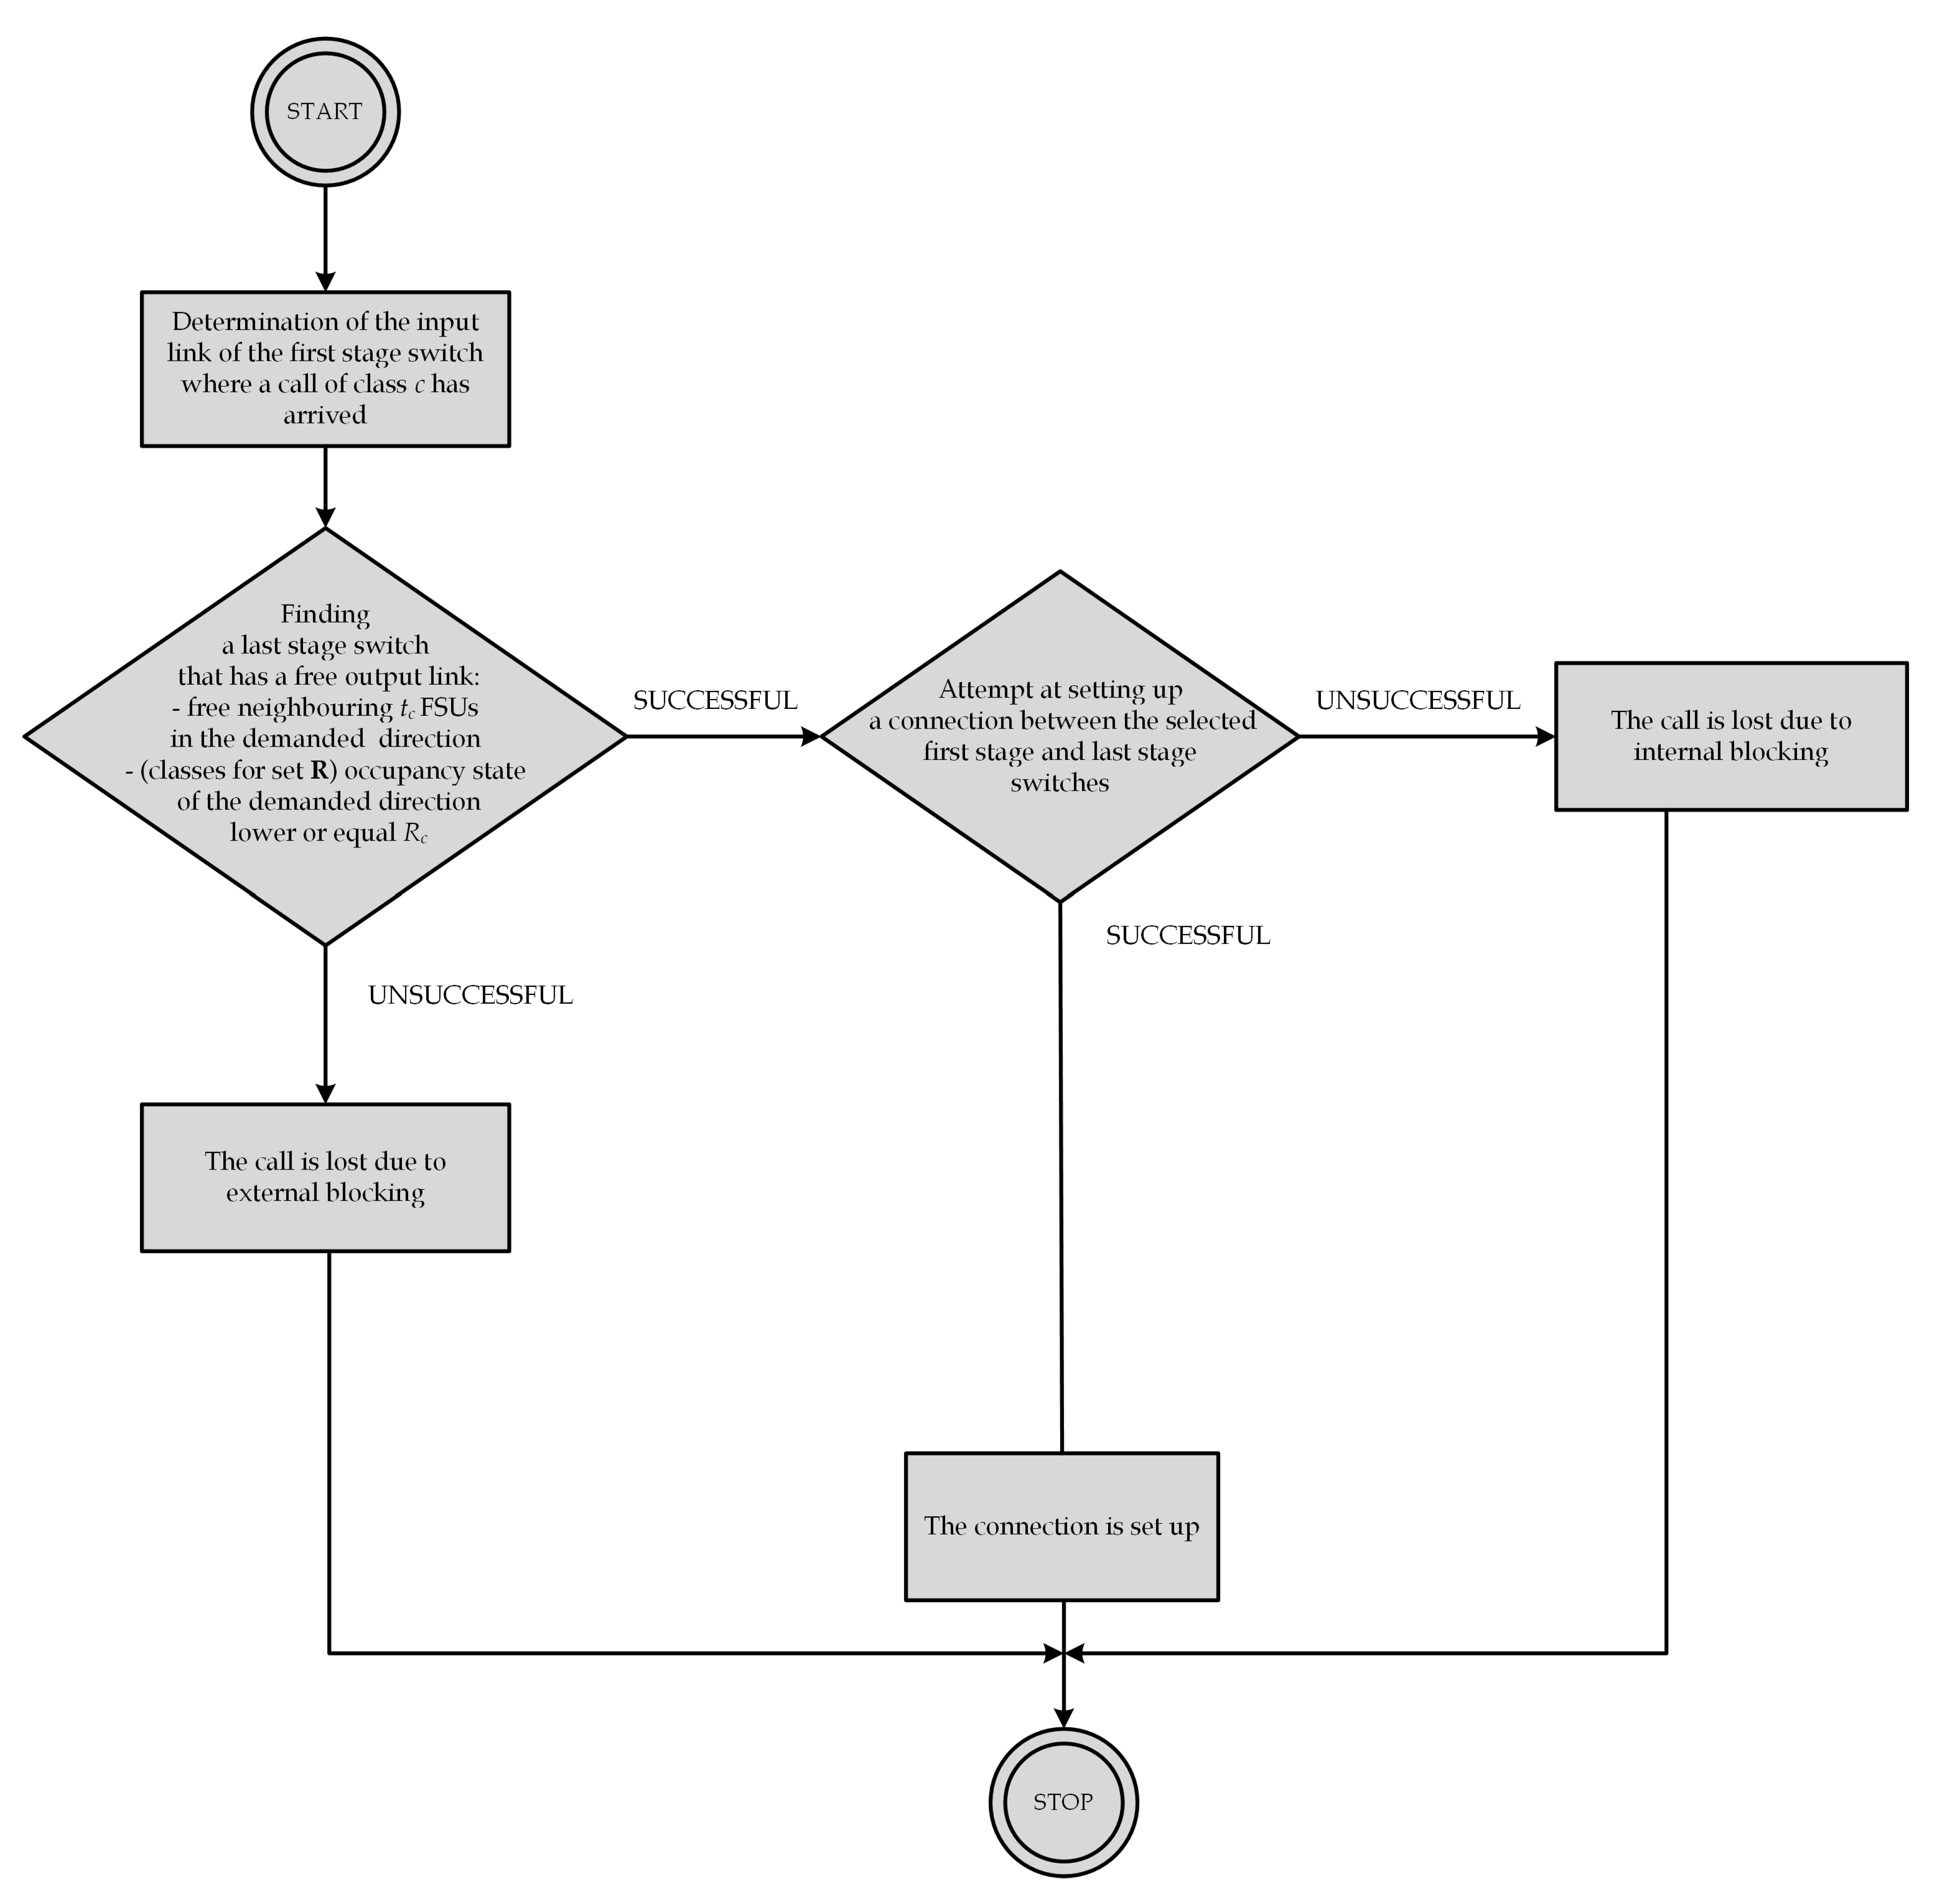
With the point-to-point path choice algorithm, a connecting path is set up between a switch of the first stage at the input of which a new call has appeared and a selected switch of the last stage that has a free output link in the required direction. In the implemented reservation mechanism in the output directions, a free output link in the demanded direction for a call of class c is such a call that has at least free, neighbouring FSUs and, additionally in the case of the classes that belong to , the current occupancy state of the system has to be no greater than the reservation threshold . The block diagram of the point-to-point algorithm is presented in Figure 6.
6. Simulation Program
6.1. Implementation and Application
The simulator of EONs with the introduced reservation mechanisms was implemented in the C++ programming language using the object-oriented programming technique and the process-interaction method [15]. Thus, the developed simulator has the advantage of providing the possibility to set the value of the loss probability in optical switching networks with point-to-group and point-to-point selection, in which resource reservation mechanisms have been implemented. In the future, this simulator will be used to verify and validate analytical models that would make it possible to find traffic characteristics of optical switching networks with resource reservation mechanisms. In addition, the same simulator can be used as a tool in the optimisation of introduced CAC mechanisms. In the immediate future, the authors’ intend to develop and publish methods that would make it possible to analytically determine the loss probability for individual call classes.
6.2. Input Data
The following parameters are given as input data to the simulation program:
- Number of input links, output switches: ;
- Capacity of input links and output switches: f FSUs;
- Number of classes of Erlang traffic: ;
- Number of classes of Engset traffic: ;
- Number of classes of Pascal traffic: ;
- For each class i from among Erlang classes:
- -
- Number of demanded FSUs: ;
- -
- Average service time: ;
- For each class j from among Engset classes:
- -
- Number of demanded FSUs: ;
- -
- Average service time: ;
- -
- Number of traffic classes: ;
- For each class k from among Pascal classes:
- -
- Number of demanded FSUs: ;
- -
- Average service time: ;
- -
- Number of traffic classes: ;
- Set of traffic classes;
- Reservation threshold for classes from set ;
- Traffic value a offered to a single FSU.
On the basis of data given to the simulator, the intensities of the arrival of new calls , and can be determined as follows.
6.3. Simulation Algorithm
While implementing the simulator using the process interaction method, two events were defined: arrival of a new call and termination of call service. With the case of the event arrival of a new call, it is checked whether a new call can be admitted for service. If this is possible, the resources of the system become occupied; if not, the call is lost. The event termination of call service means that the service of a given call has terminated and the resources of the system are to be released. The execution of the handling of these events in the simulation program is realised by using designated functions. These functions are presented in detail in other publications [16,17], while the general block diagram of the simulation algorithm is shown in the Figure 7.
6.4. Termination Condition
The simulation program permits the determination of the loss probability, which is calculated as the quotient of two determinants: the number of lost calls and the number of generated calls. Accordingly, the number of generated calls of the least active class, i.e., the class whose calls are generated with the least intensity, was adopted as the termination condition. The final result for a given set of input parameters can be determined as the arithmetic mean calculated from five series of simulations. The 95% confidence intervals are also determined, which in practice do not exceed 5% of the average value. For this purpose, the maximum of 1,000,000 calls of the class with the least call intensity are to be generated.
7. Numerical Results
The simulation study was conducted for systems for which its parameters are presented in Table 1. In addition, a study on the dependence of the loss probability for calls of individual traffic classes on the value of the reservation threshold was also performed.
The choice of appropriate number of demanded FSUs was performed on the basis of the data included in Table 2.
The results of the simulation (Figure 8, Figure 9, Figure 10, Figure 11, Figure 12, Figure 13, Figure 14, Figure 15, Figure 16, Figure 17 and Figure 18) are presented in graphs in the form of plotted points with the confidence intervals calculated on the basis of the Student’s t-distribution (with 95% confidence level) for five series with 1,000,000 calls (of the least active class) each. The confidence intervals were determined based on the following formula:
where is the arithmetic mean calculated from d results (simulation runs), is the value of the Student’s t-distribution for degrees of freedom. The parameter , which determines the standard deviation, is then determined by using the following equation:
where is the result obtained in the s-th run of the simulation.
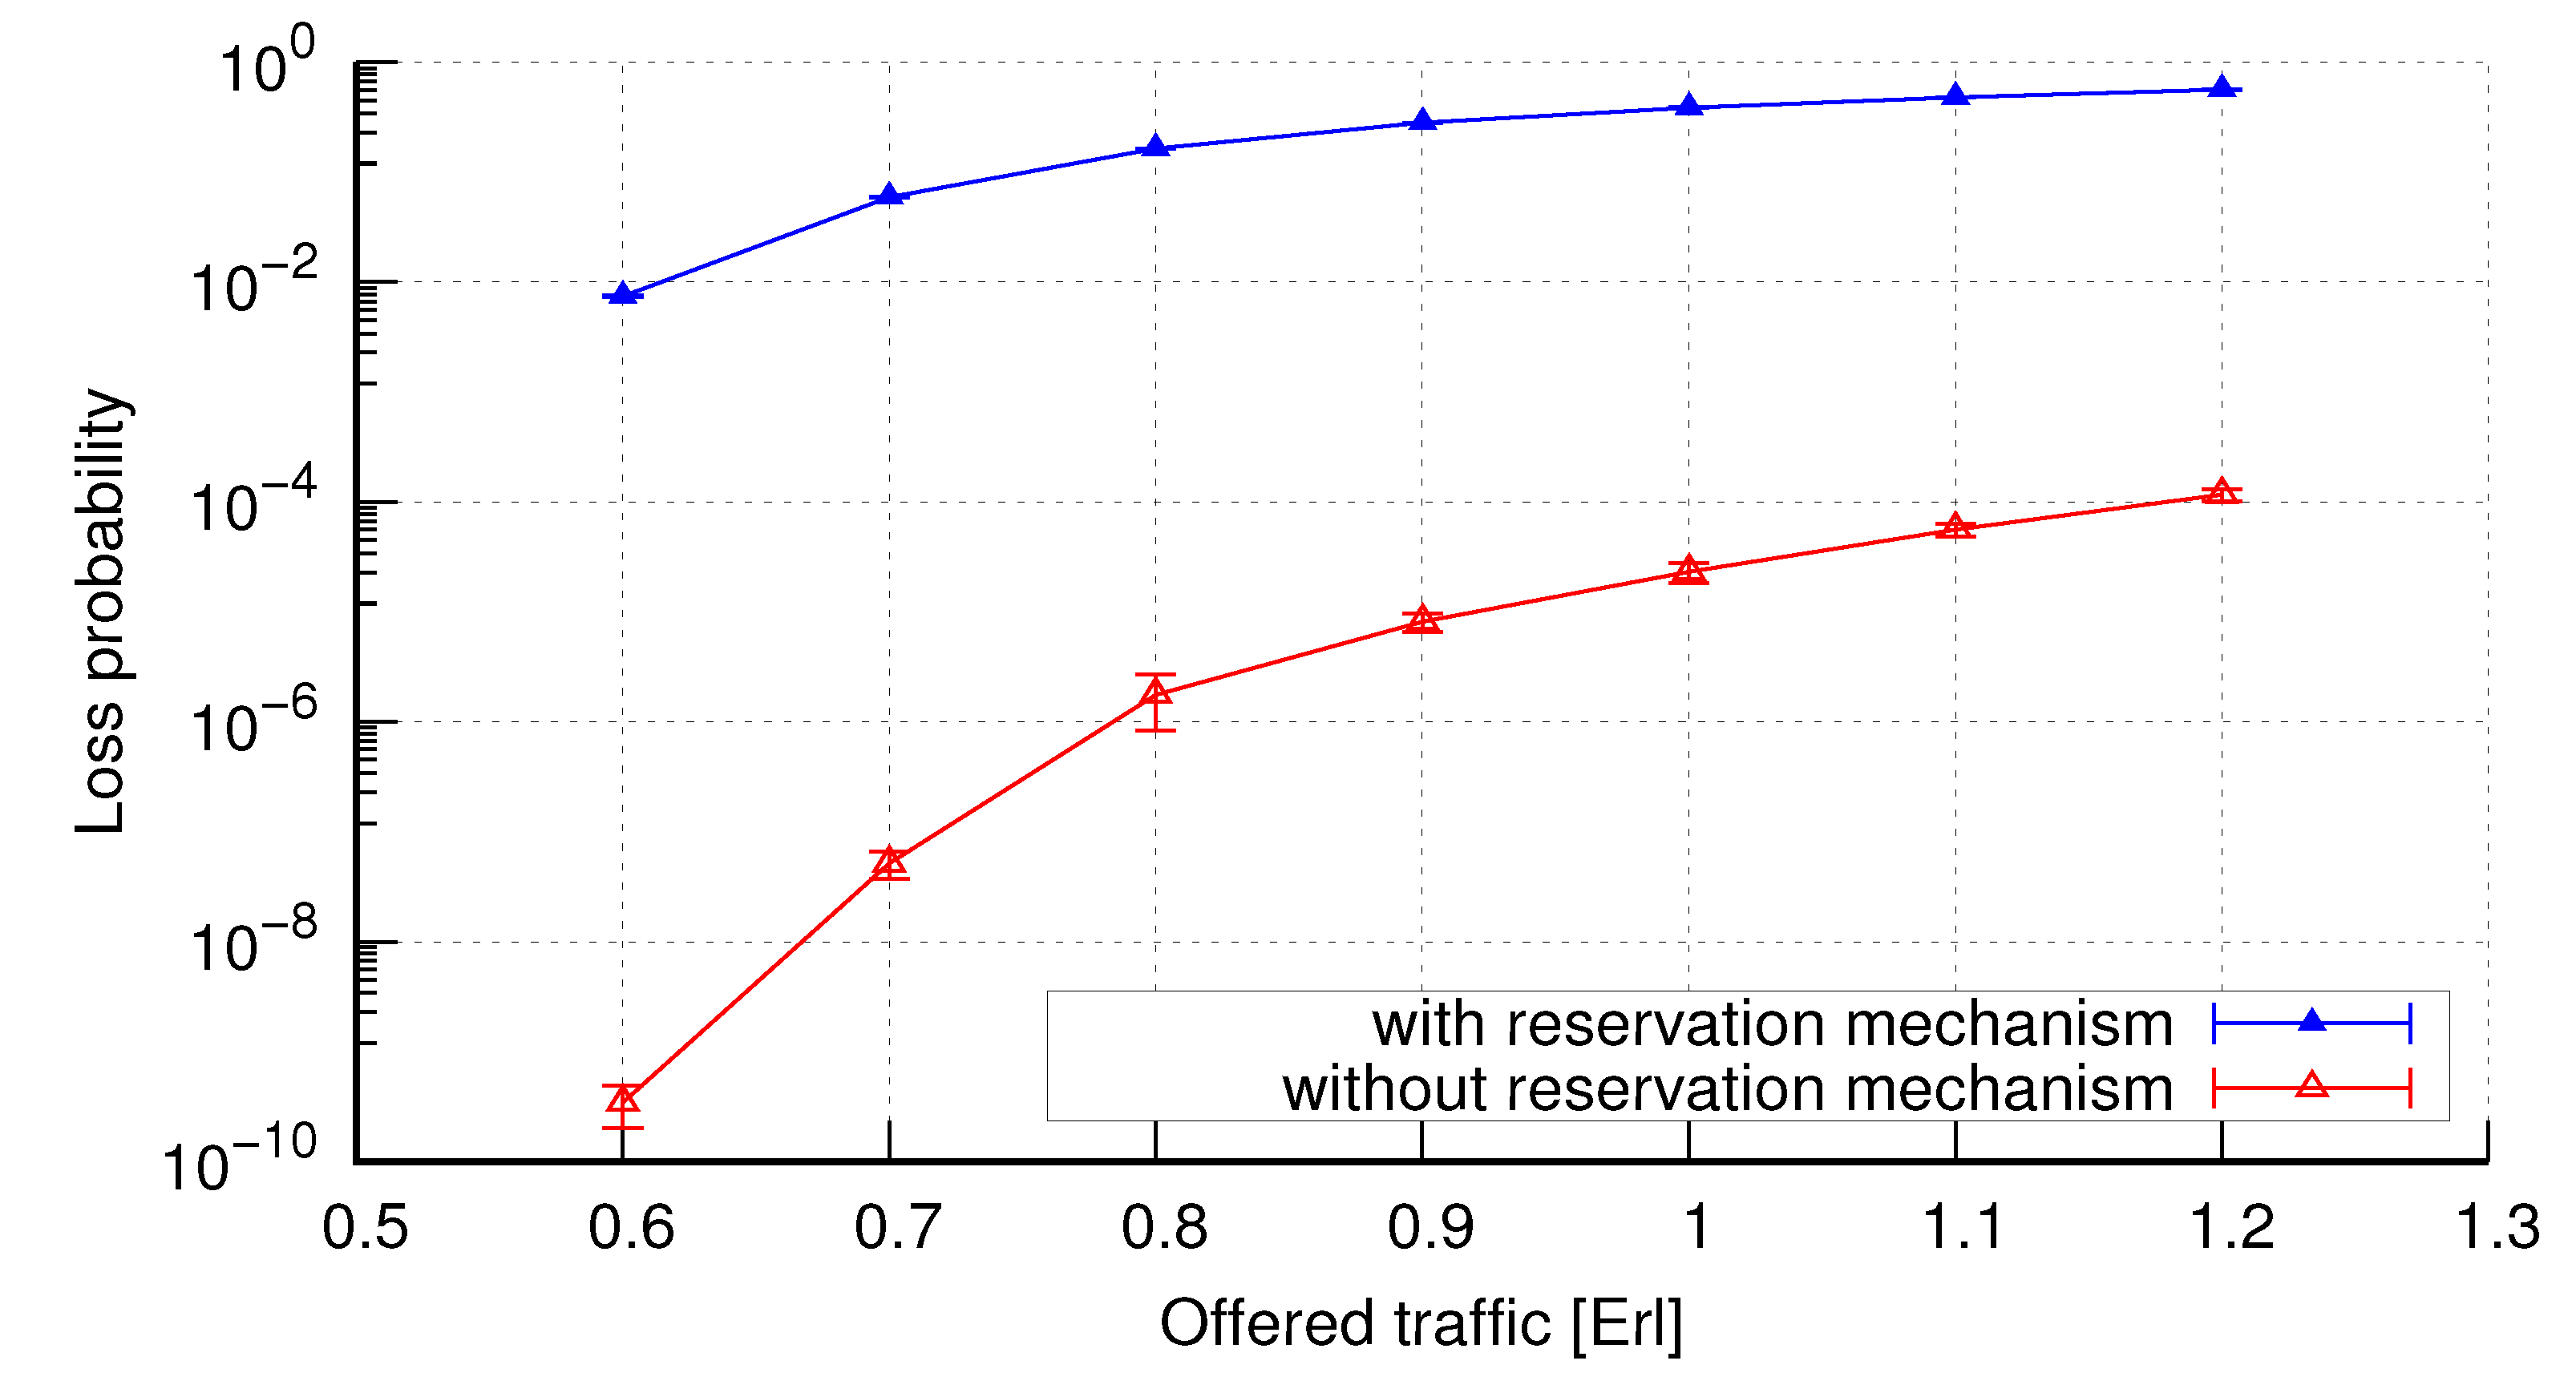
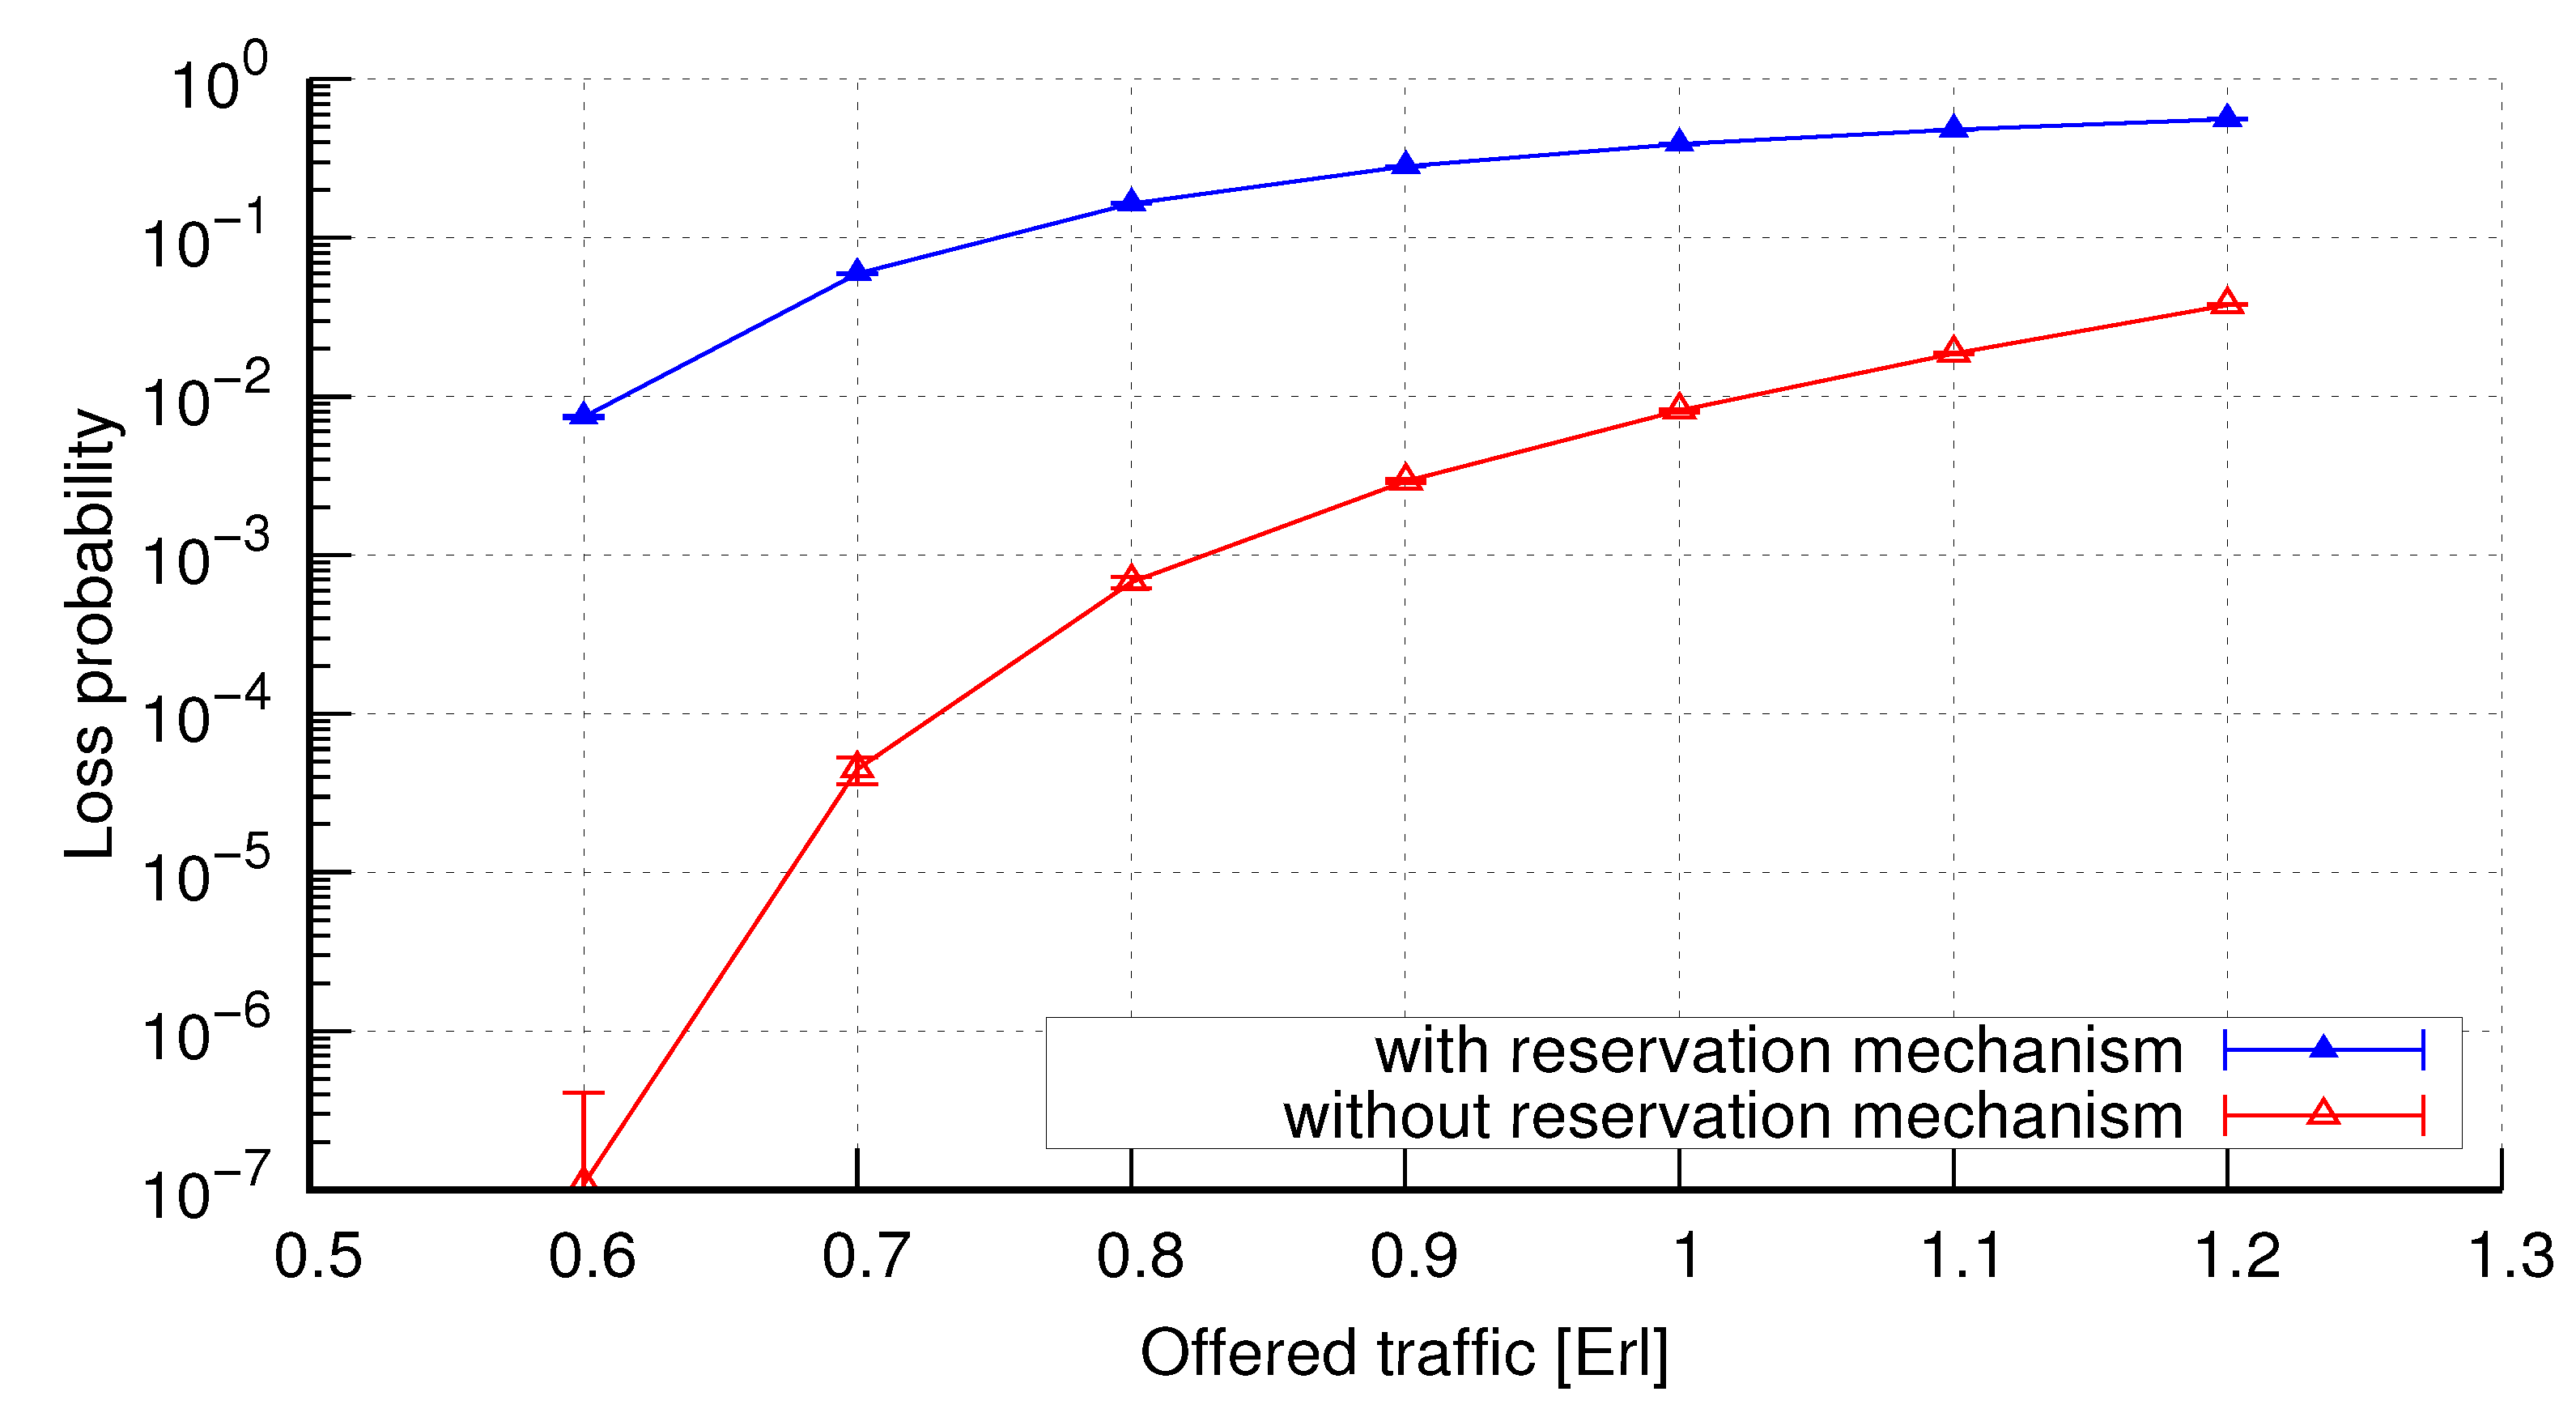
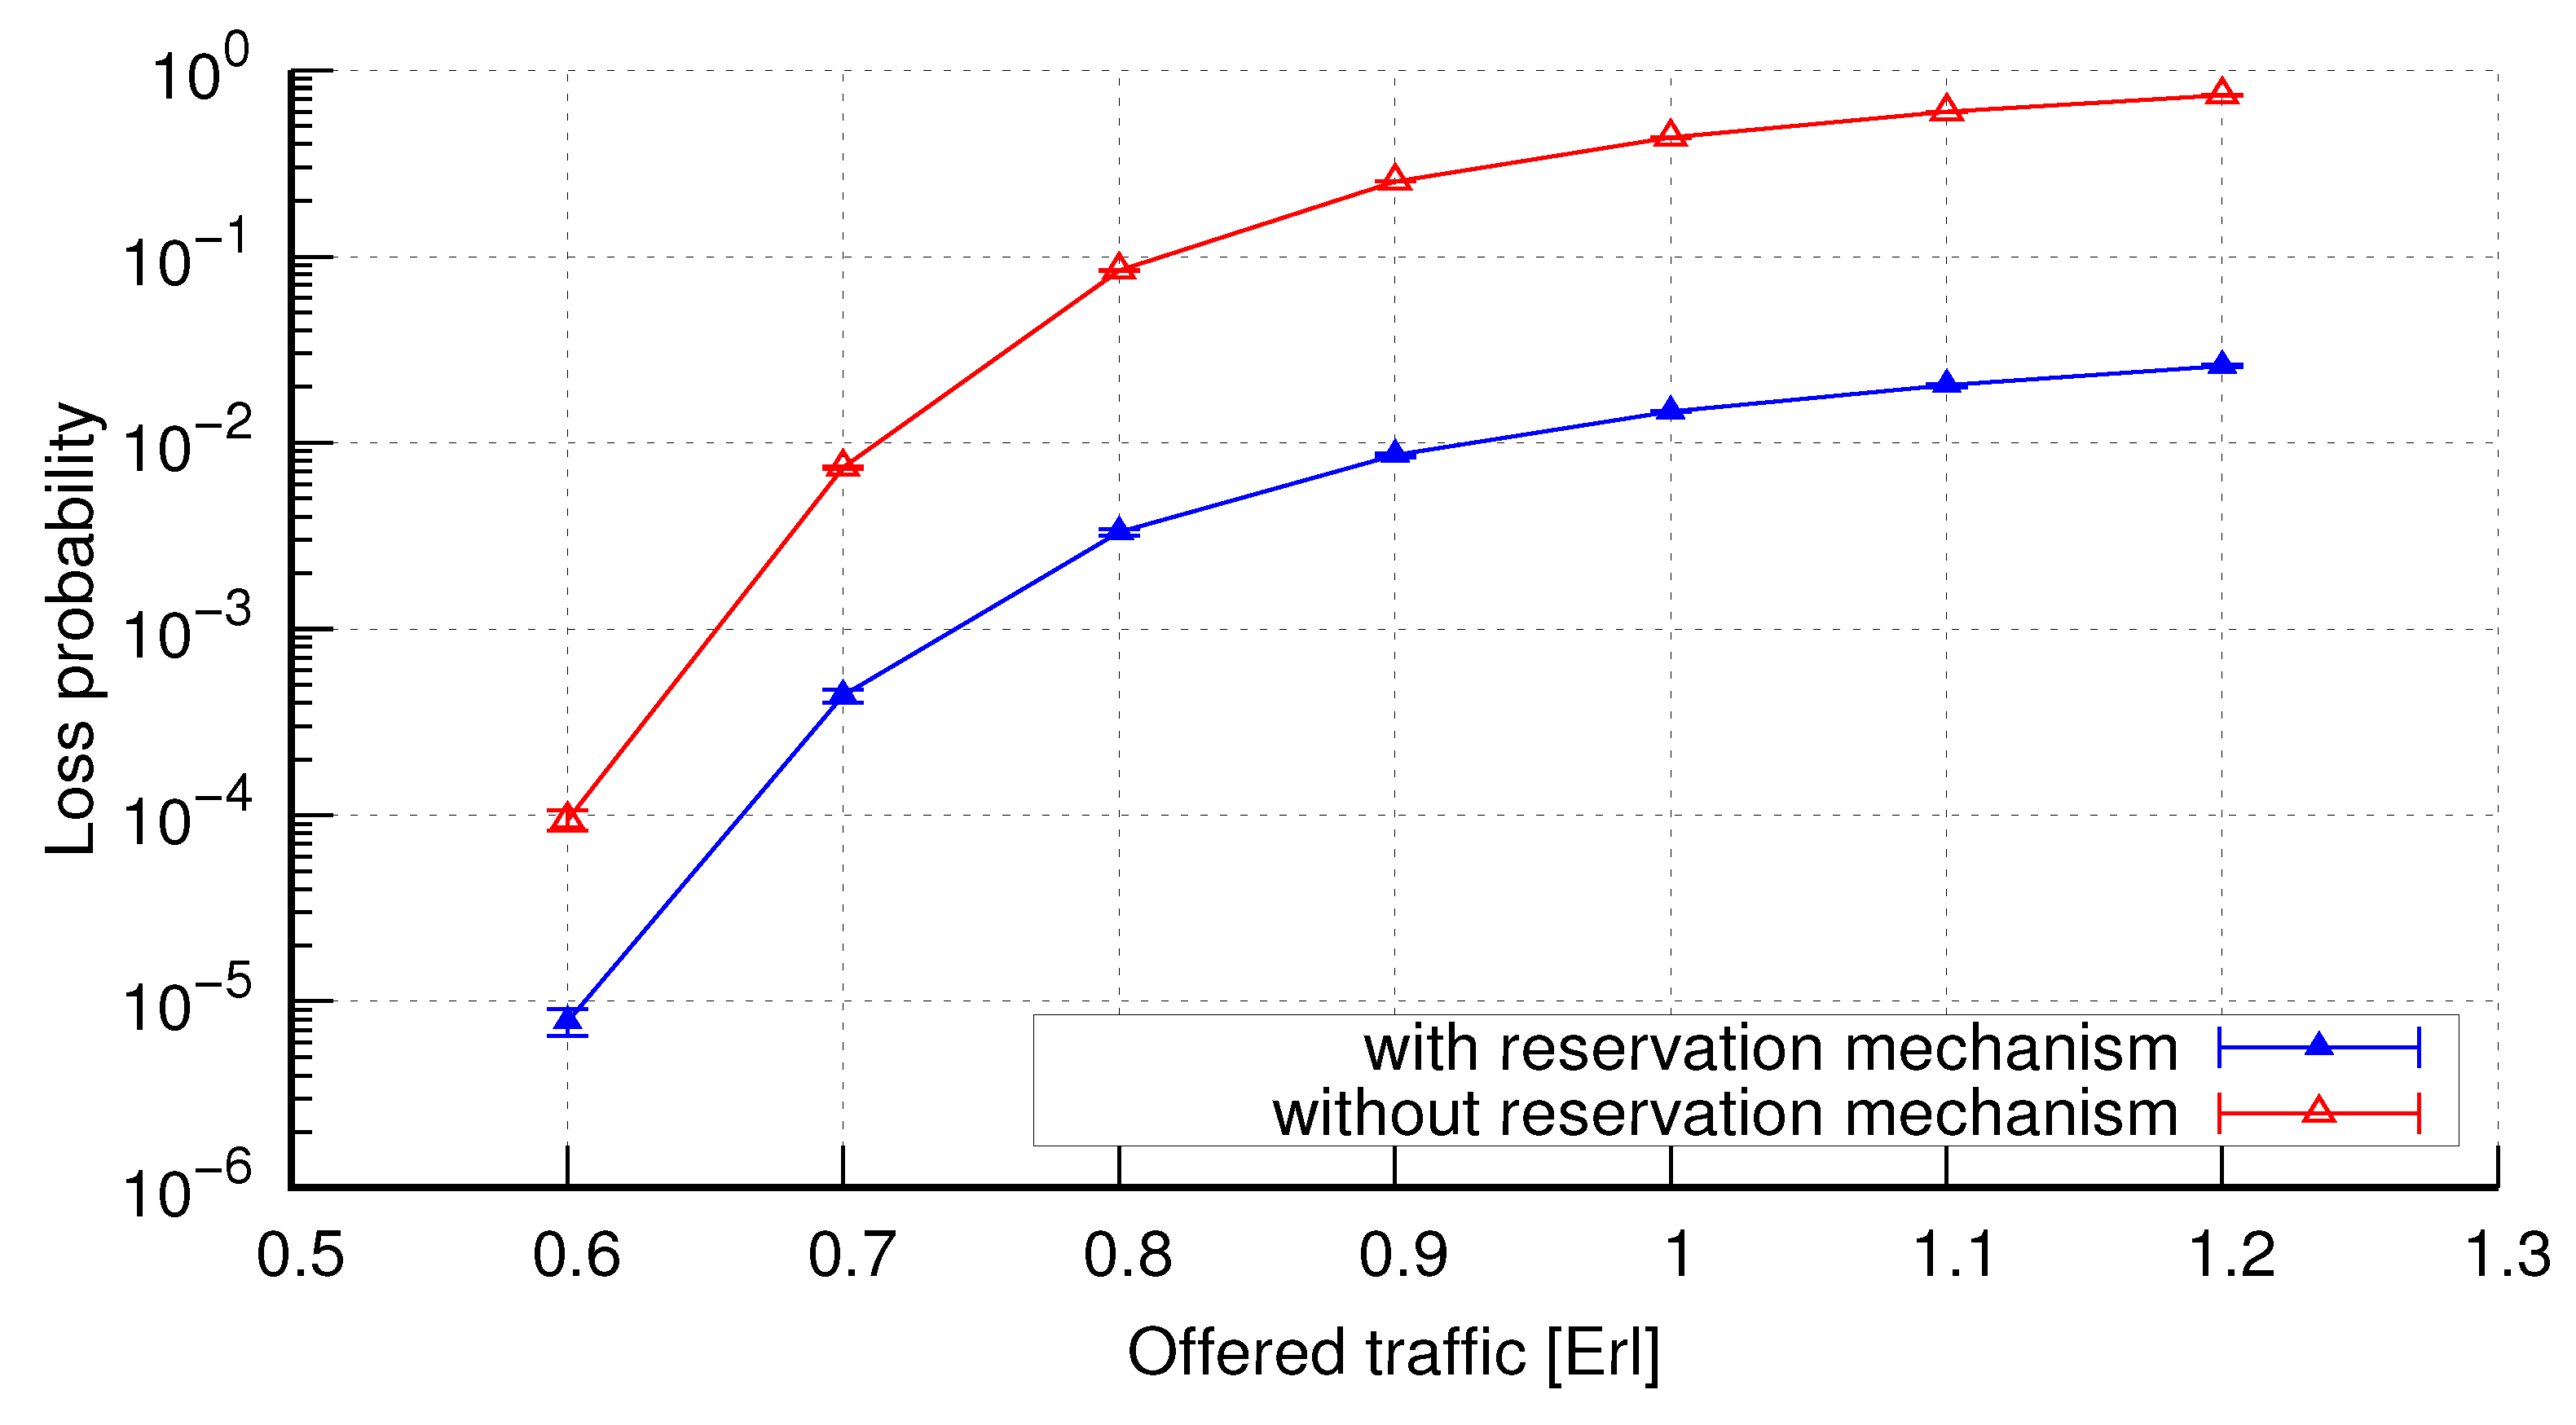
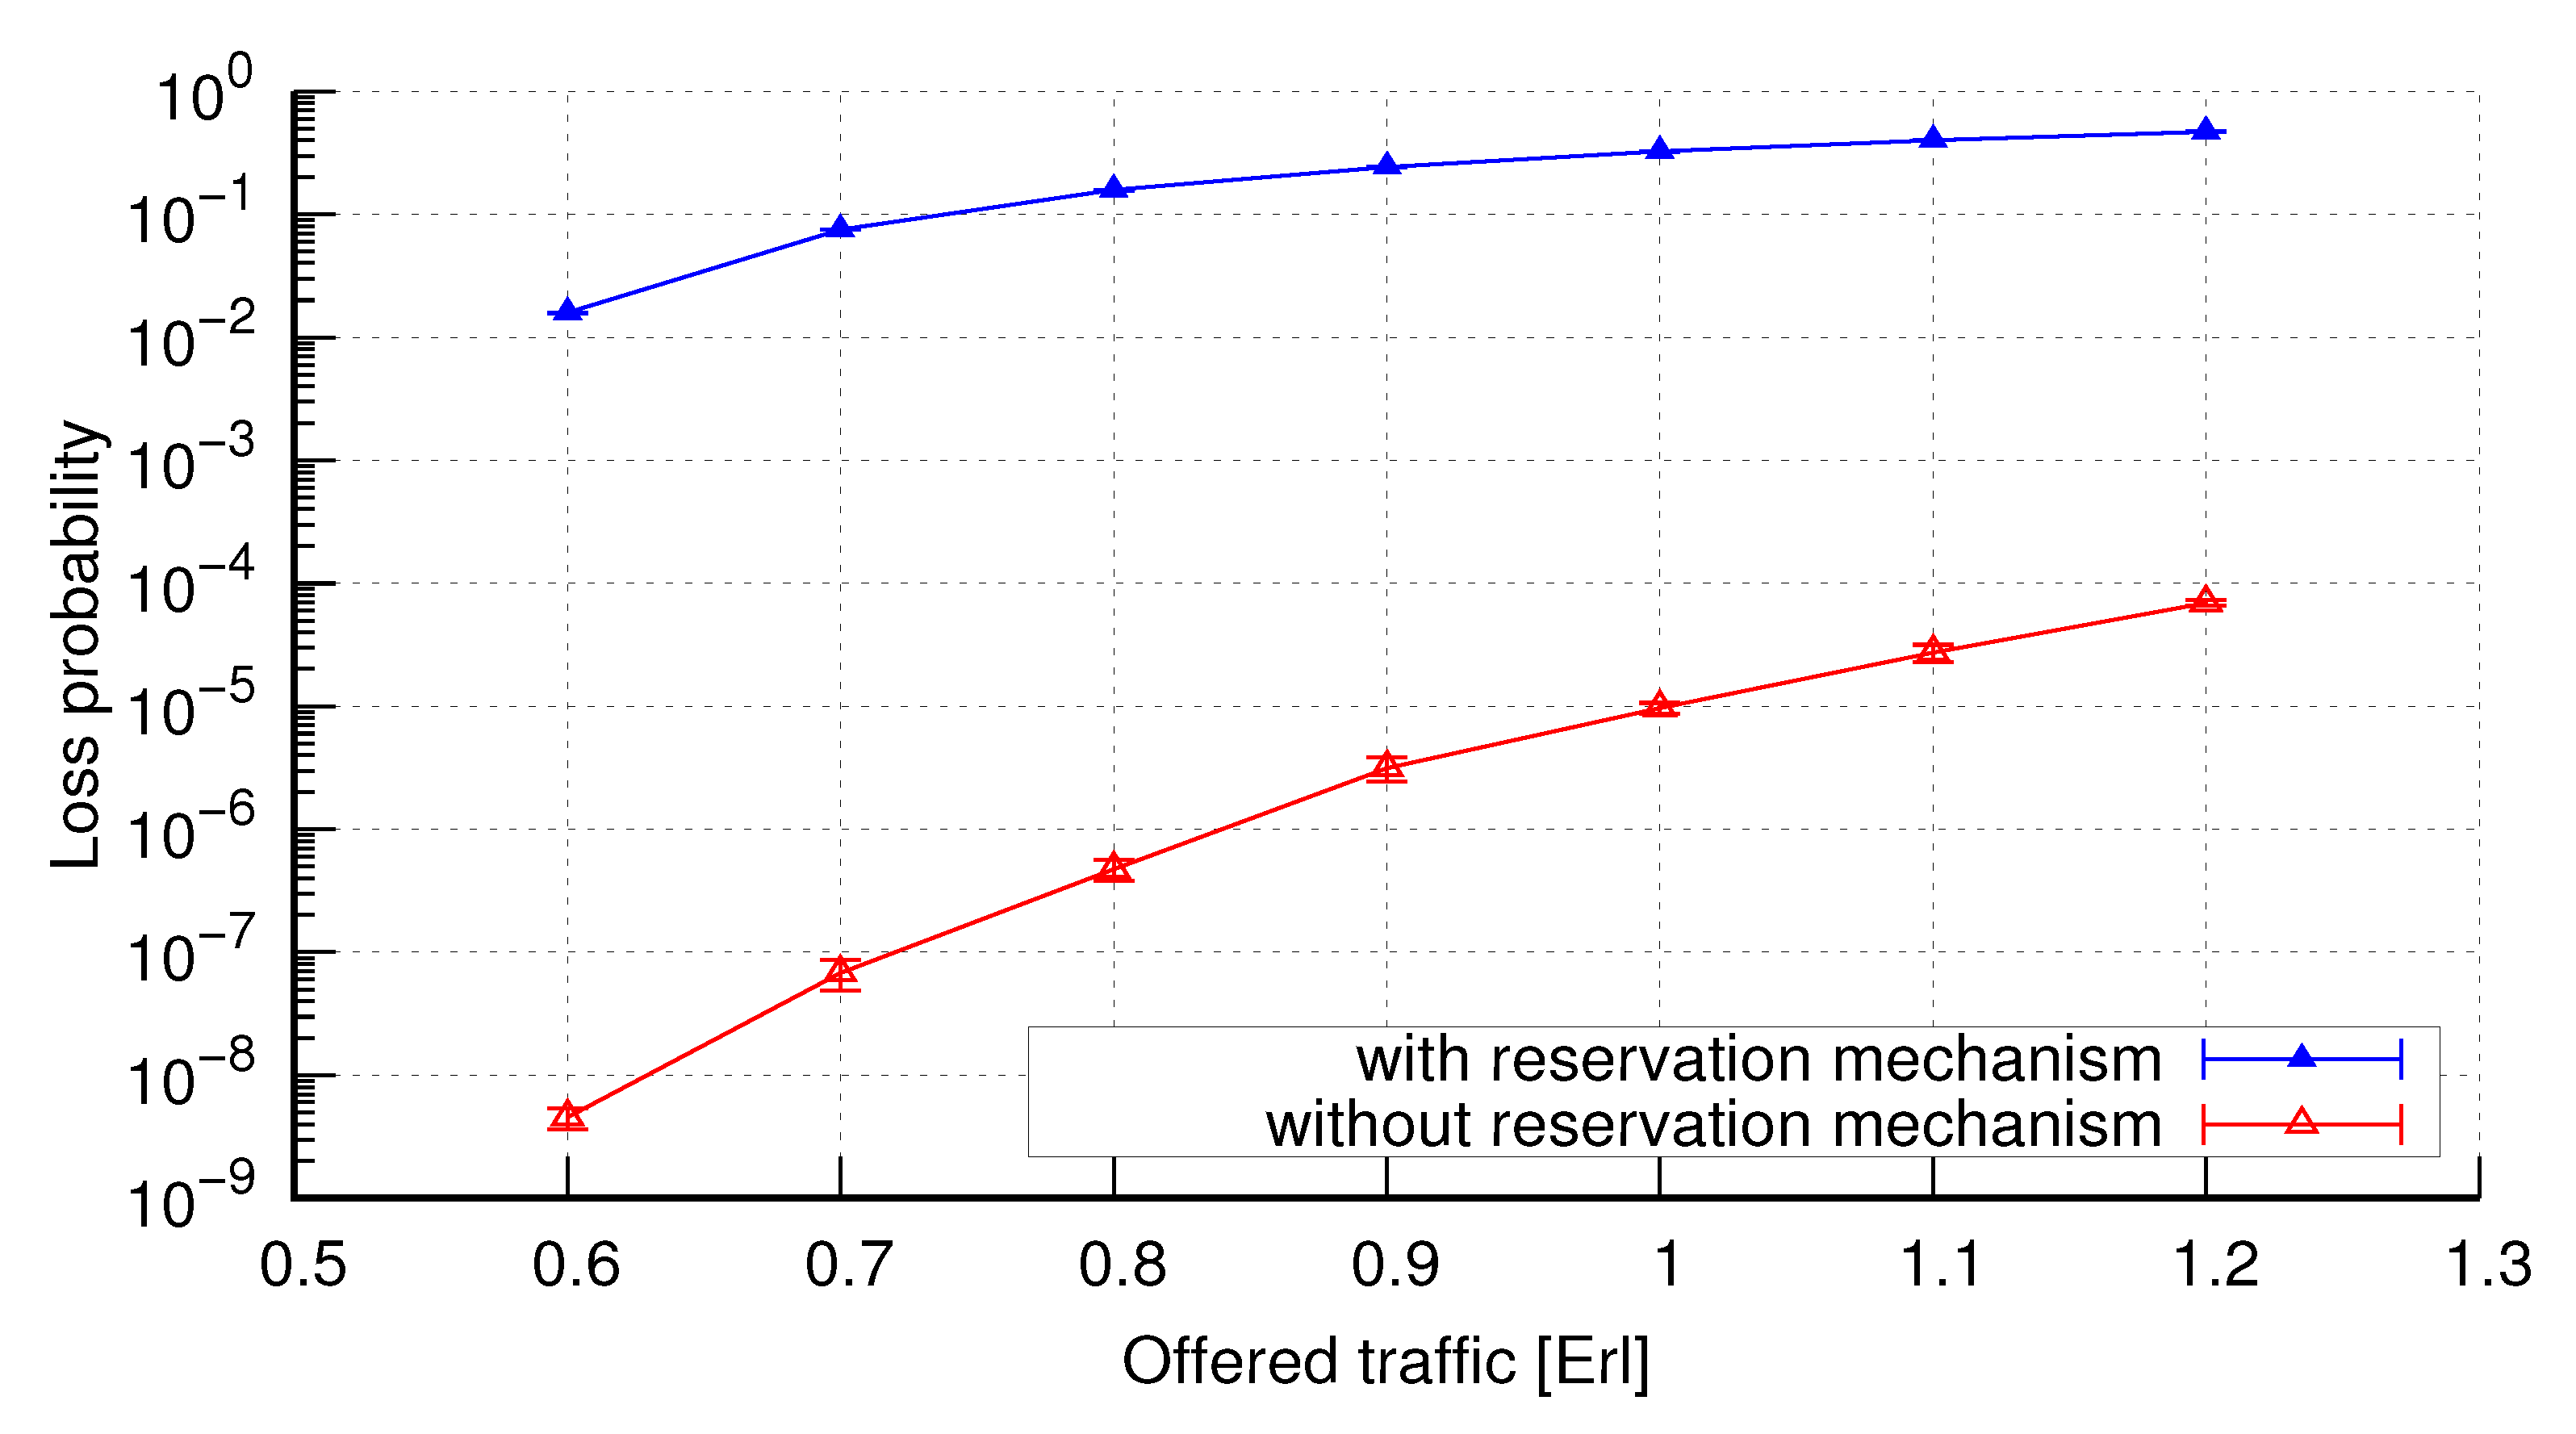
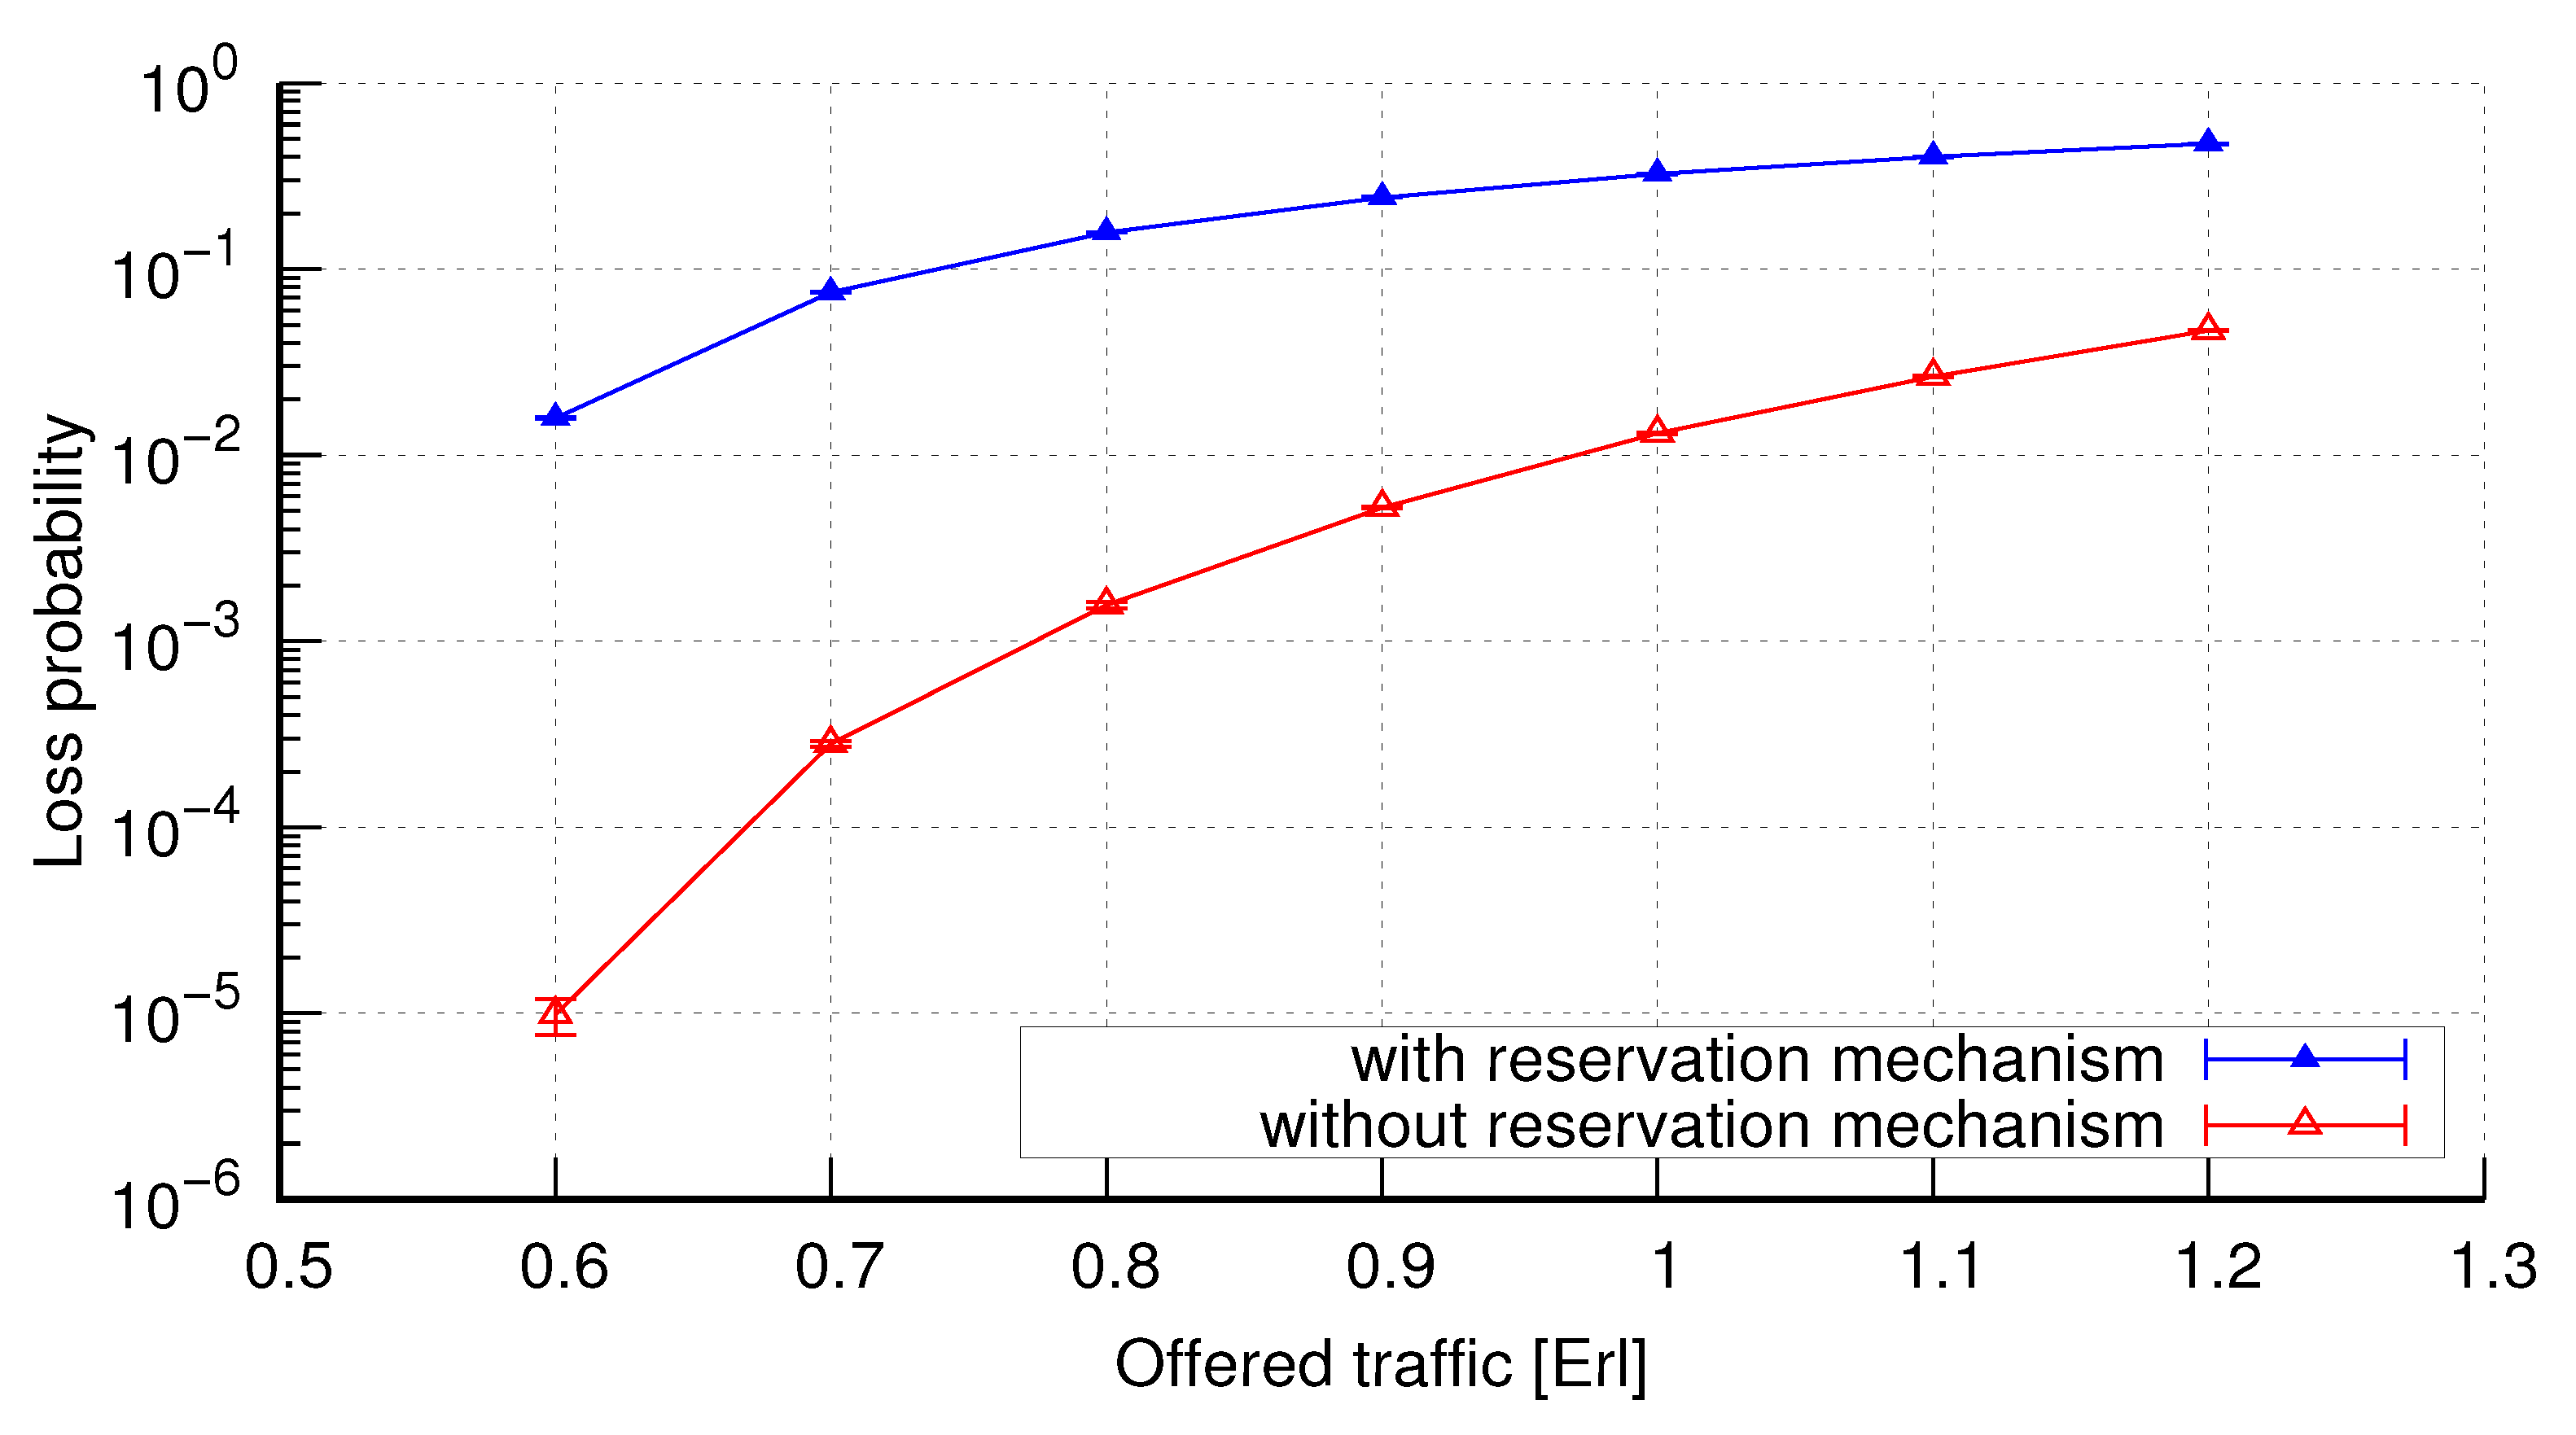
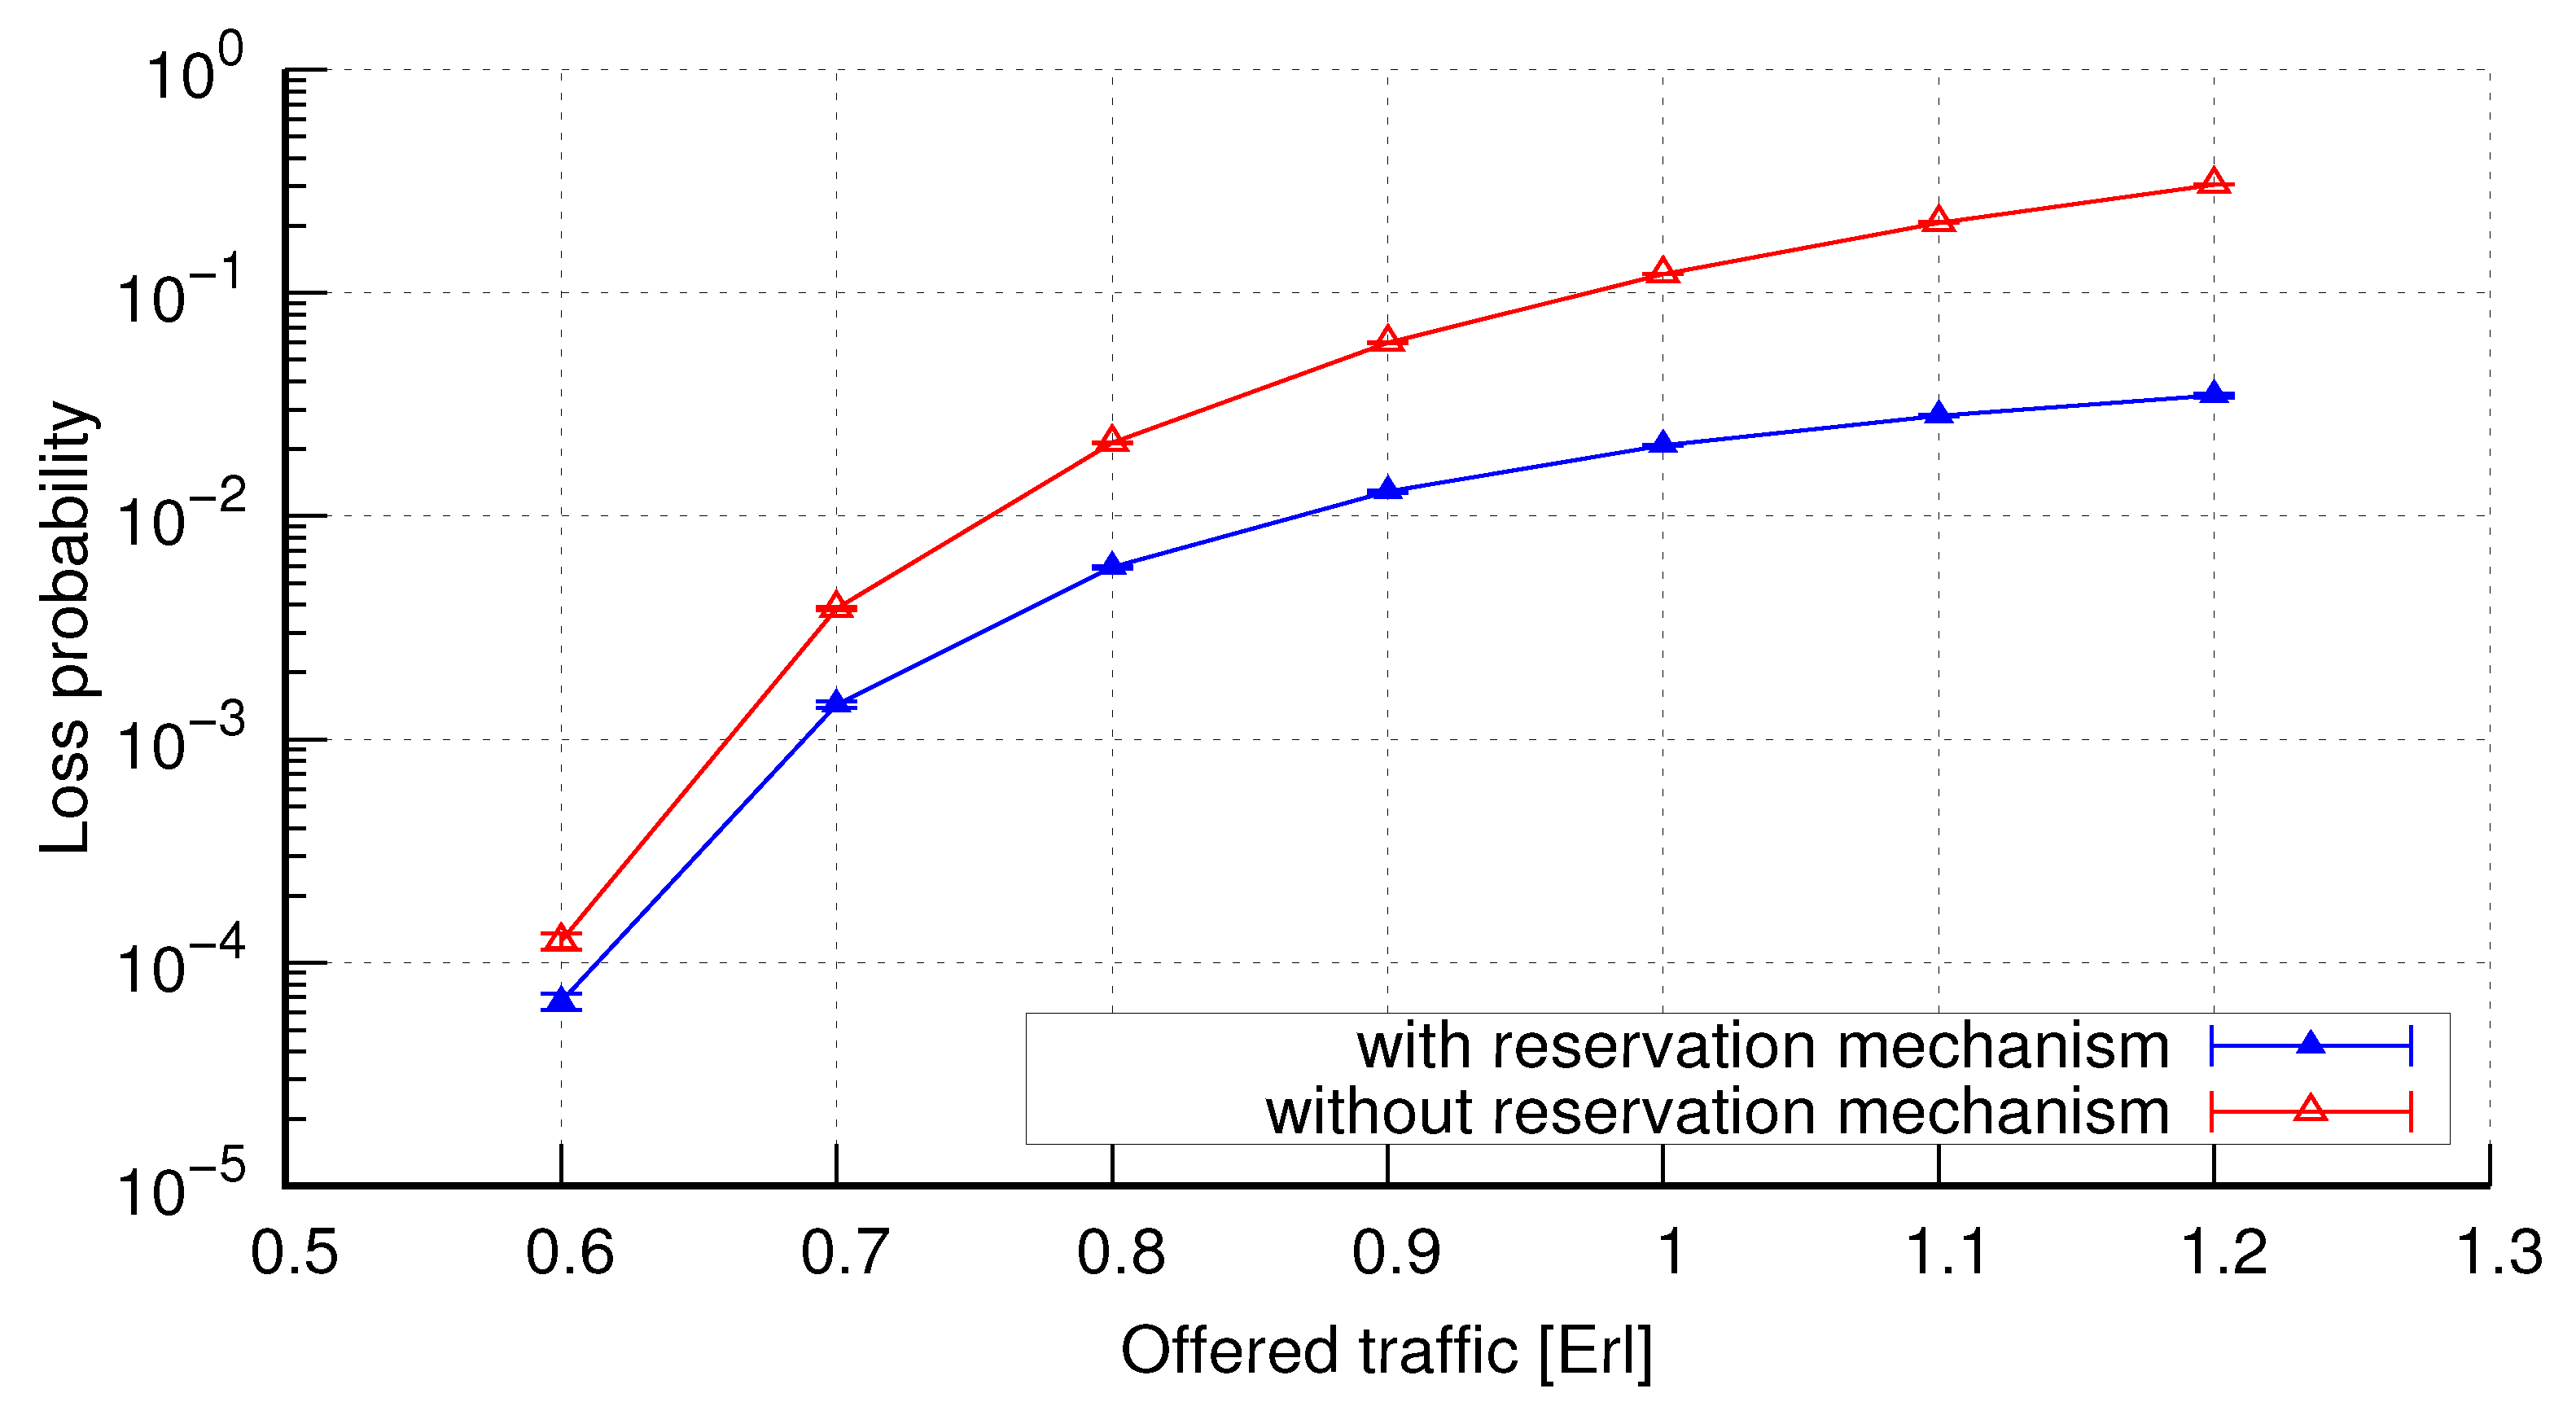
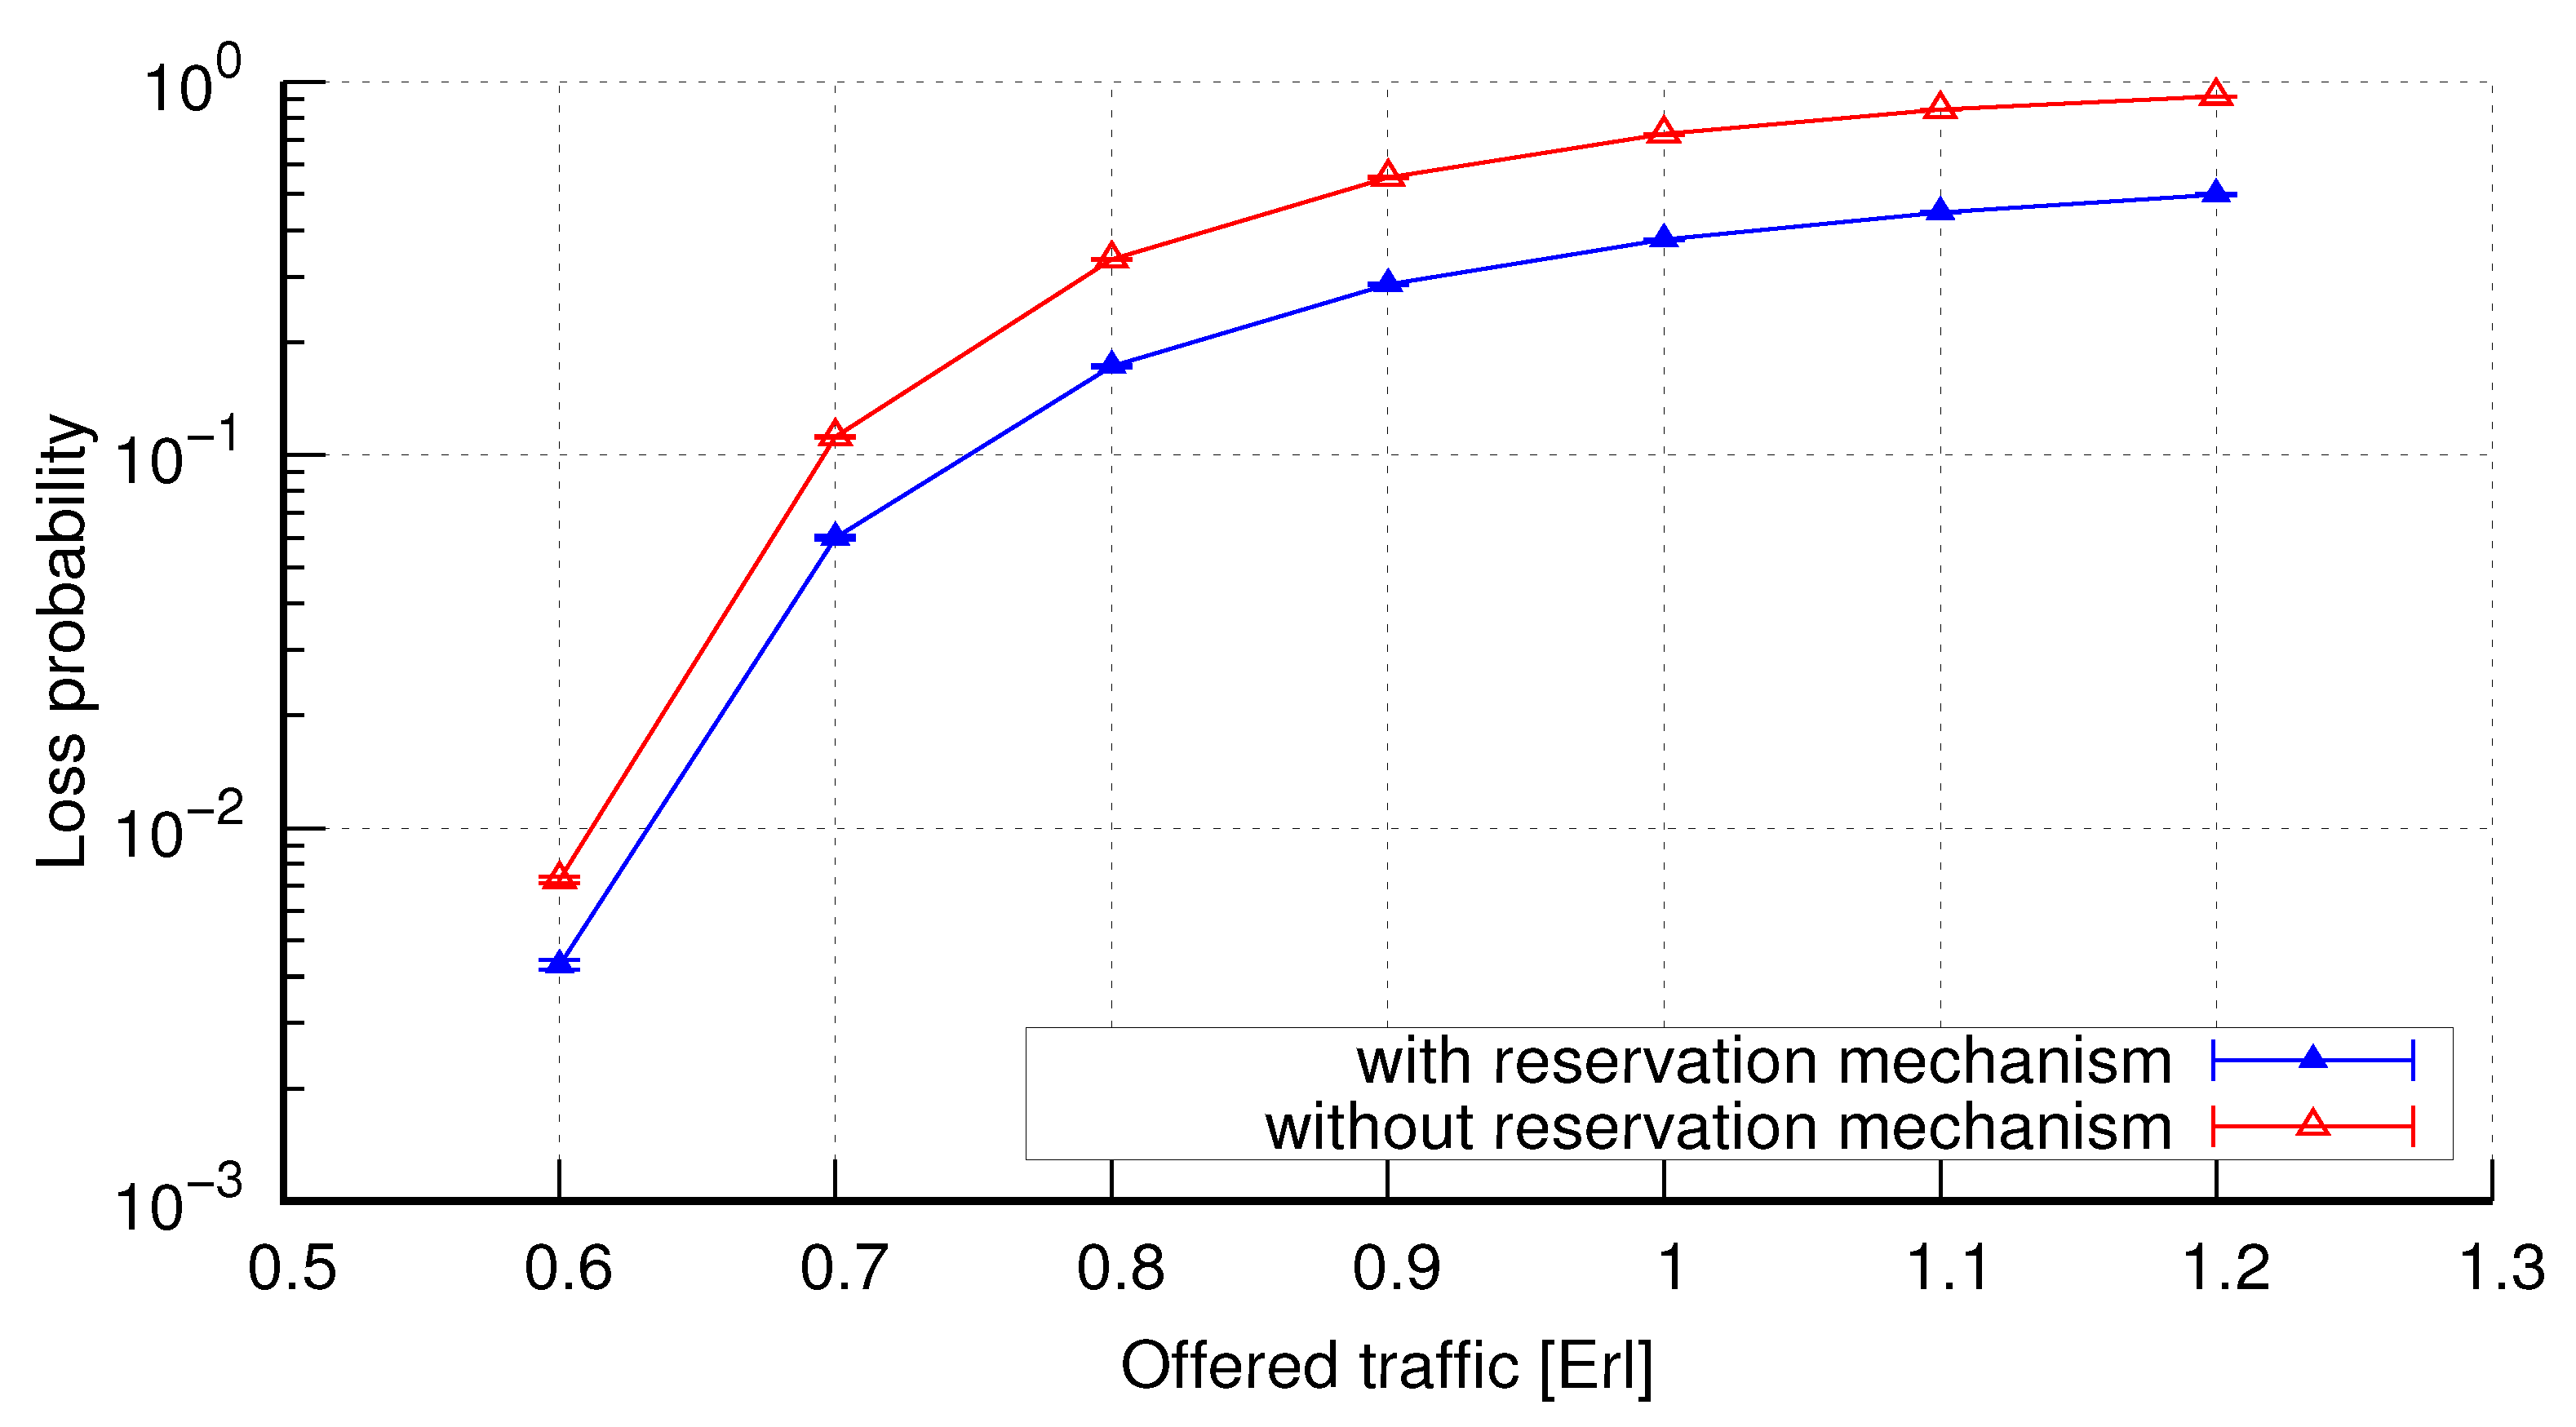
Figure 8, Figure 9, Figure 10, Figure 11, Figure 12, Figure 13 and Figure 14 show the values of the loss probability for calls of individual traffic classes in relation to the traffic value a offered to a single FSU. In the graphs, the values of the loss probability in the system with introduced reservation mechanism and the system without reservation mechanism are compared. It is observable that in the case of the classes that belong to the set , the values of the loss probability increase (in the case of the system with reservation) as compared to the values of the loss probability in the system without reservation (Figure 8, Figure 9, Figure 11 and Figure 12). In the case of the classes that do not belong to the set (privileged classes in the system with reservation), we can observe a decrease in the loss probability as compared to the values obtained for the same classes in the system without reservation (Figure 10, Figure 13 and Figure 14).
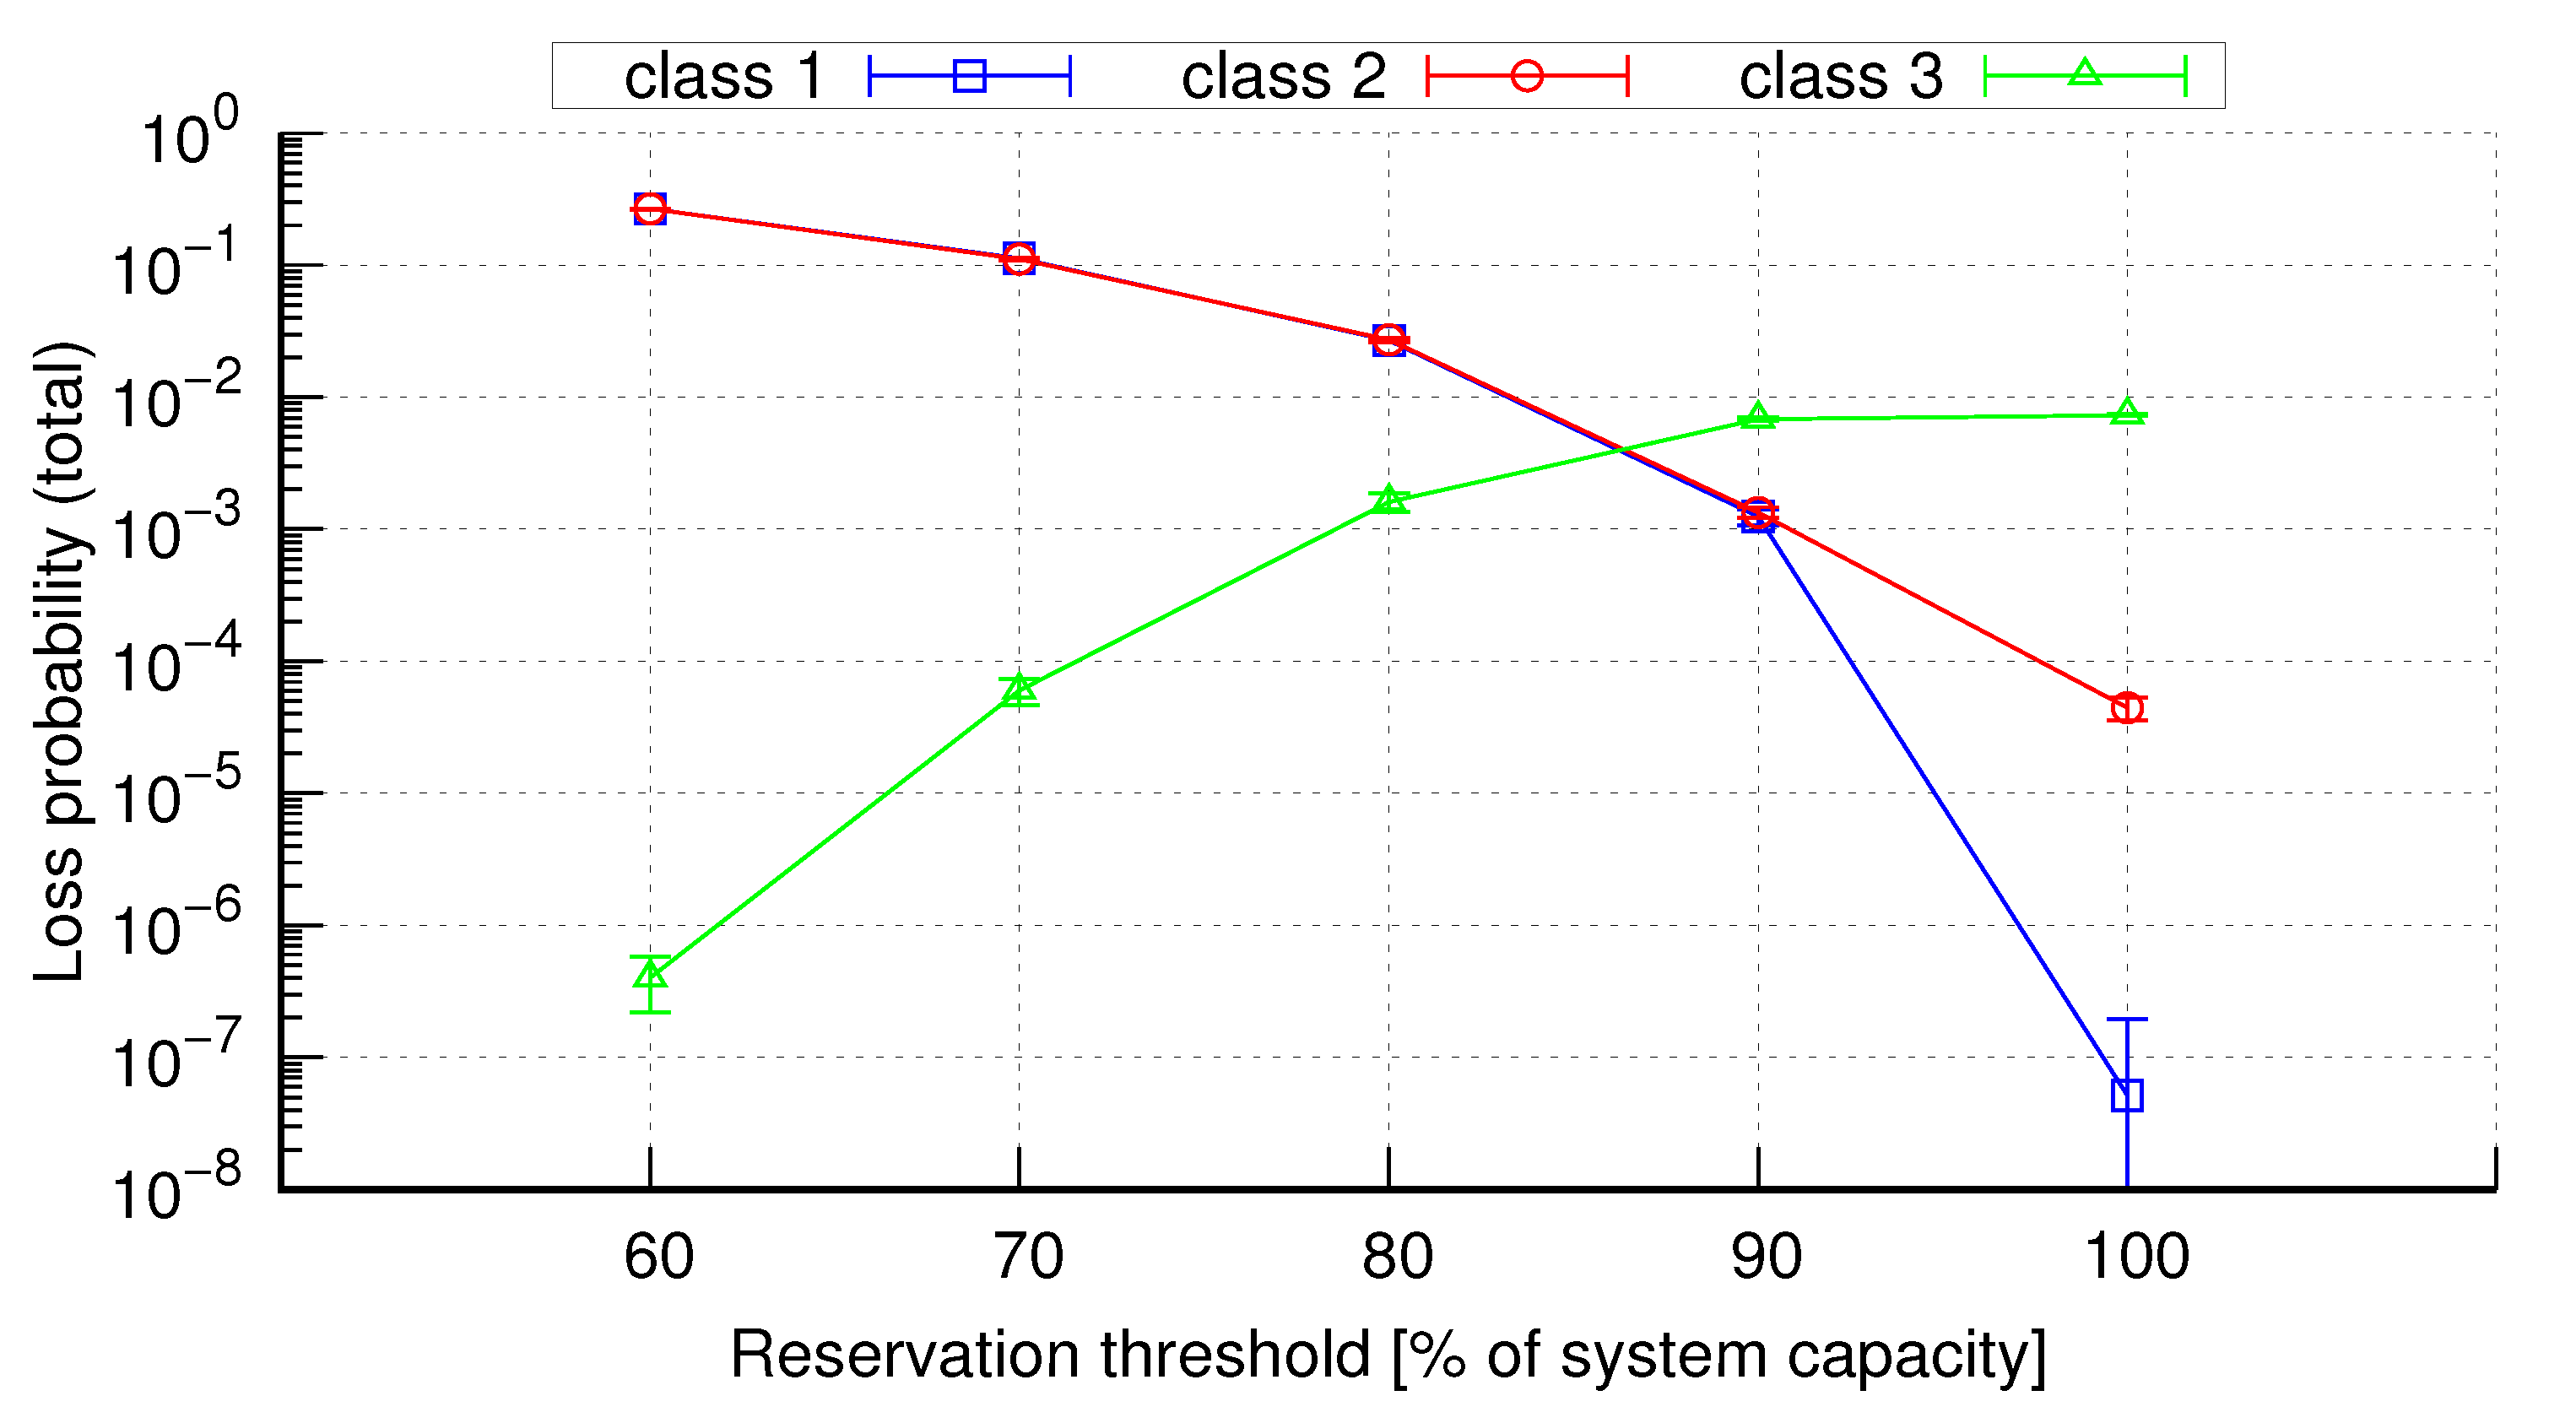
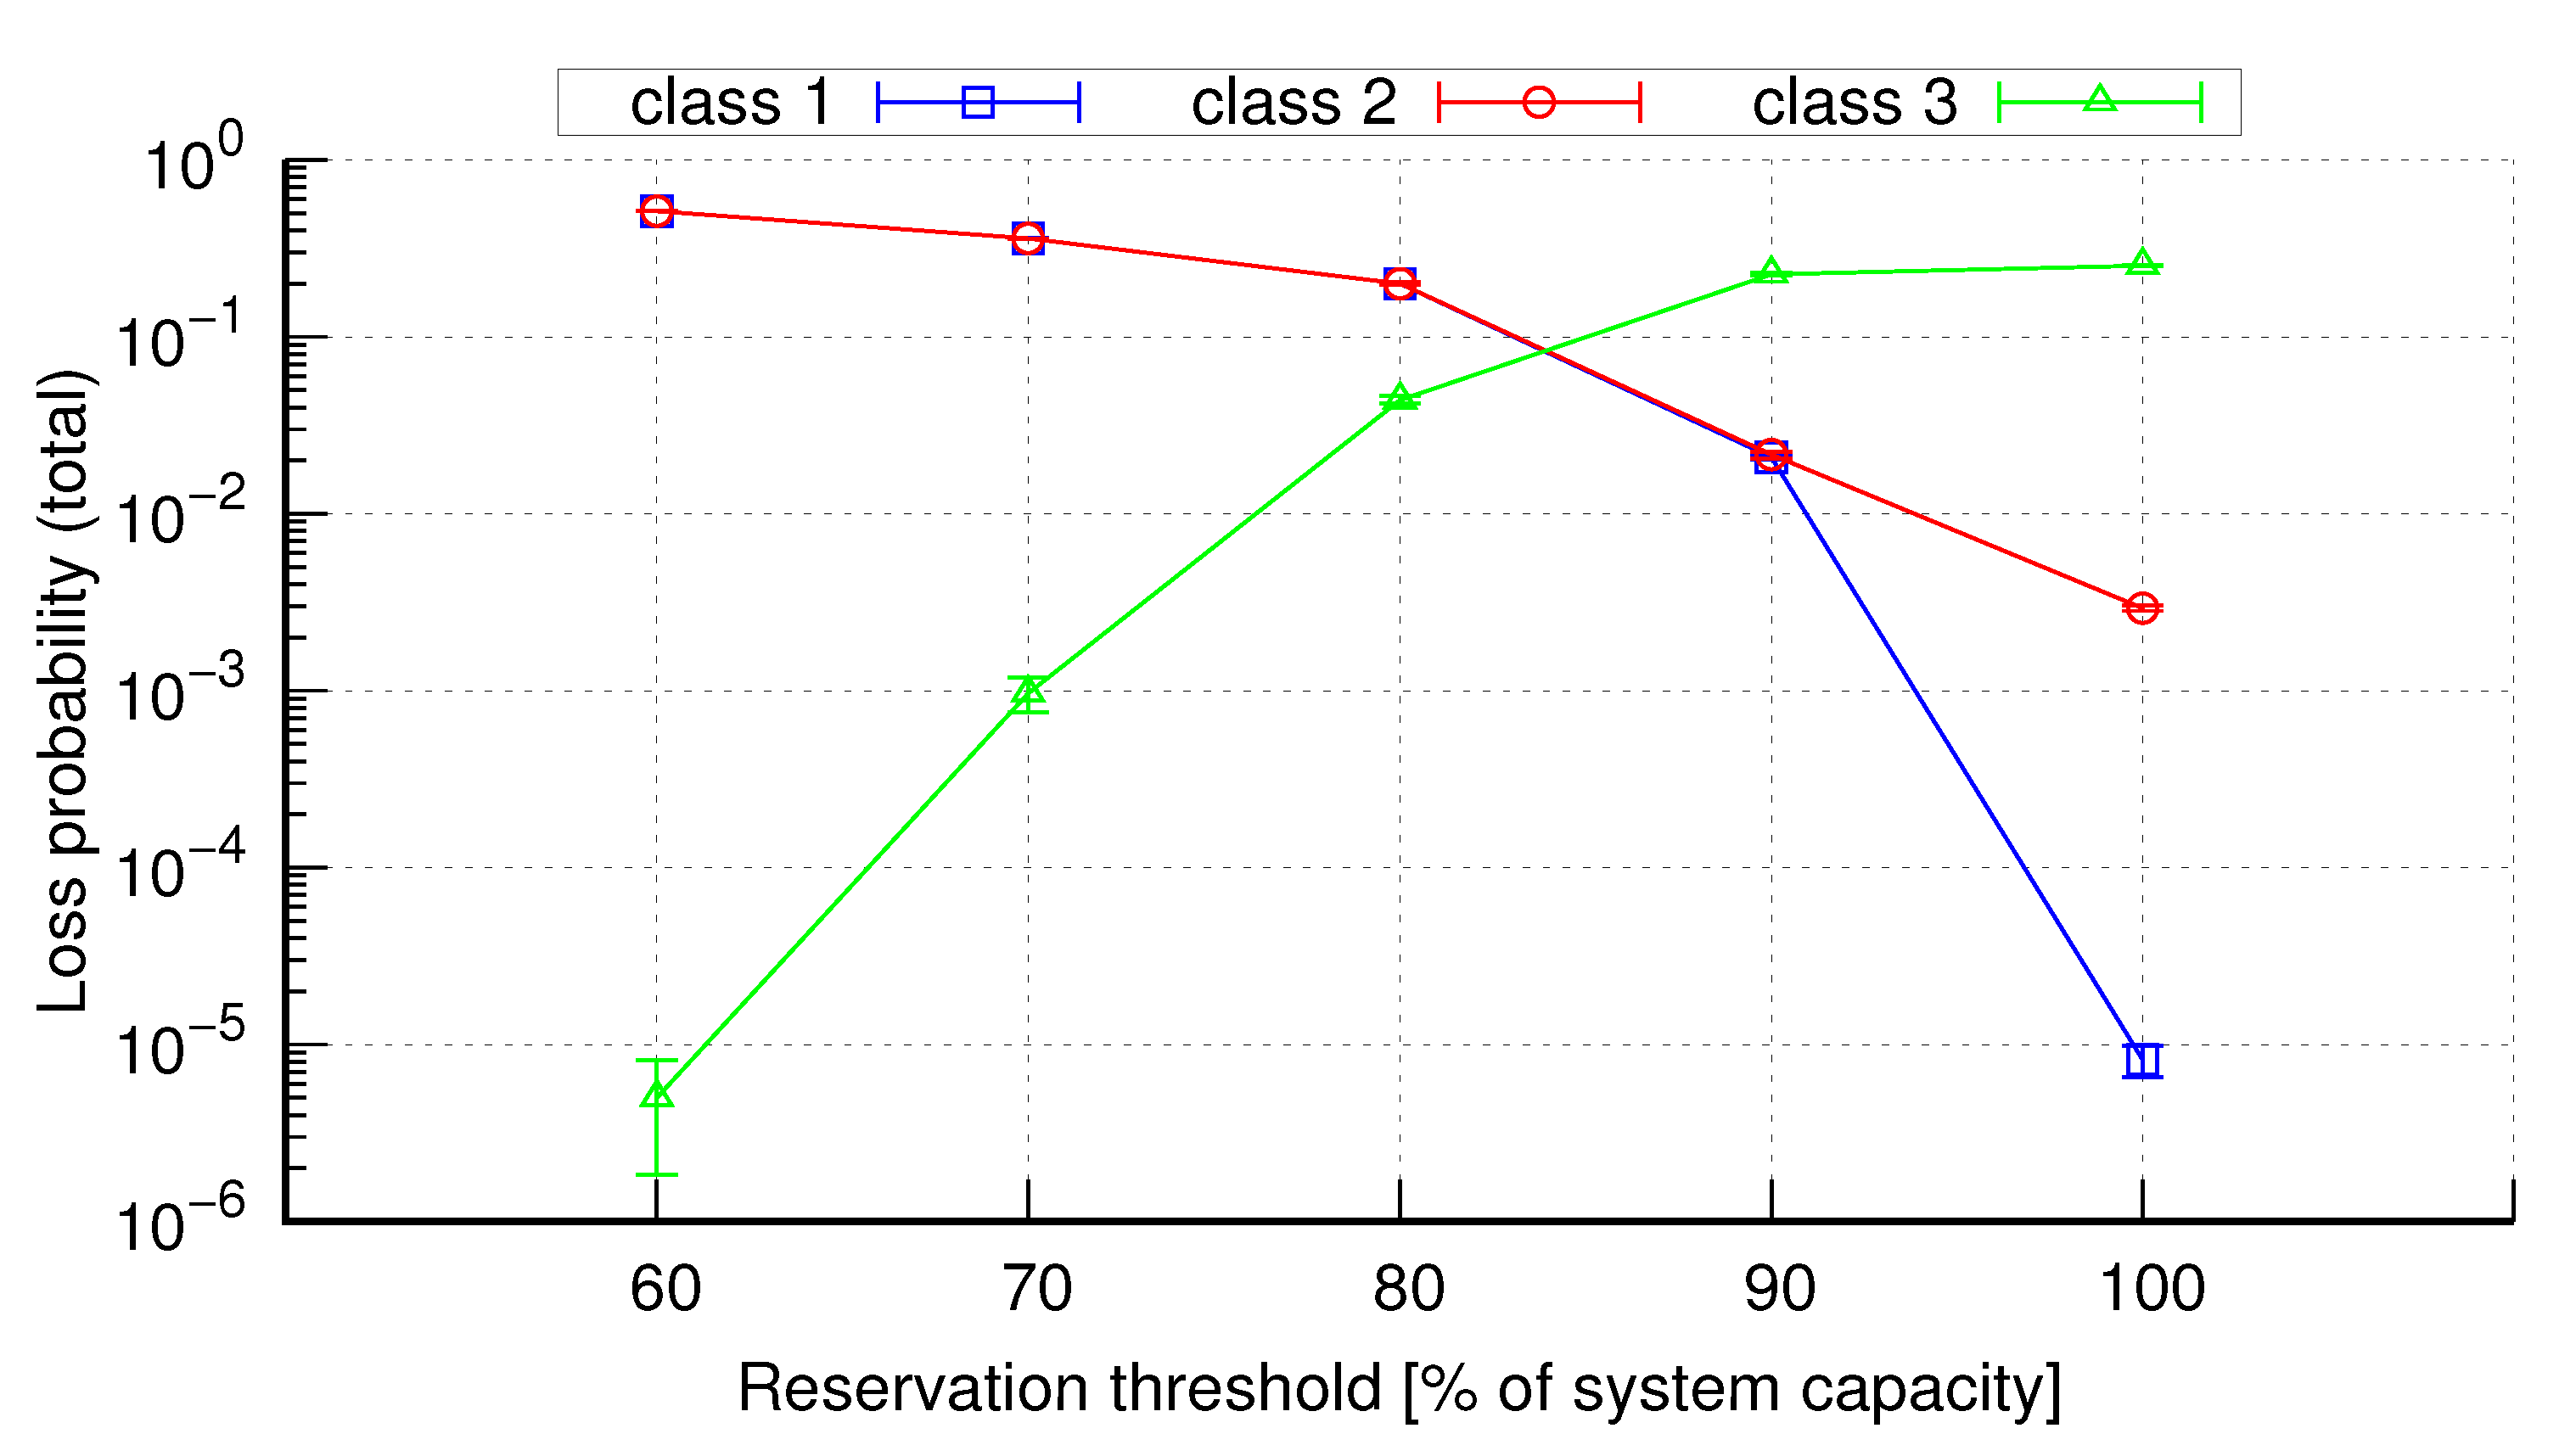
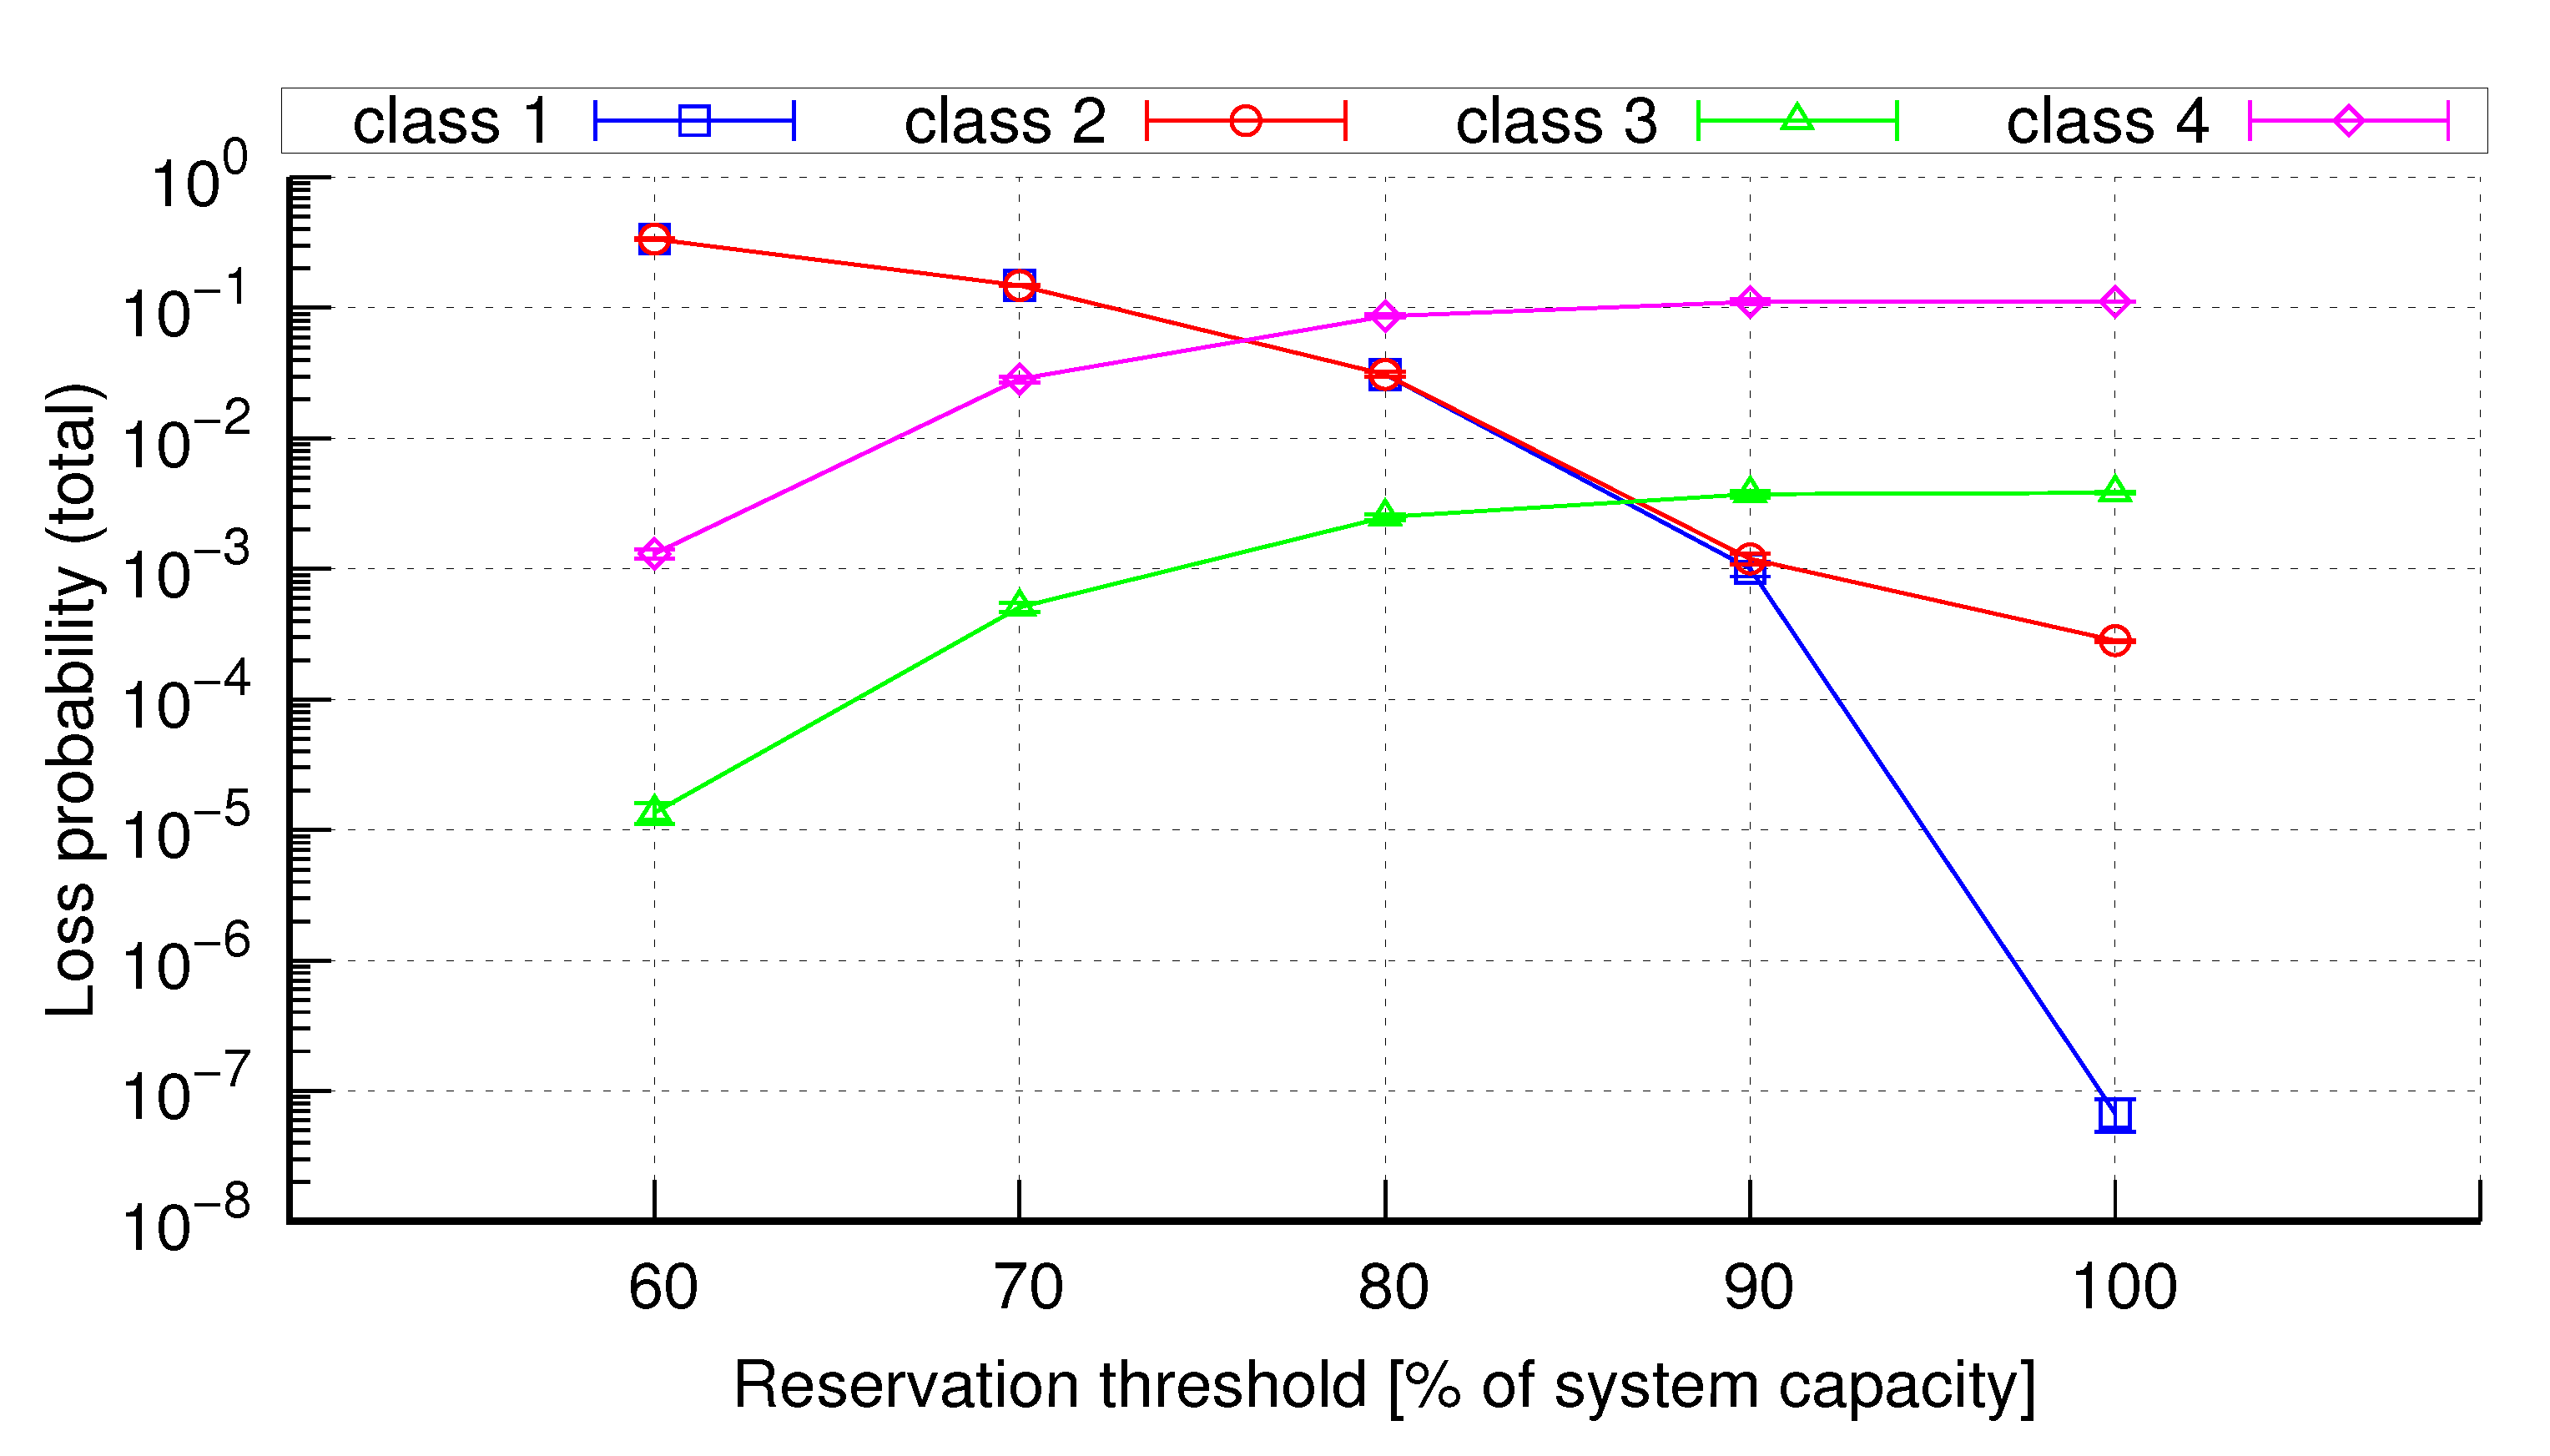
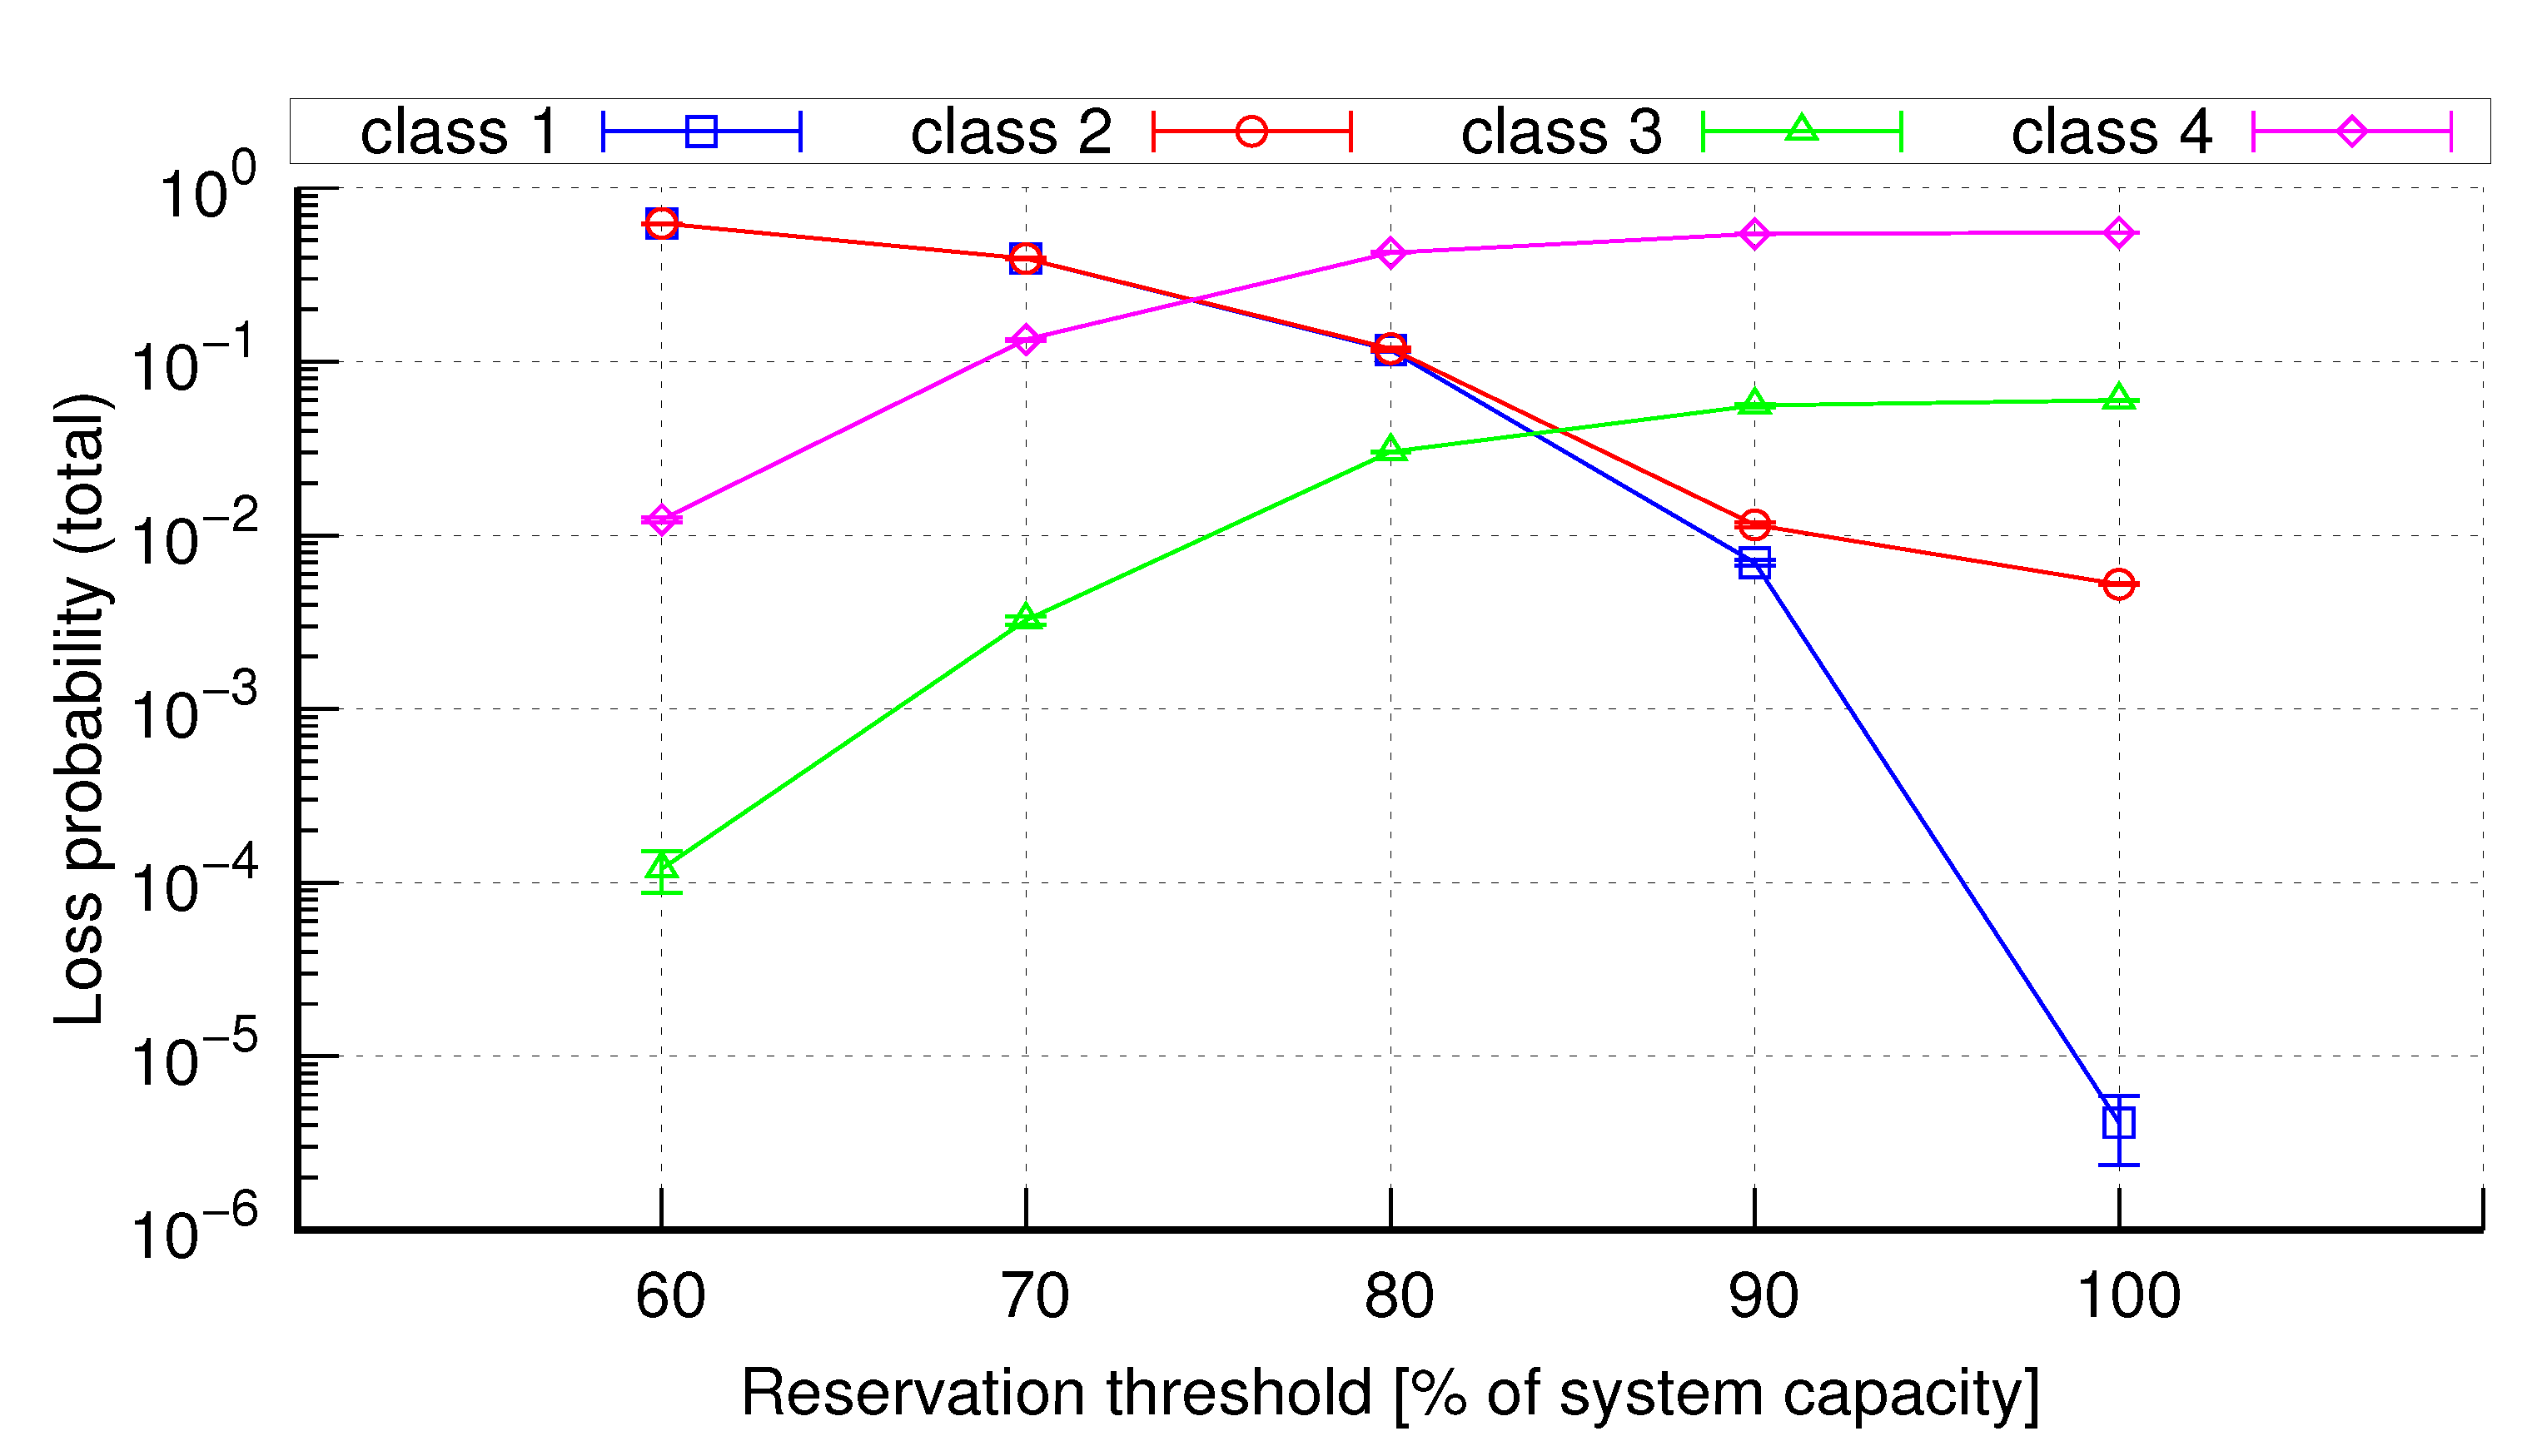
Additionally, a study on the influence of the value of the reservation threshold on the values of the loss probability obtained for calls of particular traffic classes in the switching network with reservation was performed. The results of the study are presented in Figure 15, Figure 16, Figure 17 and Figure 18. The analysis of obtained results shows that the values of the loss probability for privileged classes (i.e., those that do not belong to the set ) increase with the increase in the value of the reservation threshold. The increase in the value of the reservation threshold involves a decrease in the volume of resources reserved for privileged classes. On the other hand, in the case of the classes that belong to the set , we can observe a decrease in the loss probability with the increase in the value of the reservation threshold. It is also possible to find such a value of the reservation threshold for which equalisation of the value of the loss probability for calls that belong to the set with one privileged class occurs. In addition, it should be added that in Figure 15, Figure 16, Figure 17 and Figure 18, the value of the reservation threshold that is equal to 100% means that each traffic class has access to all resources of the system (as if it was a system without reservation).
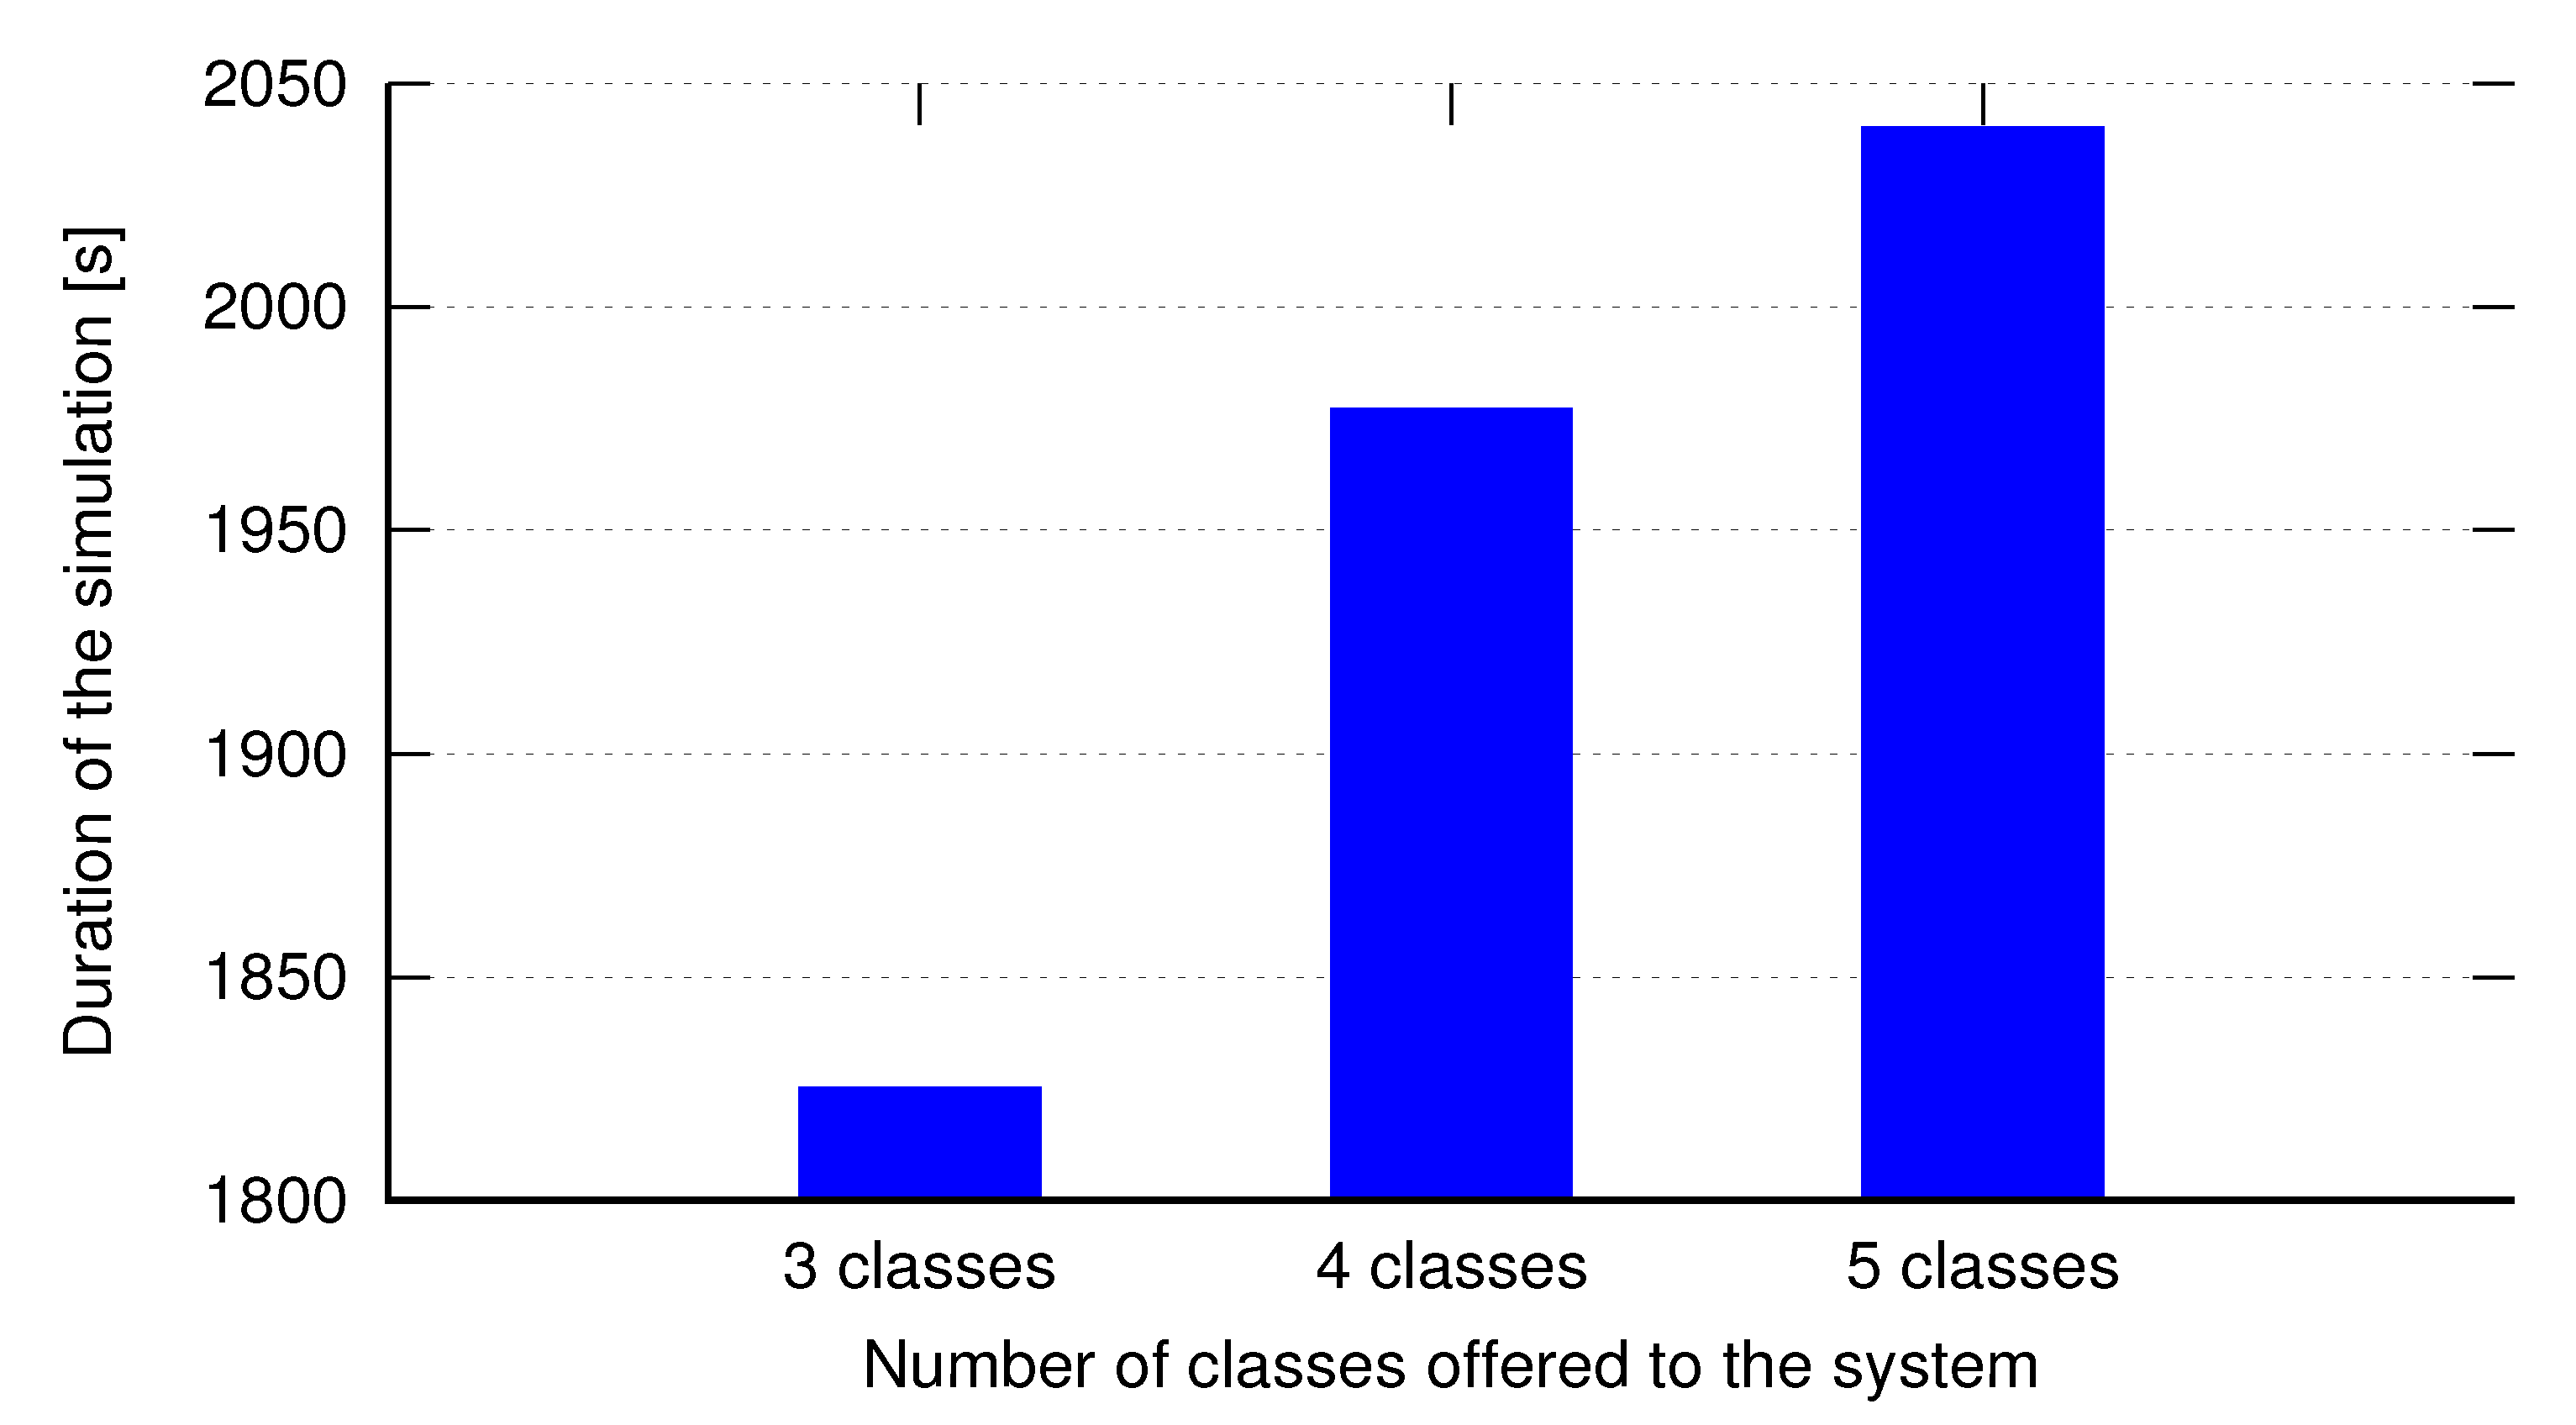
Yet another study was also conducted to examine the dependence between the duration of a single simulation run and the number of traffic classes offered to the switching network. The network under investigation was a network with the point-to-group structure with the following structure: and FSUs. The traffic classes offered to the system were defined by the following parameters: FSU, , FSUs, , FSUs, , FSUs, , FSUs, . All traffic classes generated calls that formed Erlang traffic streams. The network was offered 3, 4 and 5 traffic classes, respectively. To ensure credibility of obtained results, in each case the aggregate number of calls generated by all traffic classes offered to the switching network was 7,000,000. The simulations were run on a server platform with Intel Xeon X5670 processor and 32 GB RAM memory. The results are shown in Figure 19 in the form of a bar graph. It is observable that the number of traffic classes offered to the system has only slight influence on the duration of a simulation run. The differences in time do not exceed 10%.
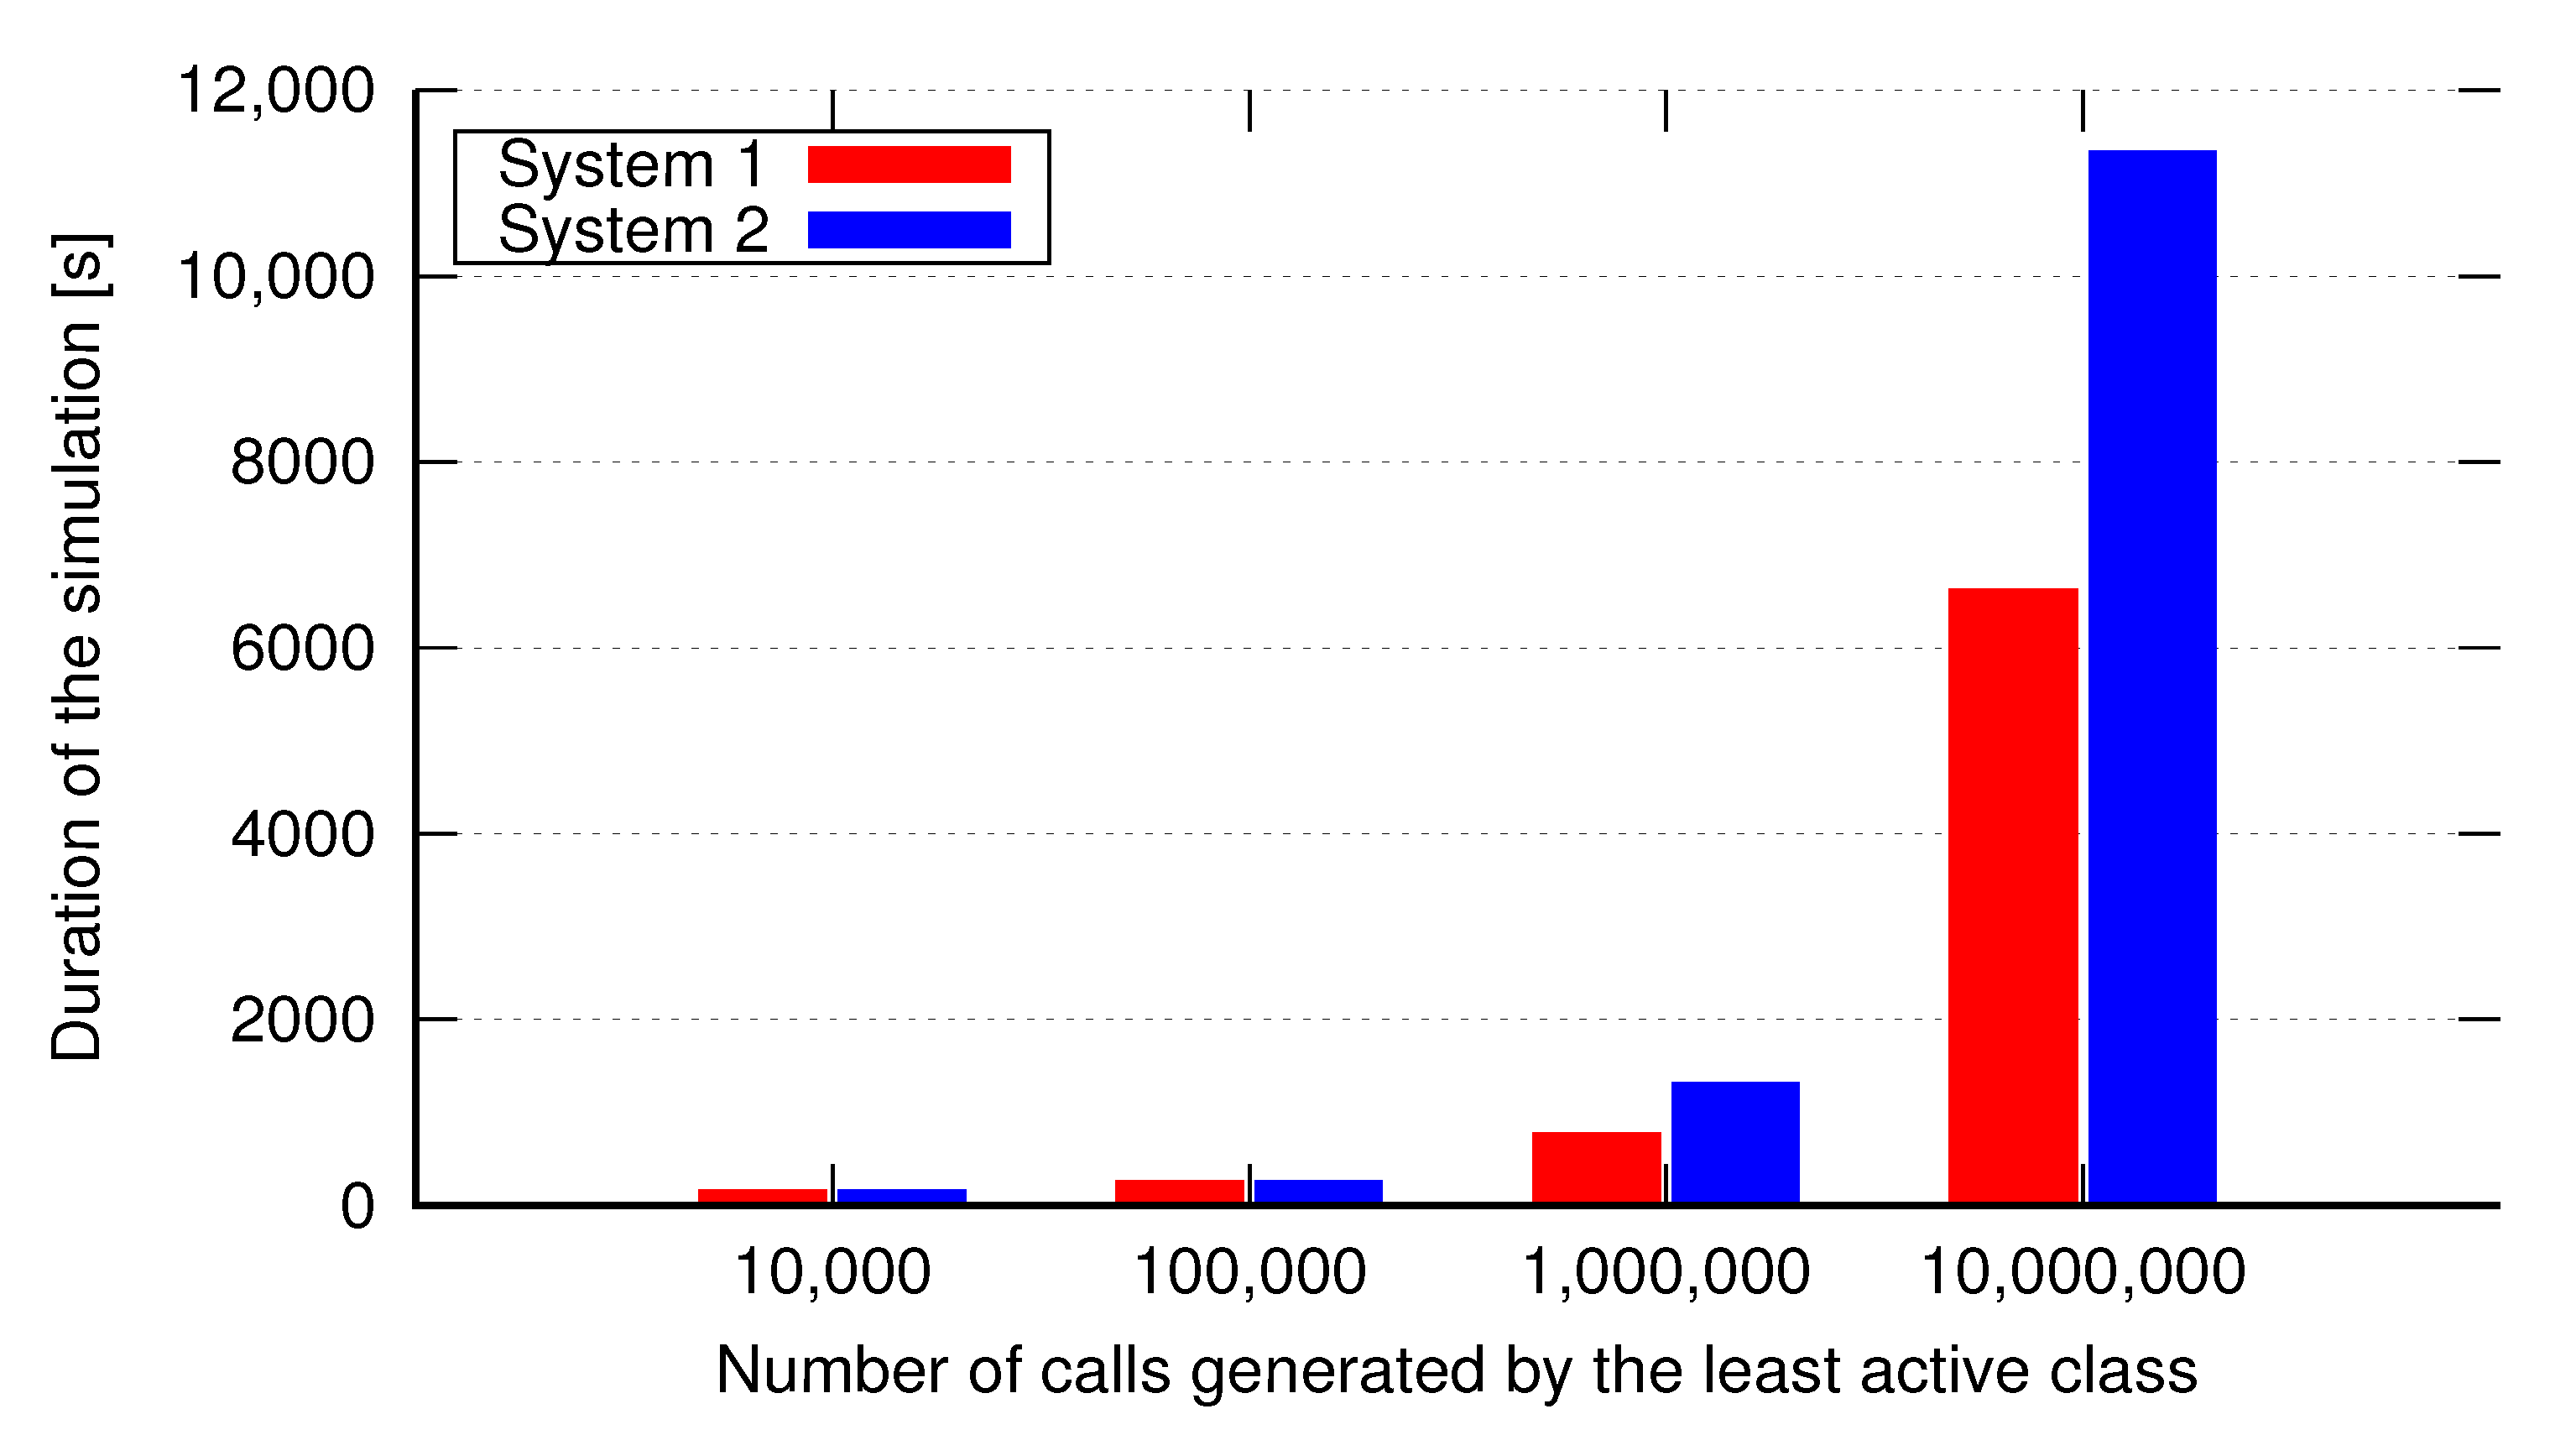
An analysis of the length of the simulation program (of one simulation run) in relation to the required number of generated calls of the least active class was also performed. The results are presented in Figure 20 in the form of a bar chart. The study was performed for the systems presented in Table 1 and the value of traffic is offered to a single FSU. The analysis of the results reveals that along with the increase in the number of generated calls, the duration time of the simulation also significantly increases.
8. Conlusions
This article shows the results of a study on the determination of the loss probability for calls of traffic classes offered in EON networks with implemented reservation mechanisms. The authors also performed an analysis of the influence of the value of the reservation threshold on the obtained values of the loss probability. As a result, the analysis will make it possible to adjust the choice of the value of the reservation threshold with the most optimal method. The article also presents the analysis of the influence of the number of the classes offered to the switching network with reservation mechanism and the number of calls generated by the least active class on the duration time of the simulation program. In the future, the authors intend to develop analytical methods that would determine loss probabilities in EON networks with Clos structure and introduced reservation mechanisms, while the developed simulator would be used as an appropriate tool for verification and validation of these methods.
Author Contributions
Conceptualization, M.S. and P.Z.; methodology, P.Z.; software, M.S.; validation, E.L., M.S. and P.Z.; formal analysis, E.L.; investigation, M.S.; resources, E.L.; writing—original draft preparation, M.S. and P.Z.; writing—review and editing, M.S.; visualization, M.S.; supervision, P.Z.; project administration, E.L.; funding acquisition, P.Z. All authors have read and agreed to the published version of the manuscript.
Funding
This research was funded in part by the Polish Ministry of Science and Higher Education under Grant 0313/SBAD/1305.
Data Availability Statement
The data presented in this study are available upon request from the corresponding author. The data are not publicly available due to the project limitation.
Conflicts of Interest
The authors declare no conflict of interest. The funders had no role in the design of the study; in the collection, analyses or interpretation of data; in the writing of the manuscript or in the decision to publish the results.
Abbreviations
The following abbreviations are used in this manuscript:
| QoS | Quality of Service; |
| CAC | Call Admission Control; |
| EON | Elastic Optical Networks; |
| FSU | Frequency Slot Unit; |
| W-S-W | Wavelength-Space-Wavelength; |
| BV-WSS | Bandwidth-Variable Wavelength Selective Switch; |
| BV-SS | Bandwidth-Variable wavelength selective Space Switch; |
| BV-WS | Bandwidth-Variable Wavelength converting Switch; |
| PC | Passive Converter; |
| TWBC | Tunable Waveband Bandwidth Converter; |
| QAM | Quadrature Amplitude Modulation; |
| QPSK | Quadrature Phase-Shift Keying. |
References
- Said Elsayed, M.; Le-Khac, N.A.; Jurcut, A.D. Dealing With COVID-19 Network Traffic Spikes [Cybercrime and Forensics]. IEEE Secur. Priv. 2021, 19, 90–94. [Google Scholar] [CrossRef]
- ITU-T. G.694.1: Spectral Grids for WDM Applications: DWDM Frequency Grid; Technical Report; International Telecommunication Union—Telecommunication Standardization Sector (ITU-T): Geneva, Switzerland, 2012.
- Gerstel, O.; Jinno, M.; Lord, A.; Yoo, S.J.B. Elastic optical networking: A new dawn for the optical layer? IEEE Commun. Mag. 2012, 50, s12–s20. [Google Scholar] [CrossRef]
- Jinno, M.; Takara, H.; Kozicki, B.; Tsukishima, Y.; Sone, Y.; Matsuoka, S. Spectrum-efficient and scalable elastic optical path network: Architecture, benefits, and enabling technologies. IEEE Commun. Mag. 2009, 47, 66–73. [Google Scholar] [CrossRef]
- Proietti, R.; Liu, L.; Scott, R.P.; Guan, B.; Qin, C.; Su, T.; Giannone, F.; Yoo, S.J.B. 3D elastic optical networking in the temporal, spectral, and spatial domains. IEEE Commun. Mag. 2015, 53, 79–87. [Google Scholar] [CrossRef]
- Tomkos, I.; Azodolmolky, S.; Solé-Pareta, J.; Careglio, D.; Palkopoulou, E. A tutorial on the flexible optical networking paradigm: State of the art, trends, and research challenges. Proc. IEEE 2014, 102, 1317–1337. [Google Scholar] [CrossRef]
- Politi, C.T.; Anagnostopoulos, V.; Matrakidis, C.; Stavdas, A.; Lord, A.; López, V.; Fernández-Palacios, J. Dynamic Operation of Flexi-Grid OFDM-based Networks. In Proceedings of the Optical Fiber Communication Conference, Los Angeles, CA, USA, 4–8 March 2012; p. OTh3B.2. [Google Scholar] [CrossRef]
- Sugihara, S.; Hirota, Y.; Fujii, S.; Tode, H.; Watanabe, T. Dynamic resource allocation for immediate and advance reservation in space-division-multiplexing-based elastic optical networks. IEEE/OSA J. Opt. Commun. Netw. 2017, 9, 183–197. [Google Scholar] [CrossRef]
- Tode, H.; Fukushima, A.; Tanigawa, Y.; Hirota, Y. Spectrum assignment and update method based on adaptive soft reservation in elastic optical networks. In Proceedings of the 2016 21st OptoElectronics and Communications Conference (OECC) Held jointly with 2016 International Conference on Photonics in Switching (PS), Niigata, Japan, 3–7 July 2016; pp. 1–3. [Google Scholar]
- Henrique Bonani, L.; Carlos Farias de Queiroz, J.; Deffert, M.A. Classes of Service Defined by Soft Trunk Reservation Technique in Elastic Optical Networks. In Proceedings of the 2018 20th International Conference on Transparent Optical Networks (ICTON), Bucharest, Romania, 1–5 July 2018; pp. 1–4. [Google Scholar] [CrossRef]
- Kabaciński, W.; Michalski, M.; Rajewski, R. Strict-Sense Nonblocking W-S-W Node Architectures for Elastic Optical Networks. J. Light. Technol. 2016, 34, 3155–3162. [Google Scholar] [CrossRef]
- Abdulsahib, M.; Michalski, M.; Kabaciński, W. Optimization of wide-sense nonblocking elastic optical switches. Opt. Switch. Netw. 2019, 33, 85–94. [Google Scholar] [CrossRef]
- Kabaciński, W.; Michalski, M.; Rajewski, R. Optimization of strict-sense nonblocking wavelength-space-wavelength elastic optical switching fabrics. Opt. Switch. Netw. 2019, 33, 76–84. [Google Scholar] [CrossRef]
- 1x9/1x20 Flexgrid® Wavelength Selective Switch (WSS). Available online: https://www.epsglobal.com/products/optoelectronics/wavelength-management/wss/1x9-1x20-flexgrid%C2%AE-wavelength-selective-switch-(ws (accessed on 18 July 2021).
- Tyszer, J. Object-Oriented Computer Simulation Of Discrete-Event Systems; Kluwer Academic Publishers Group: Dordrecht, The Netherlands, 1999. [Google Scholar]
- Głąbowski, M.; Ivanov, H.; Leitgeb, E.; Sobieraj, M.; Stasiak, M. Simulation studies of elastic optical networks based on 3-stage Clos switching fabric. Opt. Switch. Netw. 2020, 36, 100555. [Google Scholar] [CrossRef]
- Sobieraj, M.; Zwierzykowski, P.; Leitgeb, E. Modelling and Optimization of Multi-Service Optical Switching Networks with Threshold Management Mechanisms. Electronics 2021, 10, 1515. [Google Scholar] [CrossRef]
Figure 1.
The concept of the CAC function.

Figure 2.
Structure of a switching network with implemented reservation mechanism.

Figure 3.
A first/third stage switch. BV-WSS—bandwidth variable wavelength selective switch; TWBC—tunable waveband converter; PC—passive combiner.
Figure 3.
A first/third stage switch. BV-WSS—bandwidth variable wavelength selective switch; TWBC—tunable waveband converter; PC—passive combiner.

Figure 4.
A second stage switch. BV-WSS—bandwidth variable wavelength selective switch; PC—passive combiner.
Figure 4.
A second stage switch. BV-WSS—bandwidth variable wavelength selective switch; PC—passive combiner.

Figure 5.
Point-to-group path choice algorithm.

Figure 6.
Point-to-point path choice algorithm.

Figure 7.
Simulation algorithm.

Figure 8.
Loss probability for calls of class 1 (non-privileged class) in System 1.

Figure 9.
Loss probability for calls of class 2 (non-privileged class) in System 1.

Figure 10.
Loss probability for calls of class 3 (privileged class) in System 1.

Figure 11.
Loss probability for calls of class 1 (non-privileged class) in System 2.

Figure 12.
Loss probability for calls of class 2 (non-privileged class) in System 2.

Figure 13.
Loss probability for calls of class 3 (privileged class) in System 2.

Figure 14.
Loss probability for calls of class 4 (privileged class) in System 2.

Figure 15.
Changes in the loss probability for calls of individual traffic classes in System 1 in relation to the value of reservation threshold. The results are presented for the value Erl of traffic offered to a single FSU.
Figure 15.
Changes in the loss probability for calls of individual traffic classes in System 1 in relation to the value of reservation threshold. The results are presented for the value Erl of traffic offered to a single FSU.

Figure 16.
Changes in the loss probability for calls of individual traffic classes in System 1 in relation to the value of reservation threshold. The results are presented for the value Erl of traffic offered to a single FSU.
Figure 16.
Changes in the loss probability for calls of individual traffic classes in System 1 in relation to the value of reservation threshold. The results are presented for the value Erl of traffic offered to a single FSU.

Figure 17.
Changes in the loss probability for calls of individual traffic classes in System 2 in relation to the value of reservation threshold. The results are presented for the value Erl of traffic offered to a single FSU.
Figure 17.
Changes in the loss probability for calls of individual traffic classes in System 2 in relation to the value of reservation threshold. The results are presented for the value Erl of traffic offered to a single FSU.

Figure 18.
Changes in the loss probability for calls of individual traffic classes in System 2 in relation to the value of reservation threshold. The results are presented for the value Erl of traffic offered to a single FSU.
Figure 18.
Changes in the loss probability for calls of individual traffic classes in System 2 in relation to the value of reservation threshold. The results are presented for the value Erl of traffic offered to a single FSU.

Figure 19.
Duration of simulation in relation to the number of classes offered to the system.

Figure 20.
Duration of one simulation run in relation to the required number of generated calls of the least active class.
Figure 20.
Duration of one simulation run in relation to the required number of generated calls of the least active class.


Table 1.
Parameters of the systems under investigation.
| System 1 | System 2 | |
|---|---|---|
| Structure of switching network | , FSUs | , FSUs |
| Path choice algorithm | point-to-group | point-to-point |
| Number of traffic classes | 3 | 4 |
| Number of required FSUs | (Erlang) | (Erlang) |
| (Engset) | (Erlang) | |
| (Pascal) | (Engset) | |
| (Pascal), | ||
| Classes in set | 1, 2 | 1, 2 |
| Reservation threshold | FSUs | FSUs |
| FSUs | FSUs |
Table 2.
Number of FSUs in different connections depending on required bitrate and modulation format [7].
Table 2.
Number of FSUs in different connections depending on required bitrate and modulation format [7].
| Number of FSUs | Bitrate (Gb/s) | Modulation Format |
|---|---|---|
| 1 | 40 | 64-QAM |
| 1 | 40 | 32-QAM |
| 1 | 40 | 16-QAM |
| 2 | 40 | QPSK |
| 2 | 100 | 64-QAM |
| 2 | 100 | 32-QAM |
| 3 | 100 | 16-QAM |
| 5 | 100 | QPSK |
| 3 | 160 | 64-QAM |
| 4 | 160 | 32-QAM |
| 4 | 160 | 16-QAM |
| 8 | 160 | QPSK |
| 7 | 400 | 64-QAM |
| 8 | 400 | 32-QAM |
| 10 | 400 | 16-QAM |
| 20 | 400 | QPSK |
| 10 | 600 | 64-QAM |
| 12 | 600 | 32-QAM |
| 15 | 600 | 16-QAM |
| 30 | 600 | QPSK |
Publisher’s Note: MDPI stays neutral with regard to jurisdictional claims in published maps and institutional affiliations. |
© 2021 by the authors. Licensee MDPI, Basel, Switzerland. This article is an open access article distributed under the terms and conditions of the Creative Commons Attribution (CC BY) license (https://creativecommons.org/licenses/by/4.0/).
Share and Cite
MDPI and ACS Style
Sobieraj, M.; Zwierzykowski, P.; Leitgeb, E. Determination of Traffic Characteristics of Elastic Optical Networks Nodes with Reservation Mechanisms. Electronics 2021, 10, 1853. https://0-doi-org.brum.beds.ac.uk/10.3390/electronics10151853
AMA Style
Sobieraj M, Zwierzykowski P, Leitgeb E. Determination of Traffic Characteristics of Elastic Optical Networks Nodes with Reservation Mechanisms. Electronics. 2021; 10(15):1853. https://0-doi-org.brum.beds.ac.uk/10.3390/electronics10151853
Chicago/Turabian StyleSobieraj, Maciej, Piotr Zwierzykowski, and Erich Leitgeb. 2021. "Determination of Traffic Characteristics of Elastic Optical Networks Nodes with Reservation Mechanisms" Electronics 10, no. 15: 1853. https://0-doi-org.brum.beds.ac.uk/10.3390/electronics10151853
Note that from the first issue of 2016, this journal uses article numbers instead of page numbers. See further details here.