Examination of Abnormal Behavior Detection Based on Improved YOLOv3
by
 , and
, and
Meng-ting Fang
1, 
Zhong-ju Chen
1,*,
Krzysztof Przystupa
2,* ,
,
Tao Li
3,
Michal Majka
2 and
Orest Kochan
4,5 1
School of Computer Science, Yangtze University, Jingzhou 434023, China
2
Department of Automation (K.P.), Department of Electrical Engineering and Electrotechnology (M.M.) Lublin University of Technology, Nadbystrzycka 36, 20-618 Lublin, Poland
3
School of Electronic Information Engineering, Yangtze University, Jingzhou 434023, China
4
School of Computer Science, Hubei University of Technology, Wuhan 430068, China
5
Department of Telecommunications, Lviv Polytechnic National University, Bandery 12, 79013 Lviv, Ukraine
*
Authors to whom correspondence should be addressed.
Electronics 2021, 10(2), 197; https://0-doi-org.brum.beds.ac.uk/10.3390/electronics10020197
Submission received: 20 December 2020
/
Revised: 11 January 2021
/
Accepted: 13 January 2021
/
Published: 16 January 2021
(This article belongs to the Section Computer Science & Engineering)
Abstract
:Examination is a way to select talents, and a perfect invigilation strategy can improve the fairness of the examination. To realize the automatic detection of abnormal behavior in the examination room, the method based on the improved YOLOv3 (The third version of the You Only Look Once algorithm) algorithm is proposed. The YOLOv3 algorithm is improved by using the K-Means algorithm, GIoUloss, focal loss, and Darknet32. In addition, the frame-alternate dual-thread method is used to optimize the detection process. The research results show that the improved YOLOv3 algorithm can improve both the detection accuracy and detection speed. The frame-alternate dual-thread method can greatly increase the detection speed. The mean Average Precision (mAP) of the improved YOLOv3 algorithm on the test set reached 88.53%, and the detection speed reached 42 Frames Per Second (FPS) in the frame-alternate dual-thread detection method. The research results provide a certain reference for automated invigilation.
1. Introduction
The invention of the computer changed many traditional fields of technical human activity [1,2,3,4], including the less technical field, i.e., human education [5,6].
For example, an article [7] published in Energies shows how to detect isolator failures in a power grid using a YOLOv3 network. The article shows how to reduce energy expenditure in the operation process using modern methods. This article deals with a similar topic. We also show you how to reduce energy expenditure, but in a completely different application and under completely different conditions.
The examination is a knowledge appraisal method generally accepted by the public. Currently, implemented vision methods of checking the integrity of exam-takers still have disadvantages. The invigilator has a limited vision, and the review of surveillance videos in the examination room is time-consuming and laborious. As a result, cheating is widespread, and the fairness of the examination cannot be guaranteed. The survey shows that the proportion of cheating students in colleges and universities is close to 50.0%, and even as high as 80.0% in some research results. In a survey on the question “Have any classmates or friends you know cheated on examinations?”, only 2.7% of the students answered “absolutely not.” It has become a common phenomenon for students to cheat in various examinations. Strengthening the standardization of invigilation can reduce the possibility of cheating in examinations to a certain extent [8].
The emergence of deep learning has promoted the development of computer vision. Detecting abnormal behavior in examinations is a typical computer vision task, which can be achieved by deep learning methods. Currently, the object detection algorithm based on deep learning has made great achievements in many fields [9,10,11,12]. YOLOv3 [13,14,15,16] is a typical object detection algorithm based on deep learning. It uses convolutional neural networks (CNN) to complete the detection task and directly returns the position and category of the object. It is known for its high detection accuracy and high detection speed, and it is widely used in vehicle detection, pedestrian detection, ship detection, garbage detection, License plate recognition, etc. [17,18,19,20,21] In addition, YOLOv3 and its improved algorithm are also often used to detect small objects [22,23]. However, there are few studies on using YOLOv3 to detect abnormal behaviors in examinations. By distinguishing several abnormal behaviors from normal ones in the examination, and marking the detected abnormal behaviors, the suspected cheating students can be quickly obtained for the key observation. This research can not only save more labor costs and improve the efficiency of surveillance video review, but also greatly promote the fairness of the examination and the maintenance of a good test order.
In this paper, by selecting the appropriate algorithm and improving this one, both the detection accuracy and detection speed of the abnormal behavior in the examination are improved. At the same time, the alternate-frame dual-thread technology is used to further improve the detection speed of the algorithm to meet the needs of real-time detection.
2. Materials and Methods
The research work on object detection algorithms has experienced the transition from traditional algorithms to deep learning ones [24]. The traditional object detection methods, such as the algorithm of fast multi-feature pedestrian detection based on the histogram of an oriented gradient (HOG) using discrete wavelet transform proposed by Gwang-Soo Hong [25], and distinctive image features from scale-invariant key points proposed by Lowe D. [26], etc. It is necessary to manually design features according to different experimental scenarios, and then input the extracted object features into classifiers such as Support Vector Machines (SVM) [27] and Adaboost [28,29] for recognition. The feature extraction process of the traditional object detection algorithms is more complicated. The detection accuracy and detection speed are not as good as the object detection algorithms based on deep learning, and the generalization ability of the model is poor [30].
The Region-based Convolutional Neural Network (R-CNN) algorithm proposed by Girshick [31,32] et al. applied deep learning to object detection for the first time [33]. The improved Fast R-CNN algorithm combines the advantages of Spatial Pyramid Pooling Network (SPPNet) [34], which effectively improves the accuracy of object detection. However, these two algorithms use selective search algorithms when extracting regions, which are computationally expensive, consume many memory resources, and are slow in processing speed. The Faster R-CNN algorithm proposed by Ren [35] et al. increases the candidate area network, and extracts candidate boxes by setting anchor boxes of different scales, which greatly improves the detection accuracy, but it still does not solve the problem of slow detection speed and cannot meet the needs of real-time detection. The regression-based object detection algorithm is represented by YOLO [36], SSD [37], YOLOv2/YOLO-9000 [38], and YOLOv3. Although their detection speed has been greatly improved, their detection accuracy has been decreased.
Most of the current research is based on the improvement of the above algorithm. The vehicle detection method based on improved Region-based Fully Convolutional Network (R-FCN) was proposed by Hu Hui [39] et al. The R-FCN, combined with multi-scale training, deformable network, and soft Non-maximum suppression (soft-NMS) [40] improves the detection accuracy, but the generalization ability of the model is poor. Zhao Baokang [41] and others proposed the DFS (Depth-First Search) algorithm for object detection in remote sensing images. They redesigned the dimensional clustering module, loss function, and the detection mechanism based on the sliding window segmentation to improve both the positioning accuracy of objects and the detection accuracy of small objects, but its recall rate has decreased significantly. The foreground object detection algorithm based on an adaptive threshold adjustment proposed by Li Xingxin [42] and others have achieved good accuracy in railway scenes, but the algorithm has large memory consumption. Qiao Ting [43] and others enhanced the training set and designed a two-channel network for feature extraction of Faster R-CNN, which improved the detection accuracy of the algorithm, but its detection speed was not improved. Therefore, real-time detection cannot be performed.
The previously mentioned research results are all targeted algorithm designs, which are carried out in specific scenarios, and are not suitable for detecting abnormal behaviors in the examination. Lin Yongzheng [44] et al. proposed a cheating detection method based on the dynamic threshold by analyzing the behavioral characteristics of exchanging items. The iterative threshold method was used to determine the dynamic threshold to segment the differential image. The segmentation results were used to guide the update of the background, and completed the detection of cheating in the examination room based on the background subtraction algorithm. However, this method can only detect the abnormal behavior of exchanging items, and the test results were not given in the article. Dai Jinbo [45] and others proposed a method of abnormal behavior detection in the examination room. They proposed concepts, such as a behavior coverage area and 3D examination room attention. They used Latent SVM to build a model, but its accuracy and speed did not have clear advantages. It should also be noted that the detection range is too small to be applied to actual exam scenarios.
This paper draws on the experience of related researchers, and uses the YOLOv3 algorithm to establish models. In order to achieve the purpose of detecting abnormal behavior in the examination, some improvements have been made to the YOLOv3 algorithm. First, the loss function is improved. Next, the size of the anchor boxes used in the algorithm is modified. Then, the backbone network is simplified. Finally, the frame-alternate dual-thread method is used for detection to further improve the detection speed and meet the needs of real-time detection.
The rest of this paper is organized as follows. The third part describes the YOLOv3 algorithm, K-Means clustering of bounding boxes, improved backbone Darknet32, improved loss function, and frame-alternate dual-thread principle. The fourth part is the experimental and result analysis. It introduces the experimental environment, data sets, and model evaluation standards, analyzes the detection accuracy by constructing models, then uses four video detection methods to detect the video, and analyzes the detection speed and memory consumption. The last part summarizes the paper and gives relevant conclusions.
2.1. Methodology YOLOv3
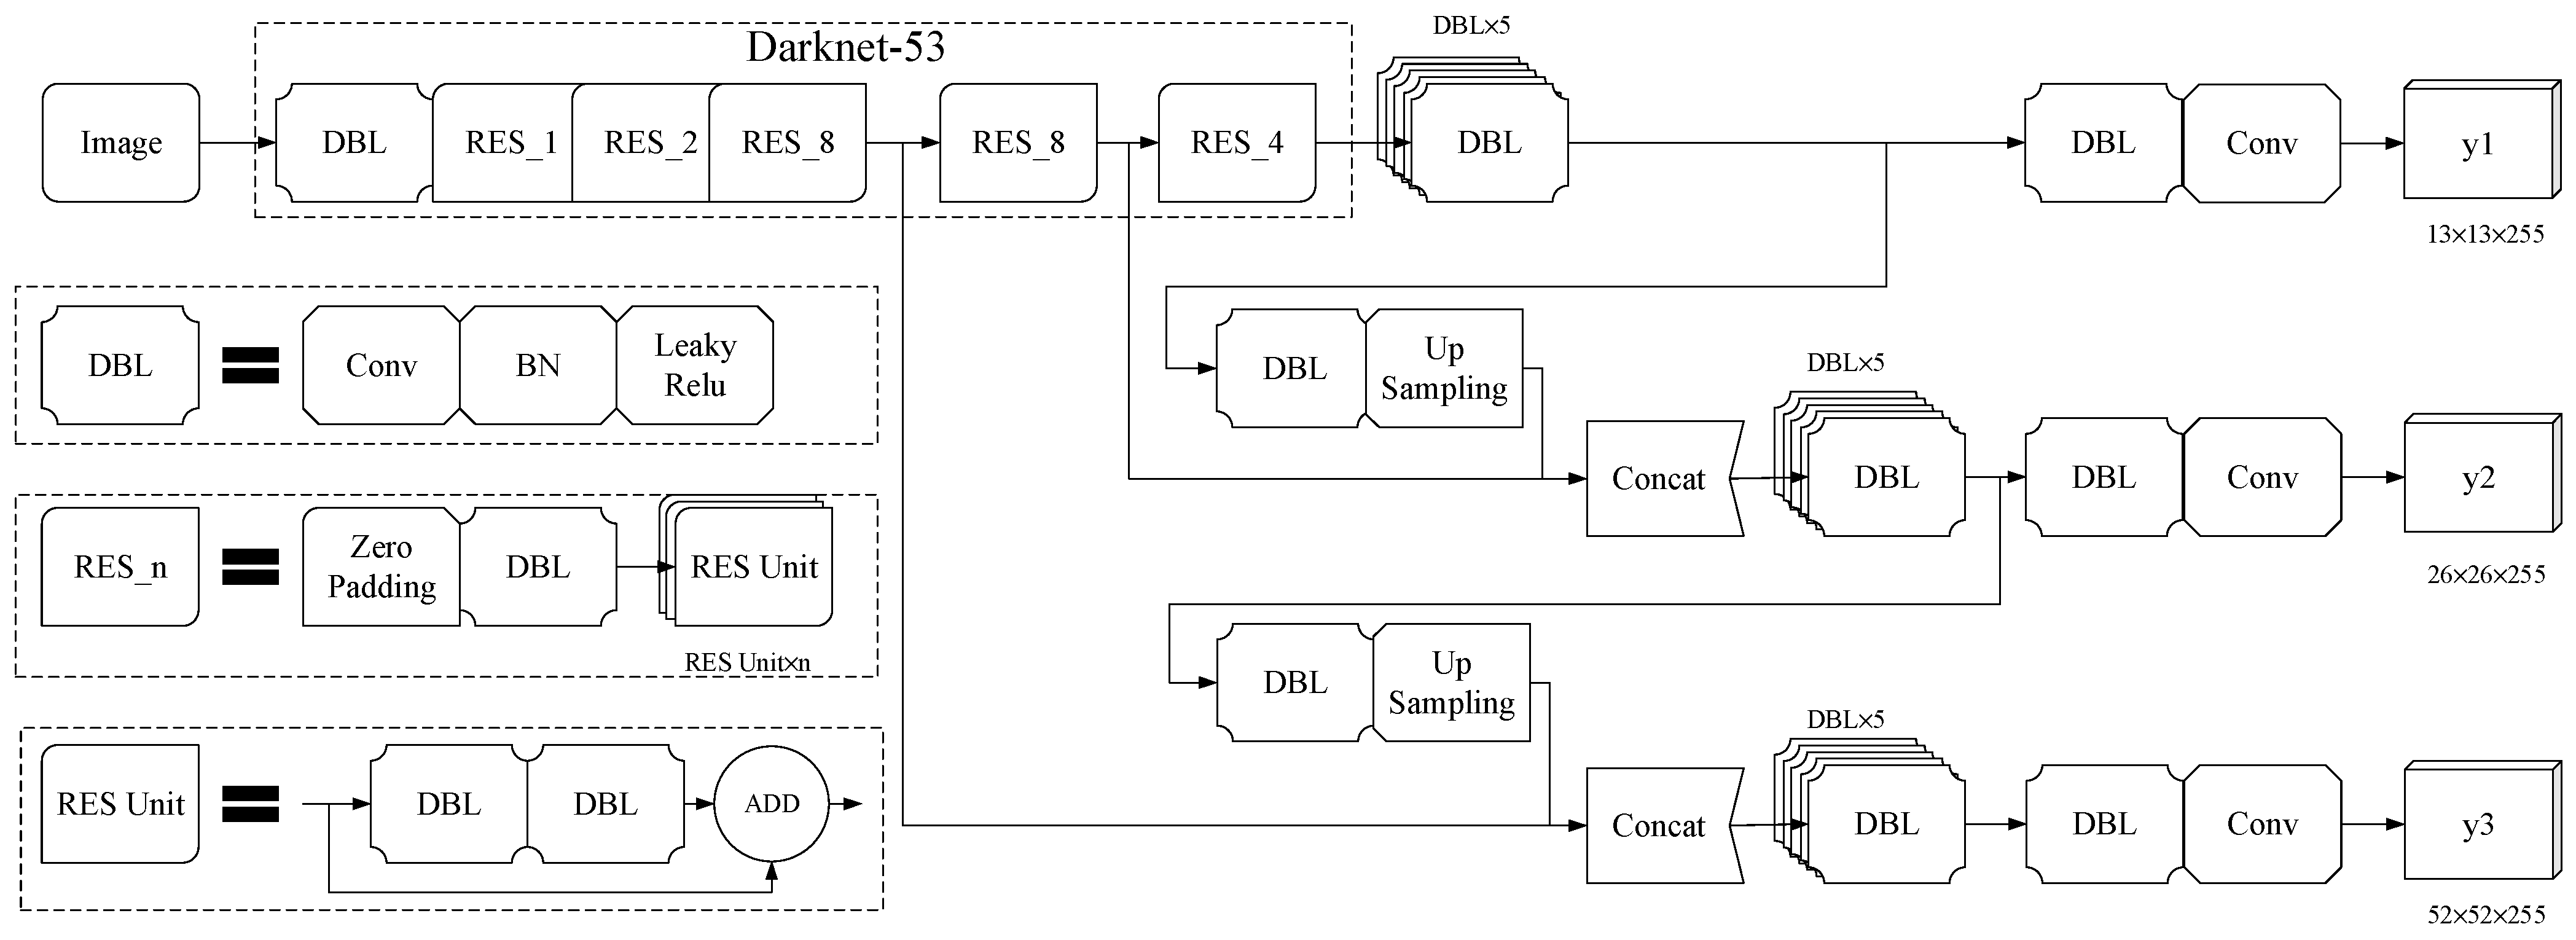
The YOLOv3 algorithm has made many improvements in YOLOv1 and YOLOv2, so that both the detection accuracy and detection speed have been significantly improved. Its core idea lies in the realization of “end-to-end” using CNN to complete the entire object detection process. The network structure of YOLOv3 can be divided into a backbone and a head (as shown in Figure 1), which perform feature extraction and multi-scale prediction, respectively. It draws on the feature fusion pyramid idea of Feature Pyramid Networks (FPN) [46], extracts the features of the previous layer through the up-sampling operation, fuses the features of the current layer, and then predicts from three scales. It realizes the detection of objects of different sizes, and has a good detection effect even when the object is partially occluded.
In Figure 1, DBL represents a complete convolutional layer, including three operations: Convolution Operation (Conv), Batch Normalization (BN), and Leaky Rectified linear unit (Leaky Relu) activation function. RES_n is a set of residual networks, composed of Zero Padding, DBL, and n residual units (RES Unit). The RES Unit adds the input of the unit to the output of the unit based on the DBL. Concat represents the splicing operation of the features of two different layers.
The backbone Darknet53 of YOLOv3 is similar to ResNet [47]. The residual block added to the network to realize the rapid transmission of parameters between certain layers, alleviates the network degradation problem faced by deep CNN, and enables the network to be built deeper. When Darknet53 is used for object detection, the fully connected (FC) layer is removed, so it contains 52 convolutional layers.
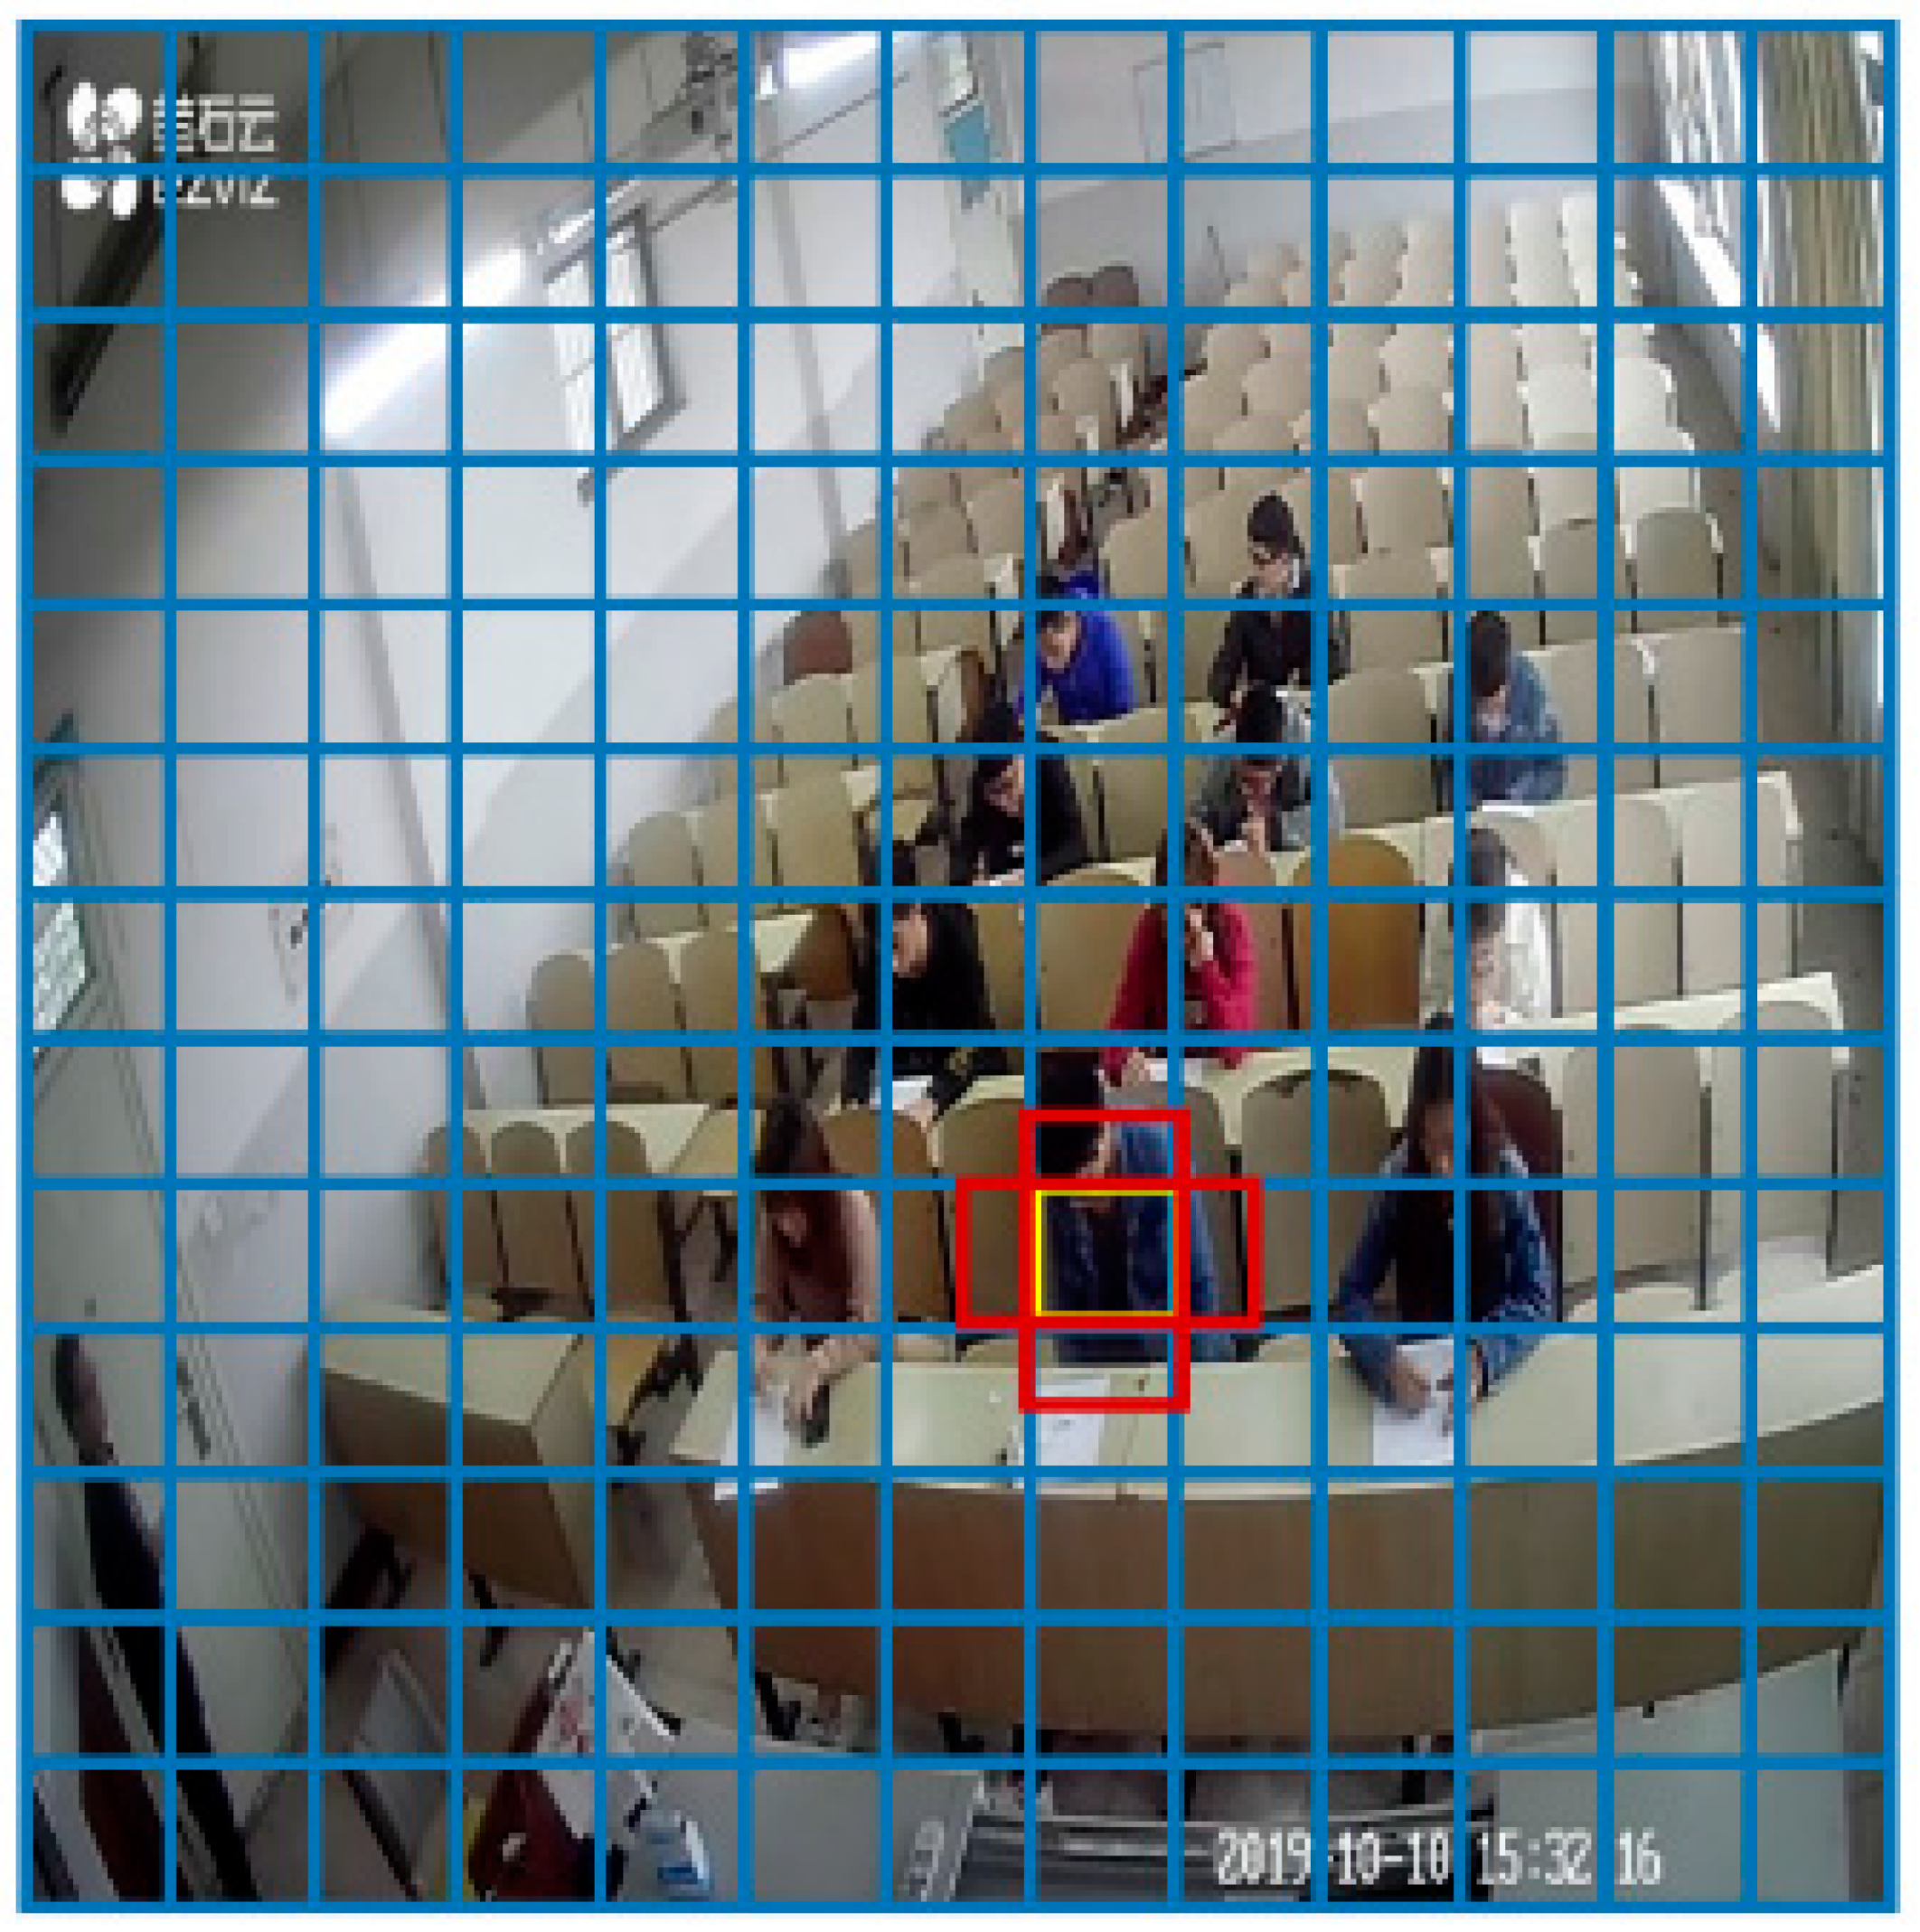
The part outside the dashed box in Figure 1 is the head network, which is used to obtain the location and category of the object. When acquiring the location area of the object, YOLOv3 divides the image into S × S grids from three scales (as shown in Figure 2). The grid, where the center of the object is located, is responsible for predicting the object, and each grid contains B bounding boxes and confidences, and C category probabilities. The anchor mechanism introduced in YOLOv3 sets anchor boxes with different sizes and aspect ratios on three scales, and each grid predicts the bounding box of three different aspect ratios (1:1, 1:2, 2:1). Each bounding box contains four coordinate information (tx, ty, tw, th) and one confidence information. To solve the multi-label classification problem, YOLOv3 uses multiple logistic regression classifiers (sigmoid function) instead of the SoftMax function, and uses binary cross entropy loss to calculate the category loss.
2.2. Obtaining the Optimal Anchor Boxes
In order to achieve rapid detection of objects of different sizes and aspect ratios, the YOLOv2 algorithm uses fixed-size anchor boxes as references for the boundary of the object. The choice of suitable anchor boxes can improve the detection accuracy of the algorithm. The anchor boxes used in the YOLOv3 algorithm are derived from 80 categories of data in the COCO (look: https://cocodataset.org/#home 15.01.2021) data set, which are suitable for most detection scenarios, but are not completely suitable for abnormal behavior detection in the examination. Therefore, this paper re-selects more suitable anchor boxes to improve the detection accuracy.
The K-Means [48,49,50] algorithm uses distance as the classification criterion. The smaller the distance between two samples, the more similar they are. The K-Means algorithm generally uses Euclidean distance as a metric, but this method is not suitable for clustering bounding boxes. Therefore, this paper uses Intersection over Union (IoU) as a distance metric. The calculation formula is as follows.
In the formula, B is the bounding box, C is the cluster center, and IoU(B,C) represents the intersection ratio of two rectangular boxes.
The steps to use the K-Means algorithm to get the optimal anchor boxes are as follows.
Step 1: Read the .Xml file in the data set to obtain the position information of all bounding boxes in the images.
Step 2: Calculate the size of all bounding boxes and normalize them to get the normalized width and height of each bounding box. The calculation method is as follows.
In Equations (2) and (3), w is the normalized width of the bounding box and h is the normalized height of the bounding box. W is the width of the image and H is the height of the image.
Step 3: Initialize the number of categories and cluster centers. The number of categories is given artificially, and the cluster centers are given randomly.
Step 4: Calculate the distance d(B,C) between each bounding box and all cluster centers, and select the nearest cluster center as its category.
Step 5: Use the average of the width and height of all bounding boxes in each category cluster as the category center for the next iteration.
Repeat steps 4 and 5 until the cluster centers of all categories do not change. At this time, the cluster centers are the best anchor boxes.
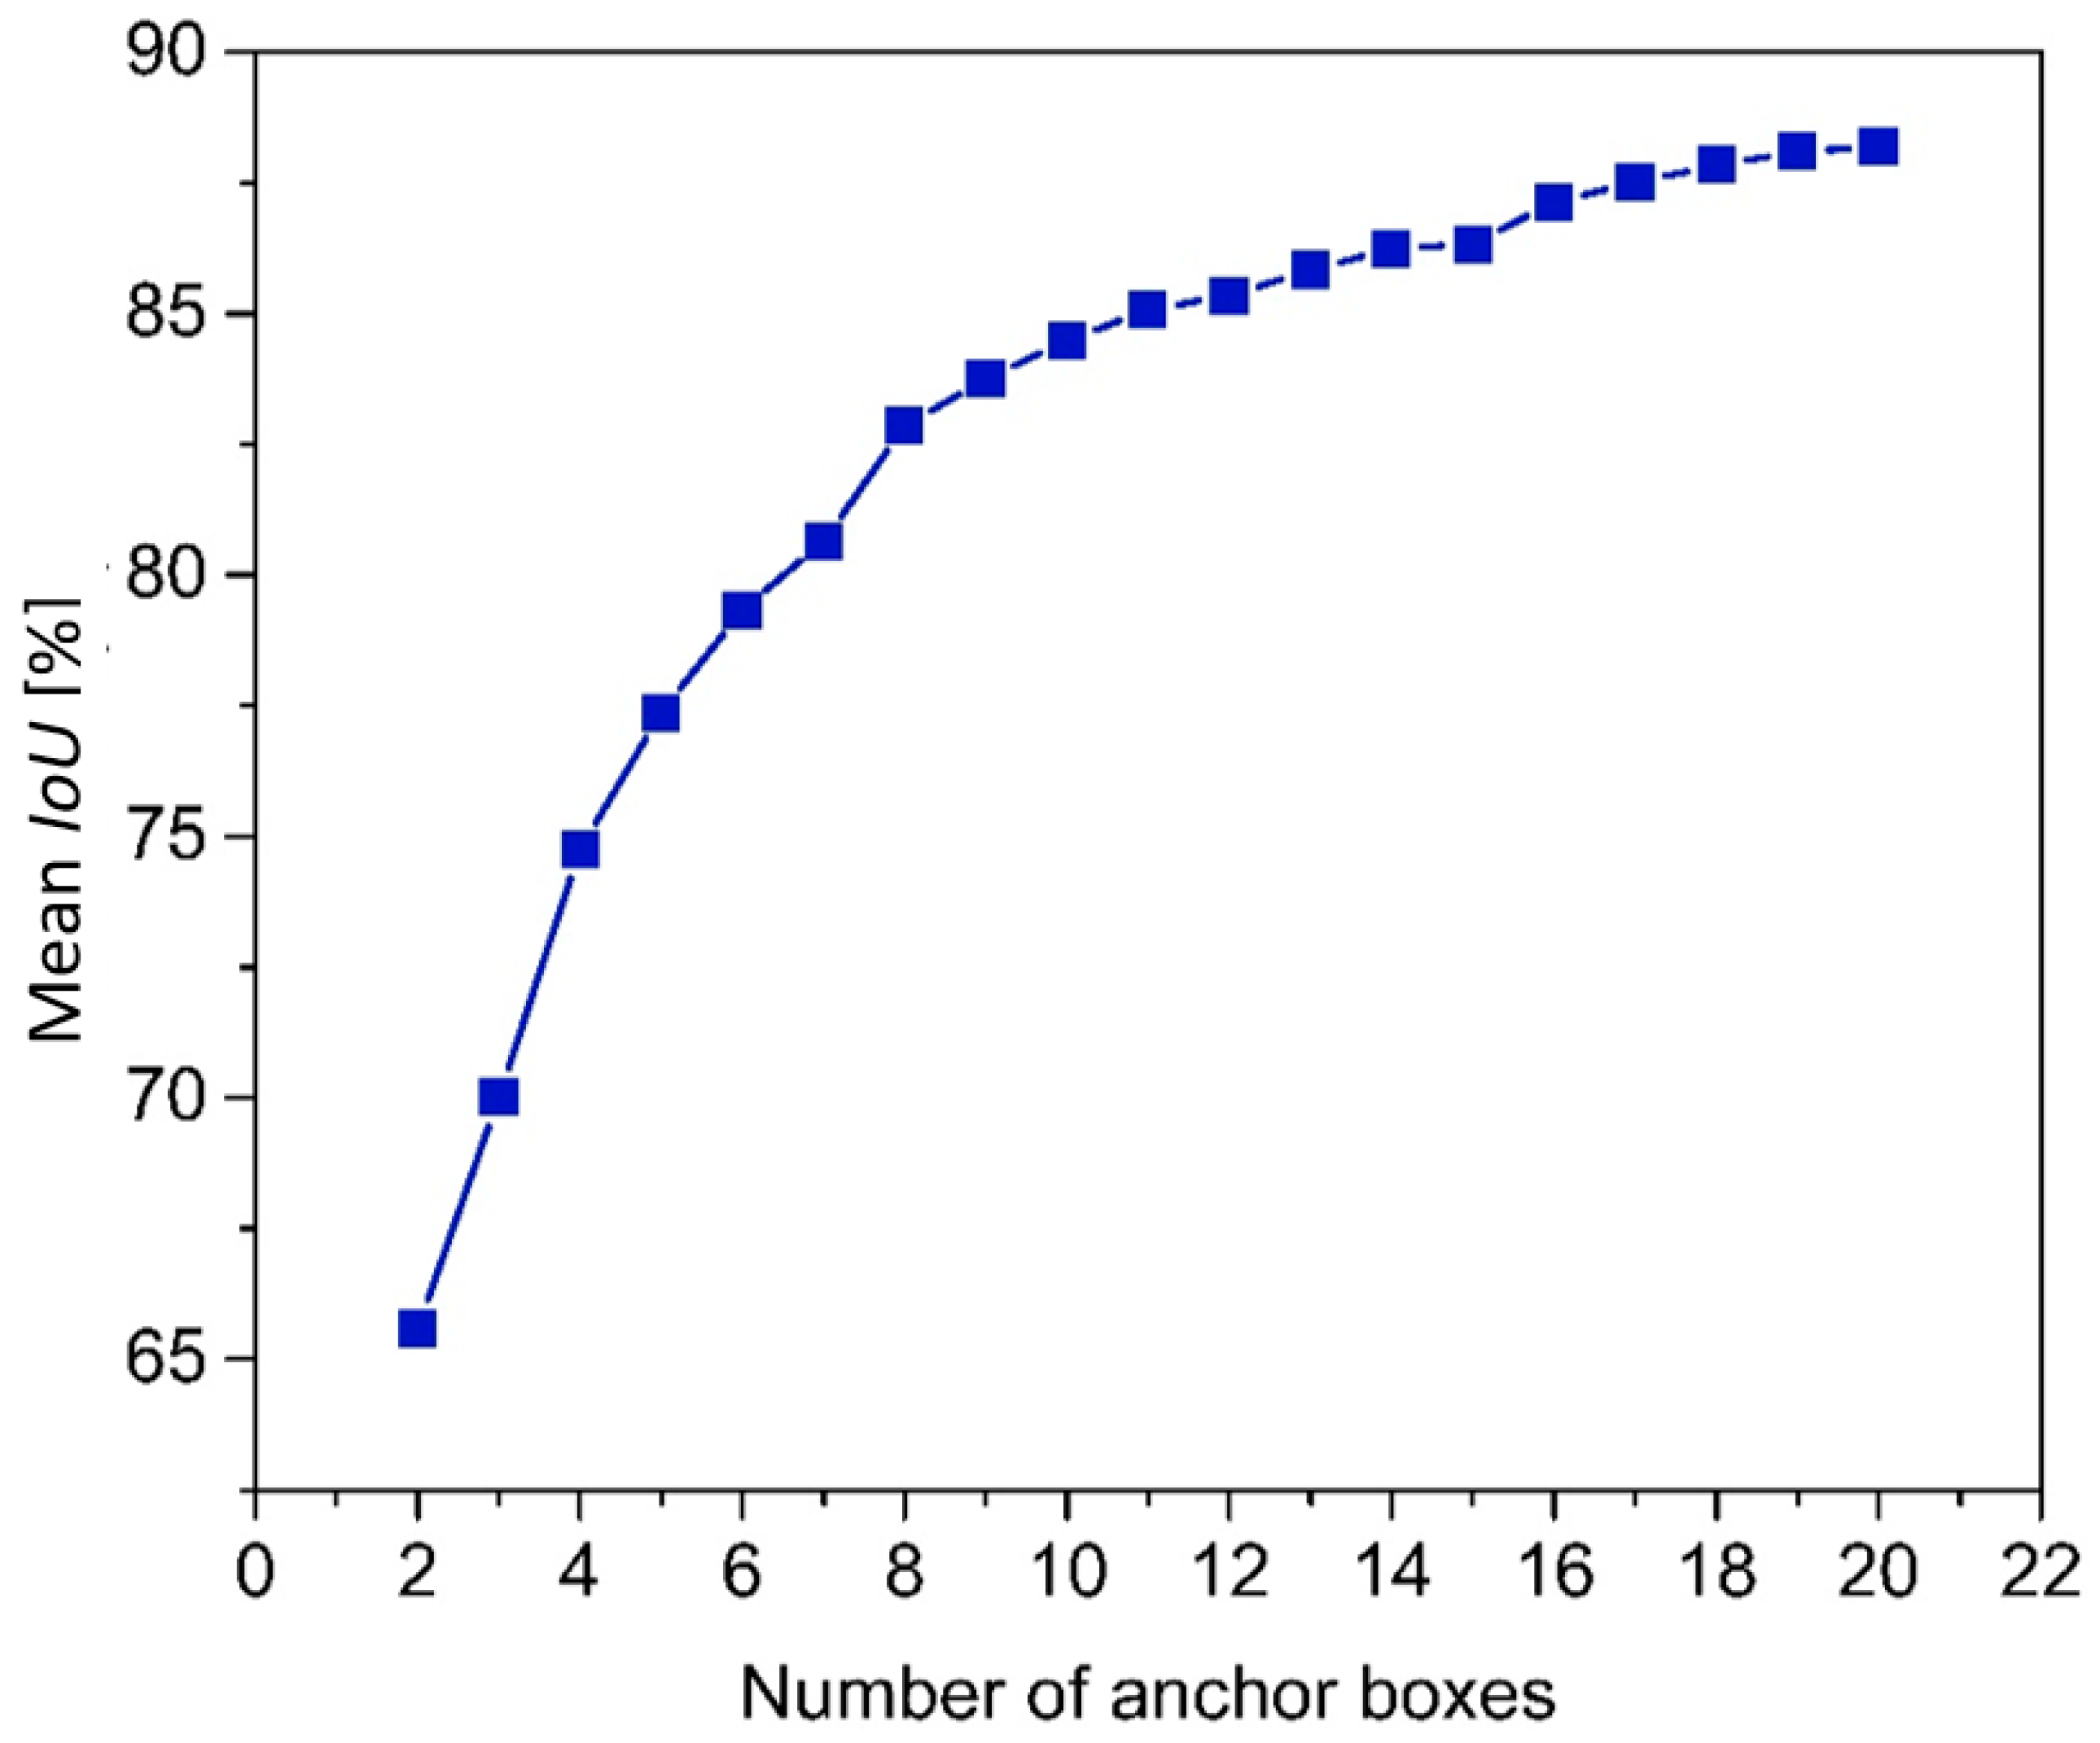
The choice of the number of anchor boxes is not random. It is determined based on the average distance (mean IoU) of all bounding boxes to their cluster centers. In the experiment, the value of the number of clustering categories lies within the range from 2 to 20, and the mean IoU under each value is obtained, as shown in Figure 3 (the number of categories is the number of anchor boxes).
It can be seen from Figure 3 that the curve tends to be flat after the number of anchor boxes is 9. Considering that the more anchor boxes, the more parameters, which is not suitable to real-time detection. Therefore, this paper chooses nine anchor boxes. The sizes of the initial and final anchor boxes for YOLOv3 are given in Table 1.
2.3. Improved Backbone Darknet32
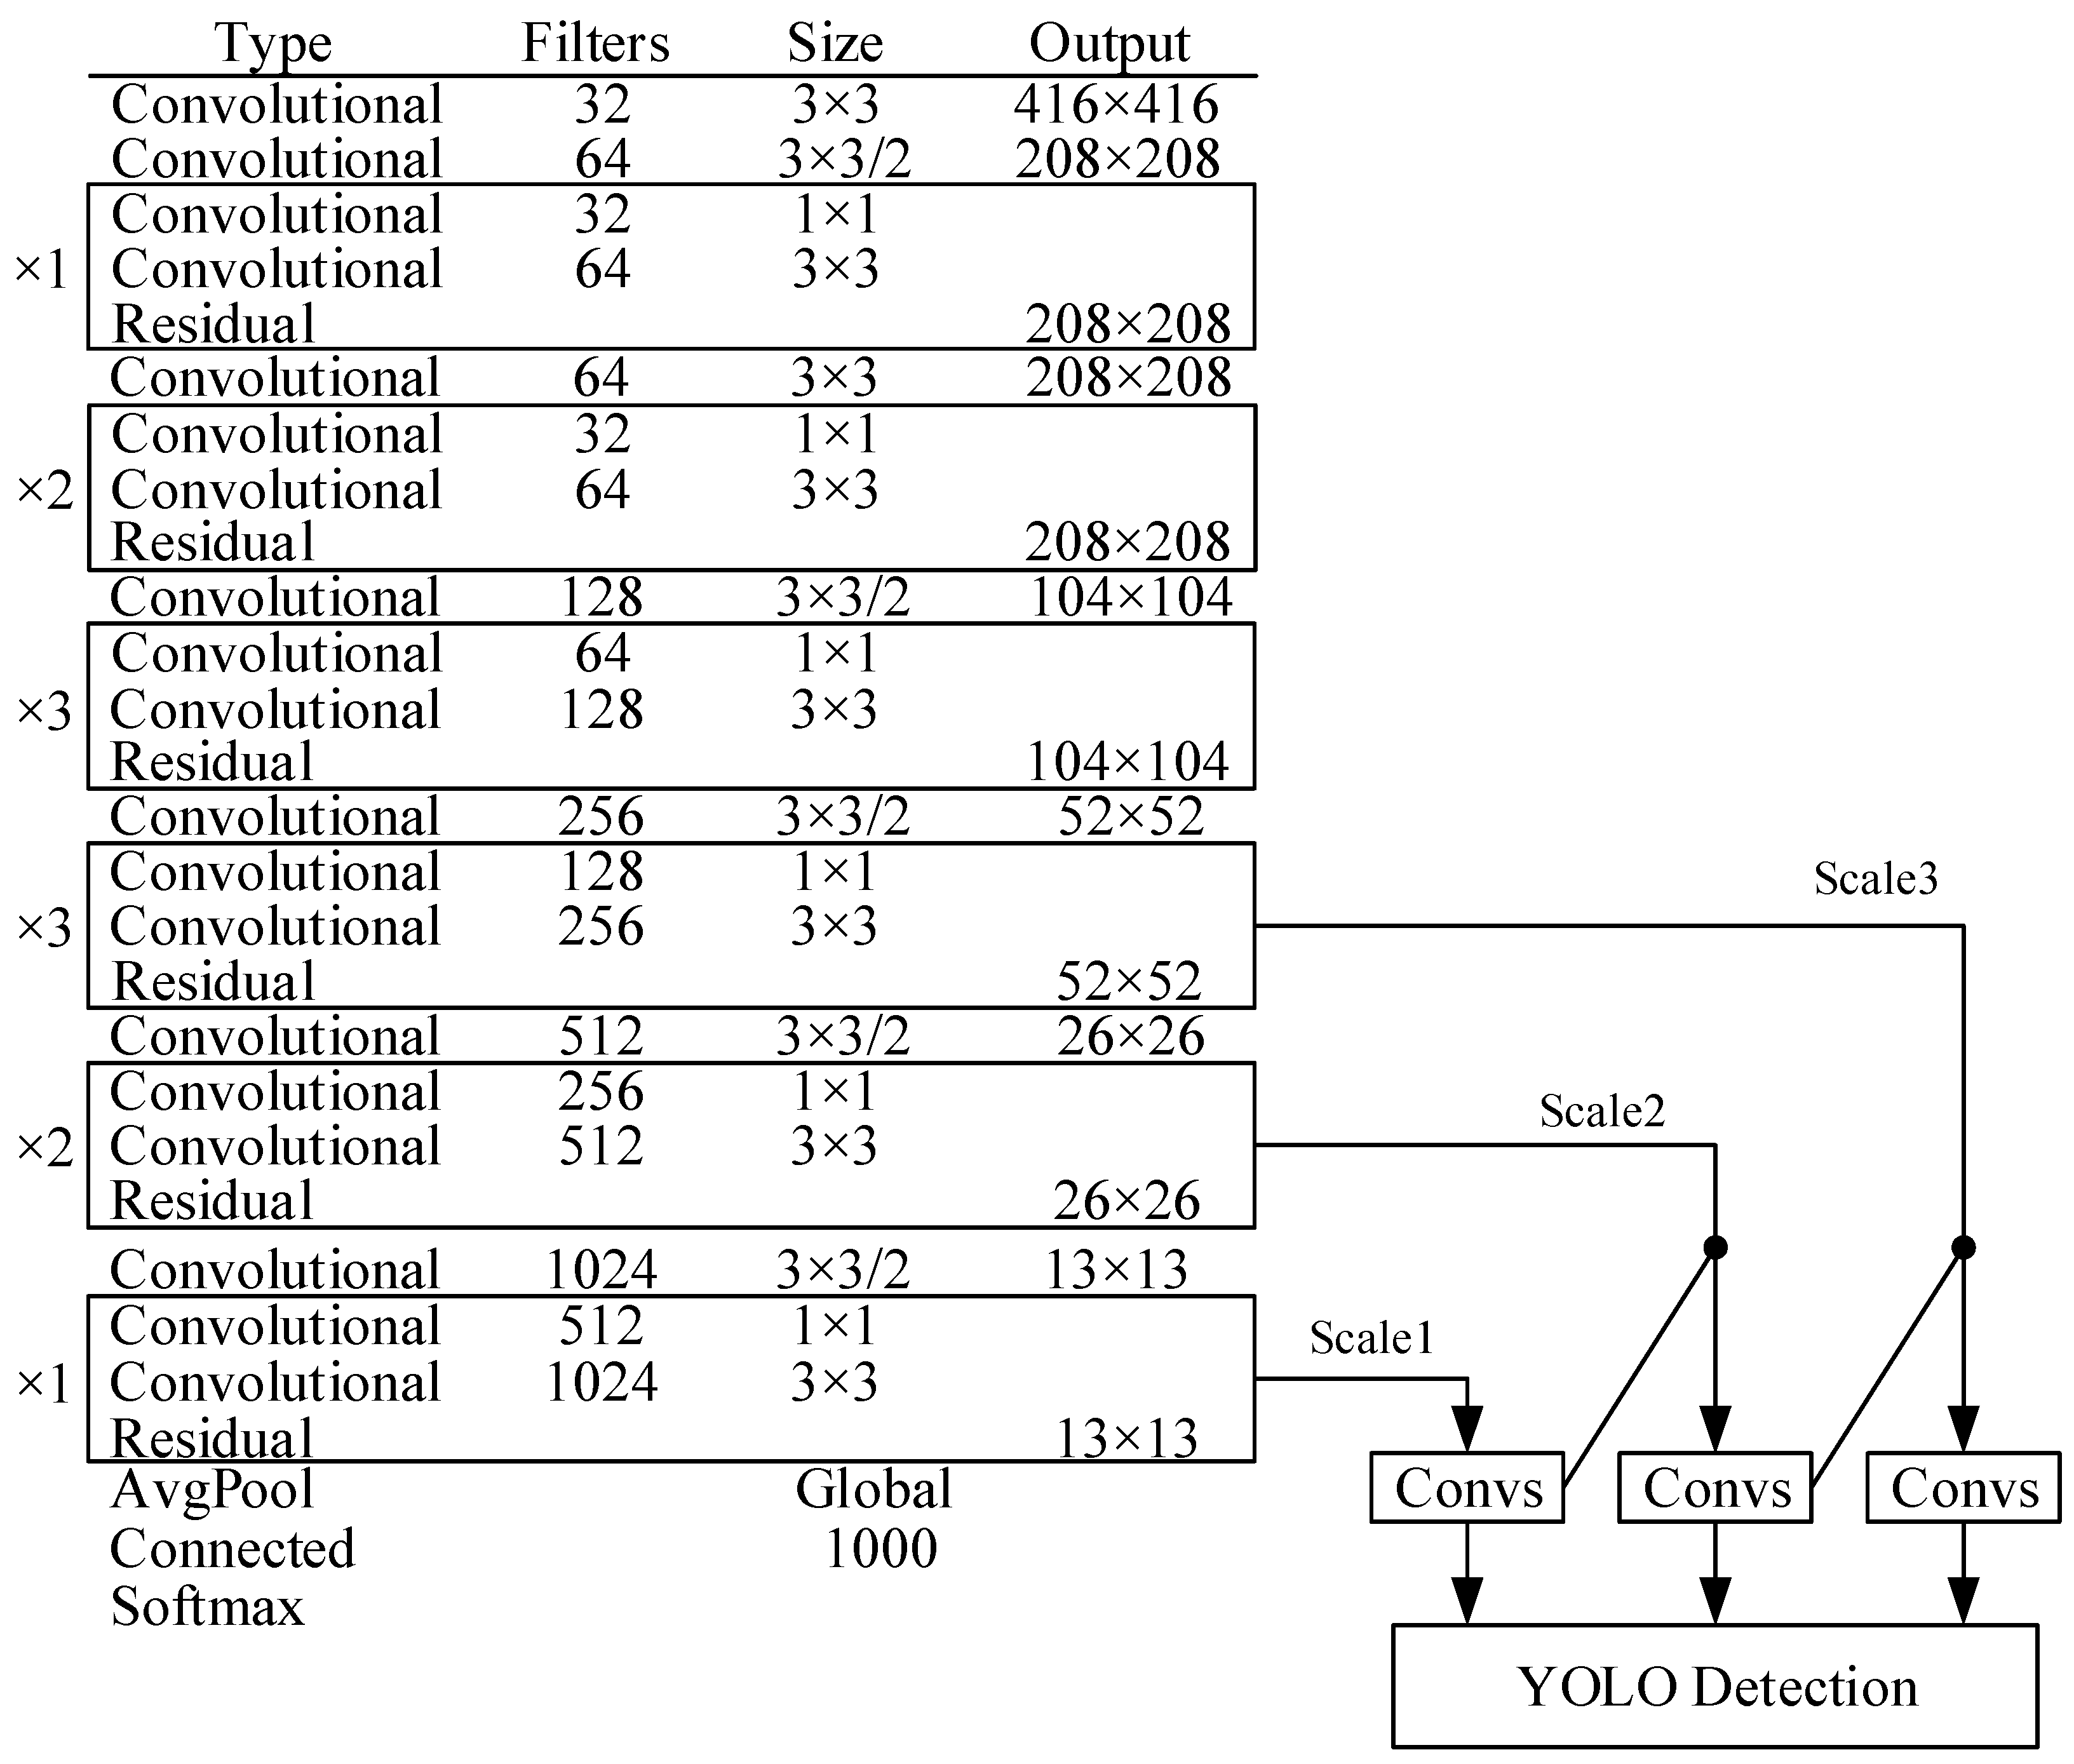
The Darknet53 used in YOLOv3 has good detection accuracy, but the huge network is complicated and redundant for the detection of abnormal behaviors in the examination. Too many parameters will lead to more complex training, more data requirements, and slower detection speed. In order to improve the detection speed of abnormal behavior in the examination and maintain high detection accuracy, this paper draws on Darknet53 and proposes a new CNN structure called Darknet32. Its network structure is shown in Figure 4.
There are six groups of networks with residual blocks in Darknet32. Compared with the five groups of networks in Darknet53, the number of residual blocks in each group is reduced. In order to balance the effect of feature extraction, an additional set of networks is added. The Multi-Scale Training method is adopted to continuously adjust the size of the input image during the training process, so that the network can better predict images of different scales. In addition, the pooling layer is no longer set in the network, and down-sampling is achieved through convolution.
The workflow of the YOLOv3 algorithm using Darknet32 as the backbone is as follows. First, the image is input into the backbone for feature extraction. After six groups of networks with the total of 12 residual blocks, 31 convolution operations are performed. The results of feature extraction are output from three scales. Then, the deep and shallow features are merged through up-sampling operations. Finally, the detection objects are predicted from three scales. For the detection results, the soft-NMS algorithm is used to filter the detected bounding boxes.
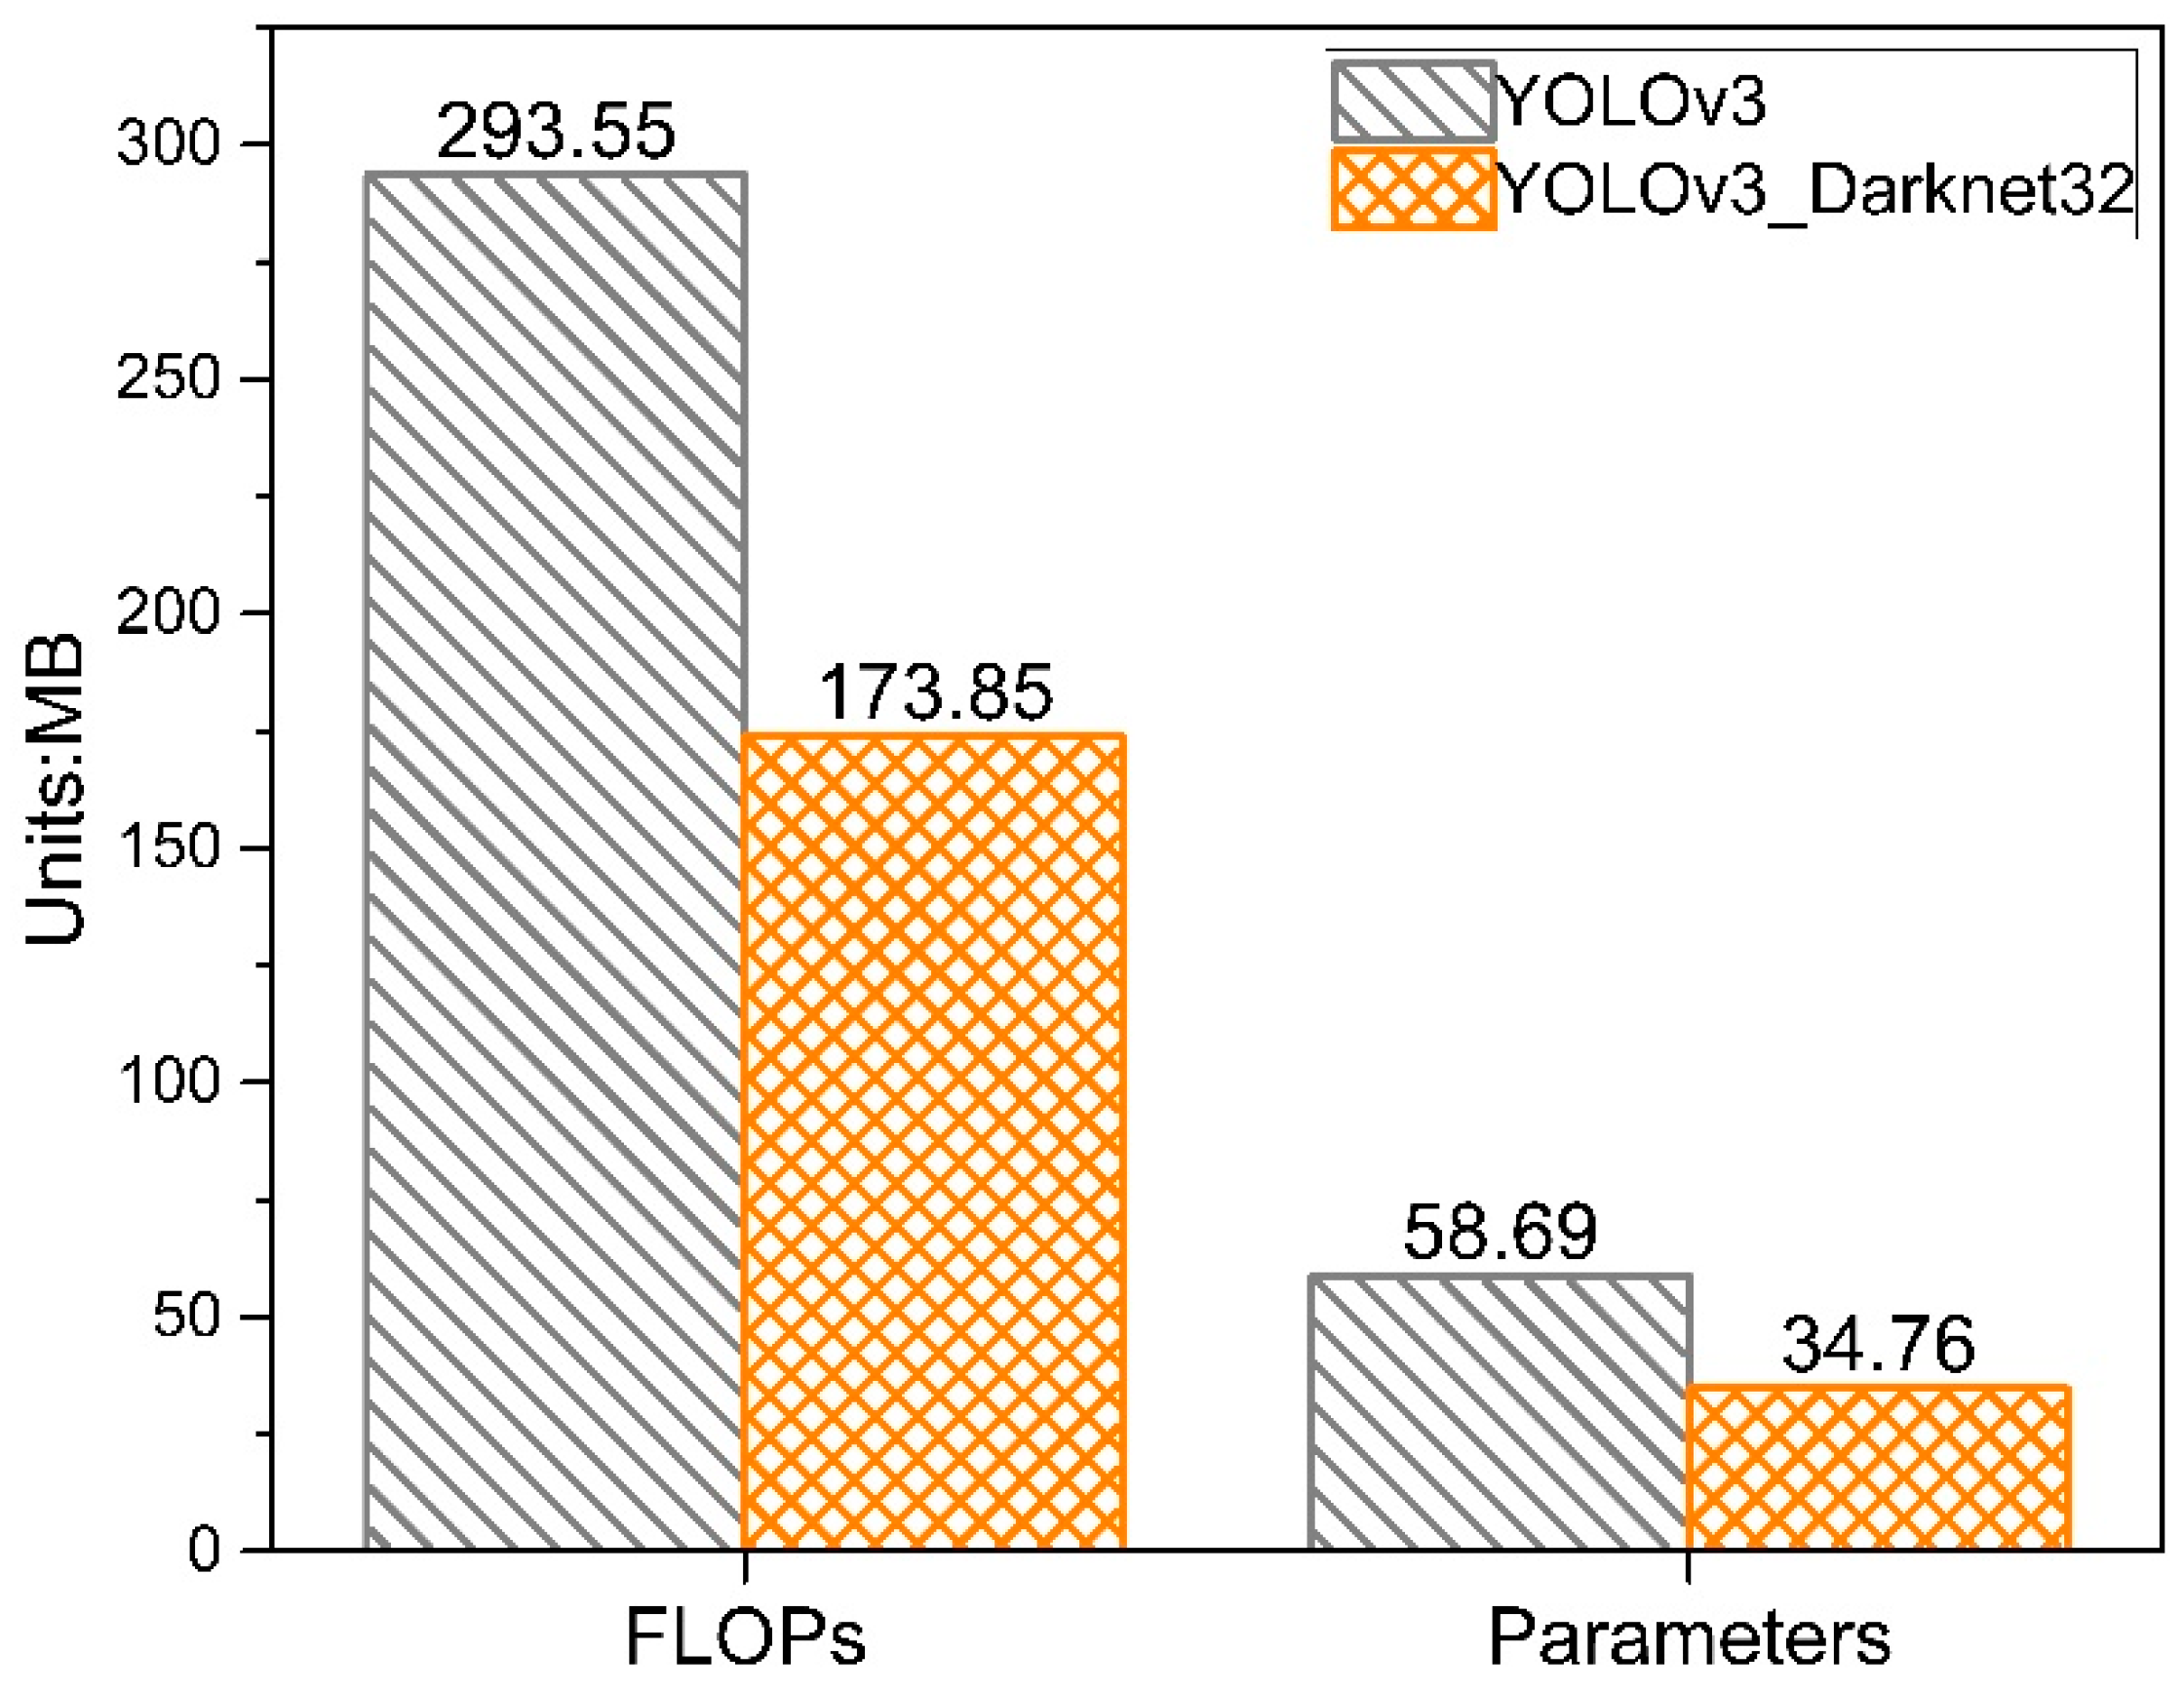
The parameters and floating point operations (FLOPs) of the original YOLOv3 algorithm and the YOLOv3 algorithm using Darknet32 as the backbone are calculated, as shown in Figure 5.
It can be seen from Figure 5, when compared with the original YOLOv3 algorithm, the YOLOv3 algorithm using Darknet32 as the backbone reduces the amount of parameters and floating point operations (FLOPs) by 41%.
2.4. Loss Function
The loss function of the YOLOv3 algorithm is composed of bounding box loss, confidence loss, and classification loss. The bounding box loss of the original YOLOv3 is calculated by the L2 norm, but the IoU is used to determine whether the object is detected during evaluation. However, IoU does not increase with the L2 loss decreases, for there is no linear relationship between IoU and L2 loss, so the bounding box loss function needs to be optimized. We have considered the direct use of IoU in the loss function, but the calculation of IoU does not consider the non-overlapping area. It cannot reflect the distance between two rectangular boxes and the overlapping form. When there is no overlap between the two boxes, IoU = 0 causes the gradient to be 0 and cannot be optimized, so IoU cannot be directly used to calculate the bounding box loss. The method of optimization of the Generalized Intersection over Union (GIoU) bounding box proposed by Rezatofighi [51] et al. considers the overlap of two boxes, and its calculation formula is as follows.
In the formula, A and B are the predicted bounding box and the true bounding box, and C is the smallest closed interval containing A and B. According to formula (2), it can be seen that GIoU and IoU are positively correlated. When the two boxes are closer to each other in size and distance, the GIoU is closer to IoU. Therefore, GIoU can be used as a measure to calculate the bounding box loss. The GIoU loss calculation formula is shown below.
The calculation formula of the improved bounding box loss function is below.
In the formula, is the number of grids, B is the number of bounding boxes detected in each grid, indicates whether the bounding box j of grid i is responsible for predicting this object, and and are the width and height of the true bounding box.
The confidence loss of the YOLOv3 algorithm is calculated by binary cross entropy loss. In order to solve the problem of unbalanced distribution of positive and negative samples, this paper uses the focal loss [52] to optimize the confidence loss. The formula for optimized confidence loss calculation is as follows.
In the formula, is the weight coefficient in the focal loss function, is the hyperparameter added in the focal loss function, is the weight coefficient, and and are the true and predicted values of confidence, respectively.
The classification loss is still calculated by binary cross entropy loss, and its calculation formula is shown below.
In the formula, and are the true value and predicted value of the category, respectively.
2.5. Frame-Alternate Dual-Thread Detection Method
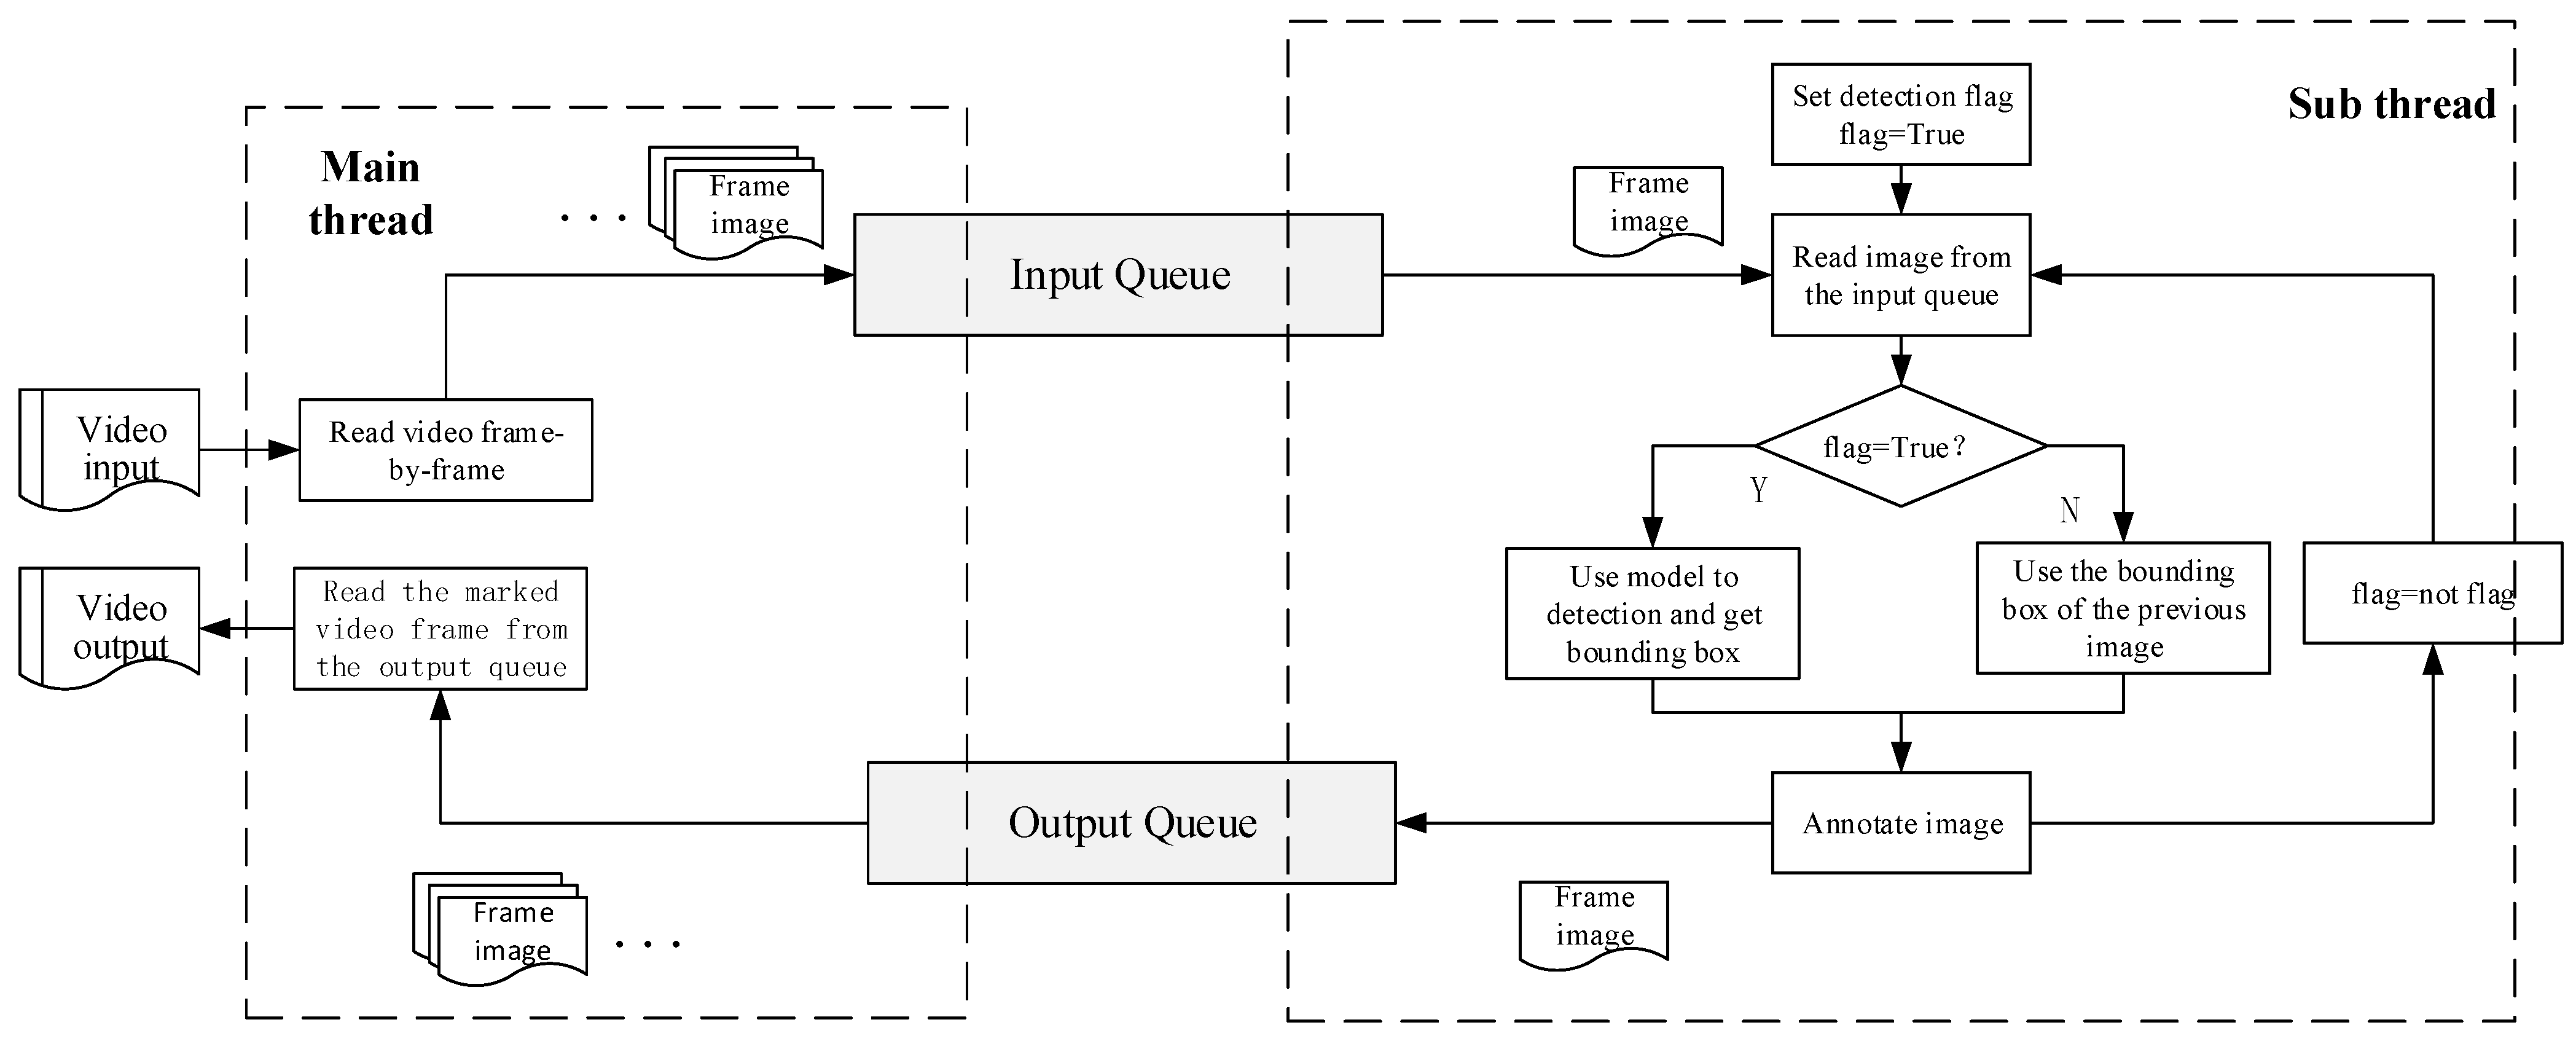
This paper uses recorded videos containing a large number of abnormal behaviors in the examination for detection, but, in the actual examination, abnormal behavior occurs infrequently, and the time of occurrence is unpredictable. Frame-by-frame detection is relatively time-consuming, while detection across multiple frames will cause many missed detections. Therefore, this paper adopts the method of crossing one frame for detection, that is, frame-alternate detection. Multi-thread technology can improve the efficiency of program operation, but, with the increase of threads, memory consumption will increase, which contradicts the realization of real-time detection on ordinary performance computers with limited memory. In the experiment, with the continuous increase of the number of threads, it is found that, when the number of threads exceeds 3, the improvement of the detection speed is not clear, but the memory consumption is very large. After measurements, the dual-thread detection method was finally adopted. Compared with a single thread, a dual thread can increase the detection speed, and, when compared with more threads, the memory consumption of the dual thread is still relatively small. A dual thread detection method is meant to allow the computer to perform two different tasks at the same time. Therefore, the detection task is divided into two parts. The main thread completes the task of reading and outputting the video frame-by-frame, and the sub-thread completes the task of frame-alternate detection and labeling, as shown in Figure 6.
3. Results and Discussion
3.1. Experimental Environment and Data Set
This experiment is carried out under the Window10 operating system, the processor is Intel (R) Core (TM) i7-8700 CPU @ 3.20 GHz, the memory size is 64 GB, and the GPU model is NVIDIA GeForce GTX 1080 Ti.
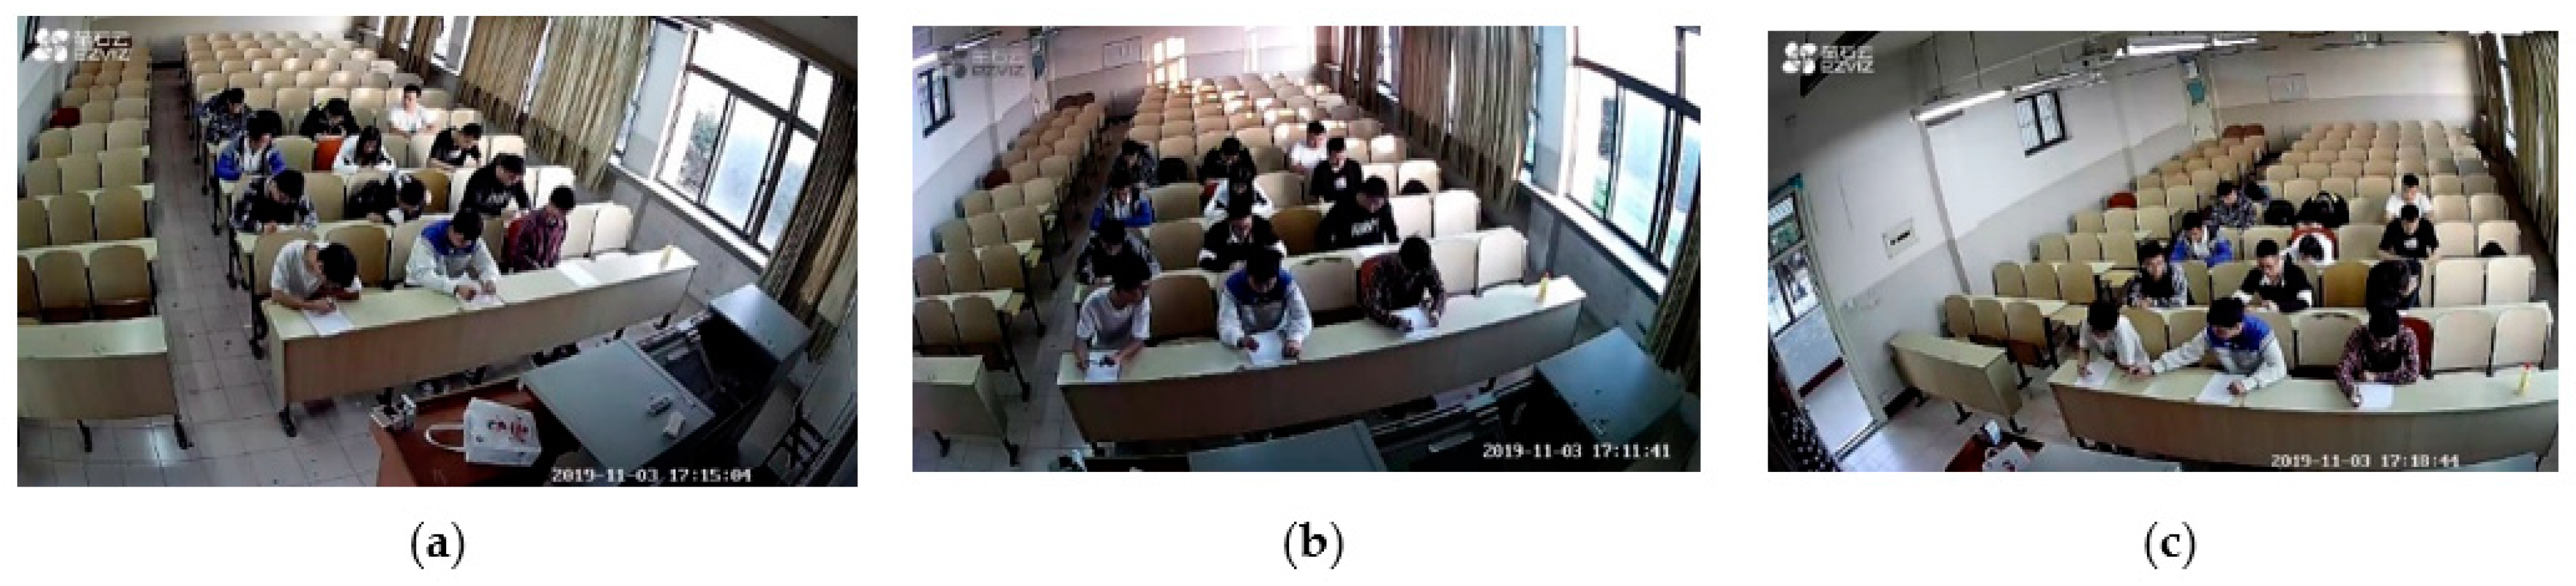
To verify the effectiveness of the algorithm, a data set for abnormal behavior detection in the exam was produced. Excluding clear examination violations such as carrying illegal items, leaving the seat, etc., this paper summarizes the abnormal behavior of the examination into four categories: “bend over the desk,” “hand under the table,” “look around,” and “deliver things.” In order to get a test abnormal behavior data set, first, arranging different people to demonstrate the abnormal behaviors in the examination at different times, in different locations, and used the EZVIZ camera to record videos from three angles (left, center, and right, as shown in Figure 7) at the same time. Next, reading the surveillance video frame-by-frame and save them as images in .jpg format, and filter these images to delete the images with no abnormal behavior in the content. Then, we divide the images into the training set and test set randomly. Fourth, use LabelImg software to annotate the images, that is, use rectangular boxes to mark abnormal behaviors in the images, and generate .Xml files based on the position and name of the rectangular boxes. Finally, according to the format of the PASCAL VOC data set, the examination abnormal behavior data set is sorted out. A total of 4120 valid images were obtained, including 8973 abnormal behavior annotation boxes. The training set contained 3740 images and 8105 annotation boxes. The test set contains 380 images and 868 annotation boxes.
3.2. Evaluation Index of the Model
This paper evaluates the performance of the algorithm from two aspects: detection accuracy and detection speed. Detection accuracy is evaluated by the average precision (AP), mean average precision (mAP), and detection speed is evaluated by the frames per second (FPS). Since FPS is greatly affected by the performance of the experimental machine, in order to ensure that the experimental results have a reference significance, this experiment was carried out on the same machine.
The P-R curve uses recall and precision as the horizontal and vertical coordinates. AP is the area enclosed by the P-R curve and the abscissa. It can be calculated by integration. The calculation formula is as follows.
In the formula, is the curve function obtained after smoothing the P-R curve, and R is the recall.
mAP represents the mean AP of N categories, and the calculation formula is as follows.
FPS represents the number of frames detected per second, and the calculation formula is as follows.
3.3. Analysis of Results
3.3.1. Analysis of Detection Accuracy
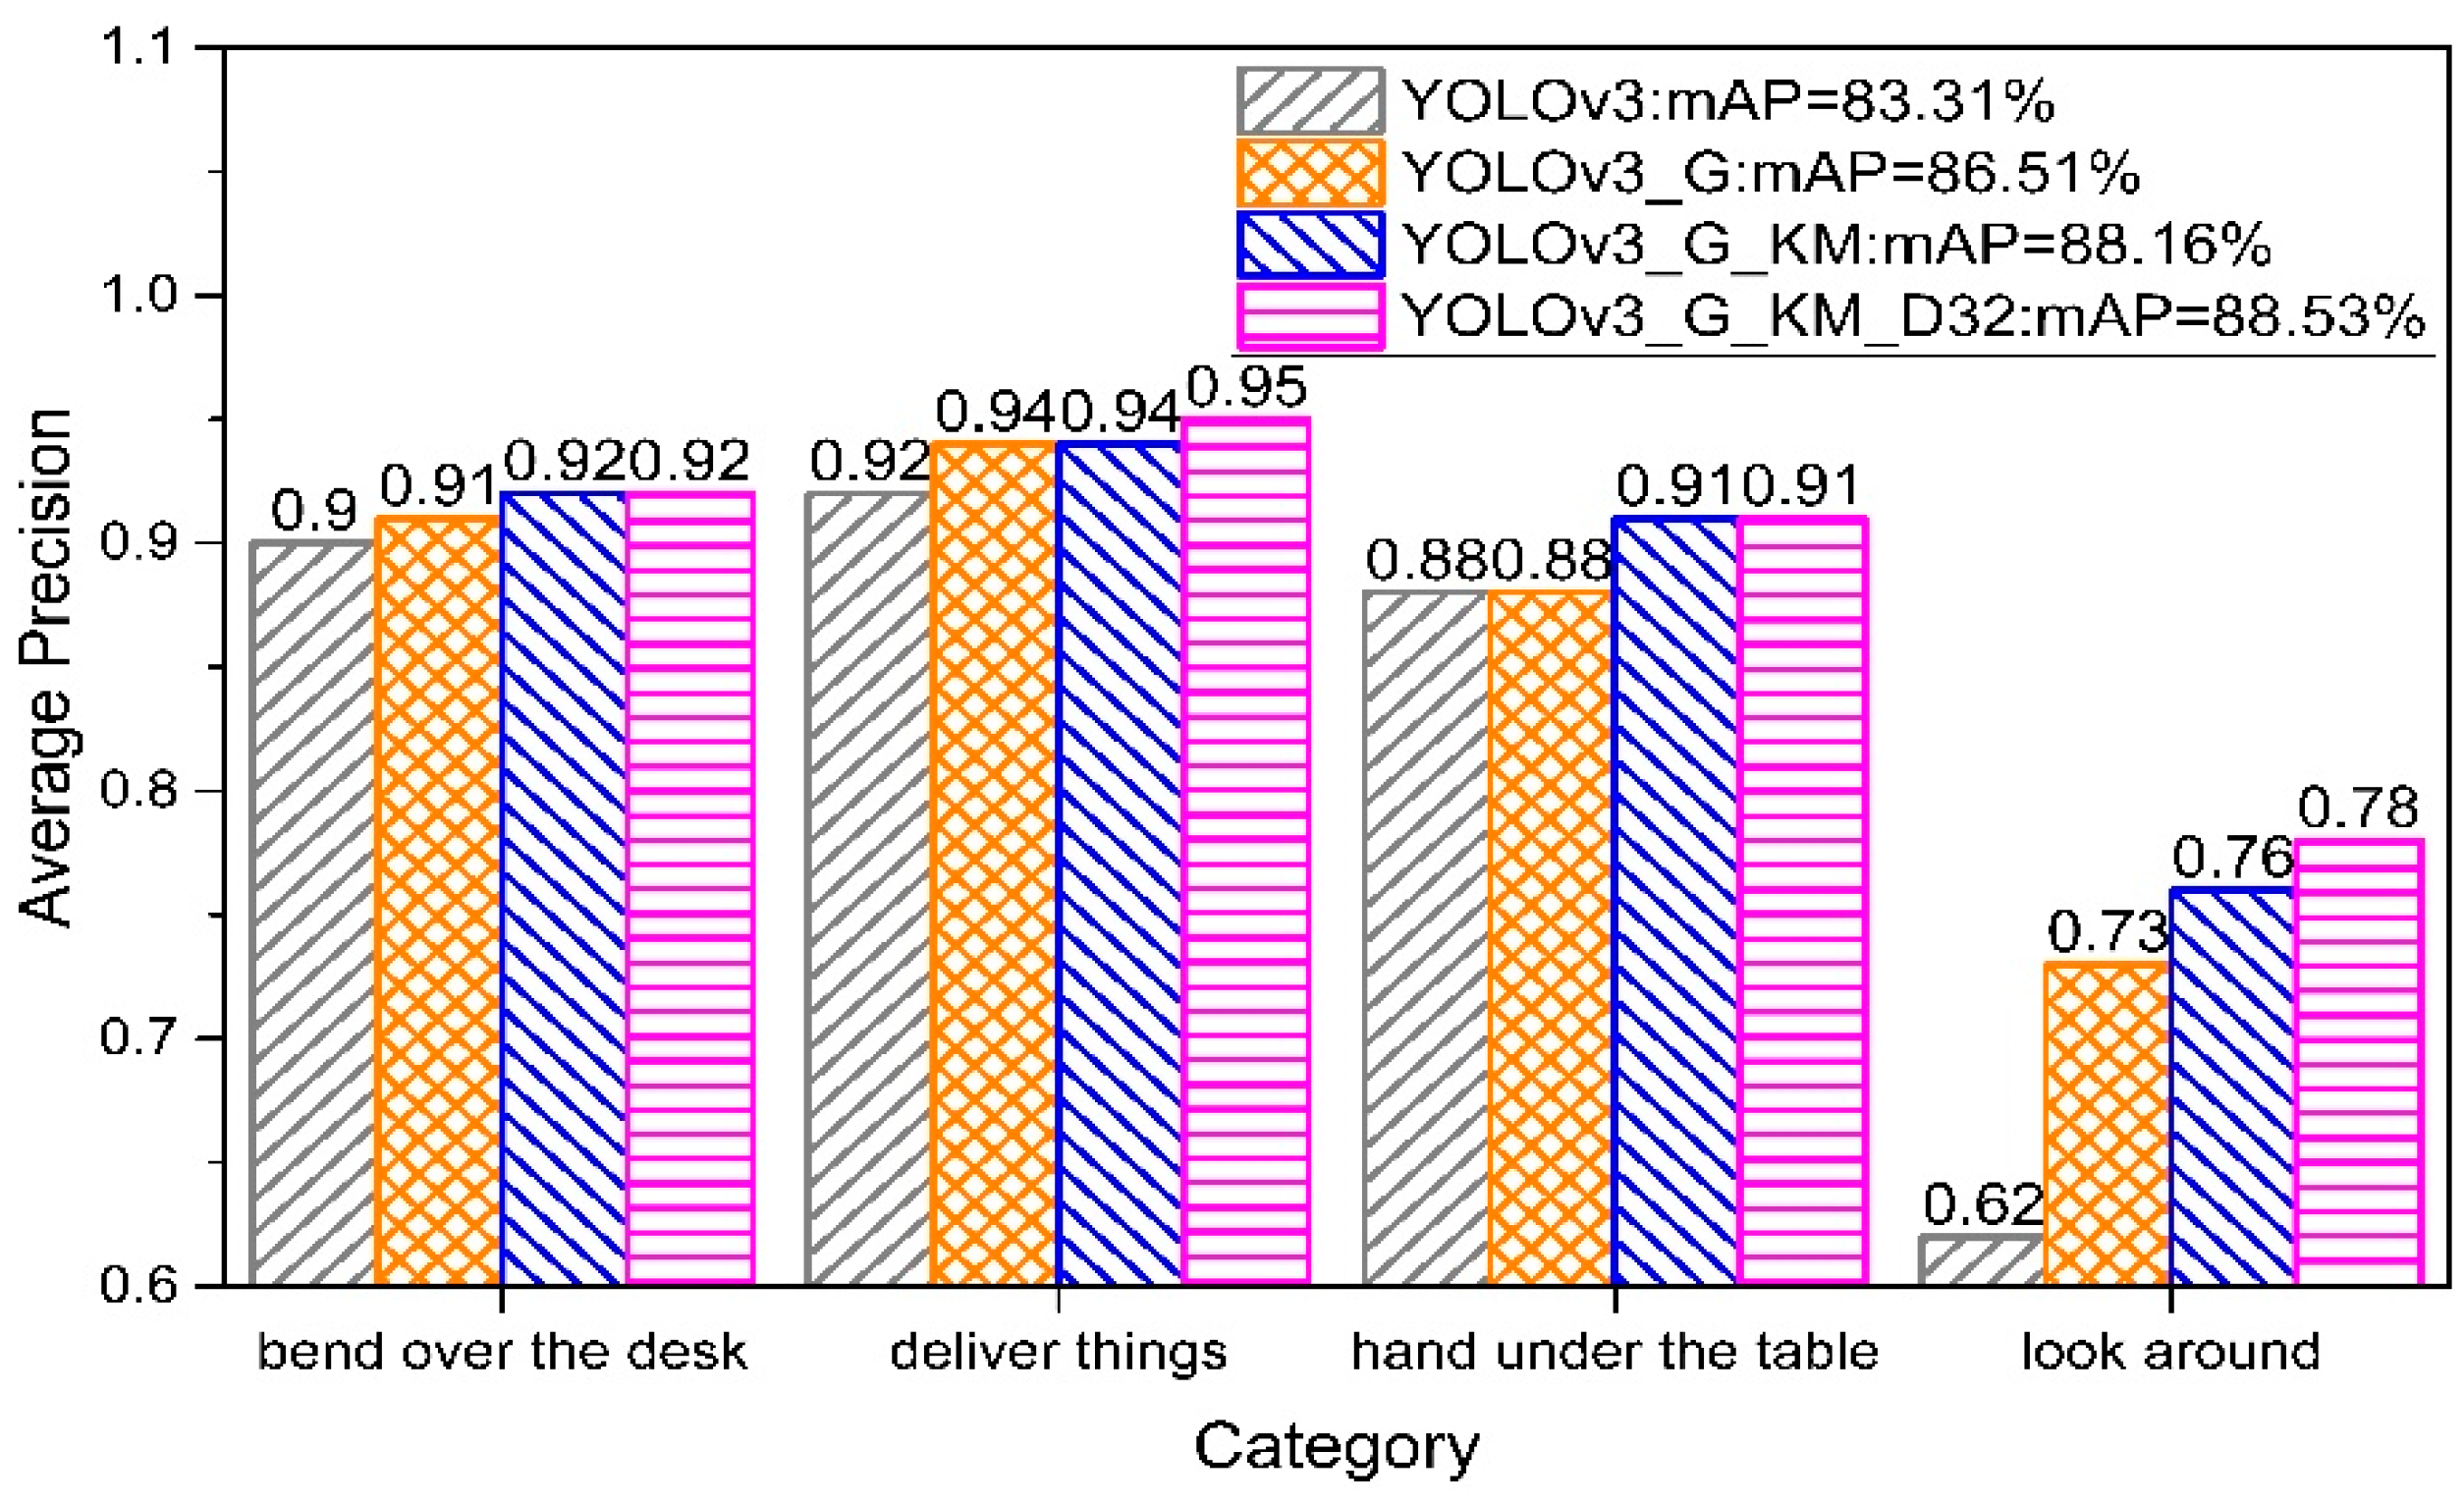
Based on the improvement points proposed in this article, three models are established. YOLOv3_G is a model built after optimizing the loss function. YOLOv3_G_KM is a model built after optimizing the loss function and combined with the best anchor boxes. YOLOv3_G_KM_D32 (algorithm using optimized loss function and backbone, and combining with the best anchor boxes—the algorithm proposed in this paper). is a model built after optimizing the loss function and backbone, and combining with the best anchor boxes. Comparison of the previously mentioned three models with the original YOLOv3 algorithm model is shown in Figure 8.
As it can be seen from the figure, every improvement can improve the overall detection accuracy of the algorithm to a certain extent. The mAP of the YOLOv3_G_KM_D32 proposed in this paper on the test set reached 88.53%, which is the highest among several models, and 5.22% higher than that of the original YOLOv3. From the perspective of the detection accuracy of a single behavior, the improved YOLOv3_G_KM_D32 has significantly higher detection accuracy for each type of behavior than that of the original YOLOv3 algorithm. For the “look around” behavior with the worst detection accuracy, every improvement of the algorithm will significantly improve its detection accuracy, and the final algorithm increases its detection accuracy by 16%. It can be concluded that optimizing the loss function of the algorithm, using the K-Means algorithm to cluster the bounding boxes in the data set to obtain the best anchor boxes, and using the improved backbone can all improve the detection accuracy of the algorithm in varying degrees.
Among the four behaviors, the detection accuracy of the three behaviors of “deliver things,” “hand under the table,” and “bend over the desk” is relatively high, but the detection accuracy of the behavior “look around” is obviously low. There may be two reasons for this phenomenon. One is that the training data set is not large enough. The other is that the amplitude of the “look around” behavior is too small, which is not very different from the normal behavior in the examination, and the other three behaviors have clear changes in the amplitude of the movement.
3.3.2. Analysis of Detection Speed
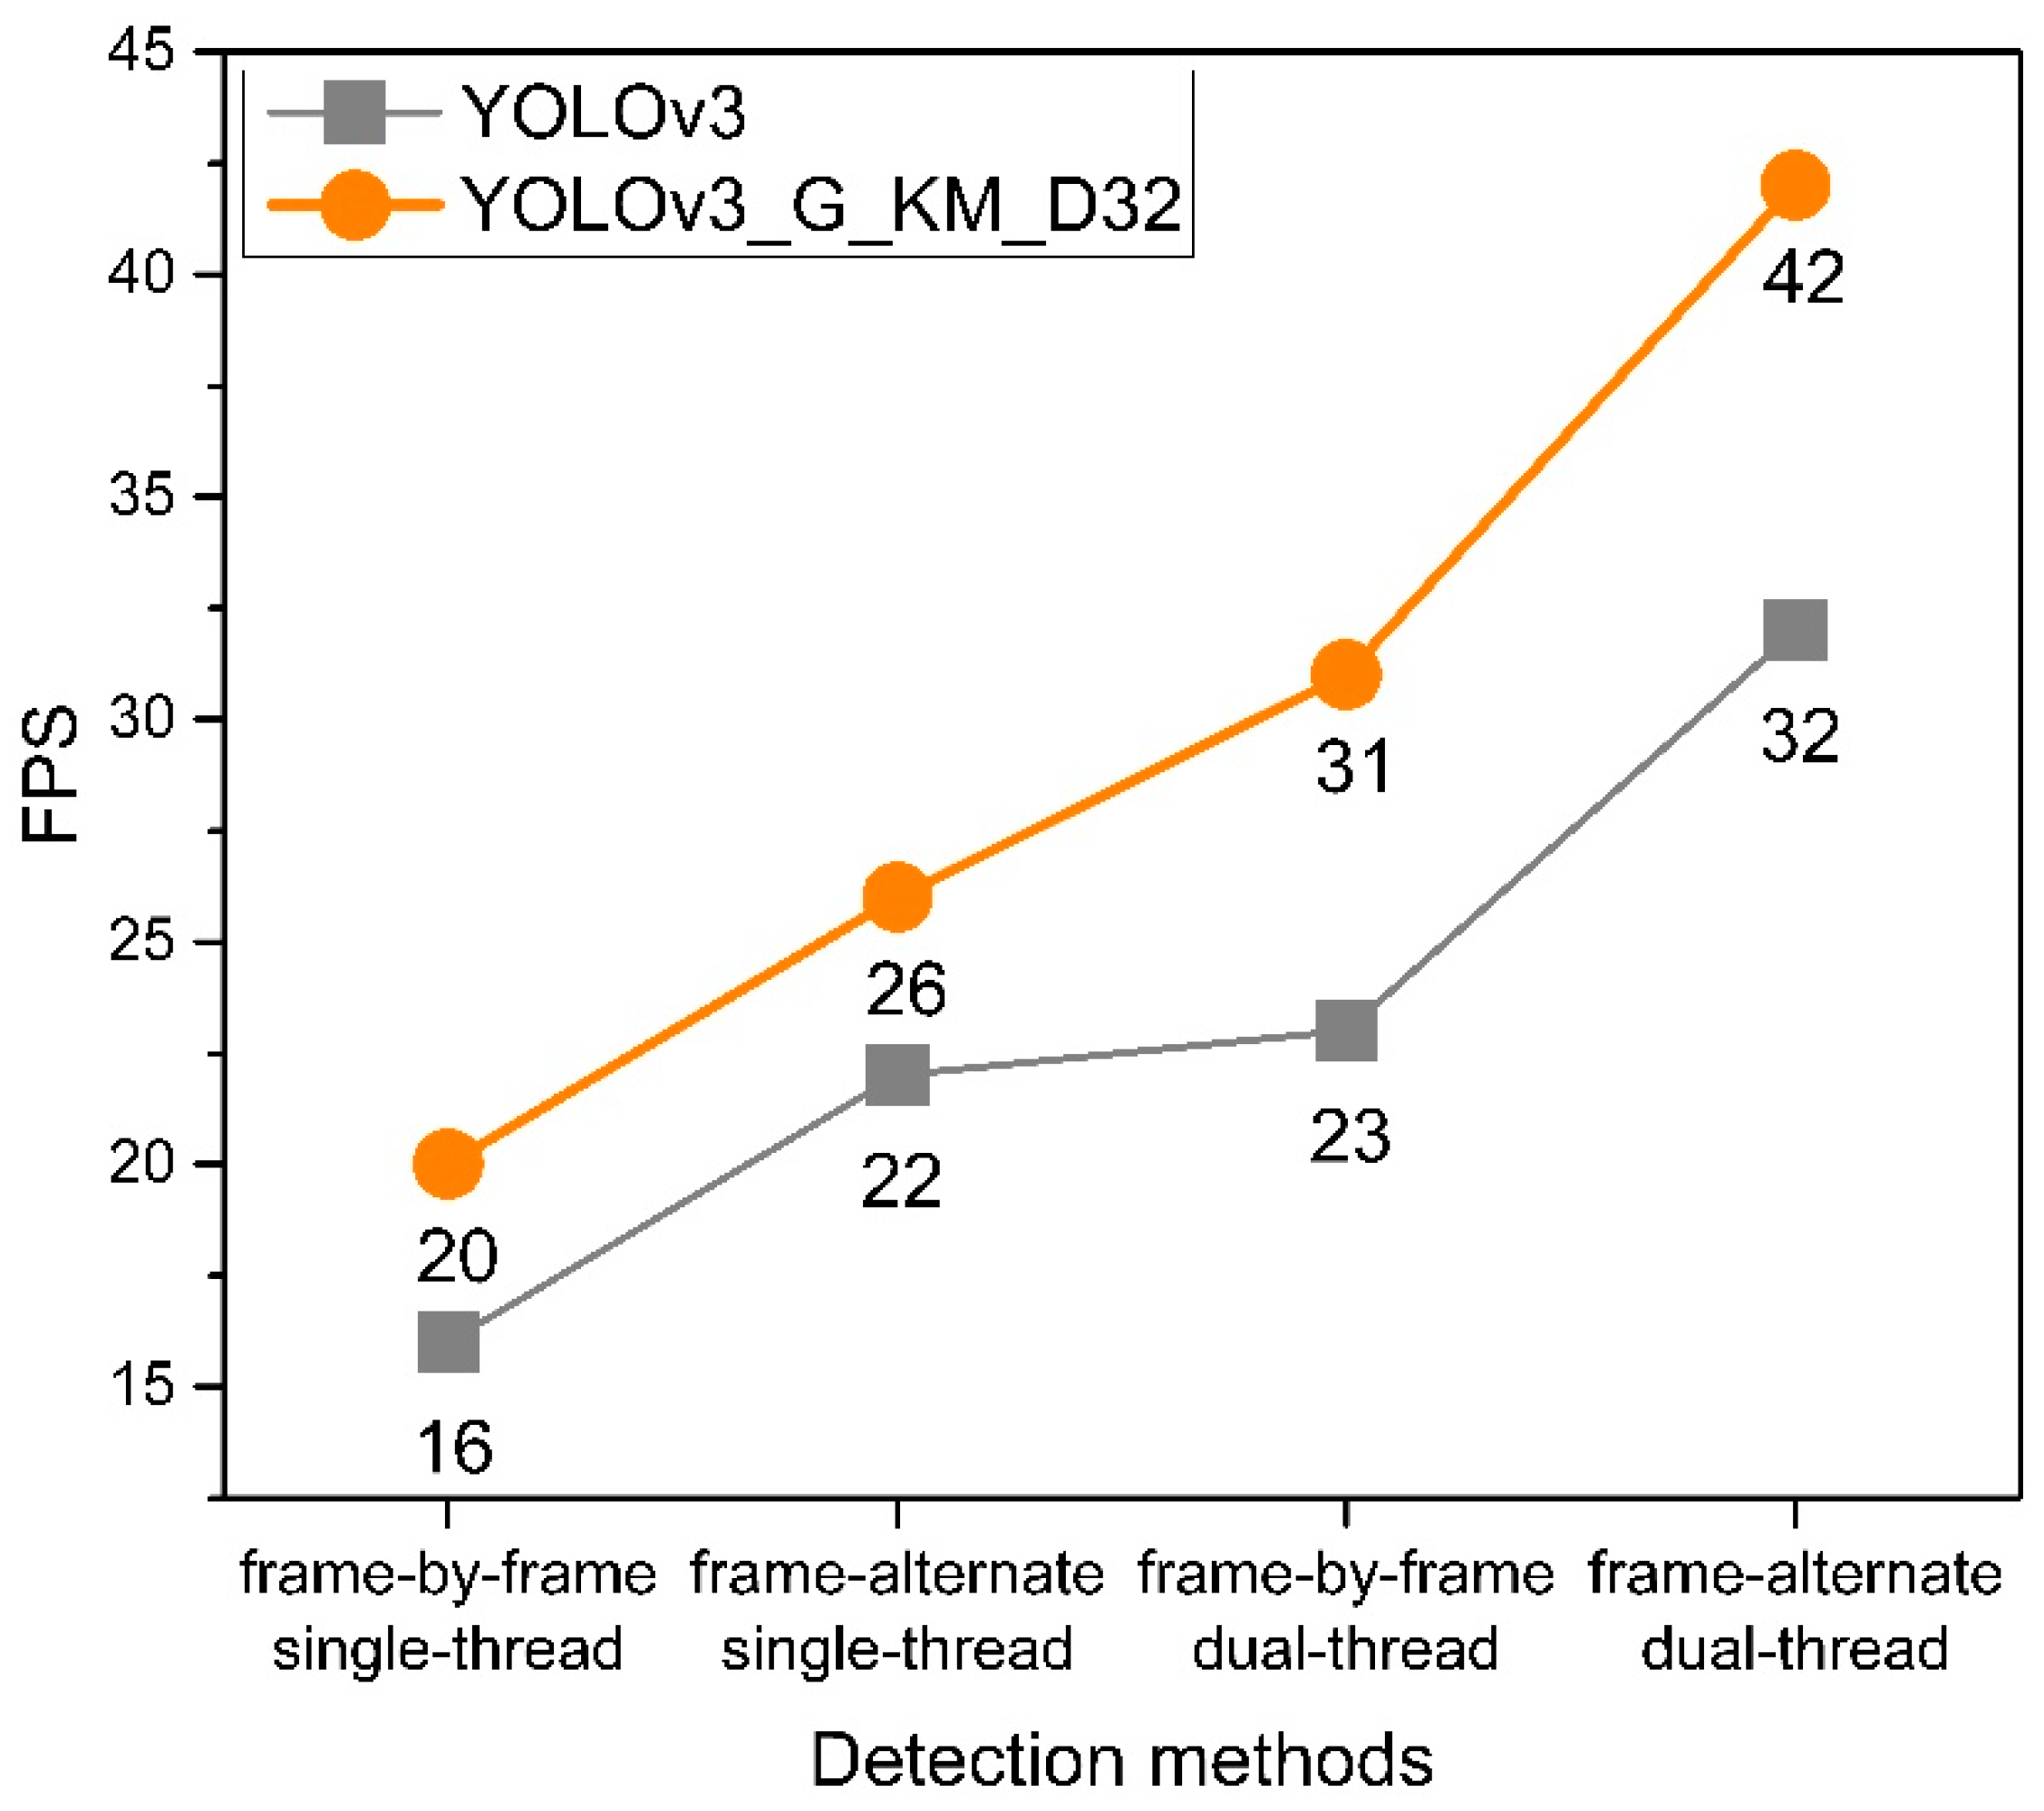
This experiment uses four methods to perform video detection on the improved YOLOv3_G_KM_D32 algorithm and the original YOLOv3 algorithm. They are frame-by-frame single-thread, frame-alternate single-thread, frame-by-frame dual-thread, and frame-alternate dual-thread. The results are shown in Figure 9 and Figure 10. It can be seen from Figure 9 that the YOLOv3_G_KM_D32 algorithm model proposed in this paper has a detection speed of 42FPS in the frame-alternate dual-thread detection mode, and 20FPS in the frame-by-frame single-thread detection mode. In any detection method, the detection speed of the YOLOv3_G_KM_D32 is significantly higher than that of the original YOLOv3 algorithm. By using frame-alternate dual-thread detection technology, the video detection speed is increased to 42FPS, which meets the requirements of real-time detection.
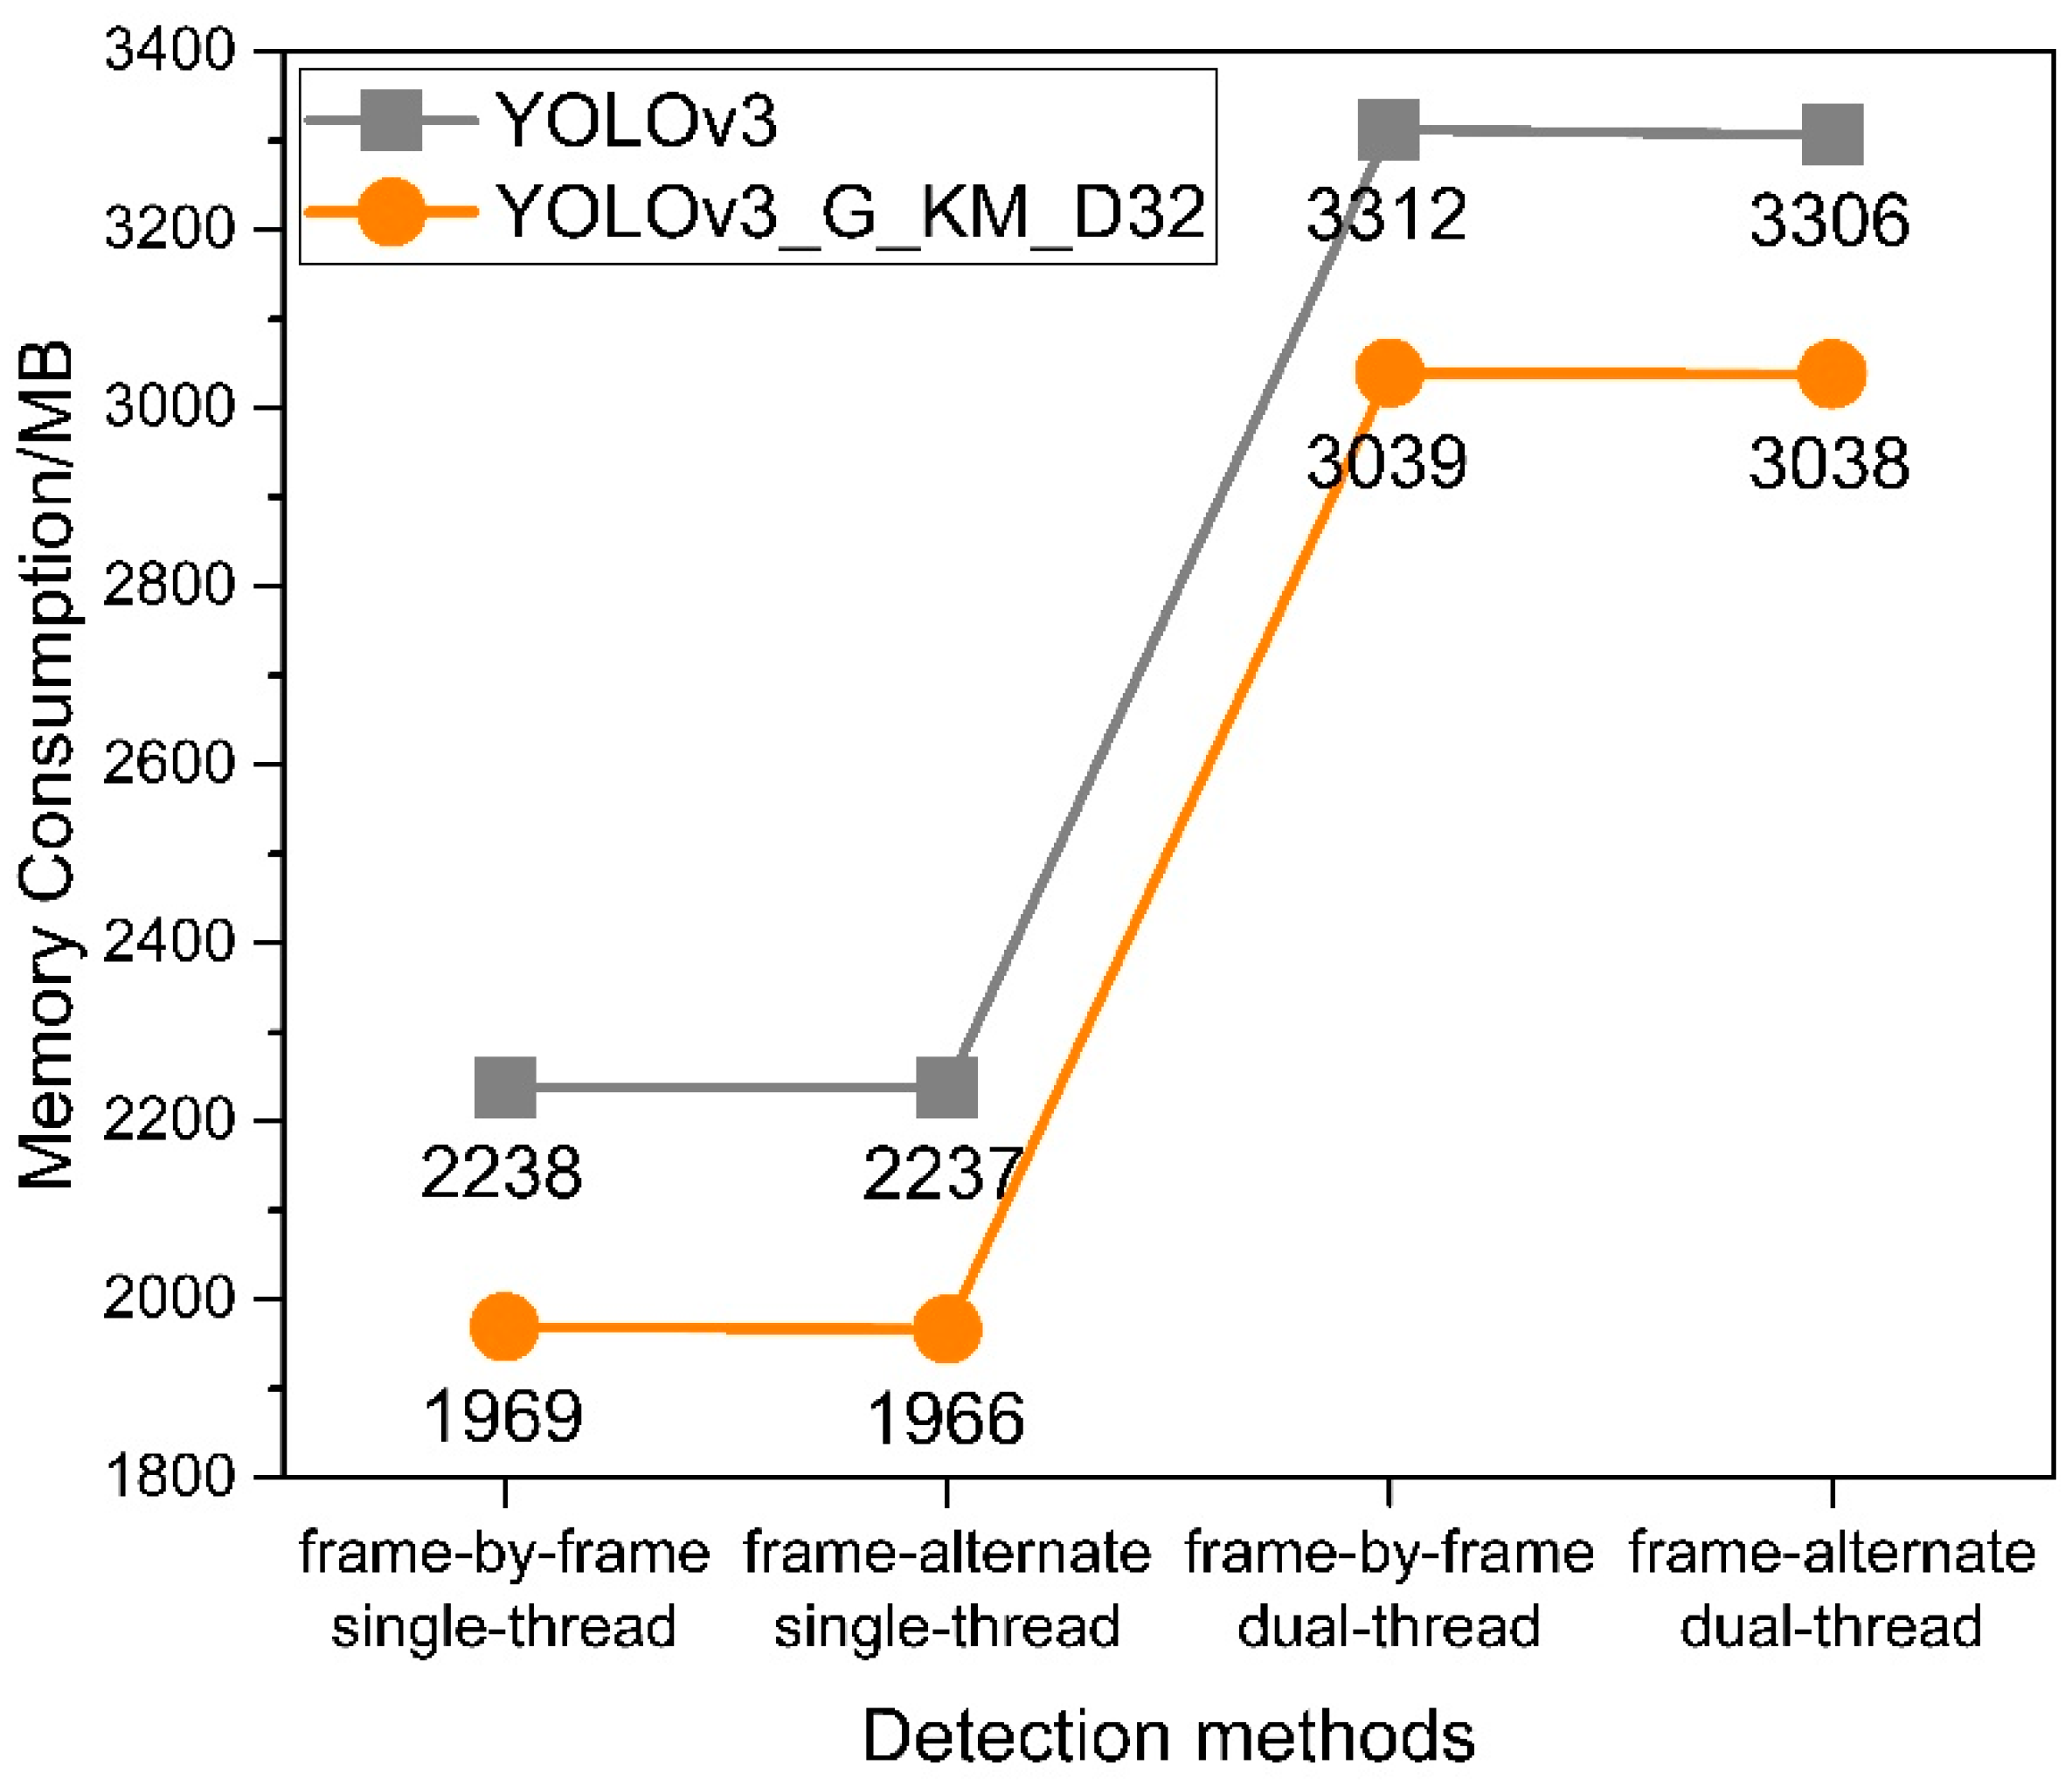
With the increase of threads, memory consumption will increase. As shown in Figure 10, the YOLOv3_G_KM_D32 algorithm proposed in this paper consumes 3038 MB of memory in the frame-alternate dual-thread detection mode and only 1969 MB in the frame-by-frame single-thread detection mode. In any detection method, the memory consumption of the YOLOv3_G_KM_D32 algorithm proposed in this paper is significantly less than that of the original YOLOv3 algorithm, which reduces memory consumption while achieving real-time detection.
As shown in Figure 9 and Figure 10, compared to the original YOLOv3 algorithm, the YOLOv3_G_KM_D32 algorithm proposed in this paper performs better in terms of detection speed and memory consumption. In addition, the frame-alternate dual-thread detection method proposed in this paper greatly improves the detection speed. Although the memory consumption has increased, it is within an acceptable range.
3.3.3. Performance Comparison of Different Algorithms
Different algorithms were used in the experiment to establish the model, and the test results are shown in Table 2.
As can be seen from Table 2, the overall performance of the YOLOv3 series of algorithms is better than that of the SSD algorithm. Therefore, YOLOv3 is more suitable for abnormal behavior detection in the examination. From the perspective of overall detection accuracy, the YOLOv3_G_KM_D32 algorithm proposed in this paper has clear advantages. Its mAP reaches 88.53%, which is 26.09% higher than that of the SSD300 and 5.22% higher than that of the original YOLOv3. From the perspective of a single behavior detection accuracy, only the SSD300 algorithm has a low AP for each behavior detection, and the AP of other algorithms is relatively high, but the YOLOv3_G_KM_D32 algorithm has the highest AP for each behavior. Especially for the detection of “look around” behavior, the AP of the YOLOv3_G_KM_D32 algorithm is 77.52%, which is 41.99% higher than that of the SSD300 algorithm, and 15.13% higher than that of the original YOLOv3 algorithm. In terms of detection speed, the YOLOv3_G_KM_D32 algorithm reaches 42FPS, which is slightly inferior to the detection speed of the SSD300 algorithm, but far surpasses other algorithms.
In general, YOLOv3_G_KM_D32 has achieved good results in both the detection accuracy and detection speed, and has significant accuracy and speed advantages in the detection of abnormal behavior in the examination.
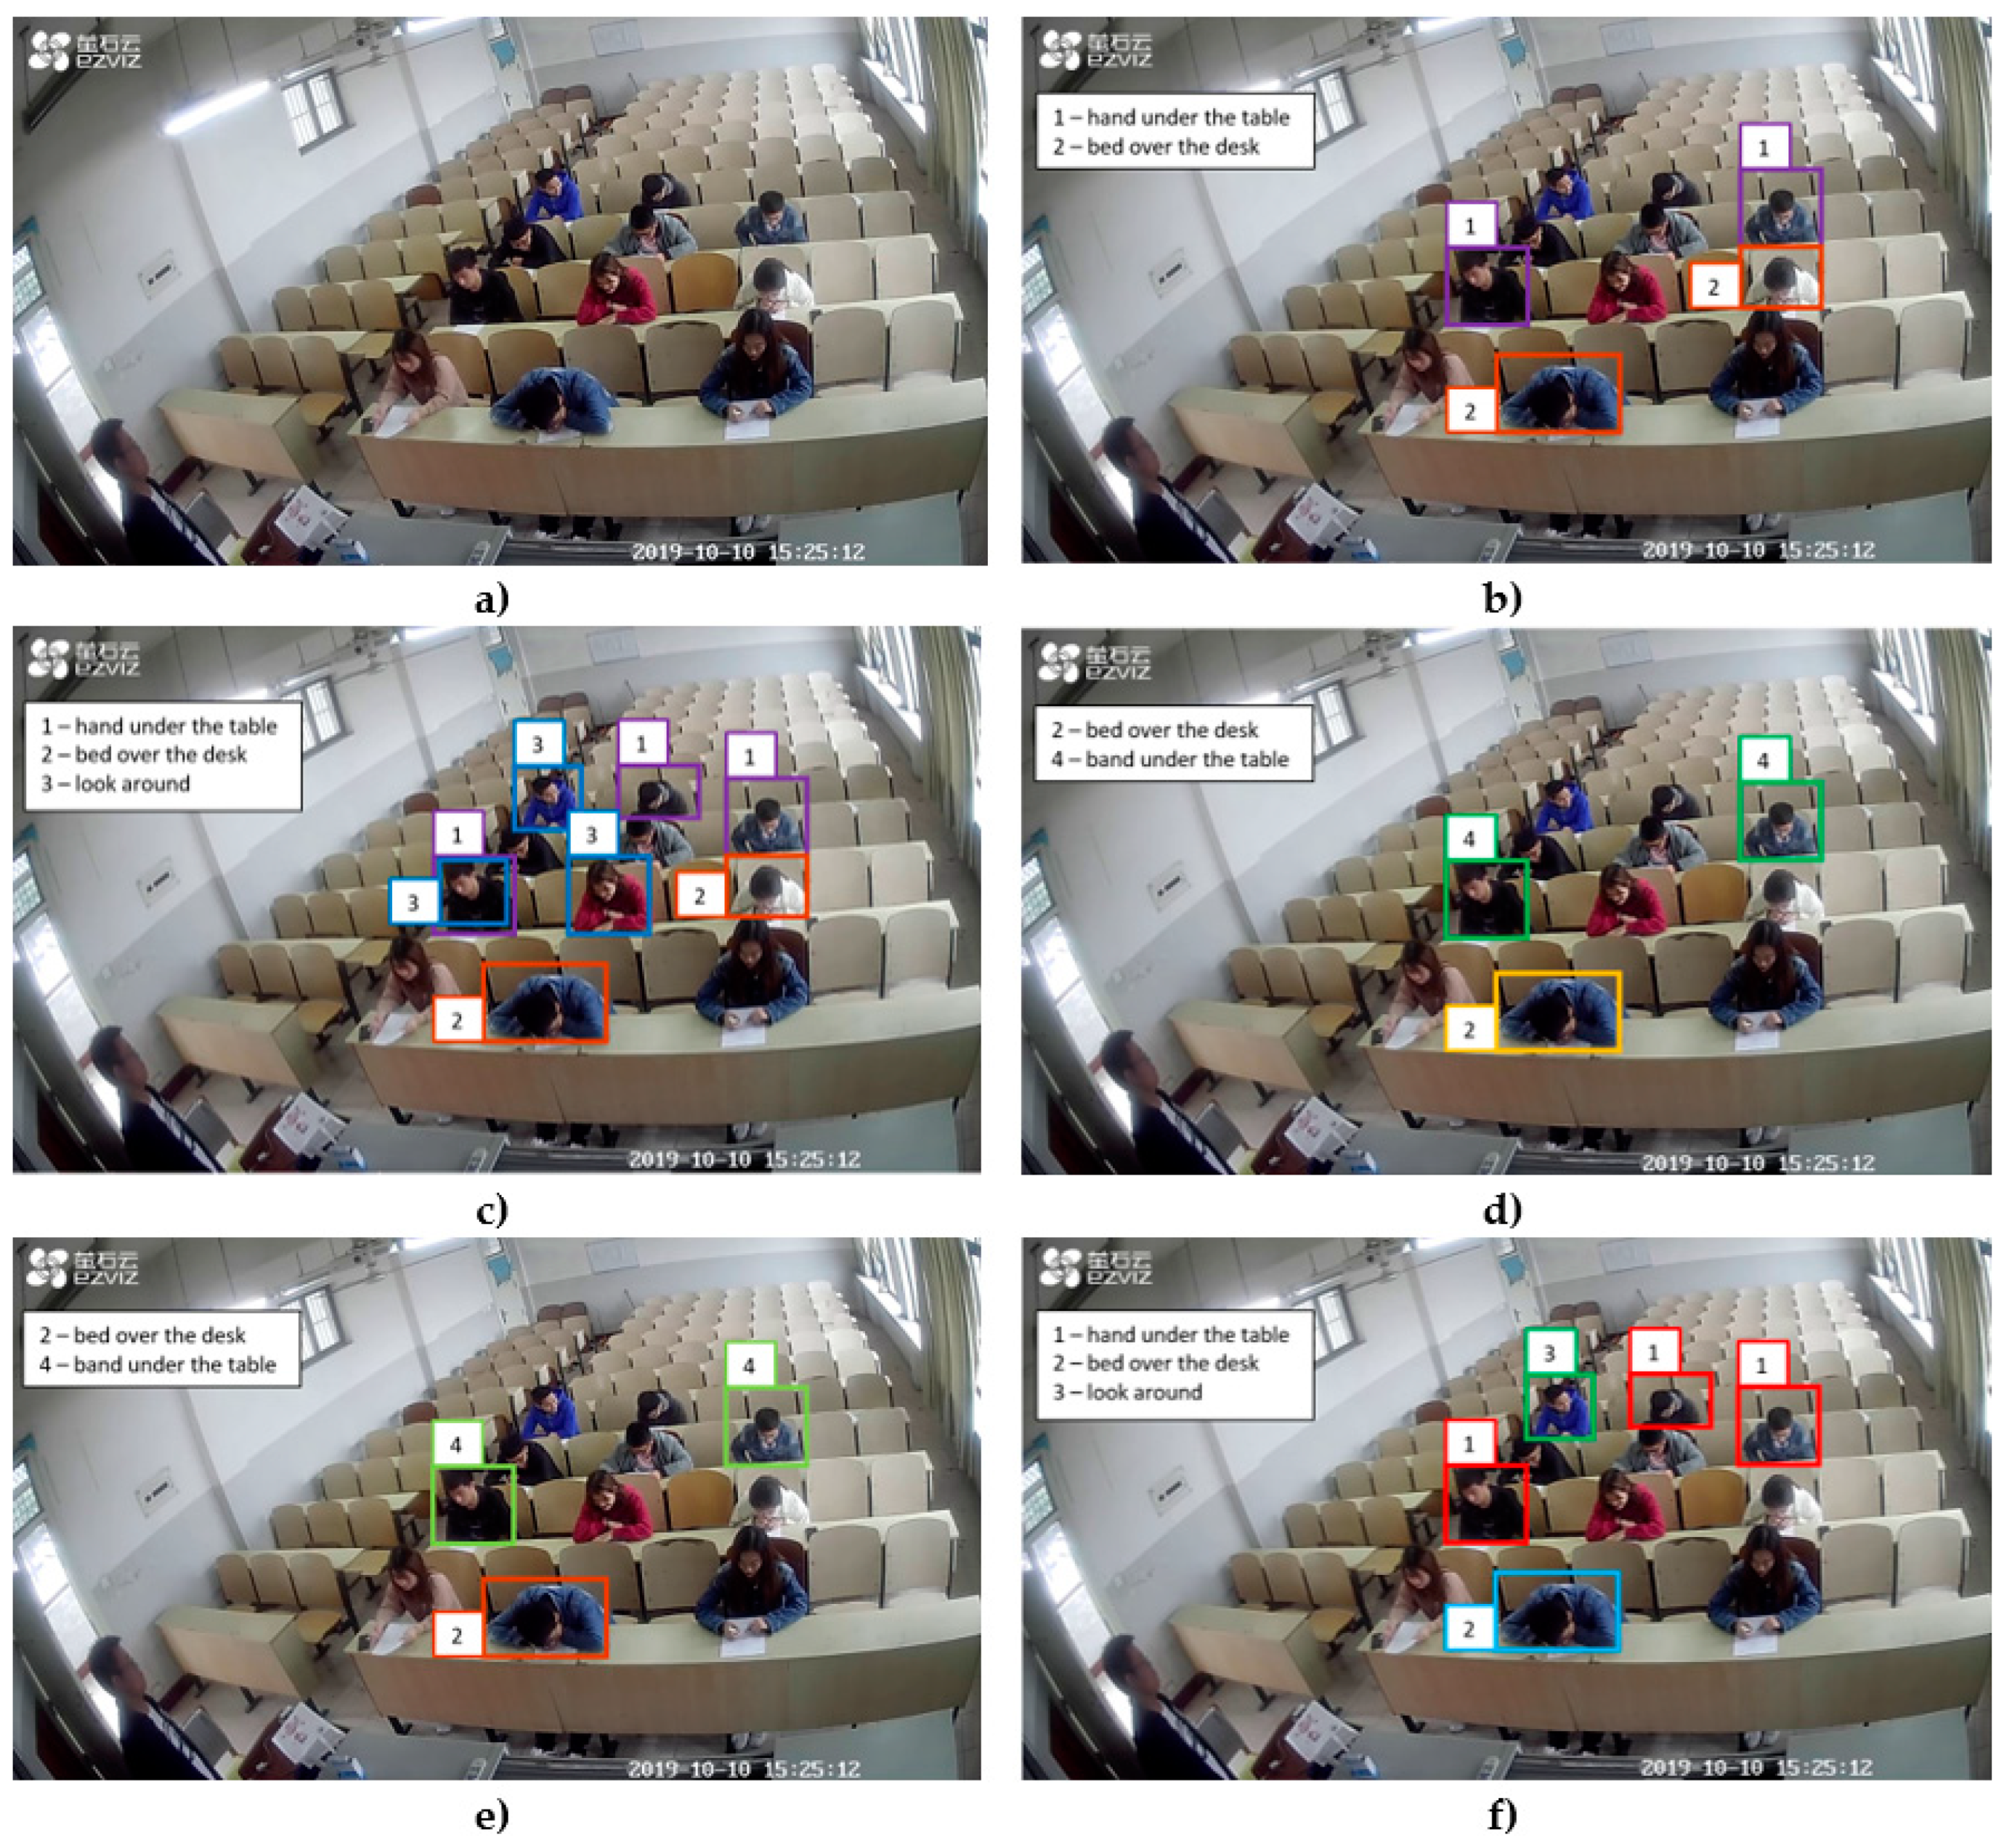
Figure 11 shows the test results of different algorithms on the same image. (a) is the original image, (b) is the detection result of SSD300. There are two missed detections and one false detection. (c) is the detection result of SSD500. Although no missed detection, there are three false detections. (d) and (e) are the detection results of SSD-MobileNet and YOLOv3, respectively. Both algorithms have two missed detections, but there are no false detections. (f) is the detection result of YOLOv3_G_KM_D32. The algorithm detects all abnormal behaviors in the examination without a false detection.
Figure 11 only shows the test result of one image, but, in the experiment, we tested more images and found that the YOLOv3_G_KM_D32 algorithm proposed in this paper has a better detection effect. Especially when the seat of the detected object is in the back row, the YOLOv3_G_KM_D32 algorithm can also be used to accurately detect it, but other algorithms cannot achieve such good results.
4. Conclusions
Aiming at the problem of abnormal behavior detection in the examination, this article adopts the improved YOLOv3 algorithm. Starting from the production of examination of abnormal behavior data sets, by optimizing the loss function of the algorithm, using the K-Means algorithm to obtain the best anchor boxes, and designing a new backbone Darknet32, we used the frame-alternate dual thread method to detect the video. Analyzing the detection accuracy (AP and mAP), detection speed (FPS), and memory consumption of the algorithm, and getting the following conclusions.
- (1)
- The use of GIoUloss and focal loss to optimize the loss function of the YOLOv3 algorithm, and the use of the K-Means algorithm to cluster the bounding boxes in the data set to obtain the best anchor boxes can improve the algorithm’s detection accuracy of abnormal behavior in the examination.
- (2)
- The use of the backbone Darknet32 proposed in this paper for abnormal behavior detection in the examination can improve the detection speed and reduce memory consumption of the computer while ensuring high detection accuracy.
- (3)
- The frame-alternate dual thread detection method can greatly increase the speed of abnormal behavior detection in the examination without consuming a large amount of memory, and this method meets the need of real-time detection.
This paper combines theory with practice. The researched content can be easily integrated with the camera in the examination room to realize real-time automated invigilation. We comprehensively consider the balance of detection accuracy and detection speed, and this paper proposes the use of the improved YOLOv3 algorithm for abnormal behavior detection in the examination. Through the improvement of the YOLOv3 algorithm, the detection accuracy and detection speed are improved, which has a certain reference value for the subsequent development of automated invigilation. Since the experimental data set is not large enough, the examination scenarios are not rich enough, and the settings of abnormal behaviors are not detailed enough. The data collection can be increased in future research. In the research, it is found that the detection accuracy of “look around” is not good enough because the action range of the behavior is too small. This phenomenon will be studied in the next research study to improve the detection accuracy.
Author Contributions
All authors contributed to the study conception and design. Methodology, M.-t.F., K.P., Z.-j.C., T.L., M.M., and O.K. Formal analysis and investigation, M.-t.F., K.P., Z.-j.C., T.L., and M.M. Writing of the original draft preparation, M.-t.F., K.P., Z.-j.C., O.K., and T.L. Writing of review and editing, M.-t.F., K.P., T.L., and Z.-j.C. Funding acquisition M.M. and K.P. All authors have read and agreed to the published version of the manuscript.
Funding
This research work was supported by the National Natural Science Foundation of China (61672112). This work was financed in the framework of the project Lublin University of Technology—contract no. FN-21/E/EE/2020 and FN-31/E/EE/2020.
Conflicts of Interest
The authors declare no conflict of interest.
References
- Michałowska, J.; Mazurek, P.A.; Gad, R.; Chudy, A.; Kozieł, J. Identification of the Electromagnetic Field Strength in Public Spaces and During Travel. In 2019 Applications of Electromagnetics in Modern Engineering and Medicine (PTZE); IEEE: Piscataway Township, NJ, USA, 2019; pp. 121–124. [Google Scholar]
- Wang, J.; Kochan, O.; Przystupa, K.; Su, J. Information-measuring system to study the thermocouple with controlled temperature field. Meas. Sci. Rev. 2019, 19, 161–169. [Google Scholar] [CrossRef] [Green Version]
- Lonkwic, P.; Przystupa, K.; Krakowski, T.; Ruta, H. Case Study of Support Frame Optimization Using a Distant Load. Sustainability 2020, 12, 974. [Google Scholar] [CrossRef] [Green Version]
- Rahman, S.; Ali, F.; Smagor, A.; Muhammad, F.; Habib, U.; Glowacz, A.; Mursal, S.N.F. Mitigation of nonlinear distortions for a 100 Gb/s radio-over-fiber-based WDM network. Electronics 2020, 9, 1796. [Google Scholar] [CrossRef]
- Przystupa, K. Jakość kształcenia w uczelni wyższej. Autobusy Tech. Eksploat. Syst. Transp. 2017, 18, 1770–1775. [Google Scholar]
- Kozieł, J.; Wac-Włodarczyk, A.; Śniadkowski, M. IT education at the faculty of electrotechnology: Quality analysis and evaluation. In Proceedings of the 29th Annual Conference of the European Association for Education in Electrical and Information Engineering (EAEEIE), Ruse, Bulgaria, 4–6 September 2019; pp. 1–4. [Google Scholar]
- Han, J.; Yang, Z.; Xu, H.; Hu, G.; Zhang, C.; Li, H.; Zeng, H. Search Like an Eagle: A Cascaded Model for Insulator Missing Faults Detection in Aerial Images. Energies 2020, 13, 713. [Google Scholar] [CrossRef] [Green Version]
- Jin, B.; Xu, D.D. Enhancing education of credit and honesty of medical students in terms of cheating on exams. Chin. J. Med Educ. 2011, 31, 93–94+122. [Google Scholar]
- Kim, S.H.; Choi, H.L. Convolutional Neural Network-Based Multi-Target Detection and Recognition Method for Unmanned Airborne Surveillance Systems. Int. J. Aeronaut. Space Sci. 2019, 20, 1038–1046. [Google Scholar] [CrossRef]
- Kou, Z.; Wu, J.; Wang, H.; Ruan, W. Obstacle visual sensing based on deep learning for low-altitude small unmanned aerial vehicles. Sci. Sin. Inf. 2020, 50, 692–703. [Google Scholar]
- Zhao, J.H.; Zhang, X.G.; Yang, L. Ship detection in remote sensing based on deep learning. Sci. Surv. Mapp. 2020, 45, 110–116+134. [Google Scholar]
- Zeng, X.; Wen, L.; Liu, B.; Qi, X. Deep learning for ultrasound image caption generation based on object detection. Neurocomputing 2020, 392, 132–141. [Google Scholar] [CrossRef]
- Redmon, J.; Farhadi, A. Yolov3: An incremental improvement. arXiv 2018, arXiv:1804.02767. [Google Scholar]
- Pang, L.; Liu, H.; Chen, Y.; Miao, J. Real-time Concealed Object Detection from Passive Millimeter Wave Images Based on the YOLOv3 Algorithm. Sensors 2020, 20, 1678. [Google Scholar] [CrossRef] [PubMed] [Green Version]
- Park, M.; Ko, B.C. Two-step real-time night-time fire detection in an urban environment using Static ELASTIC-YOLOv3 and Temporal Fire-Tube. Sensors 2020, 20, 2202. [Google Scholar] [CrossRef] [PubMed] [Green Version]
- Kuznetsova, A.; Maleva, T.; Soloviev, V. Using YOLOv3 algorithm with pre-and post-processing for apple detection in fruit-harvesting robot. Agronomy 2020, 10, 1016. [Google Scholar] [CrossRef]
- Kulikajevas, A.; Maskeliūnas, R.; Damaševičius, R.; Ho, E.S. 3D object reconstruction from imperfect depth data using extended YOLOv3 network. Sensors 2020, 20, 2025. [Google Scholar] [CrossRef] [Green Version]
- Valiati, G.R.; Menotti, D. Detecting Pedestrians with YOLOv3 and Semantic Segmentation Infusion. In Proceedings of the 2019 International Conference on Systems, Signals and Image Processing (IWSSIP), Osijek, Croatia, 5–7 June 2019; pp. 95–100. [Google Scholar]
- Novak, B.; Ilić, V.; Pavković, B. YOLOv3 Algorithm with additional convolutional neural network trained for traffic sign recognition. In Proceedings of the 2020 Zooming Innovation in Consumer Technologies Conference (ZINC), Novi Sad, Serbia, 26–27 May 2020; pp. 165–168. [Google Scholar]
- Xue, J.W.; Li, Z.H.; Fukuda, M.; Takahashi, T.; Suzuki, M.; Mae, Y.; Arai, Y.; Aoyagi, S. Application of garbage detection based on improved YOLOv3 algorithm. J. Optoelectron. Laser 2020, 31, 928–938. [Google Scholar]
- Shi, J.W.; Zhang, Y. License plate recognition system based on improved YOLOv3 and BGRU. Comput. Eng. Des. 2020, 41, 2345–2351. [Google Scholar]
- Qi, Z.G.; LI, Y.Y.; Li, B.; Yuan, X. Simulation of small object detection based on Tiny-YOLOv3. Exp. Technol. Manag. 2020, 37, 38–41. [Google Scholar]
- Li, M.K.; Zhang, T.; Cui, W.N. Research of Infrared Small Pedestrian Target Detection Based on YOLOv3. Infrared Technol. 2020, 42, 176–181. [Google Scholar]
- Sun, S.; Przystupa, K.; Wei, M.; Yu, H.; Ye, Z.; Kochan, O. Fast bearing fault diagnosis of rolling element using Levy Moth-Flame optimization algorithm and Naive Bayes. Eksploat. I Niezawodn.-Maint. Reliab. 2020, 22, 730–740. [Google Scholar] [CrossRef]
- Hong, G.S.; Kim, B.G.; Hwang, Y.S.; Kwon, K.K. Fast multi-feature pedestrian detection algorithm based on histogram of oriented gradient using discrete wavelet transform. Multimed. Tools Appl. 2016, 75, 15229–15245. [Google Scholar] [CrossRef]
- Lowe, D.G. Distinctive image features from scale-invariant keypoints. Int. J. Comput. Vis. 2004, 60, 91–110. [Google Scholar] [CrossRef]
- Zhang, L.; Zhang, D.; Sun, J.; Wei, G.; Bo, H. Salient object detection by local and global manifold regularized SVM model. Neurocomputing 2019, 340, 42–54. [Google Scholar] [CrossRef]
- Mohemmed, A.; Johnston, M.; Zhang, M. Particle swarm optimisation based AdaBoost for object detection. Soft Comput. 2011, 15, 1793–1805. [Google Scholar] [CrossRef]
- Yin, F.; Zheng, L.; Chen, T.T. Chinese text localization based on Adaboost algorithm in natural images. Comput. Eng. Appl. 2017, 53, 200–204. [Google Scholar]
- Lu, X.; Liu, K.; Cheng, Y.X. Non-Motor Vehicle Target Detection Based on Deep Learning. Comput. Eng. Appl. 2019, 55, 182–188+214. [Google Scholar]
- Girshick, R.; Donahue, J.; Darrell, T.; Malik, J. Region-based convolutional networks for accurate object detection and segmentation. IEEE Trans. Pattern Anal. Mach. Intell. 2015, 38, 142–158. [Google Scholar] [CrossRef]
- Girshick, R. Fast r-cnn. In Proceedings of the IEEE International Conference on Computer Vision, Santiago, Chile, 7–13 December 2015; pp. 1440–1448. [Google Scholar]
- Jiao, L.; Zhang, F.; Liu, F.; Yang, S.; Li, L.; Feng, Z.; Qu, R. A survey of deep learning-based object detection. IEEE Access 2019, 7, 128837–128868. [Google Scholar] [CrossRef]
- He, K.; Zhang, X.; Ren, S.; Sun, J. Spatial pyramid pooling in deep convolutional networks for visual recognition. IEEE Trans. Pattern Anal. Mach. Intell. 2015, 37, 1904–1916. [Google Scholar] [CrossRef] [Green Version]
- Ren, S.; He, K.; Girshick, R.; Sun, J. Faster r-cnn: Towards real-time object detection with region proposal networks. In Proceedings of the Advances in Neural Information Processing Systems, Montreal, QC, Canada, 7–12 December 2015; pp. 91–99. [Google Scholar]
- Redmon, J.; Divvala, S.; Girshick, R.; Farhadi, A. You only look once: Unified, real-time object detection. In Proceedings of the Ieee Conference on Computer Vision And Pattern Recognition, Las Vegas, NV, USA, 27–30 June 2016; pp. 779–788. [Google Scholar]
- Liu, W.; Anguelov, D.; Erhan, D.; Szegedy, C.; Reed, S.; Fu, C.Y.; Berg, A.C. Ssd: Single shot multibox detector. In European Conference on Computer Vision; Springer: Cham, Switzerland, 2016. [Google Scholar]
- Redmon, J.; Farhadi, A. YOLO9000: Better, faster, stronger. In Proceedings of the IEEE Conference on Computer Vision and Pattern Recognition, Honolulu, HI, USA, 21–26 July 2017; pp. 7263–7271. [Google Scholar]
- Hu, H.; Zeng, C. Vehicle detection method based on improved R-FCN. Comput. Eng. Des. 2020, 41, 1164–1168. [Google Scholar]
- Bodla, N.; Singh, B.; Chellappa, R.; Davis, L.S. Soft-NMS--improving object detection with one line of code. In Proceedings of the IEEE International Conference on Computer Vision, Venice, Italy, 22–29 October 2017; pp. 5561–5569. [Google Scholar]
- Zhao, B.K.; Li, J.W.; Yang, F. A deep learning based object detection algorithm for remote sensing images. Comput. Eng. Sci. 2019, 41, 2166–2172. [Google Scholar]
- Li, X.X.; Zhu, L.Q.; Yu, Z.J. Adaptive Foreground Object Detection in Railway Scene. J. Transp. Syst. Eng. Inf. Technol. 2020, 20, 83–90. [Google Scholar]
- Qiao, T.; Su, H.S.; Liu, G.H. Object Detection Algorithm Based on Improved Feature Extraction Network. Laser Optoelectron. Prog. 2019, 56, 134–139. [Google Scholar]
- Lin, Y.Z.; Wu, X.Y.; Li, H.J. Cheating behavior detection in examination room based on background subtraction. J. Univ. Jinan 2015, 29, 406–409. [Google Scholar]
- Dai, J.B.; Long, M.L.; Zhao, H.W.; Chen, F.J. Algorithm of the exam abnormal behavior detection. J. Jilin Univ. 2012, S1. Available online: https://www.researchgate.net/publication/296589532_Algorithm_of_the_exam_abnormal_behavior_detection (accessed on 10 December 2020).
- Lin, T.Y.; Dollár, P.; Girshick, R.; He, K.; Hariharan, B.; Belongie, S. Feature pyramid networks for object detection. In Proceedings of the IEEE Conference on Computer Vision and Pattern Recognition, Honolulu, HI, USA, 21–26 July 2017; pp. 2117–2125. [Google Scholar]
- He, K.; Zhang, X.; Ren, S.; Sun, J. Deep residual learning for image recognition. In Proceedings of the IEEE Conference on Computer Vision and Pattern Recognition, Las Vegas, NV, USA, 27–30 June 2016; pp. 770–778. [Google Scholar]
- Saroj, T. Kavita, R: Review: Study on simple k mean and modified K mean clustering technique. Int. J. Sci. Eng. Comput. Technol. 2016, 6, 279–281. [Google Scholar]
- Xu, H.; Przystupa, K.; Fang, C.; Marciniak, A.; Kochan, O.; Beshley, M. A Combination Strategy of Feature Selection Based on an Integrated Optimization Algorithm and Weighted K-Nearest Neighbor to Improve the Performance of Network Intrusion Detection. Electronics 2020, 9, 1206. [Google Scholar] [CrossRef]
- Jun, S.; Przystupa, K.; Beshley, M.; Kochan, O.; Beshley, H.; Klymash, M.; Pieniak, D. A Cost-Efficient Software Based Router and Traffic Generator for Simulation and Testing of IP Network. Electronics 2020, 9, 40. [Google Scholar] [CrossRef] [Green Version]
- Hezatofighi, H.; Tsoi, N.; Gwak, J.; Sadeghian, A.; Reid, I.; Savarese, S. Generalized intersection over union: A metric and a loss for bounding box regression. In Proceedings of the IEEE Conference on Computer Vision and Pattern Recognition, Long Beach, CA, USA, 16–20 June 2019; pp. 658–666. [Google Scholar]
- Lin, T.Y.; Goyal, P.; Girshick, R.; He, K.; Dollár, P. Focal loss for dense object detection. In Proceedings of the IEEE International Conference on Computer Vision, Venice, Italy, 22–29 October 2017; pp. 2980–2988. [Google Scholar]
Figure 1.
YOLOv3 structure.

Figure 2.
Picture after division by the grid.

Figure 3.
Mean IoU and anchor boxes.

Figure 4.
Darknet32 structure.

Figure 5.
Params and FLOPs.

Figure 6.
Alternate-frame and dual thread detection process.

Figure 7.
Multi-angle video screenshot (a) left, (b) center, and (c) right.

Figure 8.
Comparison of the detection accuracy for proposed algorithms with the original YOLOv3 algorithm.
Figure 8.
Comparison of the detection accuracy for proposed algorithms with the original YOLOv3 algorithm.

Figure 9.
Frames Per Second (FPS).

Figure 10.
Memory consumption.

Figure 11.
Display of object detection results. (a) Original image, (b) SSD300, (c) SSD512, (d) SSD-MobileNet, (e) YOLOv3, and (f) YOLOv3_G_KM_D32.
Figure 11.
Display of object detection results. (a) Original image, (b) SSD300, (c) SSD512, (d) SSD-MobileNet, (e) YOLOv3, and (f) YOLOv3_G_KM_D32.


Table 1.
Comparison of anchor boxes’ size.
| Anchor | 0 | 1 | 2 | 3 | 4 | 5 | 6 | 7 | 8 |
|---|---|---|---|---|---|---|---|---|---|
| YOLOv3 | (10,13) | (16,30) | (33,23) | (30,61) | (62,45) | (59,119) | (116,90) | (156,198) | (373,326) |
| Improved YOLOv3 | (45,50) | (57,66) | (89,53) | (89,79) | (108,104) | (125,135) | (131,69) | (166,97) | (237,131) |
Table 2.
Comparison of different algorithms. (SSD300: Single Shot MultiBox Detector algorithm and image input size is 300; SSD512: Single Shot MultiBox Detector algorithm and image input size is 512; SSD-MobileNet: Single Shot MultiBox Detector algorithm using MobileNet as the backbone).
Table 2.
Comparison of different algorithms. (SSD300: Single Shot MultiBox Detector algorithm and image input size is 300; SSD512: Single Shot MultiBox Detector algorithm and image input size is 512; SSD-MobileNet: Single Shot MultiBox Detector algorithm using MobileNet as the backbone).
| Model | Backbone | AP (%) | mAP (%) | FPS | |||
|---|---|---|---|---|---|---|---|
| Bend over the Desk | Deliver Things | Hand under the Table | Look Around | ||||
| SSD300 | VGG16 | 66.34 | 71.12 | 76.755 | 35.53 | 62.44 | 44 |
| SSD512 | VGG16 | 84.74 | 94.03 | 87.86 | 52.01 | 79.66 | 25 |
| SSD-MobileNet | MobileNet | 87.72 | 85.42 | 81.09 | 60.71 | 78.73 | 29 |
| YOLOv3 | DarkNet53 | 89.92 | 92.47 | 88.46 | 62.39 | 83.31 | 32 |
| YOLOv3_G_KM_D32 | DarkNet32 | 91.59 | 94.51 | 90.51 | 77.52 | 88.53 | 42 |
Publisher’s Note: MDPI stays neutral with regard to jurisdictional claims in published maps and institutional affiliations. |
© 2021 by the authors. Licensee MDPI, Basel, Switzerland. This article is an open access article distributed under the terms and conditions of the Creative Commons Attribution (CC BY) license (http://creativecommons.org/licenses/by/4.0/).
Share and Cite
MDPI and ACS Style
Fang, M.-t.; Chen, Z.-j.; Przystupa, K.; Li, T.; Majka, M.; Kochan, O. Examination of Abnormal Behavior Detection Based on Improved YOLOv3. Electronics 2021, 10, 197. https://0-doi-org.brum.beds.ac.uk/10.3390/electronics10020197
AMA Style
Fang M-t, Chen Z-j, Przystupa K, Li T, Majka M, Kochan O. Examination of Abnormal Behavior Detection Based on Improved YOLOv3. Electronics. 2021; 10(2):197. https://0-doi-org.brum.beds.ac.uk/10.3390/electronics10020197
Chicago/Turabian StyleFang, Meng-ting, Zhong-ju Chen, Krzysztof Przystupa, Tao Li, Michal Majka, and Orest Kochan. 2021. "Examination of Abnormal Behavior Detection Based on Improved YOLOv3" Electronics 10, no. 2: 197. https://0-doi-org.brum.beds.ac.uk/10.3390/electronics10020197
Note that from the first issue of 2016, this journal uses article numbers instead of page numbers. See further details here.