Sentiment Level Evaluation of 3D Handicraft Products Application for Smartphones Usage


1
Department of Tropical Agriculture and International Cooperation, National Pingtung University of Science and Technology, Pingtung 912, Taiwan
2
Department of Management Information Systems, National Pingtung University of Science and Technology, Pingtung 912, Taiwan
3
Department of Food and Beverage Management, Cheng Shiu University, Kaohsiung 833, Taiwan
*
Author to whom correspondence should be addressed.
Electronics 2021, 10(2), 199; https://0-doi-org.brum.beds.ac.uk/10.3390/electronics10020199
Submission received: 9 November 2020
/
Revised: 31 December 2020
/
Accepted: 14 January 2021
/
Published: 16 January 2021
(This article belongs to the Special Issue Human Computer Interaction for Intelligent Systems)
Abstract
:Three-dimensional (3D) technology has attracted users’ attention because it creates objects that can interact with a given product in a system. Nowadays, Thailand’s government encourages sustainability projects through advertising, trade shows and information systems for small rural entrepreneurship. However, the government’s systems do not include virtual products with a 3D display. The objective of this study was four-fold: (1) develop a prototype of 3D handicraft product application for smartphones; (2) create an online questionnaire to collect user usage assessment data in terms of five sentiment levels—strongly negative, negative, neutral, positive and strongly positive—in response to the usage of the proposed 3D application; (3) evaluate users’ sentiment level in 3D handicraft product application usage; and (4) investigate attracting users’ attention to handicraft products after using the proposed 3D handicraft product application. The results indicate that 78.87% of participants’ sentiment was positive and strongly positive under accept using 3D handicraft product application, and evaluations in terms of assessing attention paid by participants to the handicraft products revealed that positive and strongly positive sentiment was described by 79.61% of participants. The participants’ evaluation results in this study prove that our proposed 3D handicraft product application affected users by attracting their attention towards handicraft products.
1. Introduction
Various advanced and interactive technologies have displayed their efficiency in the processing, promotion and demonstration of products by displaying three-dimensional (3D) products [1,2] of high quality on a screen. Users can access these via their own digital devices such as smartphones [3,4]. The capability and advantages of mobile technology have resulted in the incremental influence and utilization of smartphones, which have also led to the BYOD (Bring Your Own Device) policy. Using a smartphone for e-commerce has led to a gradual increase in online shopping [5]. Increased interest in online shopping [6] has resulted in various studies on 3D technology [1,2,7,8]. This is because 3D technology can show how objects interact with products. Consequently, this affects the shopping motivation of consumers, attracting their interest in the products.
Regarding the context of Thailand, in 2019, the Thai economy was projected to grow moderately by 2.7% in 2020, and it continues to experience growth due to foreign demand [9]. The agricultural sector grew by 1.5% in Quarter 3 of 2019 in accordance with the government’s policy [9]. In addition, Thailand’s digital economy has gained importance since establishing a new ministry called the Ministry for Digital Economic and Society in 2016 [10]. This was because the utilization of the Internet, accessed by smartphones, became more widespread in Thai society; by 2020, Thai people had superior Internet usage compared to the global average with 59% [11] of Thailand’s population (65.9 million) having access [10]. This has influenced the generation of new business forms; the Thai government has announced significant projects related to the digital economy’s growth, such as Digital Thailand, Thailand 4.0, Digital Park and University 4.0. The digital strategy of Thailand is described as follows [10]:
- Analyze the main schemes that provide opportunities for the development of a digital economy.
- Create flexibility to help decrease the strictness of government organizations.
- Quick wins and high performance are significant.
- Utilize universal innovation and professionalism for establishing a better digital economy.
Thai handicraft products can provide people in rural areas with supplementary income through products from their local resources. Various previous studies have recognized the importance of handicraft products [7,12,13,14,15]. Areas of community development expertise have been developed, with the One Tambon (subdistrict) One Product (OTOP) project supporting the sustainability of products from rural areas [16,17,18]. This scheme is modeled on One Village One Product (OVOP) in Japan [19]. OTOP is a small rural entrepreneurship that produces several kinds of products from raw natural resources, using inherited abilities that rely on the local area’s ancient wisdom. Products such as textiles, wooden products, baskets and food include Thai handicraft products sold to tourists [16,17,18].
Thailand’s government encouraged OTOP marketing through advertising, established trade show exhibitions and generated an information system for trading between manufacturers and consumers [16,17,18]. Our study refers to the government-provided information system, which does not support 3D product displays. Such displays could better attract consumers’ attention to products than the current system can and could be one channel through which to support local handicraft producers and small rural entrepreneurship. This work investigates customers’ sentiment level evaluation regarding the proposed 3D handicraft product application prototype we developed, and for which the study seeks to determine the users’ feelings when using the application by collecting sentiment data utilizing an online questionnaire.
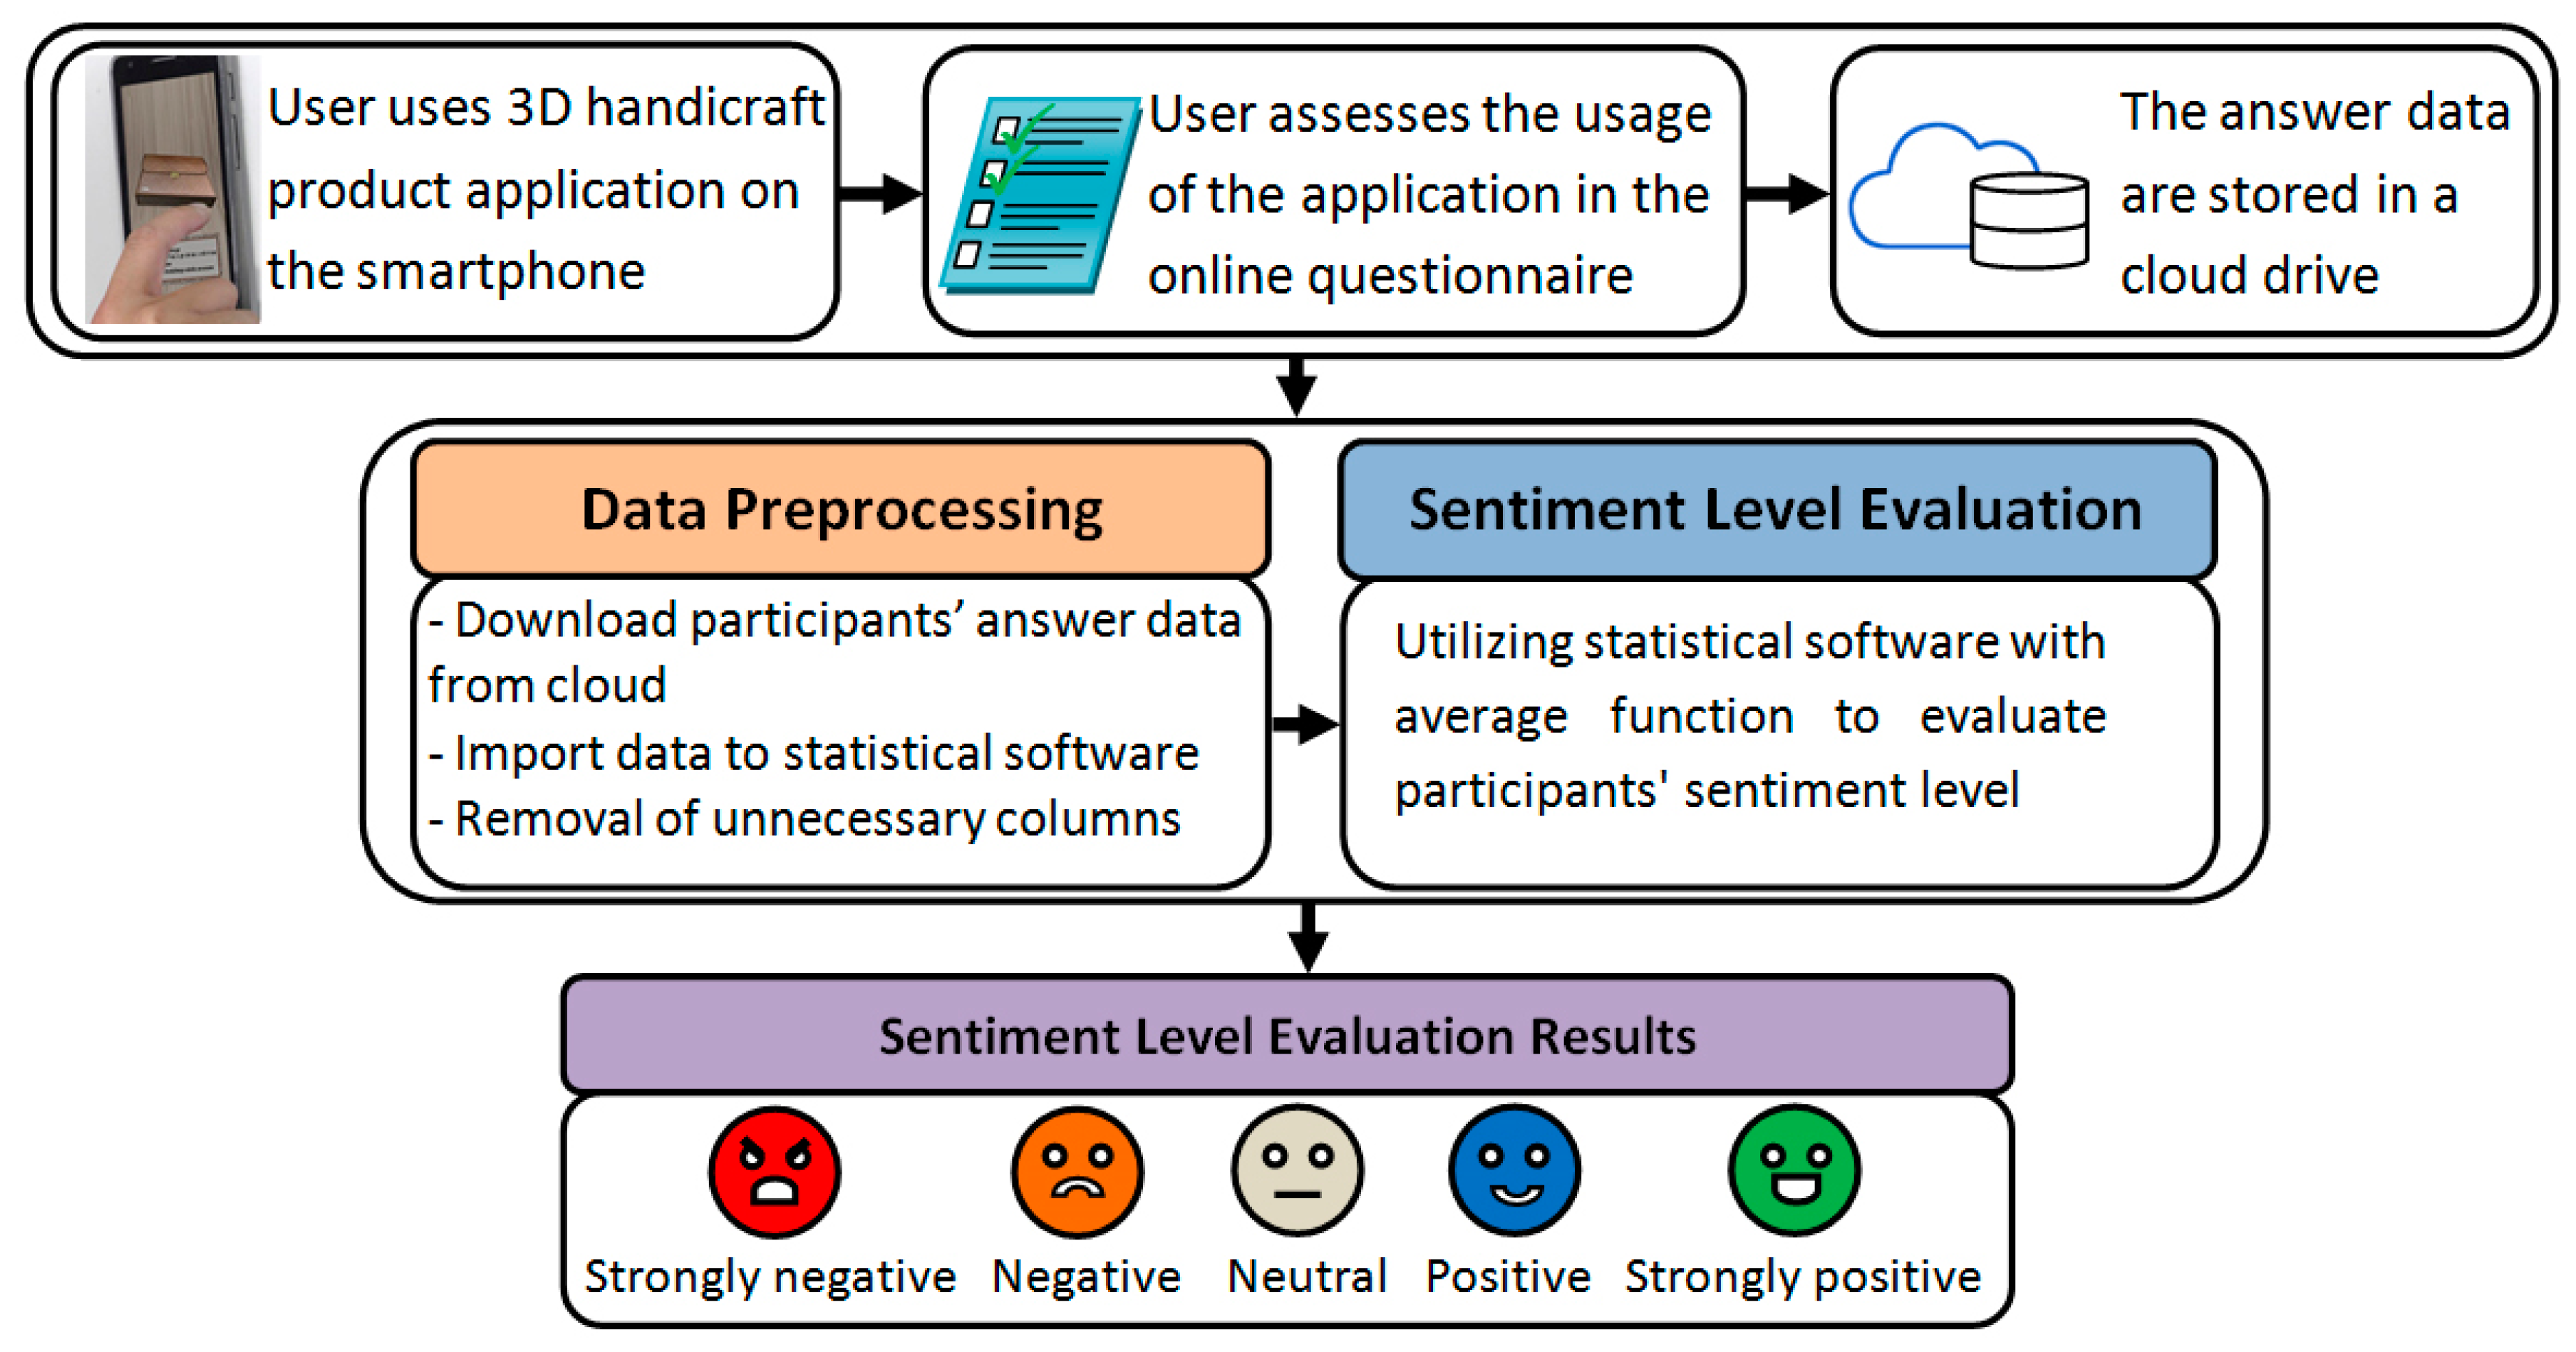
In this study, inspired by the idea of sentiment level evaluation, we used data that came from participants’ questionnaire answers. The concept diagram of this work is shown in Figure 1. In the first step, a participant, using our 3D handicraft product application on their smartphone, completed an online questionnaire, with the answers collected in cloud storage.
In the second step, data preprocessing downloaded participants’ answer data from cloud drive, imported to data to statistical software and removed useless attributes. These are appropriate steps for using in the final process of sentiment level evaluation by applying statistical software with average function for a 3D handicraft product application usage and five levels: strongly negative, negative, neutral, positive and strongly positive.
The purpose of this study was to examine how users feel when using a 3D handicraft product application on a smartphone, using questionnaire data of participants’ answer, which offers the advantage of representing the user sentiment level after application usage. Consequently, this study was divided into four objectives: (1) develop a 3D handicraft product application for smartphones; (2) create an online questionnaire to collect user usage assessment data; (3) evaluate users’ sentiment level in 3D handicraft product application usage; and (4) investigate attracting users’ attention to handicraft products after using the proposed 3D handicraft product application.
This paper is structured as follows. Section 1 provides the rationale and objective of the research. Section 2 includes related works and strengths for comparing with our work. Section 3 includes the 3D handicraft product application, the literature review for generating the online questionnaire and the data collection method. Section 4 gives the experimental results of sentiment level evaluation and attracting users’ attention. Section 5 provides a discussion of the research findings and suggests directions for future study. Finally, Section 6 presents our conclusions.
2. Related Works
There are several related works regarding sentiment analysis applied for tracking human behavior. For example, the authors of [20] utilized data from online social media posts for training with the proposed machine learning techniques to generate a dynamic dictionary system for separating people’s opinions, reaching good accuracy results of 90.21%. The authors of [21] produced machine learning models to identify people’s activity in social networking by the activity providing the emotional sentiment by the proposed models, which obtained the positive rate of 87.50% and a negative rate of 95.90%. The authors of [22] generated machine learning for sentiment prediction based on people’s ranking in online social media by combining behavior with social data with word polarity classes, and the proposed method obtained an accuracy of 85%.
Because sentiment analysis using natural language processing can be adopted in the area of linguistics, the authors of [23] created the experiment to compare machine learning approaches for the human language in the text data for sentiment classification by defining the verb, adjective and adverbs for the classes, gaining the accuracy of 88.74%. The authors of [24] used a sentiment dataset to train a machine learning method for extracting the meaning from each vocabulary item to the sentences in the micro-blog by the proposed machine learning method, achieving the precision of 92.87%. Furthermore, the authors of [25] also proposed machine learning for sentiment analysis by using text and message data in English and Chinese from micro-blogs to match in sentiment classes and then provided an indication represented by an emoticon—the performance obtained the accuracy of 88.30%. The authors of [26] considered that the conversation in social networking has several topics for which the researchers established multi-sentiment classification using the proposed machine learning method trained with a domain sentiment media dataset. The proposed model gained an overall sentiment classification accuracy of 71.79%.
Sentiment analysis is also applied in the field of education. For example, the authors of [27] investigated student satisfaction with massive open online courses (MOOCs) by employing supervised machine learning models to identify the course features, where the capability evaluation indicated an F-score of 88.32% for student satisfaction for learning via video instruction. In comparison, the authors of [28] focused on using sentiment classification to enhance higher education standards by adopting machine learning as the classifier to isolate students’ comments, achieving an accuracy of 83% for classification performance.
Several works in the literature cover e-commerce and online shopping by conducting the sentiment analysis concentrating on customer comments on products and services. The authors of [29] developed a voting classification technique with machine learning by using data from customer reviews for customers’ decisions. The results show that the proposed approach increases classification ability by producing an accuracy of 86.13%. The authors of [30] analyzed posts and discussions regarding multi-sentiment class across several topics in employing products and services with machine learning algorithms. The proposed method obtained an accuracy of 60.2% for seven categories and two classes produced an accuracy of 81.3%. The authors of [31] implemented machine learning techniques with customer experiences in reviews of products and service quality in e-commerce, where the information can be represented in emotions and opinions by the results in terms of precision at 80.10%. The authors of [32] generated a machine learning technique for multi-domains for e-commerce goods reviews and sentiment classification by gaining the average classification accuracy for cross-domain sentiment classification of 77.52% and average accuracy for domain-specific classification of 85.58%. The authors of [33] applied machine learning algorithms for identifying sentiment by big consumer review data for the experience in using e-commerce and real-time shopping. The ability of the system is effective, achieving accuracy close to 98%.
Machine learning for sentiment analysis has been applied in the case of hotel and tourism services. For example, the authors of [34] utilized the contextual data in the text comments of hotel service training with ensemble learning by achieving an accuracy of 96.03%. The authors of [35] developed machine learning methods for sentiment analysis of online tourist comments to provide good comments and suggestions for other interested tourists, with the classification results obtaining an accuracy of 81.87%.
The entertainment area can also utilize sentiment analysis. For example, the authors of [36] conducted the extraction of machine learning models, with the results showing a suitable machine learning algorithm that obtained a classification accuracy of 82.50%. The authors of [37] studied the machine learning technique for sentiment analysis by creating a sentiment dictionary for users to message online while watching shows in a real-time video on the screen, for which the proposed technique obtained a classification accuracy of 88.20% and extracted emotional data from the video by using words consisting of several emotions.
In cases of disaster and security, the authors of [38] applied an approach driven by big data for disaster response via sentiment classification, with the data of the disaster gathered from social networks and classified information following the affected people’s requirements, categorized with the machine learning algorithm for analyzing the people’s sentiment by extracting features of parts of speech and lexicon, indicating good results and achieving high classification precision up to 95%. The authors of [39] investigated sentiment analysis in terms of authentication, availability, integrity and confidentiality to estimate that reviews are trustworthy, by using the machine learning categorization. The outcome showed that 23% of applications have reliability over 0.5. In comparison, 77% of other remaining applications had reliability lower than 0.5. The appropriate application related to topical reliability contained poor security.
The above related works apply machine learning techniques for sentiment analysis in several areas, which differ from this study. We provide the summarized strengths and key differences between these related works and our work in Table 1.
3. Materials and Methods
To prepare for this study, we created the proposed 3D handicraft product application and user interaction. We also reviewed the literature to generate a questionnaire, the data collection methods, the evaluation of sentiment level of proposed application usage and sentiment in terms of attracting participants’ attention to handicraft product.
3.1. 3D Handicraft Product Application
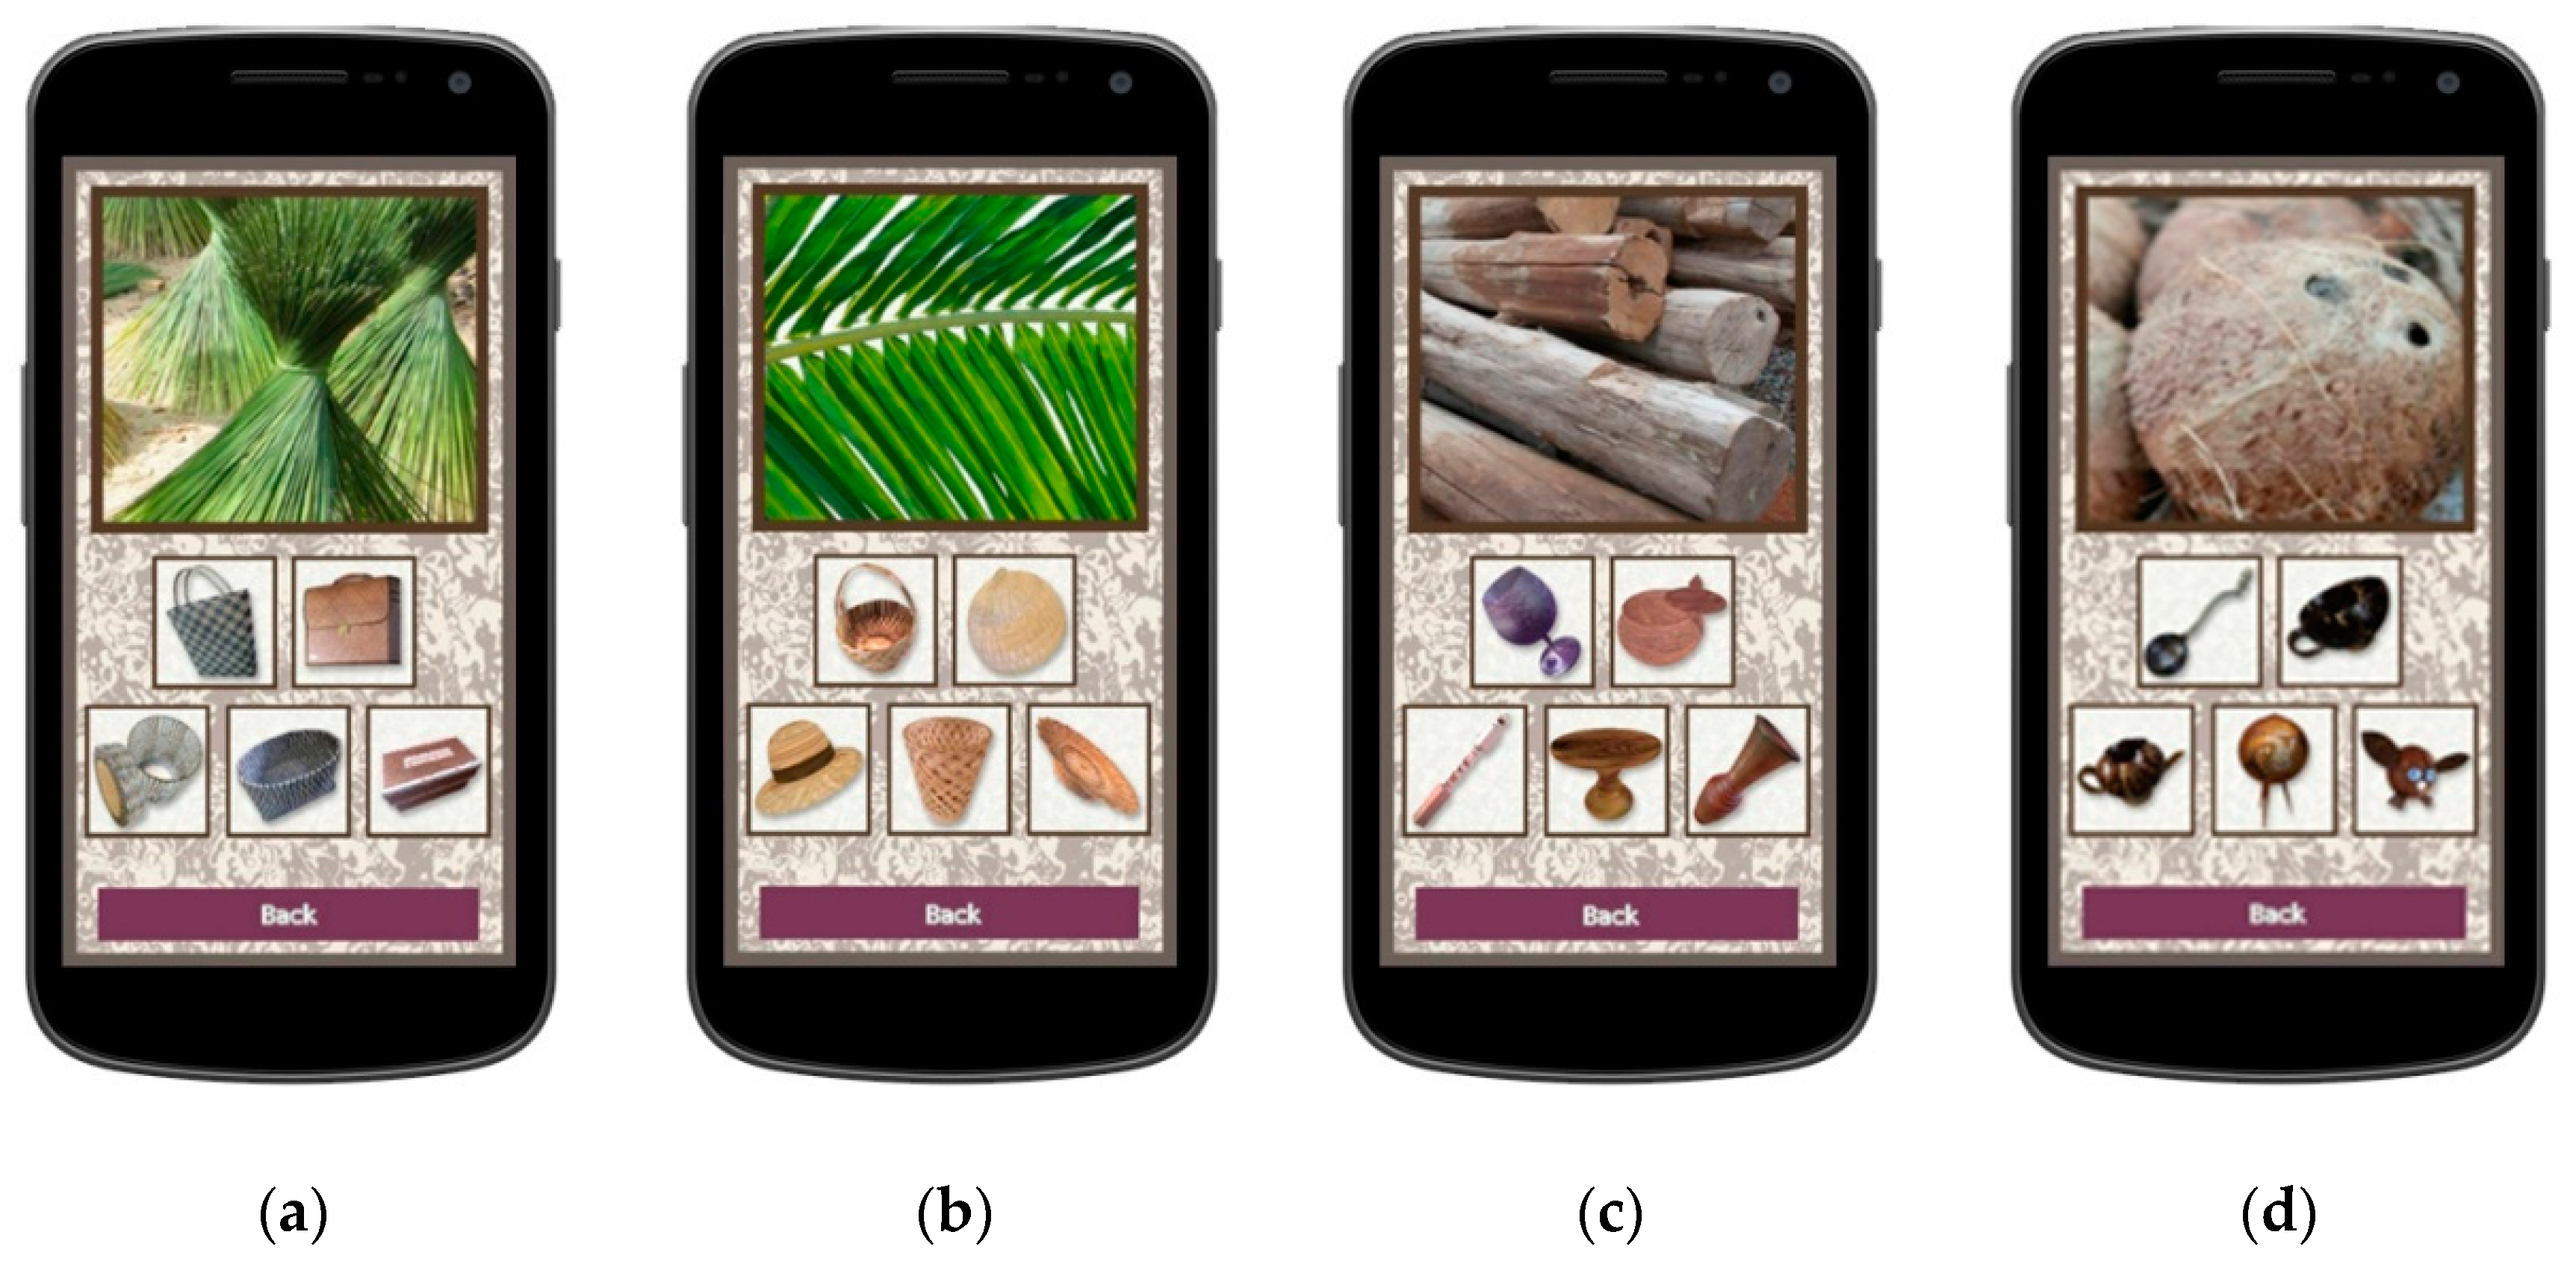
Each 3D handicraft model was created in open-source software named Blender (version 2.80, Blender Foundation, Amsterdam, The Netherlands) [40] and used to develop an application for a smartphone. The 3D handicraft product application was developed using game engine software Unity (version 2019.4.9, Unity Technologies, San Francisco, CA, USA) [41] and an installed Android SDK to generate an application that would be compatible with an Android system in a smartphone. The application is in both Thai and English; users can change between languages and use the buttons to select and view the 3D handicraft products (Figure 2).
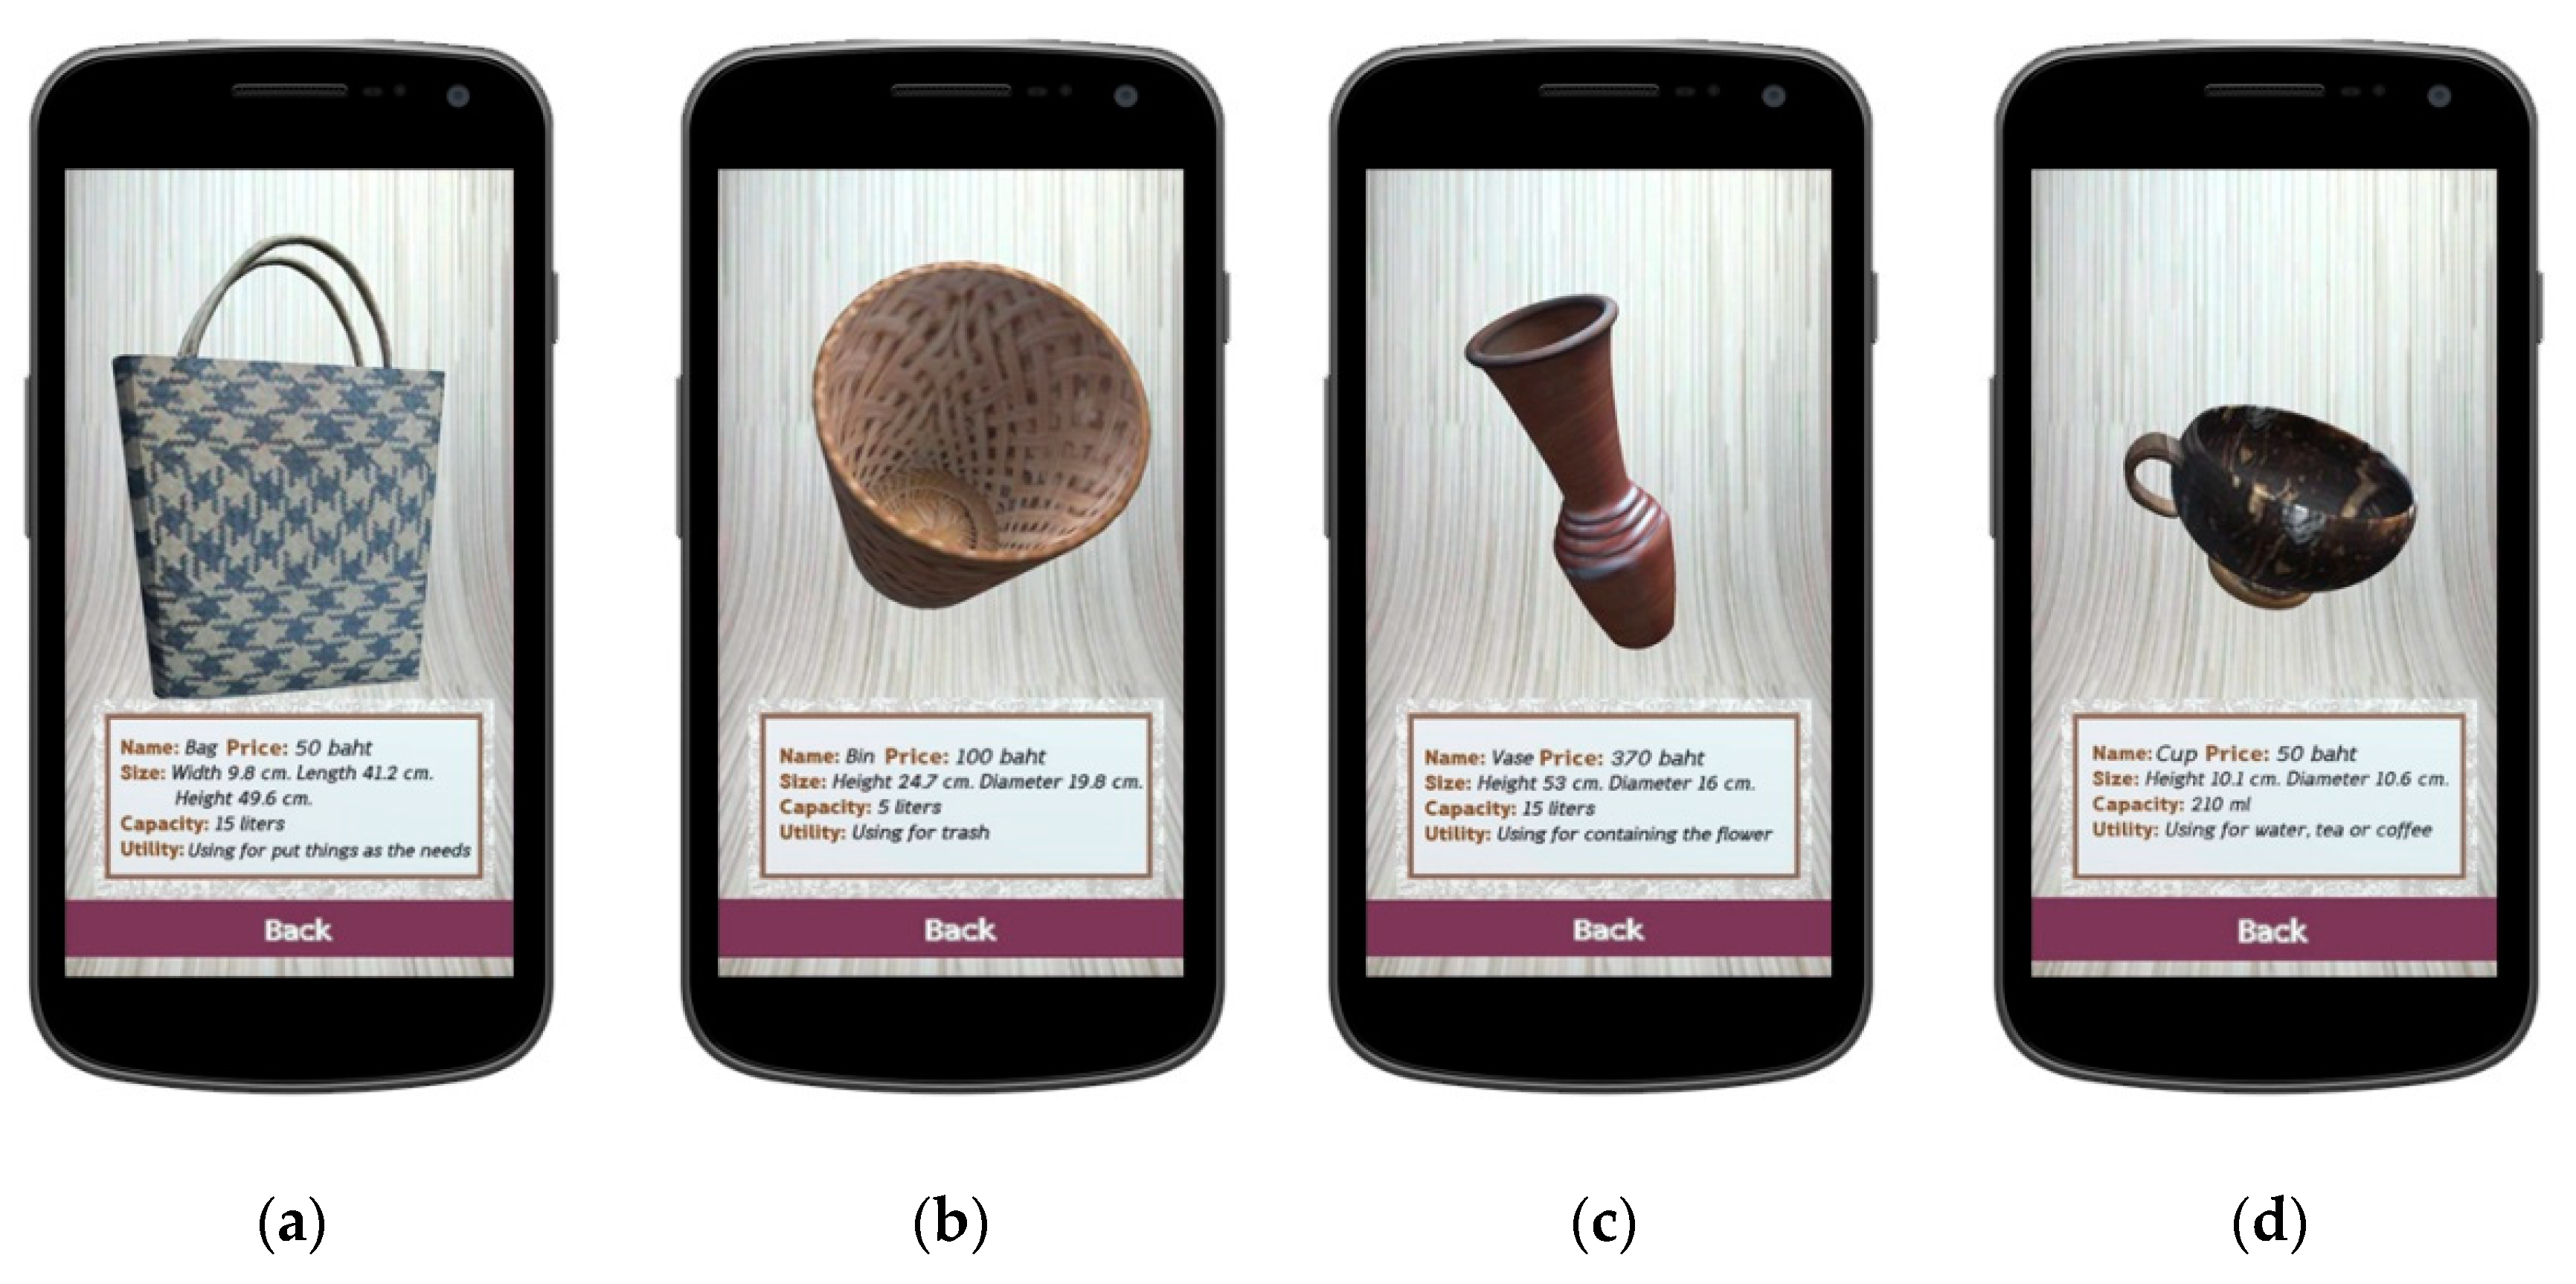
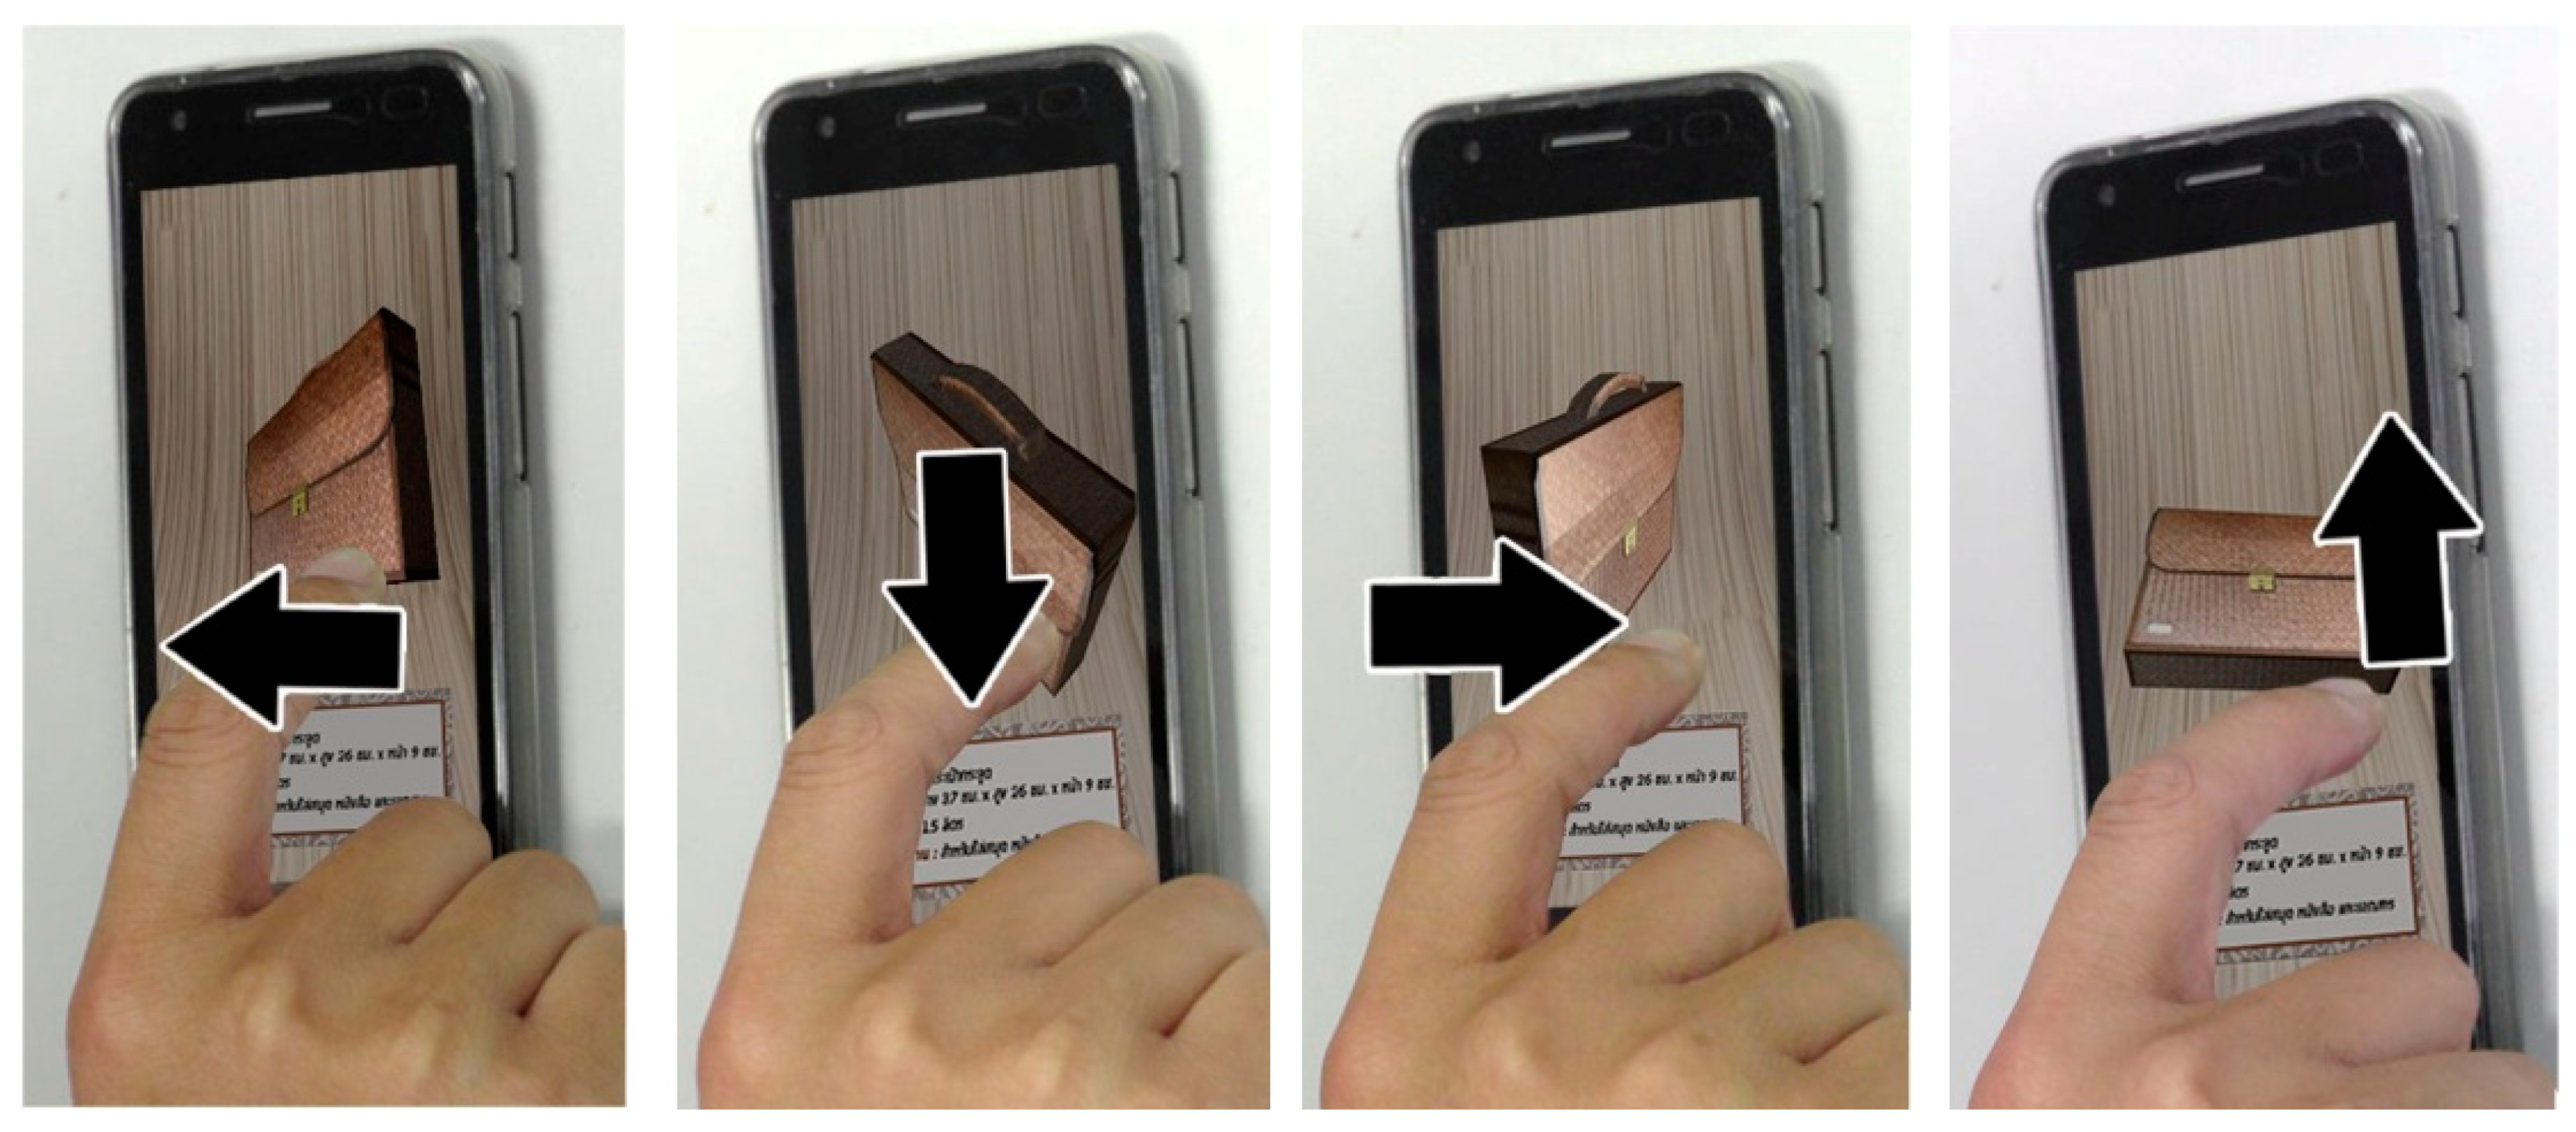
The Thai handicraft products in the application focused on products from rural resources in four categories: sedge, mangrove palm leaves, timber, and coconut shell (Figure 3). A participant can use the application on a smartphone to get a 360-degree look at the product (Figure 4); in addition, the 3D product system displayed text with details on each 3D product, including the product’s name, size, price, and usability.
3.2. Questionnaire Creation
The literature review investigated several related works in the field of technology assessment, as presented in Table 2, including the perceived ease of use, perceived usefulness, user attitudes, behavioral intention, user interaction, 3D product display and ability to attract attention.
3.3. Data Collection and Demographic Information
In total, 2500 participants, who were alumni and students from universities in several locations (thus explaining why the study had many participants), were sent online questionnaires constructed via Google Forms and distributed to their email addresses. Participants were recruited from six regions of Thailand (north, northeast, east, west, central and south). The email included a hyperlink for downloading the 3D handicraft product application for use with the participant’s smartphone. Furthermore, participants had to provide primary data and smartphone use habits as smartphone application interaction information. Both the questionnaire and 3D handicraft product application were in the Thai language; the participants’ data, including full name and identifying details, were not shown in the collected data. The preliminary participants’ information appears, with the total and demographics as percentages, in Table 3; the total and percentage of participants’ use smartphone answer are shown in Table 4. The online questionnaire answers were developed on a five-point scale (strongly negative = 1, negative = 2, neutral = 3, positive = 4 and strongly positive = 5) to evaluate sentiment in questions assessing perceived ease of use (PEOU), perceived usefulness (PU), attitude toward (AT), behavioral intention (BT), 3D user interaction (3DUI), 3D product display (3DPD) and attracting attention (AA). After sending the online questionnaire to the 2500 participants’ email addresses, 1775 questionnaires were received by the scheduled deadline, for a response rate of 71% (questionnaire sending began 1 June 2019; we waited for responses until 31 December 2019).
Demographic information indicates that, of 1775 total participants, 986 were female, accounting for 55.55% (versus 789 male participants for a percentage of 44.45%), and most were in the age range of 25–30 years old (546, or 30.76%; the smallest group was of participants older than 50, who numbered 151, or 8.51%). The most participants (330) were from the northeast (18.86%); the fewest were from the west (257; 14.54%). In terms of occupation, the most participants (367) were self-employed (20.77%), with the smallest group being the unemployed (153; 8.66%) and the average income per month for most participants (291) was 10,001–15,000 baht (24.84%). The smallest group, with 151 participants (8.55%), was for those who earn more than 25,000 baht.
The most frequent answer to the main purpose of using a smartphone application in a day was using social media (403; 33.70%); the least popular answer was using smartphones to play games (371; 18.03%). A question regarding using 3D applications on a smartphone revealed that 1189 participants, or 66.99%, had used them, while 586 participants (33.01%) had never used them. A question about using 3D products on a smartphone revealed that 705 (39.72%) had ever used this function, while 1070, accounting for 60.28%, had never used it.
3.4. Data Preparation and Sentiment Level Evaluation Method
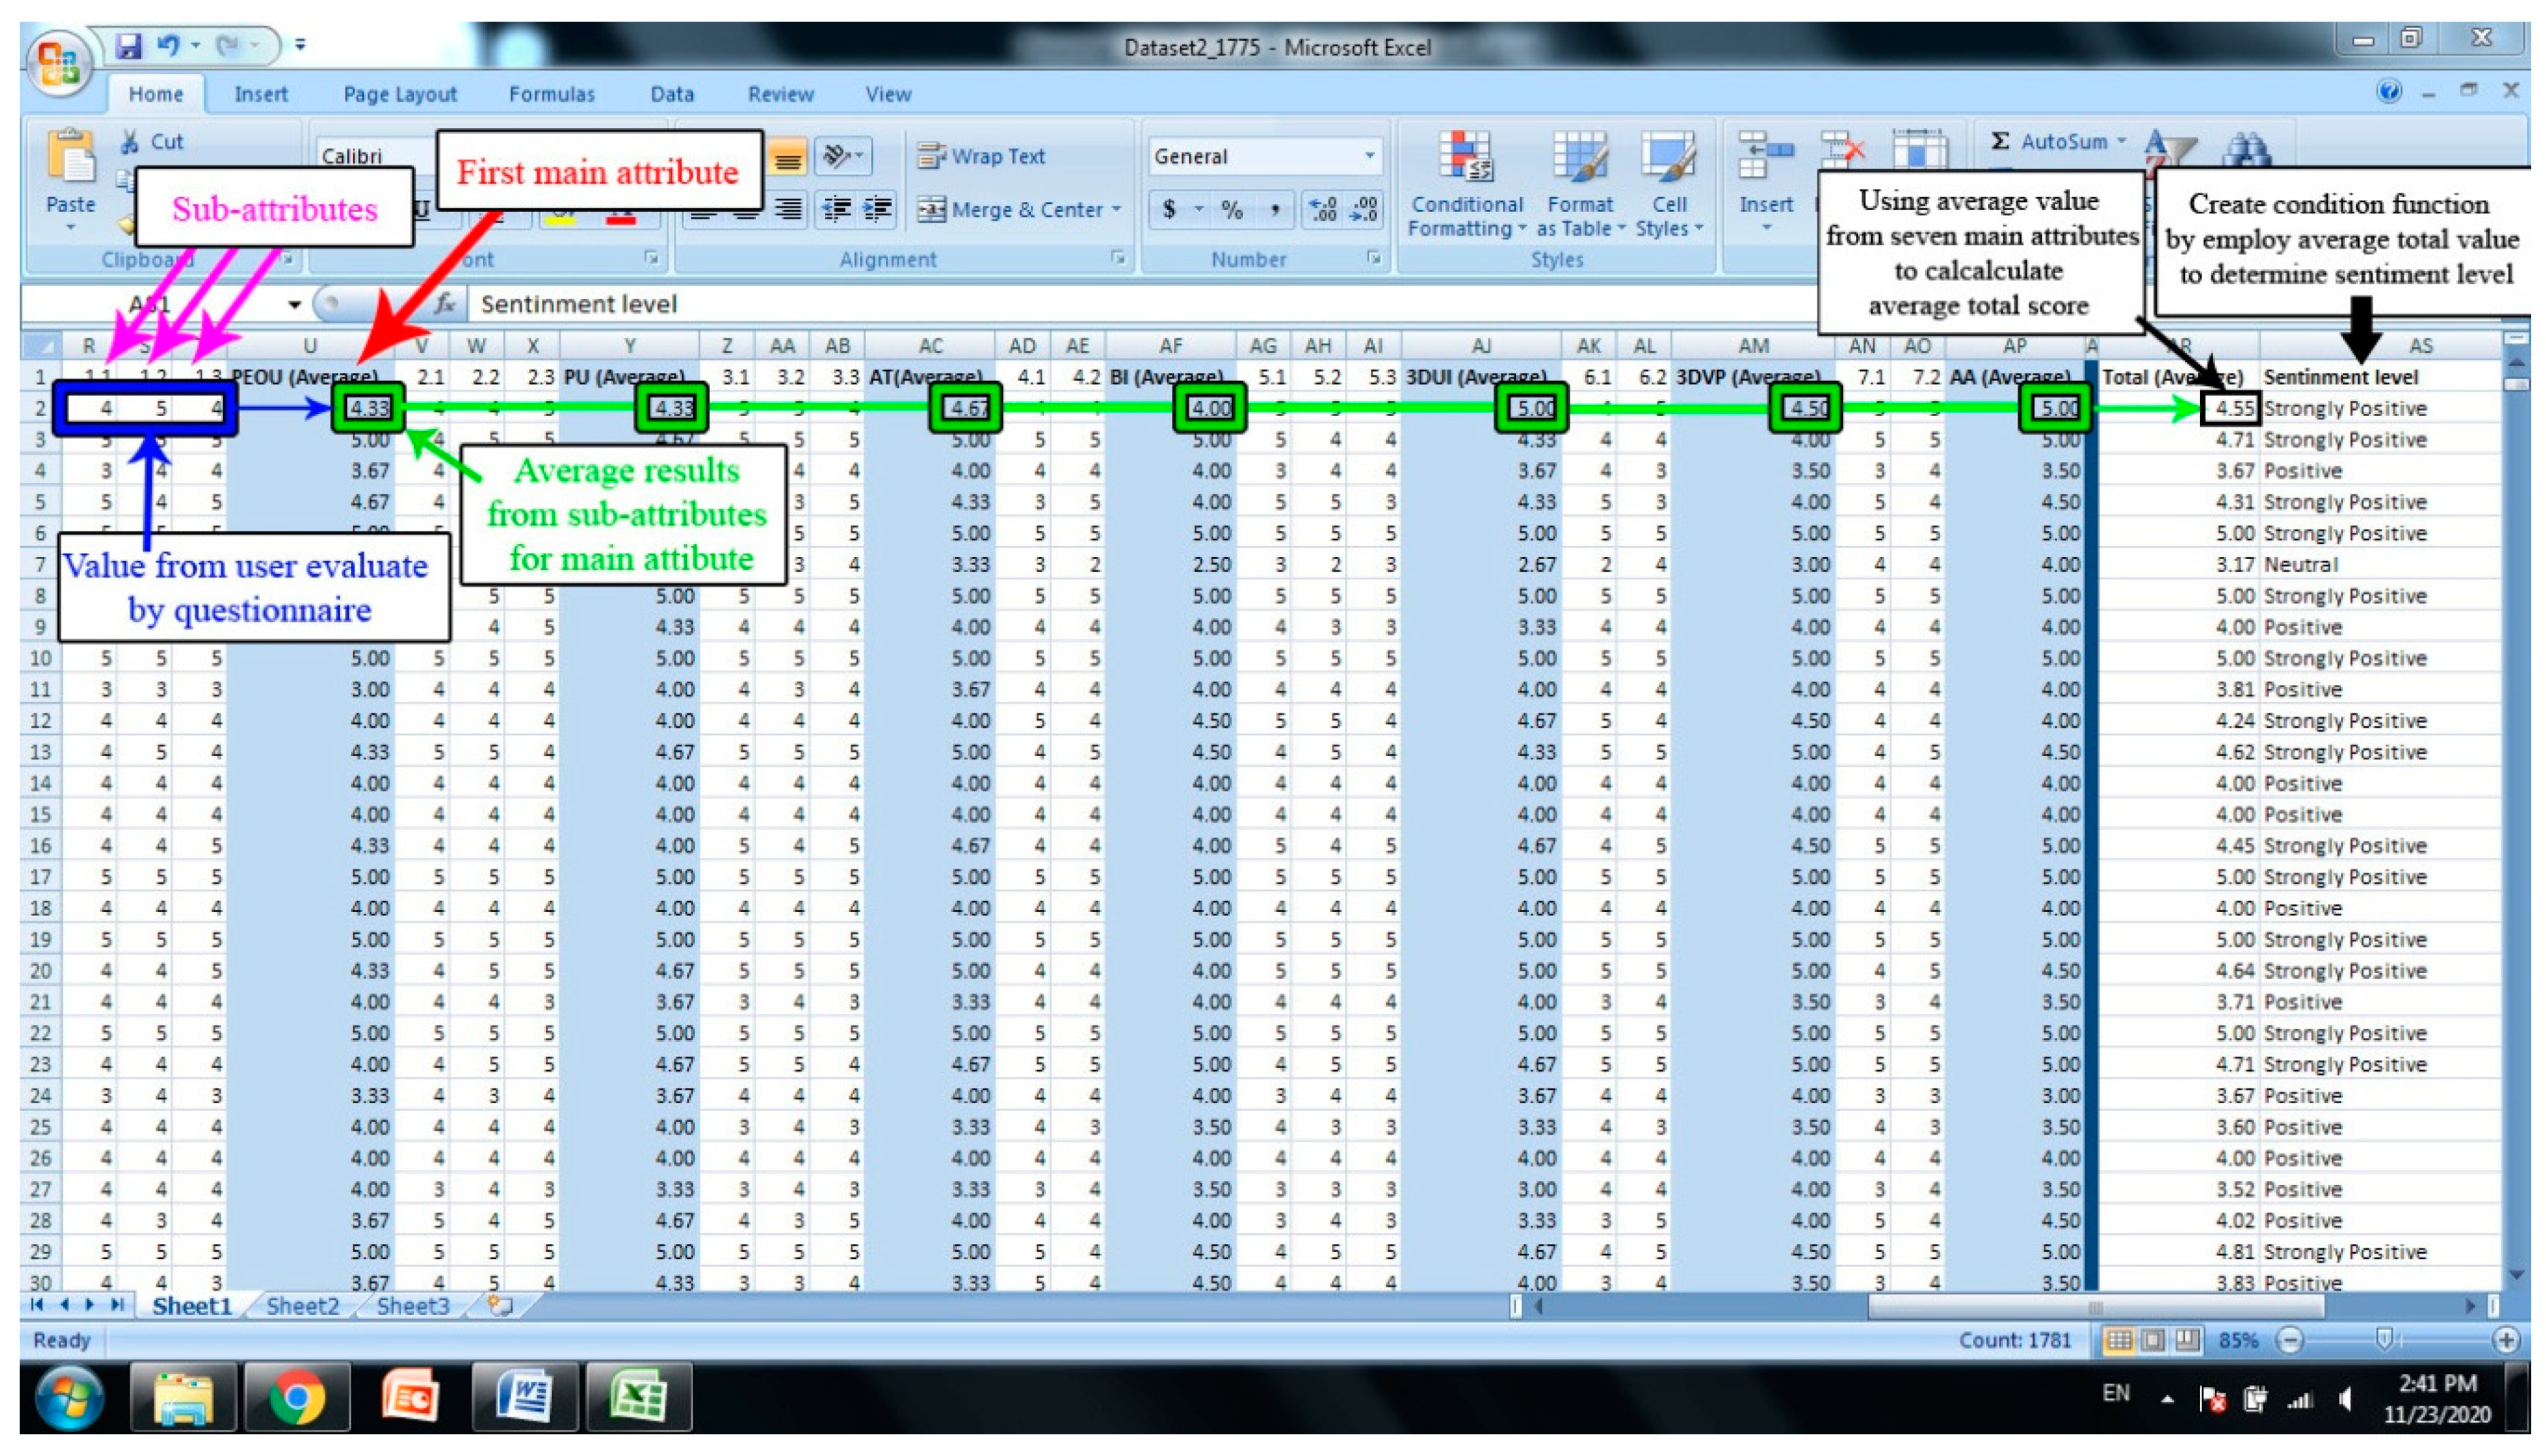
The questionnaire data were divided into two parts: the part used for users’ sentiment level evaluation is the second part of the questionnaire refers to application usage. The first part is the participants’ demography—we used only the participants’ preliminary information, which does not contain any identifiable information. Thus, we decided not to apply the first part, which is unnecessary for sentiment level evaluation. After obtaining data from the questionnaire, we applied statistical software to prepare our data and evaluate participants’ sentiment level by calculating the average in every seven main attributes (PEOU, PU, AT, BI, 3DUI, 3DVP and AA) from its sub-attributes. After that, we computed the average value of all seven main attributes, abd then created the new attribute for the average total, which employs the average value from all seven main attributes to the total average outcome by using an average function provided by statistical software (see Figure 5 for a more in-depth explanation). Once the average total value was obtained, we used this attribute to determine sentiment level by condition (see Table 5).
4. Results
This study’s contribution is that our proposed 3D handicraft product application is appropriate for usage and can attract users’ or customers’ attention to handicraft products after using the proposed application. The results for the assessment of attention paid by participants and the utilization of the statistical software for sentiment level evaluation after using the proposed 3D product application are described in this section.
4.1. Results of Participants’ Sentiment Level Evaluation of Proposed 3D Product Application Usage
As mentioned, data preparation employed statistical software to evaluated participants’ sentiment level and users’ attention by calculating the average in seven main attributes from its sub-attributes and then created the new attribute for the average total to determine sentiment level by the condition. For the sentiment level evaluation results of a 3D handicraft product application usage, we investigated the general statistics regarding the number and percentage by an average function of each sentiment level of the 1775 participants indicated in Table 6. Participants whose sentiment was strongly negative, negative or neutral were combined under the heading of “reject” using 3D handicraft products, which totaled 375 participants accounting for 21.13%, while participants who showed positive and strongly positive sentiment totaled 1400 (78.87%). This demonstrates that participants accept the 3D handicraft product application and generally have positive feelings.
4.2. Results for the Sentiment of Attracting Attention to Handicraft Products
By collecting data from participants’ usage evaluations, we can analyze the results for the attention paid by participants by applying only the attracting attention attribute or AA to calculate the percentage represented in Table 7. The participants’ evaluations in terms of sentiment after using the proposed application, assessing attention paid by participants to the handicraft products, revealed that a positive sentiment was described by 688 participants, accounting for 38.76%, while a strongly positive sentiment was described by 725 participants, or 40.85%. Thus, the total positive score of 1413 participants accounted for 79.61%. In comparison with the total of the negative and neutral scores of 362 participants, accounting for 20.39%, participants expressing positive sentiments in relation to their attention being drawn towards handicraft products were found in much greater numbers, and the participants’ evaluation results of this survey prove that our proposed 3D handicraft product application affected users by attracting their attention towards handicraft products.
5. Discussion
The return of 1775 participants’ questionnaires answer from the sending of 2500 emails in Thailand represents a response rate of 71%. The interesting data from participants’ demography represent that females returned more the questionnaires than male, and most were in the age range of 25–30 years old. In terms of occupation, the largest share of participants were self-employed, the average income per month for most participants being 10,001–15,000 baht.
According to the evaluation results of 1775 participants’ sentiment level in using the proposed 3D handicraft product application, we found that participants’ sentiment level was positive and strongly positive sentiment with a total score of 1400 (78.87%). This demonstrates that participants accept the 3D handicraft product application and generally have positive feelings. For the results of attracting users’ attention to handicraft products after using the proposed 3D handicraft product application, the participants were evaluated in terms of sentiment after using the proposed application. The attention paid by participants to the handicraft products had a total positive score of 1413 participants, accounting for 79.61%. The participants expressing positive sentiments in relation to the attention paid to handicraft products were found in much greater numbers than negative sentiments. The participants’ evaluation results in this survey prove that our proposed 3D handicraft product application affected users by attracting their attention towards handicraft products.
Further studies should consider collecting more types of handicraft products to add to the 3D product applications. In the case of sentiment level categories, this study specifically defined only five scales; future research could have scales of 1–7 or 1–3, and we could compare the sentiment level outcome. The proposed questionnaire of this study only contained the answer as a number for an estimate of the sentiment level, while the next study could use the interview method to obtain the users’ comments and suggestions and use machine learning for text classification. This study only sampled participants living in different parts of Thailand. In a future study, we could select the sample to include expatriates or international tourists, who may be more likely to pay attention to Thai handicraft products.
6. Conclusions
This research developed a 3D handicraft product application for smartphones. 3D technology can promote the sustainability of small rural entrepreneurship by advertising a product and attracting consumers’ attention. User reactions to the proposed 3D application must be investigated to improve the application and provide greater usage capability. The purpose of this study was to examine how users feel about and how attention can be drawn towards handicraft products by using a 3D handicraft product application on a smartphone, developed a 3D handicraft product application for smartphones, using an online questionnaire to collect user usage assessment data.
The proposed questionnaire of this work was divided into two parts. The demographic information part illustrated that, of 1775 total participants, the most frequent answer to the main purpose of a smartphone application usage in a day was using social media. A question regarding using 3D applications on a smartphone revealed that 66.99% of participants had used them, while 33.01% of participants had never used them. A question about using 3D products on a smartphone revealed that 39.72% had ever used this function, while 60.28% had never used it.
In the second part of questionnaire, the answers were measured on a five-point scale (strongly negative, negative, neutral, positive and strongly positive). The attributes assessed included perceived ease of use, perceived usefulness, attitude toward, behavioral intention, user interaction, 3D product display and attracting attention. Participants whose sentiment was under reject using 3D handicraft products totaled 21.13%, while participants who showed positive and strongly positive sentiment totaled 1400, accounting for 78.87%. This demonstrates that participants accept the 3D handicraft product application and generally have positive feelings. The participants were evaluated in terms of sentiment after using the proposed application, assessing the attention paid by participants to the handicraft products. It revealed that a positive sentiment was described by 38.76%, while a strongly positive sentiment was described by 40.85%. Thus, the total positive score of 1413 participants accounted for 79.61%. The attention paid by participants to handicraft products after using the proposed 3D handicraft product application and participants expressing positive sentiments related to attracting attention were found in much greater numbers than negative sentiments, while the participants’ evaluation results in this study prove that our proposed 3D handicraft product application affected users by attracting their attention towards handicraft products.
Author Contributions
Conceptualization, N.J. and C.-F.T.; Data curation, P.W.; Formal analysis, N.J.; Funding acquisition, C.-F.T.; Investigation, N.J. and C.-F.T.; Methodology, N.J. and C.-F.T.; Project administration, C.-F.T.; Resources, N.J.; Software, N.J.; Supervision, C.-F.T.; Validation, P.W.; Visualization, N.J.; Writing—original draft, N.J.; and Writing—review and editing, C.-F.T. and N.J. All authors have read and agreed to the published version of the manuscript.
Funding
This research was funded by the Ministry of Science and Technology, Republic of China, Taiwan, grant numbers MOST-108-2637-E-020-003 and MOST-108-2321-B-020-003.
Data Availability Statement
Publicly available datasets were analyzed in this study. This data can be found here: https://zenodo.org/record/4442207.
Acknowledgments
The authors would like to express their sincere gratitude to the anonymous reviewers for their useful comments and suggestions for improving the quality of this paper, as well as the Department of Tropical Agriculture and International Cooperation, Department of Management Information Systems, National Pingtung University of Science and Technology, Taiwan, Ministry of Science and Technology, Republic of China, Taiwan and Suratthani Rajabhat University, Suratthani, Thailand for supporting this research.
Conflicts of Interest
The authors declare no conflict of interest.
References
- Hu, K.; Hua, H.; Zhang, Y. Research on 3D Interactive Model Selection and Customization of Ceramic Products Based on Big Data Cloud Service Platform. In Proceedings of the 5th IEEE International Conference on Big Data Security on Cloud (BigDataSecurity), IEEE International Conference on High Performance and Smart Computing, (HPSC) and IEEE International Conference on Intelligent Data and Security (IDS), Washington, DC, USA, 27–29 May 2019; pp. 144–148. [Google Scholar]
- Altarteer, S.; Charissis, V. Technology Acceptance Model for 3D Virtual Reality System in Luxury Brands Online Stores. IEEE Access 2019, 7, 64053–64062. [Google Scholar] [CrossRef]
- Pantano, E. Engaging consumer through the storefront: Evidences from integrating interactive technologies. J. Retail. Consum. Serv. 2016, 28, 149–154. [Google Scholar] [CrossRef]
- Yim, M.Y.C.; Chu, S.C.; Sauer, P.L. Is Augmented Reality Technology an Effective Tool for E-commerce? An Interactivity and Vividness Perspective. J. Interact. Mark. 2017, 39, 89–103. [Google Scholar] [CrossRef]
- Burtăverde, V.; Vlăsceanu, S.; Avram, E. Exploring the relationship between personality structure and smartphone usage. Curr. Psychol. 2019, 1–13. [Google Scholar] [CrossRef]
- Sebald, A.K.; Jacob, F. Help welcome or not: Understanding consumer shopping motivation in curated fashion retailing. J. Retail. Consum. Serv. 2018, 40, 188–203. [Google Scholar] [CrossRef]
- Gang, Z.; Jun, L.; Shan, L.; Zhuoran, L.; Tao, H.; Hui, Z. Research on Tujia nationality’s brocade three-dimensional character modeling and animation integration. In Proceedings of the 6th International Conference on Industrial Technology and Management (ICITM), Cambridge, UK, 7–10 March 2017; pp. 205–209. [Google Scholar]
- Saal, C.; Lipp, C.; Lohse, O.; Krause, S. 3D Model-Based Product Definition and Production—A Mind Change with Technical Hurdles. In Proceedings of the 3rd International Symposium on Small-Scale Intelligent Manufacturing Systems (SIMS), Gjøvik, Norway, 10–12 June 2020; pp. 1–4. [Google Scholar]
- World Bank. Thailand Economic Monitor 2020 Productivity for Prosperity. 2020. Available online: http://documents1.worldbank.org/curated/en/394501579357102381/pdf/Thailand-Economic-Monitor-Productivity-for-Prosperity.pdf (accessed on 13 November 2020).
- World Bank. Thailand Economic Monitor 2017 Digital Transformation. 2017. Available online: http://pubdocs.worldbank.org/en/823661503543356520/Thailand-Economic-Monitor-August-2017.pdf (accessed on 28 August 2020).
- United Nations Development Programme. about Thailand. 2020. Available online: https://www.th.undp.org/content/thailand/en/home/ (accessed on 8 September 2020).
- Nayak, J.K.; Bhalla, N. Factors motivating visitors for attending handicraft exhibitions: Special reference to Uttarakhand, India. Tour. Manag. Perspect. 2016, 20, 238–245. [Google Scholar] [CrossRef]
- Zhang, Y.; Han, M.; Chen, W. The strategy of digital scenic area planning from the perspective of intangible cultural heritage protection. J. Image. Video Proc. 2018, 2018, 130. [Google Scholar] [CrossRef]
- Masoud, H.; Mortazavi, M.; Farsani, N.T. A study on tourists’ tendency towards intangible cultural heritage as an attraction (case study: Isfahan, Iran). City Cult. Soc. 2019, 17, 54–60. [Google Scholar] [CrossRef]
- Covarrubia, P. Geographical Indications of Traditional Handicrafts: A Cultural Element in a Predominantly Economic Activity. IIC-Int. Rev. Intellect. Prop. Compet. Law 2019, 50, 441–466. [Google Scholar] [CrossRef]
- United Nations Development Programme. Thailand’s Best Practices and Lessons Learned in Development Volume 1. 2012. Available online: https://www.undp.org/content/dam/thailand/docs/TICAUNDPbpVol1.pdf (accessed on 2 September 2020).
- Snodin, N.S.; Higgins, J.; Yoovathaworn, S. How Thai businesses utilize English in their product names. Kasetsart J. Soc. Sci. 2017, 38, 123–128. [Google Scholar] [CrossRef]
- Luangpaiboon, P. Strategic design for dynamic multi-zone truckload shipments: A study of OTOP agricultural products in Thailand. Comput. Electron. Agr. 2017, 135, 11–22. [Google Scholar] [CrossRef]
- Natsuda, K.; Igusa, K.; Wiboonpongse, A.; Thoburn, J. One Village One Product—Rural Development Strategy in Asia: The Case of OTOP in Thailand. Can. J. Dev. Stud. 2012, 33, 369–385. [Google Scholar] [CrossRef]
- Alaoui, I.E.; Gahi, Y.; Messoussi, R.; Chaabi, Y.; Todoskoff, A.; Kobi, A. A novel adaptable approach for sentiment analysis on big social data. J. Big Data 2018, 5, 12. [Google Scholar] [CrossRef]
- Sharma, P.; Sharma, A.K. Experimental investigation of automated system for twitter sentiment analysis to predict the public emotions using machine learning algorithms. Mater. Today Proc. 2020. [Google Scholar] [CrossRef]
- Madbouly, M.M.; Darwish, S.M.; Essameldin, R. Modified fuzzy sentiment analysis approach based on user ranking suitable for online social networks. IET Softw. 2020, 14, 300–307. [Google Scholar] [CrossRef]
- Zhang, X.; Zheng, X. Comparison of Text Sentiment Analysis Based on Machine Learning. In Proceedings of the 15th International Symposium on Parallel and Distributed Computing (ISPDC), Fuzhou, China, 8–10 July 2016; pp. 230–233. [Google Scholar]
- Liang, Y.; Liu, H.; Zhang, S. Micro-blog sentiment classification using Doc2vec + SVM model with data purification. J. Eng. 2020, 7, 407–410. [Google Scholar] [CrossRef]
- Wang, Y. Iteration-based naive Bayes sentiment classification of microblog multimedia posts considering emoticon attributes. Multimed. Tools Appl. 2020, 79, 19151–19166. [Google Scholar] [CrossRef]
- Alzamzami, F.; Hoda, M.; Saddik, A.E. Light Gradient Boosting Machine for General Sentiment Classification on Short Texts: A Comparative Evaluation. IEEE Access 2020, 8, 101840–101858. [Google Scholar] [CrossRef]
- Hew, K.F.; Hu, X.; Qiao, C.; Tang, Y. What predicts student satisfaction with MOOCs: A gradient boosting trees supervised machine learning and sentiment analysis approach. Comput. Educ. 2020, 145, 103724. [Google Scholar] [CrossRef]
- Mostafa, L. Student Sentiment Analysis Using Gamification for Education Context. In Advances in Intelligent Systems and Computing, Proceedings of the International Conference on Advanced Intelligent Systems and Informatics, Cairo, Egypt, 26–28 October 2019; Hassanien, A., Shaalan, K., Tolba, M., Eds.; Springer International Publishing: Cham, Switzerland; New York City, NY, USA, 2020. [Google Scholar]
- Catal, C.; Nangir, M. A sentiment classification model based on multiple classifiers. Appl. Soft Comput. 2017, 50, 135–141. [Google Scholar] [CrossRef]
- Bouazizi, M.; Ohtsuki, T. Multi-class sentiment analysis on twitter: Classification performance and challenges. Big Data Min. Anal. 2019, 2, 181–194. [Google Scholar] [CrossRef]
- Zhang, S.; Zhang, D.; Zhong, H.; Wang, G. A Multiclassification Model of Sentiment for E-Commerce Reviews. IEEE Access 2020, 8, 189513–189526. [Google Scholar] [CrossRef]
- Xu, F.; Pan, Z.; Xia, R. E-commerce product review sentiment classification based on a naïve Bayes continuous learning framework. Inform. Process. Manag. 2020, 57, 102221. [Google Scholar] [CrossRef]
- Yi, S.; Liu, X. Machine learning based customer sentiment analysis for recommending shoppers, shops based on customers’ review. Complex Intell. Syst. 2020, 6, 621–634. [Google Scholar] [CrossRef]
- Tran, T.K.; Phan, T.T. Capturing Contextual Factors in Sentiment Classification: An Ensemble Approach. IEEE Access 2020, 8, 116856–116865. [Google Scholar] [CrossRef]
- Luo, Y.; He, J.; Mou, Y.; Wang, J.; Liu, T. Exploring China’s 5A global geoparks through online tourism reviews: A mining model based on machine learning approach. Tour. Manag. Perspec. 2021, 37, 100769. [Google Scholar]
- Liu, Y.; Bi, J.; Fan, Z. Multi-class sentiment classification: The experimental comparisons of feature selection and machine learning algorithms. Expert Syst. Appl. 2017, 80, 323–339. [Google Scholar] [CrossRef] [Green Version]
- Li, Z.; Li, R.; Jin, G. Sentiment Analysis of Danmaku Videos Based on Naïve Bayes and Sentiment Dictionary. IEEE Access 2020, 8, 75073–75084. [Google Scholar] [CrossRef]
- Ragini, J.R.; Anand, P.M.R.; Bhaskar, V. Big data analytics for disaster response and recovery through sentiment analysis. Int. J. Inf. Manag. 2018, 42, 13–24. [Google Scholar] [CrossRef]
- Tchakounté, F.; Pagor, A.E.Y.; Kamgang, J.C.; Atemkeng, M. CIAA-RepDroid: A Fine-Grained and Probabilistic Reputation Scheme for Android Apps Based on Sentiment Analysis of Reviews. Future Internet 2020, 12, 145. [Google Scholar] [CrossRef]
- Community, B.O. Blender—A 3D Modelling and Rendering Package; Stichting Blender Foundation: Amsterdam, The Netherlands, 2018; Available online: http://www.blender.org (accessed on 12 September 2020).
- Haas, J.K. A History of the Unity Game Engine. 2014. Available online: https://web.wpi.edu/Pubs/E-project/Available/E-project-030614-143124/unrestricted/Haas_IQP_Final.pdf (accessed on 12 September 2020).
- Mostafa, M.M.; El-Masry, A.A. Citizens as consumers: Profiling e-government services’ users in Egypt via data mining techniques. Int. J. Inf. Manag. 2013, 33, 627–641. [Google Scholar] [CrossRef]
- Davis, F.D. Perceived Usefulness, Perceived Ease of Use, and User Acceptance of Information Technology. MIS Q. 1989, 13, 319–340. [Google Scholar] [CrossRef] [Green Version]
- Alalwan, A.A.; Baabdullah, A.M.; Rana, N.P.; Tamilmani, K.; Dwivedi, Y.K. Examining adoption of mobile internet in Saudi Arabia: Extending TAM with perceived enjoyment, innovativeness and trust. Technol. Soc. 2018, 55, 100–110. [Google Scholar] [CrossRef]
- White, B.E.; Hubona, G.S.; Srite, M. Does “Being There” Matter? The Impact of Web-Based and Virtual World’s Shopping Experiences on Consumer Purchase Attitudes. Inform. Manag. 2019, 56, 103153. [Google Scholar] [CrossRef]
- Zhang, X.; de Pablos, P.O.; Wang, X.; Wang, W.; Sun, Y.; She, J. Understanding the users’ continuous adoption of 3D social virtual world in China: A comparative case study. Comput. Hum. Behav. 2014, 35, 578–585. [Google Scholar] [CrossRef]
- Nikou, S.A.; Economides, A.A. Mobile-Based Assessment: Integrating acceptance and motivational factors into a combined model of Self-Determination Theory and Technology Acceptance. Comput. Hum. Behav. 2017, 68, 83–95. [Google Scholar] [CrossRef]
- Huang, Y.C.; Backman, S.J.; Backman, K.F.; Moore, D. Exploring user acceptance of 3D virtual worlds in travel and tourism marketing. Tour. Manag. 2013, 36, 490–501. [Google Scholar] [CrossRef]
- Fonseca, D.; Redondo, E.; Valls, F.; Villagrasa, S. Technological adaptation of the student to the educational density of the course. A case study: 3D architectural visualization. Comput. Hum. Behav. 2017, 72, 599–611. [Google Scholar] [CrossRef]
- Ajzen, I. The theory of planned behavior. Organ. Behav. Hum. Dec. 1991, 50, 179–211. [Google Scholar] [CrossRef]
- Li, R.; Chung, T.; Fiore, A.M. Factors affecting current users’ attitude towards e-auctions in China: An extended TAM study. J. Retail. Consum. Serv. 2017, 34, 19–29. [Google Scholar] [CrossRef]
- Andre, H.; Sihombing, P.P.; Sfenrianto, S.; Wang, G. Measuring Consumer Trust in Online Booking Application. In Proceedings of the 4th International Conference on Information Technology, Information Systems and Electrical Engineering (ICITISEE), Yogyakarta, Indonesia, 20–21 November 2019; pp. 446–451. [Google Scholar]
- Triberti, S.; Villani, D.; Riva, G. Unconscious goal pursuit primes attitudes towards technology usage: A virtual reality experiment. Comput. Hum. Behav. 2016, 64, 163–172. [Google Scholar] [CrossRef]
- Pargman, D.S.; Eriksson, E.; Bates, O.; Kirman, B.; Comber, R.; Hedman, A.; van den Broeck, M. The future of computing and wisdom: Insights from Human–Computer Interaction. Futures 2019, 113, 102434. [Google Scholar] [CrossRef] [Green Version]
- Dix, A.; Finlay, J.; Abowd, G.D.; Beale, R. Human-Computer Interaction, 3rd ed.; Pearson Prentice Hall: Upper Saddle River, NJ, USA, 2004. [Google Scholar]
- Bowman, D.A.; Kruijff, E.; LaViola, J.J.; Poupyrev, I. 3D User Interfaces: Theory and Practice; Addison Wesley Longman Publishing Co., Inc.: Redwood City, CA, USA, 2004. [Google Scholar]
- Deng, S.; Jiang, N.; Chang, J.; Guo, S.; Zhang, J.J. Understanding the impact of multimodal interaction using gaze informed mid-air gesture control in 3D virtual objects manipulation. Int. J. Hum-Comput. Stud. 2017, 105, 68–80. [Google Scholar] [CrossRef]
- Dong, L.; Feng, R.; Bi, J.; Shen, S.; Lu, H.; Zhang, J. Insight into the interaction mechanism of human SGLT2 with its inhibitors: 3D-QSAR studies, homology modeling, and molecular docking and molecular dynamics simulations. J. Mol. Model 2018, 24, 86. [Google Scholar] [CrossRef] [PubMed]
- Wang, L.; Wong, L.; Xu, Y.; Zhou, X.; Qiu, S.; Meng, X.; Yang, C. The design and empirical evaluations of 3D positioning techniques for pressure-based touch control on mobile devices. Pers. Ubiquit. Comput. 2018, 22, 525–533. [Google Scholar] [CrossRef]
- Cho, E.J.; Lee, K.M. Effects of 3D displays: A comparison between shuttered and polarized displays. Displays 2013, 34, 353–358. [Google Scholar] [CrossRef]
- Visinescu, L.L.; Sidorova, A.; Jones, M.C.; Prybutok, V.R. The influence of website dimensionality on customer experiences, perceptions and behavioral intentions: An exploration of 2D vs. 3D web design. Inform. Manag. 2015, 52, 1–17. [Google Scholar] [CrossRef]
- Currò, G.; La Malfa, G.; Caizzone, A.; Rampulla, V.; Navarra, G. Three-Dimensional (3D) Versus Two-Dimensional (2D) Laparoscopic Bariatric Surgery: A Single-Surgeon Prospective Randomized Comparative Study. Obes. Surg. 2015, 25, 2120–2124. [Google Scholar] [CrossRef]
- Cho, T.H.; Chen, C.Y.; Wu, P.J.; Chen, K.S.; Yin, L.T. The comparison of accommodative response and ocular movements in viewing 3D and 2D displays. Displays 2017, 49, 59–64. [Google Scholar] [CrossRef]
- Su, C.C.; Moorthy, A.K.; Bovik, A.C. Visual Quality Assessment of Stereoscopic Image and Video: Challenges, Advances, and Future Trends. In Visual Signal Quality Assessment: Quality of Experience (QoE); Deng, C., Ma, L., Lin, W., Ngan, K.N., Eds.; Springer International Publishing: Cham, Switzerland; New York City, NY, USA, 2015. [Google Scholar]
- Xu, H.; Jiang, G.; Yu, M.; Luo, T.; Peng, Z.; Shao, F.; Jiang, H. 3D visual discomfort predictor based on subjective perceived-constraint sparse representation in 3D display system. Future Gener. Comput. Syst. 2018, 83, 85–94. [Google Scholar] [CrossRef]
- Terkan, R. Importance of Creative Advertising and Marketing According to University Students Perspective. Int. Rev. Manag. Mark. 2014, 4, 239–246. [Google Scholar]
- Teixeira, T.S. The Rising Cost of Consumer Attention Why You Should Care, and What You Can Do about It. Harv. Bus. Sch. Work. Pap. 2014, 1, 14-055. [Google Scholar]
- Sun, B.; Wang, H. Research on the Influencing Factors of Leading Technology Diffusion Based on Technology Acceptance Model. In Proceedings of the IEEE International Symposium on Innovation and Entrepreneurship (TEMS-ISIE), Hangzhou, China, 24–26 October 2019; pp. 1–8. [Google Scholar]
- Van Wermeskerken, M.; Ravensbergen, S.; van Gog, T. Effects of instructor presence in video modeling examples on attention and learning. Comput. Hum. Behav. 2017, 89, 430–438. [Google Scholar] [CrossRef]
Figure 1.
The concept of sentiment level evaluation approach employs data from an online questionnaire.
Figure 1.
The concept of sentiment level evaluation approach employs data from an online questionnaire.

Figure 2.
Menu options of several handicraft products created from various rural natural materials: (a) sedge; (b) mangrove palm leaves; (c) timber; and (d) coconut shell.
Figure 2.
Menu options of several handicraft products created from various rural natural materials: (a) sedge; (b) mangrove palm leaves; (c) timber; and (d) coconut shell.

Figure 3.
3D handicraft products and details in the smartphone application: (a) bag created from sedge, (b) bin crafted from mangrove palm leaves, (c) vase produced from timber, and (d) cup made from coconut shell.
Figure 3.
3D handicraft products and details in the smartphone application: (a) bag created from sedge, (b) bin crafted from mangrove palm leaves, (c) vase produced from timber, and (d) cup made from coconut shell.

Figure 4.
User interaction with a 3D handicraft product.

Figure 5.
Average results of seven main attributes, average total results and the calculation of sentiment level.
Figure 5.
Average results of seven main attributes, average total results and the calculation of sentiment level.


Table 1.
Related works and strengths for comparing with our work.
| Related Works | Strengths and Key Differences |
|---|---|
| Tracking human behavior [20,21,22] |
|
| Linguistic [23,24,25,26] |
|
| Education [27,28] |
|
| E-commerce and online shopping [29,30,31,32,33] |
|
| Hotel and tourism [34,35] |
|
| Entertainment [36,37] |
|
| Disaster and security [38,39] |
|
| Proposed study |
|
Table 2.
Several related works in the field of technology assessment for generating the questionnaire.
Table 2.
Several related works in the field of technology assessment for generating the questionnaire.
| Questionnaire Item | Literature |
|---|---|
| 1. Perceived Ease of Use (PEOU) 1.1 How easy is it to learn how to use a 3D handicraft product application on a smartphone? 1.2 How convenient is it to use a 3D handicraft product application on a smartphone? 1.3 How flexible is the 3D handicraft product application on a smartphone? | Users’ feelings toward an application are easy to assess. The perceived ease of use indicates the type of user who is expected to employ the application without any difficulty [2,42]. Perceived ease of use (PEOU) was mentioned in the technology acceptance model (TAM) [43]. The TAM in terms of PEOU was tested in an earlier study to describe users’ acceptance of the system and related applications, namely mobile entertainment [44], virtual worlds [45] and the social virtual world market [46]. This indicated that the application system’s performance was appropriate, and the user would feel at ease. Thus, the expected probability could be applied to the system [47]. |
| 2. Perceived Usefulness (PU) 2.1 Does the 3D handicraft product application help you to see the details of the handicraft products? 2.2 Does the 3D handicraft product application demonstrate the handicraft products? 2.3 Does the 3D handicraft product application help you to decide whether to buy the handicraft products? | The factors of user acceptance and behavioral intentions affect other aspects of the TAM that have perceived usefulness (PU) [43]. This term indicates that user intention could affect the utilization of that technology [42]. PU has been applied in various studies to indicate user acceptance and intention, as well as related applications such as 3D virtual worlds [48], virtual reality [2] and 3D architectural visualization [49]. PU means a user can believe that the application system will be adaptable to their own preferences [49]. |
| 3. User Attitudes toward the Application (AT) 3.1 Is the use of a 3D handicraft product application on a smartphone a good idea? 3.2 Does a 3D handicraft product application on a smartphone accurately represent handicraft products? 3.3 Do you have a positive feeling about handicraft products thanks to the 3D handicraft product application on a smartphone? | The attitude measures section appears in both the theory of planned behavior (TPB) [50] and TAM [43]. It has been applied to investigate consumers’ perceptions [51] and user behavior, as well as in TAM to detail and forecast the adoption of the technology system. Attitude toward (AT) would, directly and indirectly, affect the PEOU and PU [2,47]. |
| 4. Behavioral Intention (BI) 4.1 If there were a 3D handicraft product application available on a smartphone, would you have a serious intention to use it? 4.2 Would you use a 3D handicraft product application on a smartphone to select other types of products? | Behavioral intention (BI) can apply to information systems and explain the acceptance of the system’s use [52]. BI is forecast by the user’s assessment of themselves and compares the user’s intention to use the system in the future or not [53]. BI generally agrees with AT [47]. |
| 5. Three-Dimensional (3D) User Interaction (3DUI) 5.1 Does the 3D handicraft product application on a smartphone demonstrate the 3D interaction? 5.2 Is the pattern of 3D interaction in the 3D handicraft product application on a smartphone clear? 5.3 Can you operate the 3D interaction in a 3D handicraft product application on a smartphone effectively? | This section refers to Human–Computer Interaction (HCI), a computer science field [54]. Computer systems’ design for effectiveness and simplicity will make users more likely to use the system [55]. The development of 3D user interactions (3DUI) and the display started in the 1960s [56]. More recently, there have been several studies and experiments on 3D interaction [57,58,59]. Because human users use the application system, the 3D interaction will allude to human psychology and factors resulting in the significance of HCI as part of the interactive design. For this reason, the evaluation of user interfaces is important [56]. |
| 6. Three-Dimensional (3D) Product Display (3DPD) 6.1 Does the 3D handicraft product application on a smartphone include a clear display of details and information? 6.2 Does the 3D handicraft product application on a smartphone assist you with viewing the said products? | Human–television interactions are correlated with 3D products (3DPD). The majority of the studies focused on the display [60]. Several research studies investigated the 3D display to indicate whether a 3D display was better than a 2D display [61,62,63]. A 3D display offers a new virtual system with factors that should attract increased attention [64,65]. For this study, a 3D product has the same meaning when applied to 3D handicraft products. |
| 7. Attracting Attention (AA) 7.1 Doe the 3D handicraft product application on a smartphone aid to increase attention of the handicraft products? 7.2 Can the 3D handicraft product application on a smartphone attract the attention in the handicraft products? | This part is correlated with advertising and marketing because advertising is how consumers get to know about products and services [66] and can affect consumer attention [66]. The most powerful new multimedia device and technologies, such as the Internet, tablets, smartphones and social networks, can connect users [66]. Several studies have focused on attracting attention (AA) with the new technologies [49,67,68,69]. In this study, the 3D handicraft product application was developed to attract users’ attention to the handicraft products of Thailand. |
Table 3.
Total and percentage of participants’ demographics.
| Demographic Attributes | Sub-Attributes | Total (n = 1775) | Percentage |
|---|---|---|---|
| Gender | Male | 789 | 44.45% |
| Female | 986 | 55.55% | |
| Age | Under 25 | 401 | 22.59% |
| 25–30 | 546 | 30.76% | |
| 31–40 | 486 | 27.38% | |
| 41–50 | 191 | 10.76% | |
| Over 50 | 151 | 8.51% | |
| Location | Northern | 309 | 17.49% |
| Northeastern | 330 | 18.68% | |
| Eastern | 298 | 16.86% | |
| Western | 257 | 14.54% | |
| Central | 297 | 16.81% | |
| Southern | 284 | 16.07% | |
| Occupation | Student | 343 | 19.41% |
| Employee | 351 | 19.86% | |
| Self-employed | 367 | 20.77% | |
| Civil service | 337 | 19.07% | |
| Agriculturist | 224 | 12.68% | |
| No career | 153 | 8.66% | |
| Income per month | Less than 5000 Baht | 314 | 17.77% |
| 5001–10,000 Baht | 291 | 16.47% | |
| 10,001–15,000 Baht | 439 | 24.84% | |
| 15,001–20,000 Baht | 405 | 22.92% | |
| 20,001–25,000 Baht | 175 | 9.90% | |
| More than 25,000 Baht | 151 | 8.55% |
Table 4.
Total and percentage of participants’ smartphone use information for evaluation.
| Question Attributes | Answers | Total (n = 1775) | Percentage |
|---|---|---|---|
| The main purpose for using a smartphone application in a day. | News | 371 | 20.90% |
| Playing games | 320 | 18.03% | |
| Social media | 403 | 22.70% | |
| Watching video clips | 355 | 20.00% | |
| Online shopping | 326 | 18.37% | |
| The number of participants who have ever and never used a 3D application on a smartphone. | Ever | 1189 | 66.99% |
| Never | 586 | 33.01% | |
| The number of participants who have ever/never used a 3D product on a smartphone. | Ever | 705 | 39.72% |
| Never | 1070 | 60.28% |
Table 5.
The condition to gain sentiment level result.
| Conditions | Sentiment Level |
|---|---|
| 0–1.80 | Strongly negative |
| 1.81–2.60 | Negative |
| 2.61–3.40 | Neutral |
| 3.41–4.20 | Positive |
| 4.21–5 | Strongly positive |
Table 6.
Total number and percentage of sentiment levels evaluation.
| Sentiments | Number | Negative and Neutral Score | Positive Score |
|---|---|---|---|
| Strongly negative | 123 (6.93%) | 375 (21.13%) | - |
| Negative | 126 (7.10%) | ||
| Neutral | 126 (7.10%) | ||
| Positive | 775 (43.66%) | - | 1400 (78.87%) |
| Strongly positive | 625 (35.21%) |
Table 7.
Total number and percentages of types of attention paid by participants.
| Sentiments of Attracting Attention | Participants’ Number | Negative and Neutral Score | Positive Score |
|---|---|---|---|
| Strongly negative | 130 (7.32%) | 362 (20.39%) | - |
| Negative | 135 (7.61%) | ||
| Neutral | 97 (5.46%) | ||
| Positive | 688 (38.76%) | - | 1413 (79.61%) |
| Strongly positive | 725 (40.85%) |
Publisher’s Note: MDPI stays neutral with regard to jurisdictional claims in published maps and institutional affiliations. |
© 2021 by the authors. Licensee MDPI, Basel, Switzerland. This article is an open access article distributed under the terms and conditions of the Creative Commons Attribution (CC BY) license (http://creativecommons.org/licenses/by/4.0/).
Share and Cite
MDPI and ACS Style
Jinsakul, N.; Tsai, C.-F.; Wang, P. Sentiment Level Evaluation of 3D Handicraft Products Application for Smartphones Usage. Electronics 2021, 10, 199. https://0-doi-org.brum.beds.ac.uk/10.3390/electronics10020199
AMA Style
Jinsakul N, Tsai C-F, Wang P. Sentiment Level Evaluation of 3D Handicraft Products Application for Smartphones Usage. Electronics. 2021; 10(2):199. https://0-doi-org.brum.beds.ac.uk/10.3390/electronics10020199
Chicago/Turabian StyleJinsakul, Natinai, Cheng-Fa Tsai, and Paohsi Wang. 2021. "Sentiment Level Evaluation of 3D Handicraft Products Application for Smartphones Usage" Electronics 10, no. 2: 199. https://0-doi-org.brum.beds.ac.uk/10.3390/electronics10020199
Note that from the first issue of 2016, this journal uses article numbers instead of page numbers. See further details here.