1. Introduction
The COVID-19 pandemic has spread significantly in the past year and has infected more than 118 million people globally since its inception. These numbers are rising exponentially around the world [
1,
2]. COVID-19 has caused more damage, while having a lower fatality rate when compared to previous diseases, namely “severe acute respiratory syndrome (SARS) and Middle East respiratory syndrome (MERS)” [
3]. COVID-19 disease is essentially transmitted through respiratory and contact routes when someone is in proximity [
4]. Airborne transmissions are also one of the largest sources, occurring in healthcare sectors, where support treatments or procedures are conducted in close contact. This can also occur when numerous people share the same room for long periods of time.
The Kingdom of Saudi Arabia’s government has taken massive precautionary measures, such as timely interventions, travel restrictions, and closing cinemas, indoor entertainment centers, indoor restaurants and cafes, gyms, and sports centers. These measures have seen preliminary effects in reducing the spread of this pandemic. As of 3 March 2021, the COVID-19 pandemic has caused more than 381,700 cases and 6550 deaths. According to [
5], a survey was conducted on a total of 844 healthcare workers. Three-fourths of the respondents revealed that they are at risk of contracting COVID-19 at work. Of the respondents, 69.1% revealed they would feel threatened if a colleague contracted COVID-19, 69.9% of them that they would have to care for patients infected with COVID-19, while 27.7% that they feel unsafe at work using the standard precautions available.
In hospital and laboratory settings, reverse-transcription polymerase chain reaction (RT-PCR) is the gold standard technique to detect COVID-19 infection [
6]. However, this method presents a high false detection rate, and its unavailability on a large scale might slow down the tracking of potential COVID-19 patients. Another method called thoracic computed tomography (CT) is comparatively easy to operate to deliver the diagnosis of potential patients. For instance, the majority of COVID-19 patients have a traditional radiographic imprint on their lungs when a CT scan is performed. Thus, the lung CT is a widely used method to clinically diagnose the disease [
7]. We must consider the demand for high-throughput screening for examining the chest using computed tomography and the amount of work that has been done by radiologists, especially the COVID-19 patients in a hospital environment.
In order to avoid contact with potential COVID-19 patients, noncontact and noninvasive monitoring of vital signs such as the respiratory rate is of utmost importance. Noncontact offers seamless monitoring of patients by altering daily routine activities [
8]. Recently, noncontact techniques such as radio frequency (RF) that exploit ubiquitous WiFi have shown the ability to monitor the daily routine activities of COVID-19 patients and their respiratory rate [
9]. In addition, the existing WiFi network system accesses control methods, essentially using a static password, and the media access control address is prone to attacks by malicious users. Such attackers can gain access to WiFi signals and monitor the respiratory rate of a particular COVID-19 patient and raise a false alarm [
10]. The primary reason the proposed noncontact wireless sensing system exploits low-cost ubiquitous wireless devices is that it leverages the existing WiFi signals available almost everywhere, for instance in homes, care-homes, hospitals, hotels, and so on. The system does not need any contact with the person and monitors various COVID-19 symptoms, specifically the breathing rate, by exploiting the change in the wireless medium using the variances of the amplitude information. This system can also exploit the small receiving antenna present in a mobile phone. When the mobile phone is connected to a WiFi router, the system would be able to collect breathing information using the mobile phone as well. Hence, the proposed method can help mitigate the ongoing spread of COVID–19 and can continuously and seamlessly monitor the specific patients. In the literature [
11,
12,
13,
14,
15,
16], COVID-19 monitoring/prediction methods are available; however, these methods [
11,
12,
13,
14,
15,
16,
17] are mainly focused on classification without any encryption. The method outlined in [
11,
12,
13,
14,
15,
16] mainly uses AI- and ML-based techniques. A number of ML techniques are used for other applications, and details can be found in [
18,
19]. Our proposed method uses a noninvasive detection of COVID-19 along with the patients’ privacy using the CSI. Moreover, in this work, images were secured through a lightweight chaos-based encryption method.
In this paper, we present a noncontact safe and secure WiFi sensing-based COVID-19 patient monitoring technique using low-cost ubiquitous small wireless devices such as commercially available WiFi routers, network interface cards, and traditional dipole antennas. We monitored the activities of daily living along with the respiratory rate. This system exploits RF signals by examining the variances in the amplitude information of the channel state information (CSI). Specifically, to preserve privacy, we present a novel algorithm. We used one transmitter antenna and one receiving antenna to continuously record the CSI data from a WiFi router for monitoring purposes. The main contributions of this paper are as follows:
We present a novel noncontact safe and secure channel state information-based WiFi sensing system for monitoring the activities of daily living (ADLs) and the respiratory rate of COVID-19 patients. This system does not need a dedicated device and exploits radio frequency signals available almost everywhere;
This system can efficiently monitor large-scale body movements along with tiny chest movements. It primarily exploits various parameters extracted from WiFi signals, such as the variances of the amplitude and phase information, time–frequency spectrograms, and 3D signatures containing time–frequency–amplitude information;
WiFi technology is highly susceptible to being accessed by unwanted users; therefore, we propose a novel privacy-preserving algorithm for securing the CSI data containing vital signatures such as ADLs and respiratory rates to counter the false alarms generated. Every now and then, unauthorized users can gain access to the WiFi signal, generating a false alert to the caregiver or nurse;
In this work, we encrypted spectrograms with lightweight chaos-based maps. The security of the proposed scheme was tested and proven against a number of security parameters.
One of the natural questions that arises is why researchers are deploying chaos in image encryption schemes. The behavior of chaotic signals is highly unpredictable and random-like, which can be used in the design of cryptographic algorithms [
20,
21,
22]. Inherently, chaos exhibits complex properties in a very simple mathematical formula. That is one of major reasons why many cryptographic designers prefer chaos instead of complex formulae with complex properties [
23].
2. Related Works
Several studies have used sensor systems for identifying and detecting respiratory disorders. Noncontact sensing of body movements has attracted great attention from researchers, especially noninvasive techniques for measuring vital signatures such as the respiratory and heart rates. Wireless techniques constitute an efficient technique for detecting physiological signs and movements [
24,
25,
26,
27,
28]. For instance, Dou and Huan [
29] suggested a breathing sensing system based on the Doppler spectral energy extracted from the CSI to monitor the chest displacement induced by respiration. The authors proposed two phases: fitting to obtain the CSI with the Doppler shift and decomposition to obtain the channel impulse response. Moreover, they conducted a time–frequency analysis to accumulate the Doppler spectral energy. Khan et al. [
30] conducted a systematic review of noncontact sensing related to COVID-19. The main idea was to suggest a solution for the early diagnosis of this disease based on common early symptoms such as coughing and shortness of breath. The authors identified existing methods for noncontact health monitoring and presented several steps discussed in noncontact sensing platforms such as data collection, data processing, feature extraction, and classification algorithms. Costanzo [
31] developed a software-defined radar based on Doppler elaboration features to measure the noncontact monitoring of human respiration signals. The author proposed to monitor low-frequency oscillations typical of human breath using compact, low-cost, and flexible radar solutions. Van et al. [
32] developed a continuous wave radar sensor system for self-identifying of respiratory disorders. Their proposed system was developed based on neural networks that can identify if a patient has a low, normal, or high breathing rate. Besides, the model has been improved to detect the patients who are suffering from breathing disorders. Sharma et al. [
33] used a wearable radio frequency (RF) sensor as a noninvasive method for monitoring respiration dynamics. The method was used to estimate the breathing rate and lung volume. The obtained respiratory parameters were compared with the traditional chest belts’ data for different simulated respiratory cases, which included fast and slow, shallow breathing. Kristiani et al. [
34] designed a monitor for respiration and heart rates. The proposed device used a flex sensor to detect the respiration rate. The findings of these sensors were published to the Internet using the IoT based on the ThingSpeak application. Khan et al. [
35] provided a solution to remotely monitoring vital signs such as breathing related to COVID-19 patients. The authors used software-defined radio (SDR) technology and artificial intelligence. The fine-grained wireless channel state information was extracted using the channel frequency response and multicarrier orthogonal frequency division multiplexing technique. The validation was conducted using a simulation of the channels to provide a better understanding of the channel frequency response. The technique used in Khan et al.’s paper allows sensing human body movements to diagnose breathing abnormalities in a noncontact manner.
In this paper, the core idea is to detect the lung functionality of patients with COVID-19 based on detecting abnormal breathing rates due to lung disorders. As mentioned above, numerous noninvasive applications of sensors and WiFi-signal-based human activity recognition systems have been proposed, as this provides a low-cost and device-free solution. The main feature of these systems is to analyze the change in received signal characteristics by the nearby WiFi systems, which can provide information about human activity. However, the received signal is greatly affected by multipath propagation and is highly susceptible to noise. Furthermore, the security protocol used to protect the vast majority of WiFi networks can be easily broken, potentially exposing the wireless connection to malicious eavesdroppers and attacks. Patients’ data are an attractive target for cybercrime for two fundamental reasons: they are a rich source of valuable data, and their defenses are weak.
To summarize, there is a need for noncontact, safe, and secure WiFi sensing to monitor the ADLs and respiratory rate of COVID-19 patients using low-cost small wireless devices.
3. WiFi Sensing System Model
The noncontact wireless sensing techniques can be divided into two large categories, the received signal strength indicator (RSII) and channel state information. These two methods can be applied to a large number of applications including cardiac activity monitoring, breathing rate detection, fall detection, and so on. The RSSI measurements only deliver the averaged-out radio frequency signal power level and are extremely inconsistent and inadequate for monitoring the activities of daily living and respiratory rate of COVID-19 patients [
36]. The research work in [
37] demonstrated the activities of daily living of an individual leveraging RSSI measurements using a smartphone sensor and evaluated the performance in terms of percentage accuracy. On the contrary, the channel state information obtained using small wireless devices, such as a WiFi router and network interface card, presented a granular resolution using 30 subcarriers.
The single subcarrier was used to extract breathing information. All of the 30 subcarriers presented nearly similar information, and that is why one subcarrier was used for analysis purposes.
WiFi sensing essentially exploits the received signal strength (amplitude information) indicators and channel state information (amplitude and phase information), which can be used in a large number of applications, specifically for detecting the activities of daily living and tiny chest and cardiac movements with varying frequencies. The RSSI data are the averaged-out signal received by a commercial network interface card, while the CSI data describe the overarching physical wireless medium in terms of various frequency channels [
8,
38]. The RSSI data are highly susceptible to random noise and unstable each time the data are received. The WiFi sensing-based CSI data are highly stable in the presence of external noise.
Assume that any RF signal transmitted by a WiFi router can be mathematically expressed as:
. The signal received by a network interface card at the received side can be written as follows:
Here,
L is the total number of paths, including line-of-sight (LOS) propagation and non-line-of-sight (NLOS) propagation. Here,
and
indicate the attenuation caused due to multipath propagation and delay caused at time internal
t as the RF signal travels from the WiFi router to the receiving antenna through path
i, respectively. Considering
and
do not rely on operating frequency
, by applying the superposition theorem on the RF signal received through the LOS and NLOS, any input RF signal will induce the following output signal:
The above superposition assumption is adequate as the WiFi frequency bandwidth is narrow when compared to its operating frequency (i.e., 2.45 GHz). To simplify the notation, eliminate the term
t found in
and
. The channel impulse response (time domain representation) of the physical wireless medium can be extracted from Equation (
2) as follows:
While its frequency response or channel state information can be mathematically expressed as:
The Intel 5300 network interface card used for data collection embedded within a computer collects a group of 30 frequency subcarriers that essentially measure the channel state information [
39], which can be extracted from Equation (
3) as:
Here,
H indicates the matrix comprising raw CSI data (amplitude and phase information),
f is the baseband frequency of different frequency subcarriers,
k is the total number of subcarriers (30 in this case), and fc is the central frequency (2.45 GHz). When we record CSI data using the commercial Intel 5300 network interface card, there are numerous challenges presented by the device. First and foremost are the latency and time taken when a single CSI packet is received [
40]. The CSI can be measured through received RF signal energy or increasing the sliding window by setting the receiving data. Irrespective of the method adopted, each time the WiFi router is connected to the network interface card, a random packet delay is experienced, which is induced due to the baseband frequency channels that bring random noise into the CSI data. The second reason is the phase difference between the transmitted and received signal. This particular phase difference is produced when the WiFi router is switched on and an initial random noise is transmitted along with an actual data signal. The noise is then picked up into the CSI data at the receiving side. The CSI data obtained by the network interface card can be mathematically expressed as:
Here,
represents the offset or error generated, the volume of which is higher than the actual value of
is caused by the random noise in a wireless medium,
indicates the value of residual
, expressing the time taken from transmission to reception, and
is the
. We used Equation (
6) to extract the CSI data for different activities’ recognition and the breathing rate of COVID-19 patients.
4. WiFi Sensing-Based CSI Data for ADLs and Respiratory Rate
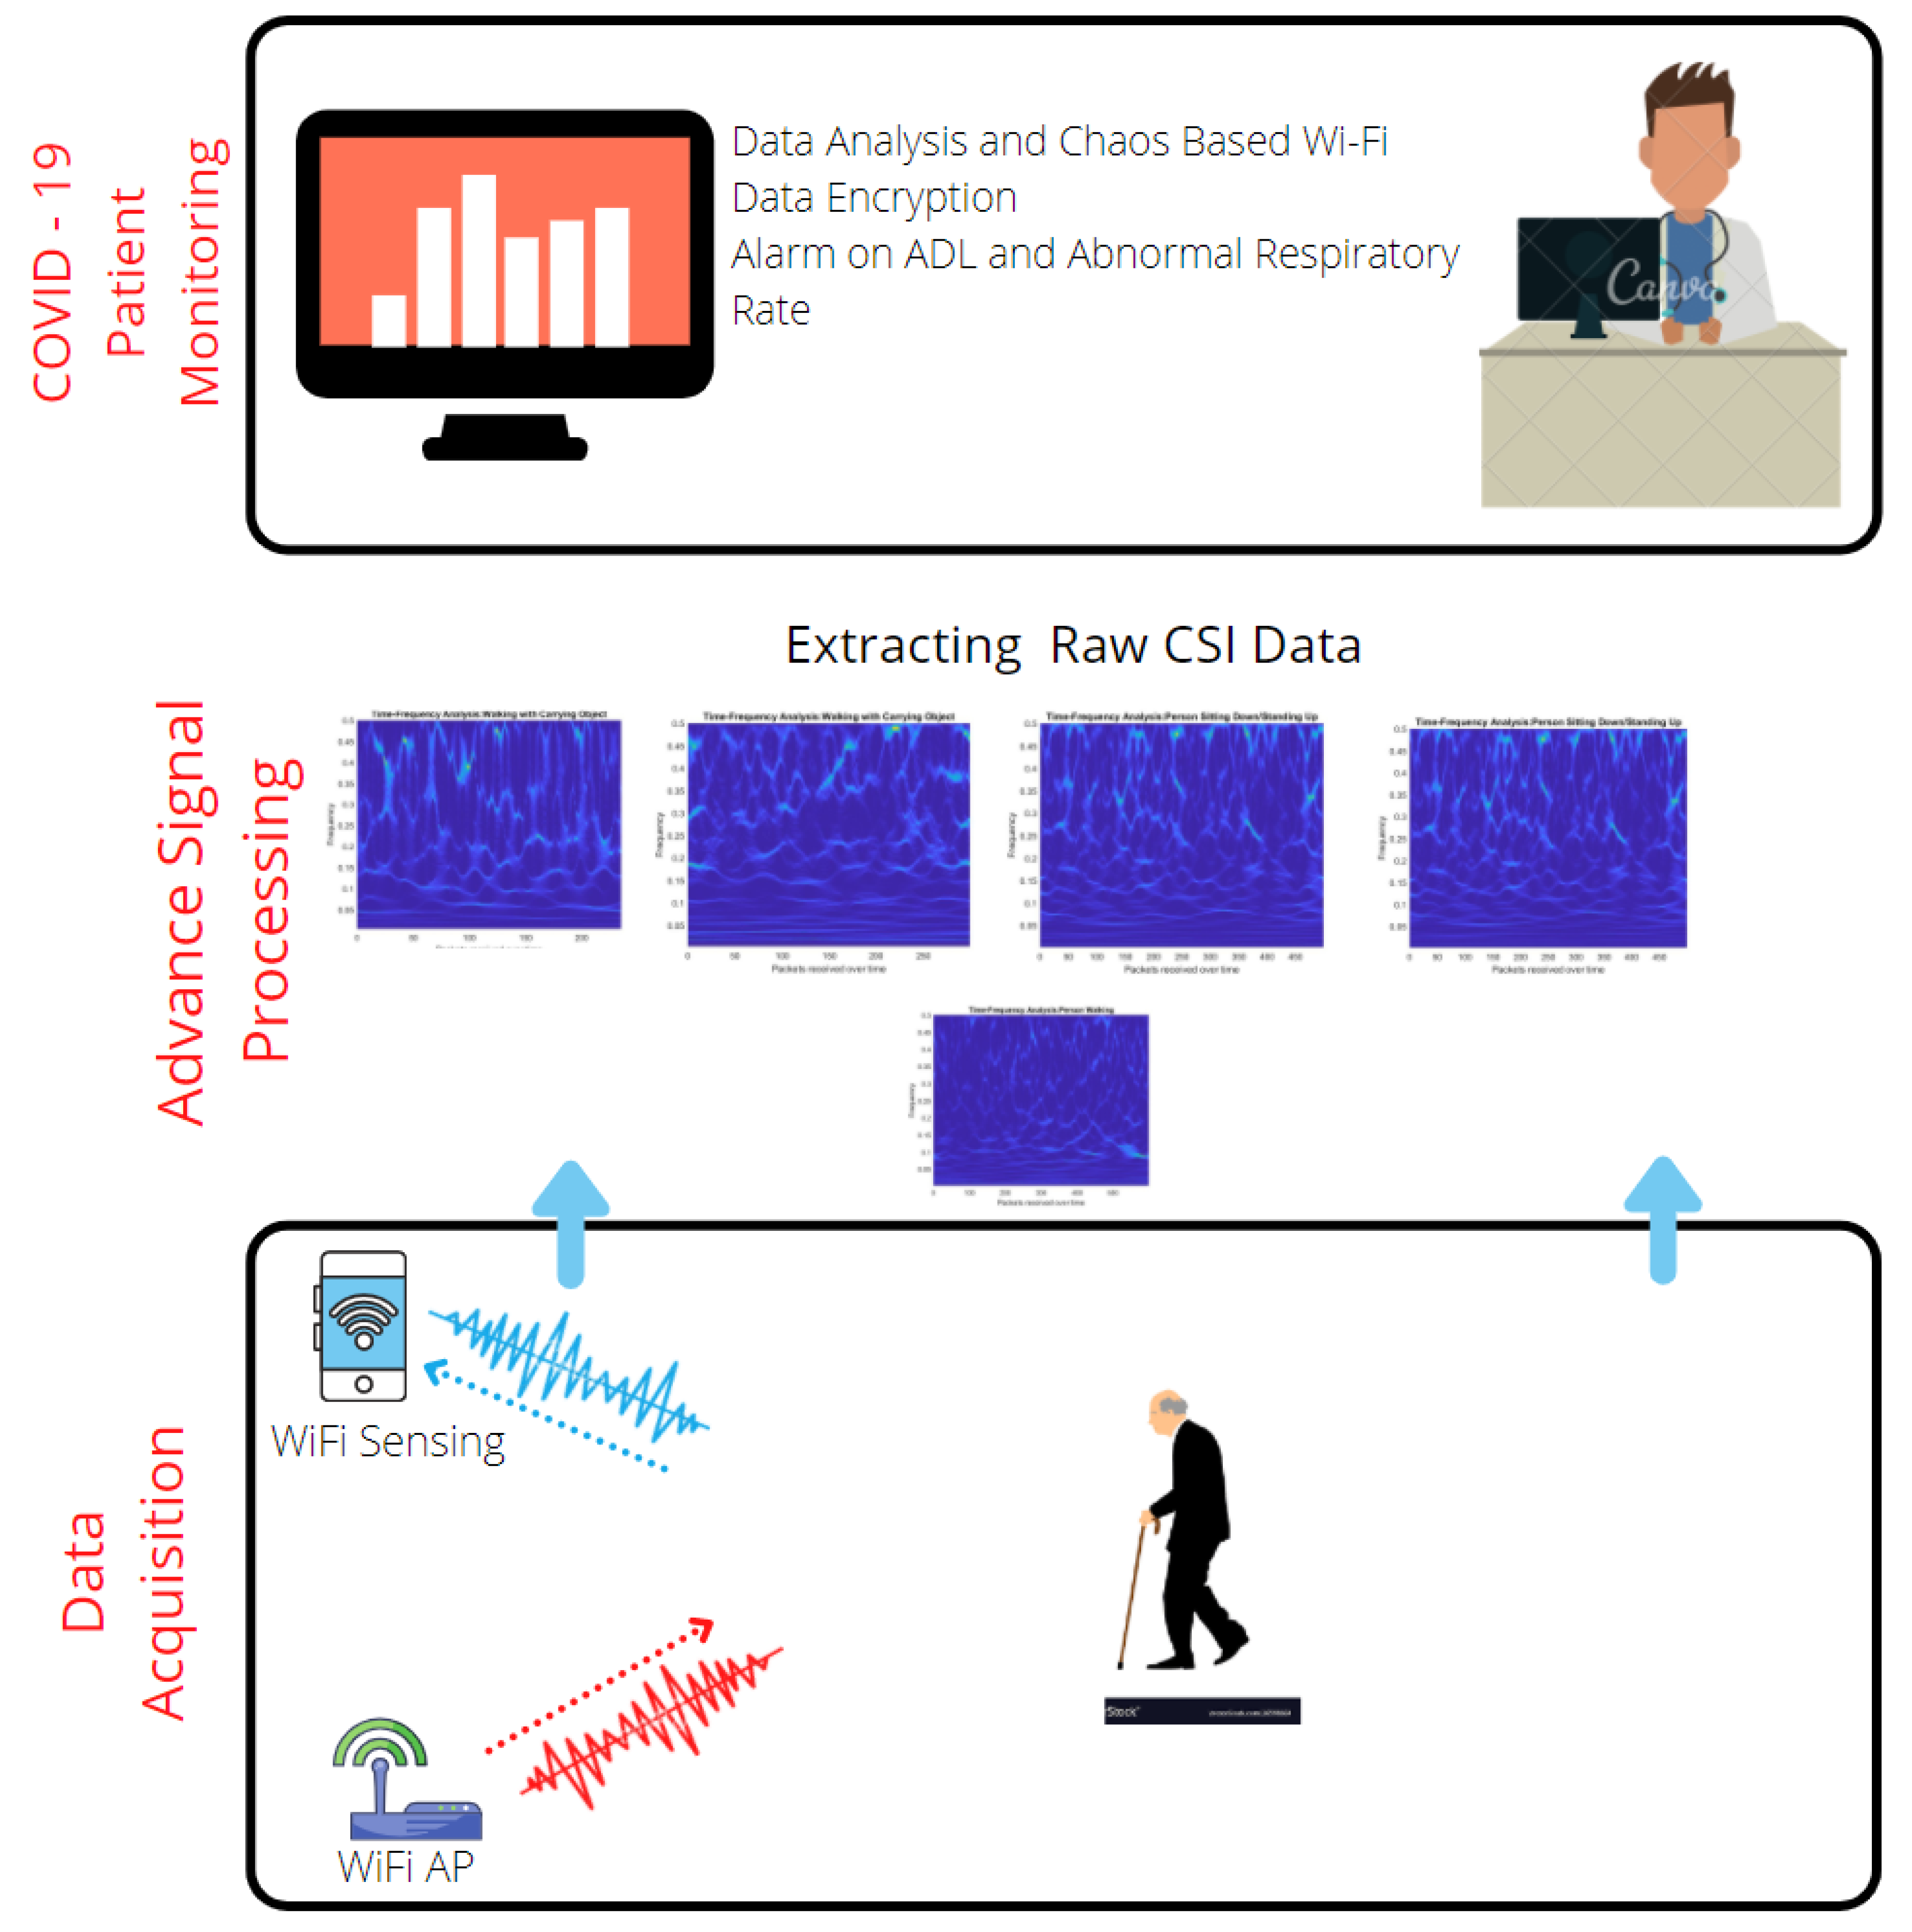
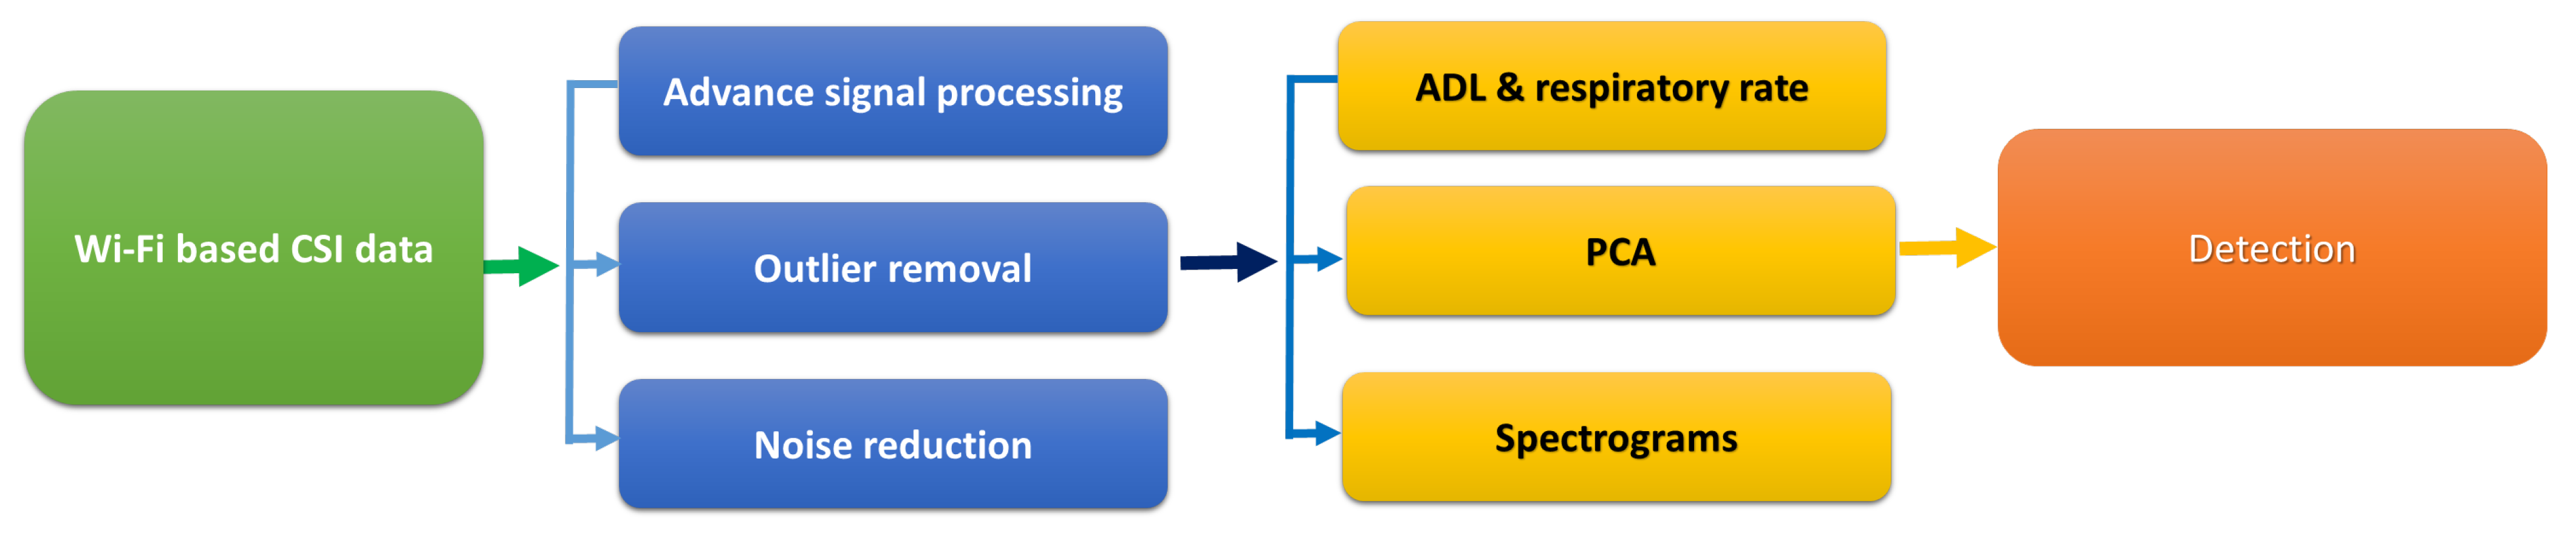
This section focuses on the CSI data obtained for various human activities such as walking at a normal pace, walking while carrying an object, sitting down in a chair, standing up from a chair, lying on a bed, and measuring the respiratory rate. We collected the data using WiFi sensing at Xidian University China, involving healthy participants. The data were previously collected for a range of applications; however, due to the ongoing pandemic, we argue that this system is applicable for monitoring COVID-19 patients since no device needs to interact with the sensing system. The data acquisition was performed in an indoor environment, generating time–frequency signatures [
41,
42] against each activity and respiratory rate and data analysis, and securing it using the chaos-based method, as given in
Figure 1.
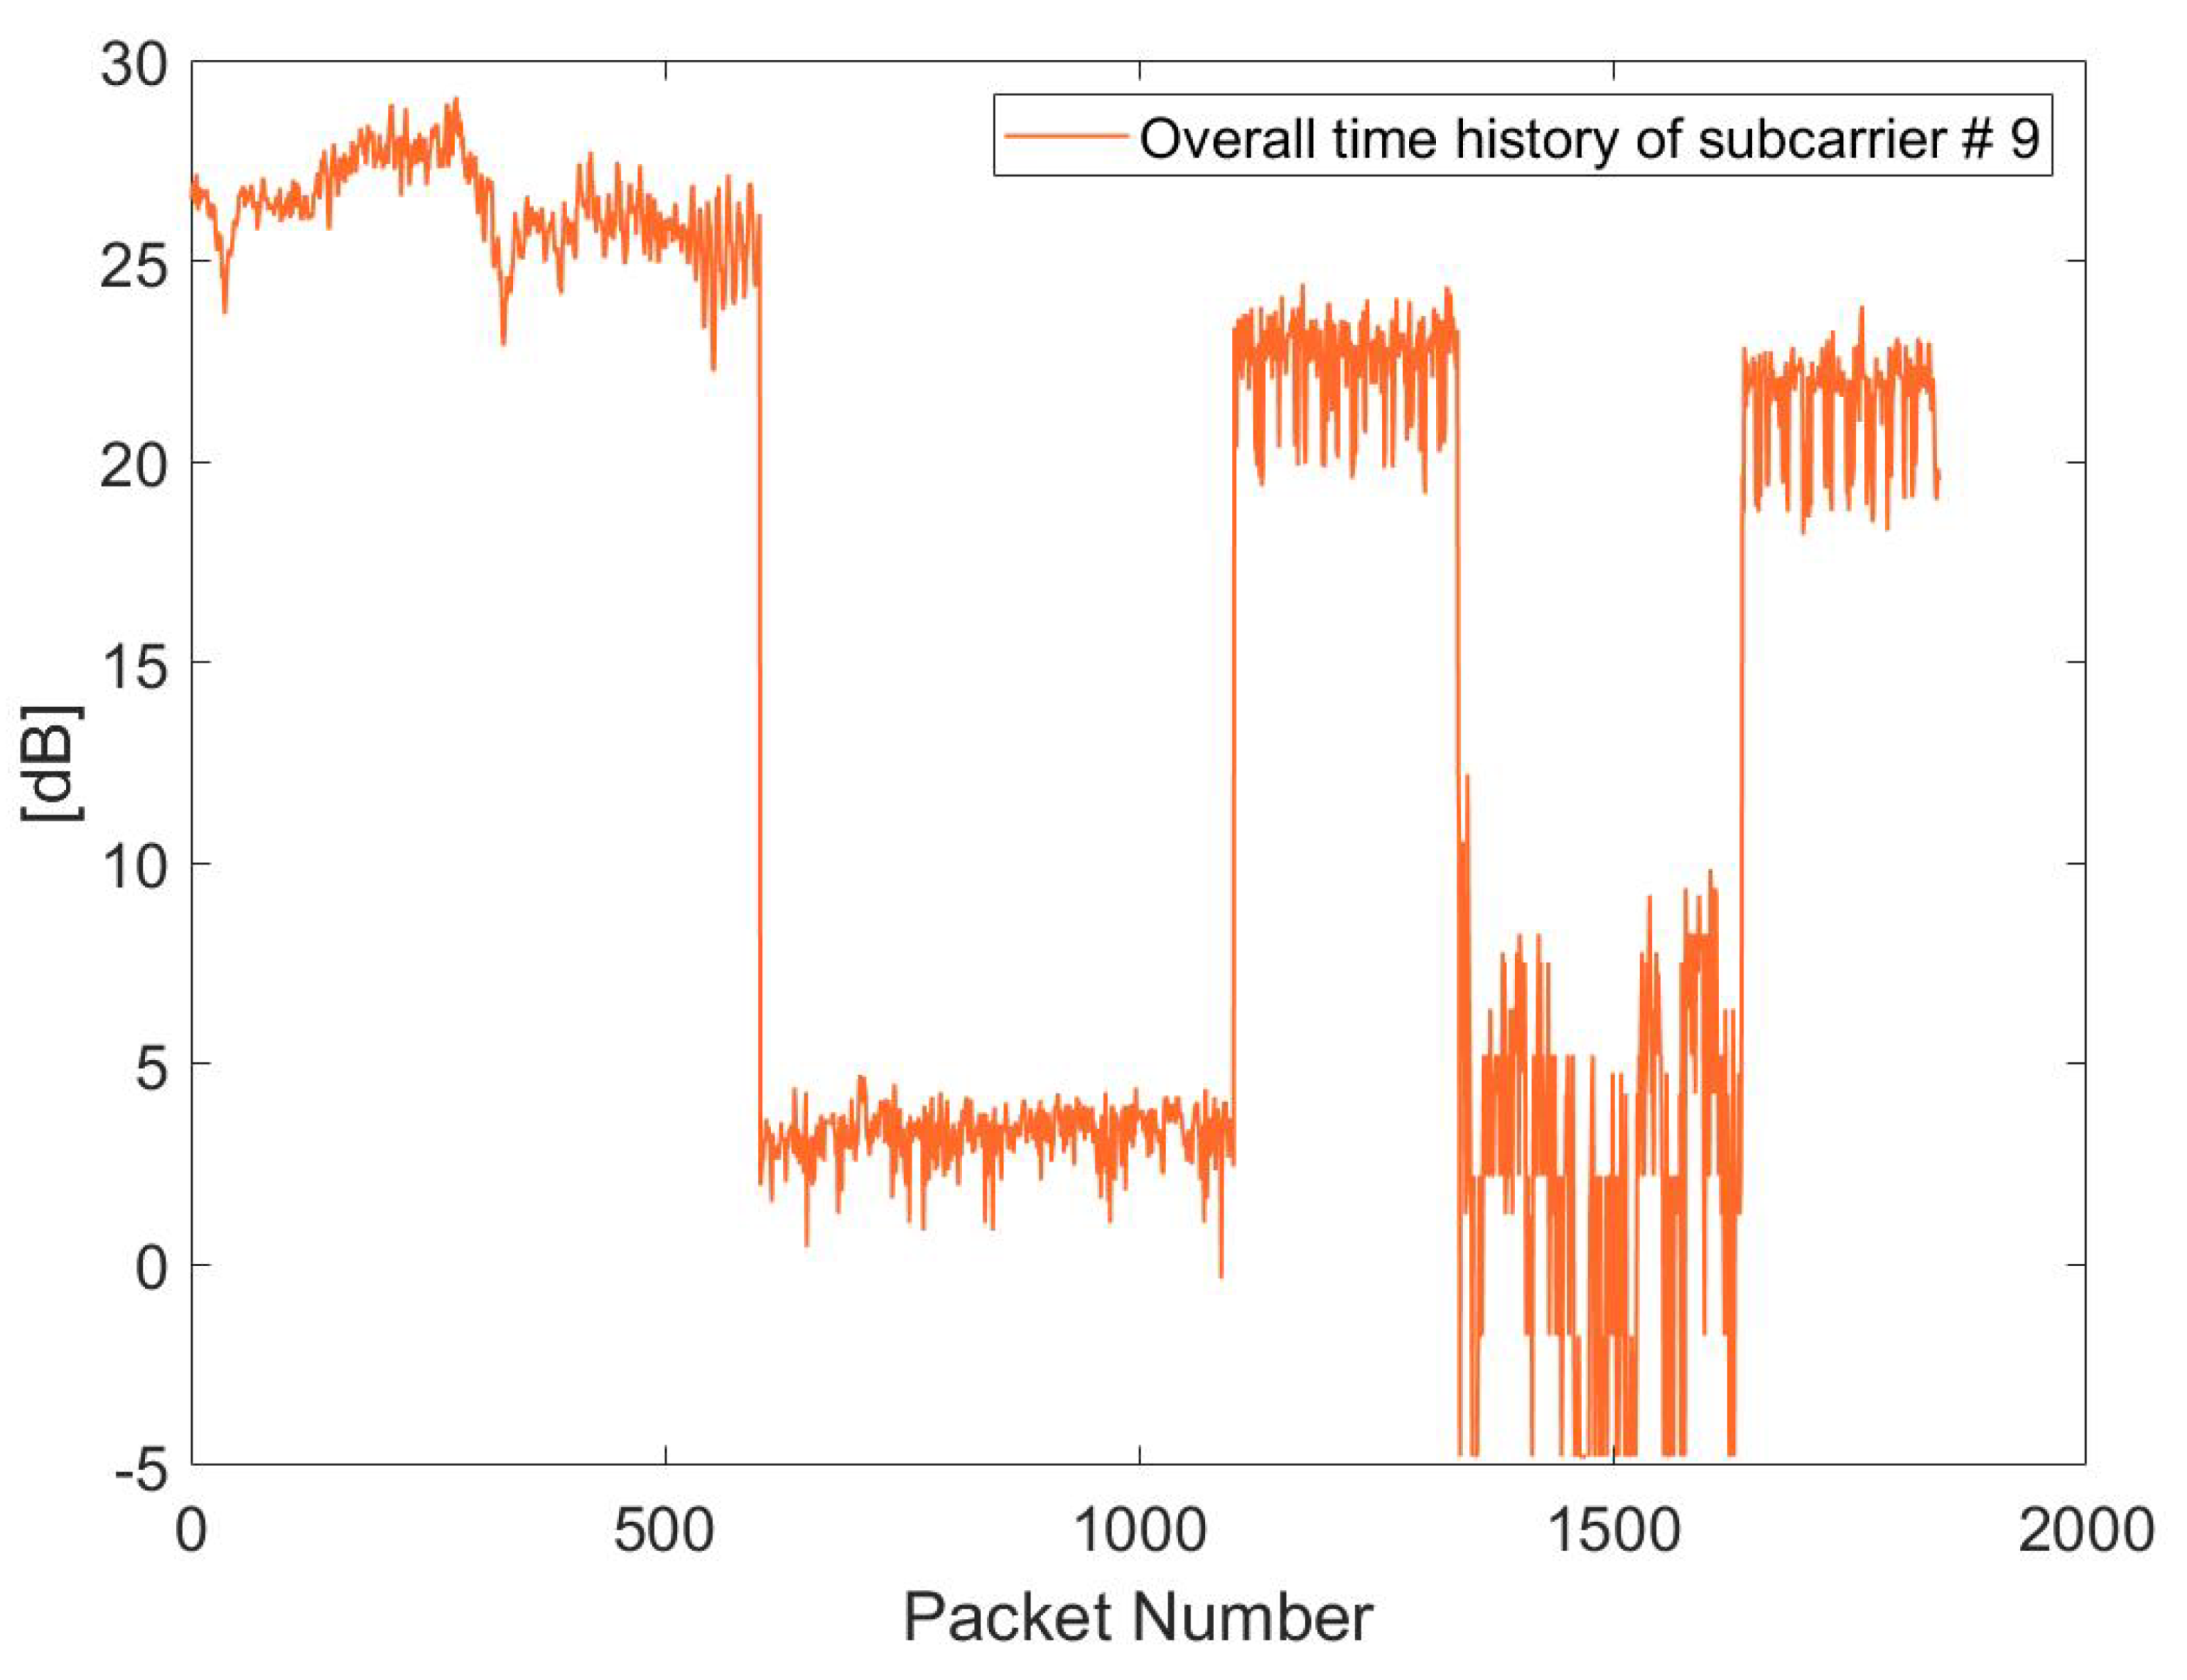
The raw variations of the amplitude information of the CSI data for different activities of daily living are presented in
Figure 2.
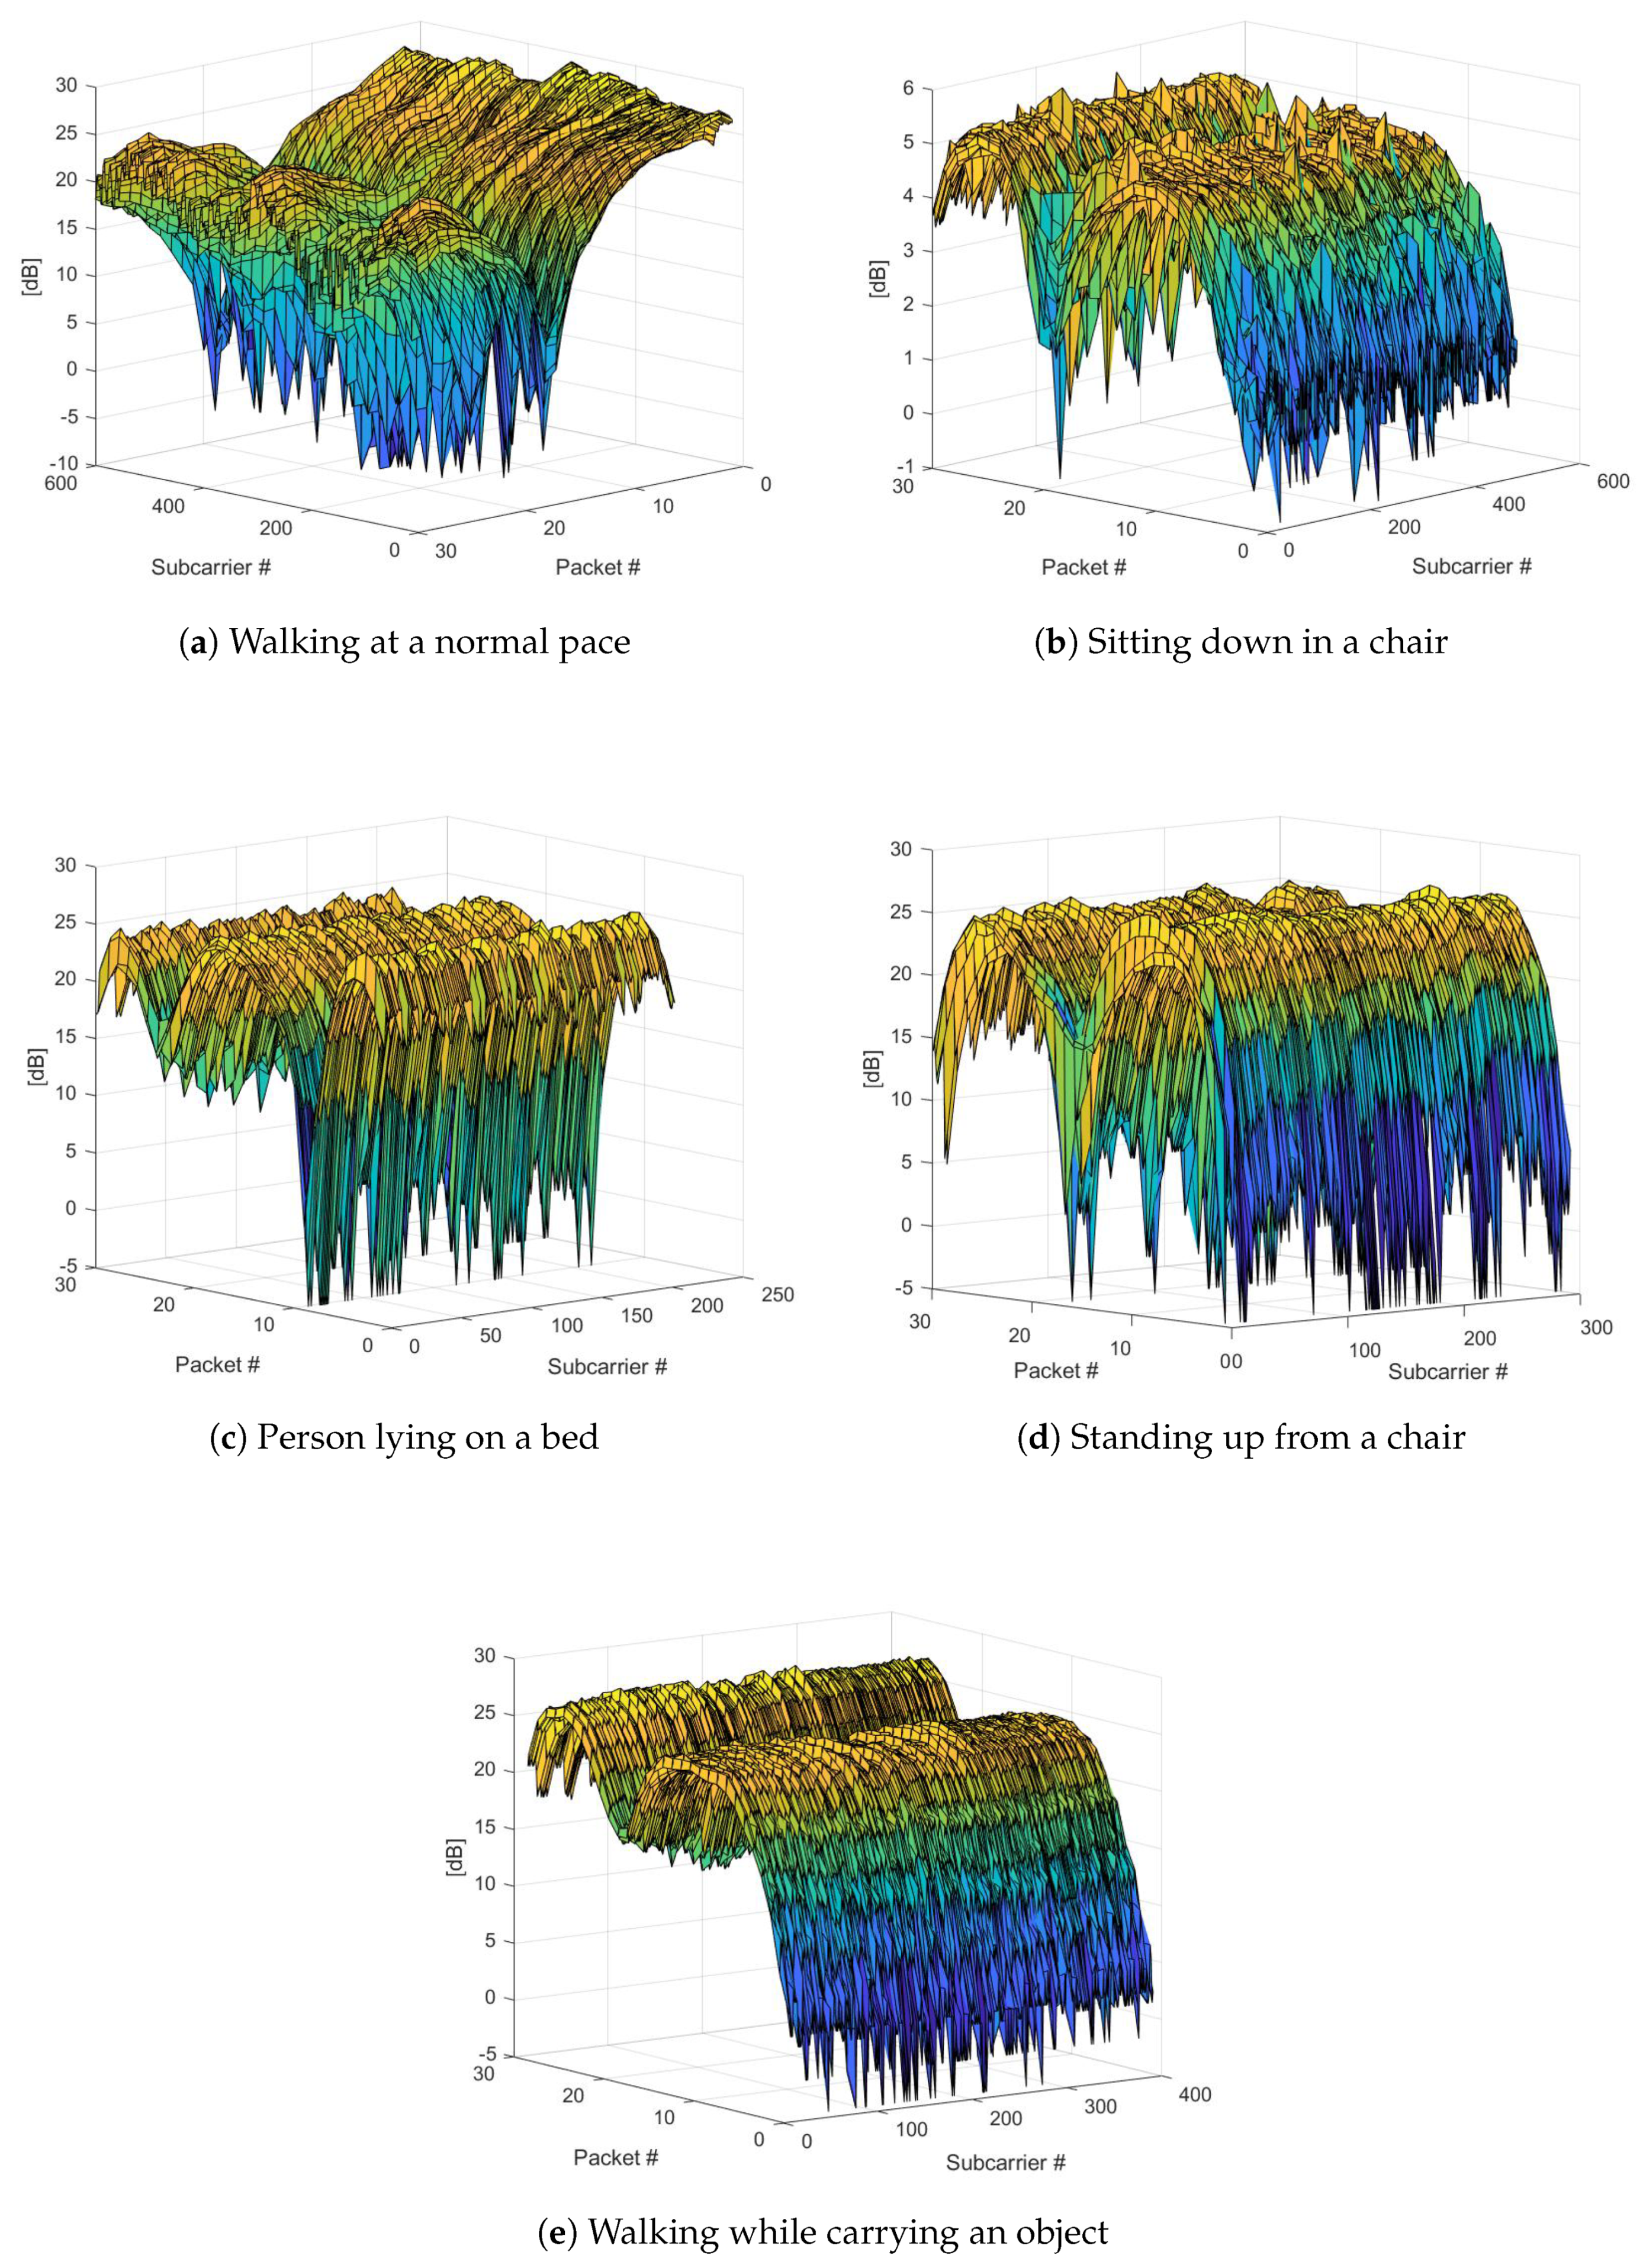
Figure 3 shows the time history of all activities for 30 subcarriers when amplitude CSI is considered in terms of the power level (dB). The 3D waveform in
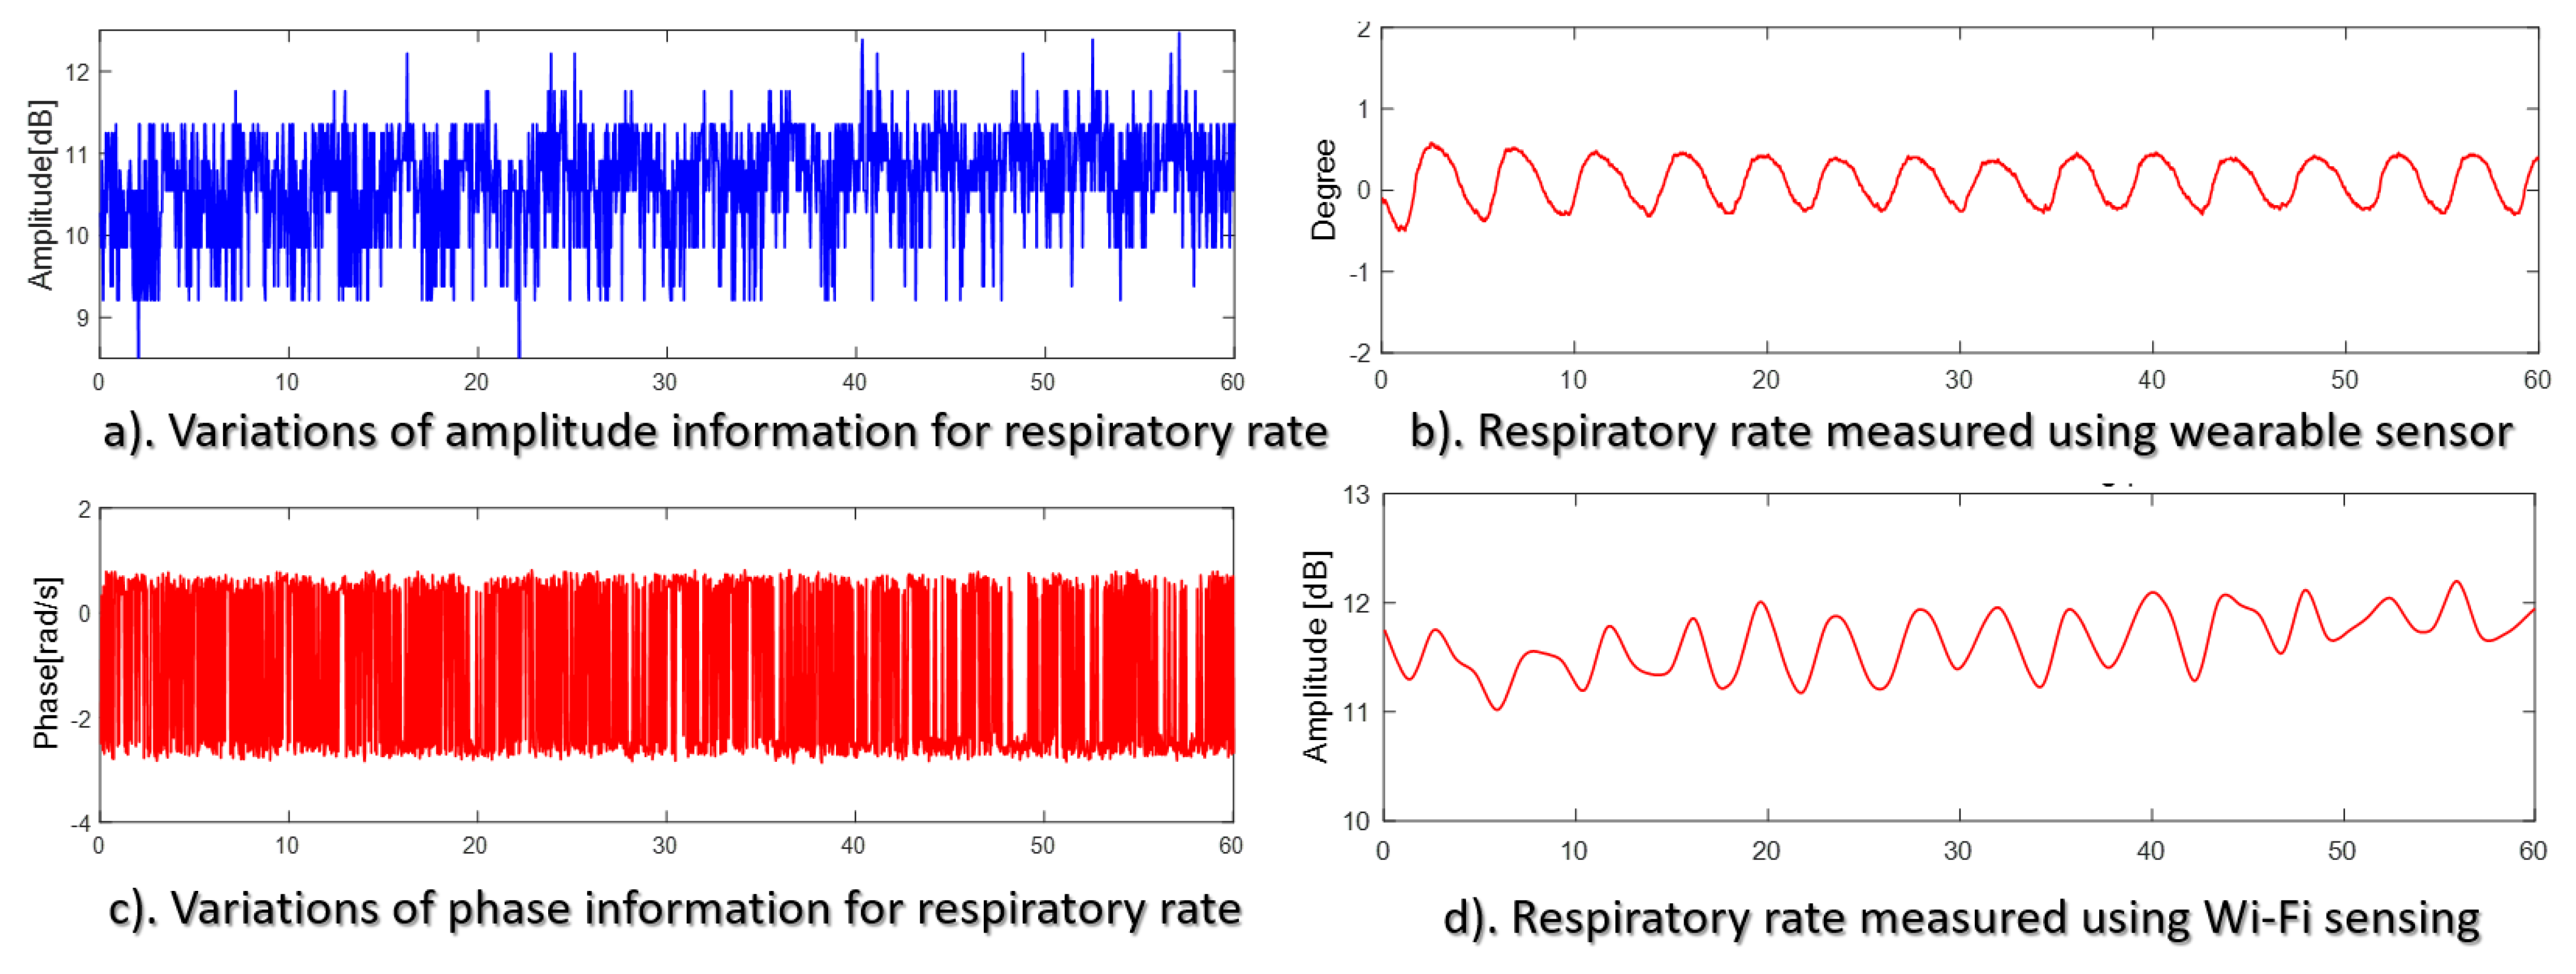
Figure 3 indicates the variances of amplitude information against the total number of subcarriers and time history. It can be seen that each body movement produced a unique CSI signature, which distinguishes each activity. We can further analyze single or multiple subcarriers against time to examine individual activity and transition from one ADL to another. The respiratory rate obtained using WiFi sensing is shown in
Figure 4. A wearable breathing sensor was put on the subject’s body, and data were recorded when the person was within WiFi range. Simultaneously, data were also recorded using a network interface card. A sample of data collected using WiFi sensing is shown in
Figure 4a,c,d, and it was compared with the one obtained using the wearable sensor, as in
Figure 4b. The data in
Figure 4a are the raw variance of the amplitude CSI extracted directly from commodity devices with an applied filter or removing random noise.
Figure 4c is the phase information of the CSI data for a person’s respiratory rate, while
Figure 4d is the final respiratory rate obtained after applying a filtering process using the parameters discussed above. There was a close synergy between the respiratory rate obtained using a wearable sensor with that of the WiFi.
5. Extracting the Time–Frequency Spectrogram from WiFi Signals
In order to reliably and accurately extract the human activities and respiratory rates of COVID-19 patients, we applied time–frequency spectrograms using the short-time Fourier transform (STFT) [
43] to images to encrypt the important data of particular patients. We used CWT to extract the scalograms, as it presents granular information as compared to the STFT. This method brings together advanced signal processing algorithms and spectrograms to obtain signal components for activity recognition and respiratory rate monitoring.
Figure 5 shows the system architecture of using the channel state information for monitoring COVID-19 patients.
The WiFi sensing-based channel state information comprises four main steps: (a) extracting raw variances of amplitude information, (b) eliminating the outliers using the Hampel algorithm, applying a bandpass filter having a cutoff frequency from 0.2 GHz to 0.4 GHz to remove random noises recorded through a commodity device, (c) applying principal component analysis (PCA) to obtain different activities of daily living and the corresponding respiratory rate, (d) estimating the abnormal respiratory rate both in the time domain and the frequency domain as experienced by the COVID-19 patients. The 3D waveform in
Figure 3 indicates the variances of the amplitude information against the total number of subcarriers and time history.
CSI signal processing consists of the following steps: (1) obtaining the CSI signal magnitude; (2) removing outliers by the Hampel identifier (Liu, Cao, Tang, Wen, and Wi-sleep, 2014) and using a bandpass filter with cutoff frequencies of 0.2 Hz and 0.4 Hz to suppress the noises; (3) exploiting PCA to obtain the breathing rate frequency contribution, then using a short-time Fourier transform to obtain the time–frequency spectrogram to extract the instantaneous frequency of the respiration rate (RR); (4) estimating the abnormal respiratory rate contributions in both the time and frequency domains to monitor the COVID-19 patients.
The proposed system works as follows, as indicated in
Figure 5: The first step is to collect data using WiFi sensing; the raw data are then processed using advanced signal processing algorithm, and random noise is remove, such as external noise and outliers. Using principle component analysis, initially, large-scale body movements such as the activities of daily living are extracted to examine the physical activities of a monitored COVID-19 patient. Then using the STFT, the respiratory rate is extracted for detection purposes.
The initial stage of channel state information raw data processing is to eliminate the interference that occurs due to noise. Different activities and a sudden change in respiratory rate can be experienced by COVID-19 patients due to an external movement such as an operational ceiling fan. We applied the Hampel filtering algorithm to mitigate the impact of a sudden change in amplitude information. The outlier noise is then replaced by the average value of neighboring values, before and after the eliminated value. The Hampel filter algorithm also has the potential to eliminate the invalid or empty channel state information packets retrieved by the network interface card. After completing the elimination of noisy signals from raw CSI data, the bandpass filter is also used to only pass on the values of signals that are required to extract a particular respiratory rate. The COVID-19 patient respiratory rate is essentially the subtle chest movement from which the application of a bandpass filter can efficiently and reliably remove high-frequency noise from CSI data. We used a bandpass filter in the frequency range of 0.2 Hz to 0.4 Hz, which is the traditional frequency range of the human breathing rate.
As mentioned earlier, the raw channel state information carries multiple frequency subcarriers (30 in this case), and human activities can be found at a lower frequency range since these are large-scale body movements. However, due to the high-low wavelength of higher frequencies, the range resolution also increases; hence, the high dimensions of CSI matrices carry the breathing rate of COVID-19 patients. To extract the breathing rate, we used PCA methods, which are essentially the space projection of the data. In this context, the expression used for human activities’ recognition and the respiratory rate of subjects can be written as
f(
t), which is defined as summing up all values of RF signal oscillations.
Here, the value of indicates the variation in amplitude CSI in terms of power level in dB, is the random phase offset of the CSI data derived from the intermediate frequency value (IF), which is mathematically expressed as and shows as the periodic RF signal having a zero mean function along unity function as in , shows the slow moving average value of the smooth function, while is the external noise picked up by the low-cost network interface card.
In order to remove the intermediate frequency values from COVID-19 patients using time–frequency analysis, we used the STFT on raw amplitude information of the CSI data against time history. The STFT along with its parameters used in this work can be mathematically expressed as follows [
44,
45]:
In Equation (8), the value of
h is the time window function of the CSI data obtained using WiFi sensing and
t denotes the total time taken to record the data over a period of time. The value
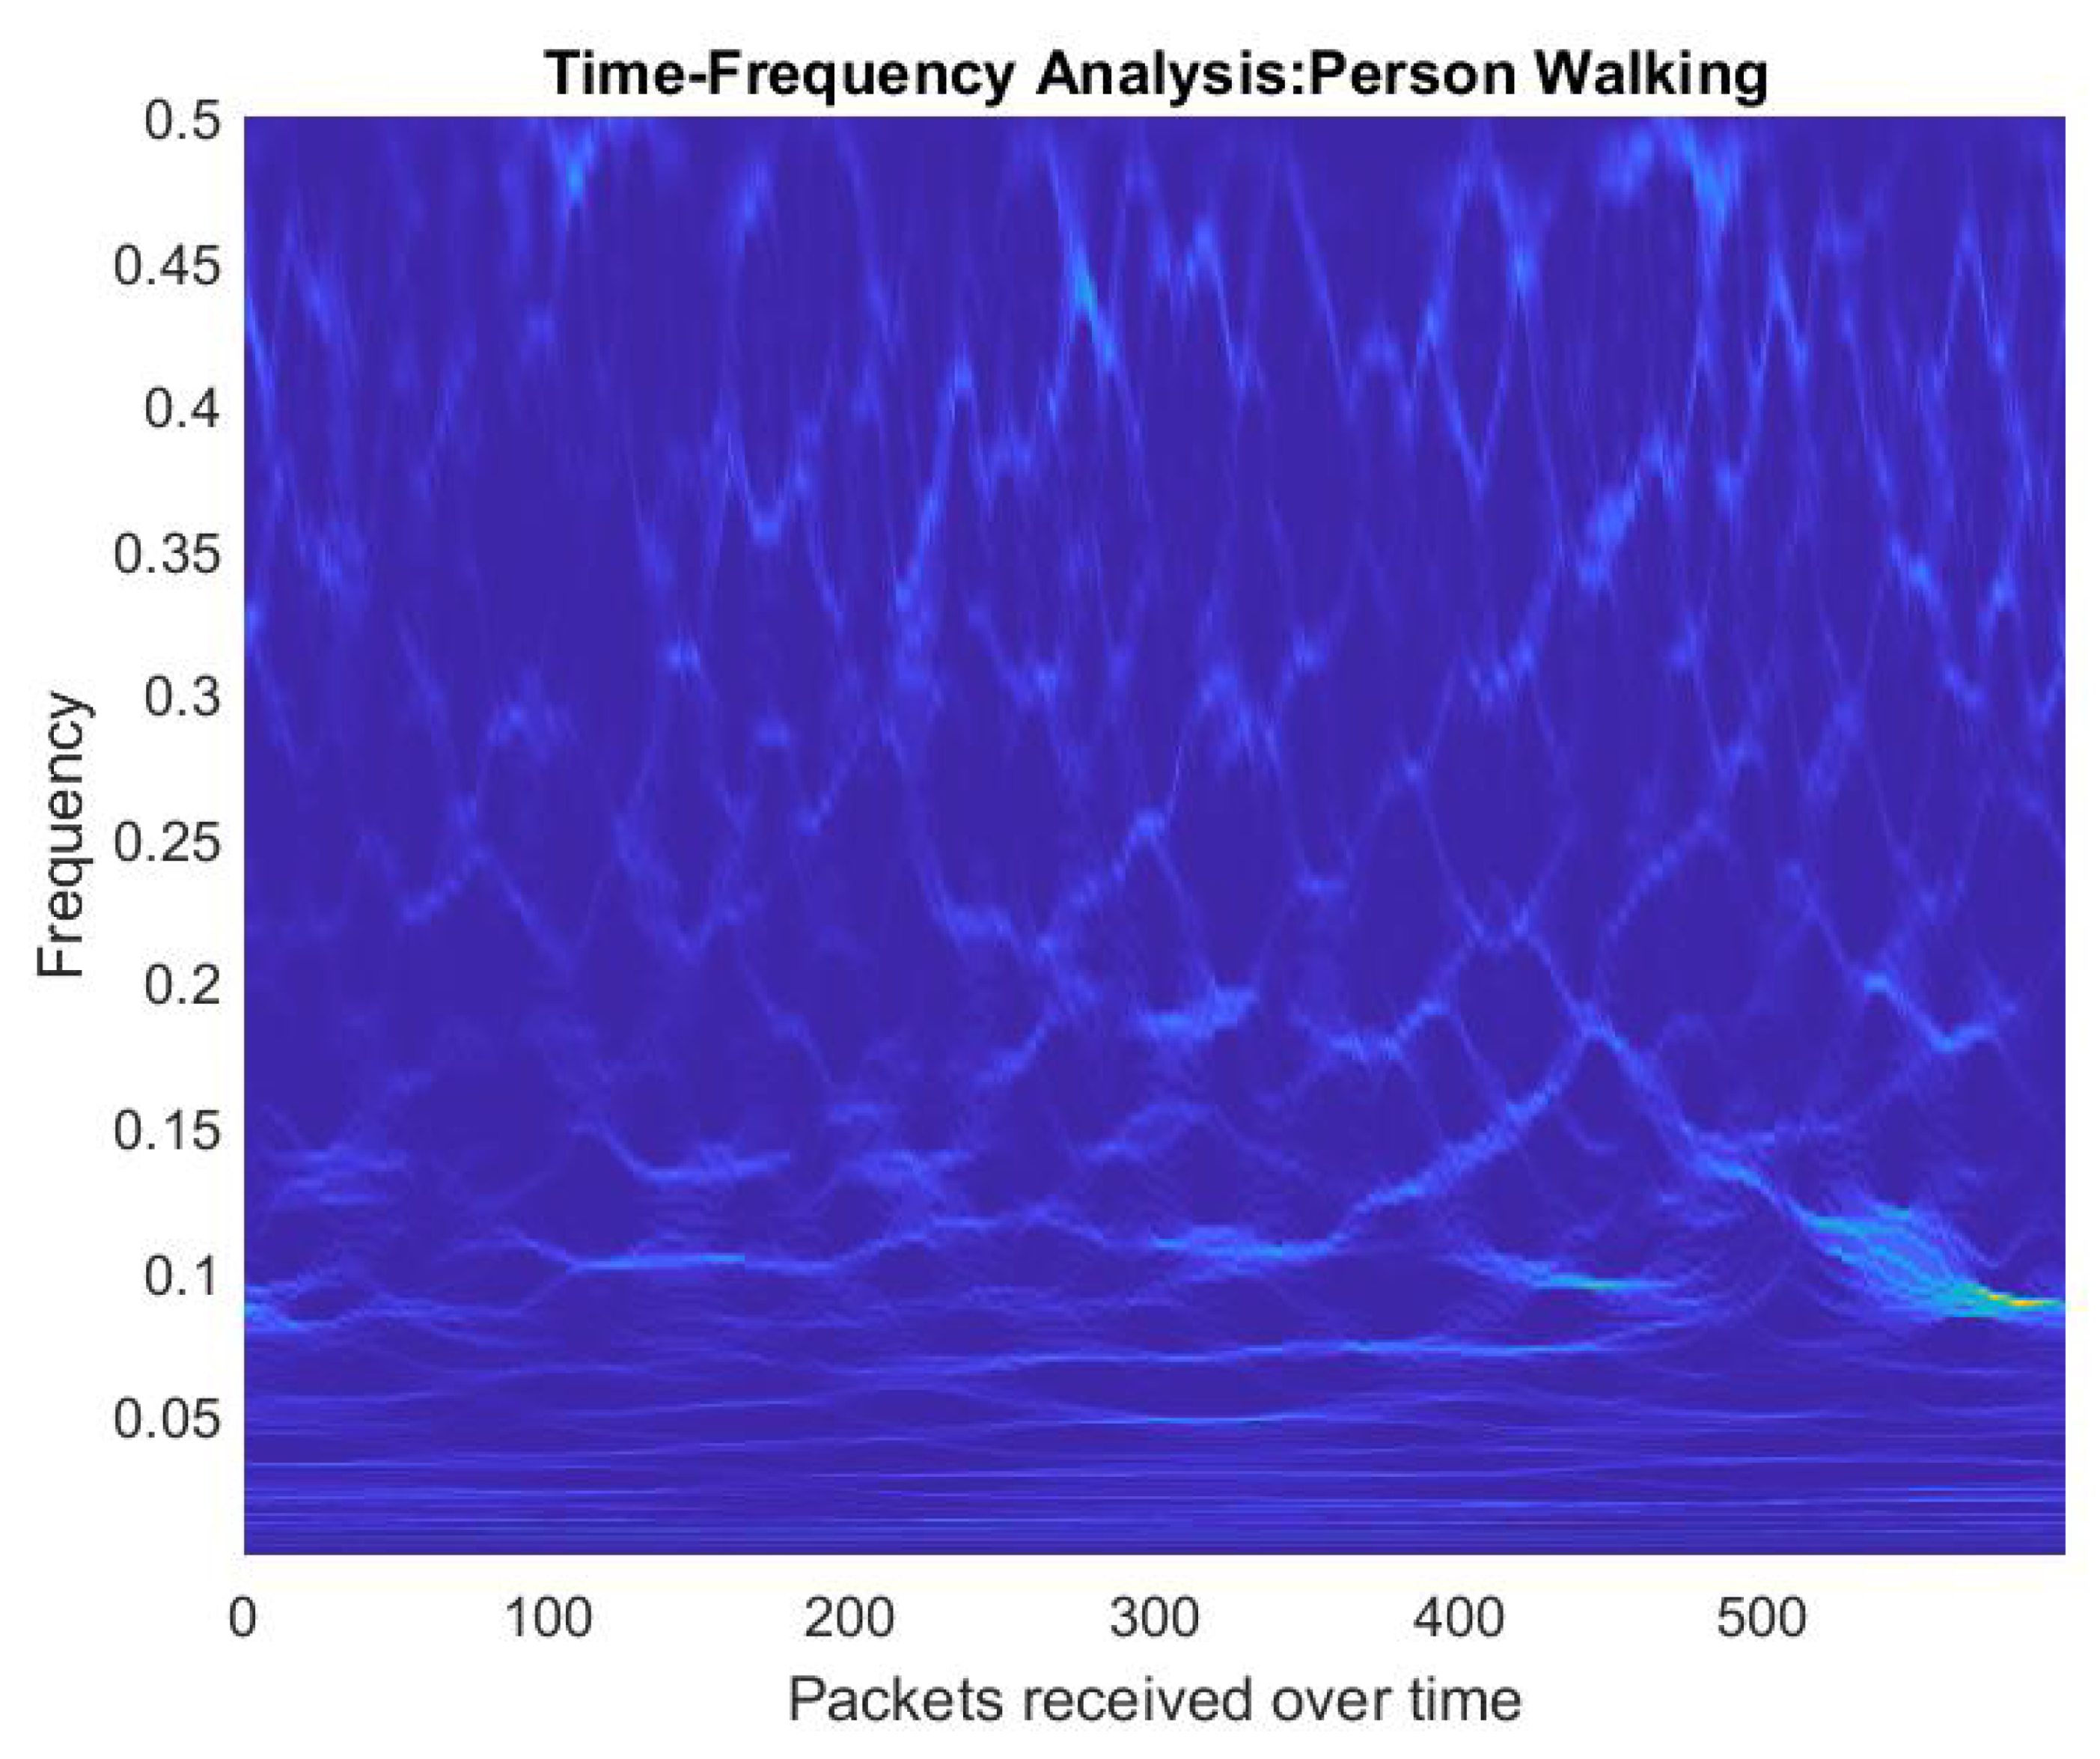
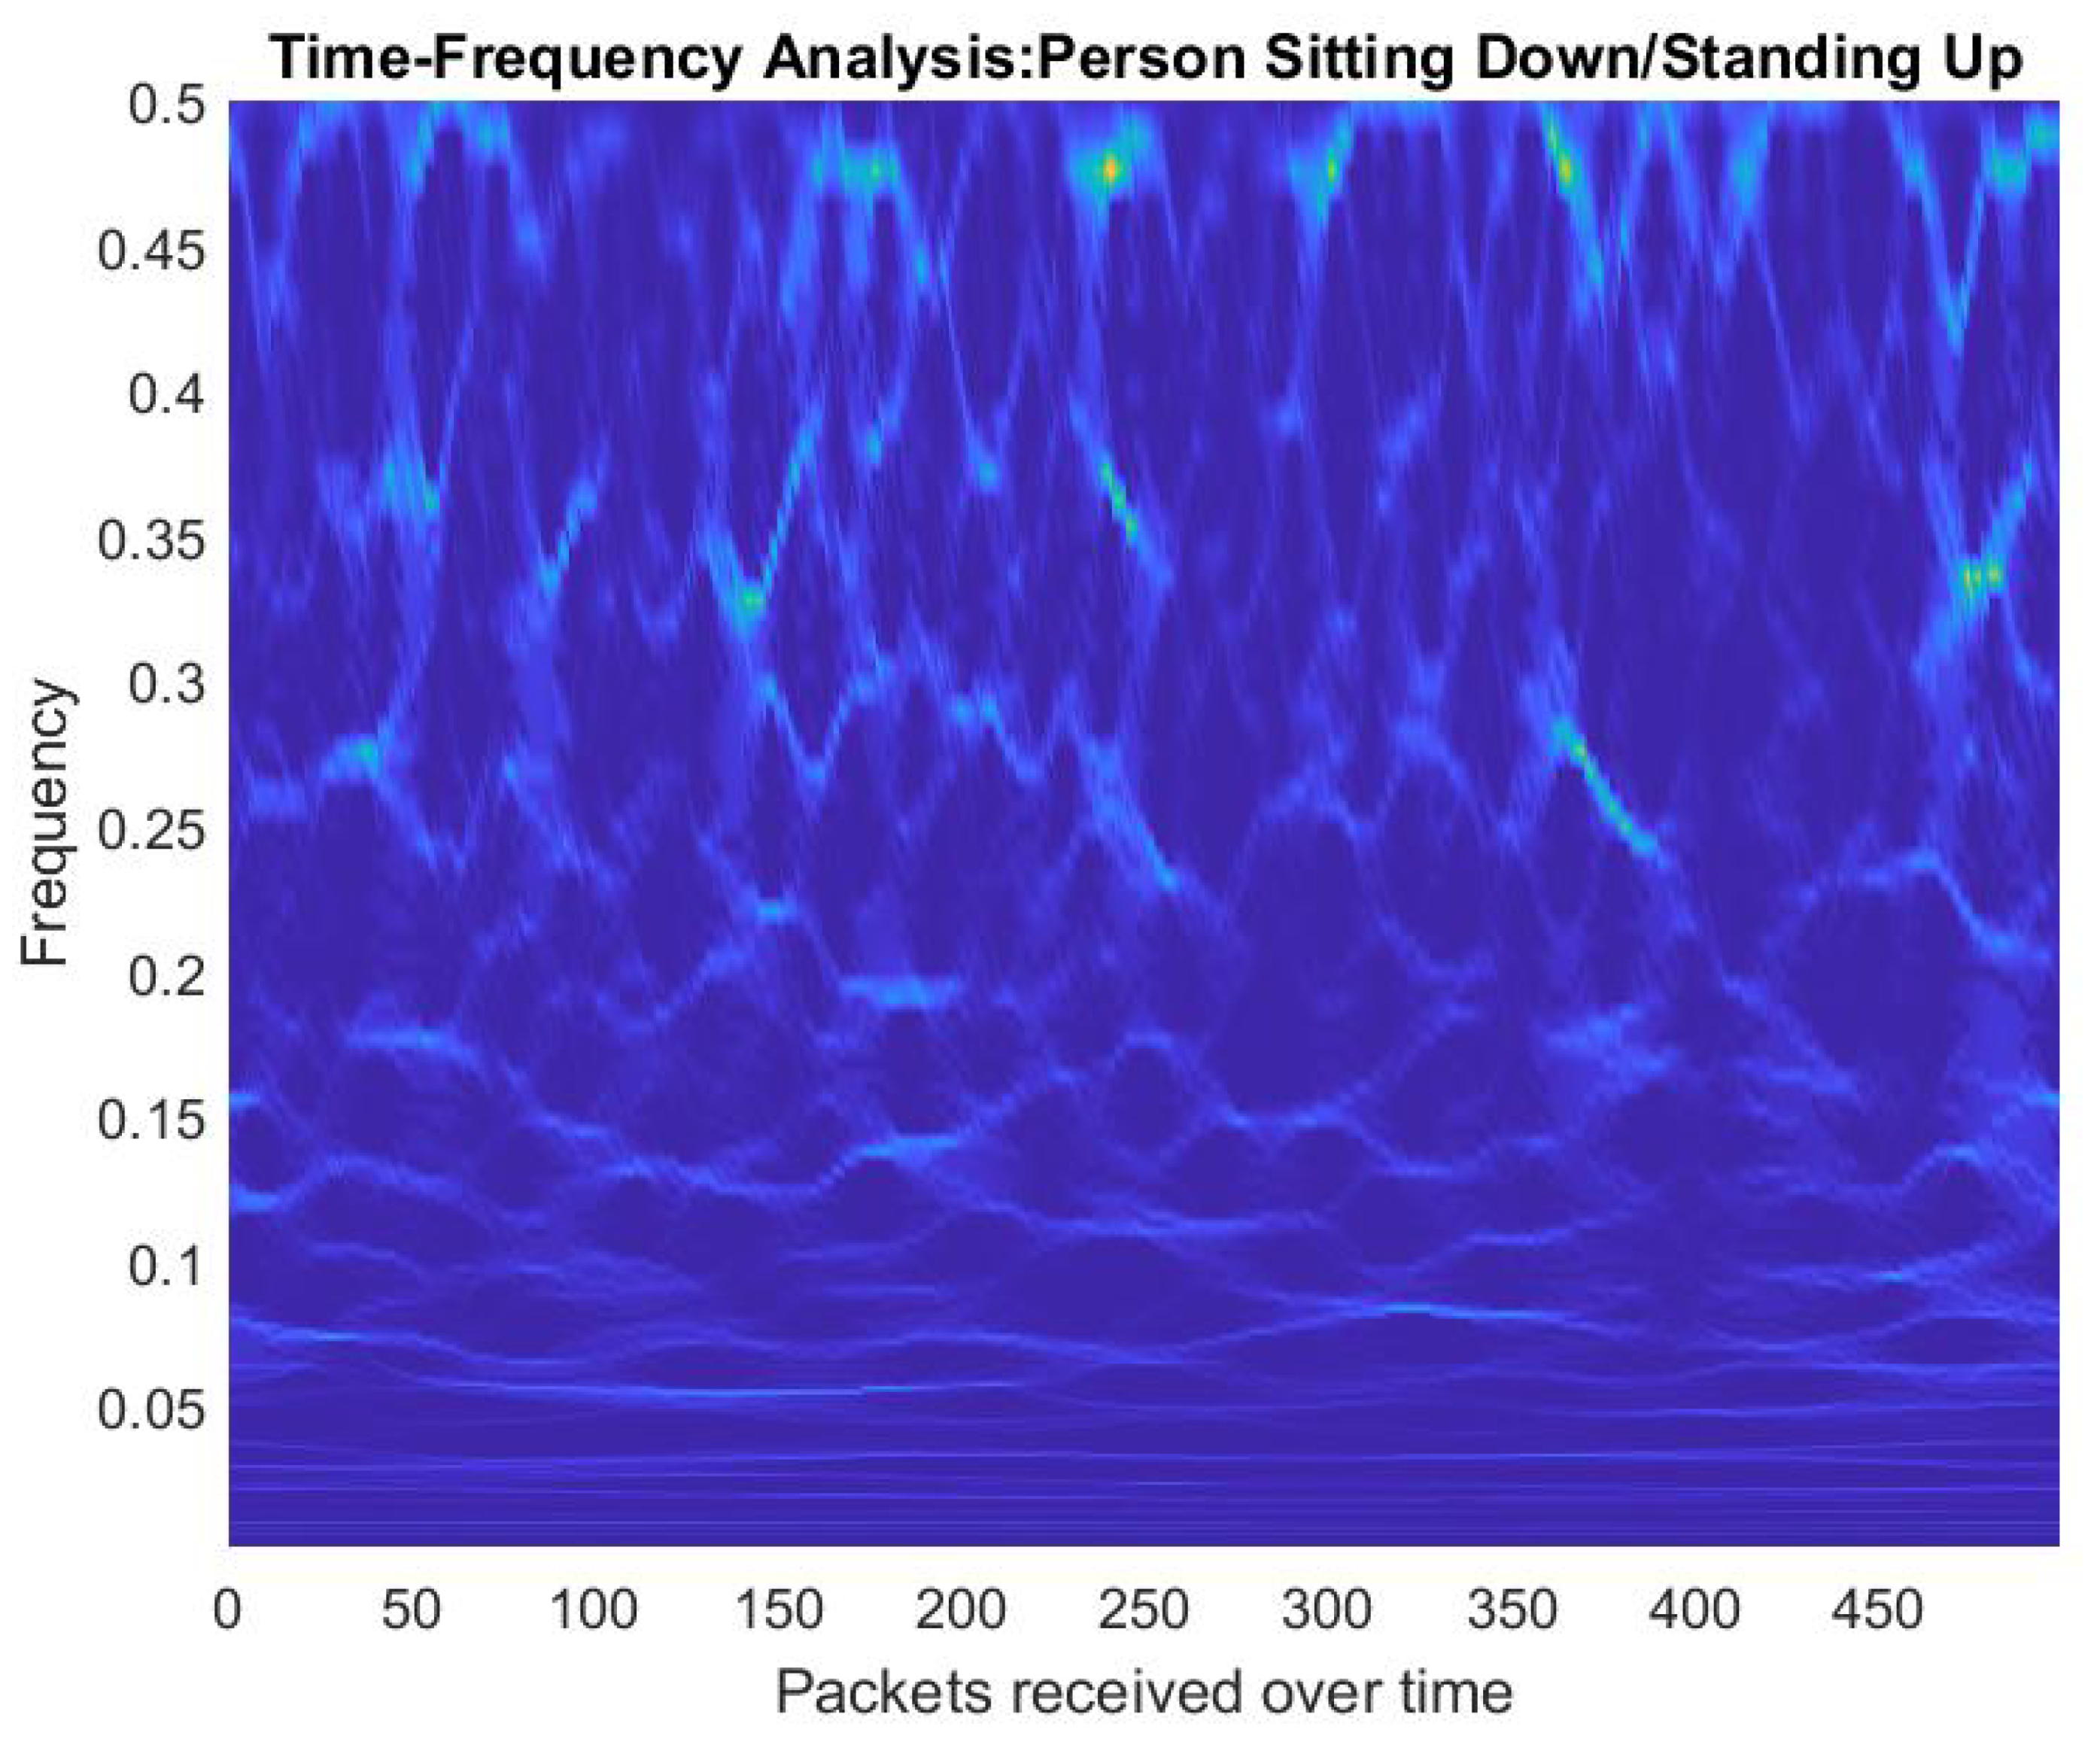
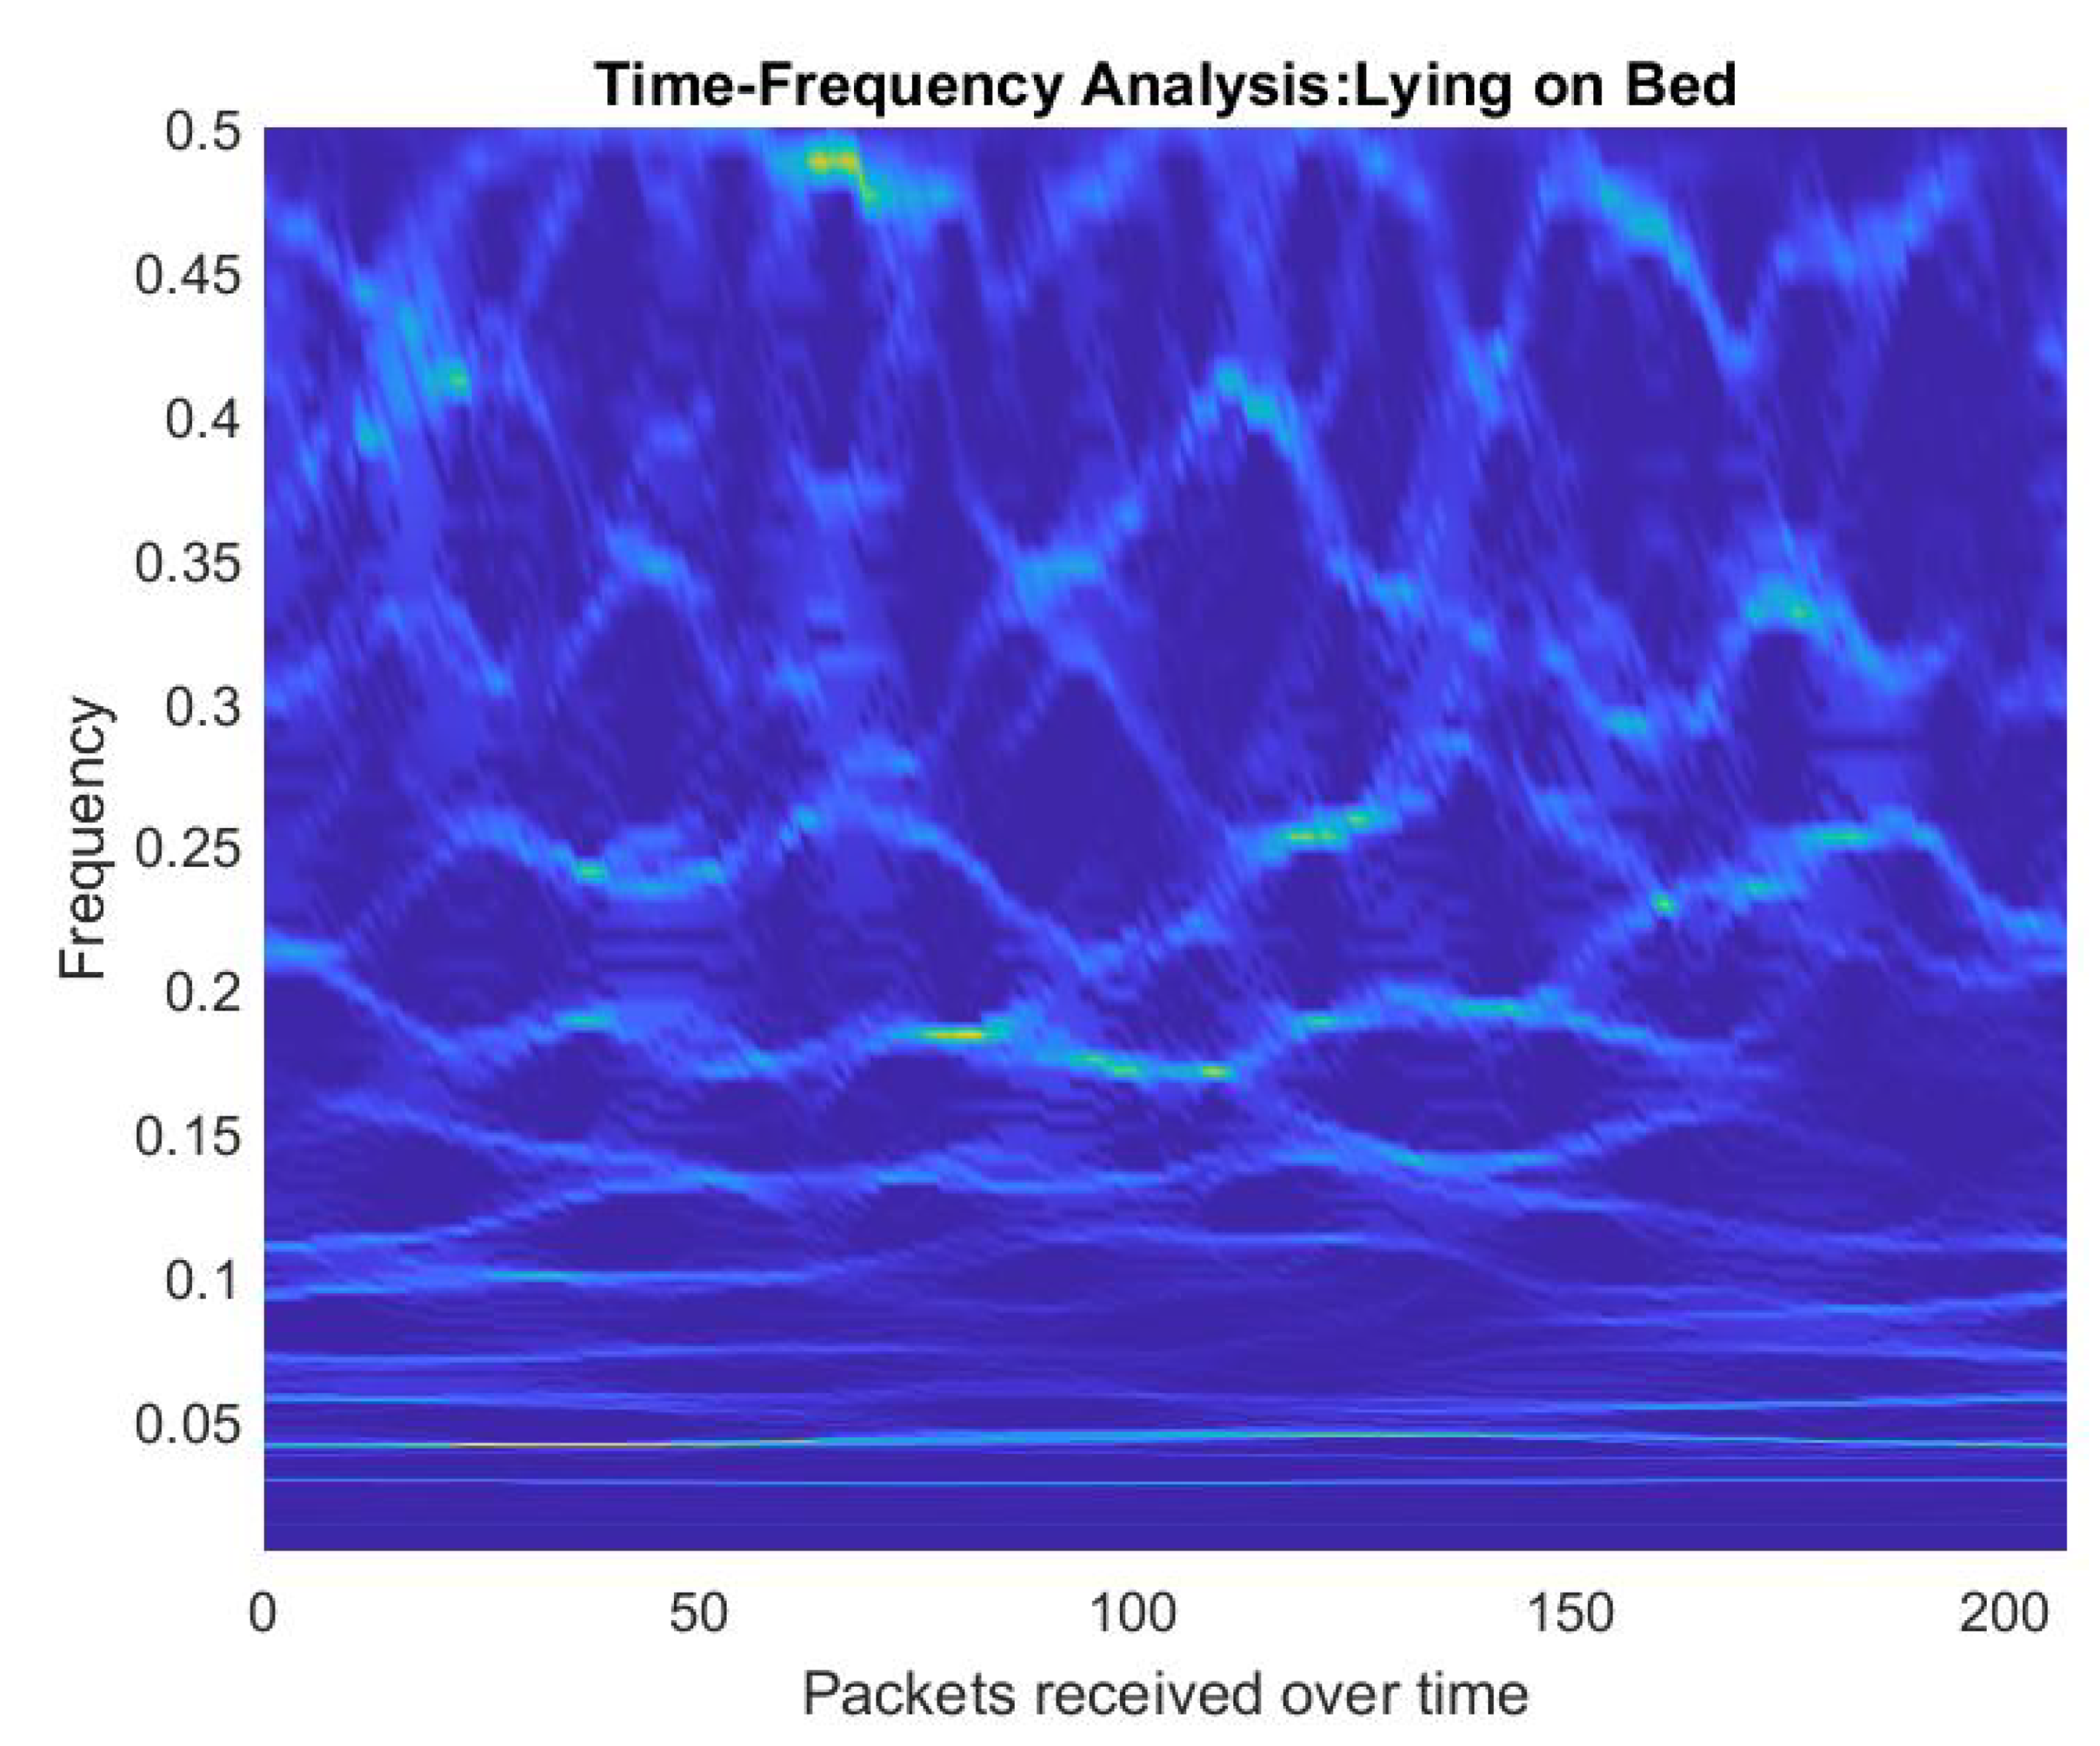
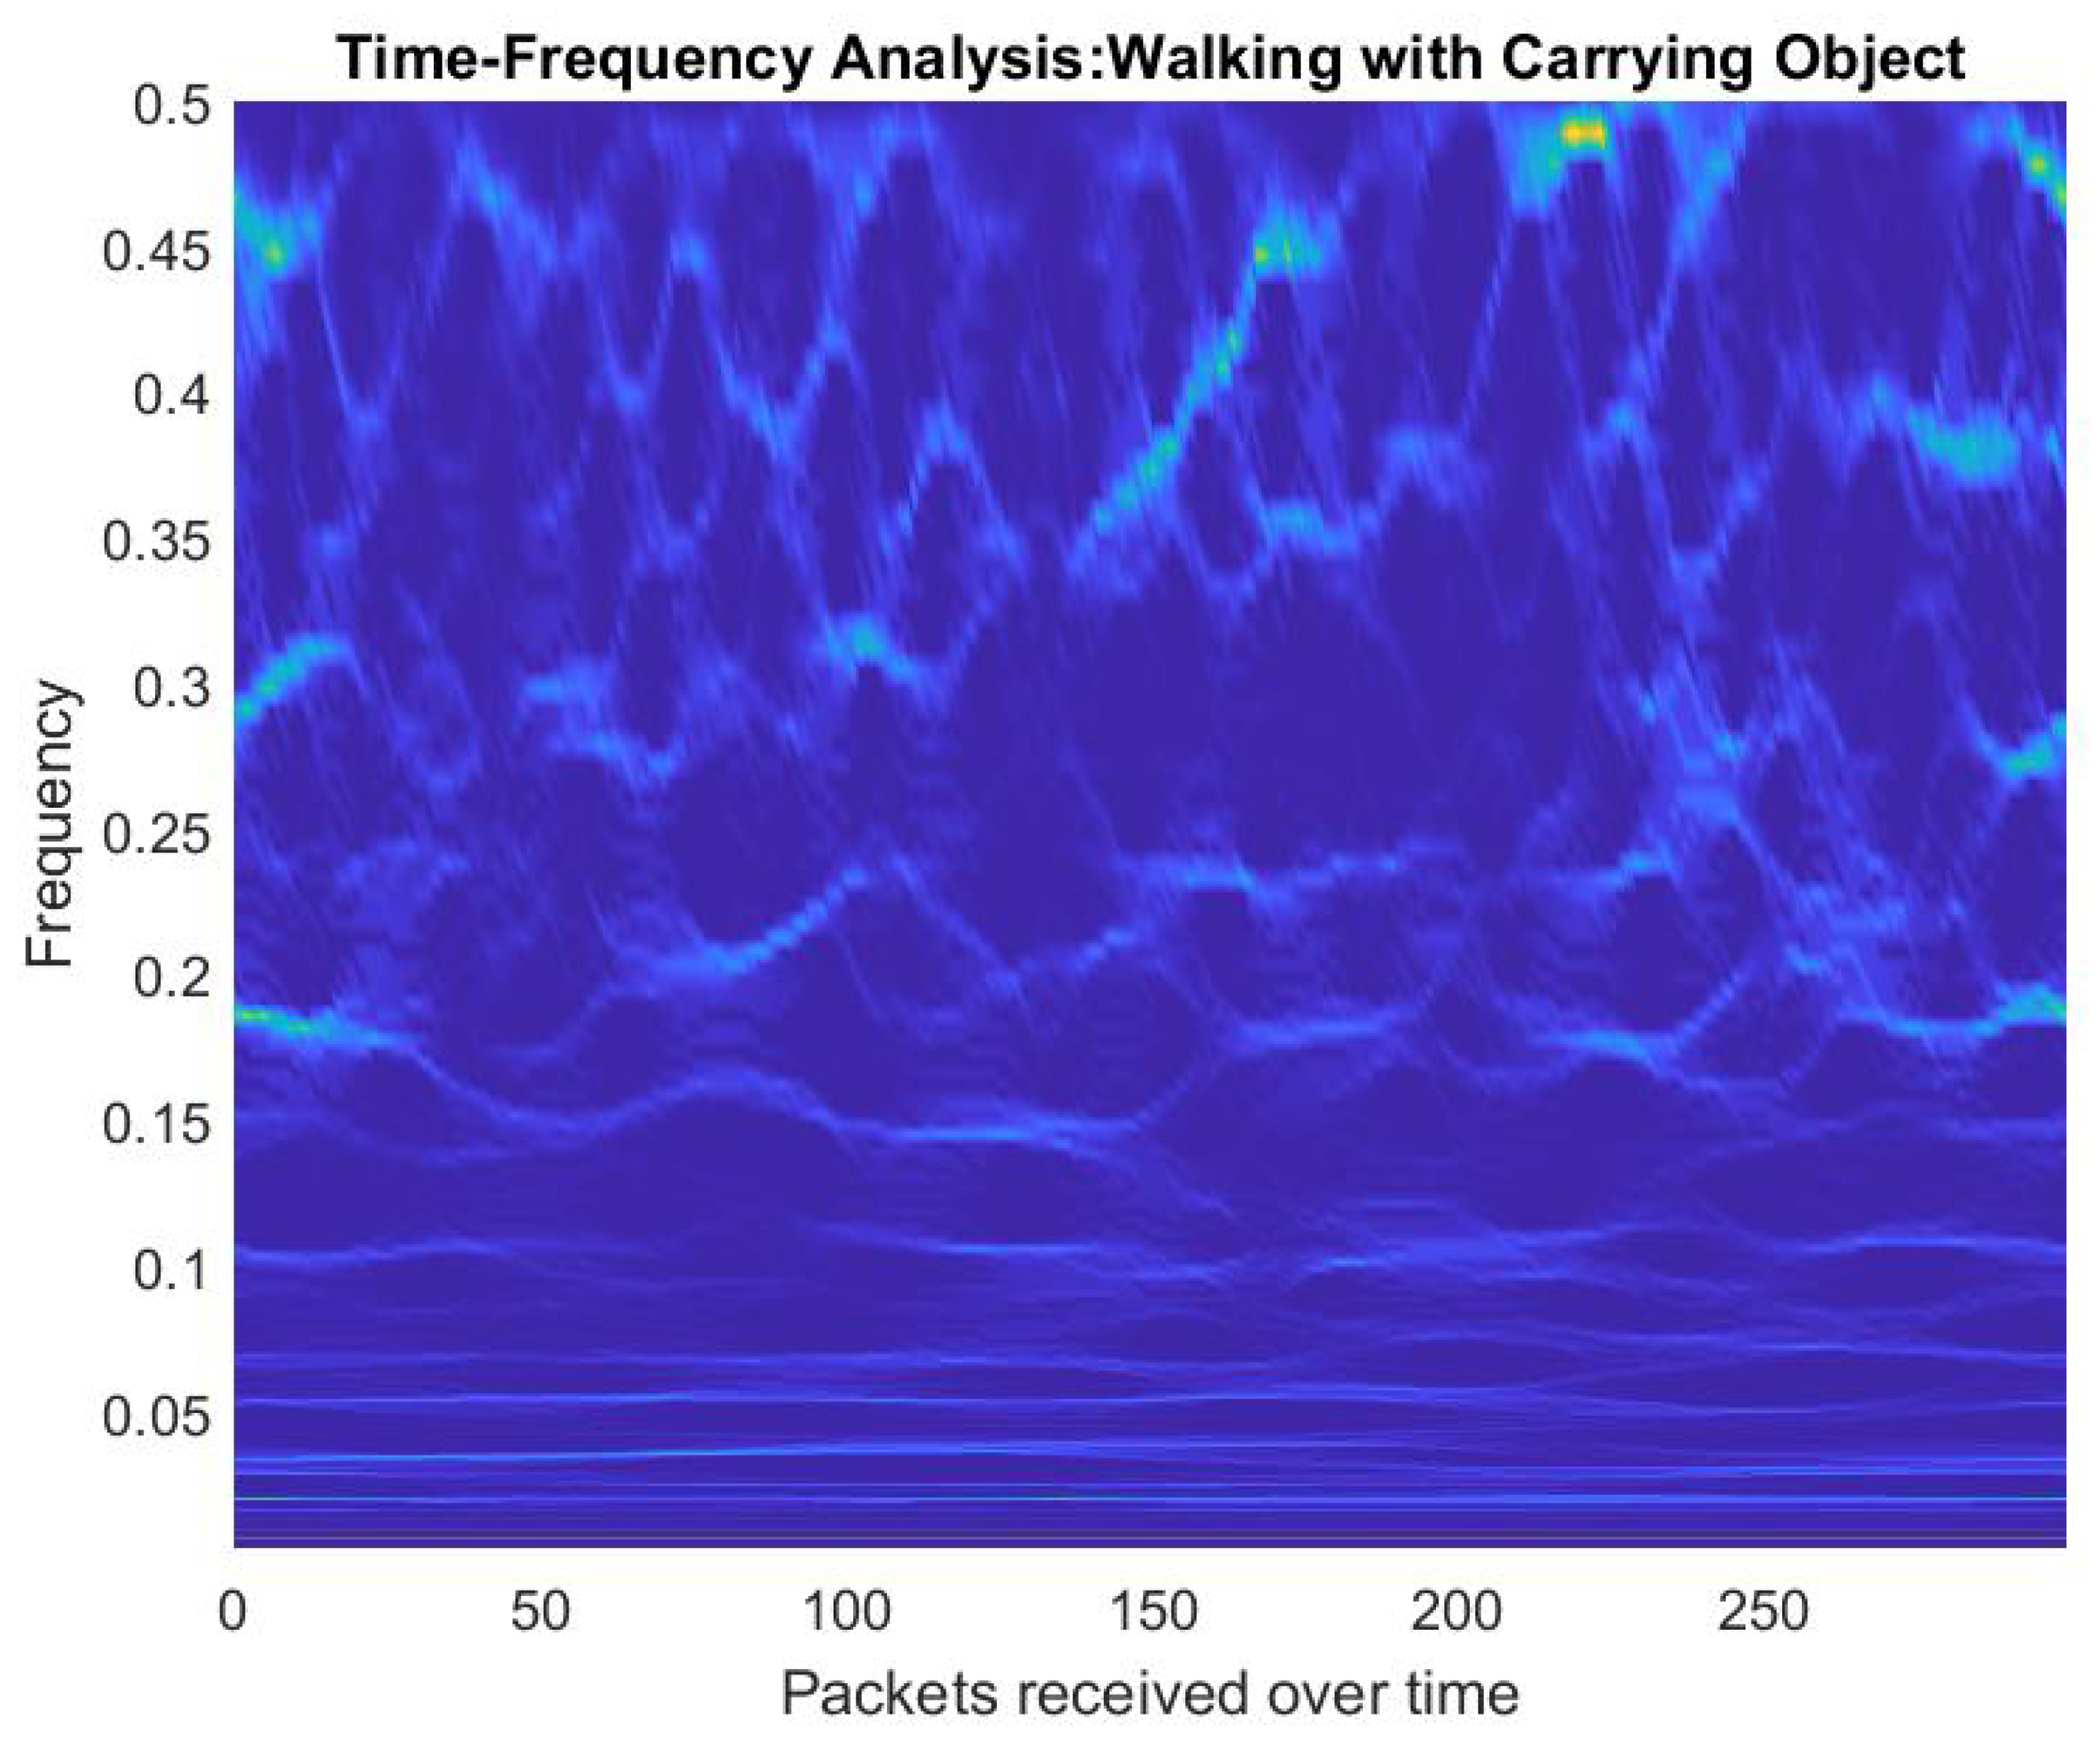
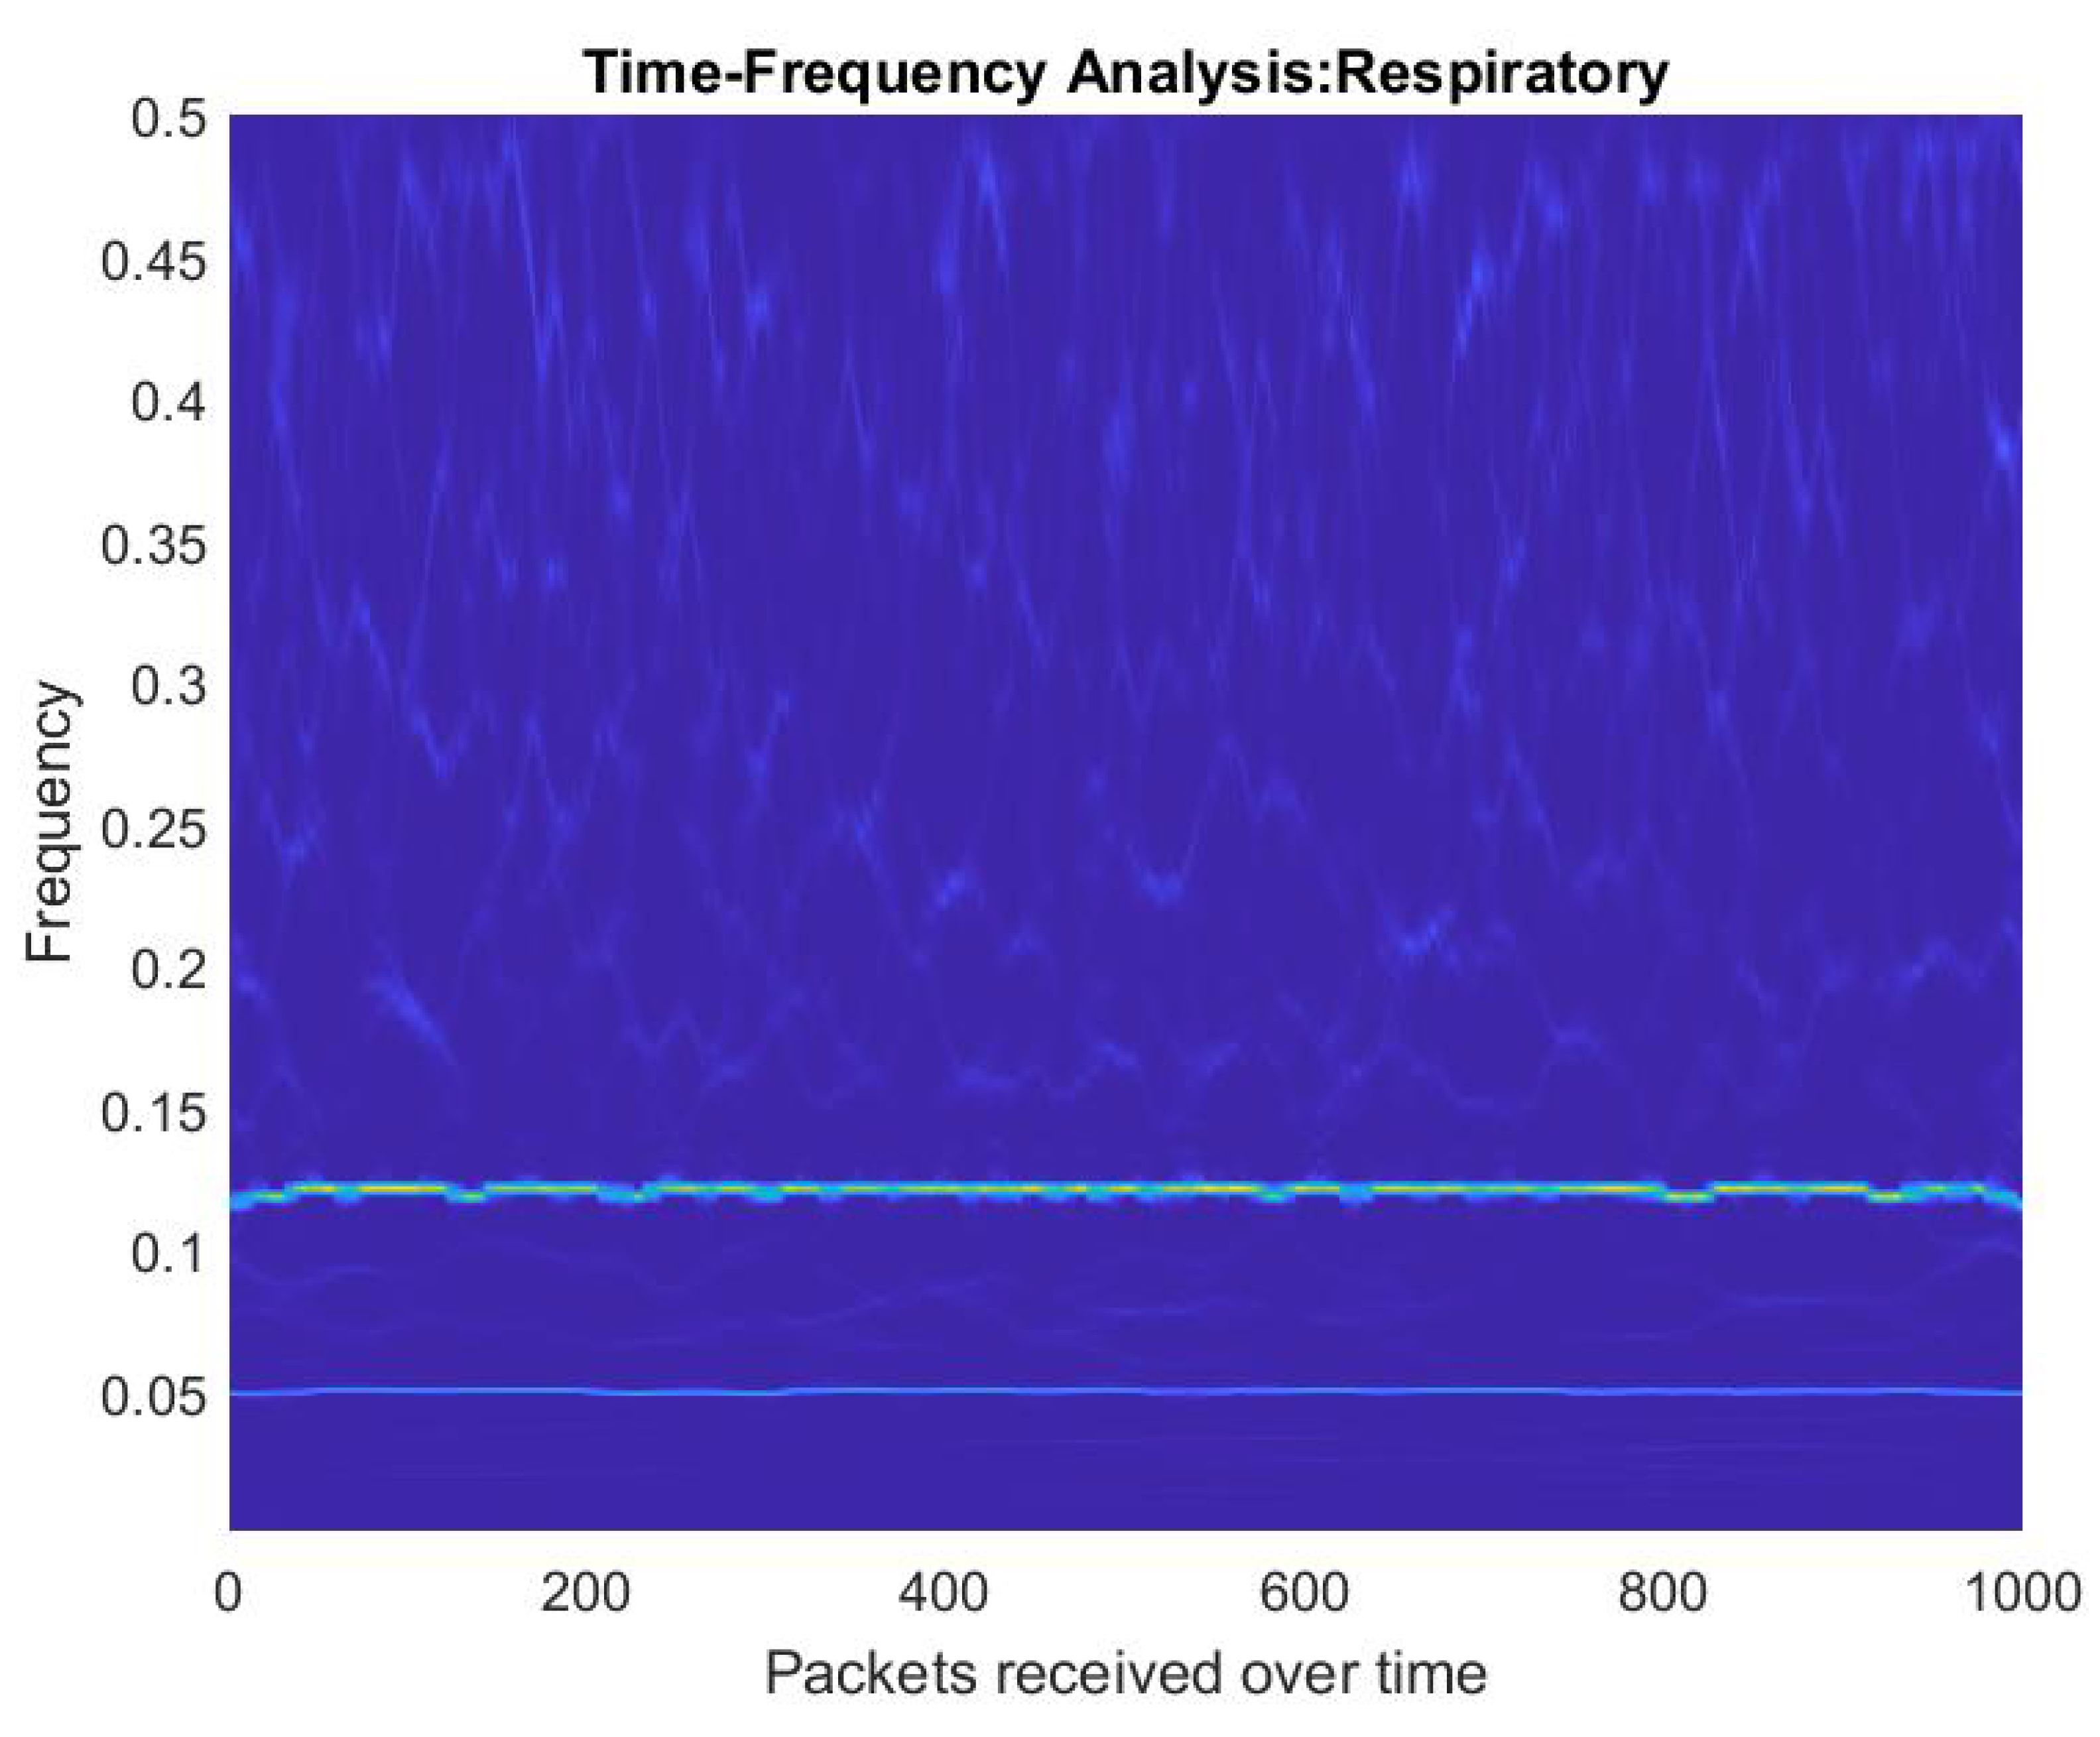
describes the operating frequency (i.e., 2.45 GHz). This equation expresses that the moving time window and STFT, when applied on the CSI data considering the amplitude information, give us the spectrograms that are expressed in terms of time vs. frequency, as shown in
Figure 6,
Figure 7,
Figure 8,
Figure 9 and
Figure 10. These figures indicate when a person was walking back and forth within WiFi range in an indoor environment.
6. Encrypted-WiFi-Based Time–Frequency Spectrograms
The spectrogram shown in
Figure 6,
Figure 7,
Figure 8 and
Figure 9 contains sensitive personal information, and an attacker could possibly hack this information and send false alarms. In this section, an encryption scheme is presented to a secure spectrogram obtained from WiFi data. The proposed encryption scheme contains both confusion and diffusion steps. A general mathematical notation is written as:
where
C and
I are ciphertext and plaintext images,
and
are functions of the confusion and diffusion processes,
and
are the confusion and diffusion secret keys, and
and
show the number of rounds for confusion and diffusion in total encryption, respectively. In the literature, one-dimensional maps such as logistic, tent, and sine maps have been applied in confusion and diffusion processes to obtain a ciphertext image. Mathematically, a logistic map is written as [
46]:
where
and
are the initial conditions. A tent map is written as:
where
and
are the initial conditions. Mathematically, a sine map is:
where
and
are the initial conditions.
However, due to a lower chaotic range and several other disadvantages, one-dimensional maps such as logistic, tent, and sine maps have serious security flaws. For example, the bifurcation diagram of a logistic map shown in
Figure 11 highlights that the logistic map has a lower chaotic range of (3.57, 4). Therefore, instead of using a traditional logistic map, hybrid maps were proposed in [
47]. In this research, we also used hybrid maps (logistic-tent, logistic-sine, and tent-sine maps) due to the larger key space and initial condition sensitivity. The detailed encryption steps are given below.
6.1. Encryption Steps
This section presents the proposed encryption scheme for a spectrogram. Without loss of generality, consider the size of the spectrogram as . Split the corresponding plaintext spectrogram into red, green, and blue channels. The encryption steps are as follows:
Step 1: Apply the Secure Hash Algorithm (SHA 3) on the plaintext channel to obtain hash
H.
Step 2: Convert hash values
H into binary bit representation form
B;
Step 3: Generate initial conditions for a logistic-tent map, logistic-sine map, and tent-sine map, respectively. Mathematically, a logistic-tent map is written as:
where mod is the modulus operation and
and
are the initial conditions. Now, calculate
and
using the binary bits obtained from Step 2.
The logistic-sine map is written as:
where
and
are the initial conditions. Calculate initial condition
:
The tent-sine map is written as:
where
and
are the initial conditions. Calculate
as:
Step 4: Iterate a logistic-tent map and logistic-sine map and times, respectively, where is 30, so that the transient effect is avoided. Save the last M values in Q = [] and the last N values in R = []. Iterate a tent-sine map using times, and save the last N values in S. Apply a rowwise permutation, columnwise permutation, rowwise circular-shift downward using the P, Q, R, and S row matrices to obtain a permuted image . The detailed permutation steps are explained below in the Algorithm 1.
Step 5: For diffusion,
is passed through one of the substitution boxes (S-Boxes) shown in
Table 1,
Table 2 and
Table 3.
is replaced with a single S-box using an intertwining map. The intertwining map is written as:
where
,
, and
are the initial conditions calculated as:
,
and
. Iterate the intertwining map
times. Retain the last three values of
W for the S-Box selection. Apply the step below:
= mod(floor(, 2).
For , , and , S-Box1, S-Box2, and S-Box3 are selected, respectively. The selected S-Box is applied on to obtain ;
Step 6: Finally, perform an XOR operation on using the values obtained from V.
= mod(floor(, 256)
= ⊕;
Step 7: Repeat Steps 1 to 6 for each, and then, combine all three channels to obtain the resultant ciphertext C.
| Algorithm 1 Permutation steps |
Input: Plaintext image P, Q, R, S
Output: Shuffled image
% Firstly, sort Q values from low to high
= Sort(Q) fordo for do if ==Q(j) then = j end if end for end for %Shuffle corresponding rows using random values obtained in . = Sortrows(, P) % Next, sort R values from low to high = Sort(R) for i=1:N do for j=1:N do if ==R(j) then = j end if end for end for % Shuffle corresponding columns using random values obtained in . P2 = Sortrows(, ) % Finally, use S, floor, multiplication, and the modulo operation to perform circular-shift downward. = Floor() = Modulus(, N) % The columns of are circular-shifted downward times, where , 2, …N. = circshiftdown, )
|
6.2. Security Analyses
Figure 12 shows the encrypted person walking spectrum using the proposed encryption scheme. Through visual inspection, it is evident that the contents are encrypted and an intruder cannot get any ideas about the original spectrogram. However, a visual inspection alone is not sufficient, and security should be proven through statistical analyses [
51].
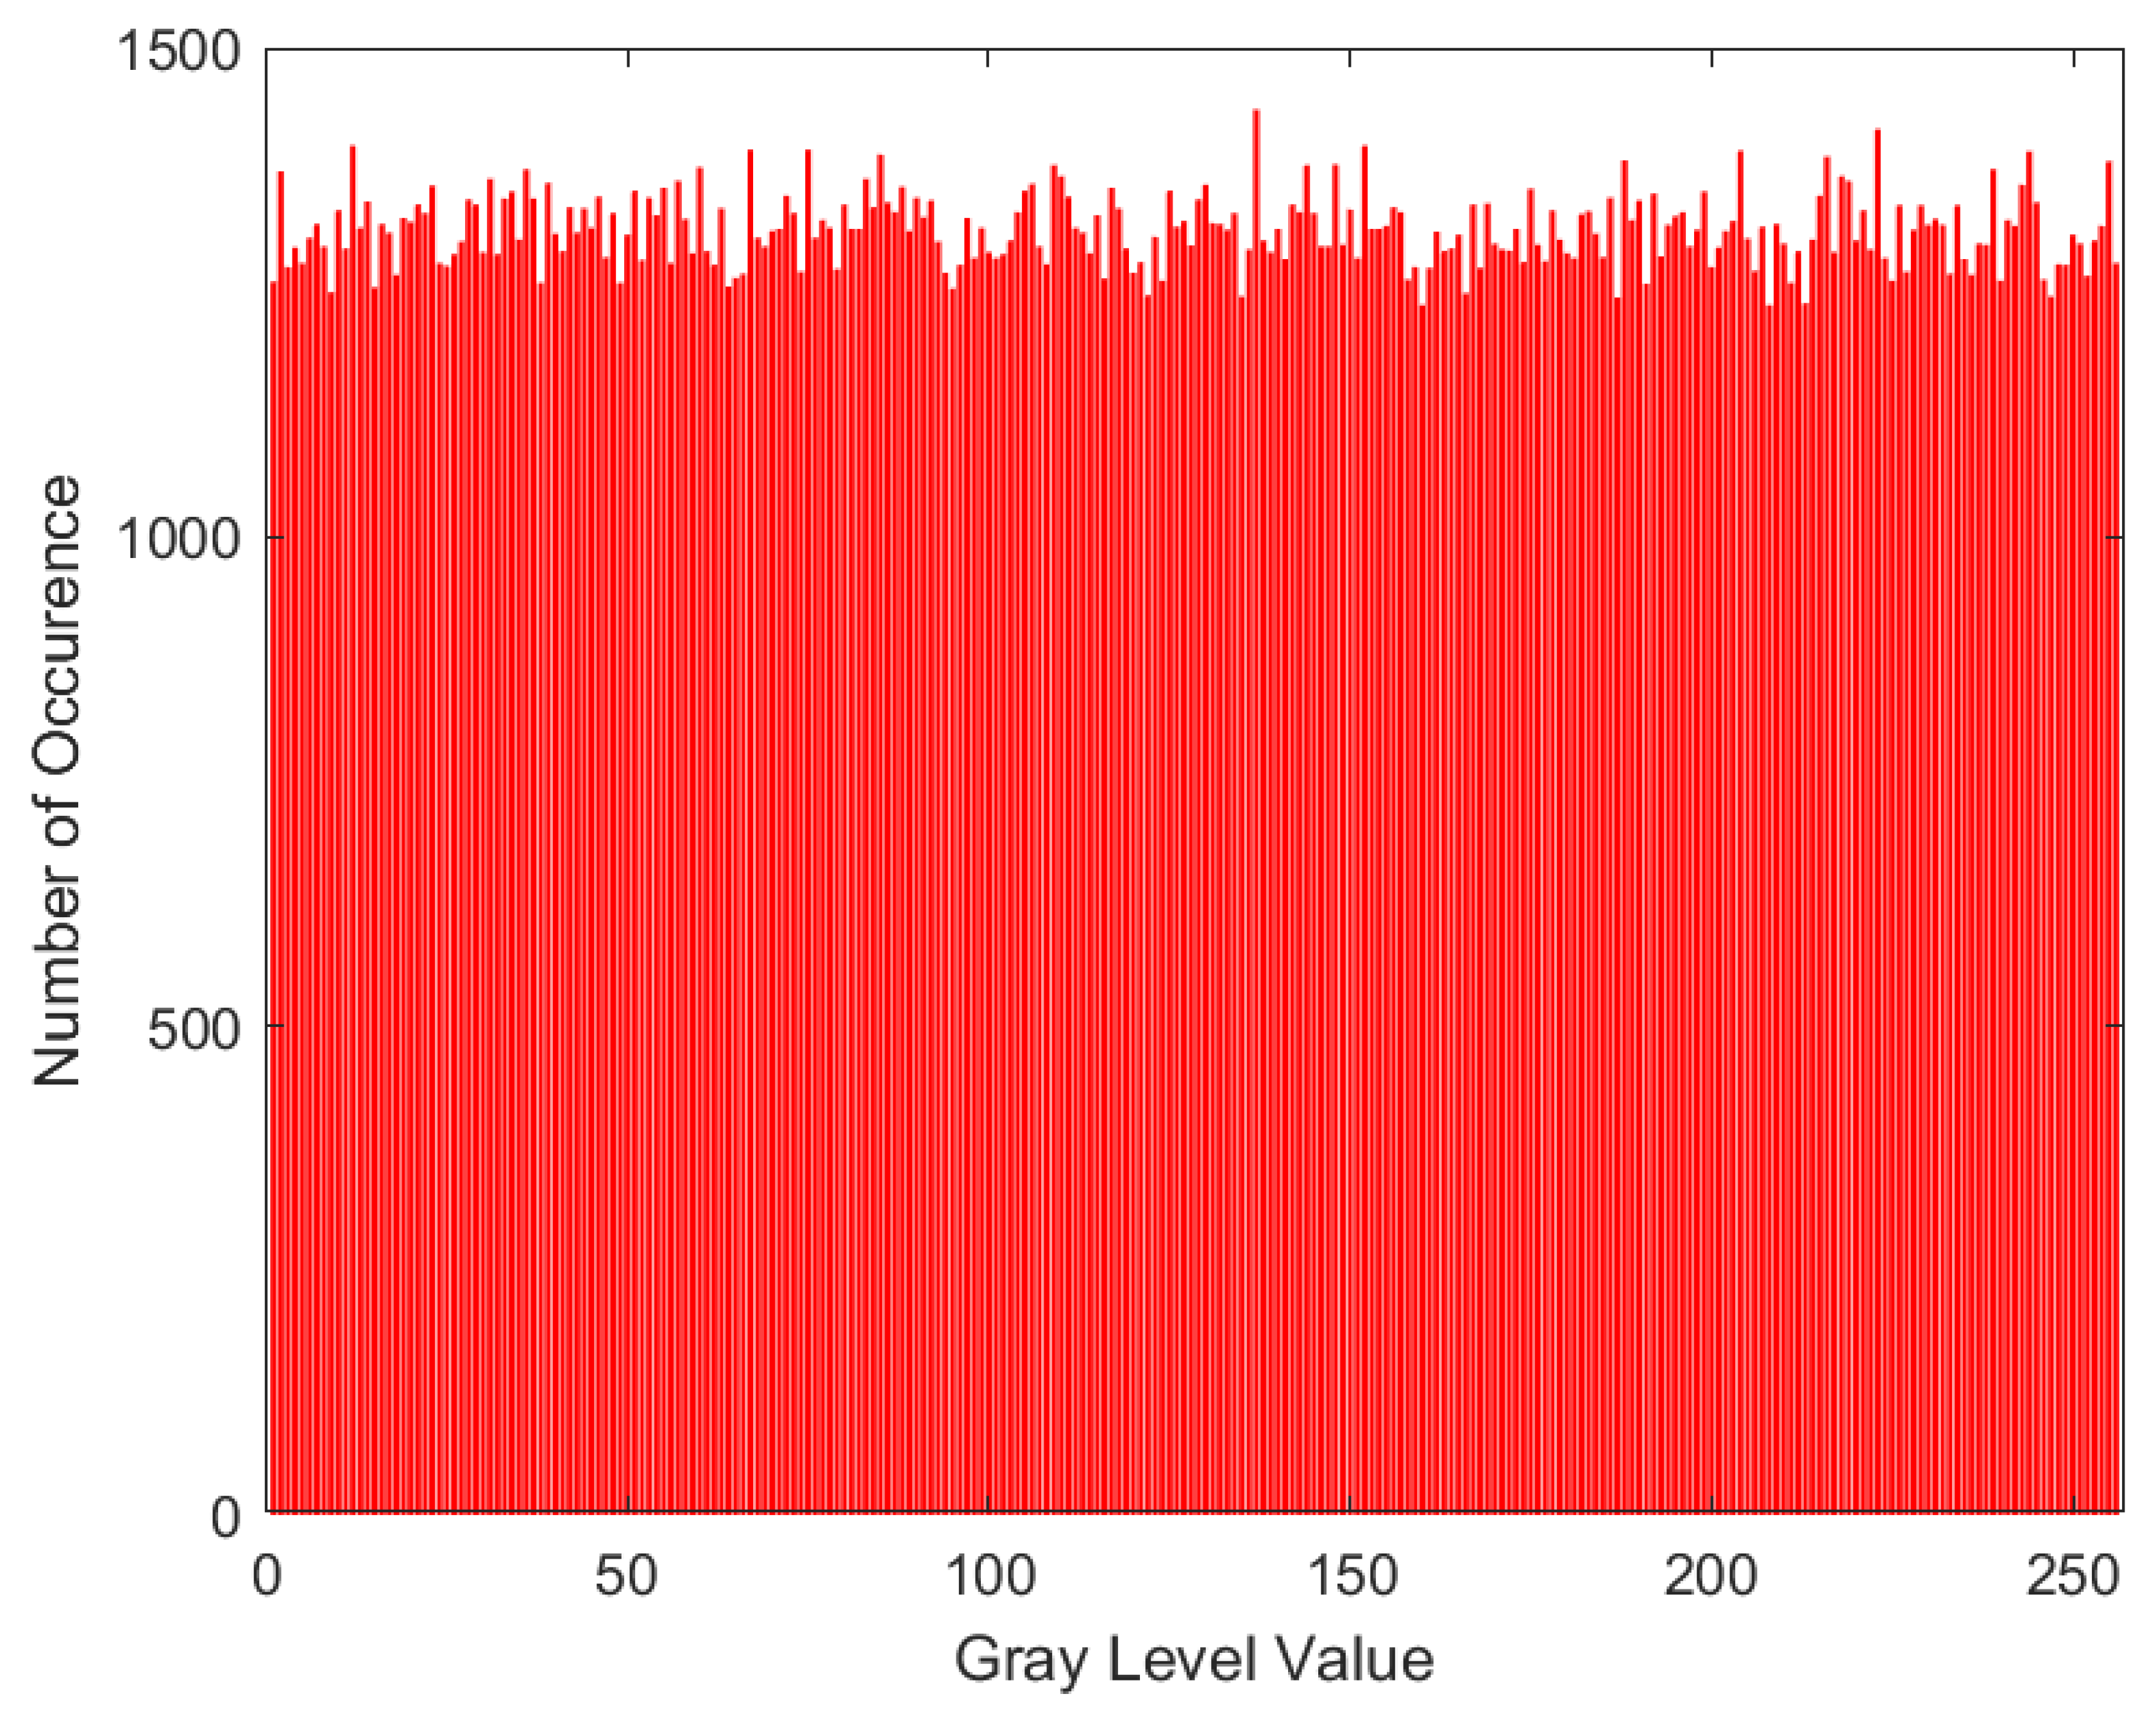
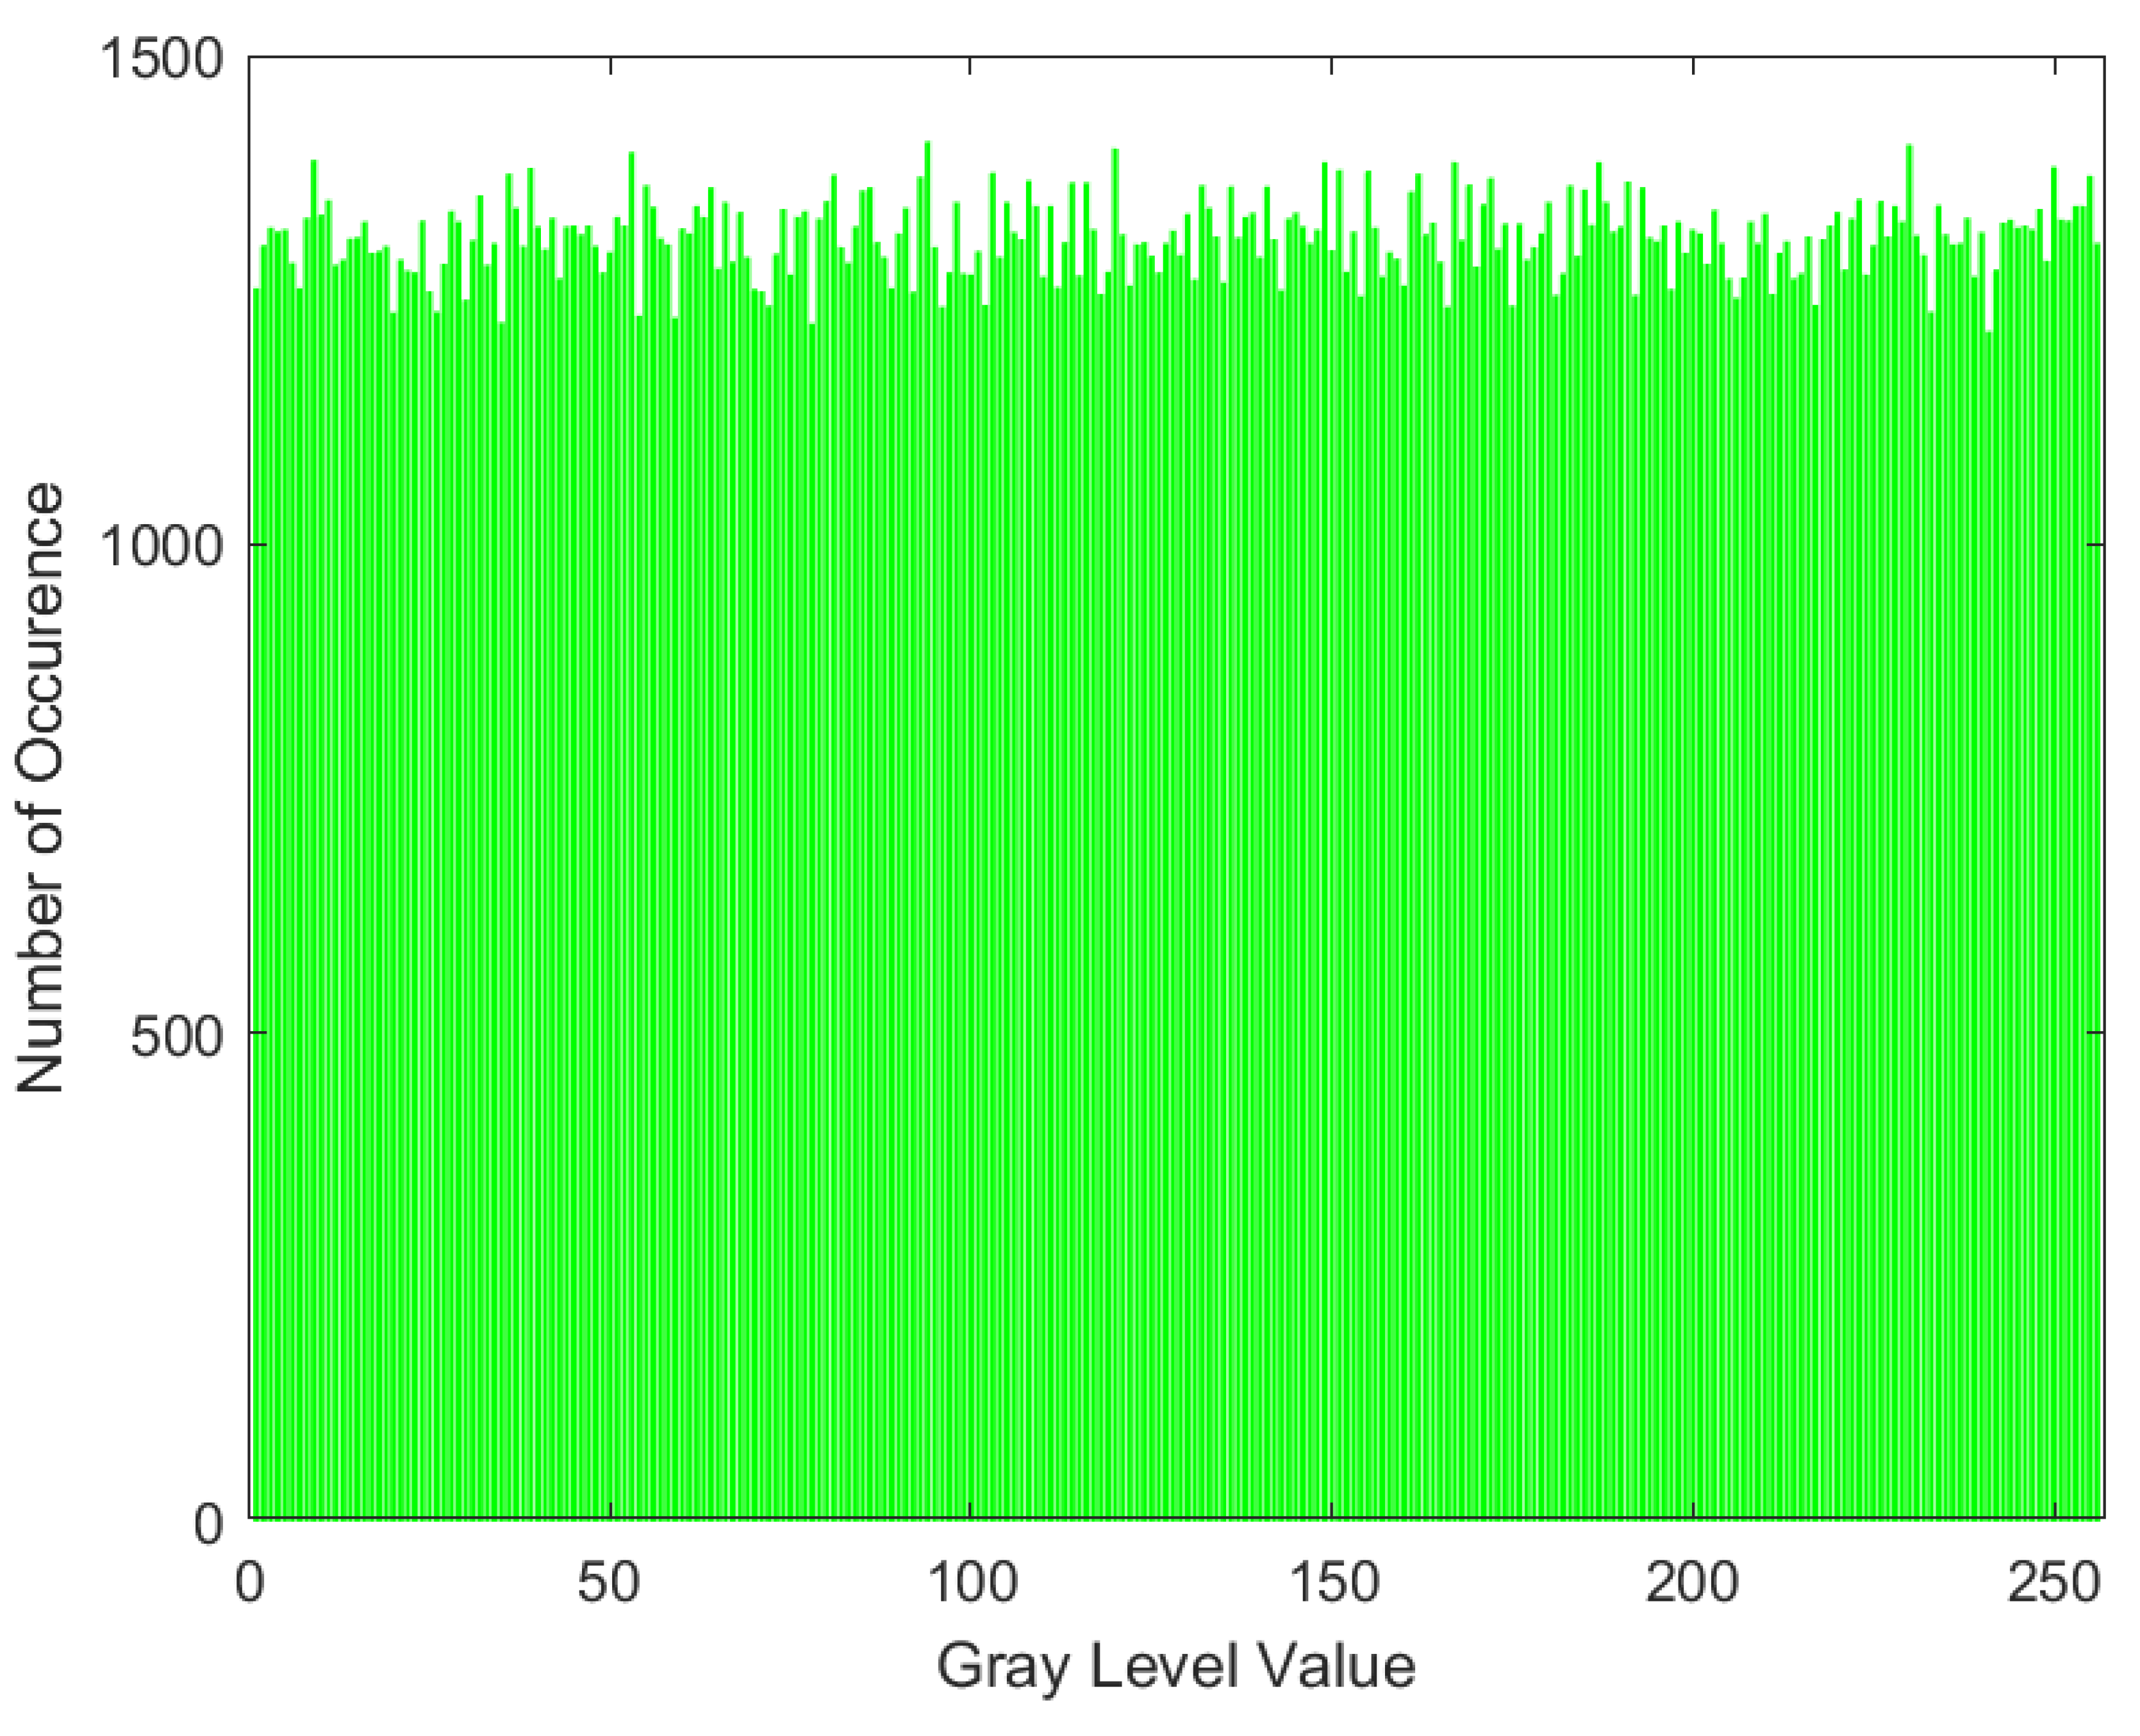
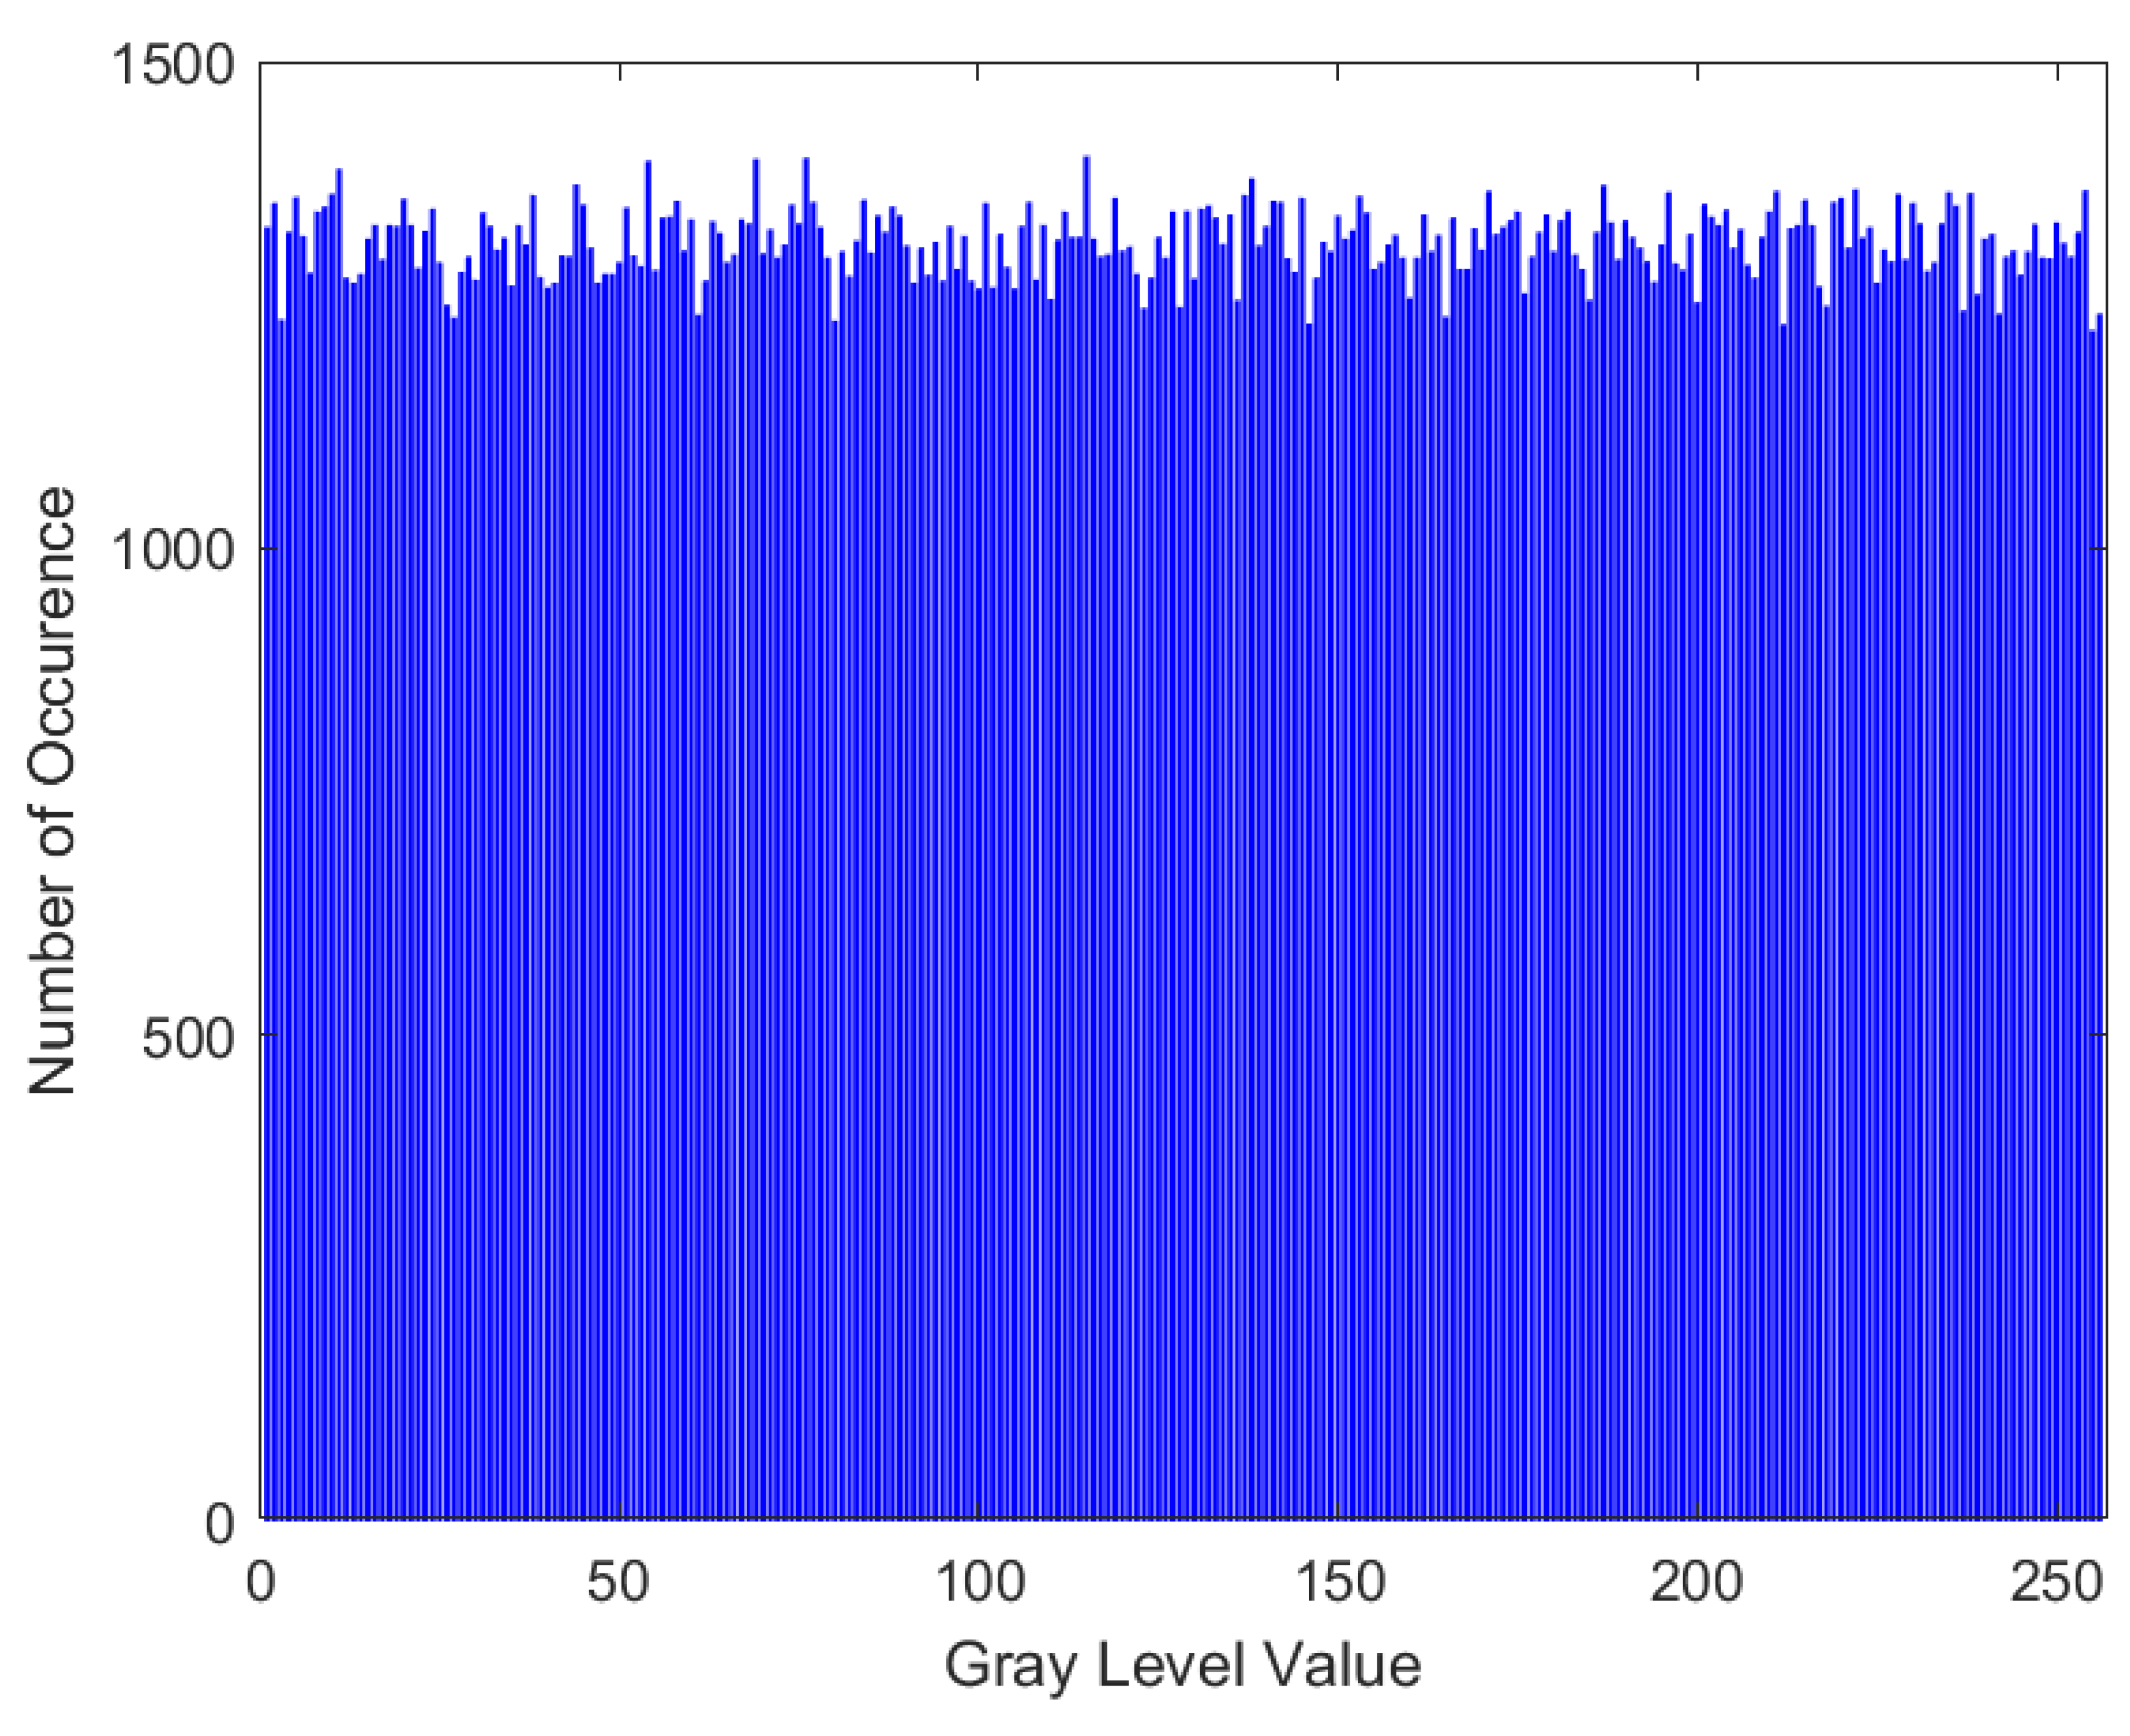
Figure 13,
Figure 14 and
Figure 15 show the histograms of the red, green, and blue channels, respectively. It can be seen that these histogram are almost flat, and hence, the encrypted color spectrogram is secure. Furthermore,
Table 4,
Table 5 and
Table 6 show the security of the encrypted spectrogram using a number of security parameters [
20,
21,
52,
53,
54] for the red, green, and blue channels, respectively. From the security parameters, it is evident that the spectrogram encryption is secure and resistant against many attacks.
7. Conclusions
This paper presented a novel privacy-preserving COVID-19 patient monitoring technique in the context of Saudi Arabia. The use of low-cost wireless devices in conjunction with a novel encryption algorithm, namely chaos-based substitution boxes, made it an end-to-end secure system for continuously monitoring patients. The variances of the amplitude and phase information were used to monitor daily routine activities and detect normal and abnormal breathing rates. A wearable sensor was used as a reference sensor, which indicated strong synergy between wearable and noncontact WiFi sensing. This system can be deployed in any indoor setting where WiFi signals are available, such as in homes, hospitals, care centers, and airports. The proposed encryption scheme can be further strengthened with multichaos maps. In the future, we will change the proposed algorithm with higher-dimensional mapping for a higher key space and higher security. Moreover, the proposed scheme will be tested against ciphertext attack and plaintext attack. The proposed multichaos-based encryption scheme will be compared with other chaos-based algorithms. In addition, we will also deploy this system in actual quarantine, hotel, of hospital environment where actual COVID-19 patients are monitored while in quarantine or being observed. The idea will be to monitor their activities of daily living and examine their respiratory rate to see whether the patients needs a timely intervention. We will also monitor multiple participants in the future, in comparison to a single patient, as in this study. Additionally, in future work, we plan to monitor real COVID-19 patients instead of healthy participants and ask them to mimic different breathing patterns.
Author Contributions
Conceptualization, W.B., S.A.S., J.A., M.D., H.G., A.A., M.A.-S. and F.S.; methodology, W.B., S.A.S., J.A. and M.D.; Software, S.A.S. and J.A.; validation, S.A.S. and J.A.; formal analysis, W.B., S.A.S., J.A. and M.D.; investigation, W.B., M.D., H.G., A.A., M.A.-S. and F.S.; data curation, S.A.S.; writing—original draft, W.B., S.A.S., J.A. and M.D.; writing—review & editing, H.G., A.A., M.A.-S., F.S.; visualization, W.B., S.A.S., J.A., M.D., H.G., A.A., M.A.-S. and F.S.; supervision, W.B., S.A.S. and J.A.; project administration, W.B. All authors have read and agreed to the published version of the manuscript.
Funding
This research was funded by the Deanship of Scientific Research at Taibah University, Saudi Arabia, project number (CSE—3).
Acknowledgments
The authors would like to thank the Deanship of Scientific Research at Taibah University, Saudi Arabia, for funding this research project number (CSE—3).
Conflicts of Interest
The authors declare no conflict of interest.
References
- Taylor, W.; Abbasi, Q.H.; Dashtipour, K.; Ansari, S.; Shah, S.A.; Khalid, A.; Imran, M.A. A Review of the State of the Art in Non-Contact Sensing for COVID-19. Sensors 2020, 20, 5665. [Google Scholar] [CrossRef]
- Cao, X. COVID-19: Immunopathology and its implications for therapy. Nat. Rev. Immunol. 2020, 20, 269–270. [Google Scholar] [CrossRef] [PubMed] [Green Version]
- Tabik, S.; Gómez-Ríos, A.; Martín-Rodríguez, J.L.; Sevillano-García, I.; Rey-Area, M.; Charte, D.; Guirado, E.; Suárez, J.L.; Luengo, J.; Valero-González, M.A.; et al. COVIDGR Dataset and COVID-SDNet Methodology for Predicting COVID-19 Based on Chest X-Ray Images. IEEE J. Biomed. Health Inform. 2020, 24, 3595–3605. [Google Scholar] [CrossRef]
- O’Suilleabhain, P.E.; Matsumoto, J.Y. Time-frequency analysis of tremors. Brain J. Neurol. 1998, 121, 2127–2134. [Google Scholar] [CrossRef] [PubMed] [Green Version]
- Abolfotouh, M.A.; Almutairi, A.F.; Ala’a, A.B.; Hussein, M.A. Perception and attitude of healthcare workers in Saudi Arabia with regard to Covid-19 pandemic and potential associated predictors. BMC Infect. Dis. 2020, 20, 1–10. [Google Scholar] [CrossRef]
- Dong, D.; Tang, Z.; Wang, S.; Hui, H.; Gong, L.; Lu, Y.; Xue, Z.; Liao, H.; Chen, F.; Yang, F.; et al. The Role of Imaging in the Detection and Management of COVID-19: A Review. IEEE Rev. Biomed. Eng. 2021, 14, 16–29. [Google Scholar] [CrossRef] [PubMed]
- Kircher, M.; Elke, G.; Stender, B.; Hernández Mesa, M.; Schuderer, F.; Dössel, O.; Fuld, M.K.; Halaweish, A.F.; Hoffman, E.A.; Weiler, N.; et al. Regional Lung Perfusion Analysis in Experimental ARDS by Electrical Impedance and Computed Tomography. IEEE Trans. Med Imaging 2021, 40, 251–261. [Google Scholar] [CrossRef]
- Taylor, W.; Shah, S.A.; Dashtipour, K.; Zahid, A.; Abbasi, Q.H.; Imran, M.A. An intelligent noninvasive real-time human activity recognition system for next-generation healthcare. Sensors 2020, 20, 2653. [Google Scholar] [CrossRef]
- Shah, S.A.; Fioranelli, F. RF sensing technologies for assisted daily living in healthcare: A comprehensive review. IEEE Aerosp. Electron. Syst. Mag. 2019, 34, 26–44. [Google Scholar] [CrossRef] [Green Version]
- Wang, G.; Zou, Y.; Zhou, Z.; Wu, K.; Ni, L.M. We can hear you with WiFi! IEEE Trans. Mob. Comput. 2016, 15, 2907–2920. [Google Scholar] [CrossRef]
- Umair, M.; Khan, M.S.; Ahmed, F.; Baothman, F.; Alqahtani, F.; Alian, M.; Ahmad, J. Detection of COVID-19 Using Transfer Learning and Grad-CAM Visualization on Indigenously Collected X-ray Dataset. Sensors 2021, 21, 5813. [Google Scholar] [CrossRef]
- Chowdhury, M.E.; Rahman, T.; Khandakar, A.; Mazhar, R.; Kadir, M.A.; Mahbub, Z.B.; Islam, K.R.; Khan, M.S.; Iqbal, A.; Al Emadi, N.; et al. Can AI help in screening viral and COVID-19 pneumonia? IEEE Access 2020, 8, 132665–132676. [Google Scholar] [CrossRef]
- Santosh, K. AI-driven tools for coronavirus outbreak: Need of active learning and cross-population train/test models on multitudinal/multimodal data. J. Med. Syst. 2020, 44, 1–5. [Google Scholar] [CrossRef] [PubMed] [Green Version]
- Panwar, H.; Gupta, P.; Siddiqui, M.K.; Morales-Menendez, R.; Singh, V. Application of deep learning for fast detection of COVID-19 in X-Rays using nCOVnet. Chaos Solitons Fractals 2020, 138, 109944. [Google Scholar] [CrossRef] [PubMed]
- Fan, D.P.; Zhou, T.; Ji, G.P.; Zhou, Y.; Chen, G.; Fu, H.; Shen, J.; Shao, L. Inf-net: Automatic covid-19 lung infection segmentation from ct images. IEEE Trans. Med. Imaging 2020, 39, 2626–2637. [Google Scholar] [CrossRef] [PubMed]
- Wang, X.; Deng, X.; Fu, Q.; Zhou, Q.; Feng, J.; Ma, H.; Liu, W.; Zheng, C. A weakly-supervised framework for COVID-19 classification and lesion localization from chest CT. IEEE Trans. Med. Imaging 2020, 39, 2615–2625. [Google Scholar] [CrossRef]
- Atitallah, S.B.; Driss, M.; Boulila, W.; Ghézala, H.B. Randomly Initialized Convolutional Neural Network for the Recognition of COVID-19 using X-ray Images. arxiv 2021, arXiv:2105.08199. [Google Scholar]
- Li, H.; Deng, J.; Feng, P.; Pu, C.; Dharshana Arachchige, D.; Cheng, Q. Short-term Nacelle Orientation Forecasting using Bilinear Transformation and ICEEMDAN Framework. Front. Energy Res. 2021, 697. [Google Scholar] [CrossRef]
- Aggarwal, A.; Alshehri, M.; Kumar, M.; Alfarraj, O.; Sharma, P.; Pardasani, K.R. Landslide data analysis using various time-series forecasting models. Comput. Electr. Eng. 2020, 88, 106858. [Google Scholar] [CrossRef]
- Qayyum, A.; Ahmad, J.; Boulila, W.; Rubaiee, S.; Masood, F.; Khan, F.; Buchanan, W.J. Chaos-based confusion and diffusion of image pixels using dynamic substitution. IEEE Access 2020, 8, 140876–140895. [Google Scholar] [CrossRef]
- Masood, F.; Boulila, W.; Ahmad, J.; Sankar, S.; Rubaiee, S.; Buchanan, W.J. A novel privacy approach of digital aerial images based on mersenne twister method with DNA genetic encoding and chaos. Remote Sens. 2020, 12, 1893. [Google Scholar] [CrossRef]
- Abbasi, S.F.; Ahmad, J.; Khan, J.S.; Khan, M.A.; Sheikh, S.A. Visual meaningful encryption scheme using intertwinning logistic map. In Proceedings of the Science and Information Conference, London, UK, 10–12 July 2018; pp. 764–773. [Google Scholar]
- Khan, J.S.; Ahmad, J. Chaos based efficient selective image encryption. Multidimens. Syst. Signal Process. 2019, 30, 943–961. [Google Scholar] [CrossRef]
- Schade, M.M.; Bauer, C.E.; Murray, B.R.; Gahan, L.; Doheny, E.P.; Kilroy, H.; Zaffaroni, A.; Montgomery-Downs, H.E. Sleep validity of a noncontact bedside movement and respiration-sensing device. J. Clin. Sleep Med. 2019, 15, 1051–1061. [Google Scholar] [CrossRef] [PubMed]
- Uysal, C.; Onat, A.; Filik, T. Non-contact respiratory rate estimation in real-time with modified joint unscented Kalman filter. IEEE Access 2020, 8, 99445–99457. [Google Scholar] [CrossRef]
- Lin, J.C. Wireless sensing and monitoring of physiological movements and volume changes. In Proceedings of the 2011 XXXth URSI General Assembly and Scientific Symposium, Istanbul, Turkey, 13–20 August 2011; p. 1. [Google Scholar]
- Safaei, M.; Ismail, A.S.; Chizari, H.; Driss, M.; Boulila, W.; Asadi, S.; Safaei, M. Standalone noise and anomaly detection in wireless sensor networks: A novel time-series and adaptive Bayesian-network-based approach. Softw. Pract. Exp. 2020, 50, 428–446. [Google Scholar] [CrossRef]
- Islam, S.M.M. Radar-Based Non-Contact Physiological Sensing. In Vision, Sensing and Analytics: Integrative Approaches; Springer: Berlin/Heidelberg, Germany, 2021; pp. 177–212. [Google Scholar]
- Dou, C.; Huan, H. Full Respiration Rate Monitoring Exploiting Doppler Information with Commodity WiFi Devices. Sensors 2021, 21, 3505. [Google Scholar] [CrossRef] [PubMed]
- Khan, M.B.; Zhang, Z.; Li, L.; Zhao, W.; Hababi, M.A.M.A.; Yang, X.; Abbasi, Q.H. A Systematic Review of Non-Contact Sensing for Developing a Platform to Contain COVID-19. Micromachines 2020, 11, 912. [Google Scholar] [CrossRef]
- Costanzo, S. Software-defined doppler radar sensor for human breathing detection. Sensors 2019, 19, 3085. [Google Scholar] [CrossRef] [Green Version]
- Van, N.T.P.; Tang, L.; Singh, A.; Minh, N.D.; Mukhopadhyay, S.C.; Hasan, S.F. Self-identification respiratory disorder based on continuous wave radar sensor system. IEEE Access 2019, 7, 40019–40026. [Google Scholar] [CrossRef]
- Sharma, P.; Hui, X.; Kan, E.C. A wearable RF sensor for monitoring respiratory patterns. In Proceedings of the 2019 41st Annual International Conference of the IEEE Engineering in Medicine and Biology Society (EMBC), Berlin, Germany, 23–27 July 2019; pp. 1217–1223. [Google Scholar]
- Kristiani, D.G.; Triwiyanto, T.; Nugraha, P.C.; Irianto, B.G.; Titisari, D. The measuring of vital signs using Internet of Things technology (heart rate and respiration). In Proceedings of the 2019 International Seminar on Application for Technology of Information and Communication (iSemantic), Semarang, Indonesia, 21–22 September 2019; pp. 417–422. [Google Scholar]
- Khan, M.B.; Rehman, M.; Mustafa, A.; Shah, R.A.; Yang, X. Intelligent Non-Contact Sensing for Connected Health Using Software Defined Radio Technology. Electronics 2021, 10, 1558. [Google Scholar] [CrossRef]
- Yoo, J. Change Detection of RSSI Fingerprint Pattern for Indoor Positioning System. IEEE Sens. J. 2020, 20, 2608–2615. [Google Scholar] [CrossRef]
- Boussad, Y.; Mahfoudi, M.N.; Legout, A.; Lizzi, L.; Ferrero, F.; Dabbous, W. Evaluating Smartphone Accuracy for RSSI Measurements. IEEE Trans. Instrum. Meas. 2021, 70, 1–12. [Google Scholar] [CrossRef]
- Ashleibta, A.M.; Zahid, A.; Shah, S.A.; Abbasi, Q.H.; Imran, M.A. Flexible and scalable software defined radio based testbed for large scale body movement. Electronics 2020, 9, 1354. [Google Scholar] [CrossRef]
- Halperin, D.; Hu, W.; Sheth, A.; Wetherall, D. Tool release: Gathering 802.11 n traces with channel state information. ACM SIGCOMM Comput. Commun. Rev. 2011, 41, 53. [Google Scholar] [CrossRef]
- Rastegardoost, N.; Jabbari, B. Minimizing WiFi latency with unlicensed LTE opportunistic white-space utilization. IEEE Trans. Wirel. Commun. 2019, 18, 1914–1926. [Google Scholar] [CrossRef]
- Fioranelli, F.; Le Kernec, J.; Shah, S.A. Radar for health care: Recognizing human activities and monitoring vital signs. IEEE Potentials 2019, 38, 16–23. [Google Scholar] [CrossRef] [Green Version]
- Tzallas, A.T.; Tsipouras, M.G.; Fotiadis, D.I. Epileptic seizure detection in EEGs using time–frequency analysis. IEEE Trans. Inf. Technol. Biomed. 2009, 13, 703–710. [Google Scholar] [CrossRef] [PubMed]
- Zhu, W.; Li, X.; Liu, C.; Xue, F.; Han, Y. An STFT-LSTM System for P-Wave Identification. IEEE Geosci. Remote Sens. Lett. 2020, 17, 519–523. [Google Scholar] [CrossRef]
- Huang, J.; Chen, B.; Yao, B.; He, W. ECG Arrhythmia Classification Using STFT-Based Spectrogram and Convolutional Neural Network. IEEE Access 2019, 7, 92871–92880. [Google Scholar] [CrossRef]
- Chikkerur, S.; Govindaraju, V.; Cartwright, A.N. Fingerprint image enhancement using STFT analysis. In Proceedings of the International Conference on Pattern Recognition and Image Analysis, Bath, UK, 22–25 August 2005; pp. 20–29. [Google Scholar]
- Dridi, F.; El Assad, S.; El Hadj Youssef, W.; Machhout, M.; Lozi, R. The Design and FPGA-Based Implementation of a Stream Cipher Based on a Secure Chaotic Generator. Appl. Sci. 2021, 11, 625. [Google Scholar] [CrossRef]
- Zhou, Y.; Bao, L.; Chen, C.P. A new 1D chaotic system for image encryption. Signal Process. 2014, 97, 172–182. [Google Scholar] [CrossRef]
- Siddiqui, N.; Naseer, A.; Ehatisham-ul Haq, M. A novel scheme of substitution-box design based on modified Pascal’s triangle and elliptic curve. Wirel. Pers. Commun. 2021, 116, 3015–3030. [Google Scholar] [CrossRef]
- Alshammari, B.M.; Guesmi, R.; Guesmi, T.; Alsaif, H.; Alzamil, A. Implementing a Symmetric Lightweight Cryptosystem in Highly Constrained IoT Devices by Using a Chaotic S-Box. Symmetry 2021, 13, 129. [Google Scholar] [CrossRef]
- Ahmed, H.A.; Zolkipli, M.F.; Ahmad, M. A novel efficient substitution-box design based on firefly algorithm and discrete chaotic map. Neural Comput. Appl. 2019, 31, 7201–7210. [Google Scholar] [CrossRef]
- Li, Z.; Peng, C.; Tan, W.; Li, L. An efficient plaintext-related chaotic image encryption scheme based on compressive sensing. Sensors 2021, 21, 758. [Google Scholar] [CrossRef]
- Shah, S.A.; Ahmad, J.; Masood, F.; Shah, S.Y.; Pervaiz, H.; Taylor, W.; Imran, M.A.; Abbasi, Q.H. Privacy-Preserving Wandering Behavior Sensing in Dementia Patients Using Modified Logistic and Dynamic Newton Leipnik Maps. IEEE Sens. J. 2020, 21, 3669–3679. [Google Scholar] [CrossRef]
- Khan, J.S.; Boulila, W.; Ahmad, J.; Rubaiee, S.; Rehman, A.U.; Alroobaea, R.; Buchanan, W.J. DNA and plaintext dependent chaotic visual selective image encryption. IEEE Access 2020, 8, 159732–159744. [Google Scholar] [CrossRef]
- Alkhelaiwi, M.; Boulila, W.; Ahmad, J.; Koubaa, A.; Driss, M. An Efficient Approach Based on Privacy-Preserving Deep Learning for Satellite Image Classification. Remote Sens. 2021, 13, 2221. [Google Scholar] [CrossRef]
| Publisher’s Note: MDPI stays neutral with regard to jurisdictional claims in published maps and institutional affiliations. |
© 2021 by the authors. Licensee MDPI, Basel, Switzerland. This article is an open access article distributed under the terms and conditions of the Creative Commons Attribution (CC BY) license (https://creativecommons.org/licenses/by/4.0/).


 ,
, 


