1. Introduction
Bird monitoring is critical for identifying species, obtaining their population, and establishing threats to species at various sites. Monitoring is also required to assess whether policies and actions are having an impact on the efforts towards the conservation of bird species. Though survey-based techniques for monitoring species conservation are reliable, they are often costly and time-consuming [
1]. Therefore, researchers have been trying to develop automated bird monitoring techniques to further improve the accuracy and reliability of the classifiers [
2].
Birds’ appearances (photographs) [
3] are used for automatic bird monitoring. However, image processing algorithms have some limitations, as it is hard to take a photograph of birds in their habitats, during flight, and at night. The resolution and angle of the photograph also affect the image classification algorithms [
4]. Therefore, monitoring through acoustic recording units (ARUs), of animals in general and birds in particular, has become a preferred approach over the past few years.
The characteristics of birdsongs are varied in different species. It is useful to consider the structure of birdsong for automatic classification. Birdsong consists of different repertoire units with silent intervals in a sequence. The basic unit of birdsong is a “note” or an “element”. Notes are the smallest separable unit of the spectrogram. However, the length of the note is too short, and it is difficult to separate them. This is at times due to the overlap in temporal and frequency structures. Different notes combine in different patterns to produce syllables. A bird can produce different syllables in a sequence.
In this paper, we propose an automatic classification of monosyllabic and multisyllabic birds using perceptual, descriptive, and harmonic features. The rest of the paper discusses the proposed approach and is structured as follows.
Section 2 presents related work before delving into details of the proposed work.
Section 3 discusses the materials and methods.
Section 4 explores the segmentation approach. In
Section 5, perceptual, descriptive, and harmonic features are discussed.
Section 6 elaborates on the evaluation performance of the segmentation algorithm, while
Section 7 shows the experiments and results. Finally,
Section 8 offers conclusions and future directions.
2. Related Work
It is challenging to perform the classification ofsyllables of birdsong from audio recording. Manual segmentation of audio recordings is time consuming and tedious task. However, some approaches [
5,
6,
7,
8] have adopted manual segmentation while others have adopted automated segmentation of birdsong [
9,
10,
11,
12]. In general, detect any acoustic activity in audio and segment it as a syllable. It is important to note that birds are categorized by the pattern of their vocalization [
13]. Some birds only produce a single syllable in a sequence with gradual modulation in speed and pitch, and are referred to as monosyllabic. Birds that produce different syllables in a sequence are called multisyllabic birds. The segmentation becomes more sophisticated when applying techniques according to these patterns of bird vocalization.
Segmented audio signals of birdsong are parameterized by a feature set that can discriminate between the vocalization of different birds. In previous studies, a single feature set is used for parametrization of birdsong, such as Mel-Frequency Cepstral Coefficients (MFCCs) [
14,
15,
16], Linear Predictive Coefficients (LPC) [
15,
16,
17,
18], or wavelets [
19]. For a small number of species, these single feature sets provide good results, as discussed in [
12]. The researchers used three different feature sets to classify 14 different bird species and reported encouraging results using MFCCs.
On the other hand, it is noted that with the increase in the number of species, a single feature set is not enough to deal with the large diversity of sounds that different species can produce. Therefore, a feature vector that can represent all the descriptive features of birds’ vocalization is required. In recent years, researchers have used a combination of feature sets and obtained good results in birdsong classification [
20,
21,
22]. However, the selection of a combination of feature vectors to achieve better performance in classification does not guarantee a better performance if the combination of features is not appropriate.
In the study of [
23], the performance of different feature vectors is compared for bird acoustic classification and the descriptive feature vector performed better than the rhythmic feature vector. The descriptive feature vector is a combination of time-domain features, frequency domain features, and Mel-Frequency Cepstral Coefficients (MFCCs), while the rhythmic feature vector is based on Inset-Onset Interval Histogram Coefficients (IOIHCs) which is related to the rhythmic properties of sound. Therefore, this feature set performs well for music classification but not for birdsong classification. The performance of descriptive feature vectors, MFCCs, and sinusoidal modeling of birdsong is also investigated in [
12], which found that sinusoidal modeling provides good results for highly tonal bird sounds while MFCCs provide more consistent results for a large number of birds. MFCCs provide consistent results, but significant accuracy is not achieved by using only MFCCs. To improve accuracy, a more descriptive feature vector is required.
In [
20], to make the feature set more descriptive, visual features are combined with audio features. The visual features are extracted from the spectrogram. This combination is used to recognize 46 bird species and achieved 94.5% accuracy. Although this approach produces a good accuracy rate in extracting visual features, conversion of the audio signals into an image (spectrogram) is required. This makes the approach computationally expensive. Therefore, it is more sophisticatedto perform birdsong classification directly from the audio signals.
The literature reveals that researchers put great efforts into producing different feature vectors to discriminate birdsong. As discussed earlier, birds produce different patterns of vocalization. Therefore, it is important to consider these unique patterns. The proposed approach mainly focuses on two different groups: monosyllabic birds and multisyllabic birds. The main contributions of this paper are: (1) a segmentation algorithm that extracts segments of bird audio from the recording according to the pattern of birds’ vocalization; (2) the proposal of a combination of low-level audio features (descriptive features), perceptual features (MFCCs), and harmonic features. This combination of audio features is referred to as Perceptual, Descriptive, and Harmonic Features (PDHFs).
3. Material and Methods
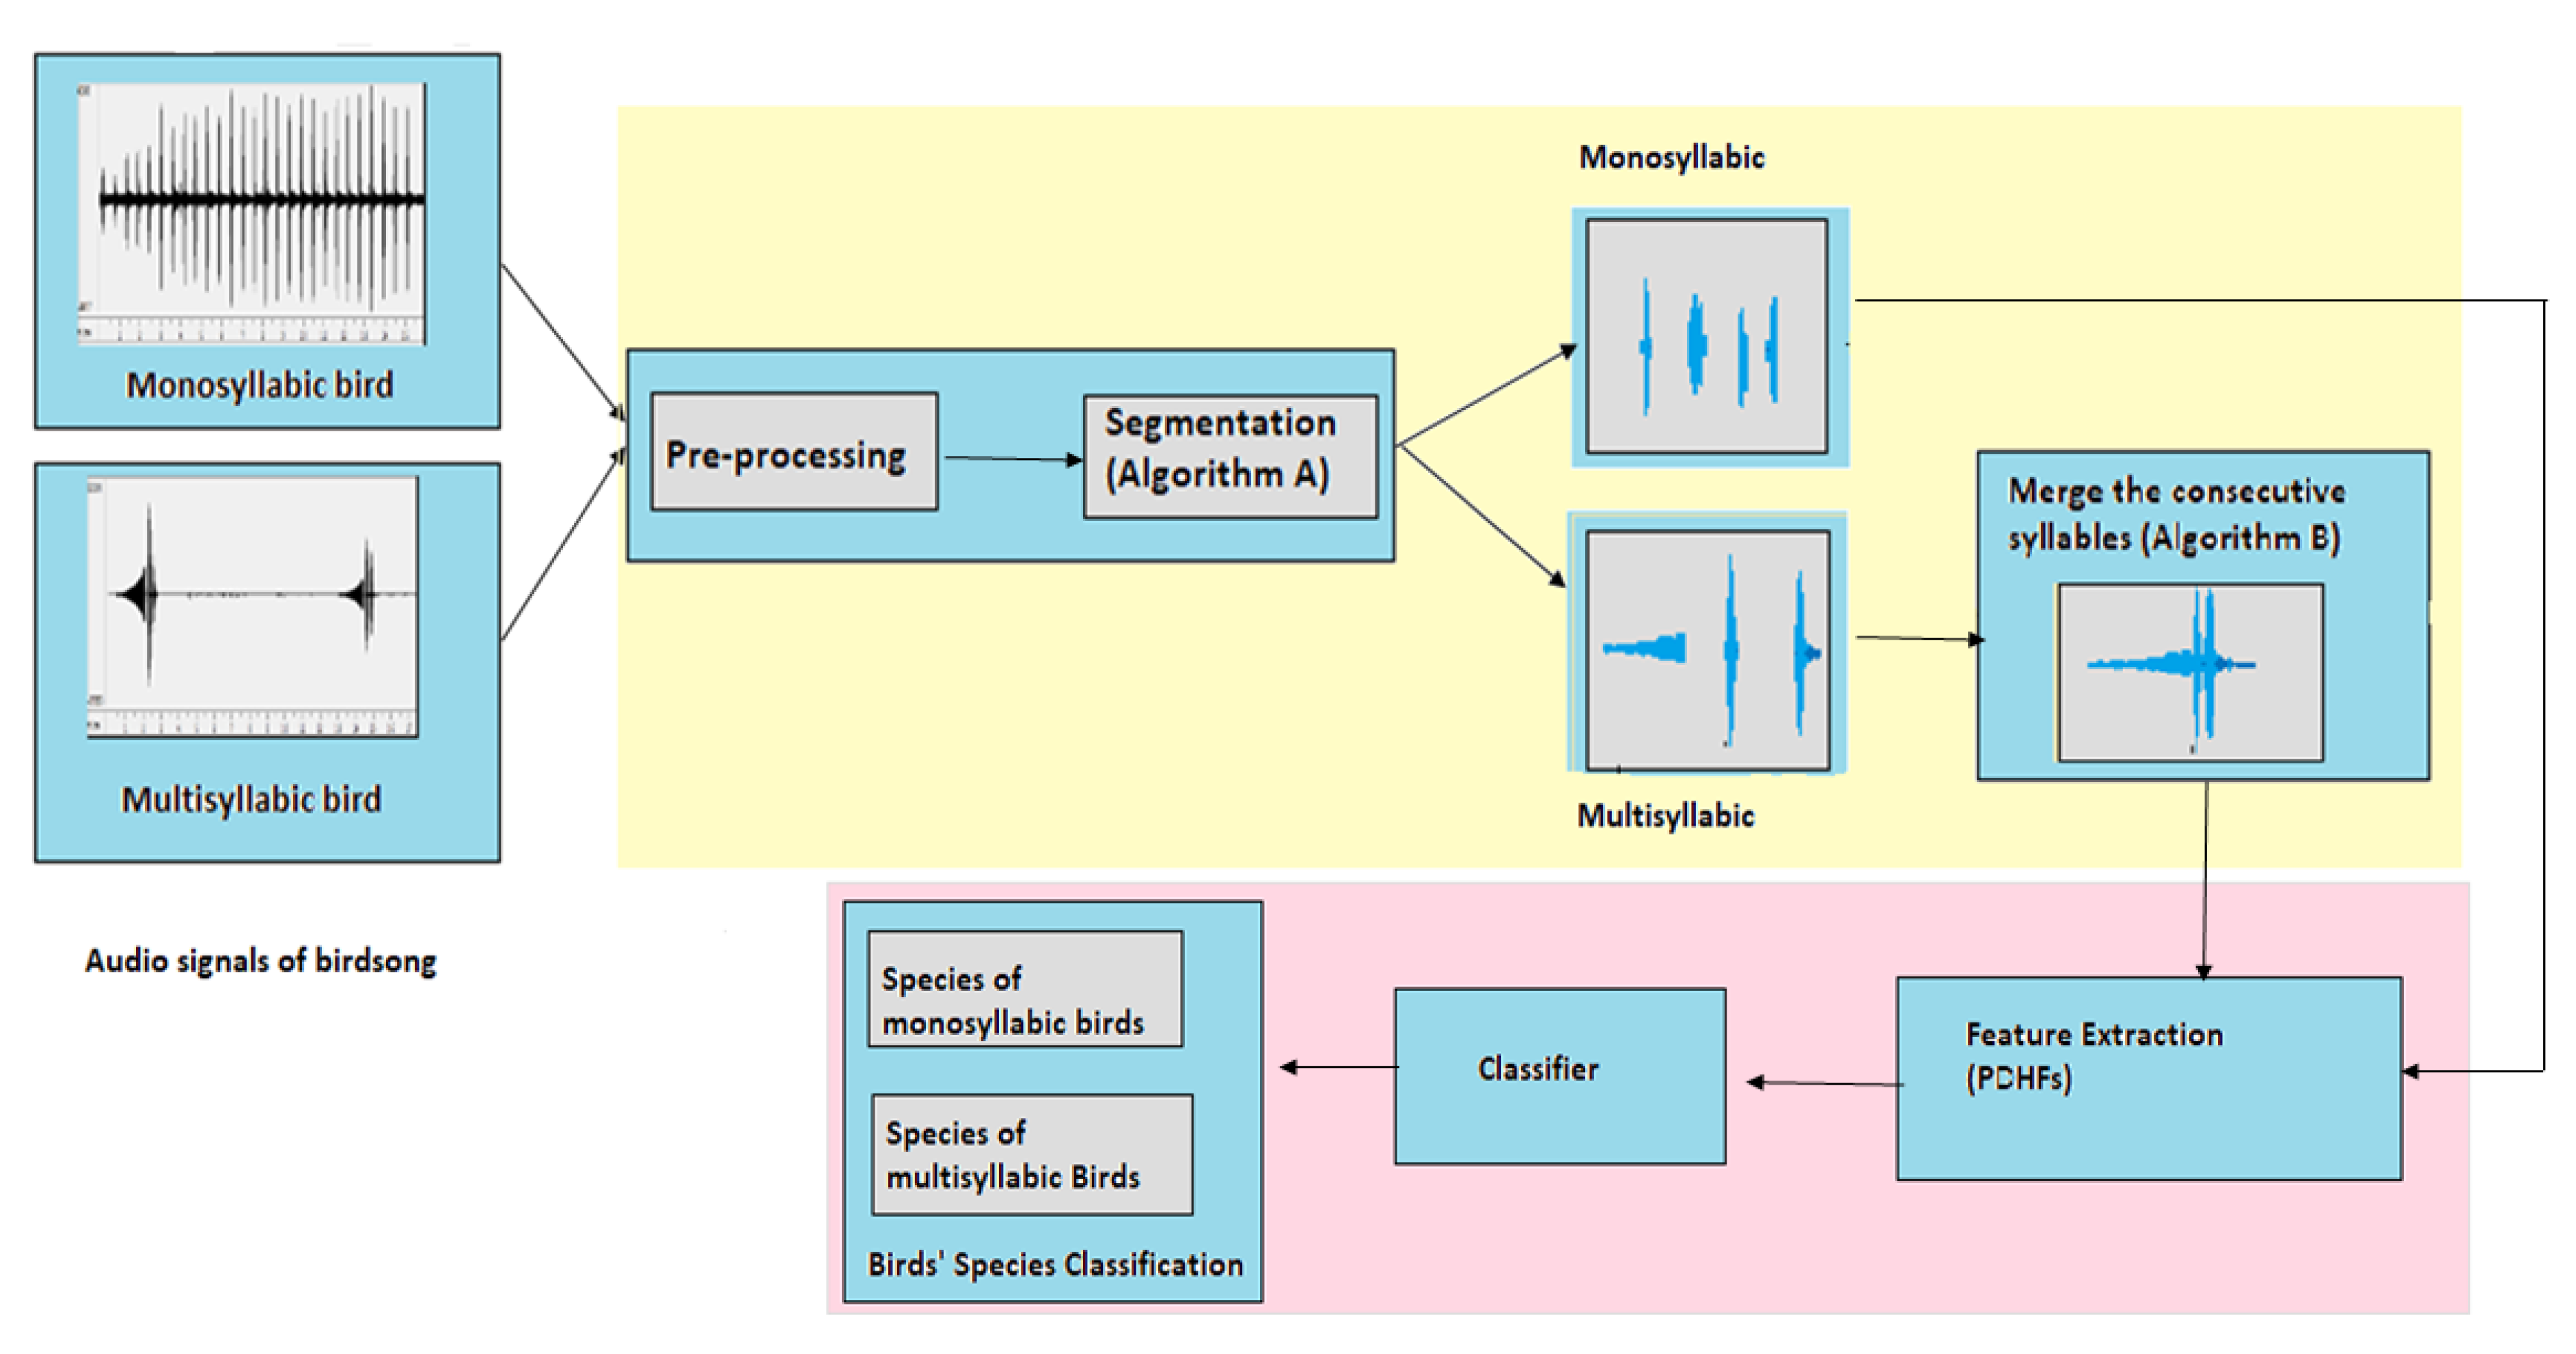
The framework of the proposed approach is based on two main steps: (i) segmentation of bird vocalization according to patterns; (ii) designing a feature set (PDHFs) that can deal with the discriminant properties of bird vocalization. The complete architecture of the proposed methodology is shown in
Figure 1 and detailed discussion is given in the following sections.
The input consists of labeled audio (.wav) files of two types of bird: monosyllabic birds and multisyllabic birds. The final output is the birds’ species classification. The two main contributions of this research are shown in two different boxes: the yellow box represents the segmentation and the pink box shows the feature extraction and classification. Before segmentation, preprocessing is applied to remove noise. The filtered audio is then segmented by applying Algorithm A. This algorithm extracts every syllable present in the recording. The single syllables are taken for feature extraction in monosyllabic birds. On the other hand, the consecutive syllables are combined by applying Algorithm B for multisyllabic birds and this segmentation is taken for feature extraction. The feature vector (PDHF) is calculated in the same way for both types of bird and used for bird species classification.
4. Segmentation of Monosyllabic and Multisyllabic Birds
Outdoor recordings are used in the current research, therefore the dataset doesnot contain only target species’ songs, but a considerable part of the recordings consists of background noise such as the sound of other surrounding species, wind, and recording equipment. To achieve better results in segmentation, it is necessary to filter out this noise. Two types of high pass filters proposed in [
11] are applied with some modifications. The first high pass filter is applied with a 500 Hz passband frequency instead of a 1000 Hz passband frequency, since the latter frequency caused the removal of the low-frequency sound of birds such as the Coppersmith Barbet.
After the removal of noise, the bird audio is segmented from the recording. An unappropriated segmentation of syllables increases noise in the feature extraction, as well as affecting the results of classification. Therefore, in the proposed method, segmentation algorithms are applied according to the patterns of bird sound, i.e., monosyllabic or multisyllabic.
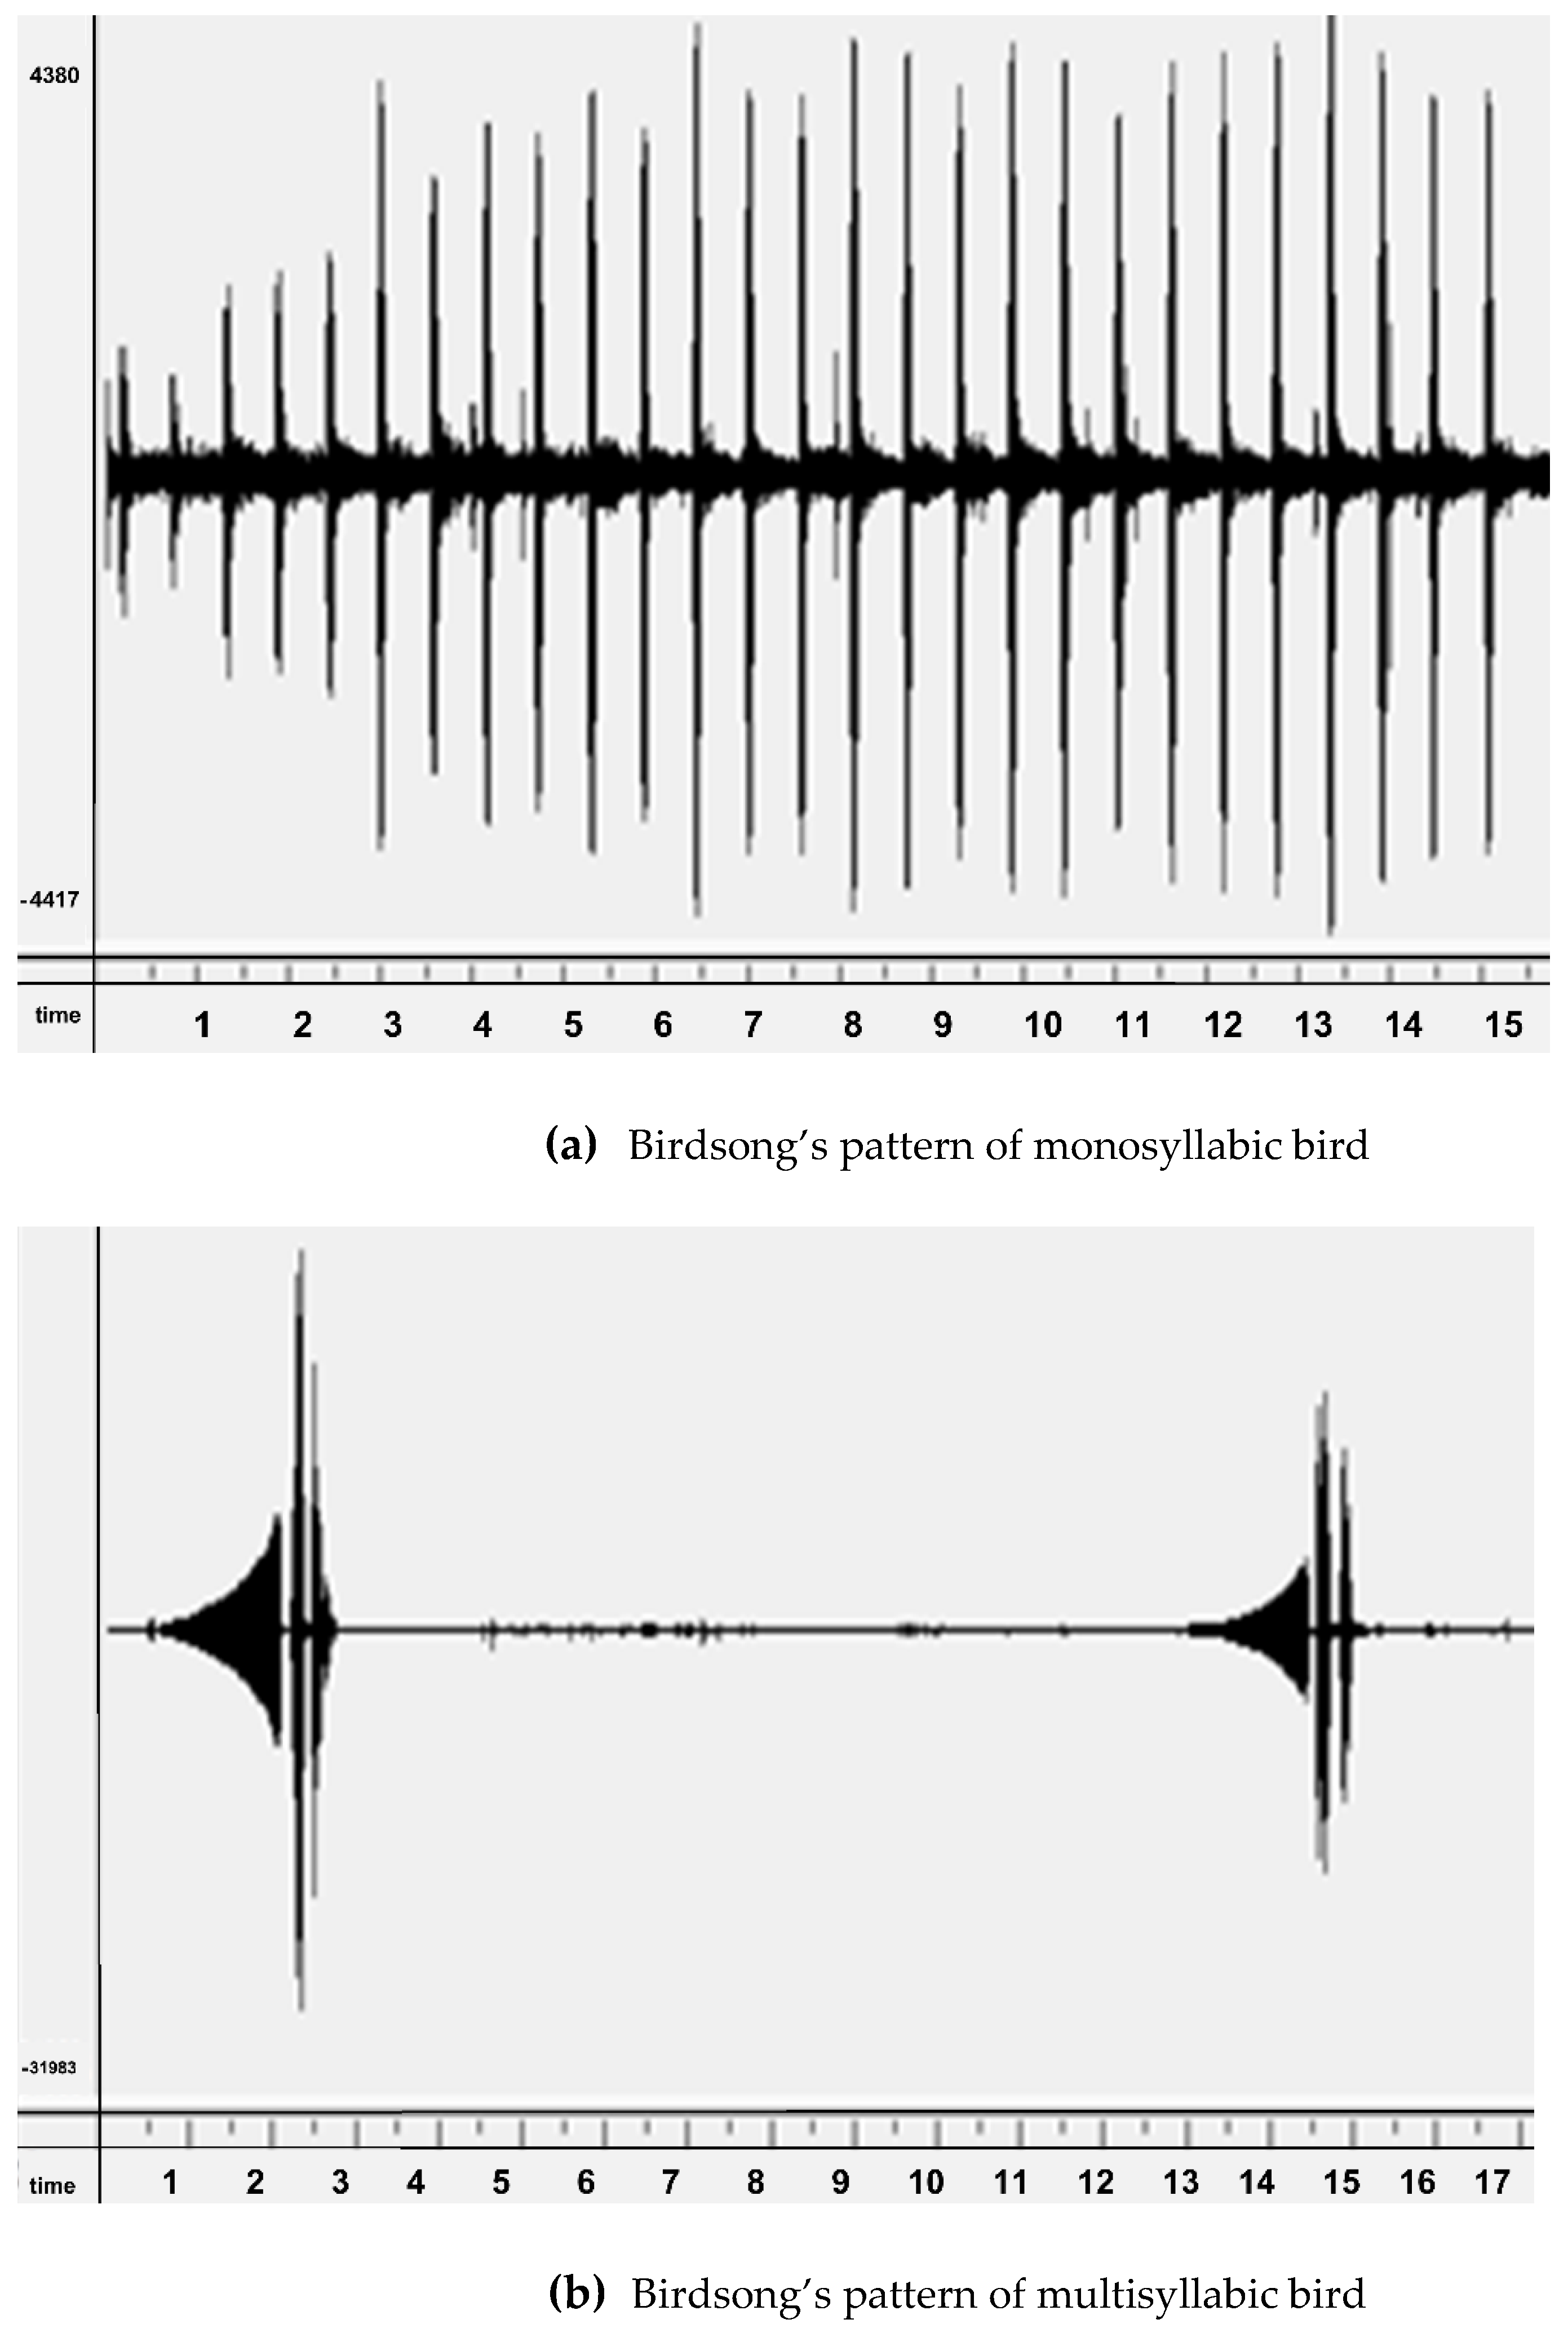
To understand the birdsong pattern of monosyllabic and multisyllabic birds, the audio signals are shown in (
Figure 2). The Coppersmith Barbet (monosyllabic bird), as shown in
Figure 2a produces a syllable with a silent interval while the Brown-flanked Bush Warbler (multisyllabic bird), as shown in
Figure 2b produces a specific pattern of different syllables with a small silent interval. If an individual syllable is extracted from the recording, then it isolates each syllable of multisyllabic birds, losing the particular sequence of syllables. Therefore, we combine different syllables for multisyllabic birds to produce a sequence and consider this pattern as a unit for classification.
The pattern of vocalization of two different birds is shown in the waveform. Panel (a) represents the syllable of the Coppersmith Barbet. The syllable is repeated after a few seconds with a small variation in wavelength. Panel (b) shows the waveform of different syllables vocalized by the Brown-flanked Bush Warbler. Three different syllables are produced with a minute silent interval; a whistle is produced initially for a second, after which a high pitch sound is produced repeatedly.
For this reason, we have used two algorithms for segmentation: (i) extract the individual syllable present in the recording (referred to as Algorithm A); (ii) merge each consecutive syllable with the series of small-time intervals to extract the segment of syllables (referred to as Algorithm B). The algorithm is similar to the syllable extraction techniques described by [
24] with some modifications [
11]. The modification was made by adding preprocessing steps to eliminate the environmental noise and post-processing steps to cluster the syllables by applying Algorithm B. In the proposed methodology, Algorithm B is applied only for multisyllabic birds because of their particular segmentation of different syllables. This segmentation is clearly shown in
Figure 1.
4.1. Single Syllable Extraction for Monosyllabic Birds (Algorithm A)
The syllable segmentation technique is based on the Short-Time Fourier Transform (STFT), which is used to generate the spectrogram of the bird’s song. A Kaiser window (512-point) is used to create a spectrogram with the default value of β = 0.5. The FFT size is 1024 with zero padding and 128 samples of each segment of the signal are overlapped.
Syllable extraction is based on the assumption that the loudest portion of the recording is most relevant. Algorithm A is used to extract the loudest part of the recording. The main steps to describe Algorithm A are mentioned below:
- (1)
Fast Fourier Transformation (FFT) is used to compute the spectrogram of the birdsong; the spectrogram is denoted in a matrix , where represents time and is frequency.
- (2)
Run steps 3–8 for times; where .
- (3)
To detect the loudest values of the recording, the appropriate values of and are found, such as , to acquire the maximum value of the spectrogram.
- (4)
The respective values of frequency
and amplitude
are stored, where
in dBs can be defined as,
- (5)
Select a threshold value , such that an amplitude less than is not considered as a syllable.
- (6)
After tracing the maximum value of
it is required to find the syllable starting in ‘
’ and ending ‘
’ position, searching the values of
in both directions of ‘
’ such as
and
, until the respective values of amplitude become lower than the value
, where
is defined as,
- (7)
Store the values of amplitude and frequencies of the nth syllable, where .
- (8)
To avoid the reselection of the same syllable, delete the area of the nth syllable:
The above-mentioned algorithm finds the highest value of the spectrogram, and to trace the complete syllable it traces the beginning values from the left and the endpoint from the right, until the value becomes less than the threshold. This procedure repeats
times, where
is the number of syllables present in the recording; when the amplitude of the spectrogram becomes lower than the threshold it stops searching for a new syllable. The value of the threshold is typically set to 1–30 dB [
11]. But in the current approach, some birds’ sounds are less than 17 dB such as that of the Coppersmith Barbet. To capture the syllable of low-pitched birds, the threshold is set to 12 dB.
This technique is good in the case of monosyllabic birds, where an individual syllable provides sufficient information and it is not required to merge consecutive syllables. On the other hand, a single syllable for multisyllabic birds does not provide enough information. It is important to consider a strong bigram structure and consider this a single unit for feature extraction. Therefore, Algorithm B is used to merge the consecutive syllables for multisyllabic birds.
4.2. Merging the Consecutive Syllables of Multisyllabic Birds (Algorithm B)
Post-processing is highly required for multisyllabic birds, where temporal variation gives better results because of the strong bigram structure. Therefore, the syllables of multisyllabic birds only are grouped together after extraction from Algorithm A.
This segmentation is performed by analyzing the silent intervals among the consecutive syllables. In order to combine the nearest syllables, a parameter ‘
’ is defined as a threshold such that if the silence interval between the syllables is less than ‘
’ then the successive syllables are merged to make a segment. A fixed value of ‘
’, which has been used by [
11], is not an appropriate technique for all kinds of birdsong. This is because some birds produce a sequence ofsyllables with a very small interval while other birds produce a sequence of syllables with a considerably large interval. In the current research, the value of
is assigned by taking the mean of all silent intervals present in the recording. The smaller interval among two consecutive syllables does not affect the value of ‘
’ but the larger interval between the sequences greatly affects it. The value of ‘
’ is computed by Equation (1).
The steps of Algorithm B to segment the syllables can be defined as follows:
- (i)
Sort the extracted syllables into a sequence according to time
- (ii)
Extract the silences among the two-consecutive syllable by subtracting the starting time of the next syllable from the ending time of the current syllable such that
- (iii)
Select the threshold value ‘’ by taking the mean of the silences using Equation (1).
- (iv)
Make a section by merging the consecutive syllables until the silence between them is less than the threshold .
- (v)
Create a new segment if the interval between the consecutive syllable is greater than the threshold .
After extraction of single syllables for a monosyllabic bird and segmentation of successive syllables for multisyllabic birds, it is required to design an appropriate feature set that can discriminate each bird’s audio in classification.
5. Perceptual, Descriptive and Harmonic Features (PDHFs)
We deal with the continuous data in the real world while audio signals are discrete. Therefore, the features are computed on short-term frames
and these frames are based on overlapped samples
of audio signals. We transform the discrete signals into
short-term frames of overlapped samples and then extract the audio features from these frames. In the presented work, each feature is extracted for
number of frames of an audio recording and then we take mean (
) and standard d deviation (
) of
number of frames to represent the feature of a recording. A feature vector is introduced named ‘Perceptual, Descriptive and Harmonic Features (PDHFs) which is a combination of different feature vectors, given in Equation (2).
where
The thirteen MFCCs (Mel Frequency Cestrum Coefficients) are computed on short-term frames; therefore Equation (3) represents the mean and standard deviation of these short-term frames. This feature set is used in many approaches and has achieved significant results [
14,
15,
16]. However, using only MFCCs to represent the birdsong are insufficient parameters because during the computation of MFCCs the spectral information compresses [
12]. Therefore, low-level descriptive features are combined with the MFCCs to observe the spectral and temporal variations.
In Equation (2) the
represents the low-level descriptive features, based on Time Domain Features (TDFs) and Frequency Domain Features (FDFs). The TDFs are calculated directly from the audio signals while the FDFs are calculated by transforming the audio signals into the frequency domain. The
is also calculated on short-term frames, therefore represented in terms of mean and standard deviation.
The TDFs are given in Equation (5), where represents the energy of the sound that reflects the aptitude of the birdsong. The Zero Crossing Rate (ZCR) provides information about the noisiness of the audio signals. represents the Entropy of the energy that is used to measure the changes in the level of energy of birdsong. On the other hand, Equation (6) represents the FDFs that provide the spectral features of the birdsong, e.g., represents the spectral entropy, and represents the spectral flux. The spectral shape is represented by spectral spread () and spectral centroid (). The represents the spectral roll-off that helps to distinguish between the sounds having lower frequency bands with the sounds having a higher frequency.
In Equation (2),
represents the harmonic features. The descriptive features have already been used with the MFCCs by [
12], but the harmonic component was not considered. However, it is found that bird vocalization is harmonic [
25]. Therefore, the fundamental frequency (
) and harmonic ratio (
) are also added to the proposed feature vector.
The performance of the segmentation algorithms and PDHF feature setis evaluated in the next section.
6. Evaluating the Performance of the Segmentation Algorithm
6.1. Data Acquisition
The data used in the experiments are acquired from the Xeno-Canto website [
26]. The dataset used in the experiments consists of birds mostly found in South Asia, as mentioned in
Table 1. Based on bird vocalization, two types of birds are taken for experiment: Monosyllabic birds and Multisyllabic birds. These species are signified with 20 syllables per species for classification. The whole dataset is further divided into training, 70% of the dataset, validation, 15%, and test dataset, 15%.
6.2. Segmentation Experiments
In order to analyze the performance of the segmentation algorithms, the segmentation results are compared by the handcrafted segmentation of the recordings. An audio software named Audacity (Jaworski, 2011) is used for handcrafted extraction of syllables. The syllable extraction and merging are evaluated on both types of data: monosyllabic and multisyllabic birds.
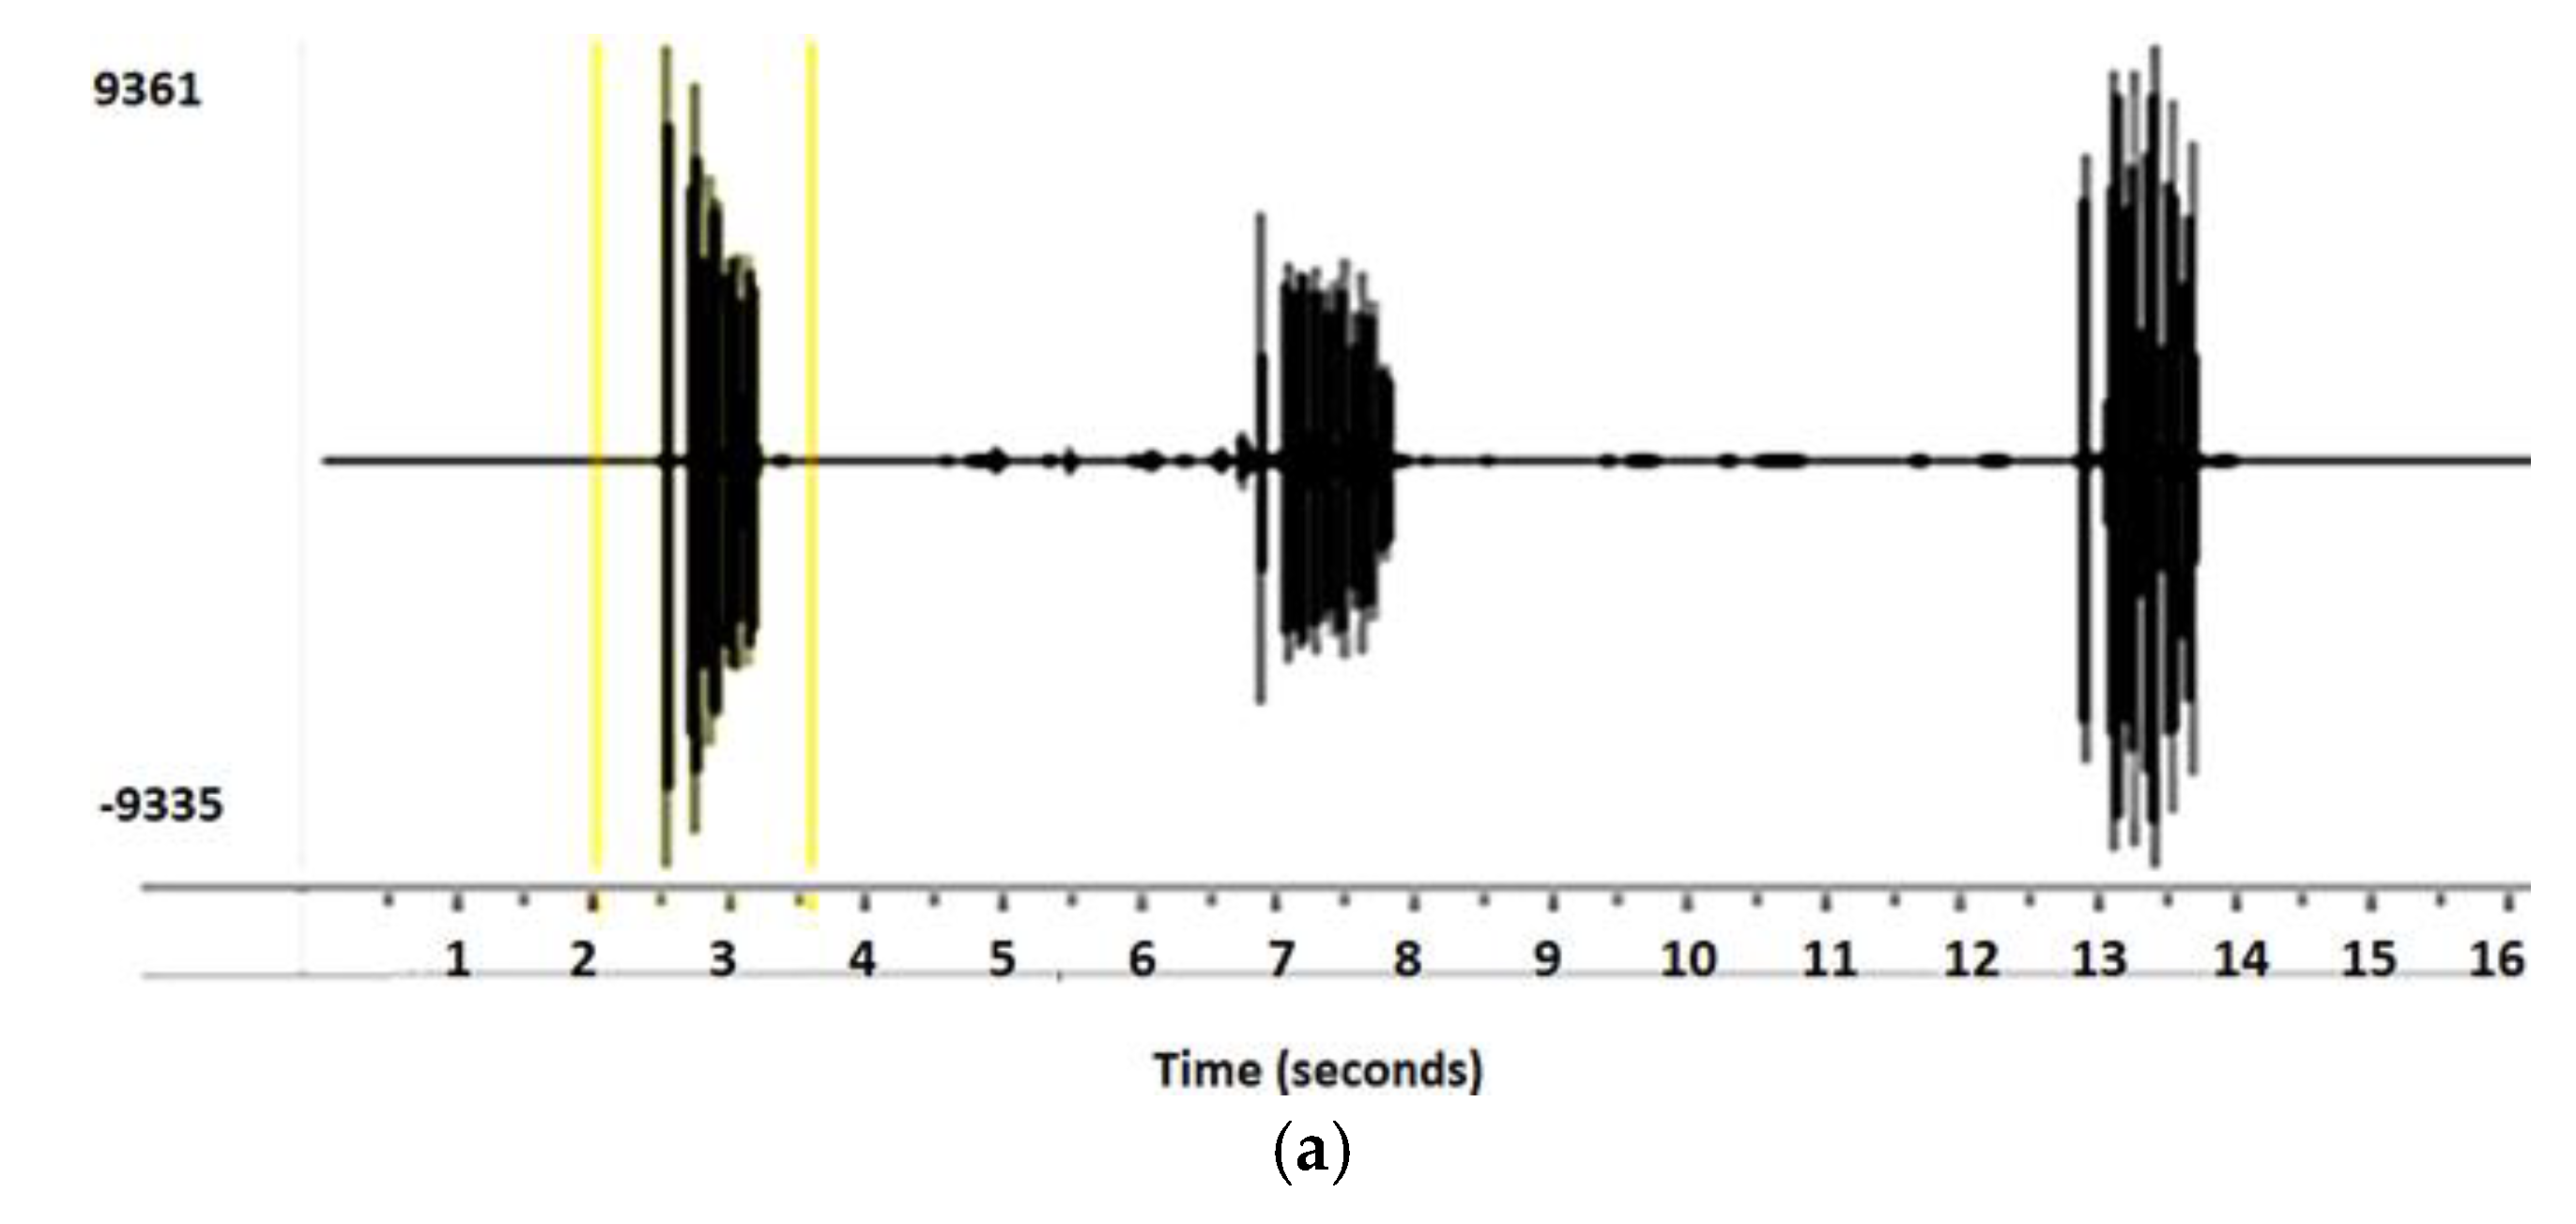
The Xeno-Canto recording (ID XC189206) of Tickell’s Leaf Warbler is taken for the experiment. Tickell’s Leaf Warbler produces the same syllable in a sequence, with the minute time interval shown in
Figure 3a. This picture when zoomed shows clearly the repetition of the same sequence as demonstrated in
Figure 3b. For the classification results, the single syllable reveals sufficient information for this monosyllabic bird.
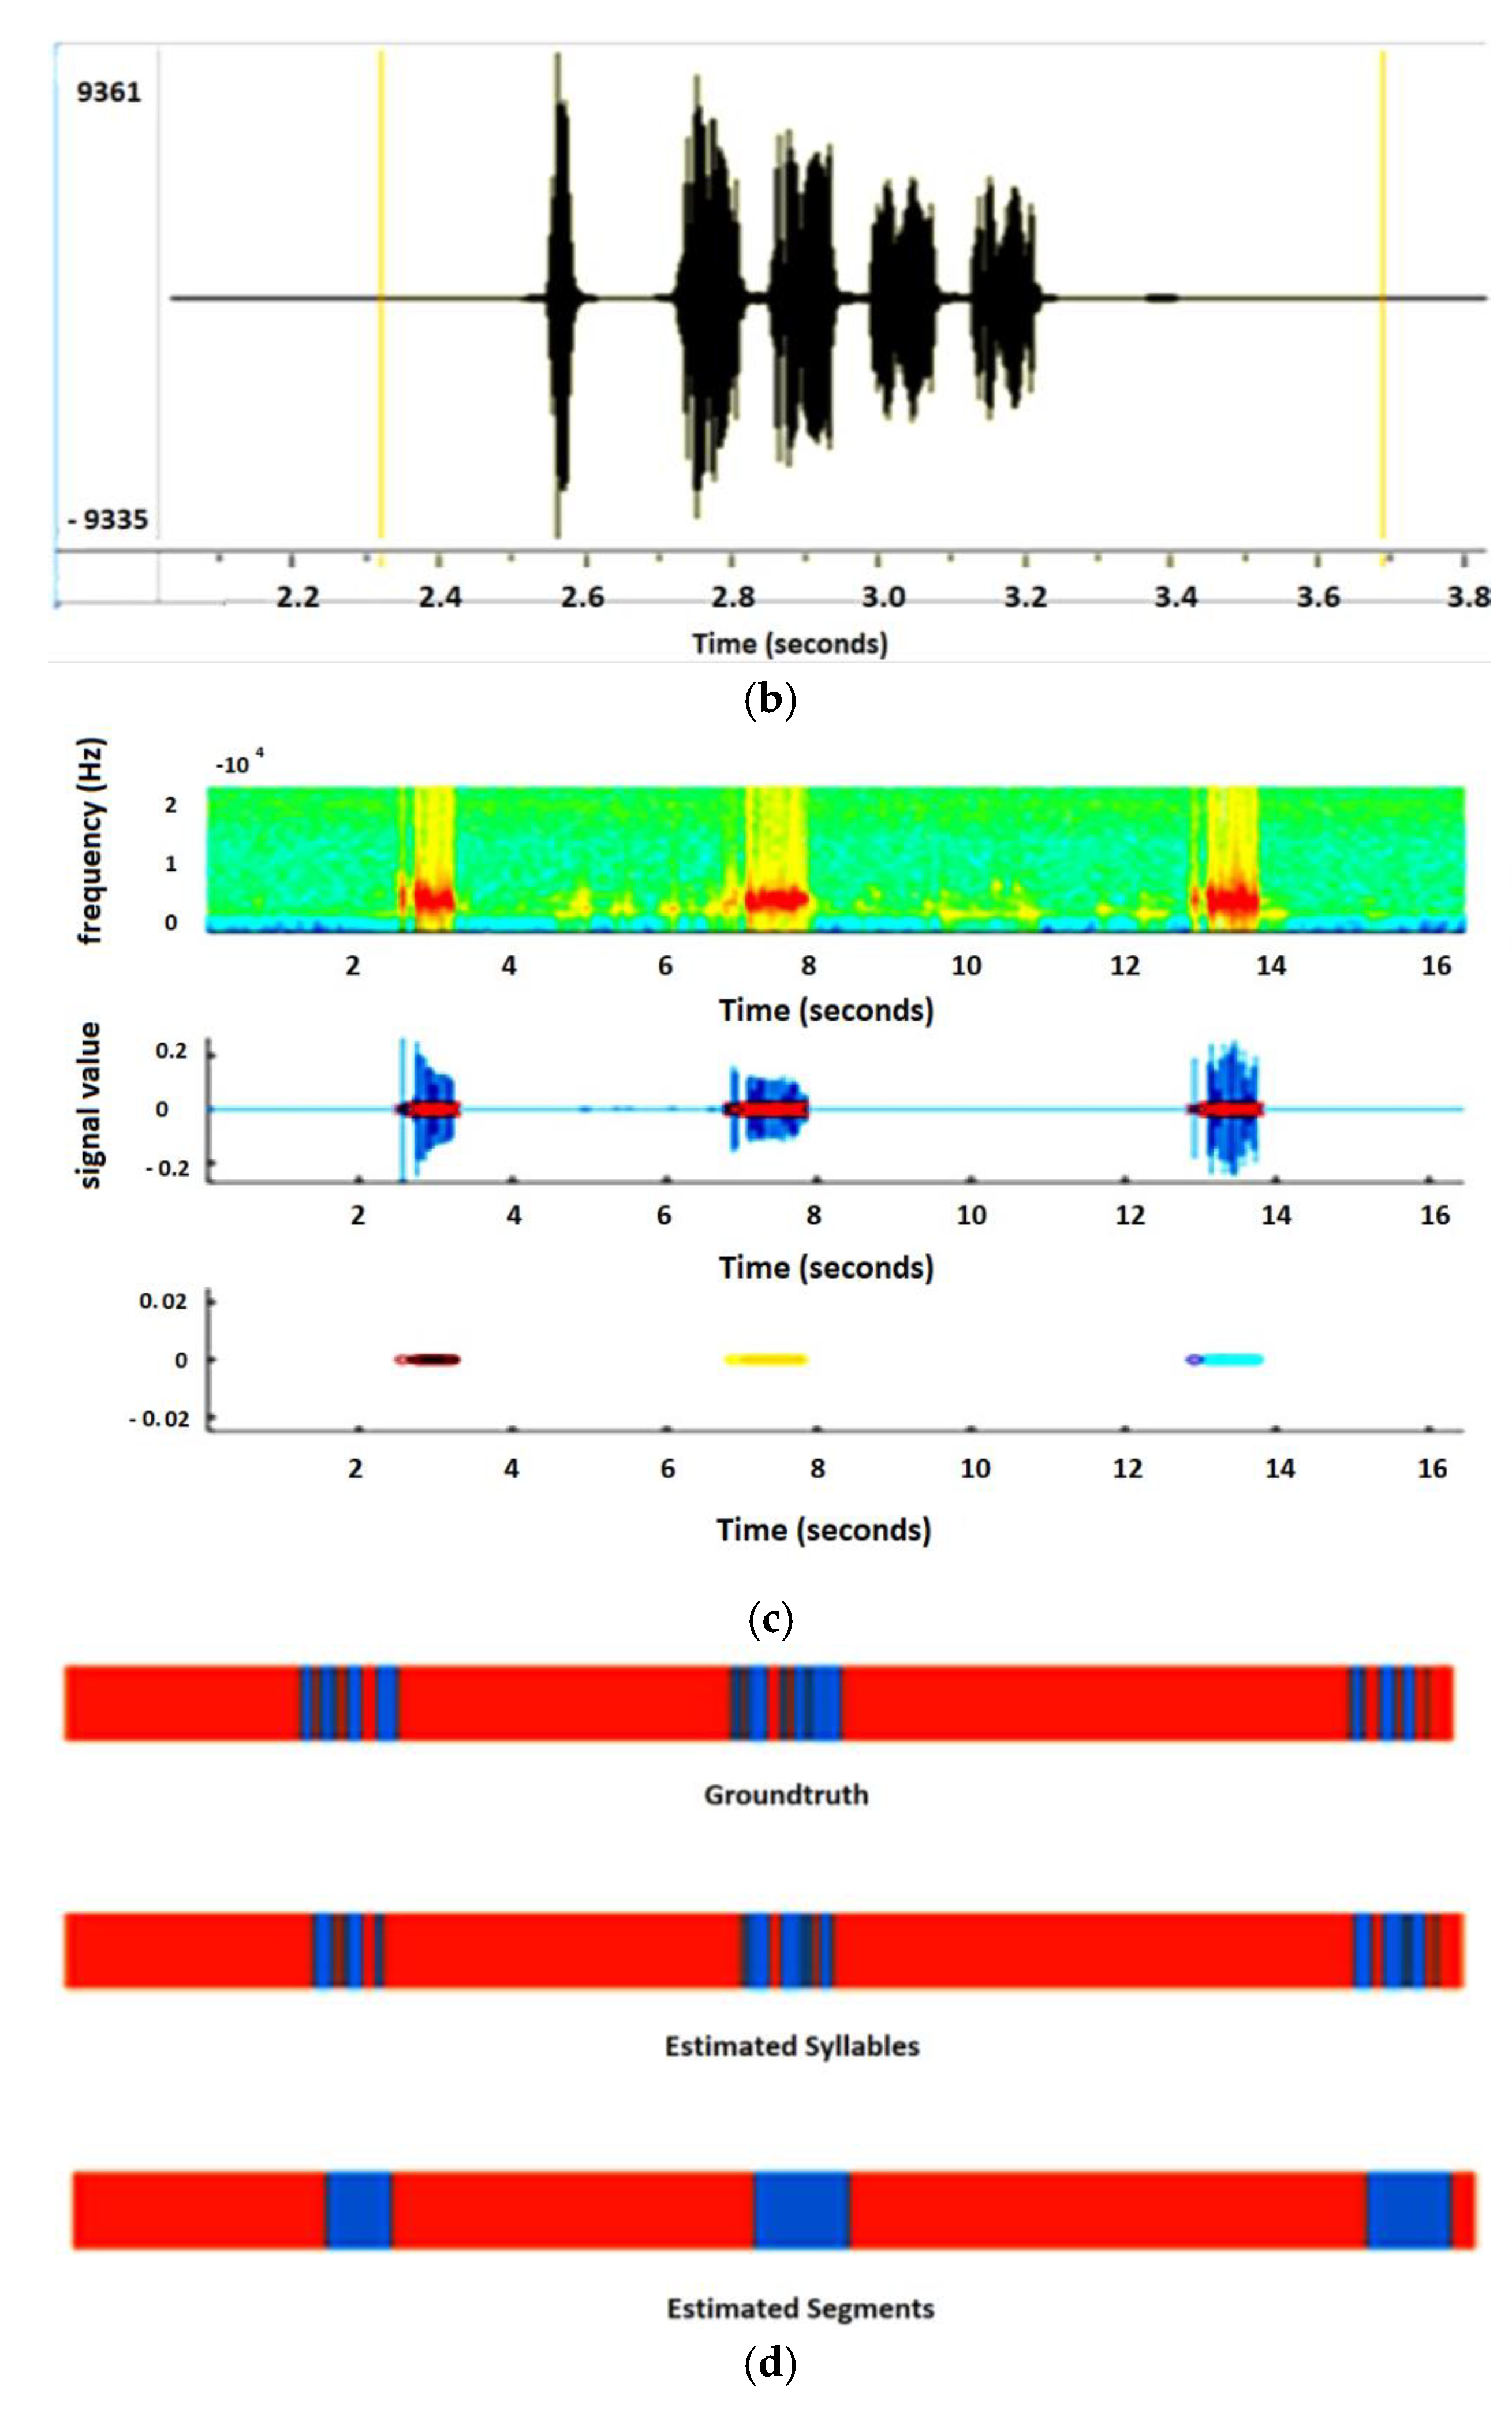
In this case, Algorithm B is not required to merge the isolated syllable. The results of both algorithms are shown in
Figure 3c. The syllables are close to each other, hence red crosses are overlapped. To analyze the accuracy of the segmentation algorithm, results are compared with the handcrafted segmentation as shown in
Figure 3d. In
Figure 3d every single syllable is represented by blue sections. The results obtained by Algorithm A are close to the ground truth.
The recording is taken from Xeno-Canto (recording ID XC189206). The single syllable is extracted by applying Algorithm A and then Algorithm B to merge the consecutive syllables. Panel (a) shows the waveform of the birdsong with the silent interval. Panel (b) illustrates the zoom view of a segment of birdsong, where we can analyze the same pattern of each syllable that shows that it repeats. In panel (c), the outcomes after applying Algorithm A and B is given. The top image is a spectrogram of syllables where the red area represents the high frequency in the audio. By applying Algorithm A this high-frequency area is taken as a syllable and each syllable is extracted separately, shown in the middle image, while the last image of this panel gives the results of Algorithm B that has merged the consecutive syllables. In panel (d), the ground truth is compared with the performance of algorithms.
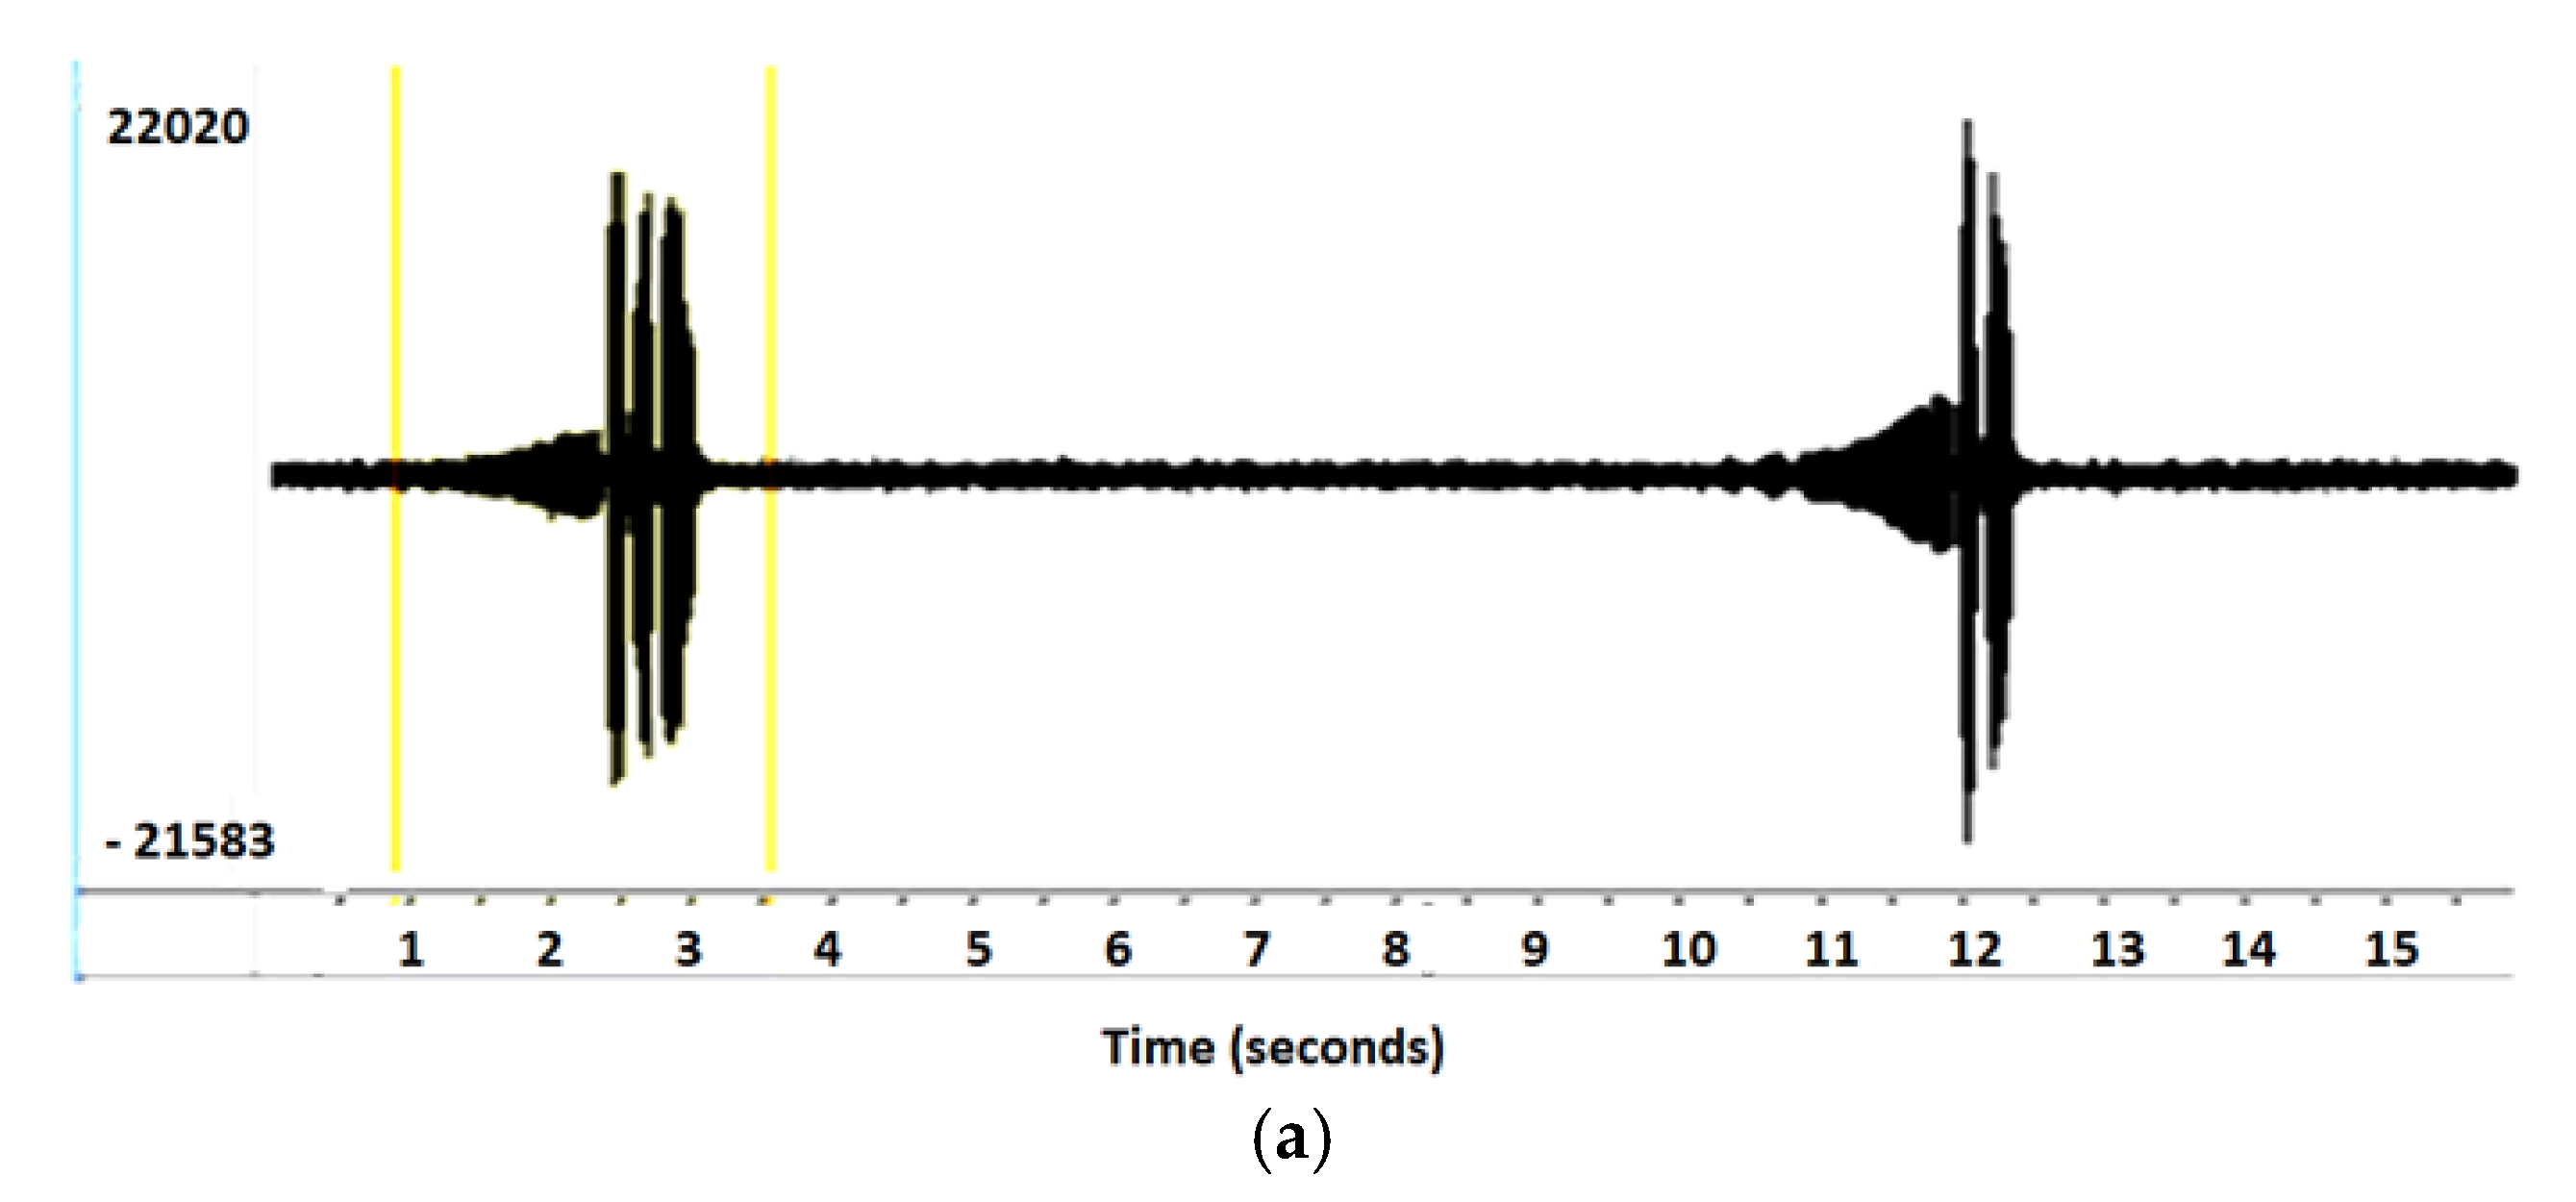
The second experiment is based on the syllable extraction of multisyllabic birds. The audio recording is taken from the Xeno-Canto (Recording ID XC109972 Brown-Flanked Bush Warbler).
Figure 4a shows the syllable sequences of the Brown-Flanked Bush Warbler, which vocalizes two sequences (phrases) with a time interval of approximately seven seconds.
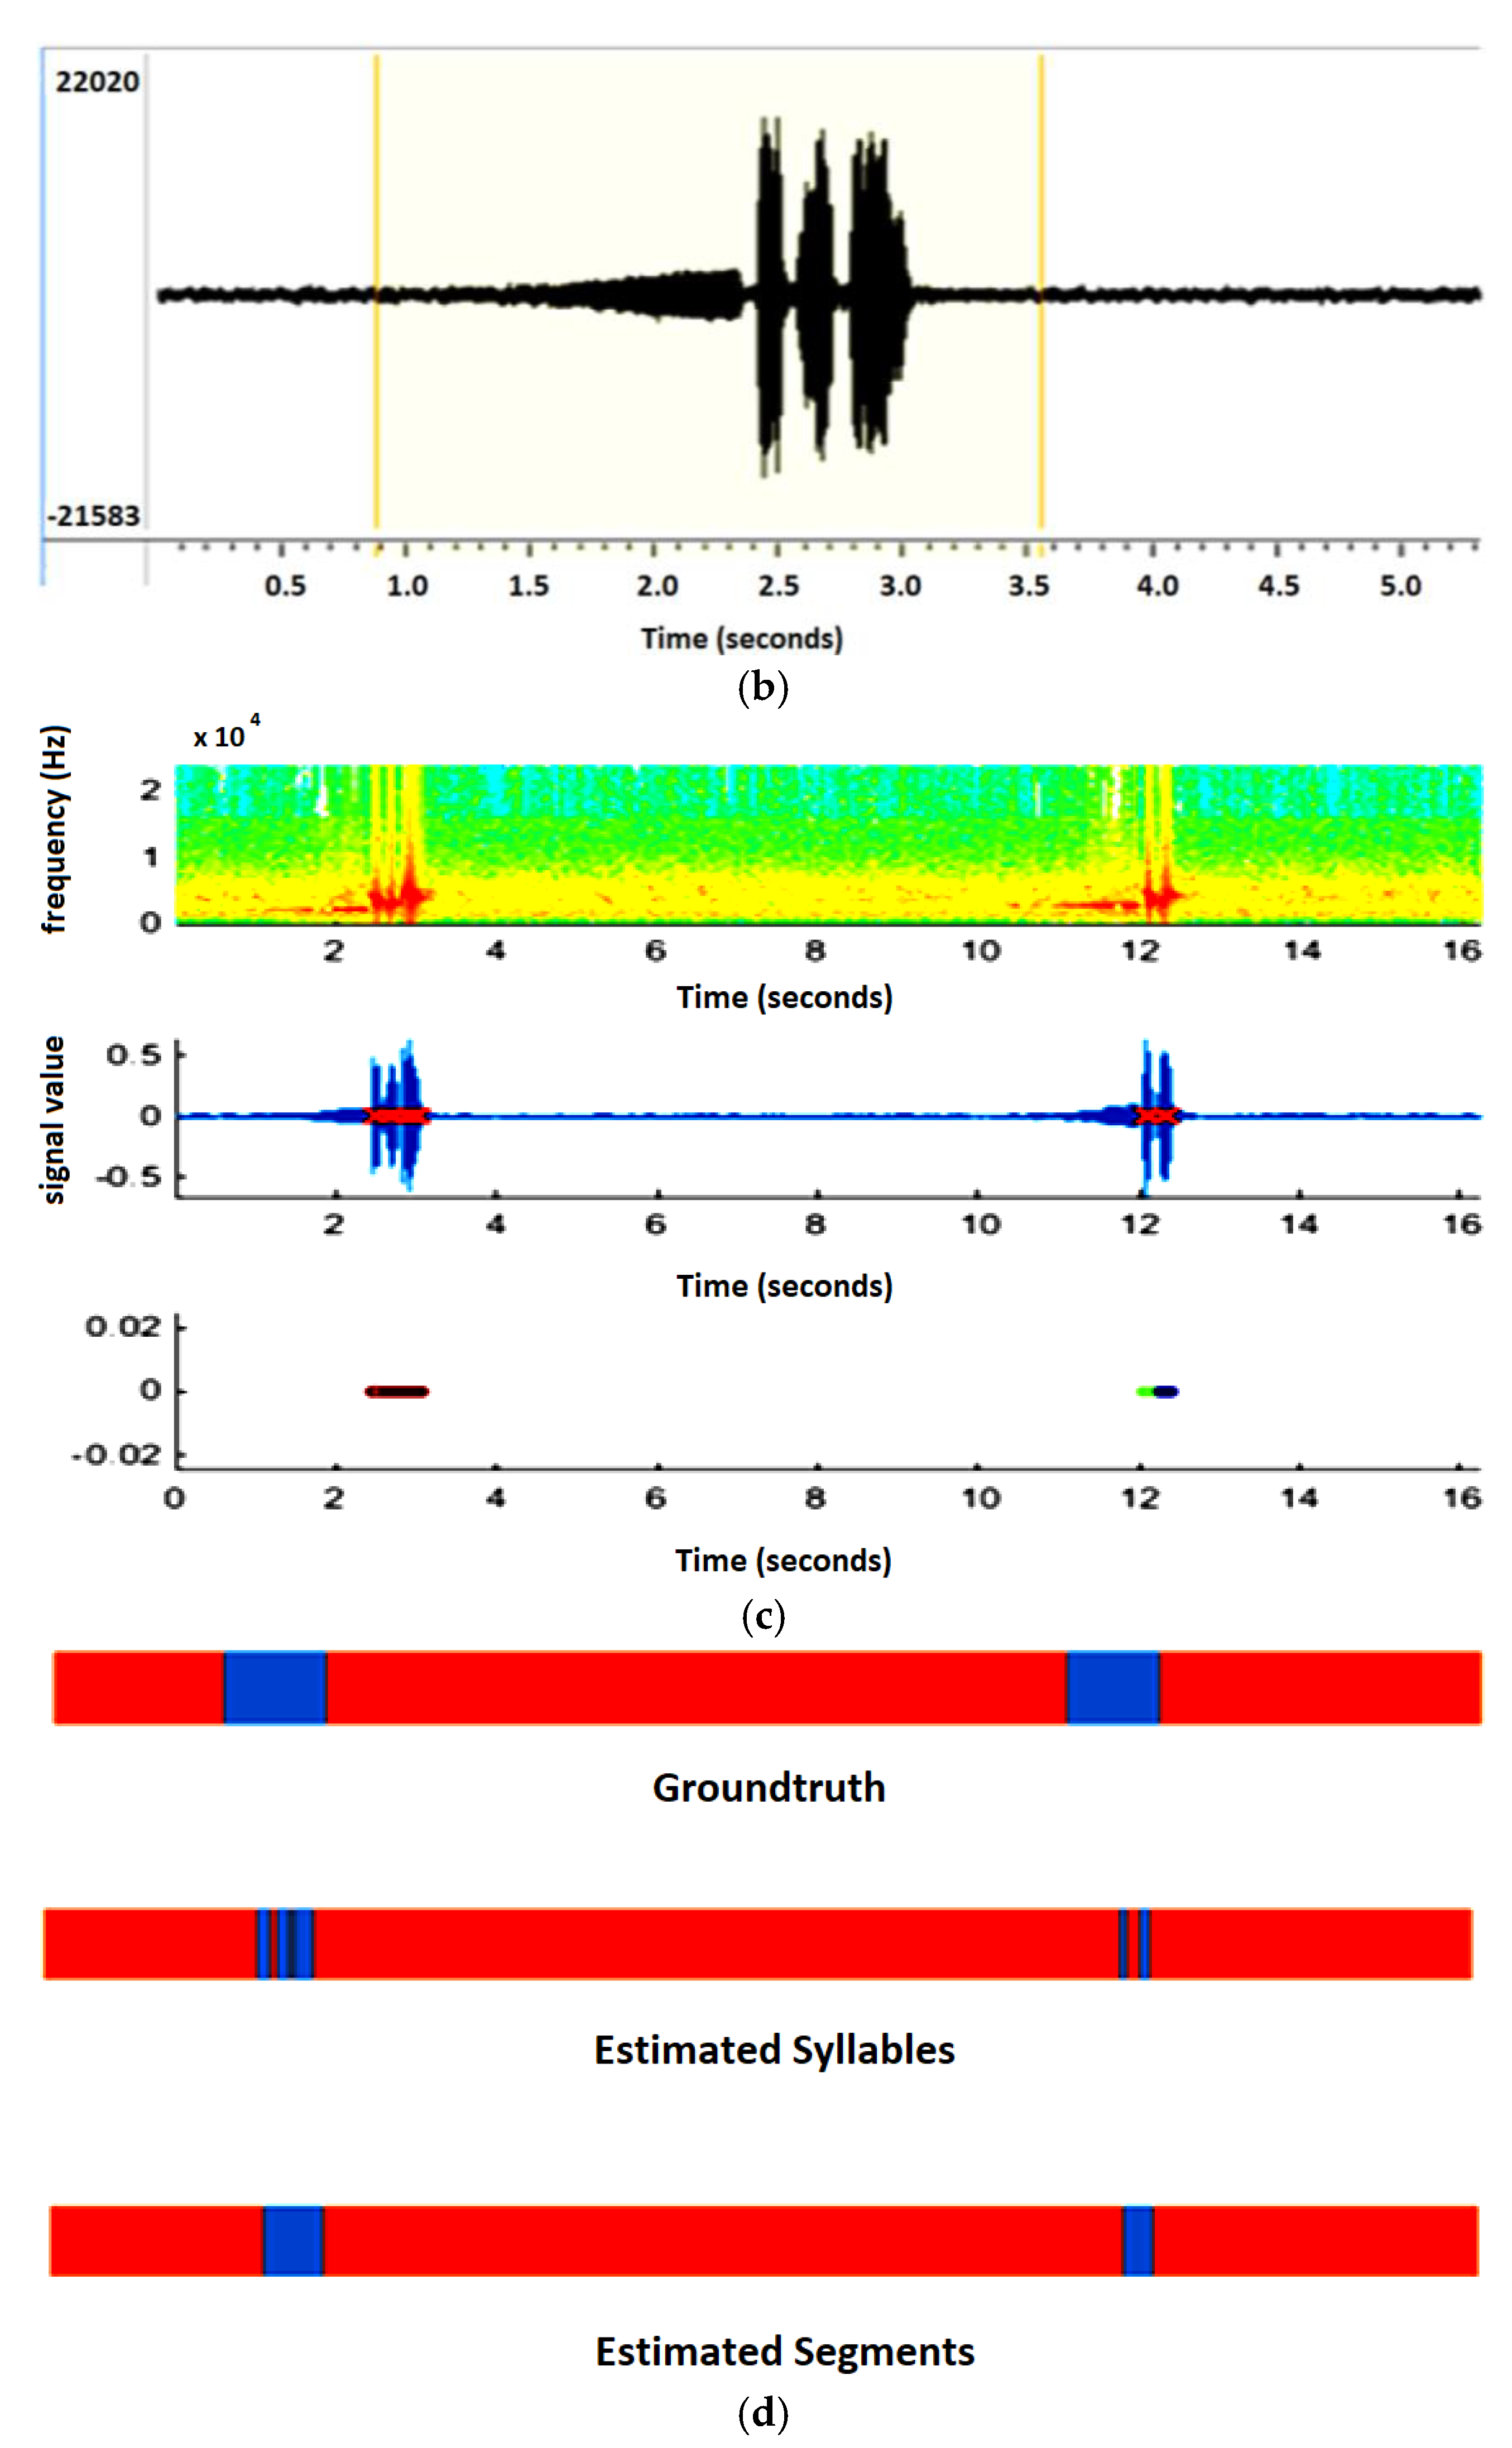
Figure 4b shows the zoom-in view of the first sequence. It is seen that it produced four different syllables with an interval of a few milliseconds. When Algorithm A is applied for segmentation to the above-mentioned recording the obtained results are shown in
Figure 4c. The top section shows the spectrogram of the syllables, and the middle section represents the waveform, where the red crosses show the extracted syllables. These closest syllables are merged by applying Algorithm B to make a segment, and this segmented area is shown in the third section of
Figure 4c.
The recording is taken from Xeno canto (recording ID XC109972). The single syllable is extracted by applying Algorithm A and Algorithm B merges the consecutive syllables. Panel (a) shows the waveform of the birdsong with the silent interval. Panel (b) illustrates the zoom view of a segment of birdsong, where we can analyze the pattern of each syllable that shows that it repeats different syllables in a specific pattern. In panel (c), the outcomes after applying Algorithm A and B is given. The top image is a spectrogram of syllables where the red area represents the high frequency in the audio. By applying Algorithm A this high-frequency area is taken as a syllable and each syllable is extracted separately, shown in the middle image, while the last image of this panel gives the results of Algorithm B after merging the consecutive syllables. In panel (d), the ground truth is compared with the performance of the algorithms.
In
Figure 4d, the results of segmentation through the defined algorithms are compared with the handcrafted segmentation, where the handcrafted segmentation is represented by the ground truth. The estimated segmentation is generated by combining the syllables from Algorithm B that are near to the ground truth as compared to the syllable extraction from Algorithm A. It is also found that the low starting and ending values of the syllable are missing in the automatically extracted syllables. This is because the presented algorithm is not able to extract values less than the threshold. If the value of the threshold is reduced to detect the lower values of the syllable, then many small sections are created in the audio.
7. Evaluating the Performance of the Segmentation Algorithm
A single syllable is taken for the monosyllabic bird by using Algorithm A and a sequence of syllables is merged for multisyllabic birds by applying Algorithm B. The performance of both algorithms is examined separately.
7.1. Individual Syllable Extraction of Monosyllabic Birds (Algorithm A)
The number of extracted syllables from handcrafted segmentation (actual number of syllables in a recording) and segmentation through algorithm Aare compared in
Table 2. For this experiment, two recordings of each bird are taken from dataset A for monosyllabic birds and analyzes how many syllables are correctly extracted from each recording.
7.2. Extracted Sequence of Syllables for Multisyllabic Birds (Algorithm B)
In
Table 3, the number of extracted syllables from handcrafted segmentation and segmentation through Algorithm B is compared to examine the performance of Algorithm B. The dataset C of multisyllabic birds is used for the segmentation of successive syllables. In some recordings of multisyllabic birds, only two syllables are found as seen in
Table 3. In order to make an equal number of syllables for each species, 20 syllables are taken for experiment.
In the above experiments, two recordings of each bird are taken to evaluate the performance of the algorithms. It is observed that in some cases the algorithm-based segmentation provides a slightly large number of syllables, which indicates that it captures some signals of high-pitched noise.
In a few cases, the presented algorithms missed low-frequency syllables. This is due to the fact that the proposed methodology uses two types of filter for noise removal, which causes the removal of some low-frequency syllables.
7.2.1. Performance Evaluation Classifier
In order to analyze the performance of feature sets of monosyllabic and multisyllabic datasets, the experiments are conducted on individual feature sets as well as by combining them. The dimension of feature vectors is given in
Table 4.
The performance of the feature set is evaluated on different classifiers. However, most of the experiments are based on ANN.
7.2.2. Step of ANN
- (i)
A two-layer Feed Forward Neural Network.
- (ii)
50 hidden units.
- (iii)
The backpropagation algorithm is used to train the ANN.
- (iv)
Performance is evaluated by the percentage accuracy of the test dataset.
- (v)
The average accuracy of five different retrains is taken to represent the result of ANN.
On every retrain of ANN slightly different results are found because of the random initialization of the parameters; therefore, average results of five different retrains are taken to show the performance of ANN in the experiments. The network trains continuously until it meets one of the following stopping criteria,
- (i)
Maximum number of epochs = 1000
- (ii)
Minimum performance gradient = 10−6
- (iii)
Maximum validation failures = 6
7.3. Classification without Preprocessing and Segmentation
The accuracy rate is significantly improved by applying the preprocessing and segmentation algorithms for both types of dataset (datasets A and B from Monosyllabic birds, Dataset C, and D from Multisyllabic birds) as shown in
Table 5. This experiment is carried out using the proposed feature vector ‘Perceptual, Descriptive and Harmonic Features (PDHFs)’ for parameterization of bird sound, and ANN for classification.
7.3.1. Performance of Perceptual, Descriptive, and Harmonic Features (PDHFs) on Different Classifiers
The performance of the proposed feature vector is analyzed using different classifiers such as Euclidean, Bayesian, SVM (Support Vector Machine), and ANN on different datasets (Monosyllabic and Multisyllabic birds). The result of the experiment is shown in
Table 6. ANN produces consistently good results as compared to other classifiers.
7.3.2. Performance of Perceptual, Descriptive, and Harmonic Features (PDHFs) on Different Classifiers
It is found by the above experiment that the PDHFs performed well on the ANN to classify different species of birds. In this experiment, we examined the classification performance on different datasets of monosyllabic birds and multisyllabic birds. The classification results of five different species of monosyllabic birds are 95% and 98% accurate for dataset A and dataset B, respectively. Furthermore, we combined dataset A and dataset B to examine the performance of classification for 10 species and the obtained accuracy is 96.7%. This shows that the increment in the number of species of monosyllabic birds does not affect the classification results by using PDHFs, as shown in
Table 7. The performance of PDHFs is consistently better than the individual feature sets for each dataset.
The multisyllabic birds are classified separately to analyze the performance of the proposed classification model. The results given in
Table 7 show that the feature set for PDHFs performed well as compared to the individual feature set. The highest accuracy obtained in classifying five different species of multisyllabic birds was 86.7%. The accuracy rate in classifying ten species is slightly less. As given in
Table 7, the accuracy in classifying 10 species is 80% while the accuracy in classifying 5 bird species is 87% for both datasets (dataset C and D). This shows that the performance of PDHFs is consistent as compared to individual feature vectors on different datasets.
Moreover, Dataset A for monosyllabic birds and dataset C for multisyllabic birds are merged to analyze the performance of classification. The results depict that the accuracy of classification has significantly decreased after merging the datasets compared to when the classification was performed separately for both monosyllabic and multisyllabic birds, respectively.
To conclude, the feature extraction and classification are performed on segmented syllables (single syllables for monosyllabic birds and sequences of syllables for multisyllabic birds). In
Table 7, the number of classes is increased for monosyllabic birds by adding A and B datasets, to dataset C and D combined in multisyllabic birds, and there is a slight effect on accuracy. However, when we combined dataset A for monosyllabic birds and dataset C for multisyllabic birds, the accuracy of the system is highly affected. Therefore, it is concluded that both kinds of vocalization have to be classified separately.
This is the main consideration of this research work; when we classify the dataset of different patterns of vocalization, monosyllabic and multisyllabic birds together, the accuracy is reduced. It is also shown in
Table 7 that the accuracy of TDFs and MFCCs is reduced when we combined datasets for monosyllabic and multisyllabic birds while FDFs performed well, which indicates that syllables have fewer discriminant features in the time domain. In PDHFs all features are combined, and where TDFs and MFCCs are not performing well on a combined dataset, this affects the accuracy.
7.4. Comparison of Proposed Methods with State of the Art Methods
It is important to note that all the existing methods in the literature have used different databases, but this comparison aims to show that the PDHF feature set presented in the proposed study performed well when we compared the achieved results with state-of-the-art methods. It is worthy to note that previously proposed methods were used to classify bird species without differentiating them as monosyllabic and multisyllabic. On the other hand, the present study focused on the segmentation and classification of monosyllabic and multisyllabic birds separately. As per the best of our knowledge, no study was previously found on monosyllabic and multisyllabic birds separately. Therefore, it is claimed by the authors that, since monosyllabic and multisyllabic birds have a different pattern of vocalization, therefore it is essential to deal with them separately for better classification results. In short, the present study proposed a unique PDHF feature set and a unique work that deals with mono and multisyllabic birds separately.
Table 8 shows the comparison of the proposed methods.
8. Conclusions
It is recommended to segment the most appropriate part of the recording to make classification more accurate. In this regard, two different techniques are used to extract the syllables of two different types of bird vocalization: monosyllabic and multisyllabic.
We extract single syllables for monosyllabic birds as they repeat the same syllable pattern. Experimental results show that the actual number of syllables in the recordings is very close to the number of syllables extracted by the segmentation algorithms. The segmentation of multisyllabic birds is slightly different from monosyllabic birds. Multisyllabic birds produce a different pattern of syllables in a sequence; hence we apply another algorithm referred to as Algorithm B to merge the consecutive syllables of multisyllabic birds. By merging the syllables, the particular patterns of syllables of multisyllabic birds are sustained. The extracted syllables and actual number of syllables are given in
Table 3. In some audios of both types of dataset, the extracted number of syllables is higher than the actual syllables in the recording. This is because noise with high frequencies is also extracted as a syllable. On the other hand, some lower frequency syllables are missing because we have applied two low pass filters to remove noise. The slight difference in the actual number of syllables and extracted syllables is acceptable because algorithm-based segmentation makes the bird identification task close to real-world application.
In order to classify the birds with significant accuracy, it is crucial to extract relevant features. We proposed a combination of perceptual, descriptive (time-domain features and frequency domain features), and harmonic features (PDHFs) to deal with the discriminant properties of birdsong. This combination of feature sets provides consistent results and significant improvement inaccuracy. This is because birds’ vocalization varies from one species to another; some birdsongs are harmonic, some birds produce a song with large energy bands, while some birds produce unusually low-pitched songs [
13]. Therefore, the proposed PDHF combination of features deals with the different parameters of birdsong and provides better results as compared to the individual feature set.
The PDHFs perform well on Artificial Neural Network (ANN) as compared to Euclidean, Bayesian, and SVM classifiers, as shown in
Table 5. The reason is that, by combining different feature sets, the PDHFs become a high-dimensional feature vector. ANN, due to its nonlinearity, provides better decision boundaries as compared to linear classifiers for proposed high dimension feature set PDHFs. ANN produced 98% and 87% accuracy for monosyllabic and multisyllabic birds, respectively. On the other hand, linear classifiers provide a low rate of accuracy in classifying different bird species using PDHFs.
Another experiment is performed to analyze the classification results in which we use a dataset consisting of both monosyllabic and multisyllabic birds. It is found that the accuracy reduced to 52% by merging datasets for two different vocalizations. Therefore, it is better to perform the classification task separately for different types of birdsongs.
To conclude this paper, there are certain limitations to the proposed approach. There are too many bird species around the world. Hence it is hard to classify all under one framework. Therefore, recent studies [
30] categorized birds according to their pattern of vocalization, then proceeded with further individual species’ classification. The presented research article focused on the impact of classification when two different types of vocalization are classified separately or as a merged dataset. The results of
Table 7 clearly show that accuracy is decreased when we merged two different types of dataset.
In monosyllabic birds, the same pattern of syllables is repeated with a variant duration of the silent interval. Merging the syllables with silent intervals caused variation in temporal features for the same species, for example, the ZCR of the silent interval is null. Therefore, we calculated the ZCR of a short time frame and then took its mean and standard deviation to generate a feature set.
As far as future work is concerned, the proposed work can be extended in various ways. One of the future works planned is to design a classifier that can categorize the patterns of bird vocalization, such as monosyllabic birds, multisyllabic birds and tonal birds, etc. In particular, one can develop a two-step classification strategy: the first classifier to decide monosyllabic vs. multisyllabic and the second classifier to decide the correct bird.
Author Contributions
Conceptualization, A.A., T.M. and R.I.; methodology, T.M., M.L., N.I. and M.H.; formal analysis, A.A., A.S. and N.I.; software, validation, writing—original draft preparation, A.A., and T.M.; writing—review and editing, M.L., M.H. and A.S.; supervision, project administration, and funding acquisition, A.A. and A.S. All authors have read and agreed to the published version of the manuscript.
Funding
The authors express their gratitude to the ministry of education and the deanship of scientific research of Najran University, Kingdom of Saudi Arabia, for financial and technical support under code number NU/ESCI/17/077.
Conflicts of Interest
The authors declare no conflict of interest.
References
- Gregory, R.D.; Gibbons, D.W.; Donald, P.F. Bird census and survey techniques. In Bird Ecology and Conservation; Oxford University Press: New York, NY, USA, 2004; pp. 17–56. [Google Scholar]
- Adi, K.; Johnson, M.T.; Osiejuk, T.S. Acoustic censusing using automatic vocalization classification and identity recognition. J. Acoust. Soc. Am. 2010, 127, 874–883. [Google Scholar] [CrossRef] [PubMed]
- Zhang, N.; Donahue, J.; Girshick, R.; Darrell, T. Part-based R-CNNs for fine-grained category detection. In Proceedings of the European Conference on Computer Vision, Zurich, Switzerland, 6–12 September 2014. [Google Scholar]
- Lu, D.; Weng, Q. A survey of image classification methods and techniques for improving classification performance. Int. J. Remote Sens. 2007, 28, 823–870. [Google Scholar] [CrossRef]
- Nanni, L.; Costa, Y.M.; Lucio, D.R.; Silla, C.N.; Brahnam, S. Combining visual and acoustic features for audio classification tasks. Pattern Recognit. Lett. 2017, 88, 49–56. [Google Scholar] [CrossRef]
- Nanni, L.; Aguiar, R.L.; Costa, Y.M.; Brahnam, S.; Silla, C.N.; Brattin, R.L.; Zhao, Z. Bird and whale species identification using sound images. IET Comput. Vis. 2017, 12, 178–184. [Google Scholar] [CrossRef]
- Acevedo, M.A.; Corrada-Bravo, C.J.; Corrada-Bravo, H.; Villanueva-Rivera, L.J.; Aide, T.M. Automated classification of bird and amphibian calls using machine learning: A comparison of methods. Ecol. Inform. 2009, 4, 206–214. [Google Scholar] [CrossRef]
- Lee, C.H.; Hsu, S.B.; Shih, J.L.; Chou, C.H. Continuous birdsong recognition using Gaussian mixture modeling of image shape features. IEEE Trans. Multimed. 2012, 5, 454–464. [Google Scholar] [CrossRef]
- Neal, L.; Briggs, F.; Raich, R.; Fern, X.Z. Time-frequency segmentation of bird song in noisy acoustic environments. In Proceedings of the IEEE International Conference on Acoustics, Speech and Signal Processing (ICASSP), Prague, Czech Republic, 22–27 May 2011. [Google Scholar]
- Oliveira, A.G.; TVentura, M.; Ganchev, T.D.; Figueiredo, J.M.; Jahn, O.; Marques, M.I.; Schuchmann, K.-L. Bird acoustic activity detection based on morphological filtering of the spectrogram. Appl. Acoust. 2015, 98, 34–42. [Google Scholar] [CrossRef]
- Koops, H.V.; van Balen, J.; Wiering, F. Automatic Segmentation and Deep Learning of Bird Sounds. In Proceedings of the International Conference of the Cross-Language Evaluation Forum for European Languages, Toulouse, France, 8–11 September 2015; Springer: Cham, Germany, 2015. [Google Scholar]
- Somervuo, P.; Harma, A.; Fagerlund, S. Parametric representations of bird sounds for automatic species recognition. IEEE Trans. Audio Speech Lang. Process. 2006, 14, 2252–2263. [Google Scholar] [CrossRef]
- Stowell, D.; Plumbley, M.D. Birdsong and C4DM: A Survey of UK Birdsong and Machine Recognition for Music Researchers; Technical Report (C4DM-TR-09-12); Centre for Digital Music, Queen Mary, University of London: London, UK, July 2010. [Google Scholar]
- Harte, N.; Murphy, S.; Kelly, D.J.; Marples, N.M. Identifying new bird species from differences in birdsong. In Proceedings of the INTERSPEECH, Lyon, France, 25–29 August 2013. [Google Scholar]
- Trifa, V.M.; Kirschel, A.N.; Taylor, C.E.; Vallejo, E.E. Automated species recognition of antbirds in a Mexican rainforest using hidden Markov models. J. Acoust. Soc. Am. 2008, 123, 2424–2431. [Google Scholar] [CrossRef] [PubMed] [Green Version]
- Cheng, J.; Sun, Y.; Ji, L. A call-independent and automatic acoustic system for the individual recognition of animals: A novel model using four passerines. Pattern Recognit. 2010, 43, 3846–3852. [Google Scholar] [CrossRef]
- Juang, C.F.; Chen, T.M. Birdsong recognition using prediction-based recurrent neural fuzzy networks. Neurocomputing 2007, 71, 121–130. [Google Scholar] [CrossRef]
- Chu, W.; Blumstein, D.T. Noise robust bird song detection using syllable pattern-based hidden Markov models. In Proceedings of the 2011 IEEE International Conference on Acoustics, Speech and Signal Processing (ICASSP), Prague, Czech Republic, 22–27 May 2011. [Google Scholar]
- Selin, A.; Turunen, J.; Tanttu, J.T. Wavelets in recognition of bird sounds. EURASIP J. Adv. Signal Process. 2007, 051806. [Google Scholar] [CrossRef] [Green Version]
- Nanni, L.; Costa, Y.M.; Lucio, D.R.; Silla, C.N.; Brahnam, S. Combining visual and acoustic features for bird species classification. In Proceedings of the IEEE 28th International Conference on Tools with Artificial Intelligence (ICTAI), San Jose, CA, USA, 6–8 November 2016. [Google Scholar]
- Qian, K.; Zhang, Z.; Ringeval, F.; Schuller, B. Bird sounds classification by large scale acoustic features and extreme learning machine. In Proceedings of the IEEE Global Conference on Signal and Information Processing (GlobalSIP), Orlando, FL, USA, 14–16 December 2015. [Google Scholar]
- Zhang, S.; Zhao, Z.; Xu, Z.; Bellisario, K.; Pijanowski, B.C. Automatic Bird Vocalization Identification Based on Fusion of Spectral Pattern and Texture Features. In Proceedings of the IEEE International Conference on Acoustics, Speech and Signal Processing (ICASSP), Calgary, AB, Canada, 15–20 April 2018. [Google Scholar]
- Lopes, M.T.; Junior, C.N.S.; Koerich, A.L.; Kaestner, C.A.A. Feature set comparison for automatic bird species identification. In Proceedings of the IEEE International Conference on Systems, Man, and Cybernetics, Anchorage, AK, USA, 9–12 October 2011. [Google Scholar]
- Härmä, A. Automatic identification of bird species based on sinusoidal modeling of syllables. In Proceedings of the IEEE International Conference on Acoustics, Speech, and Signal Processing (ICASSP’03), Hong Kong, China, 6–10 April 2003. [Google Scholar]
- Heller, J.R.; Pinezich, J.D. Automatic recognition of harmonic bird sounds using a frequency track extraction algorithm. J. Acoust. Soc. Am. 2008, 124, 1830–1837. [Google Scholar] [CrossRef] [PubMed]
- Sharing Bird Sounds from around the World; Xeno-Canto Foundation: Amsterdam, The Netherlands, 2012.
- Zhang, X.; Li, Y. Adaptive energy detection for bird sound detection in complex environments. Neurocomputing 2015, 155, 108–116. [Google Scholar] [CrossRef]
- Jančovič, P.; Köküer, M. Acoustic recognition of multiple bird species based on penalized maximum likelihood. IEEE Signal Process. Lett. 2015, 22, 1585–1589. [Google Scholar]
- Dong, X.; Towsey, M.; Truskinger, A.; Cottman-Fields, M.; Zhang, J.; Roe, P. Similarity-based birdcall retrieval from environmental audio. Ecol. Inform. 2015, 29, 66–76. [Google Scholar] [CrossRef]
- Yambem, S.D.; Chorol, S.; Jain, M. Structural and functional complexity of vocalizations in a cooperatively breeding passerine. Jungle Babbler. bioRxiv 2020. [Google Scholar] [CrossRef]
| Publisher’s Note: MDPI stays neutral with regard to jurisdictional claims in published maps and institutional affiliations. |
© 2021 by the authors. Licensee MDPI, Basel, Switzerland. This article is an open access article distributed under the terms and conditions of the Creative Commons Attribution (CC BY) license (http://creativecommons.org/licenses/by/4.0/).

 ,
, 


