
Real-Time Face Mask Detection Method Based on YOLOv3


1
Software College, Northeastern University, Shenyang 110004, China
2
School of Computer Science and Engineering, Northeastern University, Shenyang 110004, China
*
Author to whom correspondence should be addressed.
Electronics 2021, 10(7), 837; https://0-doi-org.brum.beds.ac.uk/10.3390/electronics10070837
Submission received: 11 March 2021
/
Revised: 27 March 2021
/
Accepted: 29 March 2021
/
Published: 1 April 2021
(This article belongs to the Section Computer Science & Engineering)
Abstract
:The rapid outbreak of COVID-19 has caused serious harm and infected tens of millions of people worldwide. Since there is no specific treatment, wearing masks has become an effective method to prevent the transmission of COVID-19 and is required in most public areas, which has also led to a growing demand for automatic real-time mask detection services to replace manual reminding. However, few studies on face mask detection are being conducted. It is urgent to improve the performance of mask detectors. In this paper, we proposed the Properly Wearing Masked Face Detection Dataset (PWMFD), which included 9205 images of mask wearing samples with three categories. Moreover, we proposed Squeeze and Excitation (SE)-YOLOv3, a mask detector with relatively balanced effectiveness and efficiency. We integrated the attention mechanism by introducing the SE block into Darknet53 to obtain the relationships among channels so that the network can focus more on the important feature. We adopted GIoUloss, which can better describe the spatial difference between predicted and ground truth boxes to improve the stability of bounding box regression. Focal loss was utilized for solving the extreme foreground-background class imbalance. Besides, we performed corresponding image augmentation techniques to further improve the robustness of the model on the specific task. Experimental results showed that SE-YOLOv3 outperformed YOLOv3 and other state-of-the-art detectors on PWMFD and achieved a higher 8.6% mAP compared to YOLOv3 while having a comparable detection speed.
1. Introduction
Coronavirus Disease 2019 (COVID-19) unexpectedly broke out in 2019 and has seriously affected the whole world. As of 26 March 2021, COVID-19 has infected more than 125 million people worldwide and caused over 2.7 million deaths [1]. One of the transmission routes of COVID-19 is through droplets of saliva or nasal secretions when an infected person coughs or sneezes, which is highly infectious and could be worse in crowded places. Since there is no specific treatment for COVID-19 [2], infections have to be limited through prevention methods. Studies have shown that wearing masks can reduce the risk of coronavirus transmission [3], which means wearing masks is currently one of the effective prevention methods [4]. According to the World Health Organization (WHO), the right way to wear a mask is by adjusting the mask to cover the mouth, nose, and chin [5]. The protection will be greatly reduced if masks are not worn properly. At present, security guards are arranged in public places to remind people to wear masks. However, this measure not only exposes the guards to the air that may contain the virus, but also leads to overcrowding at the entrances due to its inefficiency. Therefore, a fast and effective method is needed to address the situation.
Computer vision is an interdisciplinary scientific field that involves how computers gain advanced understanding from digital images or videos [6]. Traditional computer vision tasks include image processing, image classification, object detection, and image recognition. Object detection can detect instances of visual objects of a certain class in the images [7], which is a proper solution for the problem mentioned above. Consequently, mask detection has become a vital computer vision task to help the global society.
There has been some recent research addressing mask detection. RetinaMask [8] introduced a context attention module and transfer learning technique to RetinaNet, achieving 1.9% higher average accuracy than the baseline model. D. Chiang et al. [9] improved SSD with a lighter backbone network to perform real-time mask detection. However, both the accuracy and the speed of these approaches can be further improved. Meanwhile, most of the relevant studies only discussed whether to wear masks, without considering the situation of incorrect mask wearing. To guide the public away from the pandemic, detection of incorrect mask wearing needs to be discussed. Hence, building an appropriate dataset for mask detection and developing a corresponding detector are regarded as crucial issues.
In this paper, we proposed a new object detection method based on YOLOv3, named Squeeze and Excitation YOLOv3 (SE-YOLOv3). The proposed method can locate the face in real time and assess how the mask is being worn to aid the control of the pandemic in public areas. Our main contributions are depicted as follows:
- We built a large dataset of masked faces, the Properly-Wearing Masked Face Detection Dataset (PWMFD). Three predefined classes were included concerning the targeted cases.
- Combined with the channel dimension of the attention mechanism, the backbone of YOLOv3 was improved. We added the Squeeze and Excitation block (SE block) between the convolutional layer of Darknet53, which helped the model to learn the relationship between channels. The accuracy of the model was improved with negligible additional computational cost.
- We proposed an algorithmic improvement to the loss function of the original YOLOv3. We replaced the Mean Squared Error (MSE) with GIoU loss and employed focal loss to address the problem of extreme foreground-background class imbalance. Further analysis of these modifications in our experiments was done, which showed that with the SE block, GIoU loss, and focal loss, the mAP was improved by 6.7% from the baseline model.
- To adjust the model to application scenarios in the real world, we applied the mixup technique to further improve the robustness of the model. As shown in the results from the ablation experiment, the mixup training method led to a 1.8% improvement in the mAP.
The remainder of this paper is organized as follows: In Section 2, we briefly review related work in object detection and face mask detection. The proposed mask detection method is introduced in Section 3, and we present the experimental results in Section 4. Finally, we conclude the paper in Section 5.
2. Related Work
Object detection is a fundamental task in computer vision and widely applied in the applications of face detection [10], skeleton detection [11], pedestrian detection [12] and sign detection [13]. Face detection is always a hotspot in object detection. Due to the outbreak of the pandemic, face mask detection has attracted much attention and research.
2.1. CNN-Based Object Detectors
The Convolutional Neural Network (CNN) is a class of deep neural networks that are inspired by biological processes [14]. A CNN consists of a series of building blocks, such as the convolutional layer, pooling layer, and fully connected layer, and is capable of learning automatically and adaptively learning the spatial hierarchies of features through a backpropagation algorithm. The kernels of a CNN are shared across all the image positions, which makes it highly efficient with respect to the parameters. These properties make the CNN an ideal solution for computer vision tasks.
In recent years, with the great improvement of GPU computing power, deep learning technology has been booming. AlexNet [15], the champion model of the ImageNet Competition in 2012, utilizing a GPU for computing acceleration, has brought a rebirth to deep learning. As an important task in computer vision, object detection has also been greatly promoted. According to the proposed recommendations and improvement strategies, the current object detection methods can be divided into two categories: two-stage detectors and one-stage detectors [16].
2.1.1. Two-Stage Detectors
The two-stage method first generates a large number of region proposals for each image through a heuristic algorithm or CNN and then classifies them and regresses these candidate regions. As the earliest object detection method based on deep learning, R-CNN [17] belongs to a two-stage detector. R-CNN [18] firstly adopts selective search to generate a sparse set of candidate regions. Then, it extracts the features of the region through CNN and finally determines the class of each object by SVM and fine-tunes the bounding boxes using linear regression. Other common models are Fast R-CNN [19], Faster R-CNN [20], SPPNet [21], Feature Pyramid Network (FPN) [22], Cascade R-CNN [23], etc.
Although the two-stage detectors have good detection performances, their training phases are complex, and the testing speeds are usually slow, so they are not suitable for the real-time requirement.
2.1.2. One-Stage Detectors
In 2015, You Only Look Once (YOLO) [24], proposed by R. Joseph et al., broke the domination of two-stage detectors in object detection. Unlike the two-stage methods, YOLO directly classifies and predicts the target at each location on the whole original image. The network divides the image into grids and synchronously predicts the bounding boxes and the probability of each region. Compared with the two-stage detectors, YOLO has extremely fast detection speed with the cost of a reduction in positioning accuracy. Since then, R. Joseph et al. made some incremental improvements and proposed YOLOv2 [25] and YOLOv3 [26]. The anchor mechanism [27], a more powerful backbone network, multiscale trainings, etc., were introduced to further improve YOLO’s accuracy and speed. In addition to the YOLO series, SSD [28], RetinaNet [29], EfficientDet [30], and RefineDet [31] are representative models of one-stage object detection. Among them, RetinaNet [29] was proposed by T.-y. Lin et al., in 2017. They discovered that the extreme foreground-background class imbalance during the training phase of dense detectors was the main reason why the one-stage detectors’ accuracy was low. To address this issue, focal loss was proposed. Through the reconstruction of the standard cross entropy loss [32], the detector paid more attention to the samples that were difficult to classify in the training phase, enabling the one-stage detector to achieve comparable accuracy to two-stage detectors while maintaining a high detection speed.
2.2. Face Mask Detection
After the outbreak of the pandemic, masks have become a necessity for people’s lives, and the detection of masks on pedestrians has become an important direction. Wang et al. proposed a new anchor-level attention algorithm [33] for occluded face detection, which could boost the features of face regions and improve the accuracy by combining the anchor point allocation strategy and data expansion. However, the work by Wang et al. did not address the issue of mask detection. D. Chiang [9] built a face mask dataset composed of WIDERFace [34] and MAFA [35] and used SSD for detection, but for real-time performance, the number of parameters was compressed, resulting in an accuracy of only 89.6% on the dataset. RetinaMask [8], proposed by Jiang et al., introduced a Feature Pyramid Network (FPN) combined with a content attention mechanism and chose ResNet [36] or MobileNet [37] as the backbone network to work both on high- and low-computation hardware. Loey et al. [38] adopted the hybrid transfer learning model and machine learning methods for better feature extraction and classification. The final accuracy reached 99.64% on the Real-Time Face Dataset (RMFD) [39], 99.49% on the Masked Face Dataset (SMFD) [39], and 100% on the Labeled Faces in the Wild (LFW) dataset [40]. However, the detection speed was not discussed in [8,38]. Both works discussed above concentrated on the accuracy of detecting masks, and the speed of detection was not properly addressed. Moreover, these methods only detected masks and could not tell whether the masks were put on correctly.
Cabani et al. [41] proposed masked face images based on facial feature landmarks and generated a large dataset of 137,016 masked face images, which provided more data for training. Simultaneously, they developed a mobile application [42], which instructed people to wear masks correctly by detecting whether users’ masks covered their nose and mouth at the same time. However, the generated data in [41] might not be applicable to a real-world scenario to some extent, and they did not address the detection speed. We further built the PWMFD dataset by adopting the idea from Cabani et al.
2.3. Methods Based on YOLOv3
YOLOv3 [26] is an incremental version of the YOLO family. Following the anchor mechanism introduced in YOLO9000, YOLOv3 makes predictions from feature maps at three different levels. The feature maps are divided into grids, and the cells of the grids are placed with anchors of different sizes and aspect ratios, which are acquired by performing K-means on the dataset. Anchors are labeled as foreground if their IoU with any ground truth box is larger than the threshold of 0.3. Boxes’ center coordinates and sizes are regressed based on the positions and sizes of the anchors. Compared to using a fully connected layer to predict the coordinates of bounding boxes directly, the anchor-based mechanism can significantly improve the model’s recall on objects with small sizes. Instead of a softmax layer, YOLOv3 performs classifications with C binary classifiers, where C is the number of classes of the dataset. This alteration empowers YOLOv3 with the capacity to perform multi-label classification. Following the idea of the residual network, a deeper backbone network Darknet-53 was adopted in YOLOv3. Additionally, YOLOv3 applies a multi-scale training strategy, which further addresses the previous YOLO’s difficulty in detecting small objects.
YOLOv3 is competitive in both accuracy and speed, and it is robust in detecting different types of objects. As a result, YOLOv3 has been widely applied in industries, such as manufacturing and military. Many extended works on YOLOv3 have been proposed, which were mainly focused on speed, accuracy, and the model’s size. To fulfill the real-time requirement in electronic components manufacturing, Huang et al. [43] incorporated the MobileNet framework to lighten YOLOv3. The pointwise convolution layer in MobileNet is an effective substitute for the residual layers in DarkNet-53, with less computational complexity. With the lightweight improvement and marginal cost on accuracy, the model is two-times faster than the original model. Zhao et al. [44] proposed Mixed YOLOv3-LITE, which is aimed at embedded and mobile smart devices. Mixed YOLOv3-LITE employs the shallow backbone of YOLO-LITE to replace DarkNet-53 and adds a residual structure and parallel high-to-low-resolution subnetworks to achieve the fusion of shallow and deep features. The size of Mixed YOLOv3-LITE is reduced to 20.5 MB, which is 91.70% smaller than the original YOLOv3 model. GC-YOLOv3 [45] introduces a Global Context block and learnable fusion between the feature extraction network and the feature pyramid network. The global context block can build a long-range dependency relationship among all feature pixels in the feature map so that the model can focus on different regions. The learnable semantic fusion component makes use of the output of the extraction network, enhancing the head network’s capacity to recognize objects in the feature maps better. By adding these components, GC-YOLOv3 greatly improves the accuracy with a small amount of additional computation cost.
3. The Proposed Method
To achieve real-time mask detection and improve the accuracy of YOLOv3, we proposed a new object detector, SE-YOLOv3. Firstly, we introduced an attention mechanism to the backbone network, which can help the network allocate more resources to important features. Then, we employed GIoU and focal loss to accelerate the training process and further improve the performance. Finally, we adopted suitable data augmentation techniques for face mask detection to achieve robustness.
3.1. Base Framework
YOLOv3 [26] follows the idea of the anchor box in YOLOv2 [25], setting 9 anchor boxes referring to the area and aspect ratio. We performed k-means clustering on the data to get bounding box priors for the task. K-means is a commonly used clustering algorithm based on Euclidean distance. The hypothesis of K-means is that the data are generated from kexact centers and some Gaussian noise. It first picks k random points from the data as centroids and then assigns all the points to the closest cluster centroids. The centroids are recomputed on the newly formed clusters after the assignments. The assignment and centroids’ computation is repeated until the maximum number of iterations are reached or the centroids of newly formed cluster do not change.
The final anchor size is the center of the 9 clusters (such as P8, P2) shown in Figure 1. The bounding box priors on PWMFD are shown in Table 1. In this way, it can reduce the learning difficulty for the model and significantly improve the model’s detection performance of the target bounding box.
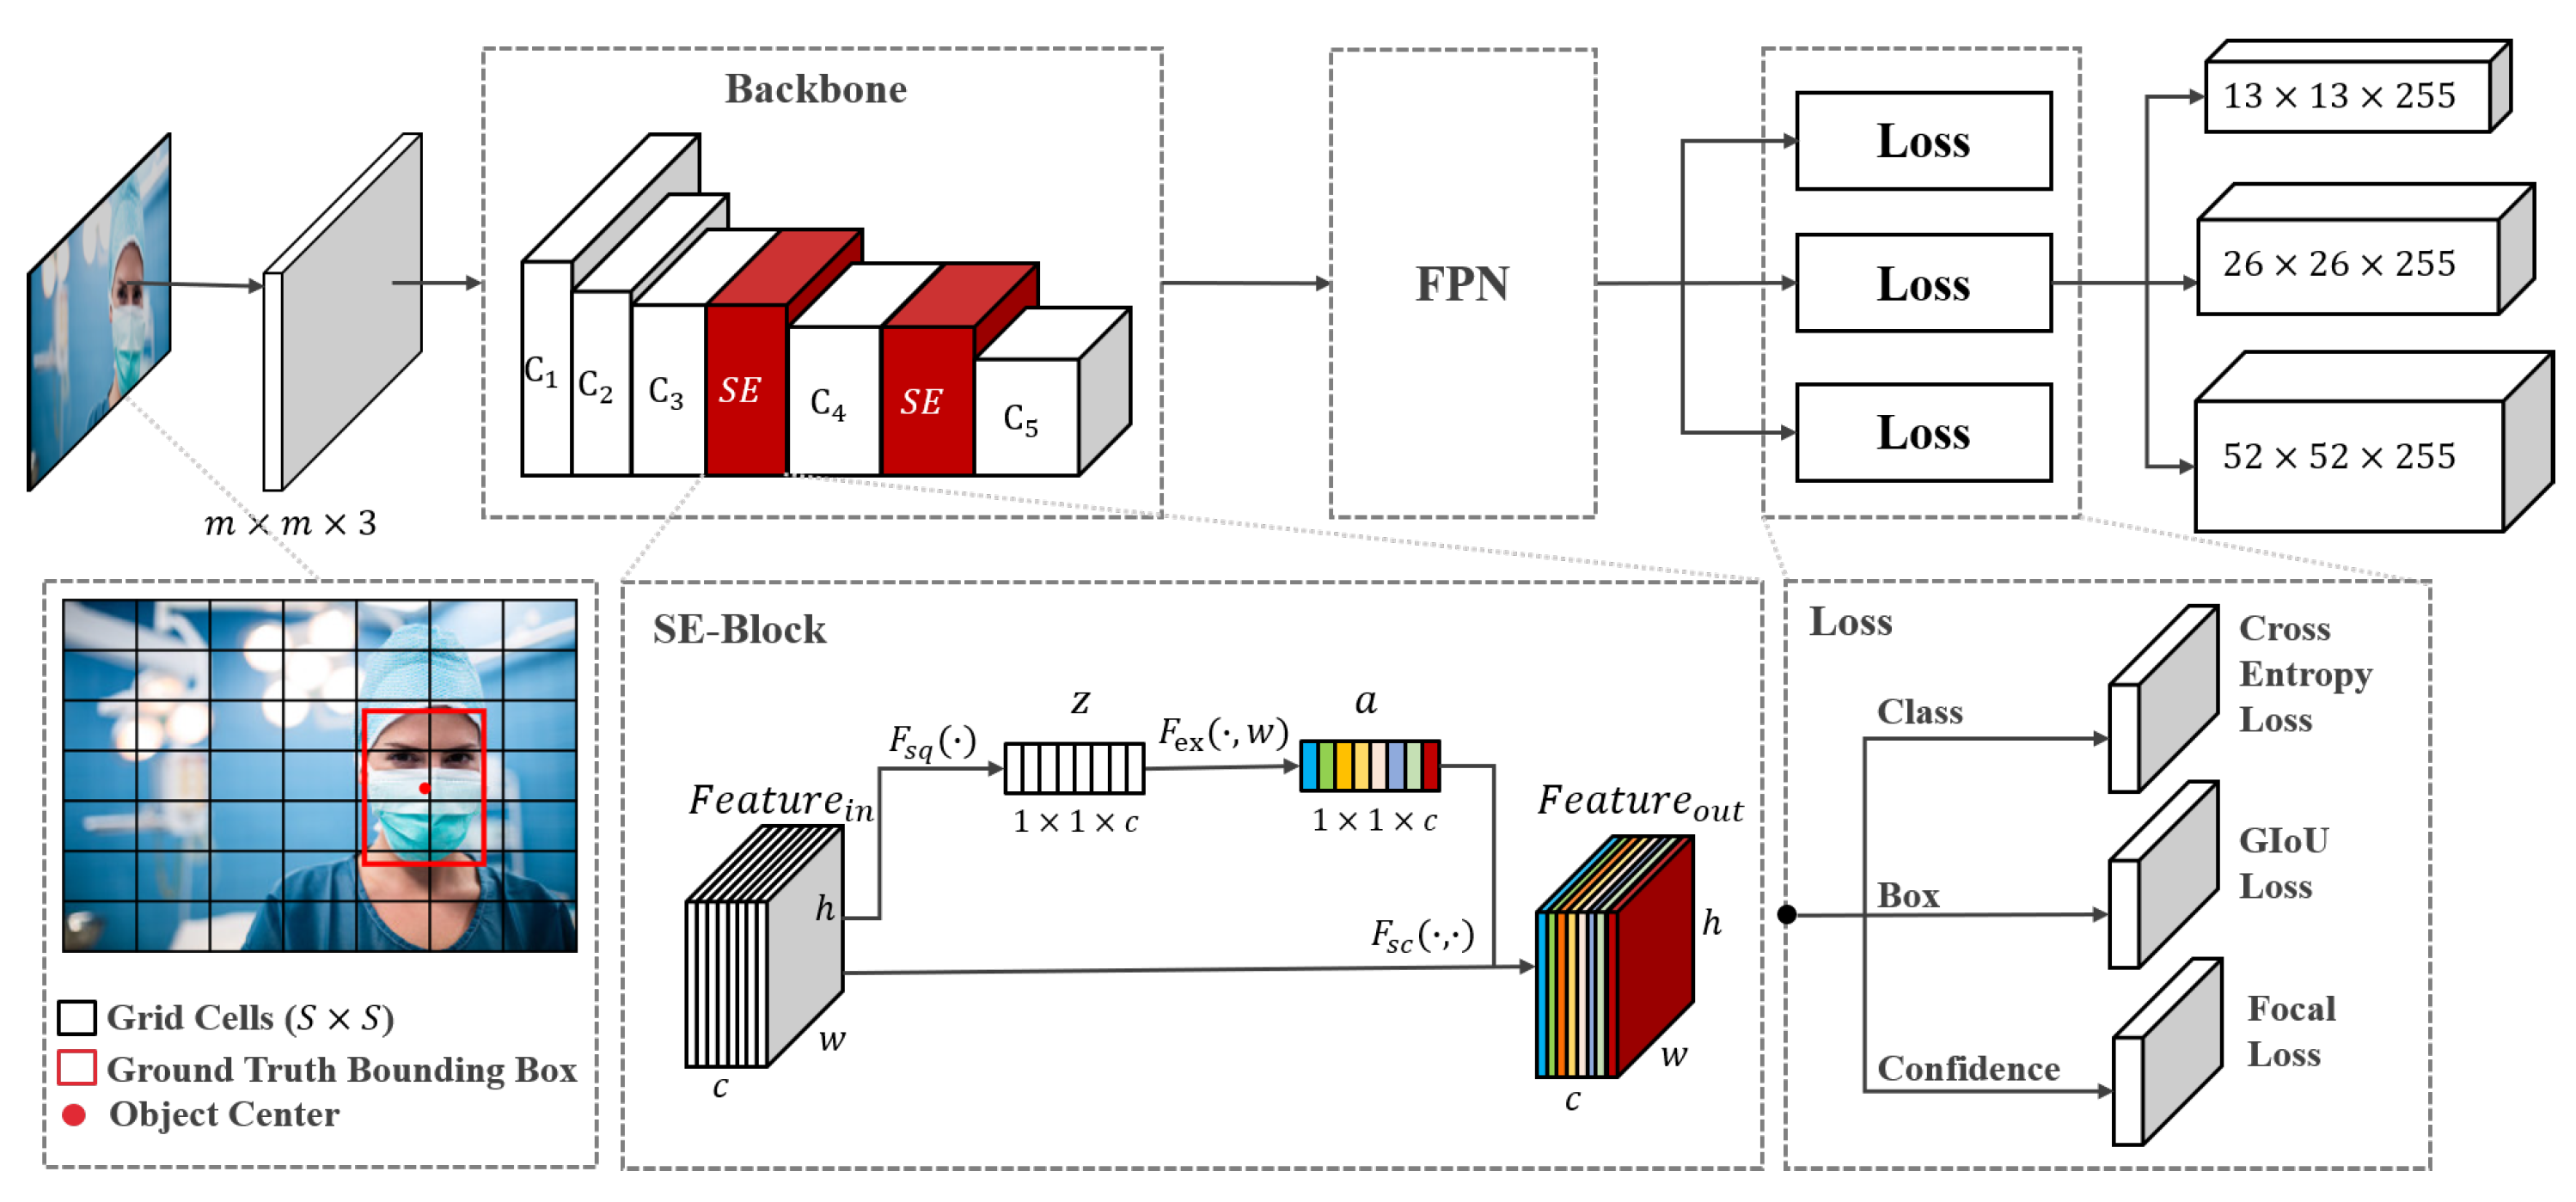
We used multiscale training to make our model more robust at different input scales. As shown in Figure 2, the network randomly selects a scale m every 10 batches in the training phase, m , and resizes the input image into m × m. Then, the image is divided into grids. The grids are responsible for detecting the objects whose bounding box center is located in them. After that, the backbone network extracts feature maps from the input image. The FPN module upsamples the output feature maps and concatenates them to the output from the previous convolutional layer. Finally, the sizes of the feature map output by the model are , , and .
3.2. Attention Network
To learn more feature representations, the convolutional network needs to get much information from the image. However, some information may be disruptive and affect the learning process of the model. To make the model focus on the important information in each channel, we introduced two SE blocks [46] into the backbone and called it SE-Darknet53 (see Figure 2). Let be the output feature of the convolution layer with spatial dimensions () and c be the number of channels. Suppose is the feature in the d-th channel and , .
The SE block consists of 3 steps: squeeze, excitation, and scale. The process of the SE block is summarized in Algorithm 1. Since each convolution only operates in a local spatial dimension, it is difficult to obtain enough information to extract the relationship between channels. Therefore, we first performed the squeeze operation on through the spatial dimensions. Global average pooling was adopted to generate global features by encoding the entire spatial feature on the channels. The d-th dimension feature of z can be calculated as: Equation (1).
Then, we performed the excitation on the global features. To learn the nonlinear relationships between each channel while emphasizing multiple channels, as shown in Equation (2), a simple gating mechanism with a sigmoid activation was utilized.
where refers to ReLU and refers to the sigmoid. , are the weights of two fully connected (FC) layers. The FC layer compresses the channels by a factor of r to decrease the parameters (we used 4 in our experiments for all SE blocks in our model, which achieved a good tradeoff between performance and complexity), while the second layer increases the number of channels back to the original. Finally, the processed feature map can be calculated as shown in Equation (3).
where is a scalar, which is multiplied by as the weight of each channel and is the final output of the SE block.
| Algorithm 1 SE block |
| Require: |
| input_features(, , ) |
| Ensure: |
| output_features(, , ) |
|
3.3. Loss Function
According to YOLOv3, the loss function of SE-YOLOv3 can be formulated as Equation (4).
means the localization loss of the bounding box. In the original YOLOv3, MSE is used as a loss function to perform bounding box regression and is sensitive to the scale of the targets, easily causing outliers in the training set to affect the performance of the model. To improve the model’s robustness to the target scale and maintain the consistency of the evaluation criteria in the training and testing phase, we used GIoU loss [47] as the bounding box loss function. The formulation of the GIoU is shown as Equation (5).
In Equation (5), and represent the predicted and labeled bounding box; represents the minimum bounding box of and . Taking the GIoU as an indicator to measure the real and predicted bounding boxes, Equation (6) shows the improved loss function of the YOLOv3 model.
Here, represents the j-th prior box in the i-th grid cell (the size is ). If this prior box is responsible for predicting the position of the target bounding box, , and otherwise, . is the number of grid cells (in Figure 2), and B represents the number of bounding boxes generated by each cell. and are the area of the ground truth bounding box and the input image.
For the loss function of confidence , we adopted the idea from focal loss [29], which can solve the problem of unbalanced background samples for reducing training time, speeding up model convergence, and improving model performance. The optimized confidence loss function formula is defined as Equation (7).
where C represents the confidence of the ground truth box and represents the predicted confidence. when there is no object centered in the grid, and otherwise, . is the weight to scale the loss of non-object detection and set as the standard configuration. To adjust the ratio of the contribution to loss between easy and hard examples, and are introduced as empirical parameters. We used and in our experiments.
For the classification loss, we used categorical cross entropy. It can be formulated as Equation (8).
where refers to the predicted probability that the object belongs to class n, while is the ground truth label.
3.4. Data Augmentation
To prevent the model from overfitting, it is important to improve the generalization ability by using large-scale samples according to the Vicinal Risk Minimization (VRM) principle [48]. Since the collection and annotation of data cost much in manual labor, we augmented the data from two aspects based on the existing data.
For image augmentation, we started with the single image itself. According to the characteristics of the face data, we performed horizontal flipping, randomly cropping, and contrast adjustment on the image to increase the spatial position transformation of the target.
We applied mixup [49], a data augmentation method originally applied in the classification task. In this detection task, we merged the labels (i.e., ground truth bounding boxes) of two training samples directly instead of setting a ratio for them. Let and denote two images from the training set. and are the ground truth bounding boxes from these two images. Then, we formed a new training sample in a linear interpolation manner as shown in Equations (9) and (10).
where refers to the augmented image mixed from and . refers to the list of ground truth bounding boxes of objects merged from them. is a parameter drawn from the distribution, . According to the experiment in [50], and were set to 1.5.
To calculate the overall loss (L) of the mixed sample, we used the weighted sum of detection loss of the objects from two images. Suppose and are the detection loss of objects from and . The weight of loss is a raw number from 0 to 1 according to the blending ratio of the images to which the objects originally belong. We mixed the two images with a ratio from to improve the anti-jamming ability of the network in the spatial dimension. The weighted loss calculation can be formulated as Equation (11).
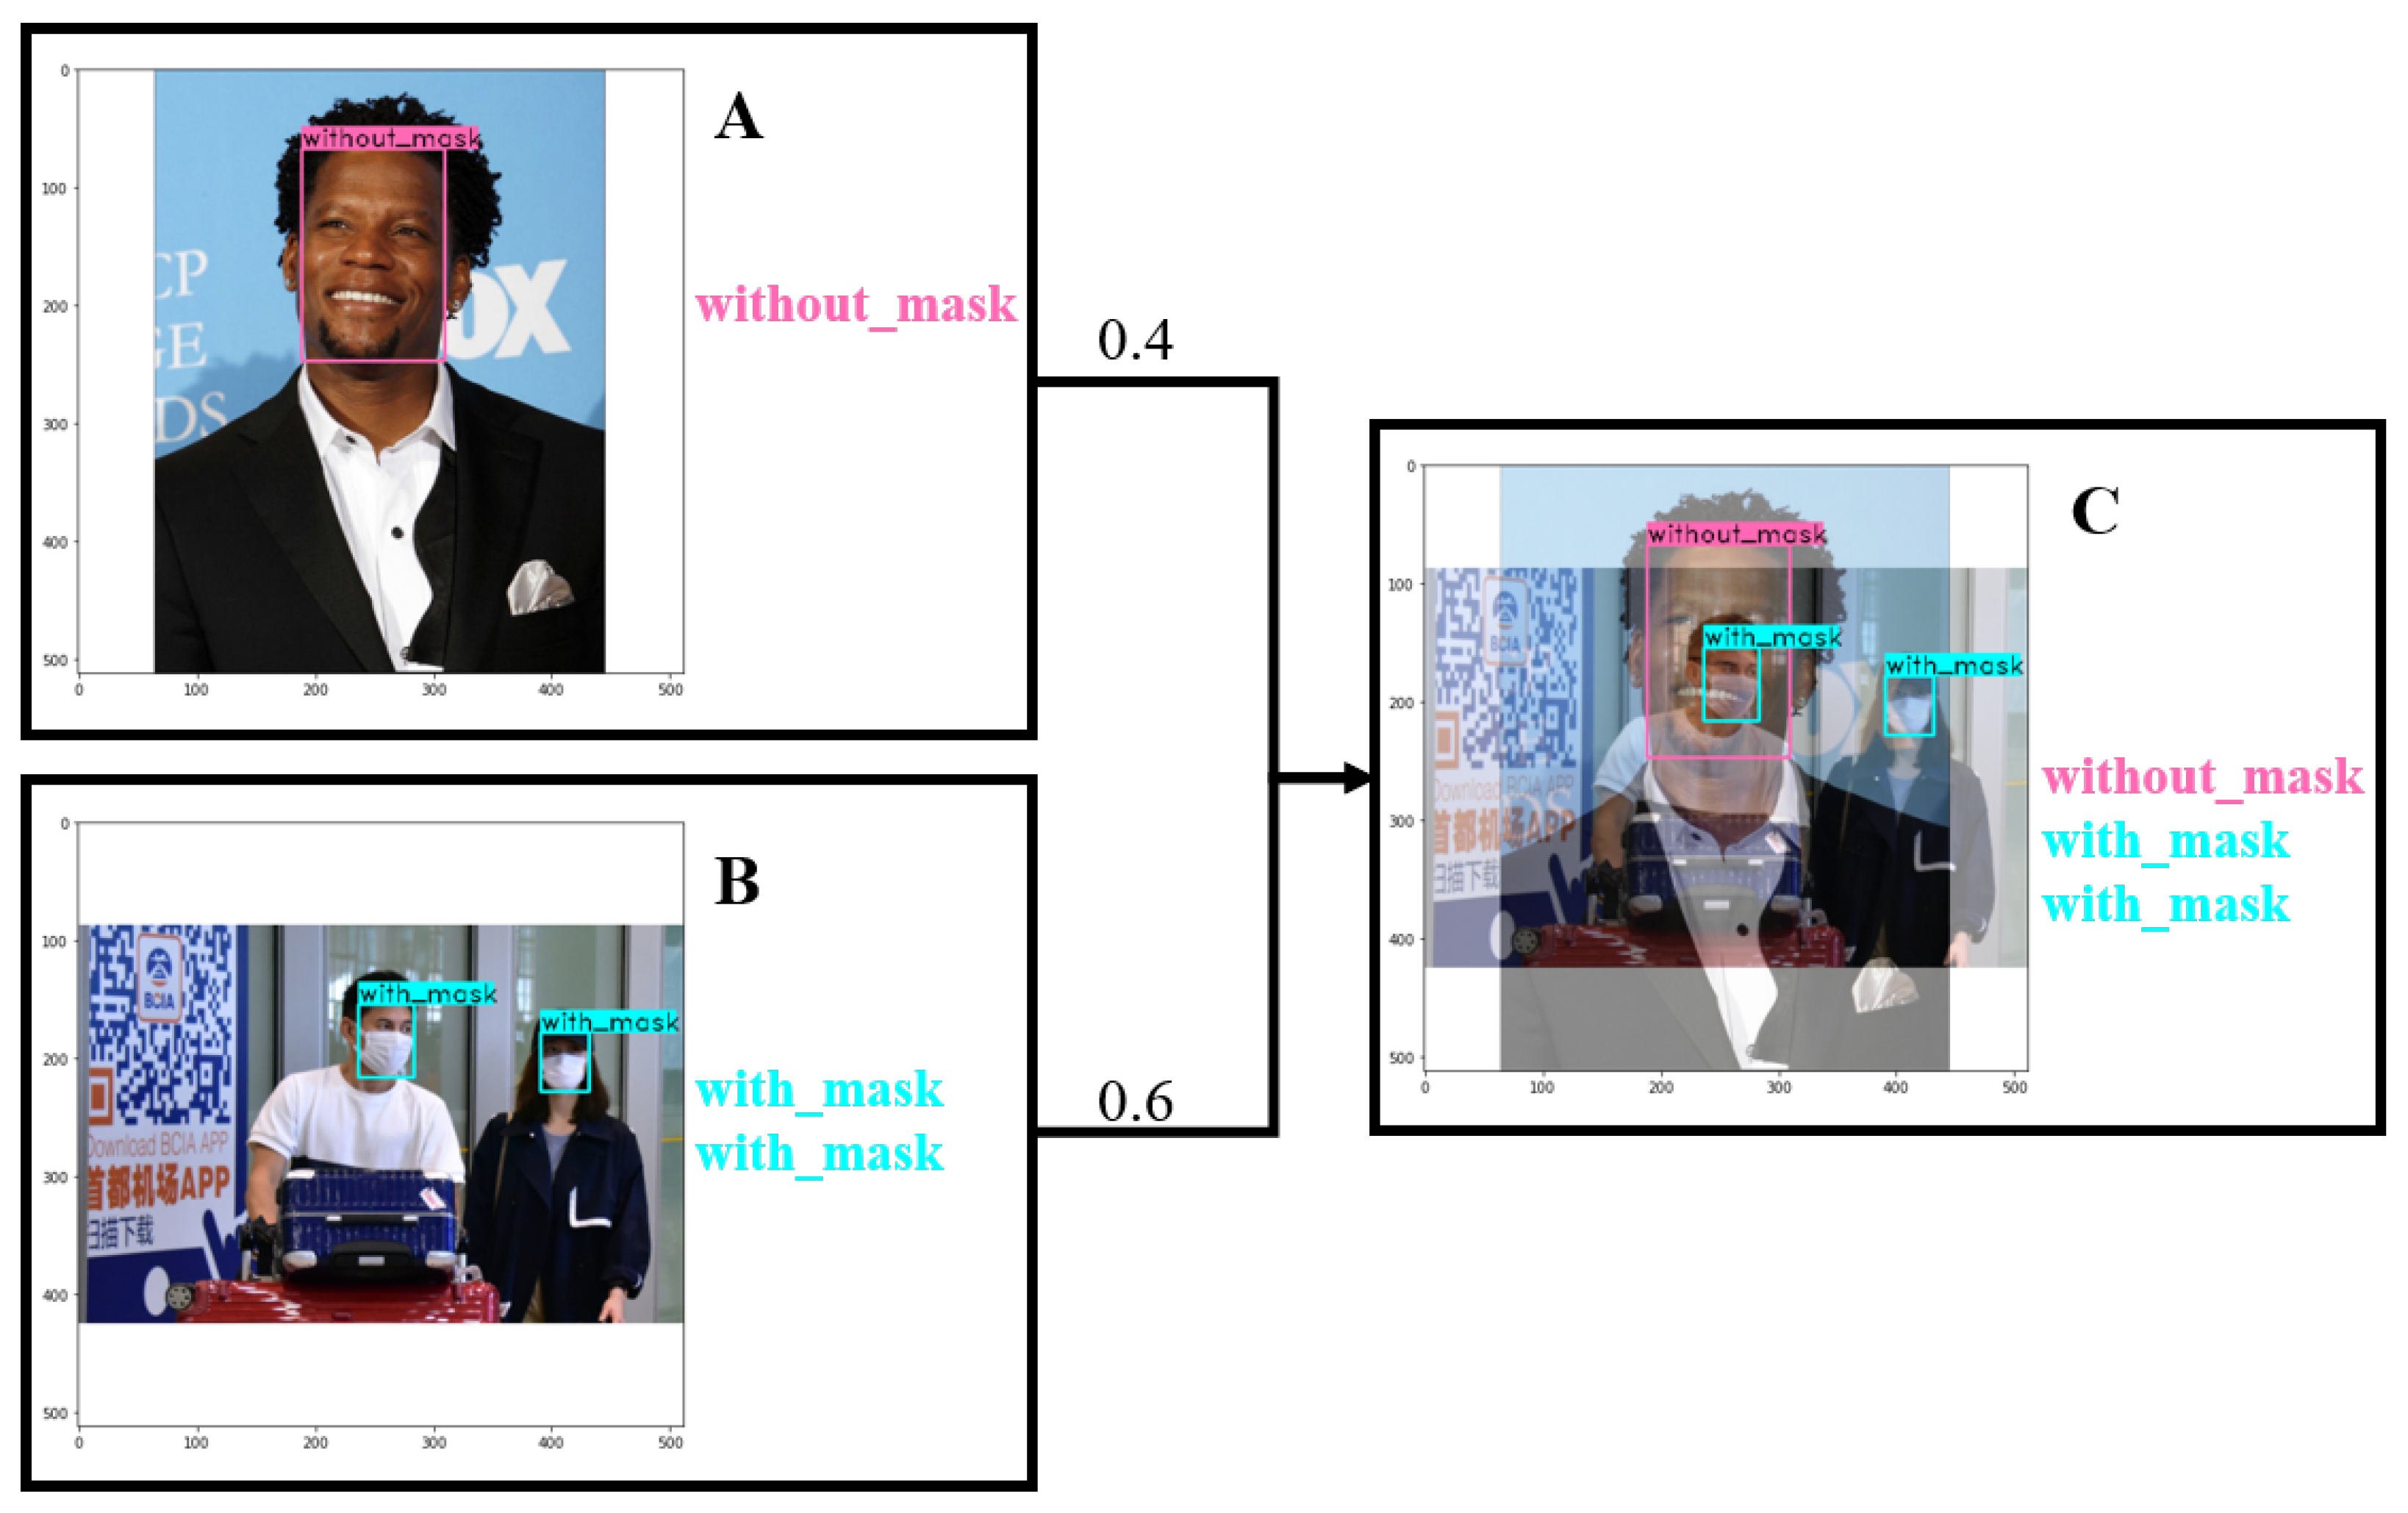
As shown in Figure 3, the size of the merged image is the maximum of the two images. For example, the size of Image A is , and B is , so the new image C is . The newly added pixels in C are set to 0, which maintains the absolute position of the candidate boxes in A and B.
4. Experimental Results and Discussion
In this section, we demonstrate the performance of SE-YOLOv3 on the PWMFD. The implementation and experiments were based on the TensorFlow deep learning framework. The network was trained and tested on our local machine with an RTX 2070 GPU with 8 GB memory. During the training phase, we used Adam to optimize the model. A warm-up and attenuation strategy was adopted to dynamically adjust the learning rate. The initial learning rate was set to , which reached a maximum of after 100 rounds of warm-up. Additionally, we used an exponential decay to prevent model overfitting. The attenuation was 0.9 of the initial learning rate every 100 epochs.
4.1. Properly Wearing Masked Face Detection Dataset
The images of the proposed dataset were collected from multiple public datasets, as well as images from the Internet. We named it the Properly Wearing Masked Face Detection Dataset (PWMFD). This built dataset contained 2951 images from WIDER Face [34], 2581 images from MAFA [35], 58 images from RMFD [39], and 3615 images obtained via the Internet. Because the annotation format of each dataset was different and some data did not meet our requirements, we reannotated all the data. To prevent the models from being deceived by people who covered their faces with other objects, we annotated the samples in such cases with the label “without_mask”, shown in Figure 4d,e. The PWMFD and more information can be found in [51].
To train and test the model, we split the dataset into two parts. The training set contained 7385 images, and the testing set contained 1820 images. Among them, there were 7695 properly masked faces, 10,471 unmasked faces, and 366 incorrectly masked faces. The classification standard is shown in Figure 4.
4.2. Evaluation Metrics
Some metrics such as the Precision (P) and Recall rate (R) were used to quantitatively evaluate the proposed method [52]. The accuracy rate represents the proportion of the real target predicted by the model, and the recall rate represents the proportion of all real targets detected.
Predicted bounding boxes with the IoU value greater than the threshold (0.5 by default) are defined as positive samples and vice versa. The calculation of the precision rate and recall rate can be formulated as Equations (12) and (13).
where , , and respectively represent the number of true positives, true negatives, and false positives.
The Average Precision (AP) was used to evaluate the performance of the object detection model on the test set. As shown in Equation (14), it is the area enclosed by the P-R curve and the coordinate axis.
Here, represents different object classes from the PWMFD, which are “with_mask”, “incorrect_mask”, and “without_mask”.
The is usually adopted to measure the results of multi-category detection, which is the mean of the scores. It can be formulated as Equation (15).
4.3. Ablation Experiment
In this part, we discuss the influence of different components in SE-YOLOv3 and study the effect of the attention module through the visualization of the feature map.
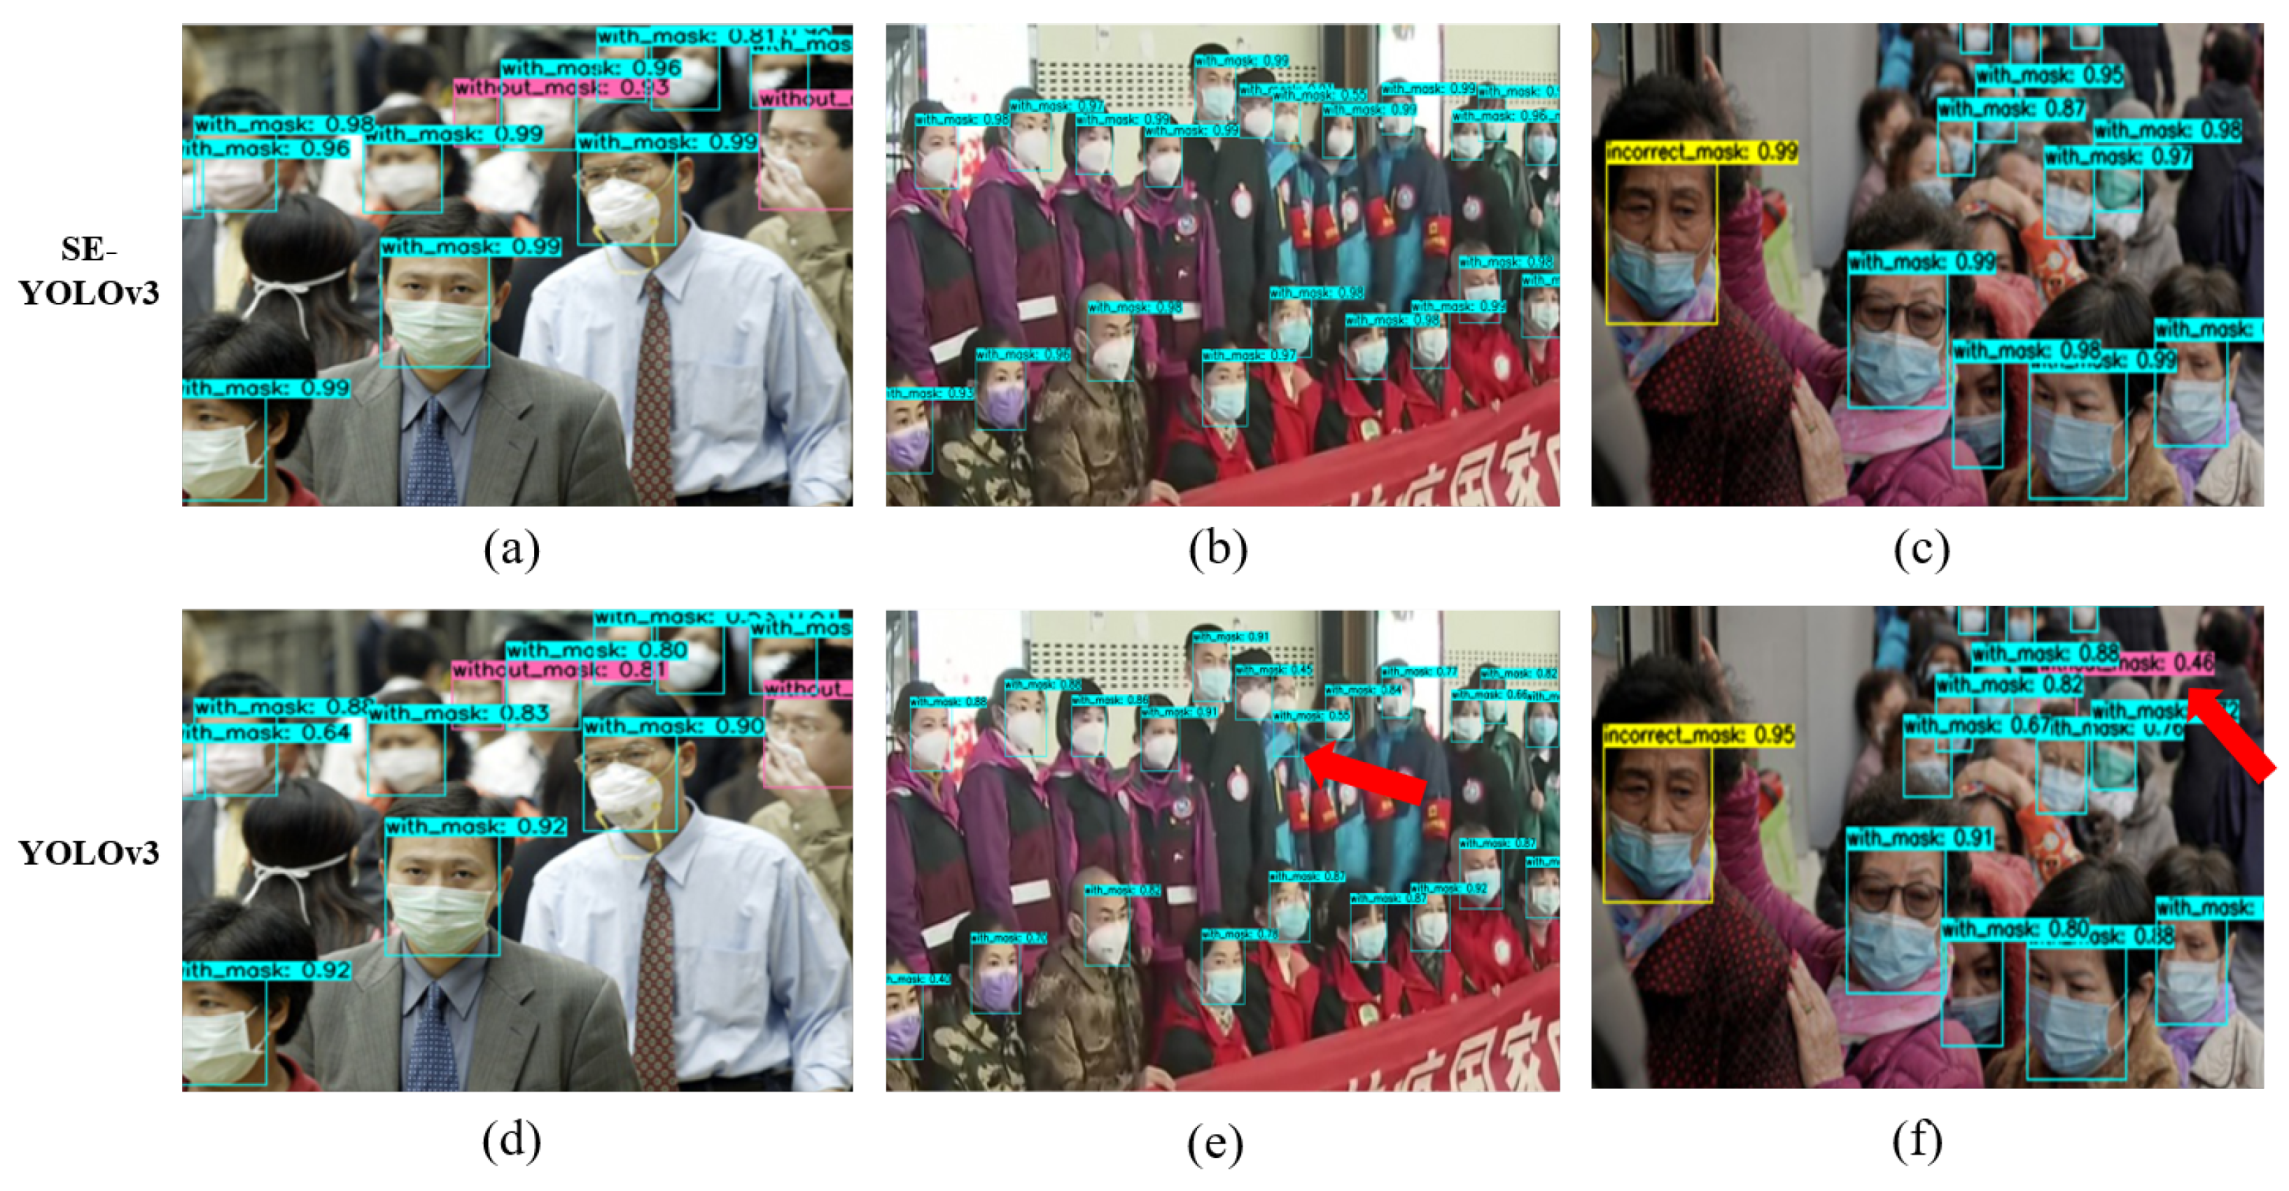
We first compared the performances between the original YOLOv3 and our proposed method by randomly selecting three images from the PWMFD. Figure 5a–c shows the results generated using our proposed method, while Figure 5d–f are the results generated using the original YOLOv3. All subfigures indicate that our SE-YOLOv3 had higher scores than YOLOv3 in terms of detecting faces. From Figure 5c,f, we can see that there were more false detections in the original YOLOv3 (marked with red arrows), which proved the superiority of SE-YOLOv3.
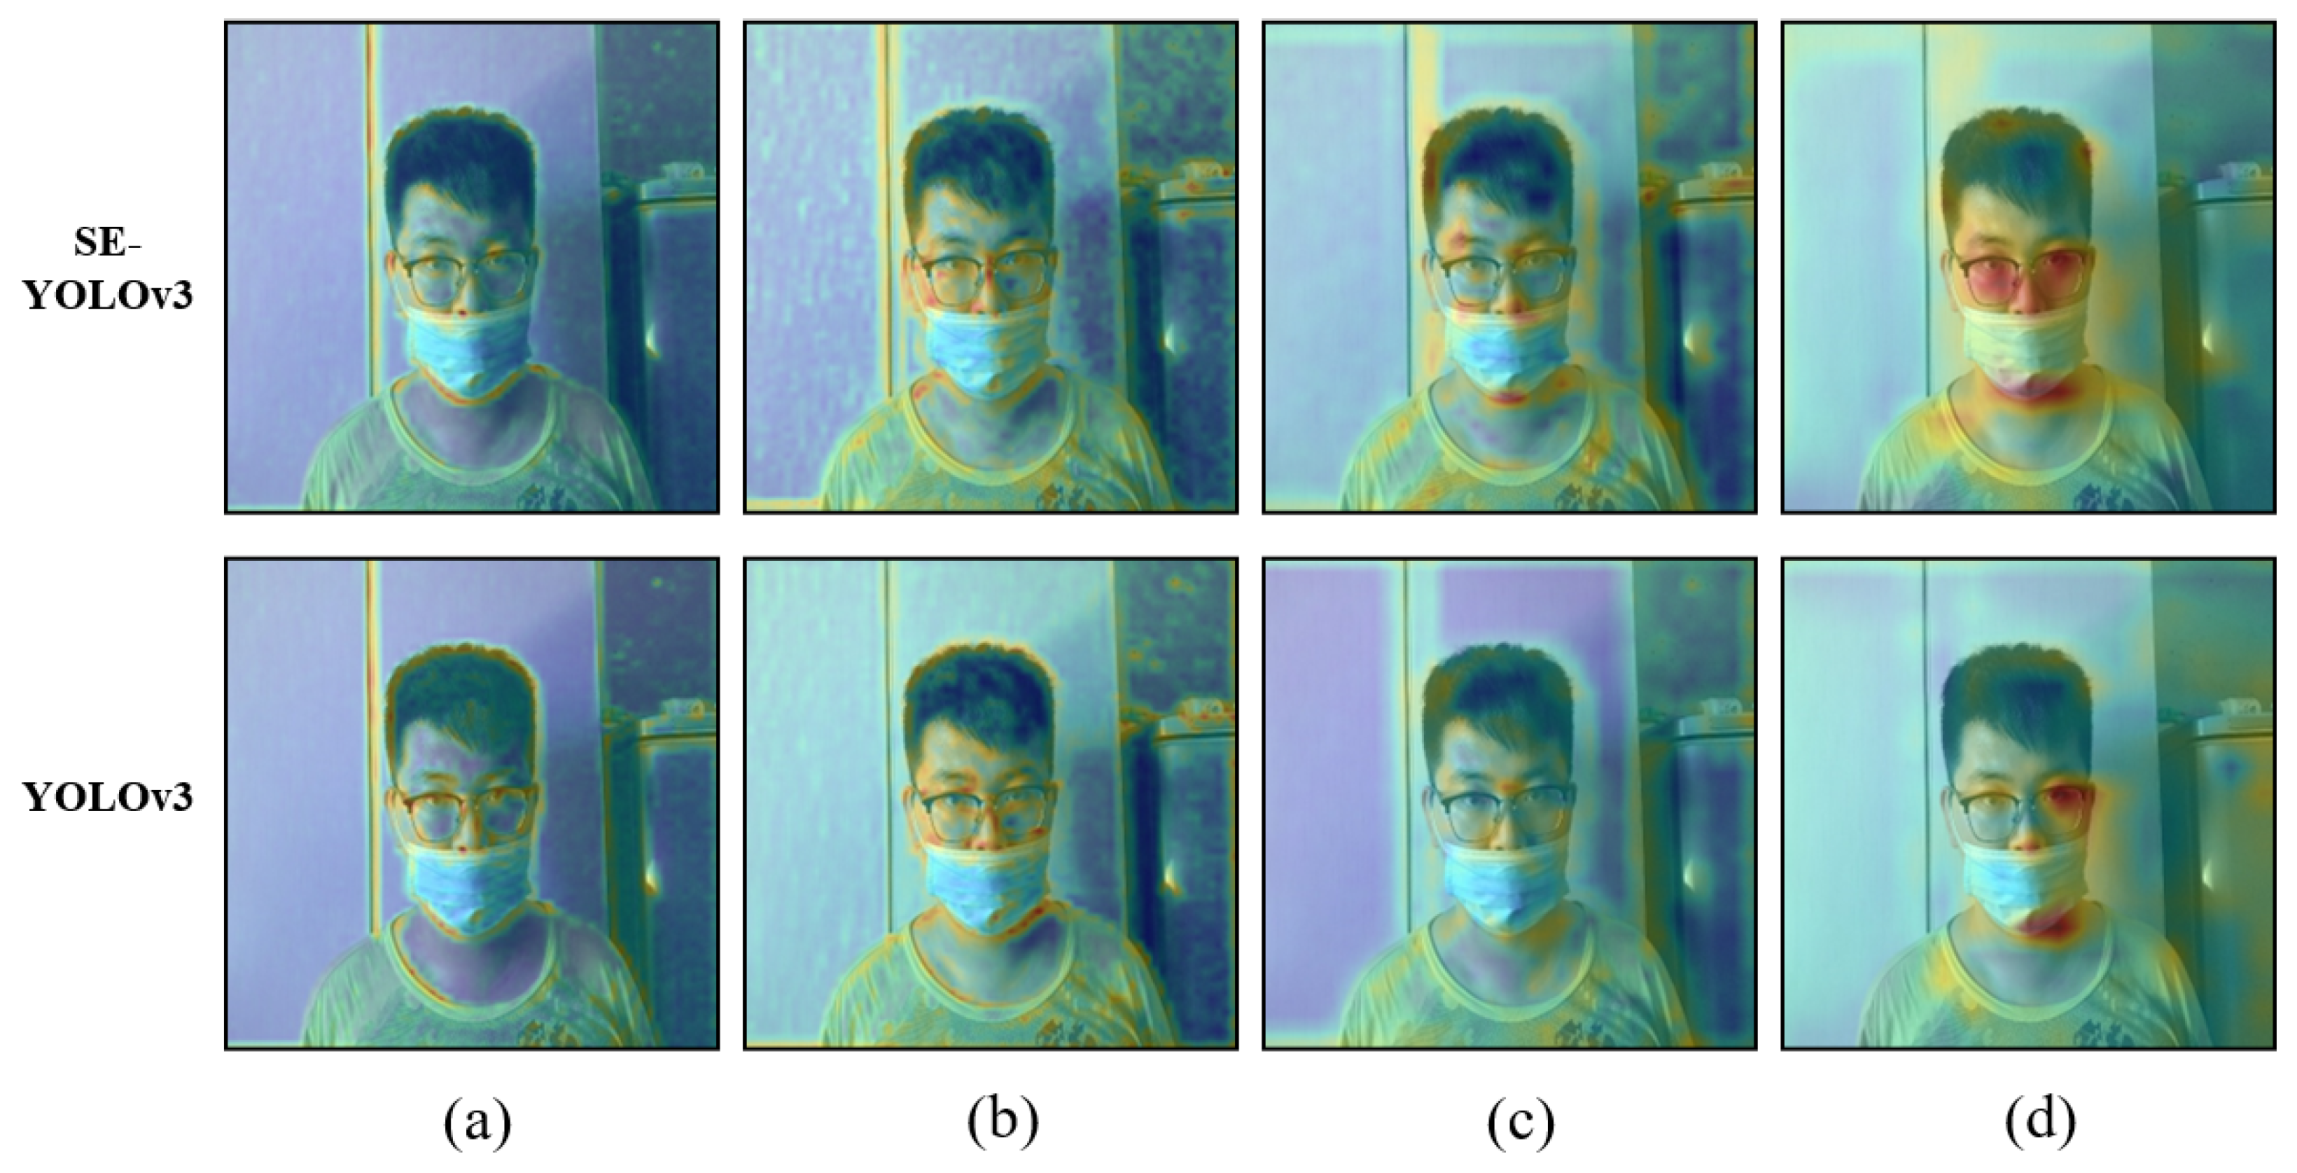
As mentioned in [53], reasoning and explanation are essential to trust models used for critical predictions. The face mask detector is used for protecting public health safety, whose explainability should be addressed as well. We present the visualization of feature maps from different layers of SE-YOLOv3 and YOLOv3 in Figure 6. From Column (a) to Column (b), the generated visualization maps have little difference, as the two models shared the same network structures before the SE block. These features were extracted from the shallow network, which contained low-level information, so that the models were mainly focusing on edges. From Column (c) to Column (e), we find that SE-YOLOv3 looked at the central area of the face, such as eyes, nose, and chin, while YOLOv3 looked at the relatively marginal area. This result showed that SE-YOLOv3 tended to focus more on relevant regions than YOLOv3 when making predictions.
Table 2 further proves the influence of different components introduced into SE-YOLOv3. means the mAP at IoU , and means the mAP at IoU . AP here represents the average of to . The contrast network in the first line without any changes is the original YOLOv3. Compared to the baseline, our SE-YOLOv3 could increase the mAP on the PWMFD from 63.3% to 70.1%. Although the separate addition of the SE block, GIoU, and focal loss would reduce the performance of YOLOv3, when they work in pairs, the performance model would be improved compared with the single component. The performance improvement of “SE block + GIoU” was 3% higher than the baseline. R. Joseph mentioned that focal loss reduced the mAP by two points in YOLOv3 [26]. In our experiment, the use of focal loss alone degraded the performance of the model, but with the combination of other components, it was proven to be effective.
Table 2 also demonstrates the effectiveness of the mixup, which further improved the mAP of SE-YOLOv3 by 1.8%. It was proven that the model could be made more accurate by using the visually deceptive images randomly generated in the training sample.
4.4. Comparison with Other State-of-the-Art Detectors
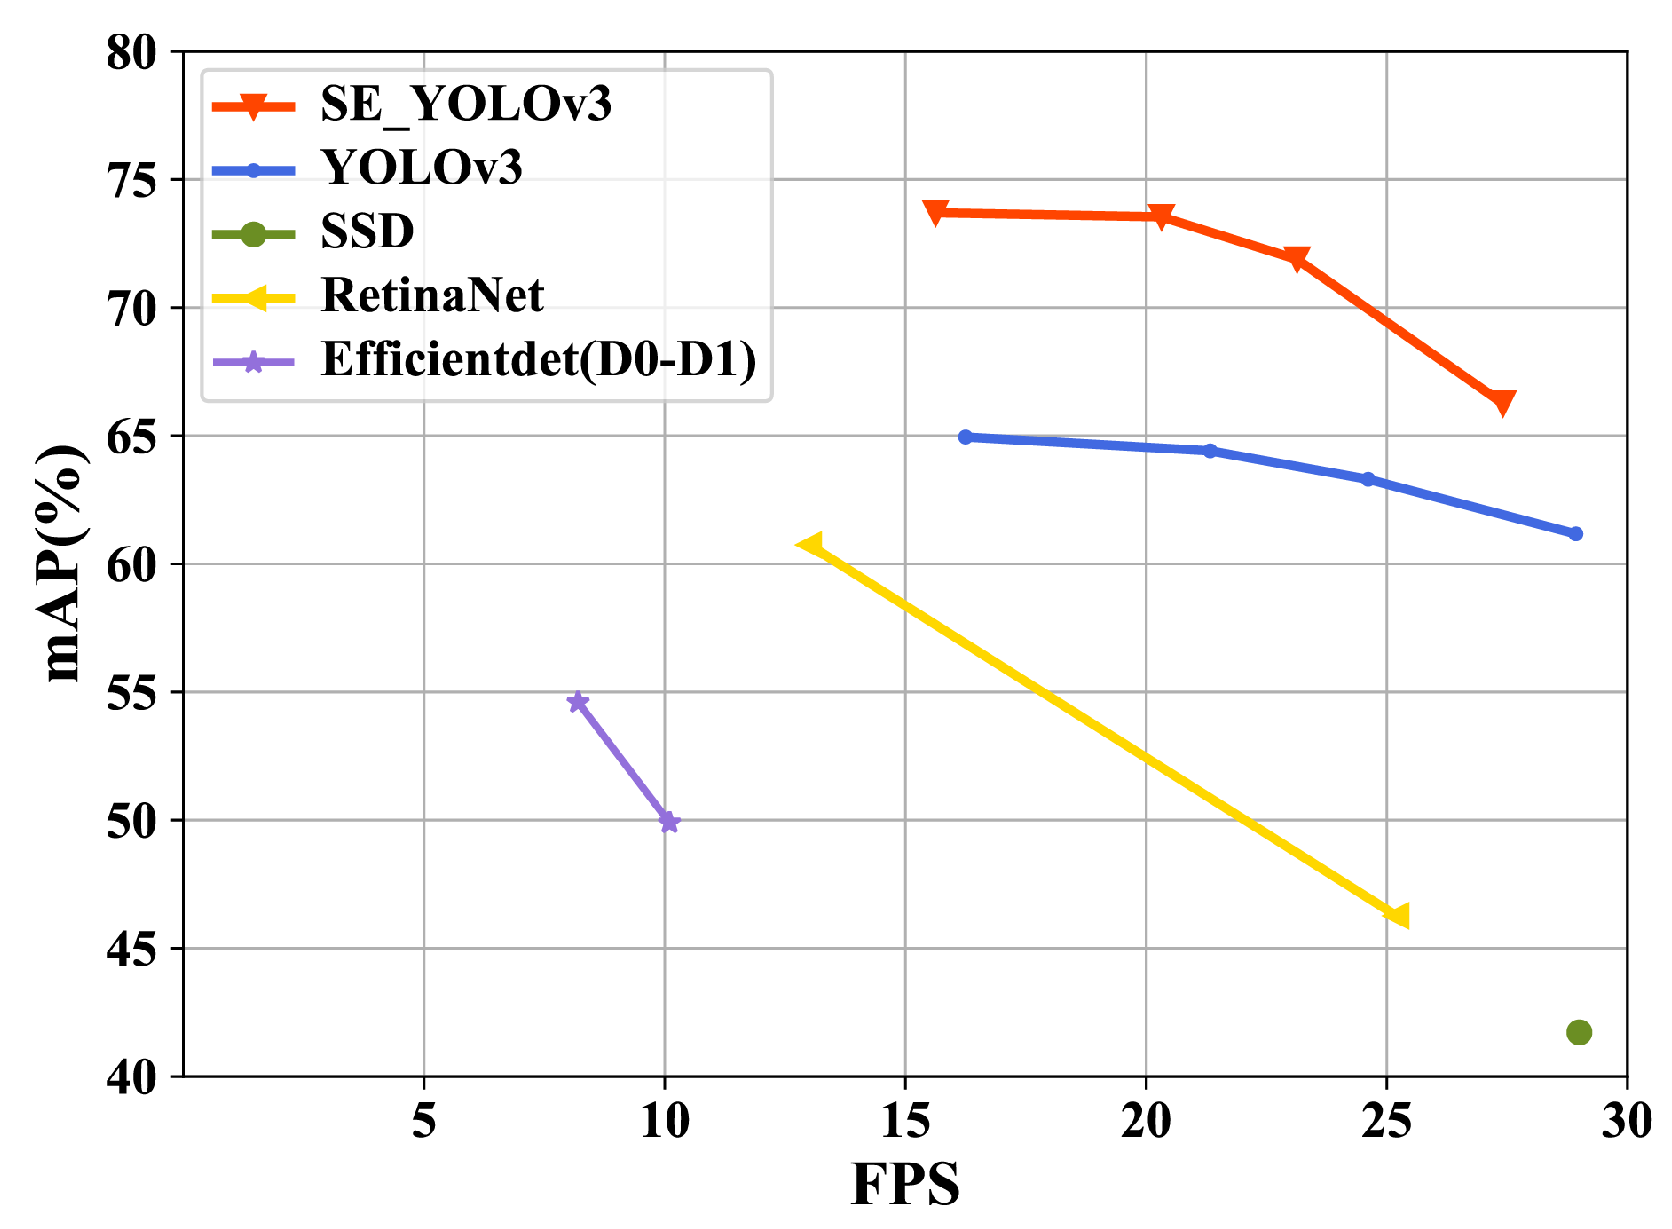
The comparison results among SE-YOLOv3 and other state-of-the-art one-stage object detectors on the PWMFD are shown in Figure 7 and Table 3. All the models were tested on GTX2070 with batch size = 1. Since different detectors had different image training scales, we used the corresponding training dimensions of the network for testing. For example, RetinaNet was only trained at [500, 800] as the input sizes, and SE-YOLOv3 and YOLOv3 were trained with multiple scales. Therefore, we used [500 and 800] as the RetinaNet test image input sizes, 512 for EfficientDet-D0and SSD, 608 for EfficientDet-D1, and [320, 416, 512, 608] and [320, 416, 512, 608] for SE-YOLOv3 and YOLOv3.
As shown in Table 3, though SSD had the lowest detection time, it had the lowest mAP. Compared to YOLOv3, SE-YOLOv3 had a significantly higher accuracy, but slightly was slower, as we introduced SE-block and increased the parameters of the model. Even evaluated with , our model could still achieve a very high performance with different input sizes. Figure 7 visually shows that SE-YOLOv3 had advantages in both speed and accuracy compared with other detectors, being ready for real-time applications.
4.5. Application to Face Mask Detection
To evaluate the effectiveness and practicality of the proposed method, in this part, we present an access control gate system prototype equipped with SE-YOLOv3, which can be deployed at public places’ entrances.
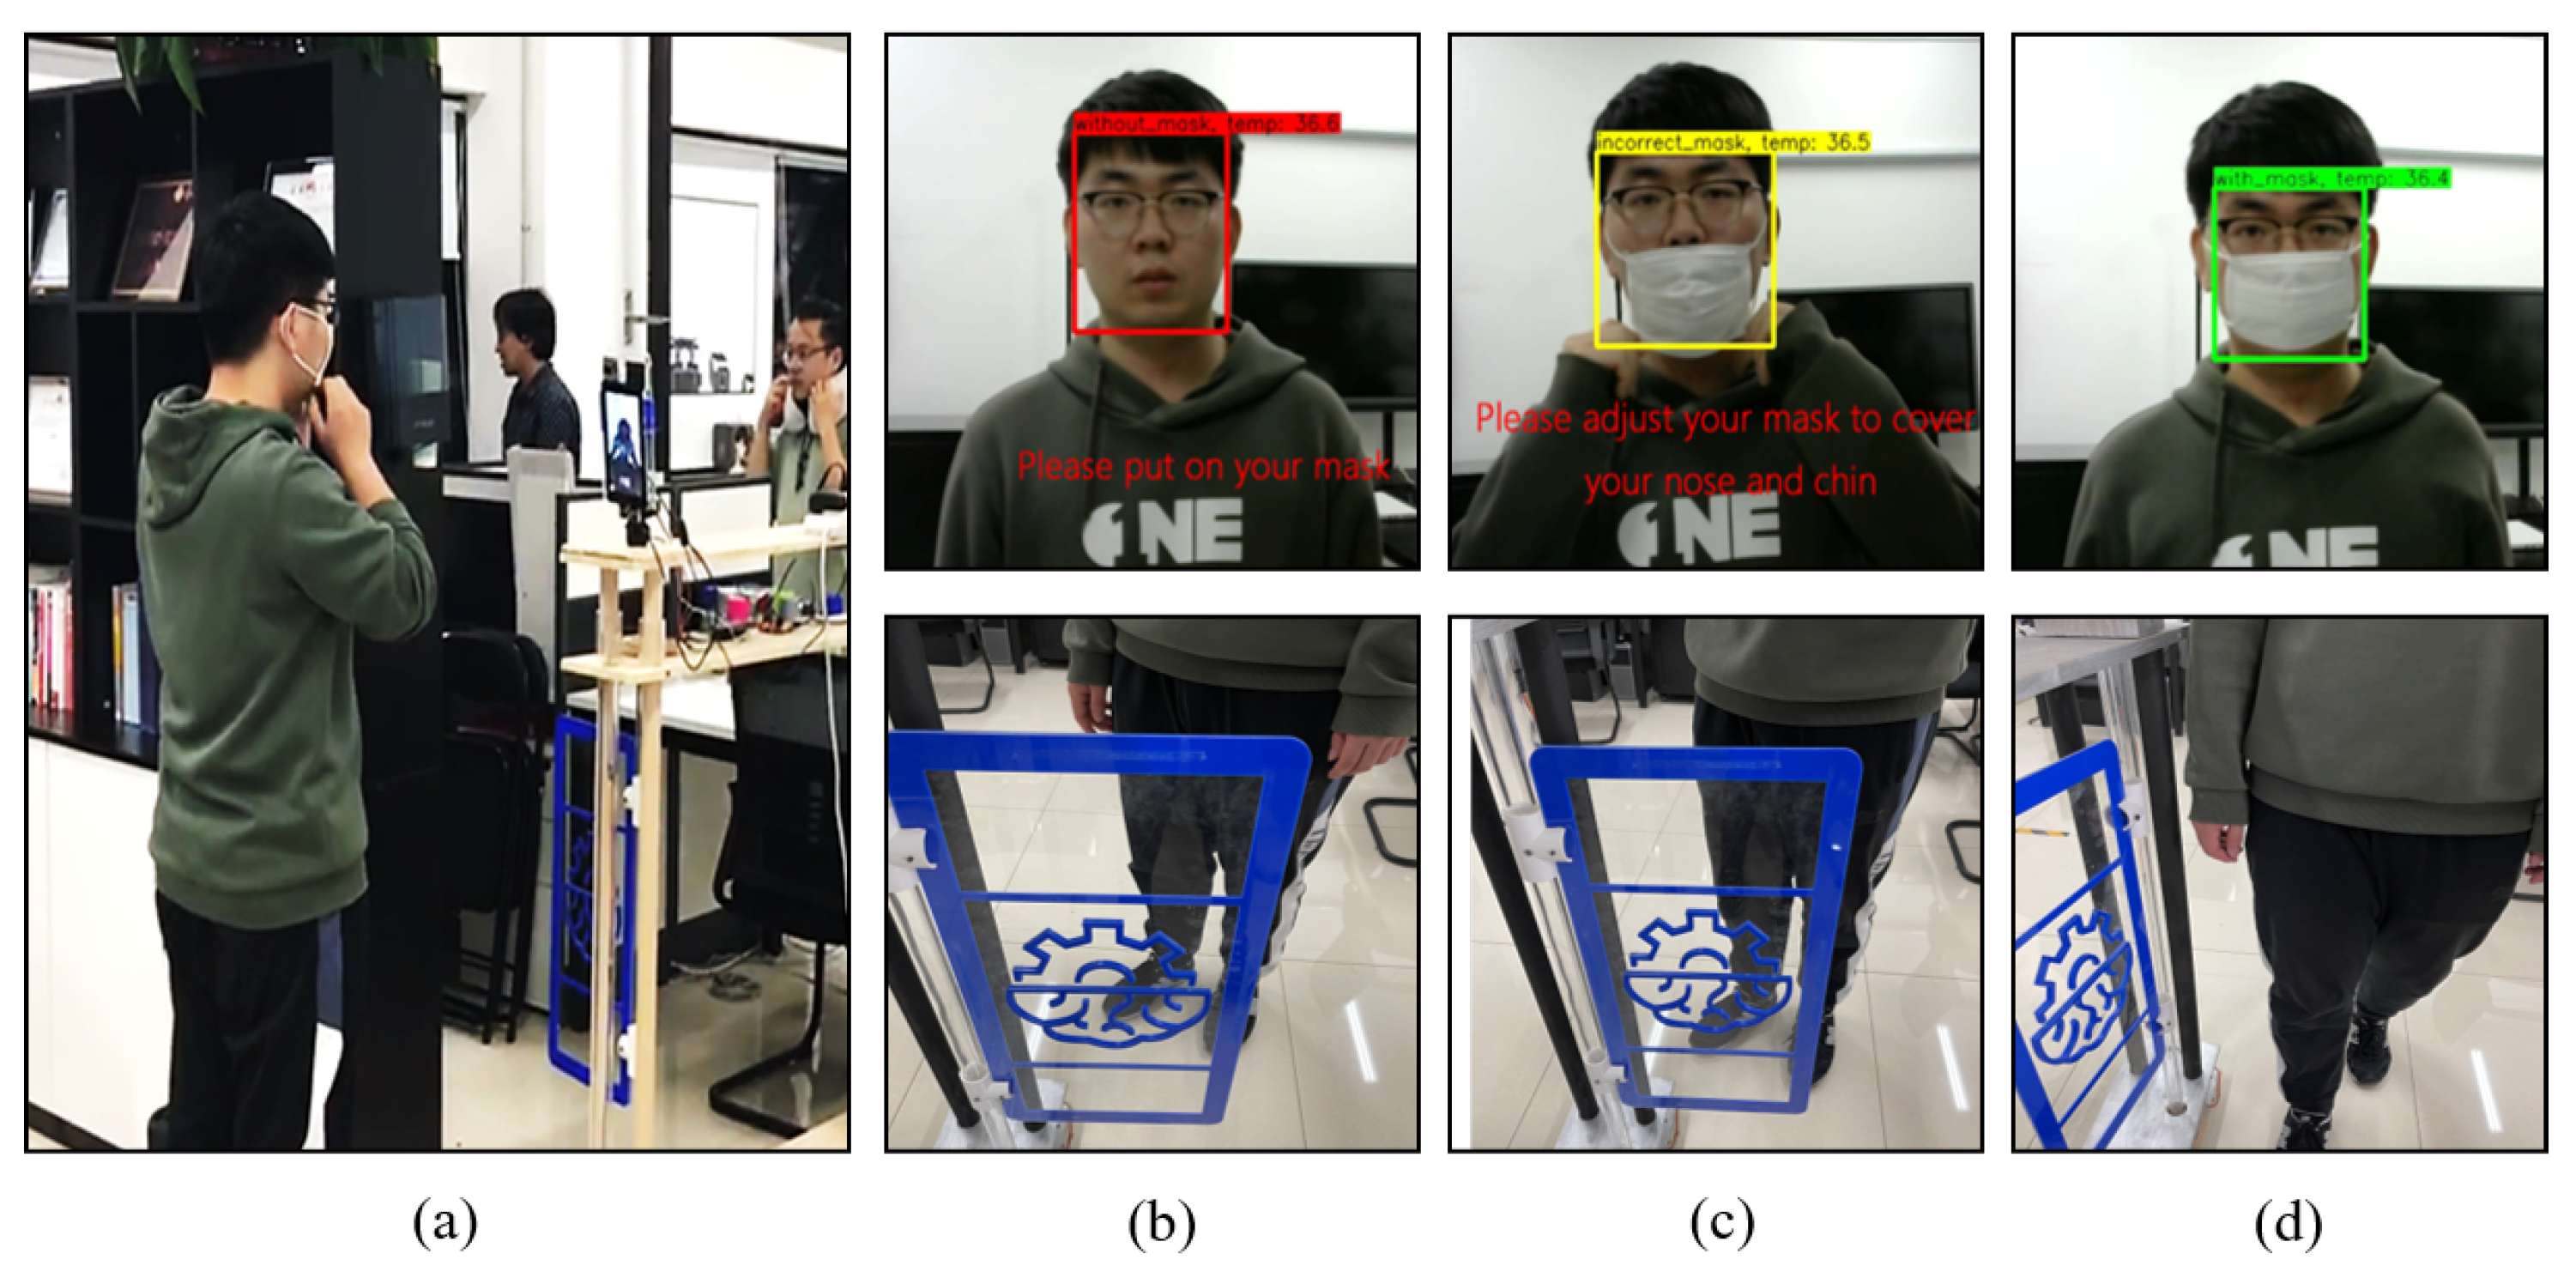
The structure of the access control gate system prototype is illustrated in Figure 8a, including a camera, an infrared thermography device, a Raspberry Pi, a screen, a retractable arm, an Arduino, and an access gate. As shown in Figure 8b, the Raspberry Pi was connected to multiple components and served as a terminal for capturing video frames and thermal imaging data, which were later sent to a server for model inference. We deployed SE-YOLOv3 on a GPU server, which was in the same local area network as the Raspberry Pi. After obtaining the inference information from the server, the Raspberry Pi displayed the result on the screen and sent hardware control commands to the Arduino to operate the access gate and camera. The Arduino is a project consisting of a physical programmable circuit board and an Integrated Development Environment (IDE). The circuit was connected to a motor to control the hardware. Furthermore, the camera was designed to be rotatable and controlled by the Arduino. By utilizing the position information, the camera would be rotated to the pose where the detected face was fixed in the middle of the frame. To this end, people did not need to move themselves toward the camera, which allowed them to pass through the gate faster.
As shown in Figure 9, the system would respond to people’s temperature and the detection results. People were not allowed to pass through the gate if they did not wear their masks properly or their temperature was out of the normal range. The average execution time of the system for processing one image frame was 0.13 s, which showed that our system could detect face masks in real-time and was of value in practical applications.
5. Conclusions
Due to the urgency of controlling COVID-19, the application value and importance of real-time mask detection are increasing. To address this issue, we built the PWMFD with 9205 quality masked face images and developed SE-YOLOv3, a fast and accurate mask detector with a channel attention mechanism that enhanced the feature extraction capability of the backbone network. Furthermore, we used GIoU and focal loss and adopted the corresponding data augmentation to improve the accuracy and robustness of the model.
In our future work, we will collect more data and make a balance between different categories of the data to improve the PWMFD. Besides, we will take parameters and flops into consideration and deploy SE-YOLOv3 on lightweight devices, which can further contribute to global health.
Author Contributions
Conceptualization, T.G. and X.J.; methodology, X.J.; software, Z.Z.; validation, X.J., Z.Z. and Y.Z.; formal analysis, T.G.; investigation, X.J.; resources, Z.Z.; data curation, Y.Z.; writing—original draft preparation, X.J. and Z.Z.; writing—review and editing, T.G.; visualization, X.J.; supervision, T.G.; project administration, T.G.; funding acquisition, T.G. All authors read and agreed to the published version of the manuscript.
Funding
This research was funded by China Fundamental Research Funds for the Central Universities under Grant Number N2017003 and Grant Number N182808003.
Data Availability Statement
The data that support the findings of this study are available in [Properly-Wearing-Masked Face Detection Dataset (PWMFD)] at [https://github.com/ethancvaa/Properly-Wearing-Masked-Detect-Dataset accessed on 25 August 2020], [51]. Some of these data were derived from the following resources available in the public domain: [WIDER Face: http://shuoyang1213.me/WIDERFACE/ accessed on 31 March 2017], [MAFA: http://www.escience.cn/people/geshiming/mafa.html accessed on 10 August 2020], [RMFD: https://github.com/cabani/MaskedFace-Net accessed on 10 August 2020].
Conflicts of Interest
The authors declare no conflict of interest.
Abbreviations
The following abbreviations are used in this manuscript:
| AP | Average Precision |
| CNN | Convolutional Neural Network |
| COVID-19 | Coronavirus Disease 2019 |
| FPN | Feature Pyramid Network |
| IoU | Intersection over Union |
| mAP | mean Average Precision |
| PWMFD | Properly-Wearing-Masked Face Detection Dataset |
| SE | Squeeze and Excitation |
References
- COVID-19 Dashboard by the Center for Systems Science and Engineering (CSSE) at Johns Hopkins University (JHU). Available online: https://0-coronavirus-jhu-edu.brum.beds.ac.uk/map.html (accessed on 1 March 2021).
- Cai, Q.; Yang, M.; Liu, D.; Chen, J.; Shu, D.; Xia, J.; Liao, X.; Gu, Y.; Cai, Q.; Yang, Y.; et al. Experimental treatment with Favipiravir for covid-19: An open-label control study? Engineering 2020. [Google Scholar] [CrossRef] [PubMed]
- Eikenberry, S.; Mancuso, M.; Iboi, E.; Phan, T.; Eikenberry, K.; Kuang, Y.; Kostelich, E.; Gumel, A.B. To mask or not to mask: Modeling the potential for face mask use by the general public to curtail the COVID-19 pandemic. Infect. Dis. Model. 2020, 5, 293–308. [Google Scholar] [CrossRef] [PubMed]
- Leung, N.H.; Chu, D.; Shiu, E.Y.; Chan, K.; McDevitt, J.J.; Hau, B.J.; Yen, H.; Li, Y.; Ip, D.; Peiris, J.S.; et al. Respiratory virus shedding in exhaled breath and efficacy of face masks. Nat. Med. 2020, 26, 676–680. [Google Scholar] [CrossRef] [PubMed] [Green Version]
- World Health Organization (WHO) Q&A: Masks and COVID-19. Available online: https://www.who.int/emergencies/diseases/novel-coronavirus-2019/questionandanswers-hub/q-a-detail/q-a-on-covid-19-and-masks (accessed on 4 August 2020).
- Voulodimos, A.; Doulamis, N.; Doulamis, A.; Protopapadakis, E. Deep Learning for Computer Vision: A Brief Review. Comput. Intell. Neurosci. 2018. [Google Scholar] [CrossRef]
- Zhengxia, Z.; Shi, Z.; Yuhong, G.; Jieping, Y. Object Detection in 20 Years: A Survey. arXiv 2019, arXiv:1905.05055. [Google Scholar]
- Jiang, M.; Fan, X. RetinaMask: A Face Mask detector. arXiv 2020, arXiv:2005.03950. [Google Scholar]
- Detect Faces and Determine Whether People Are Wearing Mask. Available online: https://github.com/AIZOOTech/FaceMaskDetection (accessed on 21 March 2020).
- Wang, M.; Deng, W. Deep Face Recognition: A Survey. arXiv 2018, arXiv:1804.06655. [Google Scholar]
- Presti, L.; Cascia, M. 3D skeleton-based human action classification: A survey. Pattern Recognit. 2016, 53, 130–147. [Google Scholar] [CrossRef]
- Benenson, R.; Omran, M.; Hosang, J.; Schiele, B. Ten Years of Pedestrian Detection, What Have We Learned? arXiv 2014, arXiv:1411.4304. [Google Scholar]
- Mengyin, F.; Yuanshui, H. A survey of traffic sign recognition. In Proceedings of the 2010 International Conference on Wavelet Analysis and Pattern Recognition, Qingdao, China, 11–14 July 2010; pp. 119–124. [Google Scholar]
- Goodfellow, I.; Bengio, Y.; Courville, A. Deep Learning; MIT Press: Cambridge, MA, USA, 2016; Volume 1, pp. 326–366. [Google Scholar]
- Krizhevsky, A.; Sutskever, I.; Hinton, G.E. ImageNet classification with deep convolutional neural networks. Commun. ACM 2017, 25, 1097–1105. [Google Scholar] [CrossRef]
- Zhao, Z.; Zheng, P.; Xu, S.; Wu, X. Object Detection With Deep Learning: A Review. IEEE Trans. Neural Netw. Learn. Syst. 2019, 30, 3212–3232. [Google Scholar] [CrossRef] [PubMed] [Green Version]
- Girshick, R.B.; Donahue, J.; Darrell, T.; Malik, J. Rich Feature Hierarchies for Accurate Object Detection and Semantic Segmentation. In Proceedings of the 2014 IEEE Conference on Computer Vision and Pattern Recognition, Columbus, OH, USA, 24–27 June 2014; pp. 580–587. [Google Scholar]
- Uijlings, J.; Sande, K.V.; Gevers, T.; Smeulders, A. Selective Search for Object Recognition. Int. J. Comput. Vis. 2013, 104, 154–171. [Google Scholar] [CrossRef] [Green Version]
- Girshick, R.B. Fast R-CNN. In Proceedings of the 2015 IEEE International Conference on Computer Vision (ICCV), Santiago, Chile, 7–13 December 2015; pp. 1440–1448. [Google Scholar]
- Ren, S.; He, K.; Girshick, R.B.; Sun, J. Faster R-CNN: Towards Real-Time Object Detection with Region Proposal Networks. IEEE Trans. Pattern Anal. Mach. Intell. 2015, 39, 1137–1149. [Google Scholar] [CrossRef] [PubMed] [Green Version]
- He, K.; Zhang, X.; Ren, S.; Sun, J. Spatial Pyramid Pooling in Deep Convolutional Networks for Visual Recognition. IEEE Trans. Pattern Anal. Mach. Intell. 2015, 37, 1904–1916. [Google Scholar] [CrossRef] [PubMed] [Green Version]
- Lin, T.; Dollár, P.; Girshick, R.B.; He, K.; Hariharan, B.; Belongie, S.J. Feature Pyramid Networks for Object Detection. In Proceedings of the 2017 IEEE Conference on Computer Vision and Pattern Recognition (CVPR), Honolulu, HI, USA, 21–26 July 2017; pp. 936–944. [Google Scholar]
- Cai, Z.; Vasconcelos, N. Cascade R-CNN: Delving Into High Quality Object Detection. In Proceedings of the 2018 IEEE/CVF Conference on Computer Vision and Pattern Recognition, Salt Lake City, UT, USA, 18–23 June 2018; pp. 6154–6162. [Google Scholar]
- Redmon, J.; Divvala, S.; Girshick, R.B.; Farhadi, A. You Only Look Once: Unified, Real-Time Object Detection. In Proceedings of the 2016 IEEE Conference on Computer Vision and Pattern Recognition (CVPR), Las Vegas, NV, USA, 27–30 June 2016; pp. 779–788. [Google Scholar]
- Redmon, J.; Farhadi, A. YOLO9000: Better, Faster, Stronger. In Proceedings of the 2017 IEEE Conference on Computer Vision and Pattern Recognition (CVPR), Honolulu, HI, USA, 21–26 July 2017; pp. 6517–6525. [Google Scholar]
- Redmon, J.; Farhadi, A. YOLOv3: An Incremental Improvement. arXiv 2018, arXiv:1804.02767. [Google Scholar]
- Zhu, C.; He, Y.; Savvides, M. Feature Selective Anchor-Free Module for Single-Shot Object Detection. In Proceedings of the 2019 IEEE/CVF Conference on Computer Vision and Pattern Recognition (CVPR), Long Beach, CA, USA, 16–20 June 2019; pp. 840–849. [Google Scholar]
- Liu, W.; Anguelov, D.; Erhan, D.; Szegedy, C.; Reed, S.; Fu, C.; Berg, A. SSD: Single Shot MultiBox Detector. arXiv 2016, arXiv:1512.02325. [Google Scholar]
- Lin, T.; Goyal, P.; Girshick, R.B.; He, K.; Dollár, P. Focal Loss for Dense Object Detection. IEEE Trans. Pattern Anal. Mach. Intell. 2020, 10778–10787. [Google Scholar] [CrossRef] [Green Version]
- Tan, M.; Pang, R.; Le, Q.V. EfficientDet: Scalable and Efficient Object Detection. In Proceedings of the 2020 IEEE/CVF Conference on Computer Vision and Pattern Recognition (CVPR), Online, 14–19 June 2020; pp. 10778–10787. [Google Scholar]
- Zhang, S.; Wen, L.; Bian, X.; Lei, Z.; Li, S. Single-Shot Refinement Neural Network for Object Detection. In Proceedings of the 2018 IEEE/CVF Conference on Computer Vision and Pattern Recognition, Salt Lake City, UT, USA, 18–23 June 2018; pp. 4203–4212. [Google Scholar]
- Boer, P.D.; Kroese, D.P.; Mannor, S.; Rubinstein, R. A Tutorial on the Cross-Entropy Method. Ann. Oper. Res. 2005, 134, 19–67. [Google Scholar] [CrossRef]
- Wang, J.; Yuan, Y.; Yu, G. Face Attention Network: An Effective Face Detector for the Occluded Faces. arXiv 2017, arXiv:1711.07246. [Google Scholar]
- Yang, S.; Luo, P.; Loy, C.C.; Tang, X. WIDER FACE: A Face Detection Benchmark. In Proceedings of the 2016 IEEE Conference on Computer Vision and Pattern Recognition (CVPR), Las Vegas, NV, USA, 27–30 June 2016; pp. 5525–5533. [Google Scholar]
- Ge, S.; Li, J.; Ye, Q.; Luo, Z. Detecting Masked Faces in the Wild with LLE-CNNs. In Proceedings of the 2017 IEEE Conference on Computer Vision and Pattern Recognition (CVPR), Honolulu, HI, USA, 21–26 July 2017; pp. 426–434. [Google Scholar]
- He, K.; Zhang, X.; Ren, S.; Sun, J. Deep Residual Learning for Image Recognition. In Proceedings of the 2016 IEEE Conference on Computer Vision and Pattern Recognition (CVPR), Las Vegas, NV, USA, 27–30 June 2016; pp. 770–778. [Google Scholar]
- Howard, A.; Zhu, M.; Chen, B.; Kalenichenko, D.; Wang, W.; Weyand, T.; Andreetto, M.; Adam, H. MobileNets: Efficient Convolutional Neural Networks for Mobile Vision Applications. arXiv 2017, arXiv:1704.04861. [Google Scholar]
- Loey, M.; Manogaran, G.; Taha, M.H.; Khalifa, N.E. A hybrid deep transfer learning model with machine learning methods for face mask detection in the era of the COVID-19 pandemic. Measurement 2020, 167, 108288. [Google Scholar] [CrossRef] [PubMed]
- Wang, Z.; Wang, G.; Huang, B.; Xiong, Z.; Hong, Q.; Wu, H.; Yi, P.; Jiang, K.; Wang, N.; Pei, Y.; et al. Masked Face Recognition Dataset and Application. arXiv 2020, arXiv:2003.09093. [Google Scholar]
- Huang, G.; Mattar, M.; Berg, T.; Learned-Miller, E. Labeled Faces in the Wild: A Database forStudying Face Recognition in Unconstrained Environments. In Proceedings of the Workshop on Faces in ’Real-Life’Images: Detection, Alignment, and Recognition, Marseille, France, 17 October 2008. [Google Scholar]
- Cabani, A.; Hammoudi, K.; Benhabiles, H.; Melkemi, M. MaskedFace-Net—A Dataset of Correctly/Incorrectly Masked Face Images in the Context of COVID-19. arXiv 2020, arXiv:2008.08016. [Google Scholar]
- Hammoudi, K.; Cabani, A.; Benhabiles, H.; Melkemi, M. Validating the correct wearing of protection mask by taking a selfie: Design of a mobile application? CheckYourMask? To limit the spread of COVID-19. Tech Sci. Press 2020. [Google Scholar] [CrossRef]
- Rui, H.; Ji-Nan, G.; Xiao-Hong, S.; Yong-Tao, H.; Uddin, S. A Rapid Recognition Method for Electronic Components Based on the Improved YOLO-V3 Network. Electronics 2019, 8, 825. [Google Scholar]
- Zhao, H.; Zhou, Y.; Zhang, L.; Peng, Y.; Hu, X.; Peng, H.; Cai, X. Mixed YOLOv3-LITE: A Lightweight Real-Time Object Detection Method. Sensors 2020, 20, 1861. [Google Scholar] [CrossRef] [PubMed] [Green Version]
- Yang, Y.; Deng, H. GC-YOLOv3: You Only Look Once with Global Context Block. Electronics 2020, 9, 1235. [Google Scholar] [CrossRef]
- Hu, J.; Shen, L.; Albanie, S.; Sun, G.; Wu, E. Squeeze and Excitation Networks. IEEE Trans. Pattern Anal. Mach. Intell. 2020, 42, 2011–2023. [Google Scholar] [CrossRef] [PubMed] [Green Version]
- Rezatofighi, S.H.; Tsoi, N.; Gwak, J.; Sadeghian, A.; Reid, I.; Savarese, S. Generalized Intersection Over Union: A Metric and a Loss for Bounding Box Regression. In Proceedings of the 2019 IEEE/CVF Conference on Computer Vision and Pattern Recognition (CVPR), Long Beach, CA, USA, 16–20 June 2019; pp. 658–666. [Google Scholar]
- Chapelle, O.; Weston, J.; Bottou, L.; Vapnik, V. Vicinal risk minimization. In Advances in Neural Information Processing Systems; MIT Press: Cambridge, MA, USA, 2001; pp. 416–422. [Google Scholar]
- Zhang, H.; Cissé, M.; Dauphin, Y.; Lopez-Paz, D. Mixup: Beyond Empirical Risk Minimization. arXiv 2019, arXiv:1905.05055. [Google Scholar]
- Zhang, Z.; He, T.; Zhang, H.; Zhang, Z.; Xie, J.; Li, M. Bag of Freebies for Training Object Detection Neural Networks. arXiv 2019, arXiv:1902.04103. [Google Scholar]
- Properly-Wearing-Masked Face Detection Dataset (PWMFD). Available online: https://github.com/ethancvaa/Properly-Wearing-Masked-Detect-Dataset (accessed on 25 August 2020).
- Fawcett, T. An introduction to ROC analysis. Pattern Recognit. Lett. 2006, 27, 861–874. [Google Scholar] [CrossRef]
- Pintelas, E.G.; Liaskos, M.; Livieris, I.; Kotsiantis, S.; Pintelas, P. Explainable Machine Learning Framework for Image Classification Problems: Case Study on Glioma Cancer Prediction. J. Imaging 2020, 6, 37. [Google Scholar] [CrossRef]
Figure 1.
The visualization of k-means clustering on the PWMFD. We predict the width and height of the box as offsets from cluster centroids.
Figure 1.
The visualization of k-means clustering on the PWMFD. We predict the width and height of the box as offsets from cluster centroids.

Figure 2.
The network architecture of SE-YOLOv3. Each convolutional block of Darknet53 is defined as to , and activation layers are omitted for brevity. The details are described in Section 3.1, Section 3.2, Section 3.3 and Section 3.4.
Figure 2.
The network architecture of SE-YOLOv3. Each convolutional block of Darknet53 is defined as to , and activation layers are omitted for brevity. The details are described in Section 3.1, Section 3.2, Section 3.3 and Section 3.4.

Figure 3.
The visualization of the mixup augmentation with a blending ratio of 0.4:0.6. The labels of each image (A,B) are merged into a new list for the new image (C).
Figure 3.
The visualization of the mixup augmentation with a blending ratio of 0.4:0.6. The labels of each image (A,B) are merged into a new list for the new image (C).

Figure 4.
(a) Faces with both nose and mouth covered are labeled as “with_mask”. (b) Faces with nose uncovered are labeled as “incorrect_mask”. Face with mask below chin (c), with other objects covered (d), with clothes covered (e), and without mask (f) are labeled as “without_mask”.
Figure 4.
(a) Faces with both nose and mouth covered are labeled as “with_mask”. (b) Faces with nose uncovered are labeled as “incorrect_mask”. Face with mask below chin (c), with other objects covered (d), with clothes covered (e), and without mask (f) are labeled as “without_mask”.

Figure 5.
Face detection results of SE-YOLOv3 and the original YOLOv3 (the red arrow indicates the false detection result). (a–c) are testing results of SE-YOLOv3 and (d–f) are testing results of YOLOv3.
Figure 5.
Face detection results of SE-YOLOv3 and the original YOLOv3 (the red arrow indicates the false detection result). (a–c) are testing results of SE-YOLOv3 and (d–f) are testing results of YOLOv3.

Figure 6.
The visualization of the feature map for SE-YOLOv3 and YOLOv3. Columns (a–d) are from the convolutional network in C1, C2, C4, and C5 (mentioned in Figure 2), respectively.
Figure 6.
The visualization of the feature map for SE-YOLOv3 and YOLOv3. Columns (a–d) are from the convolutional network in C1, C2, C4, and C5 (mentioned in Figure 2), respectively.

Figure 7.
The speed/accuracy tradeoff of the proposed SE-YOLOv3 and other SOTAobject detectors. SE-YOLOv3 can balance the accuracy and detection speed well.
Figure 7.
The speed/accuracy tradeoff of the proposed SE-YOLOv3 and other SOTAobject detectors. SE-YOLOv3 can balance the accuracy and detection speed well.

Figure 8.
(a) The access control gate system prototype for face mask detection consists of seven components (* the Raspberry Pi is occluded by the screen). (b) The overall architecture of the prototype.
Figure 8.
(a) The access control gate system prototype for face mask detection consists of seven components (* the Raspberry Pi is occluded by the screen). (b) The overall architecture of the prototype.

Figure 9.
(a) An example of user mask detection. Columns (b–d) show the different reactions of the application for three kinds of situations. The gate opens only if the detected person wears his/her mask correctly and is in the normal temperature range.
Figure 9.
(a) An example of user mask detection. Columns (b–d) show the different reactions of the application for three kinds of situations. The gate opens only if the detected person wears his/her mask correctly and is in the normal temperature range.


Table 1.
Bounding box priors obtained by K-means.
| Feature Map Size | |||
|---|---|---|---|
| Priors’ Anchor Size | |||
Table 2.
Ablation experiment (the input size of the images is ).
| SE Block | GIoU | Focal | Mixup | AP | ||
|---|---|---|---|---|---|---|
| 63.3% | 95.4% | 75.4% | ||||
| ✓ | 62.4% | 95.3% | 74.0% | |||
| ✓ | 58.8% | 95.1% | 67.5% | |||
| ✓ | 60.8% | 95.1% | 73.3% | |||
| ✓ | ✓ | 66.3% | 96.5% | 79.0% | ||
| ✓ | ✓ | 62.5% | 95.8% | 73.1% | ||
| ✓ | ✓ | 63.3% | 96.5% | 75.4% | ||
| ✓ | ✓ | ✓ | 70.1% | 97.5% | 84.3% | |
| ✓ | ✓ | ✓ | ✓ | 71.9% | 98.6% | 86.3% |
Table 3.
Comparison of the speed and accuracy of different object detectors on the PWMFD.
| Method | Backbone | Size | Detection Time (ms) | AP | ||
|---|---|---|---|---|---|---|
| RetinaNet | ResNet-50 | 500 | 39.8 | 46.3% | 94.2% | 34.5% |
| RetinaNet | ResNet-50 | 800 | 76.8 | 60.7% | 94.9% | 70.5% |
| EfficientDet-D0 | Efficient-B0 | 512 | 99.3 | 49.9% | 84.5% | 54.9% |
| EfficientDet-D1 | Efficient-B1 | 608 | 122.0 | 54.6% | 85.1% | 65.2% |
| SSD | VGG-16 | 512 | 34.5 | 41.7% | 92.7% | 23.7% |
| YOLOv3 | Darknet53 | 320 | 34.6 | 61.2% | 95.3% | 71.6% |
| YOLOv3 | Darknet53 | 416 | 40.6 | 63.3% | 95.4% | 75.4% |
| YOLOv3 | Darknet53 | 512 | 46.9 | 64.4% | 95.7% | 76.1% |
| YOLOv3 | Darknet53 | 608 | 61.5 | 64.9% | 96.1% | 77.1% |
| SE-YOLOv3 | SE-Darknet53 | 320 | 35.5 | 66.3% | 96.2% | 78.9% |
| SE-YOLOv3 | SE-Darknet53 | 416 | 43.2 | 71.9% | 98.6% | 86.3% |
| SE-YOLOv3 | SE-Darknet53 | 512 | 49.2 | 73.5% | 99.1% | 88.1% |
| SE-YOLOv3 | SE-Darknet53 | 608 | 64.0 | 73.7% | 99.5% | 88.7% |
Publisher’s Note: MDPI stays neutral with regard to jurisdictional claims in published maps and institutional affiliations. |
© 2021 by the authors. Licensee MDPI, Basel, Switzerland. This article is an open access article distributed under the terms and conditions of the Creative Commons Attribution (CC BY) license (https://creativecommons.org/licenses/by/4.0/).
Share and Cite
MDPI and ACS Style
Jiang, X.; Gao, T.; Zhu, Z.; Zhao, Y. Real-Time Face Mask Detection Method Based on YOLOv3. Electronics 2021, 10, 837. https://0-doi-org.brum.beds.ac.uk/10.3390/electronics10070837
AMA Style
Jiang X, Gao T, Zhu Z, Zhao Y. Real-Time Face Mask Detection Method Based on YOLOv3. Electronics. 2021; 10(7):837. https://0-doi-org.brum.beds.ac.uk/10.3390/electronics10070837
Chicago/Turabian StyleJiang, Xinbei, Tianhan Gao, Zichen Zhu, and Yukang Zhao. 2021. "Real-Time Face Mask Detection Method Based on YOLOv3" Electronics 10, no. 7: 837. https://0-doi-org.brum.beds.ac.uk/10.3390/electronics10070837
Note that from the first issue of 2016, this journal uses article numbers instead of page numbers. See further details here.