
Game-Theoretic Power and Rate Control in IEEE 802.11p Wireless Networks


1
Department of Informatics and Telecommunications, University of Ioannina, 47150 Arta, Greece
2
Industrial Systems Institute, Athena Research Center, Patras Science Park Building, 26504 Patras, Greece
*
Author to whom correspondence should be addressed.
Electronics 2022, 11(10), 1618; https://0-doi-org.brum.beds.ac.uk/10.3390/electronics11101618
Submission received: 31 December 2021
/
Revised: 6 May 2022
/
Accepted: 9 May 2022
/
Published: 19 May 2022
(This article belongs to the Section Computer Science & Engineering)
Abstract
:Optimization of the transmission power and rate allocation is a significant problem in wireless networks with mobile nodes. Due to mobility, the vehicles establishing wireless networks may exhibit severe fluctuations of their link quality, affecting their connection reliability and throughput. In Vehicular Ad-hoc Networks (VANETS), the IEEE 802.11p standard provides a practical metric for the Packet Reception Ratio (PRR), which is related with the transmission power and rate. Finding a global strategy for optimizing PRR for all mobile nodes can be treated as a potential game where each vehicle is considered as a selfish player, aiming to maximise its transmission reliability while rate constraints are satisfied. To this end, we propose a game-theoretic approach that converges to a Nash equilibrium. The main contributions of this work include: (i) identification of the best case equilibrium, for two cases of interference: diminished or kept stable, and (ii) verification of the equilibrium optimality, by showing that the value of stability is 1. Moreover, numerical results exhibiting the ease of the utility function calculation are provided, especially after an SINR level, whereby the utility function is concave and can be solved efficiently in polynomial time.
1. Introduction
Wireless networks are often constraint by Quality of Service (QoS) requirements that aim to enhance their reliability. The unstable wireless medium does not provide a stable environment for wireless parameters tuning. Issues such as link quality and rate are restrictions that need to be addressed to optimise the behaviour of a wireless network. Such QoS constraints appear in practical scenarios. Their encapsulation in an optimisation process is essential to produce efficient approaches towards optimal wireless behaviour. A major concern in wireless networks operating with the IEEE standard is the maximisation of transmission reliability with high link quality and maximum rate, where delay limitation may be satisfied.
In particular, Vehicular Ad-hoc Networks (VANETS)-based communication introduced the IEEE 802.11p standard. The difficult environment of deploying Vehicle to Infrastructure (V2I) devices is evident. Since the early days of the Vehicle to Vehicle (V2V) and V2I technologies, the necessity of a wireless standard emerged; hence, the IEEE 802.11p or Dedicated Short-Range Communications (DSRC) was established. This protocol offers a dedicated bandwidth of 75 MHz in the 5.850–5.925 frequency band, as established and allocated by the Federal Communications Commission (FCC) in the USA [1]. Furthermore, DSRC provide a high V2I of V2V data rate. In terms of Wireless Access in Vehicular Environments (WAVE), the DSRC standards comprise the IEEE 1609.x family and IEEE 802.11p. Specifically, the IEEE 1609 sits on top of the IEEE 802.11p and handles upper layers from the PHY and MAC without having information about low-layer parameters. The PHY and MAC layers are specified by the IEEE 802.11p for single-channel operations. Multi-channel operations can be offered by the division of the access time to two separate channels. This is done using a trial IEEE 1609.4 on top of the IEEE 802.11p [2].
The reason behind employing game theory is that it studies mathematical models of conflict and cooperation [3] between vehicles in our example. Therefore, our meaning of the term game corresponds to any form of social interaction between two or more devices. The utilisation of a potential game approach comes as a result of the fact that in 2008, Daskalakis et al. [4] proved that finding a Nash equilibrium is PPAD-complete. Polynomial Parity Arguments on Directed graphs (PPAD) is a class of total search problems [5] for which solutions have been proven to exist; however, finding a specific solution is difficult if not intractable. There exists a class of games called “Potential Games” [6], which have important properties that pure Nash equilibria will always exist and best response dynamics are guaranteed to converge. This class of games consists of the exact, ordinal and weighted potential games.
In this paper, we utilise exact potential games and we build a potential function that has the same behaviour as the individual utility function when a player unilaterally deviates. We take into account the physical-layer (PHY) characteristics of the IEEE 802.11p standard, and we adopt the link layer Packet Reception Ratio (PRR) measure. The PRR can be used to implicitly optimise throughput by reducing re-transmissions. To do so, we construct a model to optimise the rate and transmission power for each vehicle to enhance throughput. In contrast with the conventional methodology, we do not take into account parameters such as the Received Signal Strength Indicator (RSSI), given that for low-power transmissions, it may result into severe packet losses. Thus, we are considering the network layer parameter of PRR to model the packet reception or drop. Using this, we devise a utility function that is represented by the PRR and rate. We employ this utility function to construct a potential game, where each device can optimise its rate and transmission power in a selfish manner. The main motivation behind this work is that there are conflicting interests of players/vehicles, which aim to maximise their profits by not cooperating. Thus, a methodology will be suggested whereby the conflicting members will not lose throughput by employing the best transmission power level.
In summary, the contributions of this paper are listed below:
- We devise a new metric that pushes the PRR further down the wireless stack, in particular the PHY layer.
- We form a potential game of the joint power and rate control.
- We identify the best case Nash equilibrium for two cases, namely no or stable interference.
- We show that the price of stability is 1.
- We show that with a stable delay, the utility function is maximised because the rate increases.
- We show that the utility function is concave, and it can be solved in polynomial time.
- We indicate the number of time slots and time in seconds that are required for the transmission with and without the duty cycling mechanism.
- We show results that we can accomplish a maximum rate and PRR by raising the transmission power, which with duty cycling means increasing the signal-to-interference-plus-noise ratio (SINR).
2. Related Work
Vehicular wireless networks have been extensively studied in different contexts, and recently published surveys cover many of their aspects. Game theory has been widely used to analyse the interactions of competitive and cooperative behaviours in wireless networks. The applications of game theory in wireless networks have been generally investigated [7]. With the development of the fifth-generation (5G) communication technology, several recent surveys are mainly concerned with the applications of game theory in the emerging wireless communications such as the multi-access edge computing wireless networks [8] and the UAV-assisted wireless networks [9].
Joint power and rate control have been extensively studied under the game theory framework. In [10], a non-cooperative bargaining game was used for joint power and packet rate adaptation to avoid information congestion. The authors showed that the proposed joint power and rate adjustment congestion control scheme can alleviate the possible packets collisions, thus reducing the average experienced delay in queue and increasing the number of successfully delivered packets on the receiver side. The drawback of this work is that according to their analysis, the more the players, the more the introduced time and computation complexity will be brought, which raises issues of complexity and density.
In [11], Tielert et al. proposed a power and rate control approach for Vehicle Safety Communications in order to optimise the reception performance between a pair of agents participating in the VANET. To this end, they suggest utilising the average packet Inter-Reception metric. They show that an optimal Tx power can be used for a good reception, which is independent of vehicle density. They provide a simple rate and power control algorithm, which is based on the distance of the communication. In particular, they set the Tx power according to the distance of the vehicle with the receiver, and then, they optimise the rate. Even though this work is simple to be evaluated in practical scenarios, acquiring the distance in wireless networks is ambiguous, and other metrics should replace it.
In [12], Aygun et al. suggested a joint power and rate adaptation mechanism based on environmental parameters and context. They proposed some form of cooperative communication between vehicles, since a vehicle calculates and receives path loss and neighbouring vehicles’ path loss exponents to determine its own power and then utilises the appropriate rate. The proposed algorithm adjusts the transmit power of the messages in order to reach the desired awareness ratio at the target distance. At the same time, the algorithm controls the channel load using an adaptive rate control algorithm. The major problem of this approach is the calculation of the path loss exponent of vehicles. Since we know that it can vary significantly depending on the scenario, it can be risky to make decisions based on this metric. In addition, the neighbouring communication will introduce a significant overhead in the vehicle communication, which may result in a degradation of the desired output.
In [13], Zemuri et al. proposed a joint rate and power adaptation scheme, which takes advantage of the ETSI TS technical specification for minimum beacons transmit frequency. The authors regulate the frequency of beacons and attempt to enhance awareness of the vehicles in close ranges. Moreover, they describe a mechanism to reduce the collision rate and keep the channel in a good state of utilisation. In particular, the presented scheme adapts the rate of transmission to regulate the collision rate and utilisation in terms of the channel being busy. Thereafter, power is adjusted to ensure a high level of awareness for close vehicles considered as neighbours. The binary search employment for the near-optimal channel busy rate is not explained thoroughly, providing evidence in the efficiency of their result analytically.
In [14], Jose et al. described an approach of rate and power control in DSRC for VANETS. They propose a utility maximisation method by exploiting the network congestion control methodologies. Due to the difficulty of the problem, they proceed to a decomposition of the rate and power control in two subproblems. In the first subproblem, they optimise rate with fixed powers and vice versa. They show asymptotic optimality. However, the iterative methods they propose to solve the two subproblems do not take into account the dynamic relationship between rate and power. A decomposition of the problem solving the problems in a more dynamic manner could be more efficient.
In [15], Huang et al. proposed a protocol for adaptive beaconing rate and power. In particular, the vehicles compute transition probabilities in every time step. These probabilities rely on the suspected tracking error on vehicles being close by towards its own position in an Euclidean sense. Note that in this case, the beacon transmission rate increases. This work employs a threshold to determine whether transmission will occur or not. In the case that transmission is mandatory, it takes place with a probability proportional to the magnitude of the suspected error. The transmission power adaptation occurs by using the Channel Busy Ratio (CBR). The authors determine maximum and minimum values of CBR to rule the use of minimum or maximum transmission powers. In the case that the CBR is within the two values, the transmission power is selected between the maximum and minimum values using a linear function. The main drawback of this work is that it misses study and analysis of the fairness.
In [16], Liu et al. devised a robust optimisation problem to optimise the network-wide sum rates constrained with the predefined outage probability. The maximisation includes the conversion of the known statistical characteristics of the original problem with probability constraints, such as the mean and variance of V2V gains, to the deterministic problem. Moreover, the non-convex problem is formulated as a successive convex approximation, in order to result in a convex optimisation problem. Using the dual decomposition, the optimal solution can be identified. Finally, an iterative algorithm is used to determine the optimal transmission power of each user. In terms of results, the numerical simulation exhibits the effectiveness and the robustness of the algorithm in dynamic vehicular network settings. Practical considerations and a high density of Cluster Members (CM)s in simulations are subjects that need to be further investigated, since the maximum number of CMs should be restricted to four in a subchannel to achieve a higher average rate of each CM.
With respect to the related work, the proposed algorithm attempts to maximise the power and rate control of the VANET by using a duty cycling mechanism, whereby the collisions and interference is diminished or kept stable. In this way, the maximum power can be used, and the rate keeps increasing with the increase of the SINR.
3. System Model
We consider a VANET, as we can see in Figure 1, whereby the vehicles communicate between them. We denote the number of vehicles as N. As we mentioned previously, we aim to optimise the throughput of each vehicle while satisfying certain QoS constraints, such as PRR and rate.To this end, we identify certain wireless parameters as capable of assisting this objective. These are the transmission power and the rate of transmission. The former can be adjusted to strengthen the signal for successful packets’ transmissions and to mitigate interference from other neighbouring vehicles. The latter can be optimised to achieve better throughput in the network when multiple packets are required to be forwarded.
3.1. Link Quality Estimator
To characterise the link quality, we utilise the Packet Reception Ratio (PRR) metric, which in general describes the ratio of the number of packets successfully received by node j over the number of packets sent by node i for a wireless link . It is known that the relation between PRR and Signal-to-Interference-plus-Noise Ratio (SINR) is given by:
where is the SINR of the transmission from node i to node j, and l is the packet length in bits. The term is given by
where is variance of the white Gaussian noise, is the channel gain of node i with node j, is the transmission power of node i and is the interference signal from node t, which can be calculated as , namely using the channel gain between nodes t and k and the transmission power of node t. for the node i.
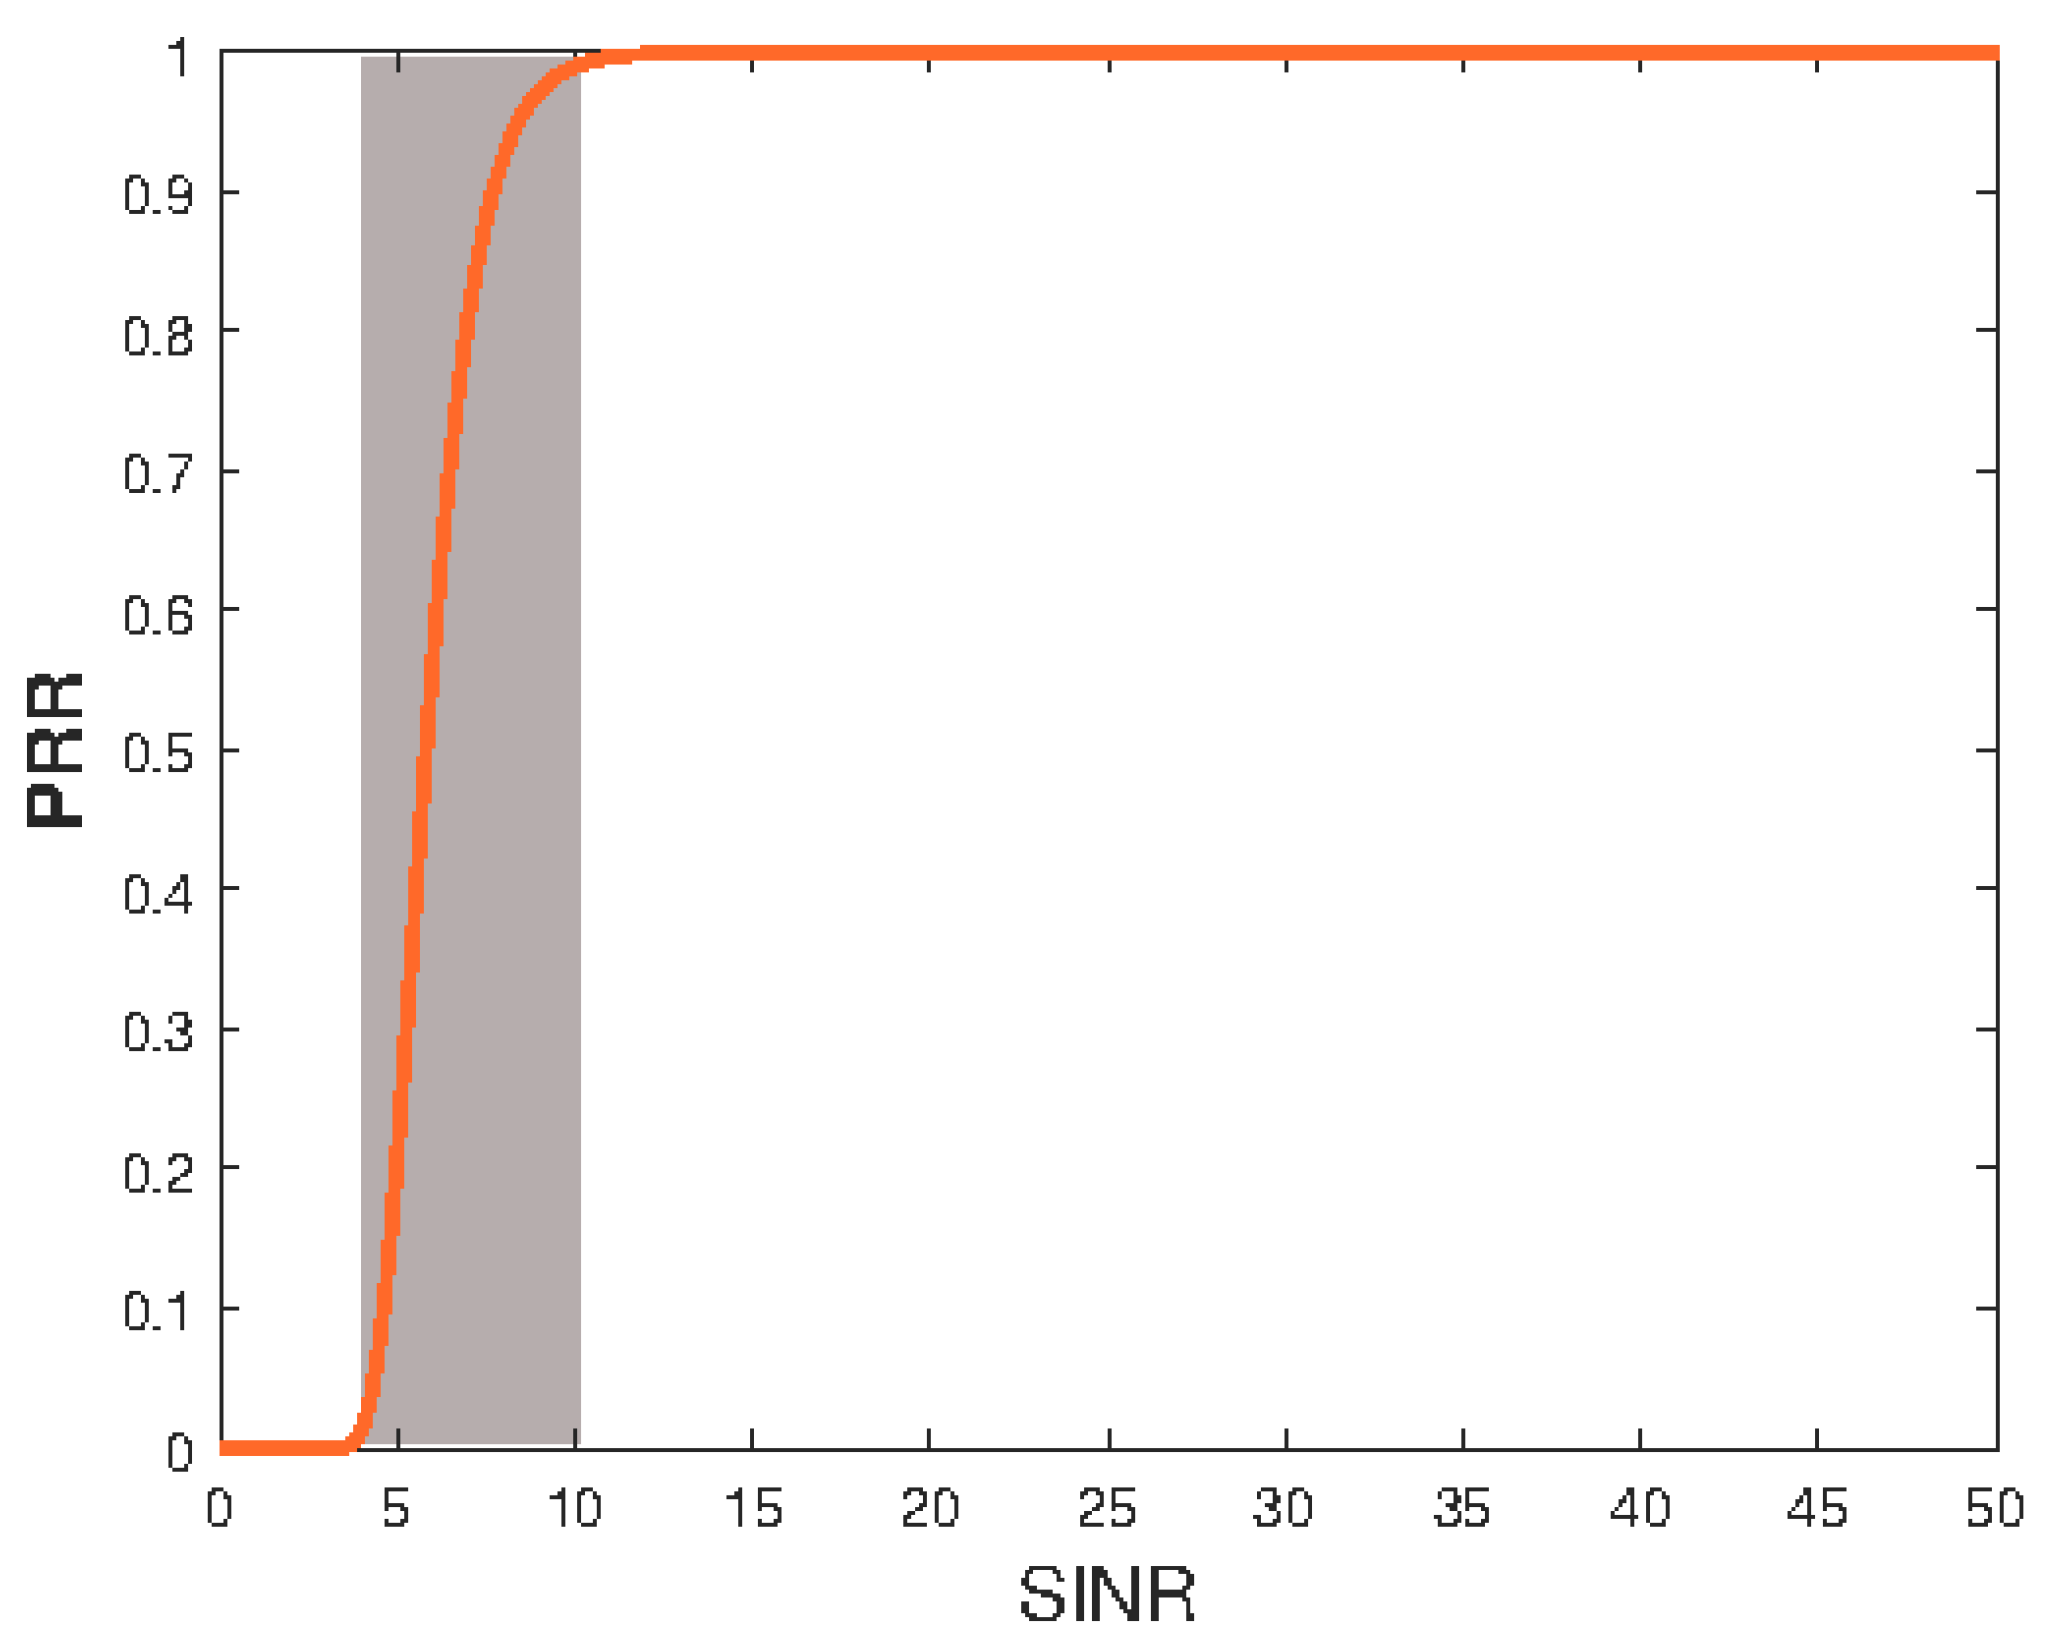
By increasing the the transmission power, it is expected that the SINR will also be increased. However, when the transmission power is set to a significantly high level, interference from the other users, , makes the PRR decrease. When we have no interference, the PRR goes rapidly to maximum 1. In Figure 2, we see the increase of the PRR with the increase of the SINR without the presence of interference, where it follows the sigmoidal function. Note that for and , which is true for a packet with reasonably large number of bits. Thus, SINR values that belong in the grey area do not exhibit stable PRR estimation. For this reason, our simulation results will be based on more practical definitions of PRR.
3.2. Utility Function and Game Formulation
We consider the wireless devices as selfish players, whose interest is to maximise their rewards in a similar manner as we see in [17]. To this end, we consider a game with N players, A set of actions, and u payoffs in the form of utility functions in order to consider a non-cooperative game. Let us define the utility function for the i-th device which communicates with the j-th device, as follows
where is the transmission power for the i-device with , which also represents the set of actions. Transmission rate is defined as:
which is a function of green transmission power adjustment, the interference, and the noise. B is the bandwidth, and is the maximum achievable rate. Recall that the packet reception rate at the physical layer has been defined in Equation (1), which is a function of the SINR . Essentially, the introduced utility function is the product of the transmission rate and the , which both depend on the transmission power . In our game formulation, each game attempts to maximise its utility by selecting the transmission power that achieves the best PRR and rate, which with the rate it is considered to be the throughput of a link . Therefore, we want to perform the following optimisation procedure
where is the SINR which obtains , is a value of PRR that shows a highly reliable link (≥90 %), and is given as the rate node that i can transmit with when is satisfied.
Thereafter, we formulate this non-cooperative game into a potential game. In order to use exact potential games, it is essential to have a potential function that has the same behaviour as the individual utility function when a player unilaterally deviates.
More formally, a game , with N players, A strategy profiles and u as the payoff function, is an exact potential game if there exists a potential function
where is the strategy of player i, is the deviation of player i, is the set of strategies followed by all the players except player i, and is the set of strategy profiles of all players except i such as
We define the potential function as
Lemma 1.
The is a potential game with the potential function given by (8).
Proof.
We have
where is the neighbourhood of node k. By the definition of the exact potential game, one node can deviate to accomplish a Nash equilibrium. If we allow node i transmitting to node j to deviate, the remaining nodes remain with their current strategies. Hence, it has to be shown that
From (2), which gives the SINR expression, the reader can see that the data rate as it comes from the upper bound of Shannon’s formula is
where B is the bandwidth. As a result of the coming from (17), the interference caused by the change of the transmission power of node i may affect the utilities of a number of other nodes K due to the denominator of the SINR in (2). Hence, it needs to be shown that the interference is 0 or or at least equal when node i transmitted with the initial transmission power.
Taking inspiration from [18], we can see that a potential function with PRR utility can be a potential game if a node i that is transmitting to node j and its interfering nodes (hidden terminals) can be duty cycled with at most
where
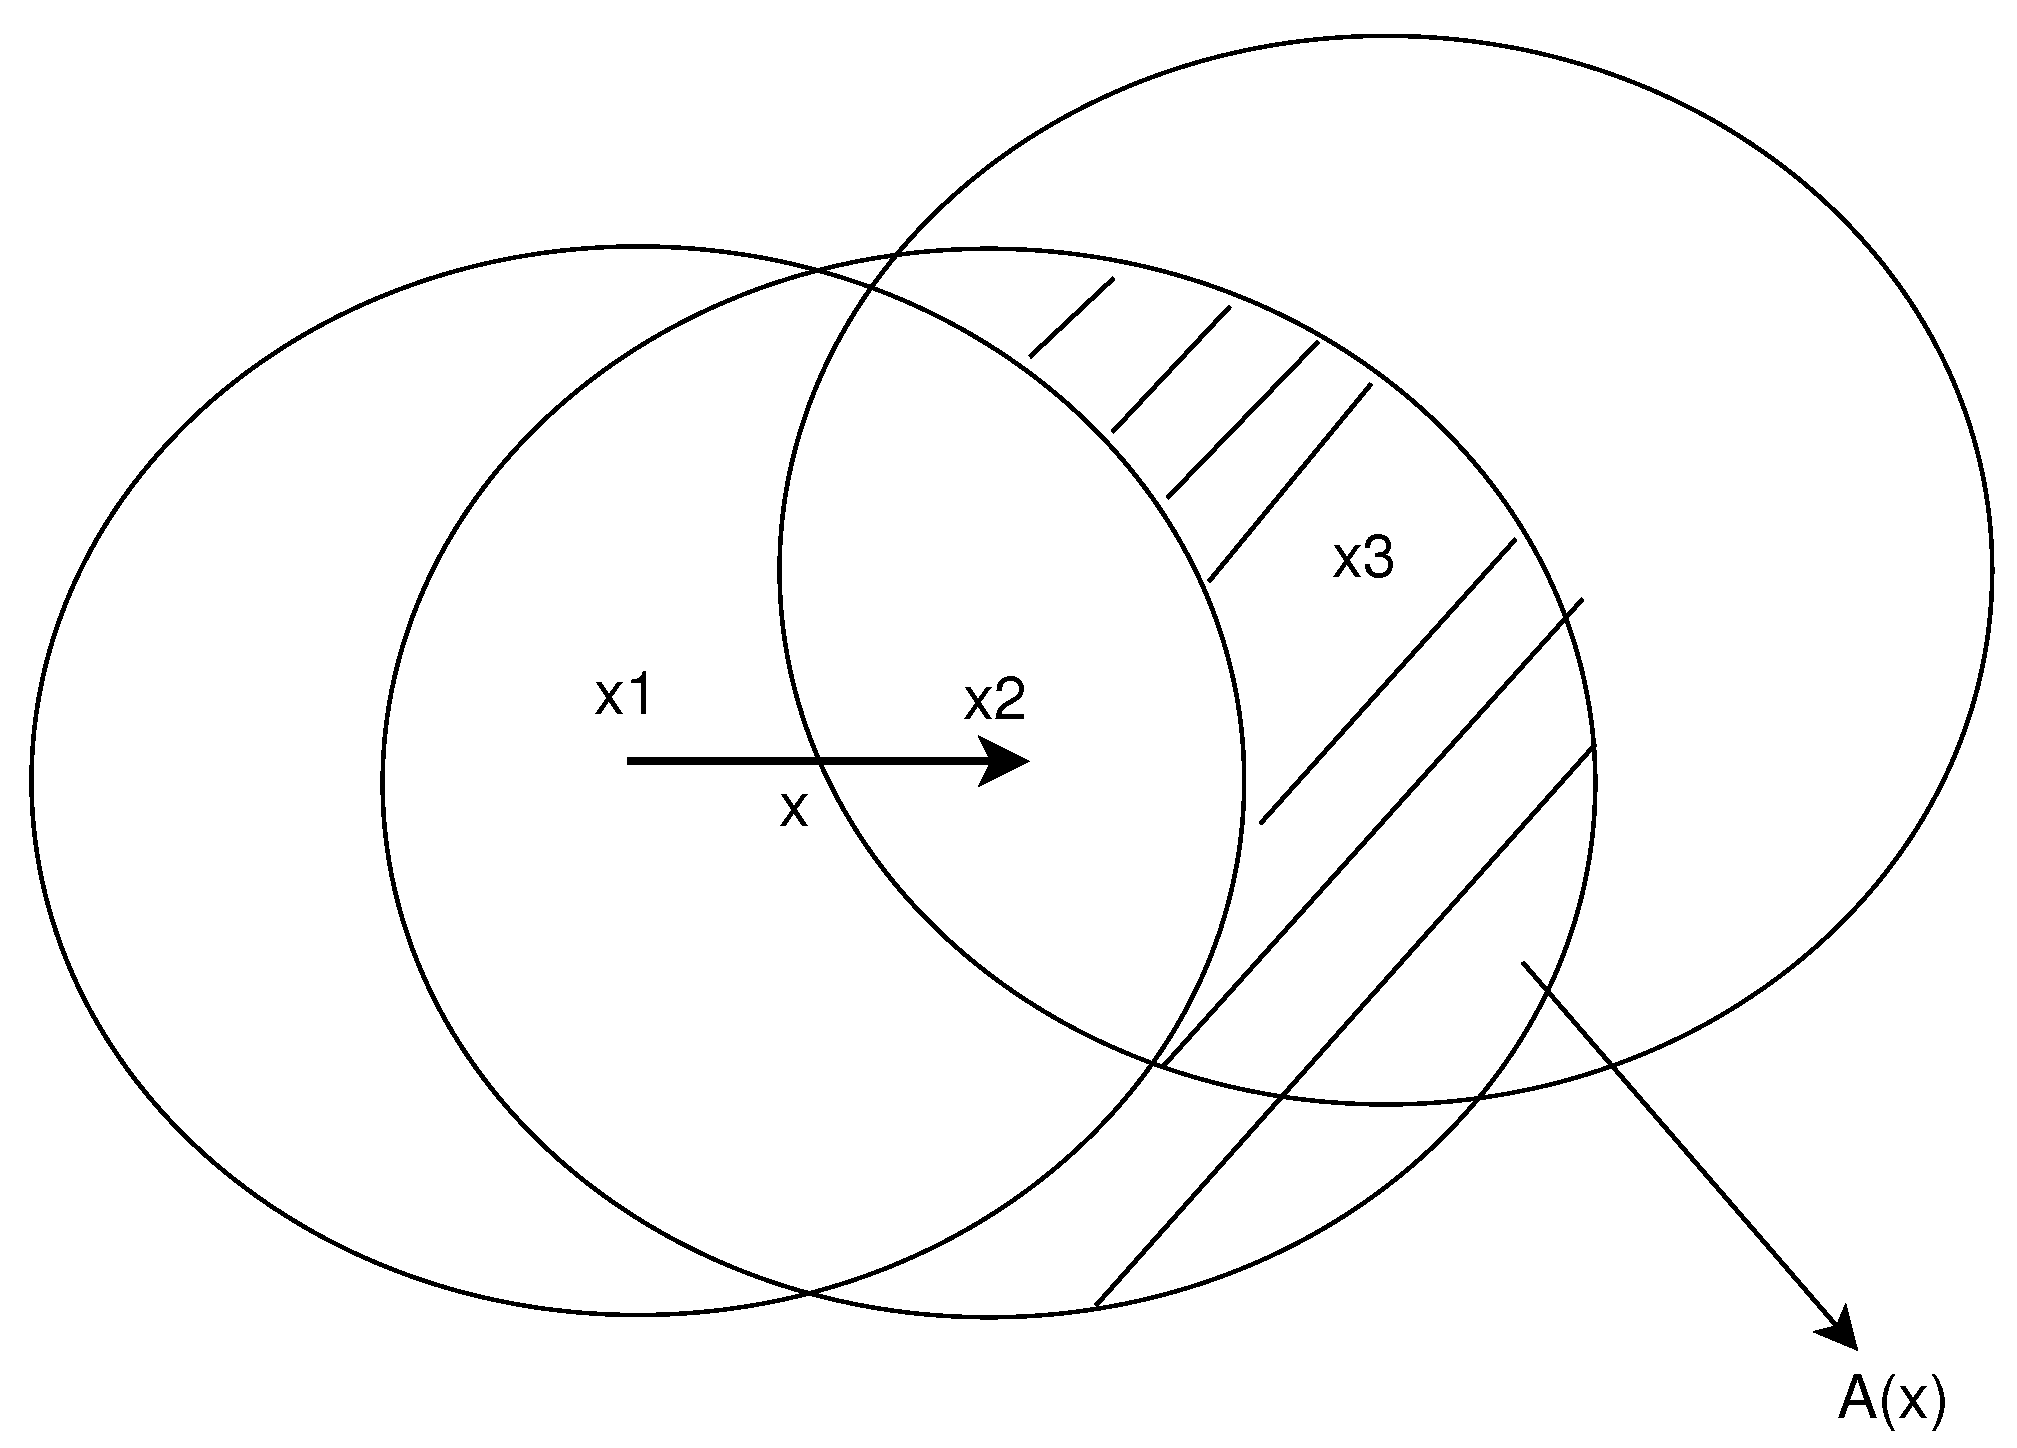
when the receiver is located within an annulus from distance x from the sender and r is the transmission range as it appears in Figure 3. By , we denote the nodes per unit area and W is the window size of the PRR, which in , the header is added on [19], and the area with hidden terminals for an edge of the neighbourhood is denoted by A(x).
We have
and
if we keep the interference at the same level and the rates are kept at the same level as well. Hence, in this case, and when if the nodes can be duty cycled to ensure no packet loss.
Hence, our game is a potential game since (10) is satisfied. □
Figure 3.
Hidden Terminal Example (based on [19]).
Figure 3.
Hidden Terminal Example (based on [19]).

Moreover, Successive Interference Cancellation (SIC) [20] can be employed, which we could employ to ensure that the messages will go through even in the presence of interference. Assuming that this perfect SIC is on board, then perfect communication can be accomplished, and the game is a potential game as well, since the messages go through regardless of the SINR, which should be which is the receiving threshold, for a successful transmission.
3.3. Nash Equilibrium Properties
In the game formulation, specific properties can be shown of the Nash equilibrium that exists by definition of the potential game. Initially, the existence of multiple Nash equilibria are shown. Thereafter, we try to identify the best one.
Lemma 2.
The best Nash equilibrium is when the nodes play with , resulting in that satisfies the constraints of (5).
Proof.
We denote and as two subsets of the playing nodes N participating in our game formulation. Furthermore, we denote as the transmission powers, which is the best response of the nodes in subset and denotes the best response rates. Moreover, we denote and as the best response transmission power and rates of subset , respectively. Finally, we denote , where is the SINR threshold for the successful reception of a packet. As we have seen from [21], there exists two transmission powers that two different sender/receiver pairs use, which results in both messages successfully received for a sparse configuration of the nodes. In addition, duty cycling of the nodes may result in equal or no interference; hence, we have for a link Equations (14) and (15) satisfied, where if we duty cycle the nodes to keep interference to the same level.
In the case that , the duty cycling mechanism ensures that the denominator of the SINR equation gets smaller; hence, the reception threshold is exceeded, and the . Even if we raise the transmission power, the PRR will be 1, as we can see below,
and using transmission power , this ensures that (16) is satisfied as well.
The transmission powers and set the , with a smaller transmission power than . Since (11) reaches its maximum value with maximum SINR, the transmission powers used by the two subsets of nodes is = . Hence, the two subsets of nodes will transmit with , which is the best case equilibrium.
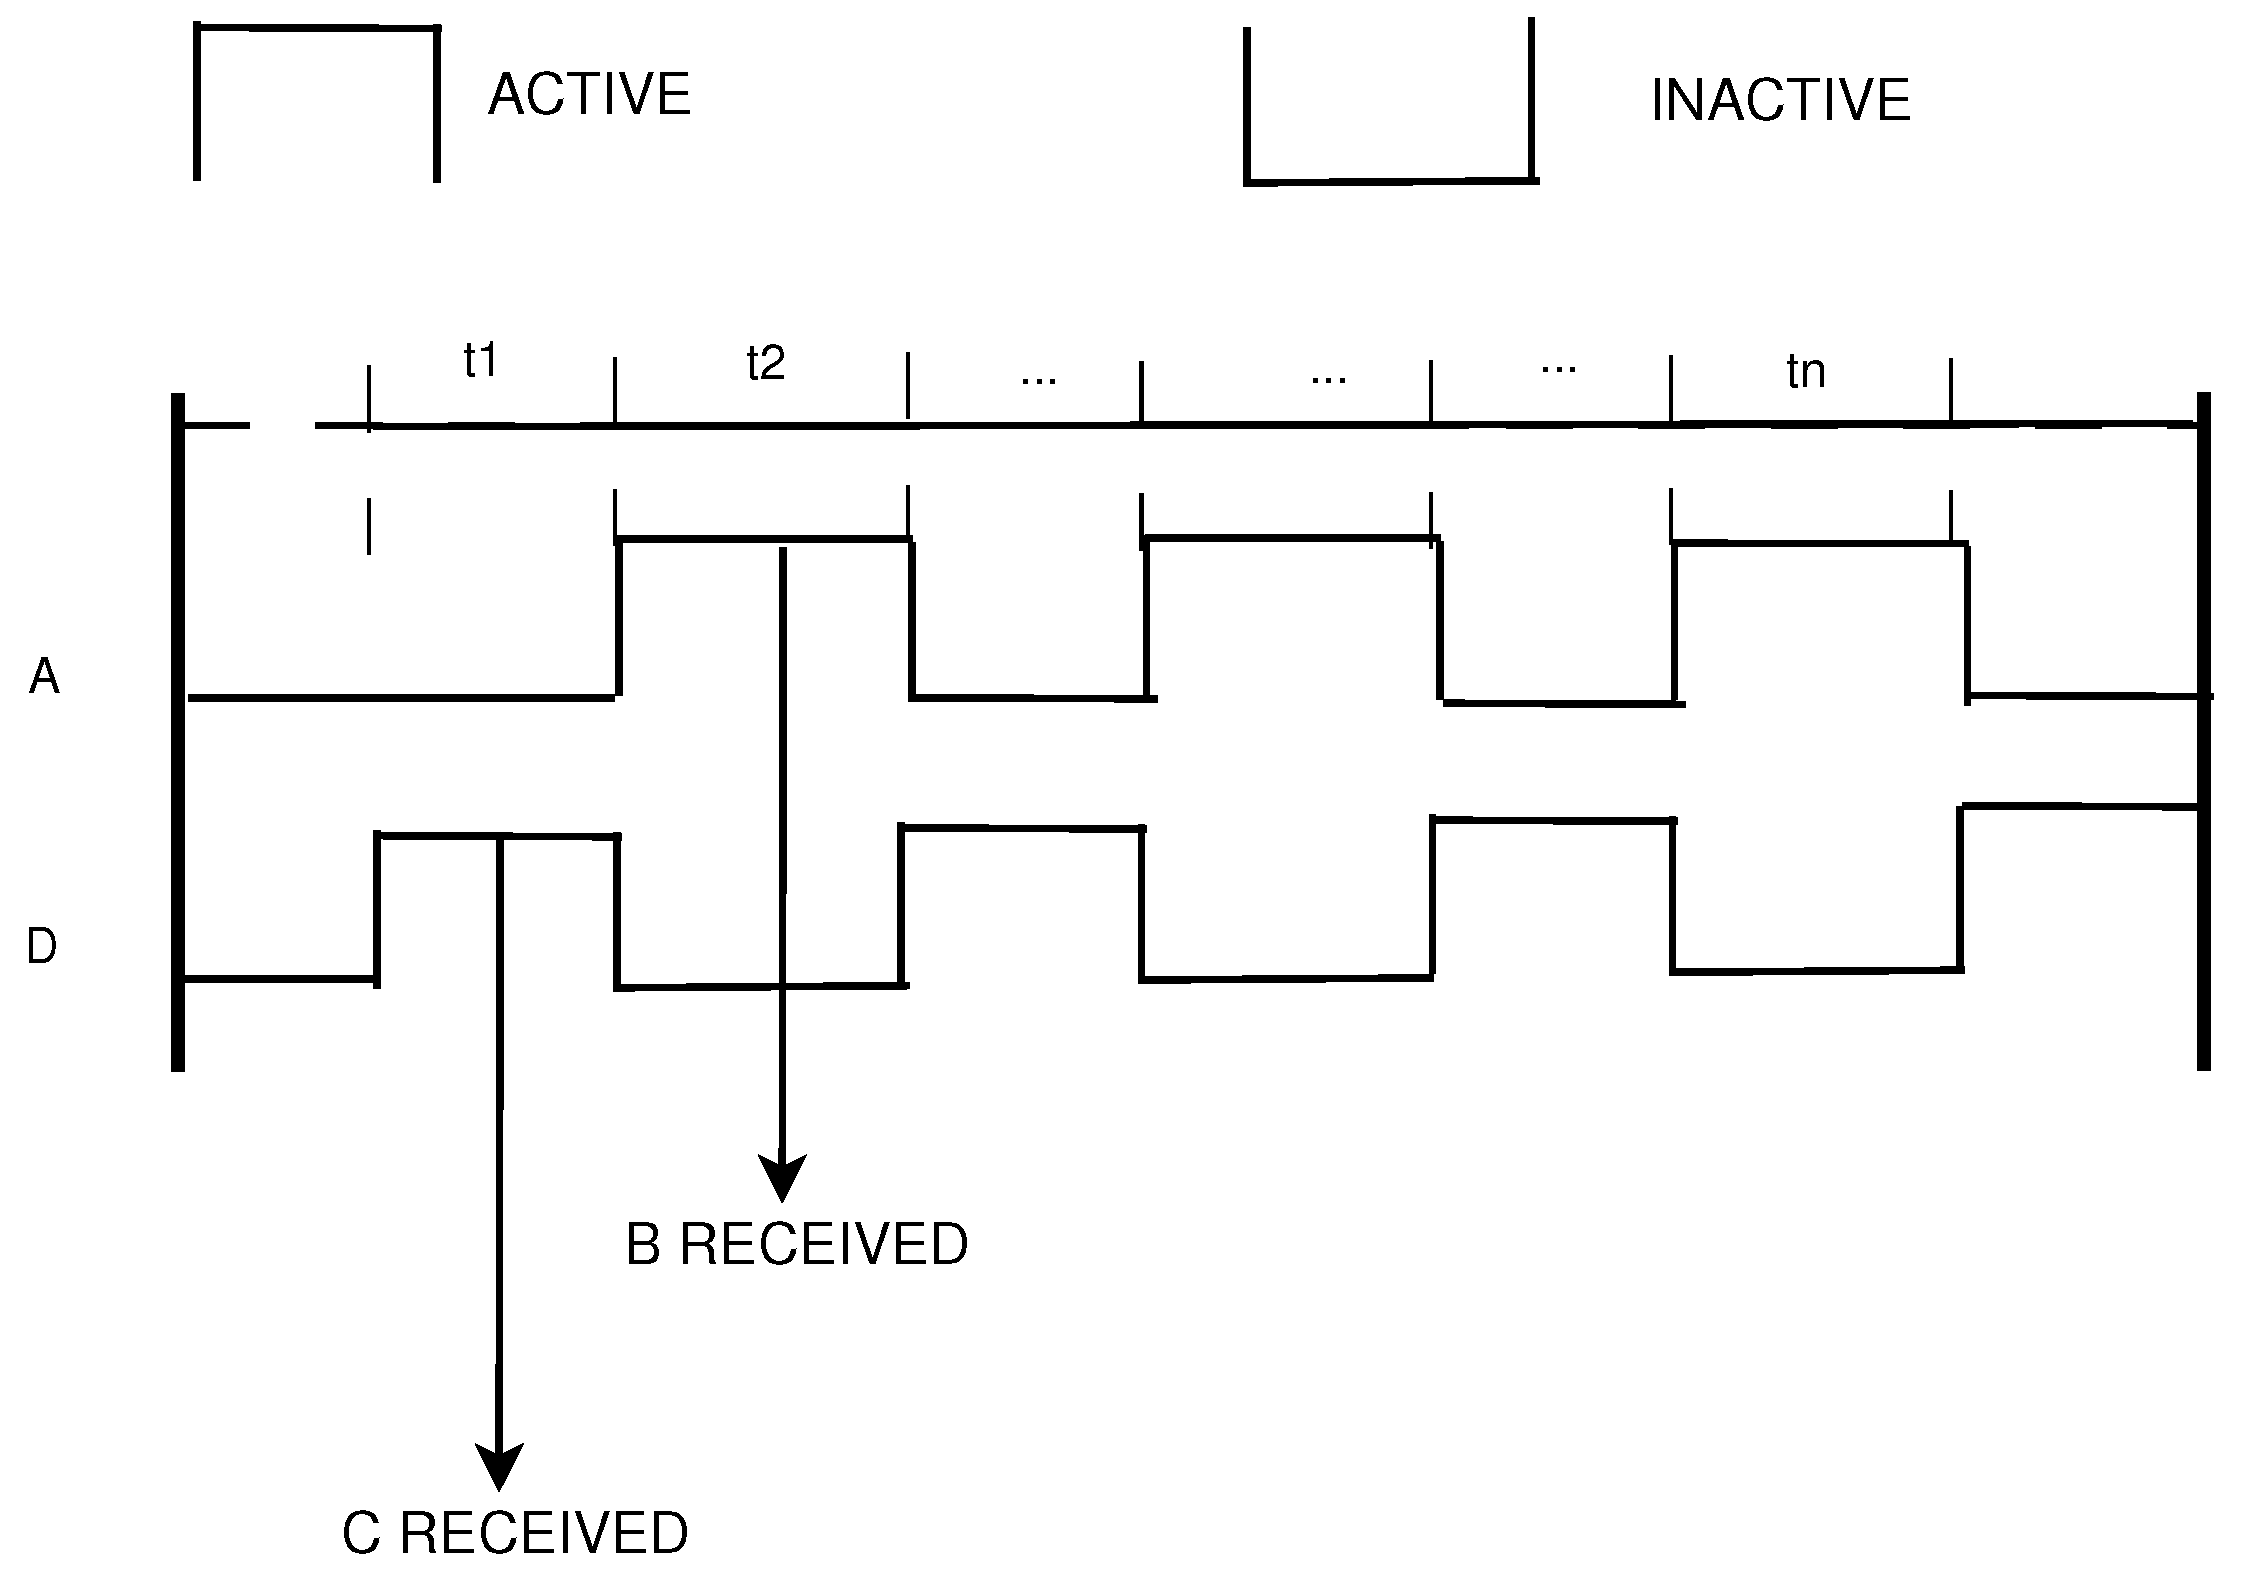
As such, increasing the rate of such configuration will further increase the throughput of the network and maximise Equation (5). In conjunction with the transmission powers and , the rates of the nodes in the subsets are , by using the maximum transmission power that satisfies the constraints. This is due to the maximum rate including the maximum , as we can see from the constraints of (5) when interference is mitigated or diminished using duty cycling, as we can see in Figure 4. □
Lemma 3.
The price of stability when the best case equilibrium is played is 1.
Proof.
We have seen that the best case equilibrium is when and . If we suppose that there is a more efficient equilibrium, then we have that a node deviates to another transmission power ,
which contradicts that the and is the best case equilibrium. Hence, the price of stability is 1. □
4. Numerical Results
In this section, we derive several numerical results to evaluate the proposed approach.
4.1. Practical Considerations
We know from practical scenarios that the PRR can be calculated at the link layer when a message is successfully received at the receiver, which then sends an acknowledgment to the sender. Thus, the sender has knowledge of whether the message has been sent, and it does not re-transmit it. The MAC layer is responsible for the re-transmission of the packet or the acknowledgment. In this paper, we push the PRR down the wireless stack, and we measure it at the physical layer. We aim to eliminate acknowledgments on both sides. Instead, the receiver will send a message of non-ack to the sender to inform it about a unsuccessful transmission. We do this to reduce messages in the network, since our objective is to optimise throughput via link quality. Certain works in the literature suggest metrics of link estimators on the PHY layer [22,23,24]. In summary these works employ the packet decoding process to compute the link estimator. They take into account the packet drop in the link estimation algorithms even though they analyse packets at the bit level as well. Our technique attempts to reduce messages, while link estimation is not compromised.
The IEEE 802.11p PHY layer employs the OFDM method to perform encoding and decoding processes. It performs signal processing at the bit level and it separates decoding into specific stages [25].
- StartReceive: This essentially is the reception of the first packet bit, whose signal strength must exceed the reception threshold for successful reception.
- EndPreamble: This event check is the preamble reception process. It includes specific conditions for the preamble’s reception to be initiated. The state of reception should not be busy; also, the signal strength of the incoming signal should have an SINR larger than the reception threshold to schedule the EndHeader decoding event.
- EndHeader: This decoding event should be aware of the modulation, coding length and parity check of the incoming data. The header information needs to be justifiable to initiate the EndRx decoding event.
- EndRx: During this event, data are decoded by applying signal demodulation and error correction. Moreover, channel estimation is performed to the OFDM samples, and when data are decoded successfully, the RxPhyOk event takes place.
Errors in the aforementioned stages that result in packet drop include the errors of StartReceive, EndPreamble, and EndHeader due to channel interference as well as for decoding reasons. When a packet is successfully received on the PHY layer, the RxPhyOk occurs [22]. As such, we transform the PRR definition to the PHY layer for a time window of k packets as follows:
where is a packet successfully received by the receiver j from sender i, and is the packet sequence number coming from the sender in the header. Note that PRR can be given by two formulas, the ones being in Equations (1) and (17), and the other
over a window of W transmissions, where is the number of packets received by node j from node i and is the overall numbers sent from node i to node j.
For practical considerations, we utilize (17) and (18) to estimate the utility function. The packets that are received can be calculated in two ways. For the first, we can use the PxPhyOK and for the latter, we can use the Bit-Error Rate (BER). The Medium Access Control (MAC) layer can be utilised to duty cycle the vehicles for their transmission according to the metrics used in this problem. The packets that are received can be calculated in two ways: firstly by adding a sequence number on the packet to show how many packets have been sent (successfully and unsuccessfully) or by using acknowledgments. As such, we will have the received packets over the sent packets at the receiver. For example, if the sender sent a packet with an and the , then the . In this case, the receiver will send a message to the sender informing it that it missed one packet instead of sending 4 acknowledgment packets for each received message.
Note that we use different definitions for PRR, which are based on the PHY and network layer. Specifically, Equation (1) is the general theoretical case of . The equivalent equation of the network layer is the (18). The latter equation is utilised in practical research works, whereby the packets are being counted, since the SINR requires a calculation that needs to include the interference measurement as well, which may be challenging to obtain in practice. For instance, the noise floor may need to be obtained constantly. Hence, we attempted to provide a PHY layer metric that can be acquired in practice: thus, to use Equation (18) further down the stack, which is a function of the SINR as we see in the equivalent Equation (1). The is affected by the SINR, in practical scenarios; by increasing the SINR, the PRR increases as well, unless interference or collisions are present.
In the next subsection, plots for the utility versus SINR and the utility versus transmission power are presented. According to Equation (3), the utility function is proportional to the PRR. This is also shown in Figure 2, where it moves from the grey area to the maximum value due to the increase in the SINR, which can be done by increasing the transmission power or reducing interference with duty cycling. In the next section of the paper, simulation results and detailed discussions will be given to justify the theoretical analysis.
4.2. Evaluation Results
Let us assume that our algorithm operates in a road network, which is interconnected operating with 802.11p. The bandwidth is set to 10 MHz, and and we set a delay of 0.05 s. We also set the arrival rate of the packets to 10 packets per second and the , since we have very reliable links due to the nature of the problem. Note that there will be interference from other vehicles that want to receive a message from another as well as interference from other vehicles that reside nearby. Initially, we take the case where two vehicles want to exchange messages with two respective vehicles. We assume that the Carrier Sense Multiple Access (CSMA) is disabled in order to ensure that simultaneous transmission to a vehicle is allowed. We duty cycle the two vehicles into two time slots; hence, the utility of each vehicle can reach the maximum when the maximum transmission power is used due to the increase of the SINR from the transmission power increase, as we do not experience interference.
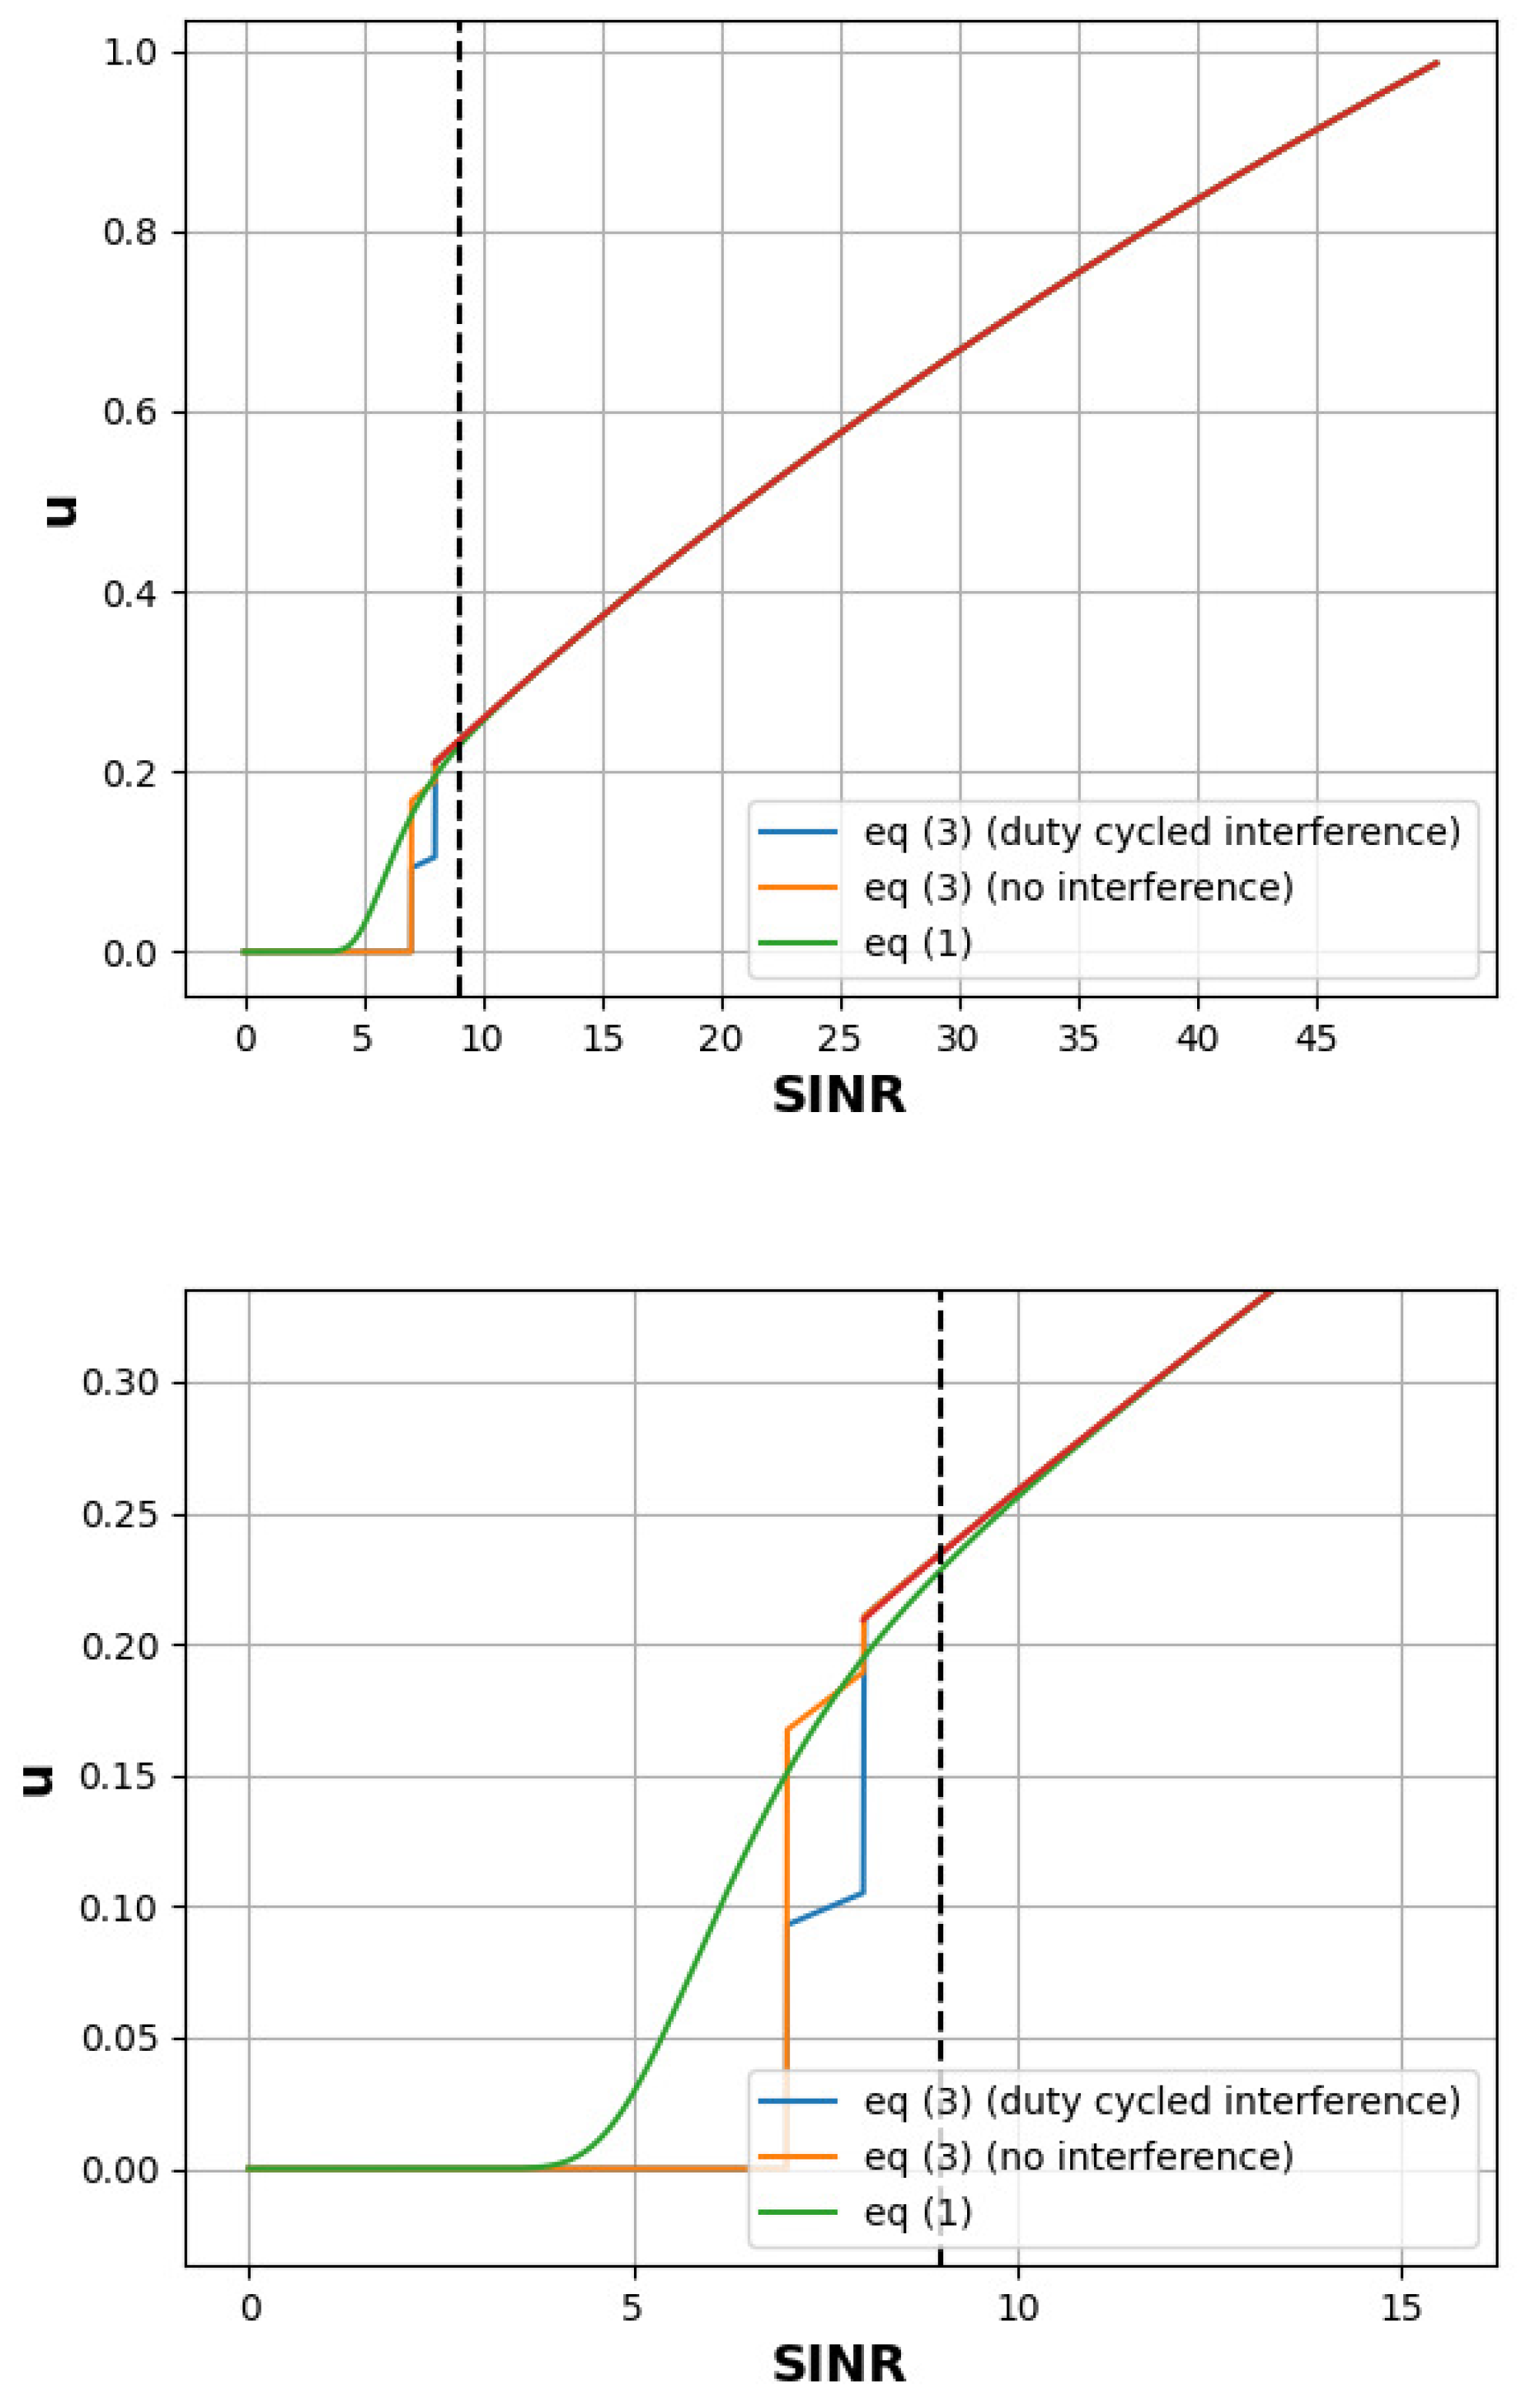
The reader can see the results of the plots of Equations (1) and (17). For the latter, we included the cases with no interference and duty cycled interference in Figure 5. Here, with the red color, we see the utility when the constraints are satisfied. The best case Nash equilibrium is the one with the highest SINR. Moreover, we plotted the curve of Equation (1) and the plot for the duty cycled interference from Equation (17). For the latter, we see that with the increase of the SINR, the PRR increases from the grey area to the maximum and then the rate is maximised after the PRR being 1. This takes place since the PRR can be one with lower than the maximum SINR. Furthermore, the zoom of the plot can be seen directly below the figure to see the change in the .
The value of the rate starts increasing when the , which is when the SINR is 9 dB, as it can be seen with the red line of the plot. Note that for the case of no interference, the utility rapidly increases, since the SINR exceeds the reception threshold and the jumps from 0 to 0.9. When the SINR reception threshold is surpassed, the PRR becomes 1, as we can see from Equation (1) and Figure 2; thus, the PRR jumps to a high value. The is since, due to the low transmission power, a packet may be lost due to the coverage or other problems, such as an obstacle between the sender and the receiver. For the duty-cycled case, the utility appears to be like a step function, since the duty cycling mechanism is applied and the jumps from to a final . We constructed the experiment in such a way in order to show the duty-cycled mechanism when it is applied to the transmission of the packets. In practical scenarios, the PRR fluctuates when interference is experienced, and the PRR falls into the grey area, especially when the signal is not strong enough from the transmission power perspective. Once the duty cycling mechanism is activated, the signal can go through and the reception threshold at the received is exceeded, meaning the successful transmission of a packet. This means that the PRR will be increased dramatically.
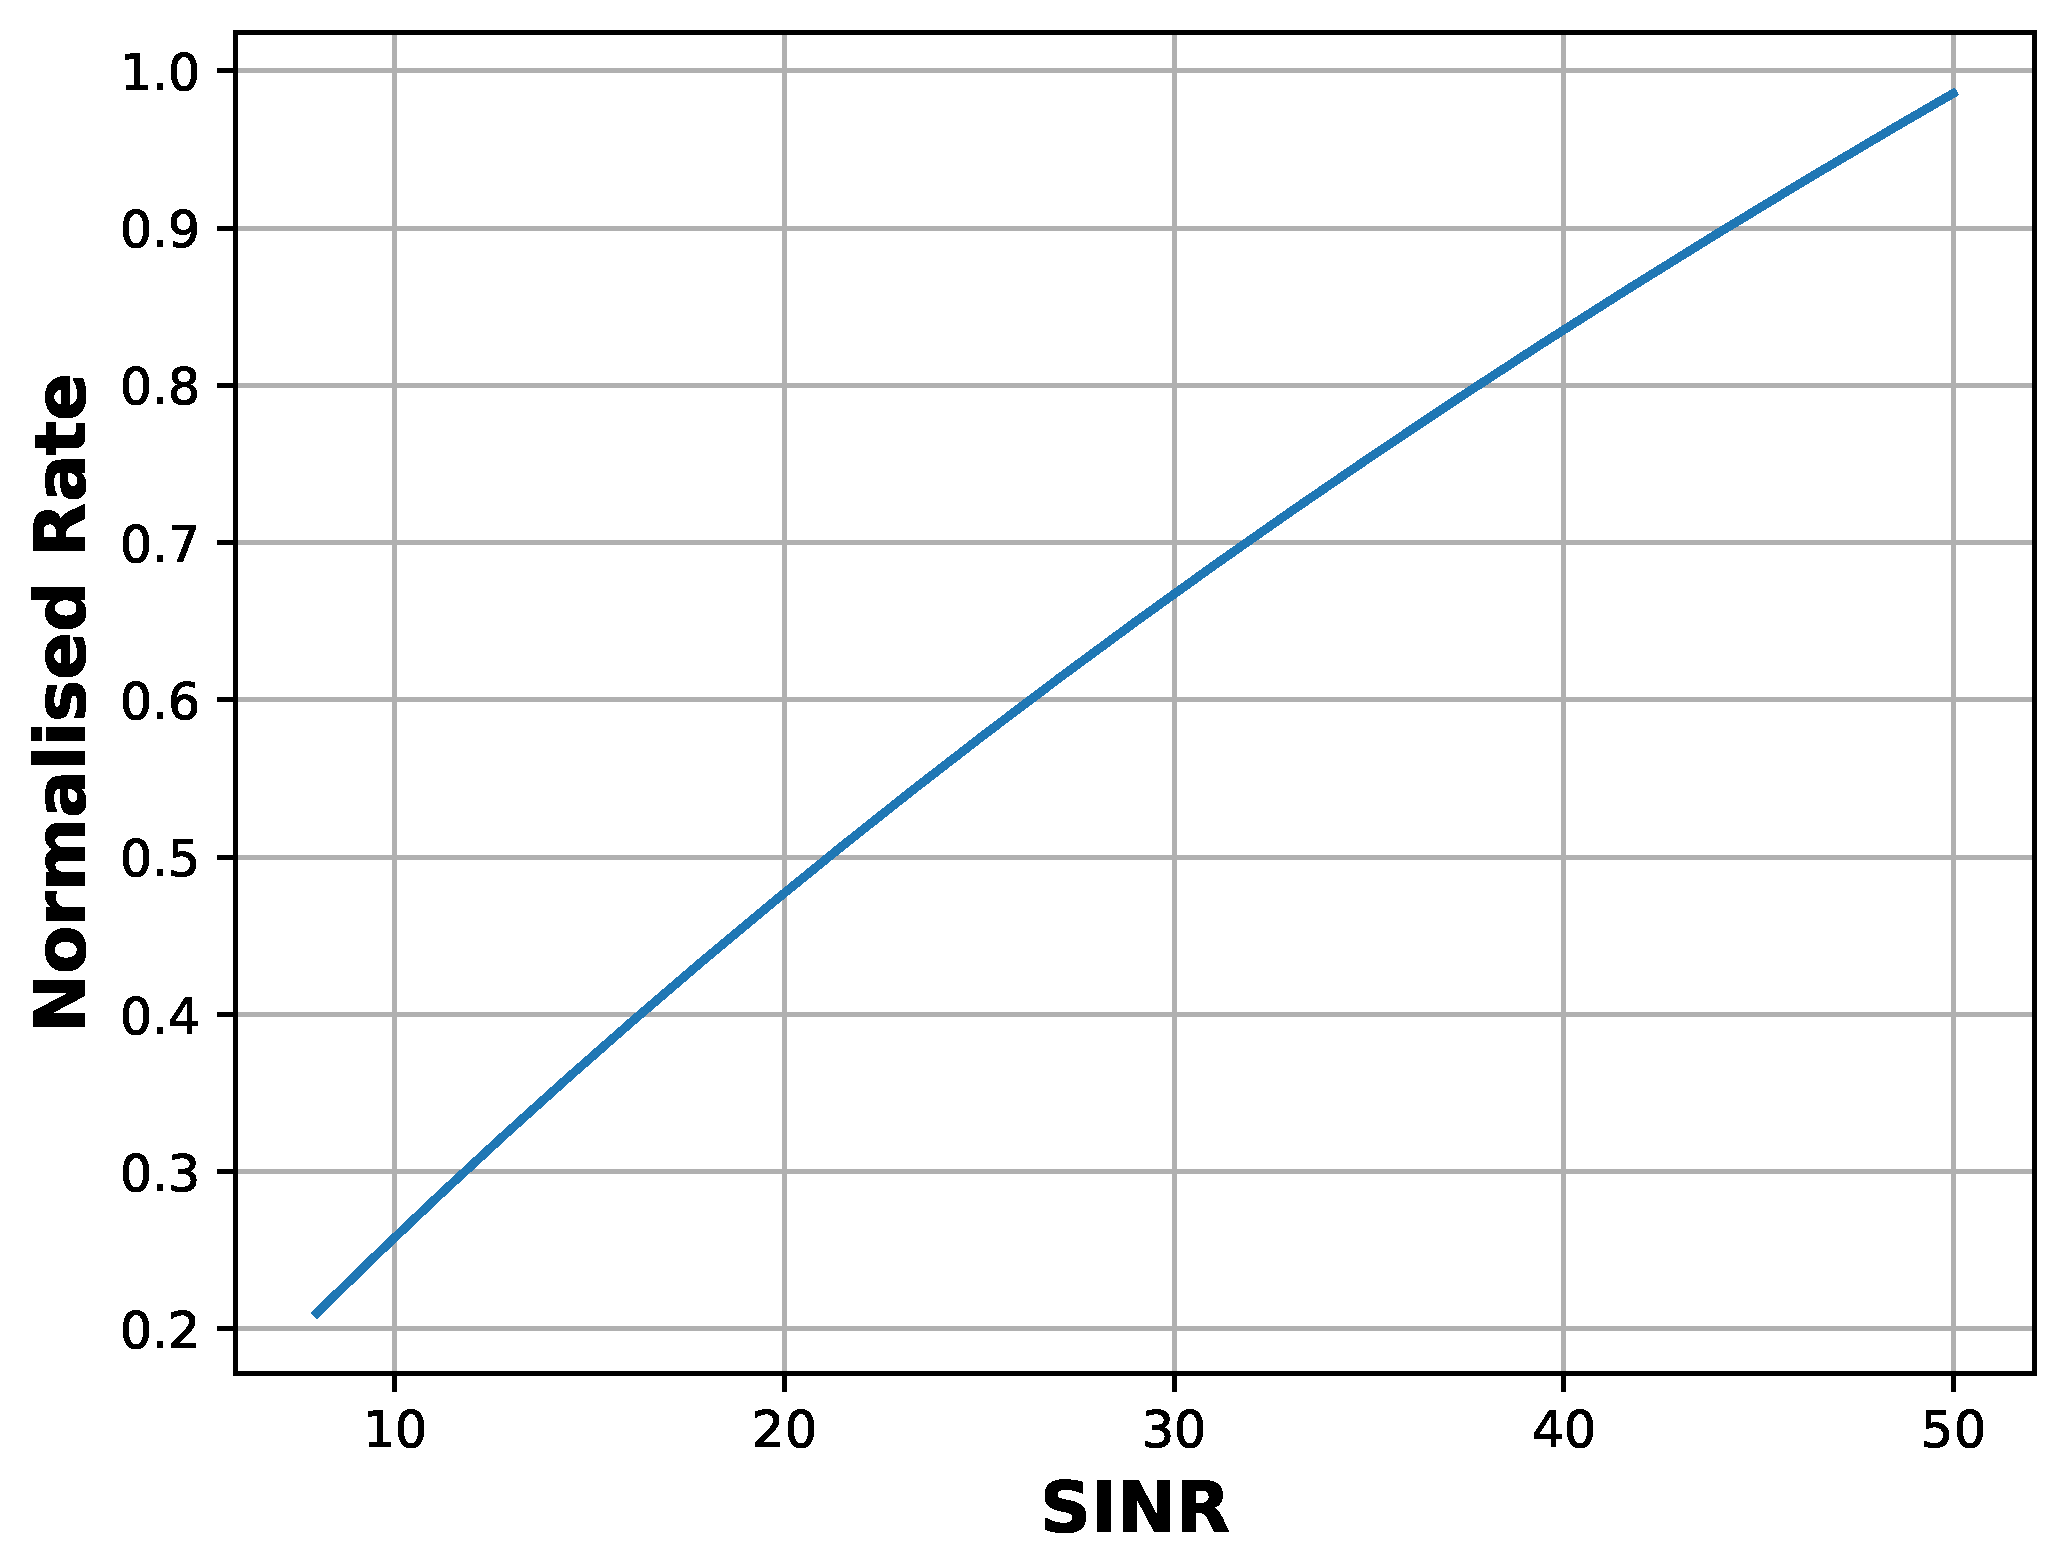
In a similar manner, the rate increases with the increase in SINR, coming from the transmission power becoming higher, as we can see in Figure 6. Since in this work, we duty cycle vehicles to stabilise or diminish interference, the SINR changes with the change of the transmission power. The reader can see that in Equation (2), whereby the denominator remains the same and the nominator increases.
In terms of packets lost, we take the case where there is one interferer in the communication of two vehicles. For one second, we need a maximum of 20 time slots and a minimum of 10 slots (if the vehicles are in a sparse place whereby the packets simultaneously go through) for the packets to be successfully transmitted for the interferer and the sender in one second. If we do not apply duty cycling and have a simultaneous transmission and allow three re-transmissions per packet, we can have a maximum of 60 transmission slots for this case and a minimum of 10 time slots, if the message will go through with one re-transmission. The reader can see the results of this case in Table 1.
For different values of delay, the times of packets’ transmission can be given in Table 1 as well. As it can be seen, the number of seconds delay for the duty-cycled approach is a minimum of 0.5 s delay and maximum 1 s delay on top of the programmed transmission. For the not duty-cycled approach, we see a delay of minimum 0.5 s and maximum of 3 s on top of the transmission.
From the second constraint in (5), it can be derived that the increase of the delay provides a smaller value of the rate. Moreover, the transmission power increases the rate as well, as we can see from Shannon’s formula; however, a large transmission power by a vehicle can increase interference to other vehicles, thus increasing the delay in the case that we allow the re-transmission of packets. With our work, the duty cycling mechanism will not mimic re-transmission, albeit it is similar. The difference is that we duty cycle the nodes to stabilise or diminish interference and not re-send the same packet a number of times.
Since the potential function is essentially the sum of the sigmoidal functions when using Equation (1) (utility functions, there exists an algorithm to solve this optimisation problem, namely the branch and bound method, which is described in [26]).
We further altered the SINR coming from the transmission power to exceed the value 9.0, which we consider a threshold that can ensure a high PRR. This alteration gives us another property as to make the utility function strictly concave. This will ensure that a local maximum of the function is a global maximum as well. We can see the dashed line which separates the utility function into two parts in Figure 5. The PRR in this setting is 1.0 when the constraints are satisfied and the rate increases, as we can see in Figure 6. Note that the constraint has been set to the normalised value of the rate when the delay is 0.05 s.
The natural question that arises is that the delay will increase with the duty cycling of the vehicles. This can be also the case with the CSMA, since there will be a backoff for the attempt of a new transmission. One of the main problems of the IEEE 802.11p protocol is its functionality in dense environments [27]. Moreover, using proximity sensors, the vehicles may instruct the passing or coming behind vehicles to transmit using a beacon. The beacon will include the unique ID of the vehicle and notify that one will transmit, further limiting the interference. For our scenario, the delay of transmission will be 0.04 s. For our future work, we will investigate a denser scenario.
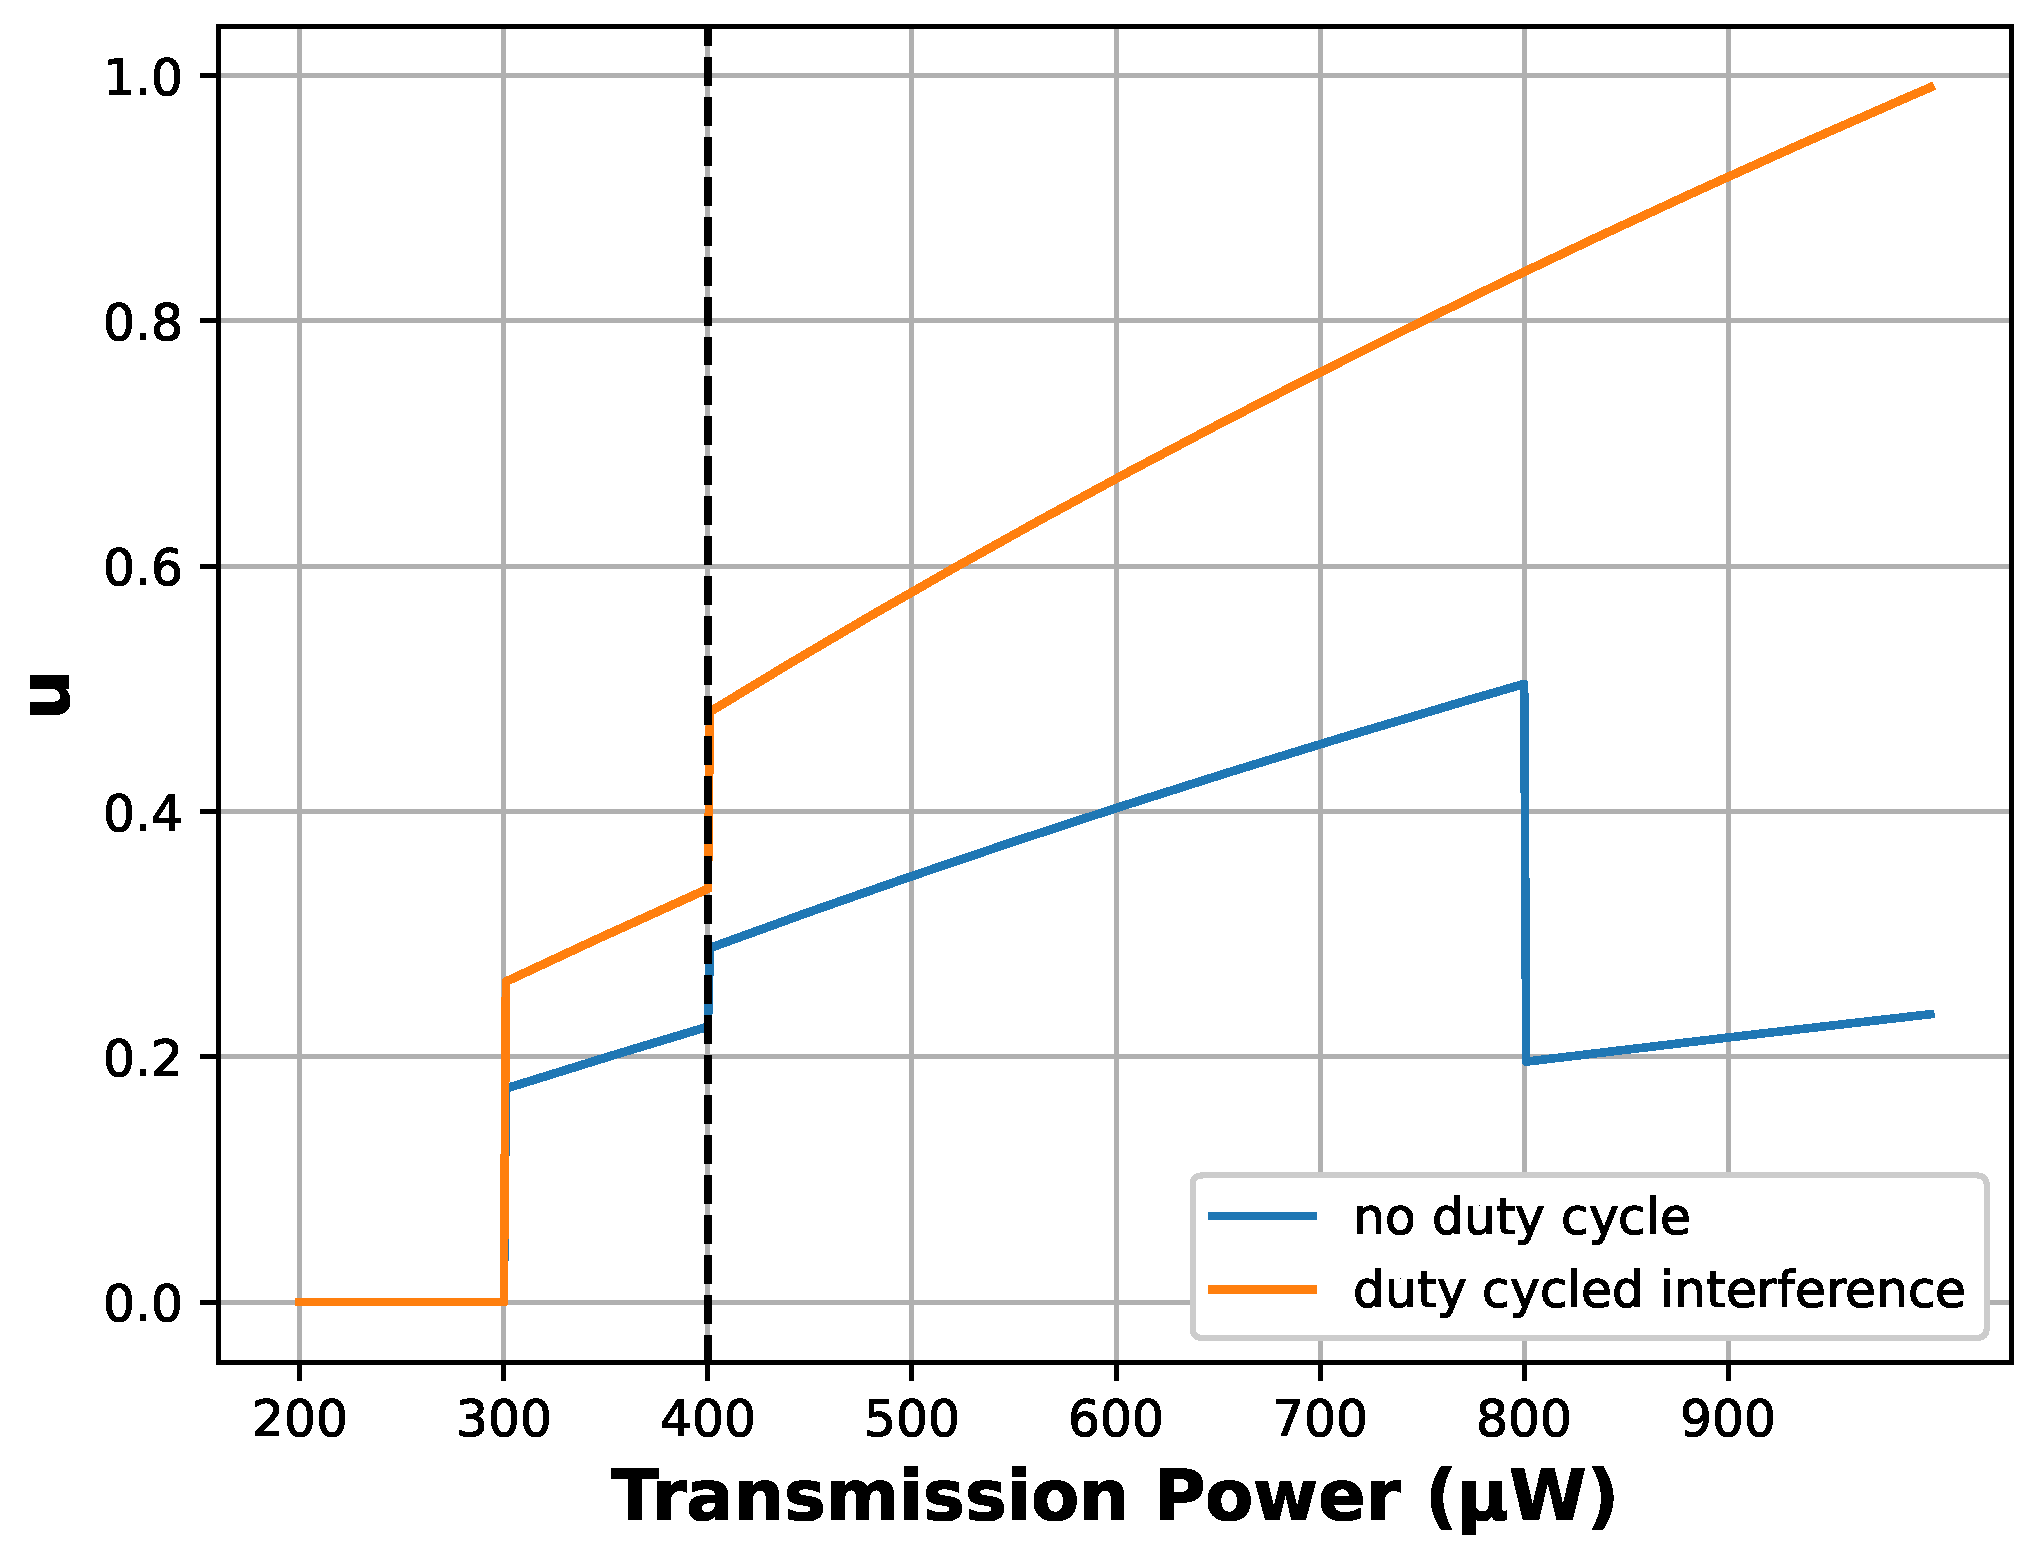
Moreover, the utility function u was plotted against the transmission power levels in W in Figure 7. The purpose of this experiment is to indicate the difference with the duty-cycled and not duty-cycled case. As the reader can see in Figure 7, there are two cases: the one being with duty-cycled vehicles and the other without the duty-cycled mechanism. The interference in this example is initially set to 300 W. In the duty-cycled case, the interference remains stable throughout the experiment, and the PRR goes from 0 to 0.9 and then to 1.0. On the other hand, in the not duty-cycled case, there is an increase in interference reaching 500 W at the 800 W transmission power utilised. Moreover, since we experience packet loss from interference, the PRR goes from 0 to 0.6, and then it falls to 0.35.
In Figure 7, the sudden utility increase is to show the difference between duty-cycled interference and non-duty-cycled interference. The yellow line of the plot shows that the PRR goes to 1 with the duty-cycled mechanism enabled, since after the reception threshold is surpassed, the PRR becomes 1 and the SINR keeps increasing with respect to the transmission power, and the utility goes to 1 from the rate part of the utility function Again, a packet is lost, which is potentially due to coverage. The blue line shows a different behaviour, since the duty-cycled mechanism is not enabled. Hence, the PRR does not move to 1, and according to an increase of interference or the existence of collisions, the PRR drops suddenly. The 300 W interference causes the drop in the other case.
4.3. Discussion
In this paper, we have introduced a utility function as the product of the rate and the PRR, which depend on the transmission power. This is essentially different from [17], where a bits/joule approach is employed for the description of the utility function. In our case, we exploit the different PRR descriptions on the PHY or MAC layer, Equations (1) and (17), depending on the SINR range. Thus, for SINR between 0 and 8, (17) performs better by maximizing the utility function.
The equilibrium that is best in our paper is when the rate and PRR is maximum, using the maximum transmission power due to duty cycling, which diminishes or stabilises interference. On the other hand, the maximum transmission power of the work of Meshkati et al. [17] results in an equilibrium which is not the best, since it raises interference between the nodes, which in turn decreases the utility function. Essentially, Meshkati et al. focus on energy-efficient optimisation, which takes into account a thorough interference model. The approach we are proposing optimises the transmission power and the rate with respect to no or stable interference, which we ensure by assigning time slots to each transmission, thus resembling to a Time Division Multiple Access (TDMA) framework. One drawback of this approach is the scalability due to vehicle density, which however may be solved assuming the locality of the vehicles.
In this work, solid mathematical procedures that operate nicely in simulation have been proposed. Several Nash equilibrium properties have been derived for our problem formulation. The utility function has been transformed to concave in order to make it solvable in polynomial time and avoid practical implications such as the time of execution in [17]. However, further tests are required to put into our algorithm to check for run time as well as scalability performance. The main difference is the fact that we use a duty cycling method to allow maximum transmission power utilisation compared to the competitor, which uses a thorough queuing theory model and a different utility function. Note that the best equilibrium of [17] is the one where the transmission power is not the maximum due to interference.
A drawback of this work is that it does not take into account a thorough queuing model to the optimisation. Taking into account the delay relationship with the rate and PRR requires a thorough M/G/1 model to be lumped into our optimisation model. Certainly, this work can be extended with such a model, but it is beyond the scope of this paper.
5. Conclusions
In this paper, we addressed the optimisation of power and rate control in IEEE 802.11p or DSRC vehicular networks. The DSRC standard consists of the IEEE 1609.x family and IEEE 802.11p. Specifically, the IEEE 1609 is up the stack from the IEEE 802.11p and handles upper layers from the PHY and MAC without prior information regarding low-layer parameters. The PHY and MAC layers are specified by the IEEE 802.11p for single-channel operations. We can also include multi-channel operations by dividing the access time to two separate channels with the IEEE 1609.4.
Specifically, we constructed a new metric based on the PRR (Equation (17)), which pushes it further down the wireless stack, in particular the physical layer. We show that by using QoS constraints, the PRR and rate at maximum constitute the best case equilibrium. An optimisation problem as a potential game has been formulated, and significant Nash equilibrium properties have been presented. It is shown that for the lower SINR, values coming from the transmission power values are excluded, the utility function is concave, and otherwise, it is sigmoidal. It has been noted that the data rate increases with the SINR when the transmission power is maximised, which is the best case equilibrium of our approach. A description of the differences between our approach and the conventional one [17] has been provided.
For future research, we aim to re-formulate our problem to include energy efficiency as well, since this will definitely change the best case equilibrium and the whole optimisation process. Intuitively, the best case equilibrium will not be the one that uses the maximum transmission power. Furthermore, a comprehensive queuing theory model will be adopted in order to include the delay in this work. Moreover, the ns-3 simulator will be utilised to provide initial simulation experimental results by using the WAVE models. Finally, we aim to check whether our model is suitable for practical implementation as well.
Author Contributions
Conceptualization, E.D.S.; methodology, E.D.S.; software, E.D.S.; validation, E.D.S., E.V. and C.S.; formal analysis, E.D.S. and E.V.; investigation, E.D.S.; resources, E.D.S. and E.V.; data curation, E.D.S.; writing—original draft preparation, E.D.S. and E.V.; writing—review and editing, E.D.S., E.V. and C.S.; visualization, E.D.S.; supervision, C.S.; project administration, C.S.; funding acquisition, C.S. All authors have read and agreed to the published version of the manuscript.
Funding
This research received no external funding.
Data Availability Statement
Please contact Dr Evangelos D. Spyrou for issues involving the data replication, [email protected].
Acknowledgments
This research work is co-funded by the project “Immersive Virtual, Augmented and Mixed Reality Center of Epirus” (MIS 5047221) implemented under the Action “Reinforcement of the Research and Innovation Infrastructure”, funded by the Operational Programme “Competitiveness, Entrepreneurship and Innovation” (NSRF 2014-2020) and co-financed by Greece and the European Union (European Regional Development Fund).
Conflicts of Interest
The authors declare no conflict of interest.
References
- Jiang, D.; Delgrossi, L. IEEE 802.11p: Towards an international standard for wireless access in vehicular environments. In Proceedings of the VTC Spring 2008—IEEE Vehicular Technology Conference, Marina Bay, Singapore, 11–14 May 2008; pp. 2036–2040. [Google Scholar]
- IEEE Std 1609.4-2010; Draft Standard for Wireless Access in Vehicular Environments (WAVE)-Multi-Channel Operation. IEEE Standards Association: Piscataway, NJ, USA, 2010.
- Von Neumann, J.; Morgenstern, O. Theory of Games and Economic Behavior; Princeton University Press: Princeton, NJ, USA, 2007. [Google Scholar]
- Daskalakis, C.; Goldberg, P.W.; Papadimitriou, C.H. The complexity of computing a Nash equilibrium. SIAM J. Comput. 2009, 39, 195–259. [Google Scholar] [CrossRef]
- Papadimitriou, C.H. On the complexity of the parity argument and other inefficient proofs of existence. J. Comput. Syst. Sci. 1994, 48, 498–532. [Google Scholar] [CrossRef] [Green Version]
- Monderer, D.; Shapley, L.S. Potential games. Games Econ. Behav. 1996, 14, 124–143. [Google Scholar] [CrossRef]
- Sun, Z.; Liu, Y.; Wang, J.; Li, G.; Anil, C.; Li, K.; Guo, X.; Sun, G.; Tian, D.; Cao, D. Applications of Game Theory in Vehicular Networks: A Survey. IEEE Commun. Surv. Tutor. 2021, 23, 2660–2710. [Google Scholar] [CrossRef]
- Moura, J.; Hutchison, D. Game Theory for Multi-Access Edge Computing: Survey, Use Cases, and Future Trends. IEEE Commun. Surv. Tutor. 2019, 21, 260–288. [Google Scholar] [CrossRef] [Green Version]
- Mkiramweni, M.E.; Yang, C.; Li, J.; Zhang, W. A Survey of Game Theory in Unmanned Aerial Vehicles Communications. IEEE Commun. Surv. Tutor. 2019, 21, 3386–3416. [Google Scholar] [CrossRef]
- Chen, C.; Hu, J.; Zhang, J.; Sun, C.; Zhao, L.; Ren, Z. Information Congestion Control on Intersections in VANETs: A Bargaining Game Approach. In Proceedings of the 2016 IEEE 83rd Vehicular Technology Conference (VTC Spring), Nanjing, China, 15–18 May 2016; pp. 1–5. [Google Scholar] [CrossRef]
- Tielert, T.; Jiang, D.; Hartenstein, H.; Delgrossi, L. Joint power/rate congestion control optimizing packet reception in vehicle safety communications. In Proceedings of the Tenth ACM International Workshop on Vehicular Inter-Networking, Systems, and Applications, Taipei, Taiwan, 25 June 2013; pp. 51–60. [Google Scholar]
- Aygun, B.; Boban, M.; Wyglinski, A.M. ECPR: Environment-and context-aware combined power and rate distributed congestion control for vehicular communications. Comput. Commun. 2016, 93, 3–16. [Google Scholar] [CrossRef] [Green Version]
- Zemouri, S.; Djahel, S.; Murphy, J. Smart adaptation of beacons transmission rate and power for enhanced vehicular awareness in vanets. In Proceedings of the 17th International IEEE Conference on Intelligent Transportation Systems (ITSC), Qingdao, China, 8–11 October 2014; pp. 739–746. [Google Scholar]
- Jose, J.; Li, C.; Wu, X.; Ying, L.; Zhu, K. Distributed rate and power control in vehicular networks. arXiv 2015, arXiv:1511.01535. [Google Scholar]
- Huang, C.L.; Fallah, Y.P.; Sengupta, R.; Krishnan, H. Adaptive intervehicle communication control for cooperative safety systems. IEEE Netw. 2010, 24, 6–13. [Google Scholar] [CrossRef]
- Liu, Z.; Xie, Y.a.; Yuan, Y.; Ma, K.; Chan, K.Y.; Guan, X. Robust power control for clustering-based vehicle-to-vehicle communication. IEEE Syst. J. 2019, 14, 2557–2568. [Google Scholar] [CrossRef]
- Meshkati, F.; Poor, H.V.; Schwartz, S.C.; Balan, R.V. Energy-efficient power and rate control with QoS constraints: A game-theoretic approach. In Proceedings of the 2006 International Conference on Wireless Communications and Mobile Computing, Vancouver, BC, Canada, 3–6 July 2006; pp. 1435–1440. [Google Scholar]
- Spyrou, E.D.; Mitrakos, D. On the Potential Game of Packet Reception Ratio Utility Functions in Wireless Sensor Networks. In Proceedings of the 2021 29th Mediterranean Conference on Control and Automation (MED), Puglia, Italy, 22–25 June 2021; pp. 880–885. [Google Scholar]
- Jayasuriya, A.; Perreau, S.; Dadej, A.; Gordon, S. Hidden vs. Exposed Terminal Problem in ad hoc Networks. In Proceedings of the Australian Telecommunication Networks and Applications Conference, Sydney, Australia, 8–10 December 2004. [Google Scholar]
- Watanabe, Y.; Sato, K.; Fujii, T. Poster: A scheduling method for V2V networks using successive interference cancellation. In Proceedings of the 2016 IEEE Vehicular Networking Conference (VNC), Columbus, OH, USA, 8–10 December 2016; pp. 1–2. [Google Scholar]
- Moscibroda, T.; Wattenhofer, R.; Weber, Y. Protocol design beyond graph-based models. In Proceedings of the ACM Workshop on Hot Topics in Networks (HotNets-V), Irvine, CA, USA, 29–30 November 2006; pp. 25–30. [Google Scholar]
- Gabteni, H.; Hilt, B.; Drouhin, F.; Ledy, J.; Basset, M.; Lorenz, P. A novel predictive link state indicator for ad-hoc networks. In Proceedings of the 2014 IEEE Global Communications Conference, Austin, TX, USA, 8–12 December 2014; pp. 149–154. [Google Scholar]
- Spuhler, M.; Lenders, V.; Giustiniano, D. BLITZ: Wireless link quality estimation in the dark. In Proceedings of the European Conference on Wireless Sensor Networks (EWSN 2013), Ghent, Belgium, 13–15 February 2013; Springer: Berlin/Heidelberg, Germany, 2013; pp. 99–114. [Google Scholar]
- Heinzer, P.; Lenders, V.; Legendre, F. Fast and accurate packet delivery estimation based on DSSS chip errors. In Proceedings of the 2012 IEEE INFOCOM, Orlando, FL, USA, 25–30 March 2012; pp. 2916–2920. [Google Scholar]
- Ledy, J.; Drouhin, F.; Daniel, J.; Basset, M.; Hilt, B.; Gabteni, H.; Lorenz, P. Data fusion for a forecasting link state indicator in vanets. In Proceedings of the 2016 IEEE Global Communications Conference (GLOBECOM), Washington, DC, USA, 4–8 December 2016; pp. 1–6. [Google Scholar]
- Udell, M.; Boyd, S. Maximizing a Sum of Sigmoids. Available online: https://web.stanford.edu/~boyd/papers/pdf/max_sum_sigmoids.pdf (accessed on 2 January 2020).
- Abboud, K.; Omar, H.A.; Zhuang, W. Interworking of DSRC and cellular network technologies for V2X communications: A survey. IEEE Trans. Veh. Technol. 2016, 65, 9457–9470. [Google Scholar] [CrossRef]
Figure 1.
VANET Scenario.

Figure 2.
PRR as a function of SINR.

Figure 4.
Messages Received with Duty Cyclin ©2022 IEEE. Reprinted, with permission, from Spyrou, E. D., & Mitrakos, D. (2021, June). On the Potential Game of Packet Reception Ratio Utility Functions in Wireless Sensor Networks. In 2021 29th Mediterranean Conference on Control and Automation (MED) (pp. 880–885). IEEE.

Figure 5.
Utility as a function of SINR .

Figure 6.
Normalised rate with SINR.

Figure 7.
Normalised utility with transmission power.


Table 1.
Number of slots and seconds for duty-cycled and not duty-cycled cases.
| Case | Min Slots | Max Slots | Min Time (s) | Max Time (s) |
|---|---|---|---|---|
| Duty Cycled | 10 | 20 | 0.5 | 1 |
| No Duty Cycle | 10 | 60 | 0.5 | 3 |
Publisher’s Note: MDPI stays neutral with regard to jurisdictional claims in published maps and institutional affiliations. |
© 2022 by the authors. Licensee MDPI, Basel, Switzerland. This article is an open access article distributed under the terms and conditions of the Creative Commons Attribution (CC BY) license (https://creativecommons.org/licenses/by/4.0/).
Share and Cite
MDPI and ACS Style
Spyrou, E.D.; Vlachos, E.; Stylios, C. Game-Theoretic Power and Rate Control in IEEE 802.11p Wireless Networks. Electronics 2022, 11, 1618. https://0-doi-org.brum.beds.ac.uk/10.3390/electronics11101618
AMA Style
Spyrou ED, Vlachos E, Stylios C. Game-Theoretic Power and Rate Control in IEEE 802.11p Wireless Networks. Electronics. 2022; 11(10):1618. https://0-doi-org.brum.beds.ac.uk/10.3390/electronics11101618
Chicago/Turabian StyleSpyrou, Evangelos D., Evangelos Vlachos, and Chrysostomos Stylios. 2022. "Game-Theoretic Power and Rate Control in IEEE 802.11p Wireless Networks" Electronics 11, no. 10: 1618. https://0-doi-org.brum.beds.ac.uk/10.3390/electronics11101618
Note that from the first issue of 2016, this journal uses article numbers instead of page numbers. See further details here.