
Improved Cell Search for mmWave Cellular Networks Using Deterministic Scanning Algorithm with Directional Array Antenna

Department of Electrical Engineering and Computer Science, School of Engineering, The Catholic University of America, 620 Michigan Avenue, NE, Washington, DC 20064, USA
*
Author to whom correspondence should be addressed.
Electronics 2017, 6(2), 42; https://0-doi-org.brum.beds.ac.uk/10.3390/electronics6020042
Submission received: 1 March 2017
/
Revised: 10 May 2017
/
Accepted: 15 May 2017
/
Published: 26 May 2017
(This article belongs to the Special Issue Smart Antennas and MIMO Communications)
Abstract
:Millimeter Wave (mmWave) communication is considered as an enabling technology for the next generation of cellular networks because it offers much larger bandwidth and higher data rate than the current lower-frequency cellular systems to satisfy the exponential growth of mobile data demand. High gain directional antennas are needed to overcome high propagation losses in mmWave bands. However, the reliance on highly directional antennas will result in a more complicated initial cell search procedure since both base station and mobile device have to look for each other over a large space to establish the link. This paper focuses on analyzing the performance of the directional cell search procedure where the base stations periodically transmit signals in a set of optimal directional patterns to scan the coverage area. The mobile terminals detect the signals from the base station using the Generalized Likelihood Ratio Test (GLRT). The results show that with an appropriate scanning scheme, the use of directional antennas can outperform their omnidirectional counterparts in terms of signal detection performance as well as total time required.

1. Introduction
With the development of modern mobile devices and increase in user demand for a wide range of applications such as education, communication, navigation and entertainment; the need for cellular data has grown exponentially, which results in a significant spectrum shortage of current cellular networks. It is estimated that by the year of 2020, 130 exabits ( of cellular data will be required, [1,2,3]. Conventional cellular spectrum below 3 GHz is experiencing severe shortage, and cannot keep up with this exponential traffic growth. Therefore, the need for new technology to provide extensive bandwidth, and thus significantly increase the throughput of cellular networks has brought millimeter wave (mmWave) communications into the context as one of the contenders for the fifth generation (5G) wireless networks. With orders of magnitude more available spectrum in the mmWave band than current cellular allocations, [4], mmWave communications technology has the potential to achieve multiple gigabit-per-second data rates to support a wide range of services such as ultra-high definition video (UHDV) and virtual reality [5,6,7]. However, there are a number of technical challenges for mmWave communications; such as high propagation loss even in free space according to Friis’ law [8]. Reflection and penetration characteristics of common building materials as well as diffraction effects are also factors that greatly impact the propagation of mmWave signals [9]. It was shown in [10] that the penetration loss of 9.6, 28.8 and 57.6 GHz waves increased by 25 dB to 50 dB when the glass surface was metal coated. The research in [10,11] also shows that no signal was detected through brick pillars throughout the mmWave signals, yet signals through a hollow plasterboard wall resulted in a penetration loss ranging between 5.4 dB and 8.1 dB. To overcome these loss mechanisms, higher gain, i.e., directional antennas, are necessary. Since the wavelengths at the mmWave frequencies can be orders of magnitude smaller than the frequency band of the current state of art, and thanks to the advances in materials and low-power CMOS RF circuitry, it is possible to pack a large number of antenna elements in compact transceiver systems [12,13,14,15,16,17,18]. Therefore, it is feasible to integrate highly directional antennas in base station (BS) and user equipment (UE) systems to enhance the quality of mmWave communications.
While the use of highly directional antennas in mmWave cellular networks addresses the loss issues, another challenge emerges due to the complication of the initial cell search procedure [19,20], i.e., a mobile device needs to discover an available base station and establish initial communications. Although current cellular networks such as 3GPP LTE/4G have been using beamforming techniques to enhance the quality of communication links, they are still based on using omnidirectional transmissions or transmissions with fixed antenna patterns for the initial cell search process [20,21]. This is not the case in mmWave cellular networks because it is essential to use high gain antennas for propagation loss compensation. Although the use of omnidirectional antennas simplifies the cell search problem, they may default to establishing connection only with the closest UEs even though communications may be feasible with other UEs that may reside further away using a high-gain directional antenna. Such UEs cannot be detected by the omni-directional antenna.
The initial cell search problem was recently investigated in [21], where the authors established a Generalized Likelihood Ratio Test (GLRT) at the mmWave receiver to assess the performance of signal detection. Although the idea of using GLRT for signal detection is not new for traditional cellular networks, it is novel in [21] that the authors applied the concept of GLRT in a mmWave network where directional array at BS was used to scan for the coverage region at random directions in time. The authors in [21] showed that omnidirectional transmissions from the BS generally have better performance than random directional scanning over a given scan time. In [22,23,24], the authors proposed and analyzed the performance of the initial access problem using an exhaustive method (the BS performs a brute-force sequential beam searching) and an iterative method (minimize the region of interest in the first stage and focus only on this region in the second stage). It was shown in these works that each method has its own advantages and drawbacks. While iterative techniques require a shorter search time, they may present higher misdetection rates. When a multipath channel is considered in a dense, urban environment, the exhaustive approach is more preferable since it offers lower misdetection rates.
This paper further investigates the initial cell search problem based on the iterative search method proposed in [21] to see whether we can exploit directional transmissions with a carefully designed scanning pattern, instead of random scanning, to enhance the cell search process. We show that for a given coverage area, it is possible to design a scanning procedure for the BS using a set of directional antenna patterns so that the misdetection rate is significantly reduced compared to omnidirectional transmissions or random scanning. It should be noted that the previous work in [22,23,24] is implemented only in angular spaces, which simplified the beamforming procedure. In this paper, we consider the 3D transmission scheme where beamforming of BS and UE are created based on both azimuth and elevation angles. Furthermore, to maximize the performance of the search process, we propose the use of an adaptive array antenna to reduce the total scanning time while keeping the coverage capability the same and misdetection rate low. We believe that our transmission scheme is comprehensive; therefore, it can be applied to practical problems. The mobile terminals are assumed to detect the signals from the base station based on a GLRT detector, which will be discussed in detail in Section 3. Furthermore, we consider the 28 GHz band, which is also referred to as the Local Multipoint Distribution Service (LMDS) band in the USA, and operates under FCC Part 101 rules for Fixed Microwave Services [25]. Compared with other bands, the signals at 28 GHz band suffer from lower rain attenuation (0.18–0.9 dB/200 m) and oxygen absorption (0.04 dB/200 m) [26].
The remainder of the paper is organized as follows. Section 2 introduces the fundamentals of the initial cell search problem in traditional cellular networks, and our proposed framework. Section 3 presents the formulations for GLRT detection. Section 4 applies the GLRT detector to analyze the performance of the cell search procedure with omnidirectional antenna at BS. Section 5 describes the proposed scanning scheme, and evaluates its performance under line-of-sight (LOS) channels assumption. Section 6 discusses the applicability of the proposed algorithm to non-line-of-sight (NLOS) channels assumption. Section 7 presents conclusions of the paper.
2. Initial Cell Search Procedure
Cell search is the procedure where the mobile devices; i.e., user equipment (UE), search for a BS to establish an initial connection or initiate potential handover. The cell search procedure enables the UEs to obtain the identity of the BS and estimate the frame timing of the identified cell. Generally, the number of physical layer cell identities is sufficiently large and varies between different generations of cellular networks. For example, 3GPP LTE cellular networks support 510 different cell identities, which are divided into three groups with 170 identities per group [20]. For the cell search procedure, each base station periodically broadcasts Primary Synchronization Signal (PSS) and Secondary Synchronization Signal (SSS). The UE first searches for the presence of the PSS by scanning various frequency bands over the interested region. Detection of PSS signals at the UEs is implemented by performing the matched filtering between the received signal and the referenced PSS signal. If the matched filter output is maximized, the UEs will know the timing of the BS with a high probability. The frequency offset of the BS is also obtained by the UEs based on a frequency locked mechanism. Once the UE detects the PSS signal, the UE can search for the SSS signal. After the PSS and SSS are detected, the UE will be able to obtain the cell identity and proceed to decode the BS broadcast channels for further information about the BS.
2.1. Periodic Synchronization Signal Transmission
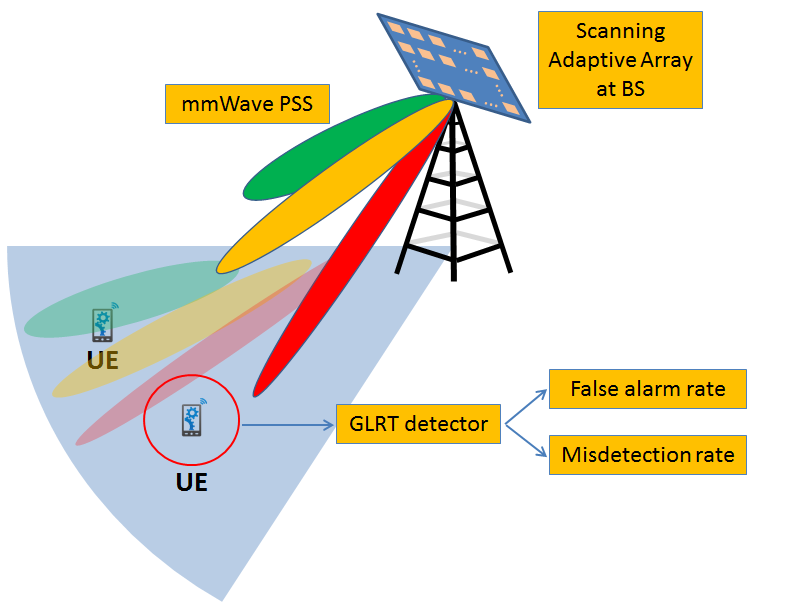
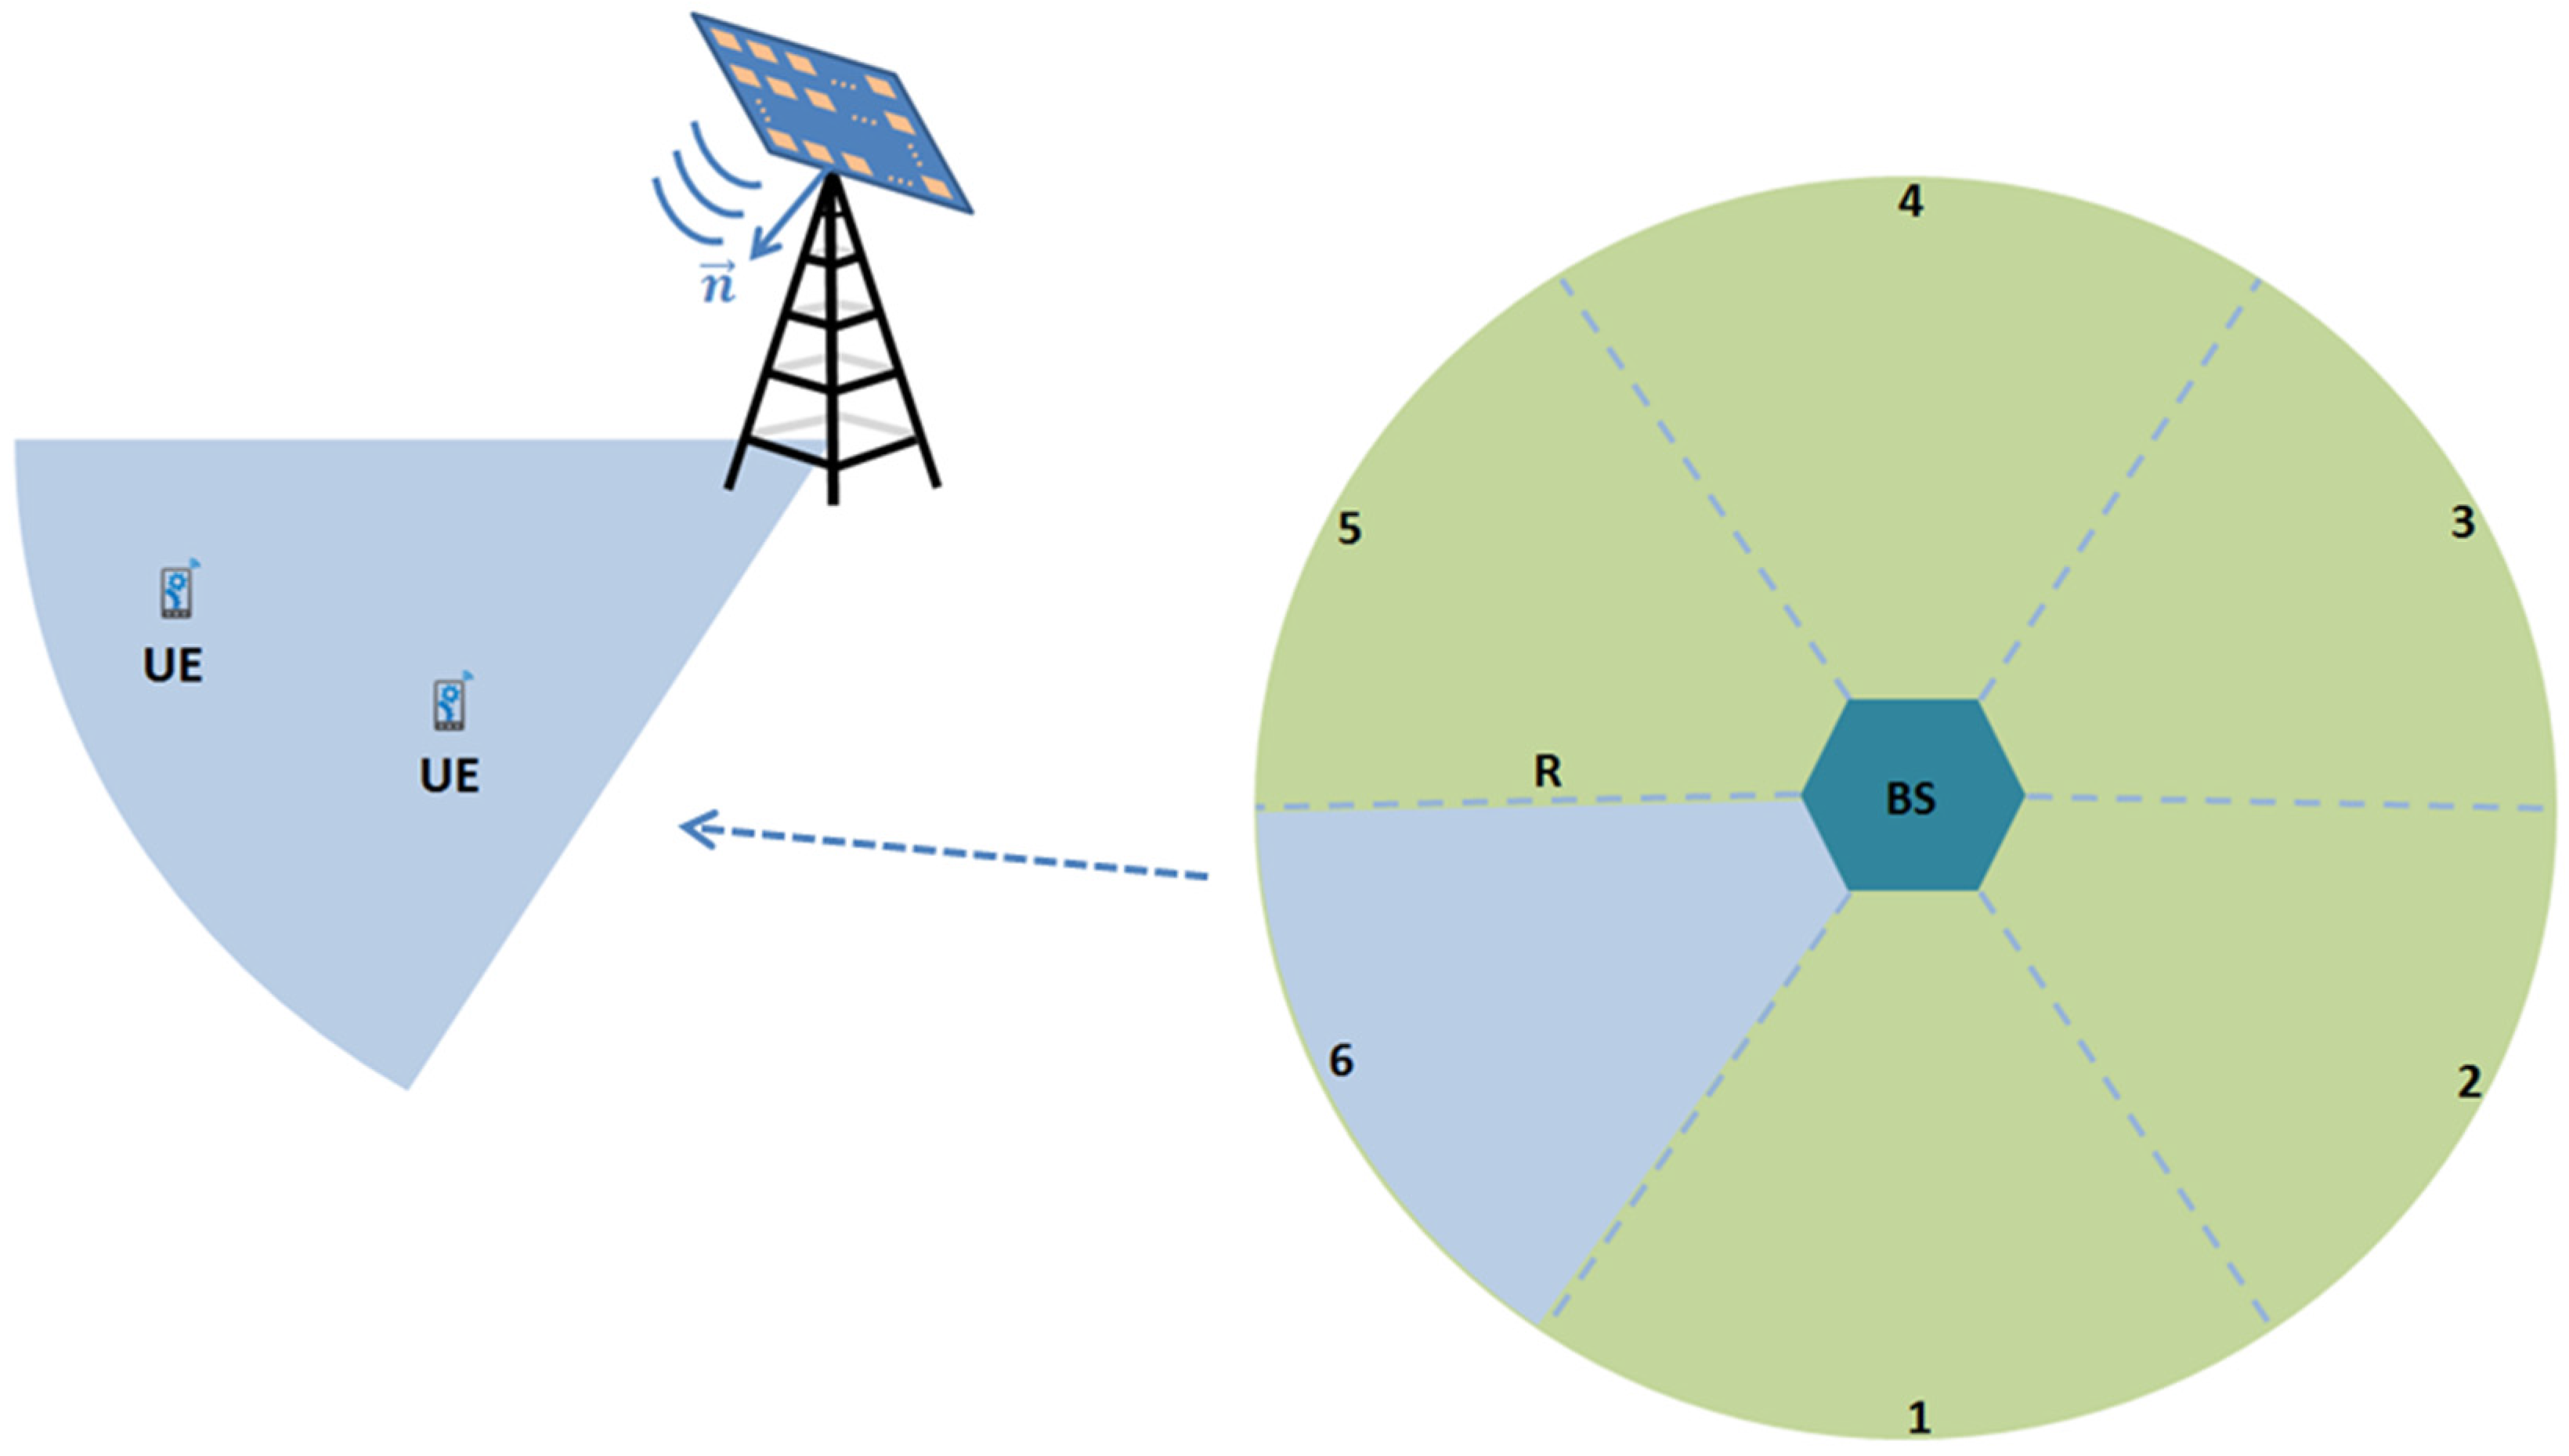
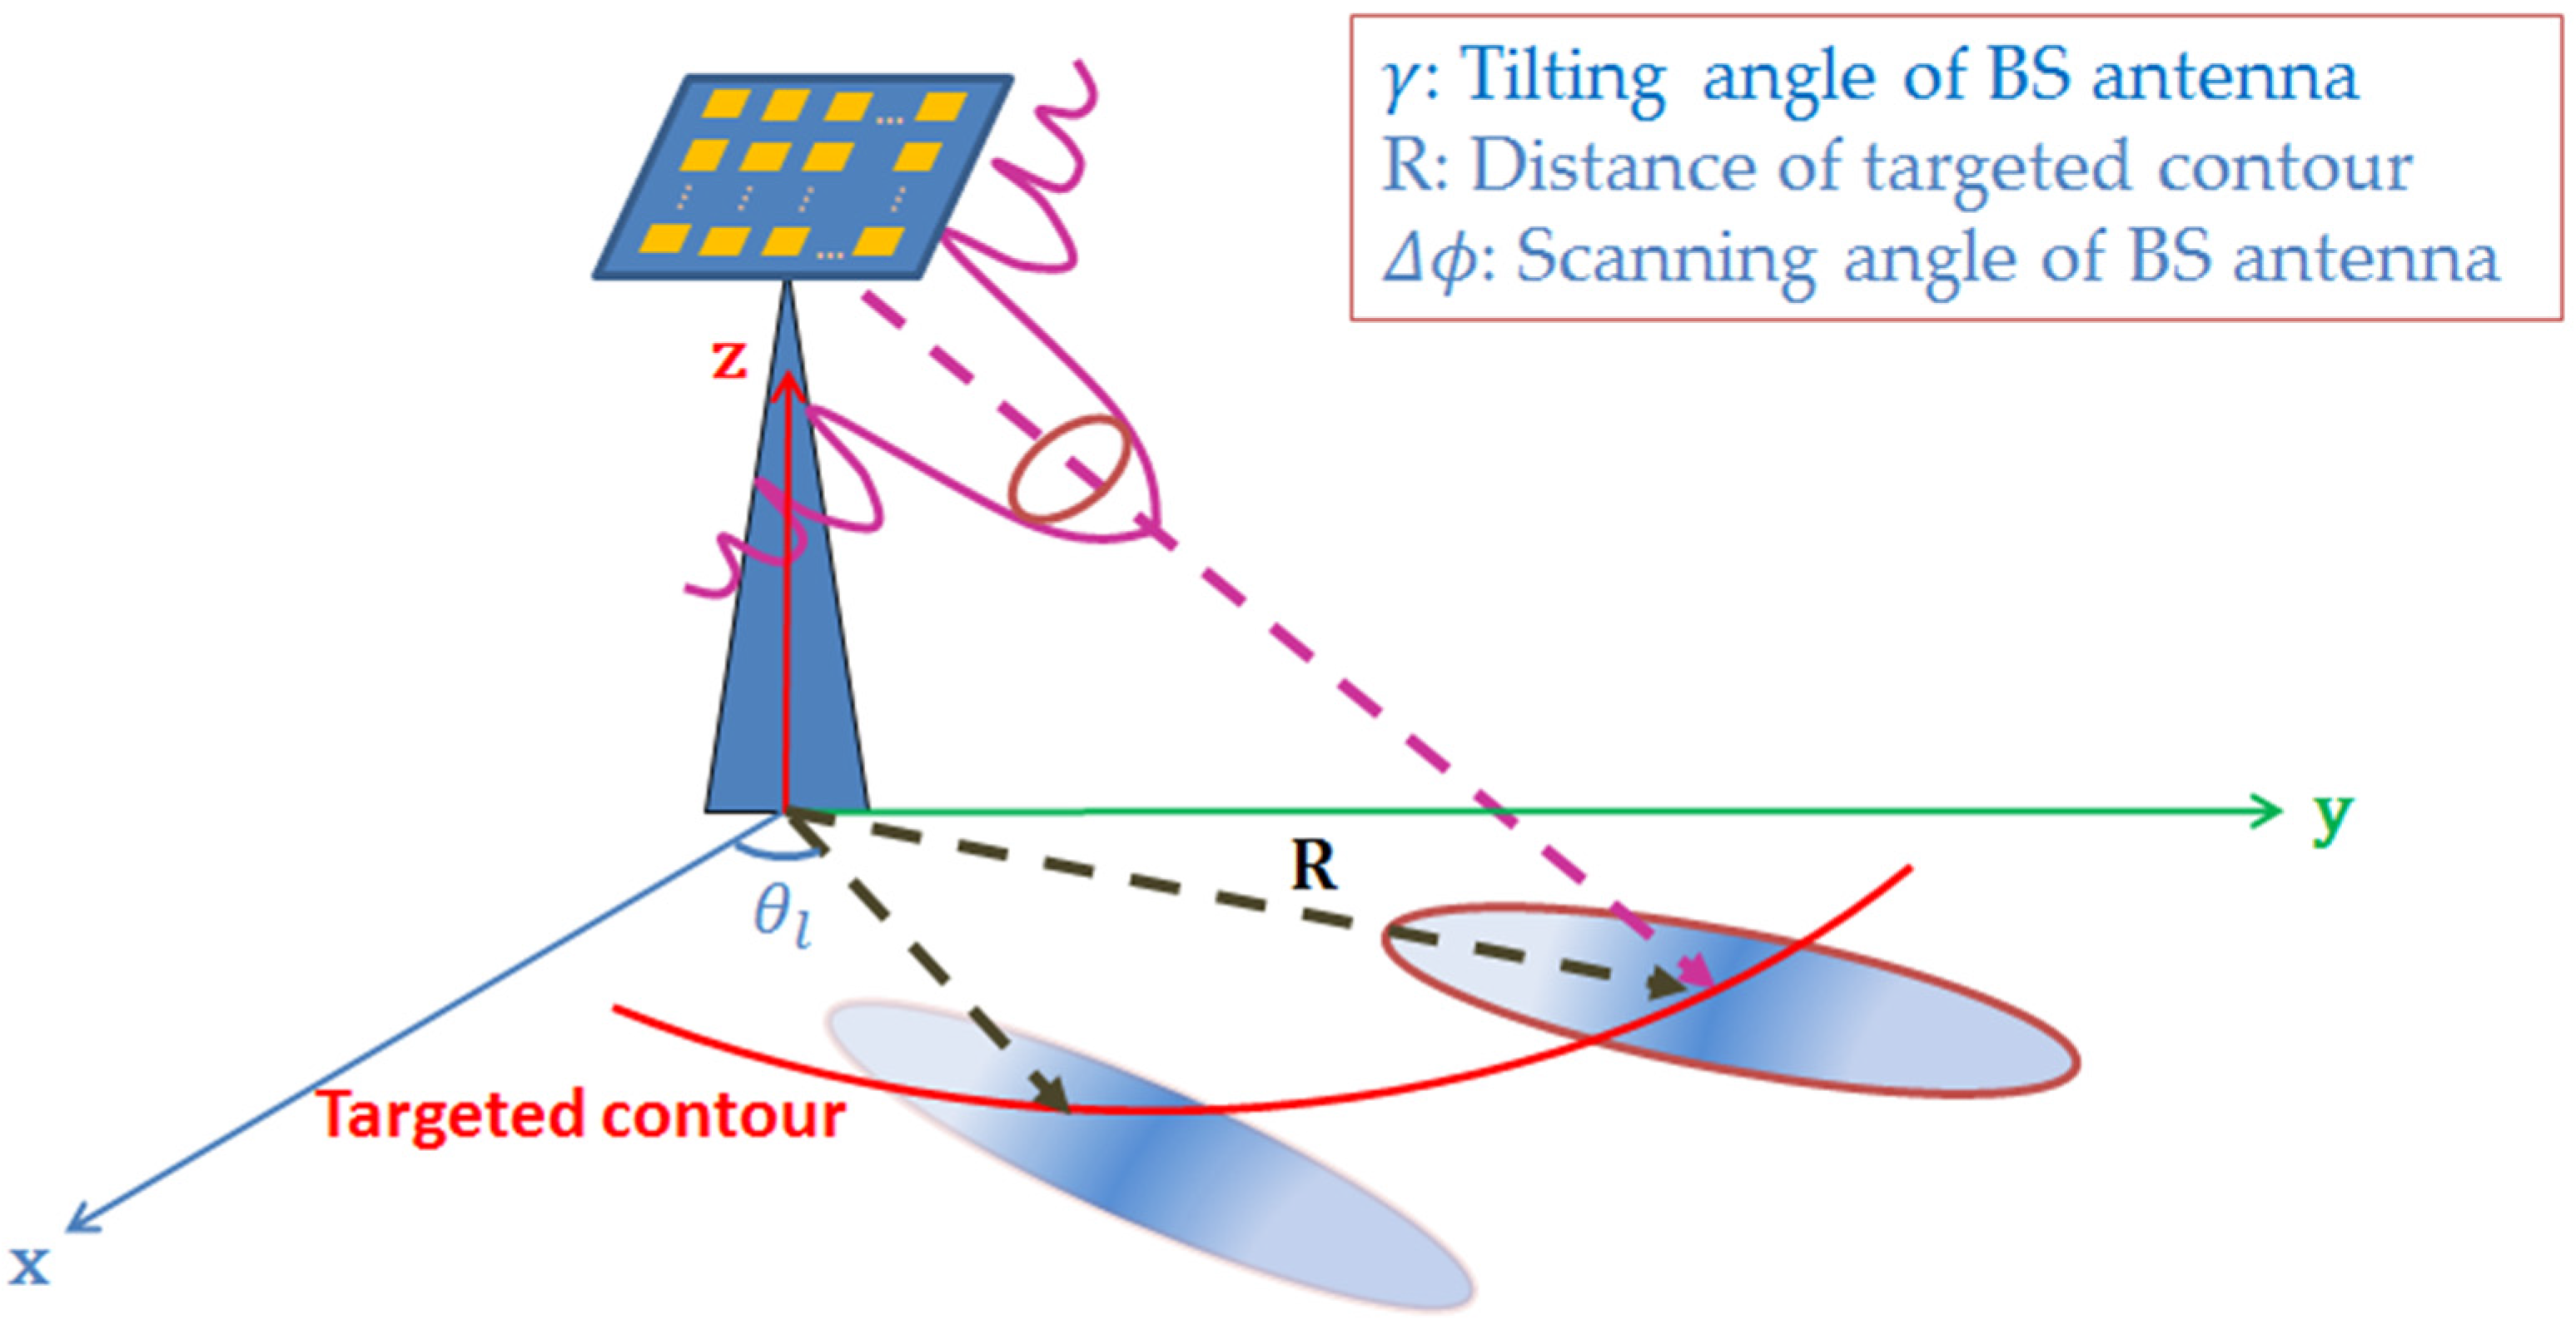
Although the initial cell search problem requires both PSS and SSS signal transmissions, this paper only focuses on the transmission and detection of the PSS signals from the BS since this is the procedure to initially discover the BS that is significantly affected by the propagation loss characteristics of mmWave signals. In this work, a microcell system including a BS with multiple randomly distributed UEs inside the coverage area of interest is considered, as shown in Figure 1.
The height of the base station is assumed to be 50 m while each UE is placed at 2 m above the ground. The array antenna at the BS consists of multiple planar arrays to enable complete azimuthal coverage, as depicted by the six facets of the hexagon in Figure 1. The maximum coverage area is defined by a radius R = 600 m with BS at its center. Although it was shown in the real-world measurements in [4,9,27] that the receivers are usually in outage when they are deployed at more than 200 m, this is due to a number of factors such as cluster blockage, lognormal fading, fast fading that increase the total path loss of the channel. In this paper, we start our investigation with LOS channels with lognormal fading parameters to demonstrate the proof of concept for our proposed search algorithm. In this case, the choice of a coverage region with radius of R = 600 m is reasonable. Later, we will employ the empirical model given in (14) to investigate NLOS media. We demonstrate in the following sections that the searching procedure is dependent on the path loss characteristic of the channel, and the radius of the coverage is determined by the channel loss characteristics. To enable the use of adaptive array antennas at the BS, we assume that the maximum available array size at the BS is 144 elements on a square grid; i.e., 12 × 12 elements with half wavelength spacing. This allows us to exploit smaller portions of the array such as 4 × 4 or 8 × 8 as necessary for broader coverage where less power can be used. It will also be shown later that the use of adaptive array antennas offers many advantages in terms of flexibility and efficiency for cell search procedure. The antenna at each UE is assumed to be 4 × 4 with half wavelength spacing (total of 16 elements).
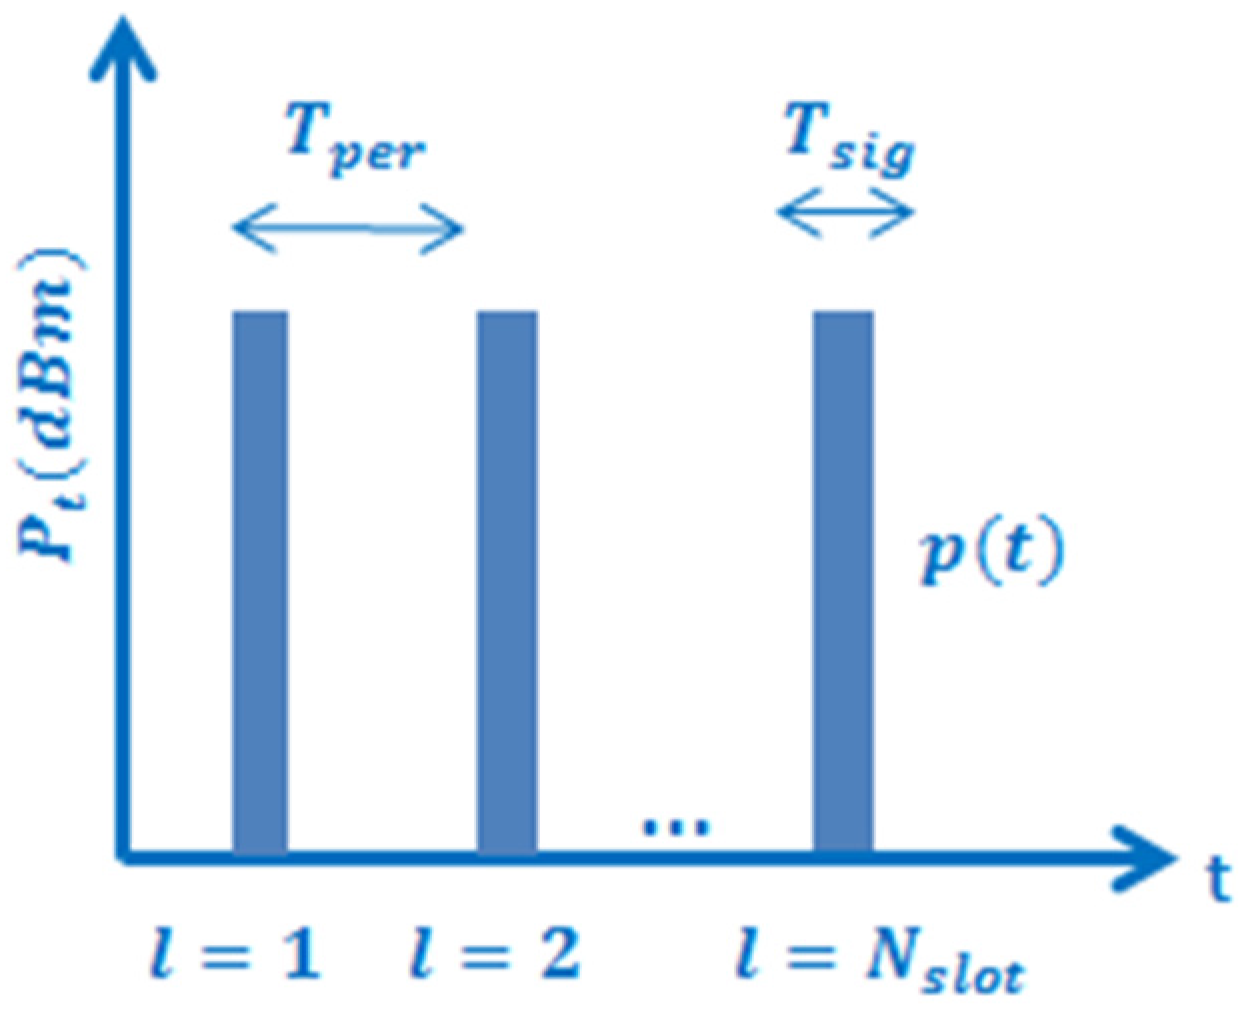
The BS periodically transmits the PSS signals, one every seconds as shown in Figure 2 [21,22]. The duration of the signal is denoted as seconds, which is the length of each time slot. Since the number of slots determines the total time required for the PSS signal detection, minimizing will significantly reduce the total time required for the initial cell search process, that is, the time for a UE in the cell to detect the PSS signal. As mentioned in the Introduction section, the use of directional antennas at BS plays an important role in determining the number of time slots required. Therefore, in this paper, given the microcell structure in Figure 1, our main objective is to determine the optimal search patterns using adaptive array at BS such that the entire area is covered by a minimum number of time slots.
2.2. Received Signal
Given a large array, analog beamformers are easier to implement and integrate with the array antennas compared with their digital counterparts since digital beamformers for large arrays require a high data rate through the analog to digital converter (ADC). Furthermore, digital beamformers usually require higher power consumption for the ADC and processors that perform multiple functions; such as combining signals from antenna elements, signal processing or data packaging in the system, etc. Thus, we consider analog beamforming in this paper, where the BS antenna system generates one beam at a time. The complex received signal at the receiver after the beamforming can then be written as:
where is the time slot index, and , are the gain values of the transmitter (TX) and receiver (RX), respectively. The path loss coefficient of the coverage area is denoted by , is the reference PSS signal waveform at time slot , is the propagation delay of the PSS signal, and is the AWGN with representing the PSD of the noise, which is assumed to be constant in time. Thus, if the TX antenna is omnidirectional, the value of will be constant at each time slot . In this paper, the antenna array is assumed to have isotropic elements, and the array factor is used as the antenna radiation pattern [8]. As a result of this assumption, i.e., that the array factor is the antenna pattern, the mutual coupling between antenna elements, and individual element pattern of array elements, which would not be isotropic in real applications, are neglected in our analysis. The radiation pattern for an N × M element can then be calculated from its array factor formulation as in (2).
where with , λ is the operating wavelength, are the spacing between adjacent elements along x and y axes, denote the scanned position of the main beam, and are the observation angles on the conventional spherical co-ordinate. The gain values of the antennas in (1) when scanned to position are then calculated as
The value of in (1) depends on the channel characteristics. For line-of-sight (LOS) channels, the omnidirectional path loss coefficient is calculated based on the Friis’ transmission principles. For non-line-of-sight channels (NLOS), the “Empirical NYC” model [4,27], which is based on an extensive field measurement procedure in downtown New York city at both 28 GHz and 73 GHz is used in our analysis. Besides the “Empirical NYC” model for NLOS channels, various empirical/theoretical models can be used such as the Walfisch and Bertoni model [28], which includes the effect of buildings on the propagation path, or the prediction model of [29], which obtains NLOS formulas for low-rise or high-rise environments.
3. PSS Signal Detection at UE
As discussed earlier, the detection of the PSS signals is generally performed by applying a matched filter between the received signal and the transmitted PSS waveforms. The maximized value of the matched-filter output determines the delay propagation between the BS and UE. However, it should be noted that this process becomes more difficult as the noise density increases. Therefore, it is necessary to establish a threshold value as a reference for assessing the level of matched-filter output values. The threshold value is also a function of the signal-to-noise ratio (SNR) to make sure that the output levels of the matched filter are realized even under high-density-noise circumstances. With these characteristics, it is appropriate to apply the concept of Generalized Likelihood Ratio Test (GLRT) [30,31] as the detection algorithm at the UEs. The concept of GLRT has been shown in [32,33,34,35,36] for detections of signal embedded in Gaussian noise with unknown covariance matrix. Recently, D. Ciuonzo et al. [37,38,39] investigated the signal detection problem in partially homogeneous disturbance with structured interference. They extended the well-known generalized multivariate analysis of variance to obtain the maximal invariant statistic for the problem and developed several detectors for the hypothesis testing. In this section, we discuss the formulation of the GLRT algorithm, which is categorized as Constant False Alarm detection based on the work in [21,30,31]. We also discuss the calculation of test values that are used to assess the performance of the GLRT detector.
3.1. Detection Algorithm of PSS Signals Using Generalized Likelihood Ratio Test (GLRT)
Using the GLRT, the cell search problem can be stated as a binary hypothesis problem in which we know either or . Specifically, for each delay value τ, corresponds to “no signal detected” at the UEs, hence there is only noise, and is the hypothesis that signals are present at the receiver, where is described in Equation (1). The GLRT is then used to decide between the two hypotheses as,
where is the vector of unknown parameters, is the probability density of the received signal under each hypothesis or and is the threshold value as reference. The problem in (4) can be solved statistically by using the maximum likelihood estimators, in which the values of are estimated to maximize the value of probability density function under each hypothesis. Further details on this method can be found in [31,37,38,39].
By using the matched-filtering method, the likelihood ratio in Equation (4) can be evaluated via a correlation computation. As the details can be found in [21], we only show the important formulas used to calculate the likelihood ratio between the two hypotheses. With the received signal at the UE as shown in Equation (1), let be the normalized correlation of the received signal with the transmitted PSS signal . Then,
The likelihood ratio or test statistics in Equation (4) is then equivalent to the test form.
where is the threshold value, v(τ) is a vector as defined below
and is the total received energy over time slots defined as:
3.2. GLRT Performance
The performance of the GLRT detector is directly related to the test values such as the probability of false alarm (i.e., the signal is deemed present when it is not), probability of detection (i.e., the signal is deemed present when it is), and probability of misdetection (i.e., the signal is deemed absent when it is present). These test values are calculated as follows [30,31]:
where are the probability density functions of the test statistics Ʌ computed in Equation (6) under hypotheses and , respectively. It should be noted that there are no analytical expressions for and because the test statistics Ʌ are calculated numerically based on Equation (6). Therefore, and are estimated numerically based on a large number of Monte Carlo simulations [40]. Since the detection of the PSS signal in the initial cell search is categorized as CFAR detection, the value of will be constant throughout the test and is independent of parameters such as the SNR level or received signal sampling rate. The value of threshold level is then calculated numerically using Equation (9). Since Ʌ depends on the total energy received and matched-filter output, is dependent on the SNR level.
4. Scanning Algorithm Using Omnidirectional Antenna at BS
We first assess the performance of the GLRT detector for the case when an omnidirectional antenna is used at the BS. The parameters used for the PSS signal transmission are specified in Table 1. The value of is chosen similar to that of current cellular networks while is chosen to keep a low total PSS overhead which is slightly higher than the overhead values of current systems (1.5%). The values of false alarm probability used to estimate the threshold level of the GLRT detector are , which are similar to that used in [21]. As will be shown in the next section, the choice of is necessary so that the BS antenna can cover the region of interest without any gaps. If , the BS will likely not be able to cover the region, resulting in instability of the probability of misdetection. On the other hand, is not necessary and leads to a waste of transmitted power and resources.
The SNR of the PSS signal is defined as
where is the received power at the receiver, is the duration of the signal, and is the noise power. It should be noted that the transmitted power for all BS antenna configurations (omni, 4 × 4, 8 × 8, etc.) are kept at the same level; i.e., .
We will initially focus on LOS channels to present different scanning algorithms. For LOS channels, the omnidirectional path loss coefficient is calculated based on the Friis’ transmission principles as in Equation (13). Later on in Section 6, we will investigate the impacts of more realistic scenarios for NLOS channels.
where is the distance between TX and RX, for LOS channels , and the lognormal shadowing with .
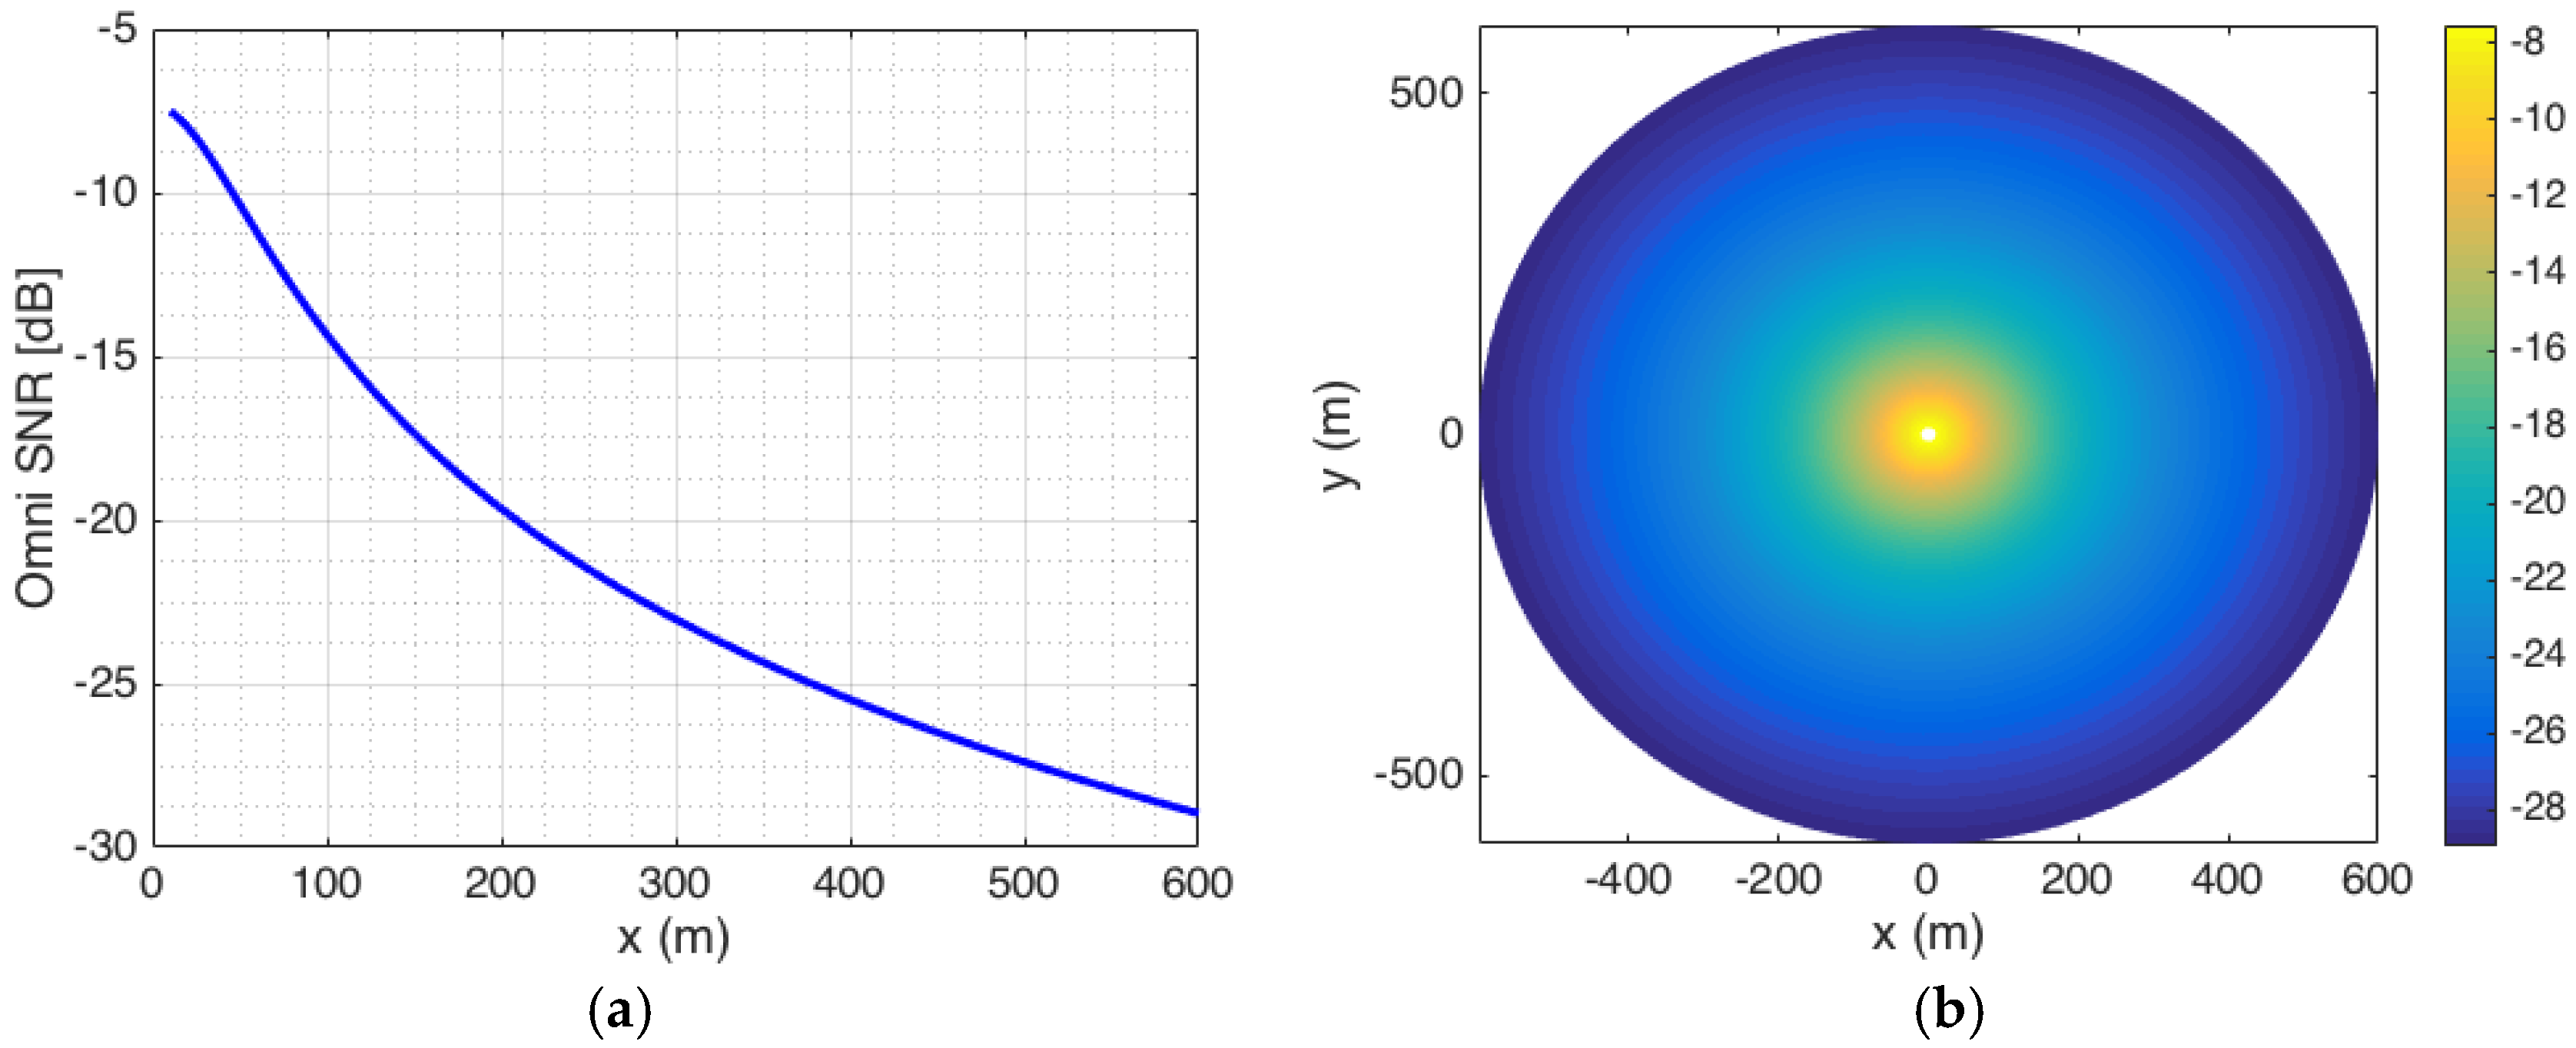
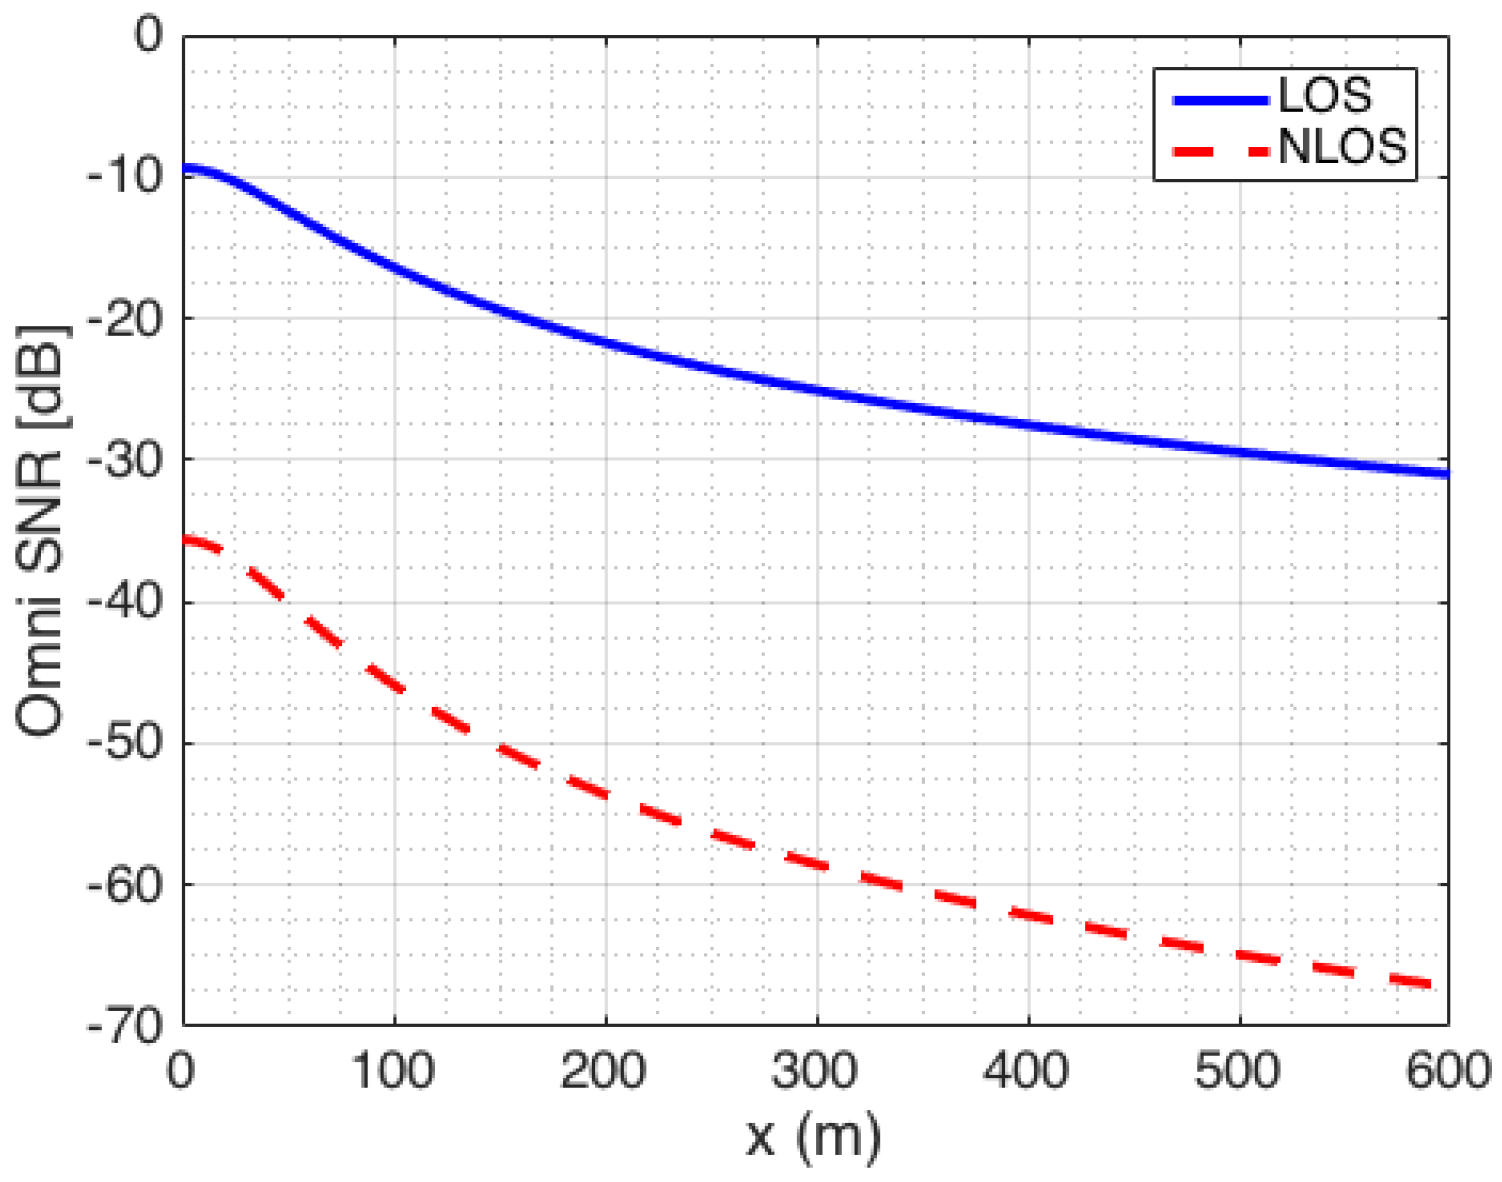
Figure 3 shows the SNR levels for an omnidirectional transmitter as a function of distance between the BS and the UE in a LOS setting. As shown, for omnidirectional TX and 4 × 4 directional RX antennas with a noise power as specified in Table 1, the value of SNR levels at RX is −8 dB when RX is located on radial contours 10 m away from TX, while the value drops to −28 dB as RX is located on radial contours 600 m away from the TX.
To demonstrate the concept, we focus on one facet of the hexagonal BS antenna structure in Figure 1, corresponding to a 60°-segment of cell. The performance for the other cell segments is similar assuming that: (i) the same antenna arrays will be employed in all cell segments, and (ii) channel characteristics are uniform across the coverage area. To assess the GLRT detector at different SNR levels, 46 different 4 × 4 directional UEs are distributed randomly over different radial contours corresponding to different PSS SNR contours. Applying Equations (5)–(11), the misdetection probability of the cell search procedure at each of the 46 distributed UEs with an omnidirectional antenna at BS is calculated as shown in Figure 4.
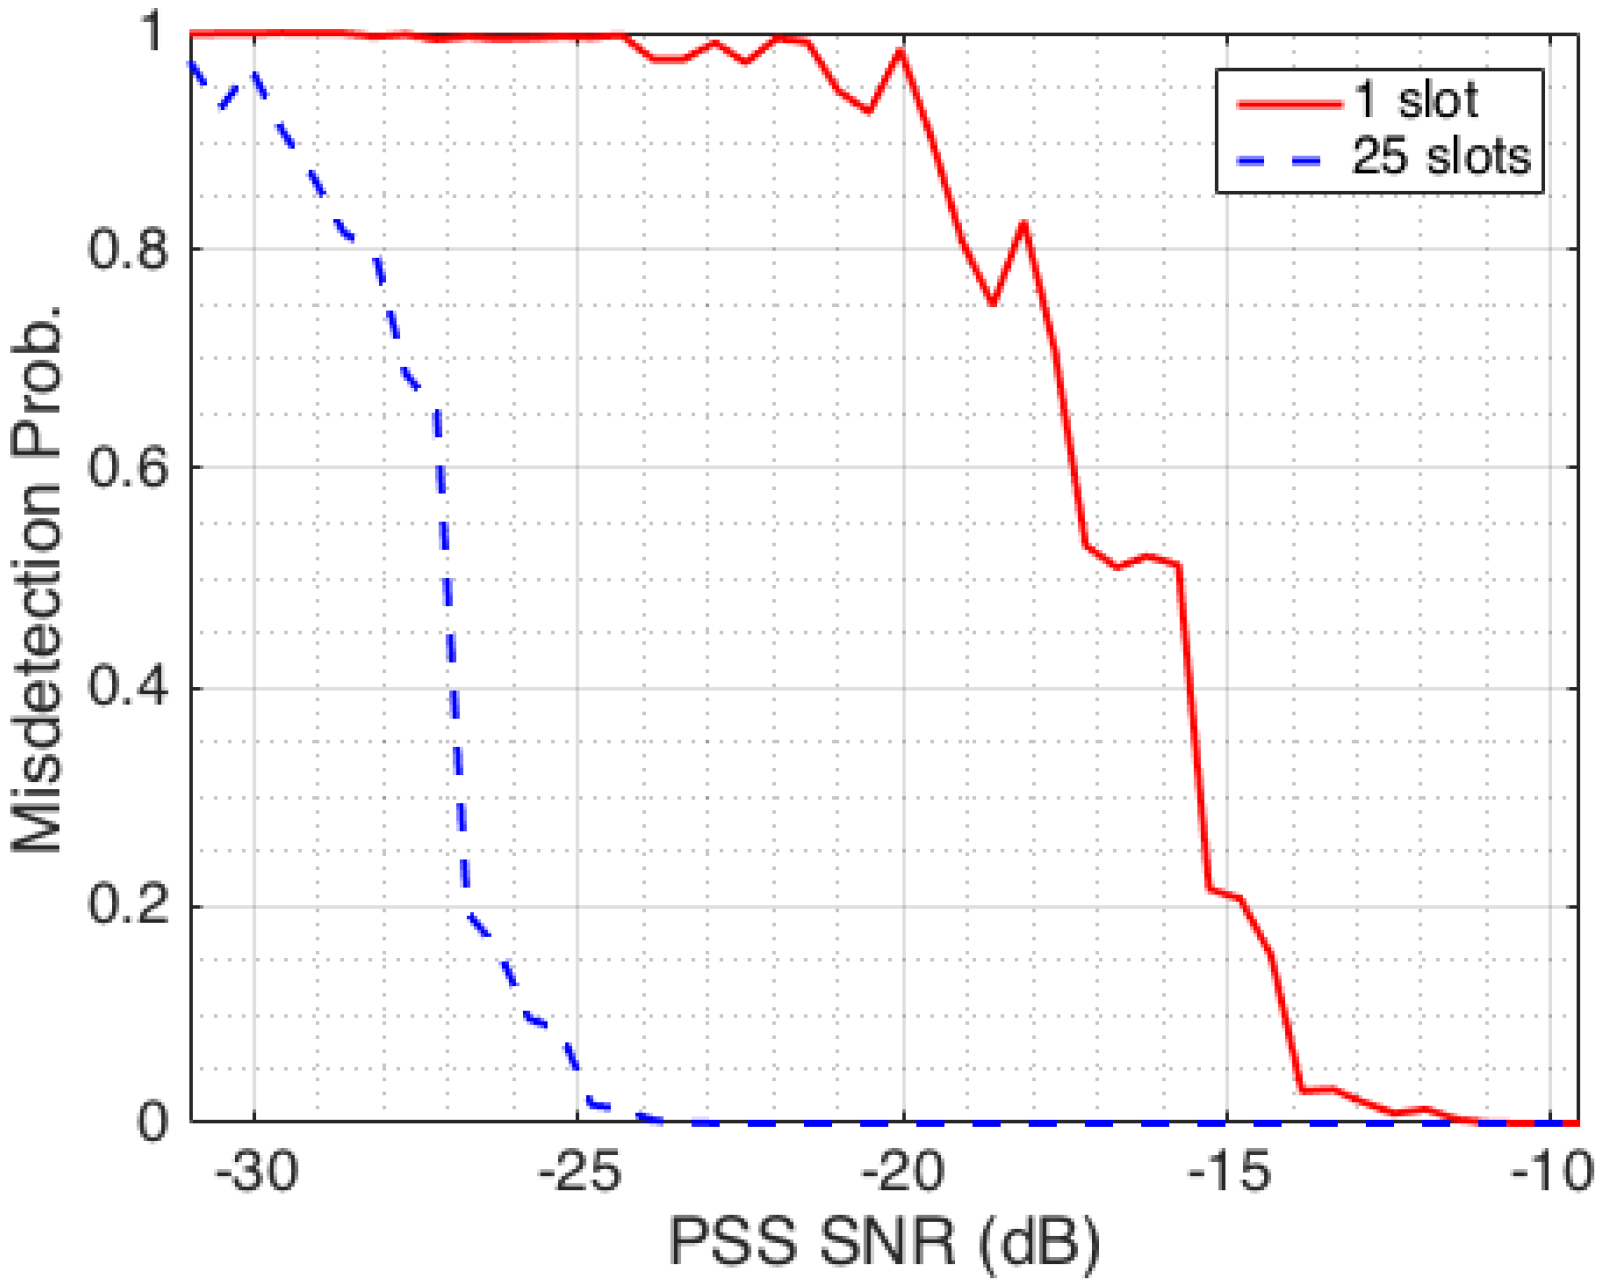
The solid red line in Figure 4 shows that with the use of an omnidirectional antenna at BS, the detection of PSS signals at UEs does not perform well at low SNR conditions, and the performance depends on the search time, that is, the duration that an UE receives the signal. With the use of only one time slot within 5 ms of search time, only the UEs within the −13 dB SNR contour can detect the PSS signal with a high probability. In the SNR range of −25 to −13 dB, the UEs can still detect the PSS signals, but the misdetection rate sharply increases as a function of SNR levels. For UEs located where the SNR is lower than −25 dB, it becomes almost impossible to detect the PSS signal. Thus, if a UE wants to detect the PSS signal with a low misdetection probability within one timeslot, the SNR at the UEs should be greater than −13 dB. In the case where 25 time slots are used within 125 ms of search time, the misdetection rate improves as observed by the dashed blue line in Figure 4. The detection is achieved with high probability for UEs beyond the SNR level of −25 dB. As SNR levels decrease from −25 to −32 dB, the misdetection rate increases to almost 1. For UEs at locations with SNR levels lower than −32 dB, the PSS detection becomes impossible.
5. Scanning the Coverage Area with Directional BS Antennas (LOS Channels)
Based on the misdetection probability rates for the omnidirectional antenna in Figure 4, we realize that to keep the misdetection rate low for each slot of search time, the SNR level received at the UEs should be at least −13 dB. Directional antennas can be used to compensate for the path loss, and improve the cell search procedure. Figure 5 demonstrates the concept of using a directional antenna at BS to focus the main beam to a specific location on the ground. We will consider two scanning schemes in this paper: random and deterministic.
Both random scanning and deterministic scanning schemes have been proposed in the past work shown in [21,22,23,24]. Authors used an 8 × 8 array antenna at BS to scan randomly in [21]. Exhaustive and iterative searching methods were employed in [22,23,24] to address the cell searching problem deterministically. We employ an adaptive array antenna in our analysis. Depending on our scanning scheme, we choose between three possible configurations: 4 × 4, 8 × 8 and 12 × 12 element arrays. Table 2 shows the different adaptive array configurations we employ, and their relevant antenna properties.
We will investigate two scenarios as indicated in Table 3. For the random scanning algorithm, we employ an 8 × 8 element array similar to [21]. Our deterministic approach utilizes all three configurations as indicated in Table 2. The specific beam positions for the array configurations are calculated so as to minimize any gaps; i.e., SNR less than −13 dB in the coverage area, for the deterministic algorithm. We will explain in detail the methodology we use in identifying these beam positions in the following subsection. For both random and deterministic algorithms, we first consider a LOS channel. Later on, we demonstrate how the same concepts can be applied to NLOS channels, and the key factors to be considered in adapting these ideas to more realistic NLOS scenarios.
5.1. Random Scanning Algorithm
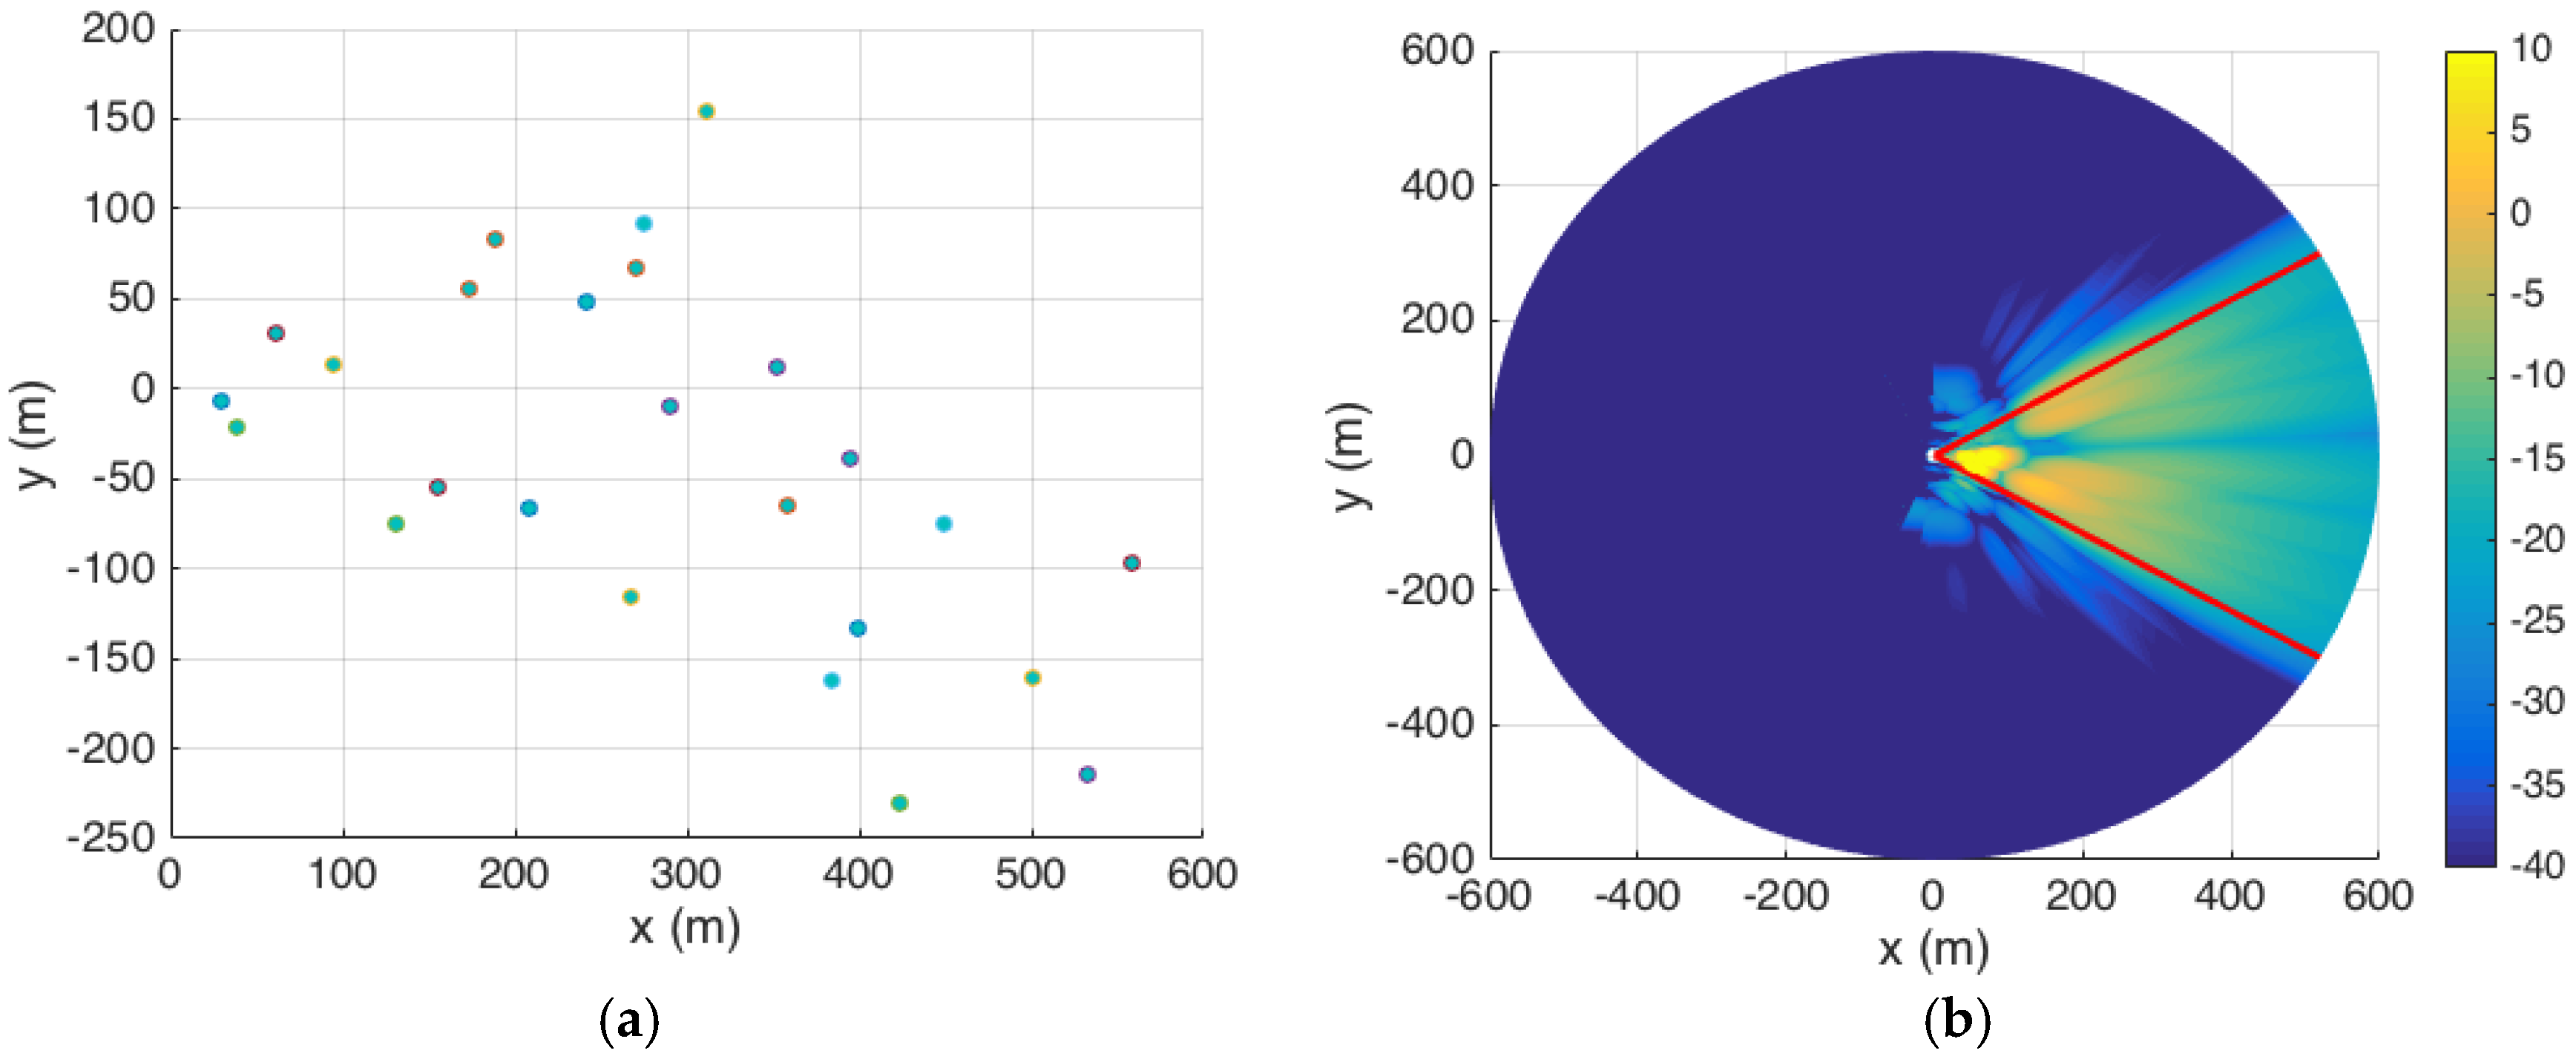
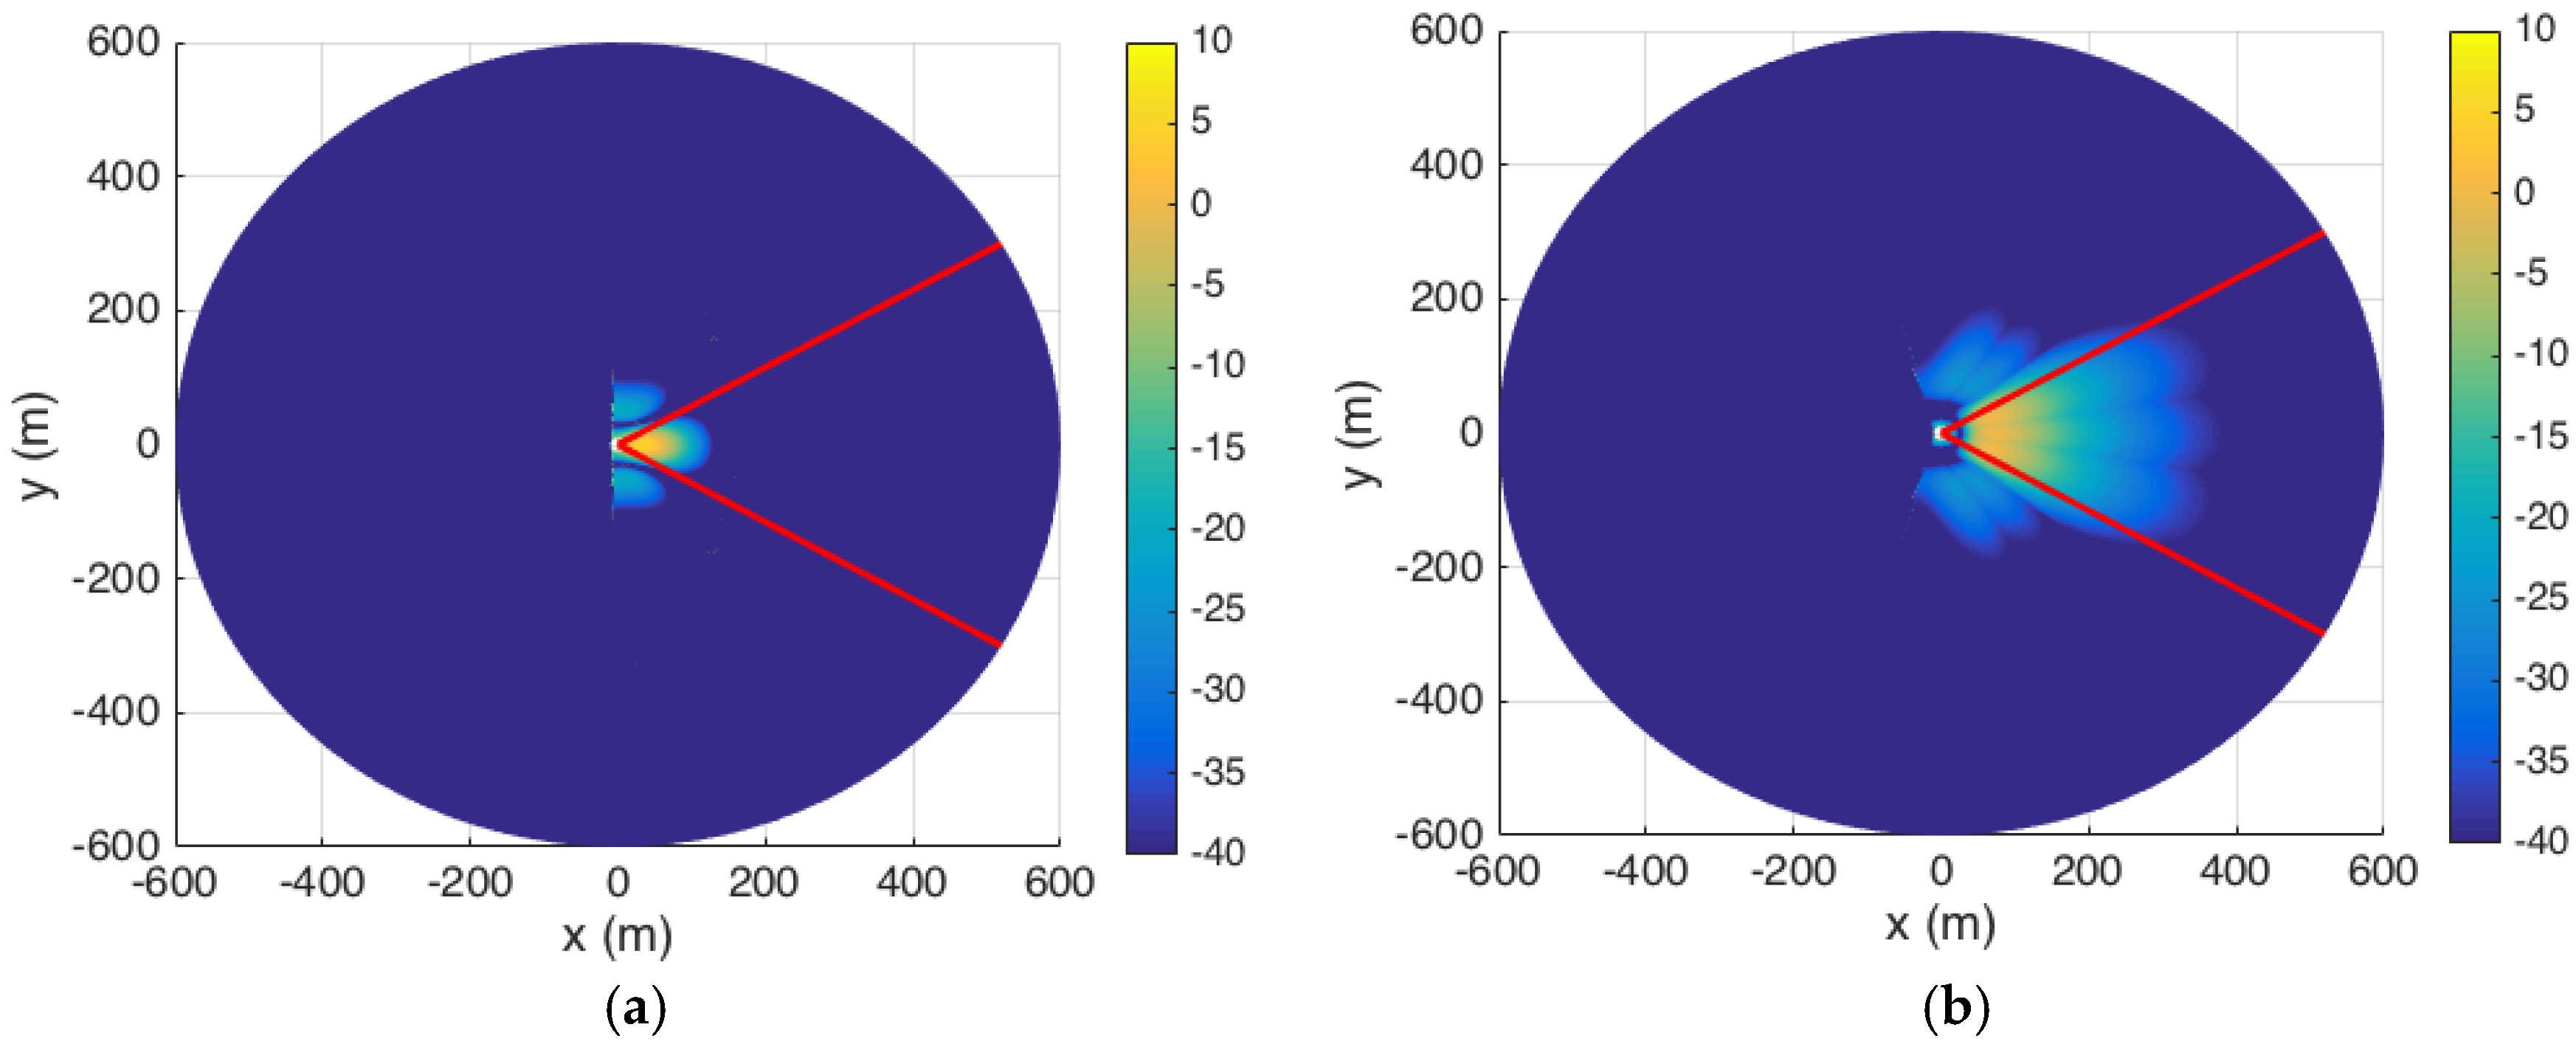
In the random scan process, an arbitrary location (both and are chosen randomly based on Gaussian distribution) inside the coverage region. The 8 × 8 BS antenna will re-focus its main beam to these random locations for each time slot. The results of the random beam positions and the resulting coverage (assuming a LOS channel) area within the 60° segment of the circle after 25 slots are shown in Figure 6a,b, respectively. We observe that random scanning does not guarantee a complete coverage, and there are regions with SNR levels less than −13 dB.
5.2. Deterministic Scanning Algorithm
For the deterministic approach, the exhaustive method was shown to be effective in [22,23,24]. While this method presents a low misdetection probability at UEs, it is considered too cumbersome in practice since the BS antenna needs to scan both in angular and radial spaces. In this paper, we propose an optimized deterministic scanning pattern employing directional antennas at the BS. This step will be considered as stage 2 of the iterative method in [22,23,24]. The objective is to use adaptive directional antennas to cover the regions where the omnidirectional transmission suffers from high misdetection rate due to propagation loss. This way, the misdetection rate can be reduced for UEs residing far away from the BS by improving the SNR levels. Furthermore, to maximize the performance of the search process, we propose the use of an adaptive array antenna to reduce the total scanning time while keeping the coverage capability the same and misdetection rate low.
Based on the misdetection probability rates for the omnidirectional antenna in Figure 4, we realize that to keep the misdetection rate low for each slot of search time, the SNR level received at the UEs should be at least −13 dB. With the required SNR values, we can calculate the required power at each receiver based on (12). Therefore, the specific antenna configuration at each time slot is based on the required SNR level at a target area to acquire a low value of . Furthermore, we assume the BS antenna can only scan in one direction at a time. The BS will then need to scan multiple slots to guarantee good SNR levels anywhere within the segment. The array can be scanned to different directions by applying the necessary phase excitations to the array elements as described in (2) while the transmitted power is fixed.
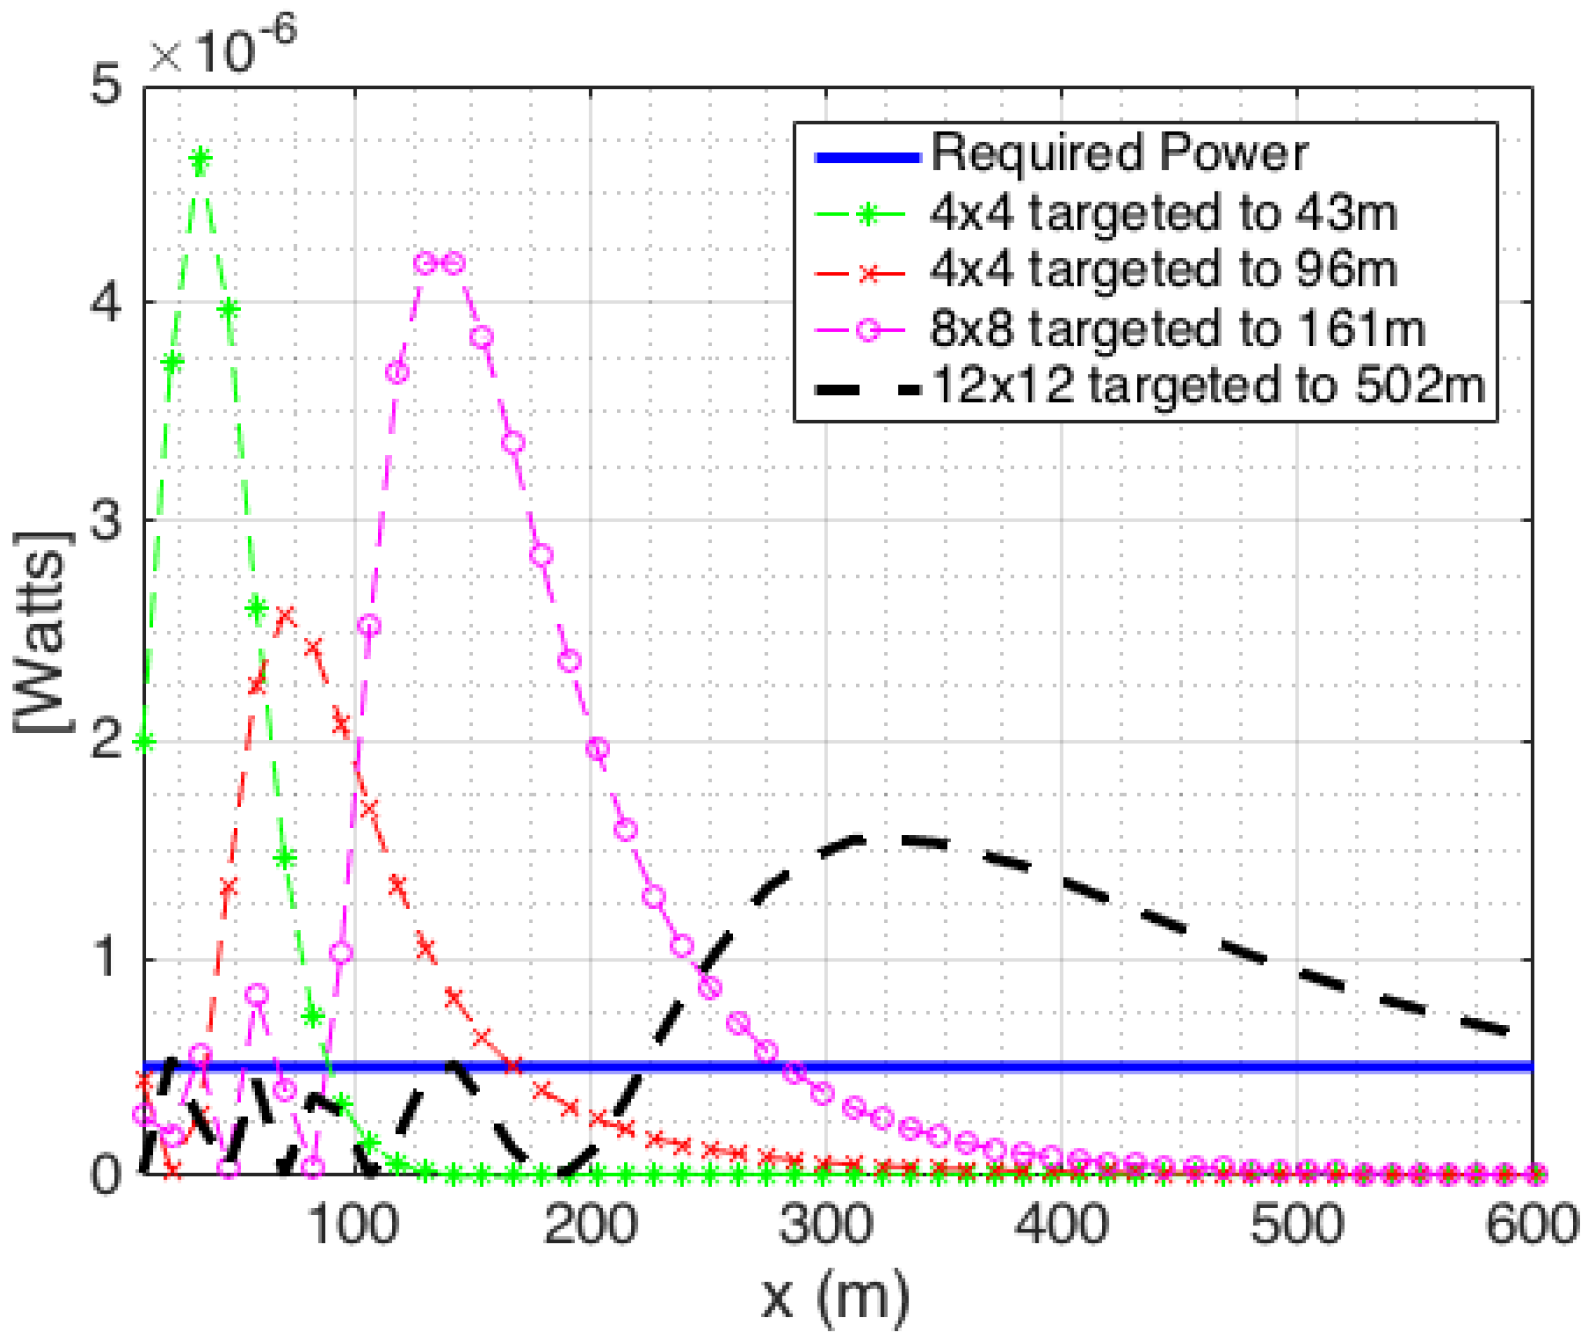
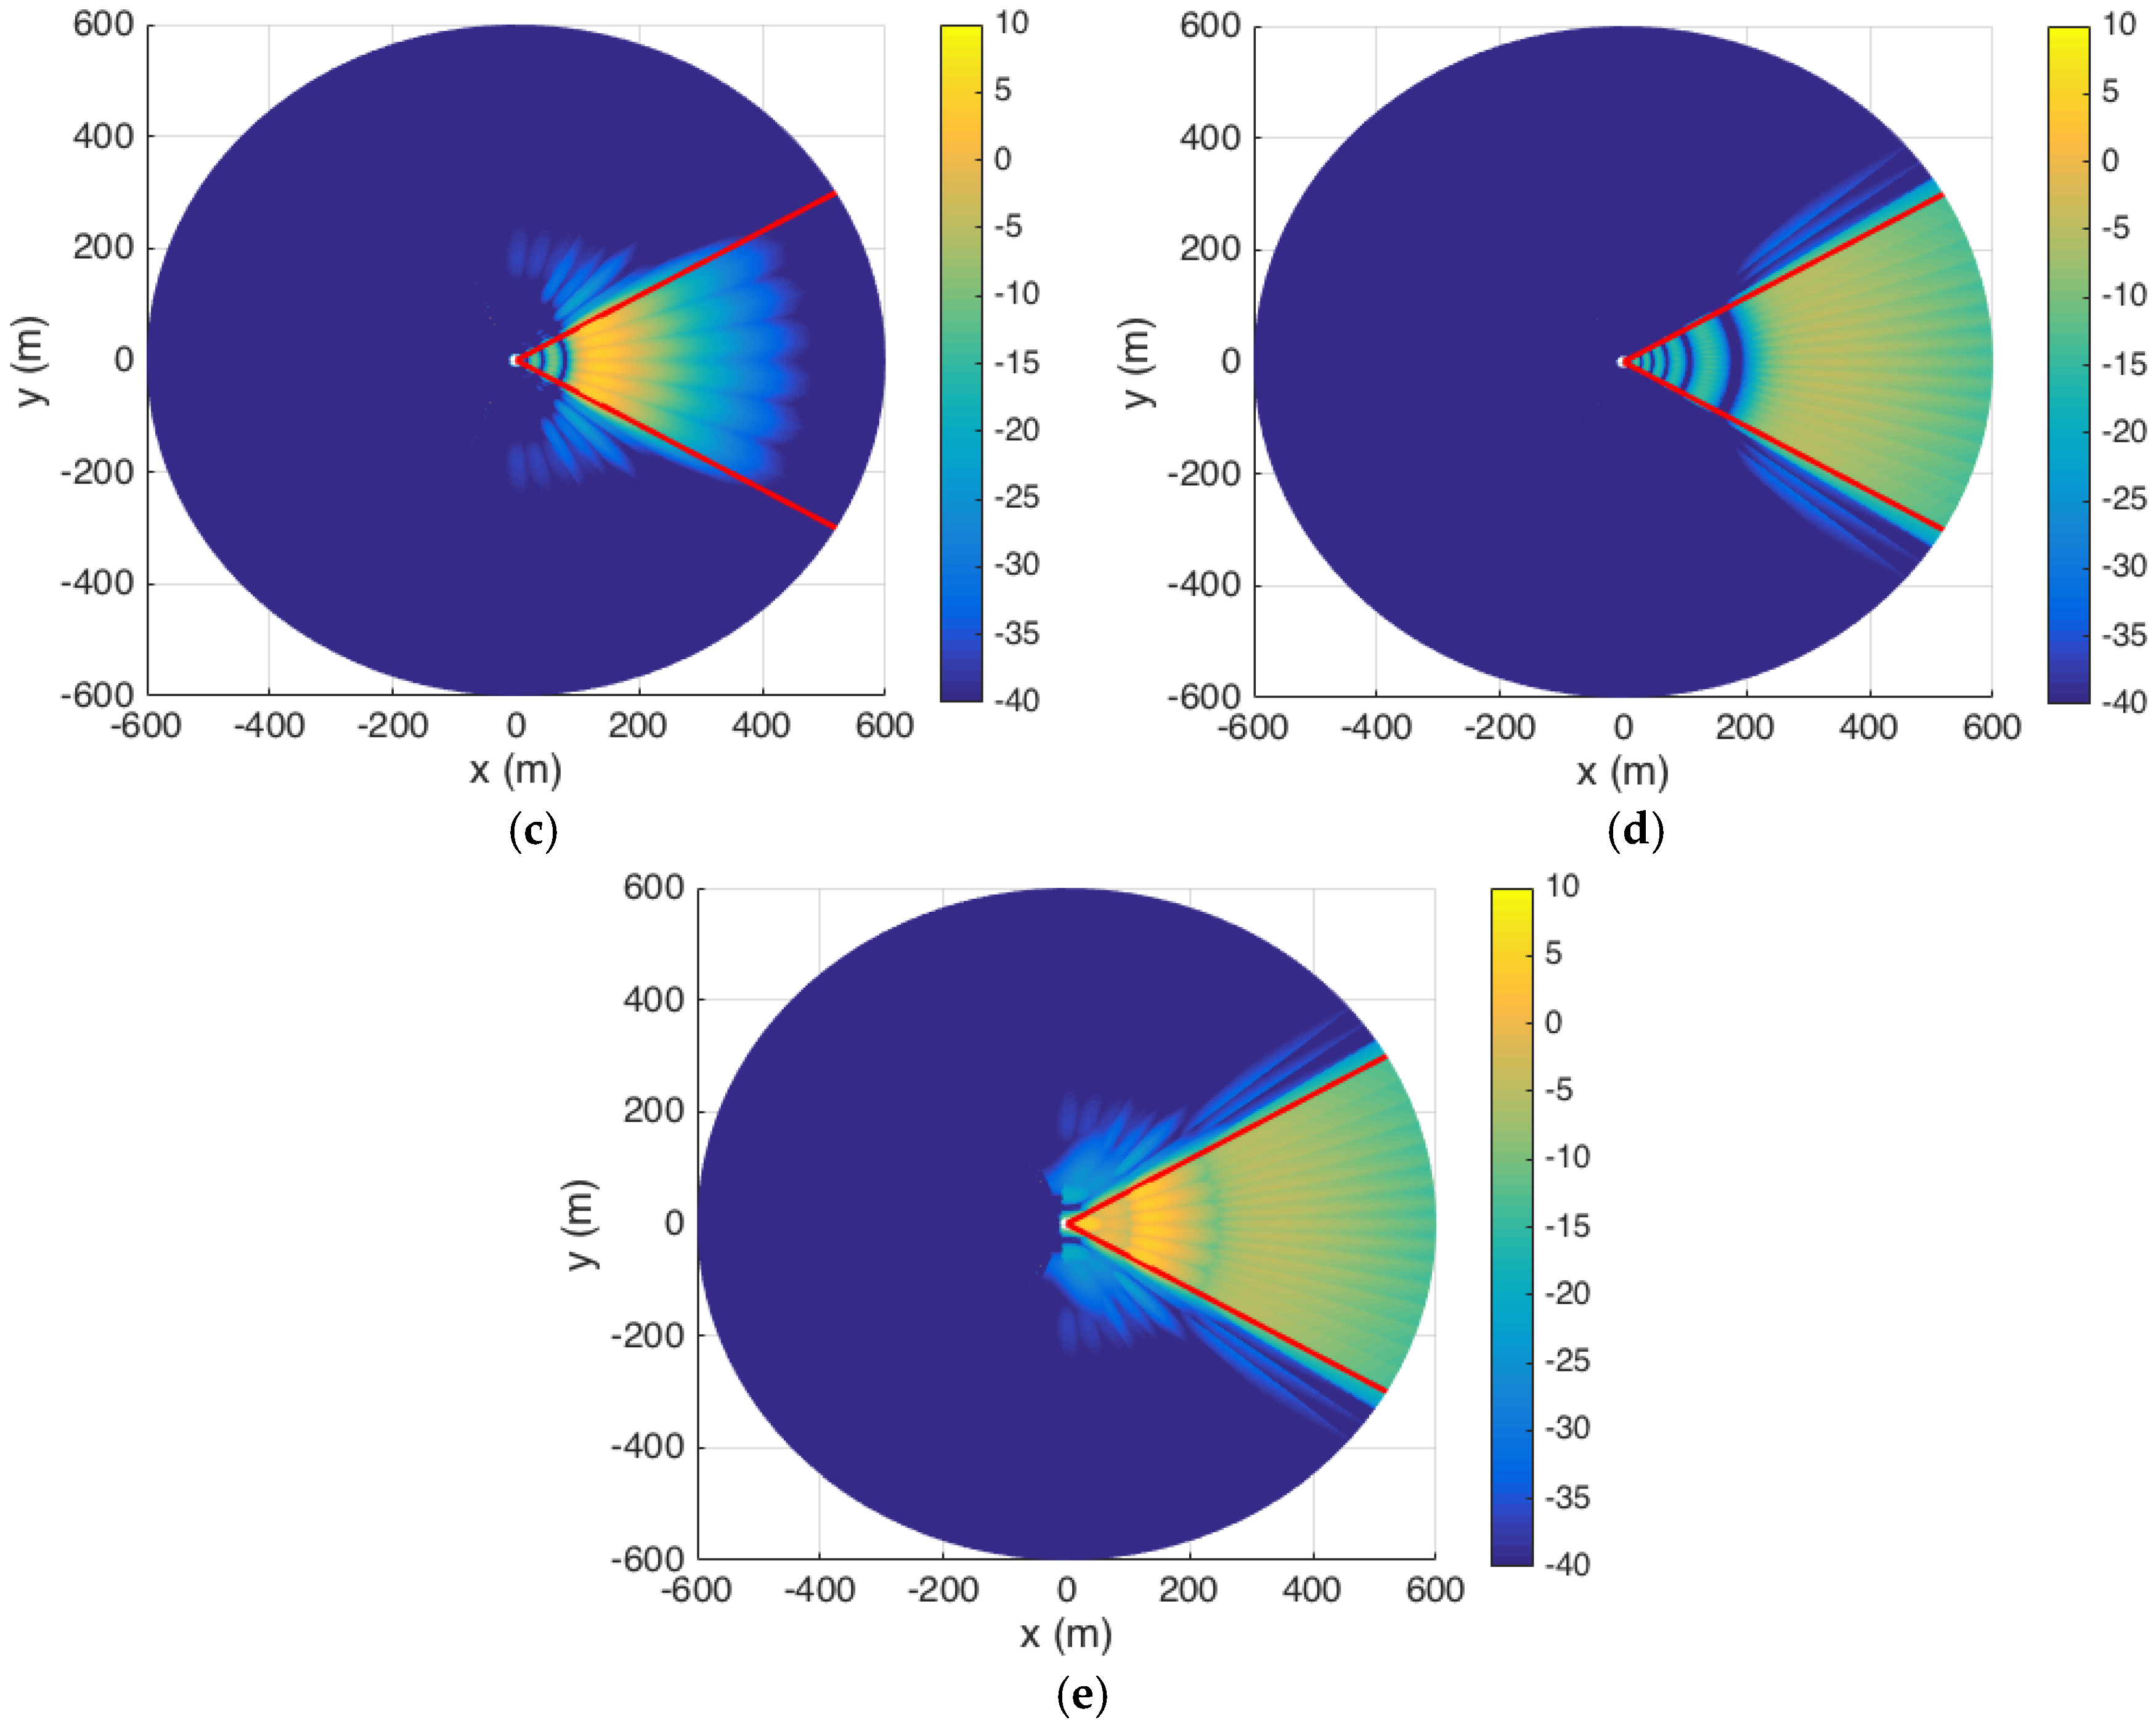
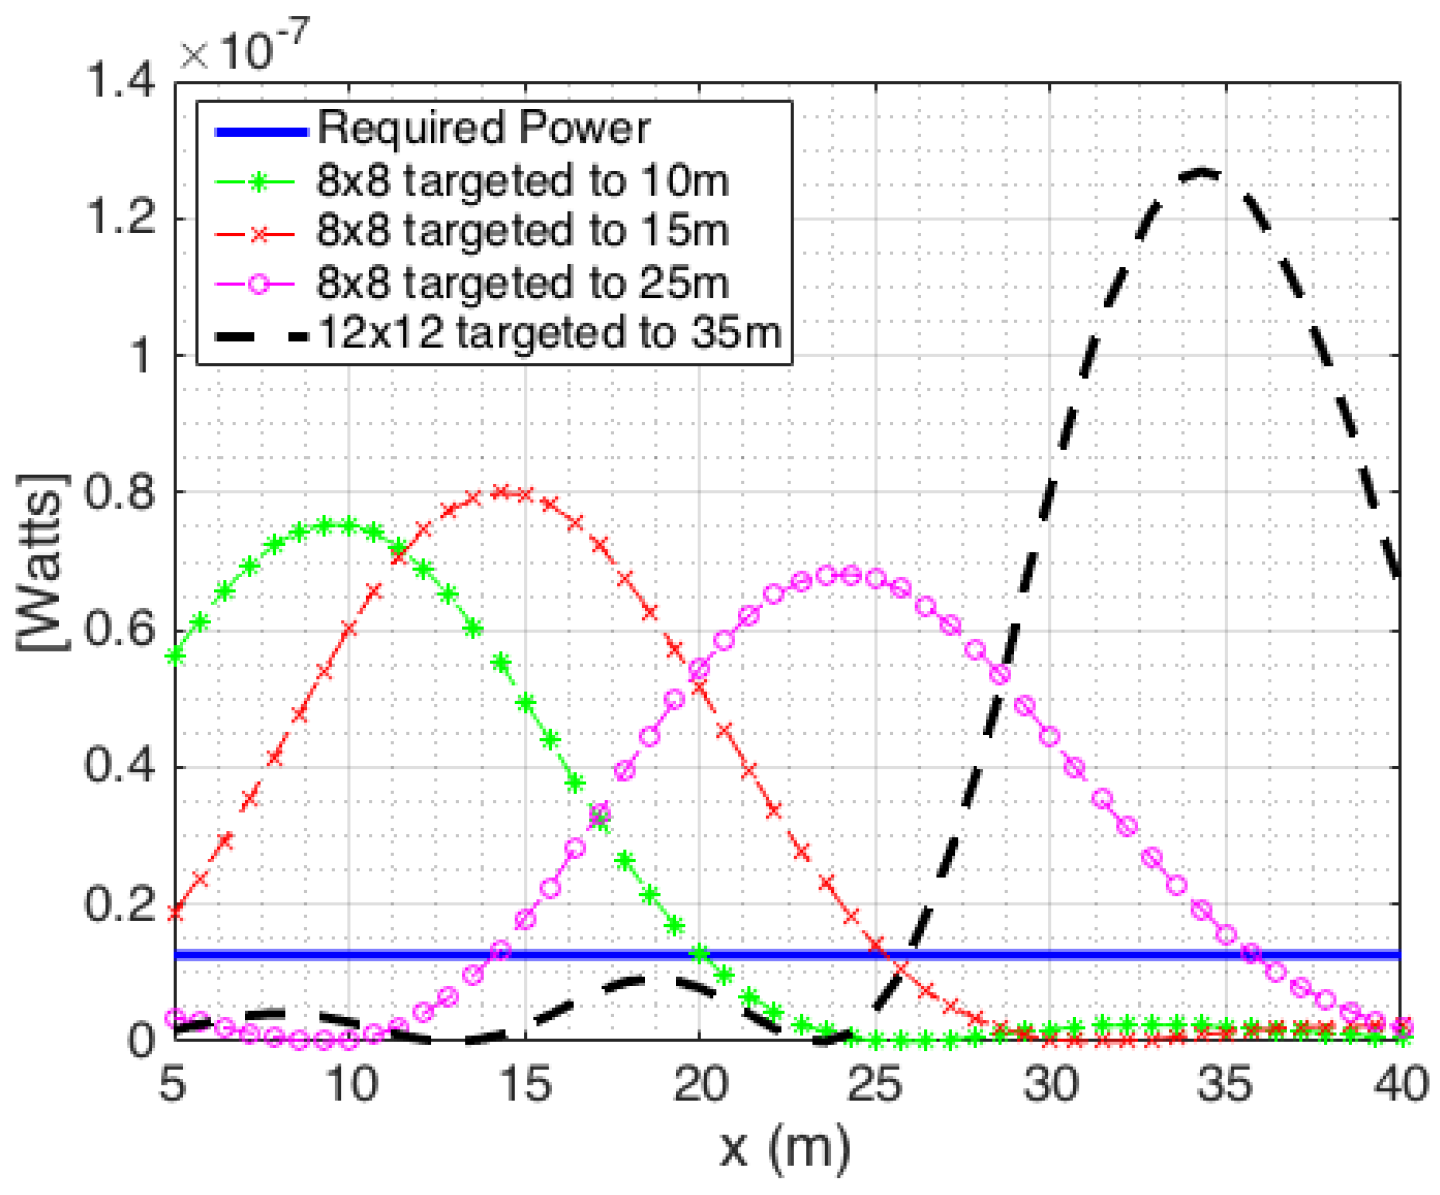
Figure 7 shows the received power at UEs distributed along the x-axis. It is observed that with the appropriate array configurations directed towards points on the x-axis at 43 m, 96 m, 161 m and 502 m, all UEs acquire the required power levels for high probability of detection. From the choices in Figure 7, the BS antenna is then scanned azimuthally to fully cover the area of interest. This is where the total of is equal to 25.
Figure 8a shows the color mapping of SNR levels after scanning for one slot within 43 m. For all of the UEs located within 43 m of BS, they will acquire a low misdetection rate since the powers received at these UEs are higher than the required power. Figure 8b shows the color mapping of the next three slots as the BS scans to the 96 m contour using a 4 × 4 array antenna. As observed, three beams with an azimuthal scan step of , cover the radial range between 43 and 200 m with the required received power. Similarly, Figure 8c shows six slots targeting the 161 m contour using an 8 × 8 element array with an azimuth scan step of , and Figure 8d shows 15 slots targeting the 502 m contour using a 12 × 12 element array with an azimuth scan step of . As the dimension of the antenna increases, its beamwidth decreases and more scan points are required to make sure the BS antenna covers the region of interest contiguously. Figure 8e shows the combined SNR levels corresponding to all scan positions as listed in Table 3 for the deterministic case. We observe that the SNR levels within the entire area of interest are maintained at the required values; i.e., higher than −13 dB, which allows us to keep a low value of at the output of the GLRT detectors. It should be noted that the antenna configuration proposed above is not necessarily a unique solution for a given microcell. Different antenna configurations may be exploited in the scanning procedure to obtain a similar SNR performance to that shown in Figure 8.
5.3. Performance Comparison between Deterministic and Random Scanning Algorithms (LOS Channels)
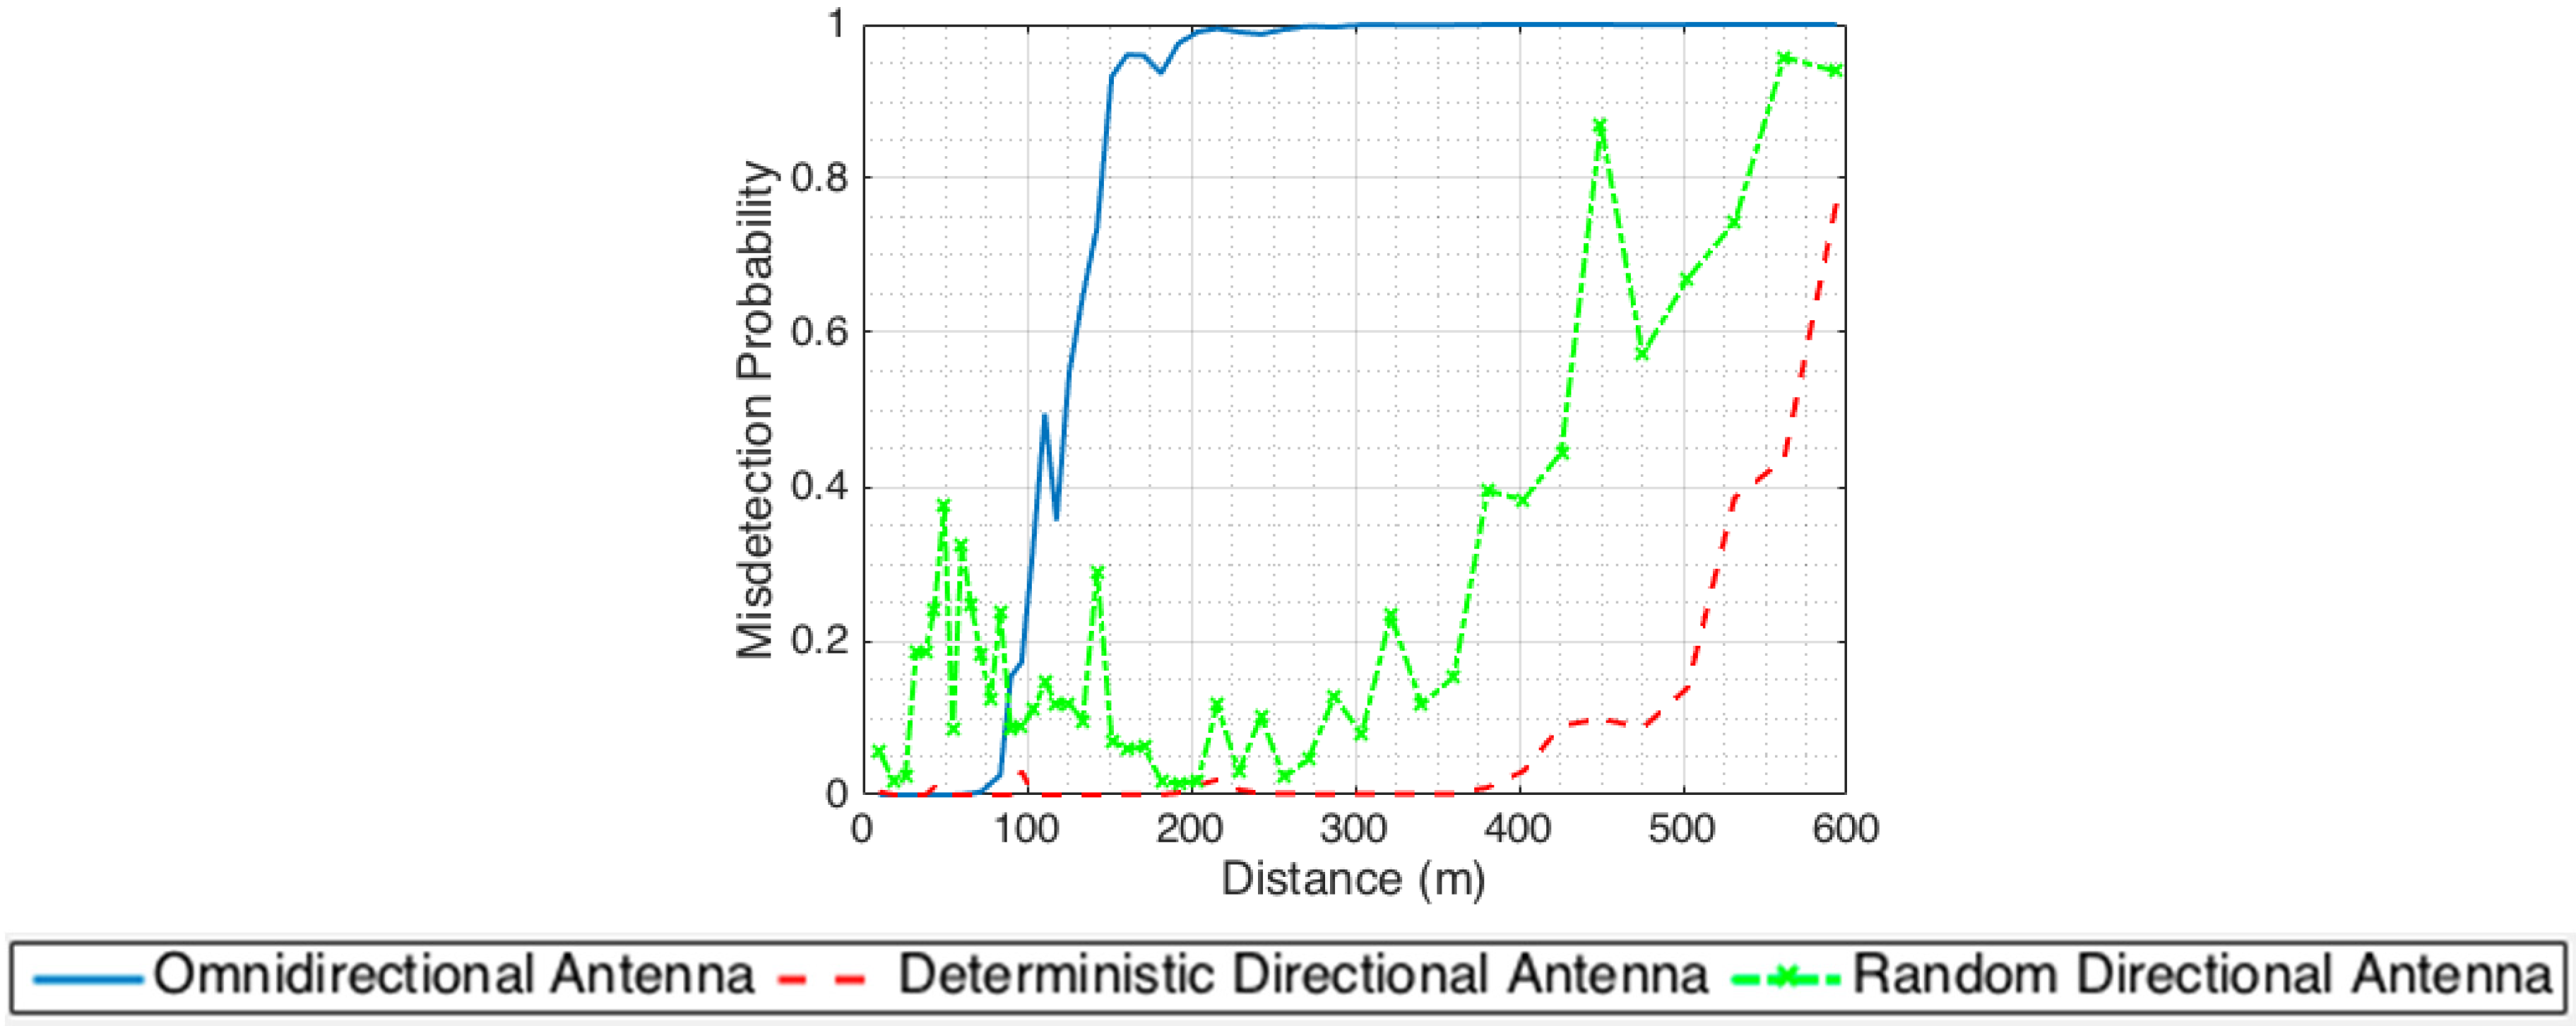
To compare the performance of different scanning strategies, Figure 9 shows the misdetection probability versus the distance of a UE from the BS for three scenarios: (i) omnidirectional BS, (ii) random scanning with an 8 × 8 BS antenna array, and (iii) scanning with the proposed pattern of an adaptive array as described in Table 3.
We observe that the misdetection rate is significantly improved when an adaptive antenna is exploited under the proposed scanning scheme. With an omnidirectional antenna at BS (blue line), the detection of PSS signals does not perform well at UEs located at distances greater than 100 m away from the BS. Within the 100 m to 200 m range, the UEs can still detect the PSS signals, but the misdetection rate sharply increases as a function of distance. For UEs located at distances greater than 200 m, it becomes impossible to detect the PSS signal. This is consistent with the results in Figure 4. For the random scanning case using an 8 × 8 array antenna at BS, the misdetection rate (green-dashed-x line) fluctuates over the region. Although the random scan method is simple and can be applied to different coverage areas, it is not necessarily efficient to achieve a short search time. The mean misdetection probability of the UEs is very high within a required search time of 125 ms (25 time slots). This is due to the fact that the antenna beam width versus the area of coverage is not considered, which results in the rise of the misdetection rate on these regions. The proposed deterministic scanning scheme using an adaptive array achieves low misdetection rates (red dashed line) even for UEs located at ~400 m away from the BS. For UEs located beyond 400 m, although the misdetection probability starts increasing, it is still better compared to the case of omnidirectional transmission or random scanning with a directional antenna.
6. Scanning the Coverage Area with Directional BS Antennas (NLOS Channels)
While the same procedure described above can be applied for NLOS channels, the excess path loss encountered results in reduced coverage area. As mentioned earlier, we employ the empirical model given in [4,28] to model NLOS channel behavior. The path loss is described by the empirical relationship given in Equation (14) as:
where for NLOS channels , , and the lognormal shadowing with . The NLOS path loss as a function of distance (solid blue line) is compared in Figure 10 to the LOS loss (dashed red line). We observe that as high as 30 dB excess loss can be experienced.
Therefore, with the available antenna configuration specified in Table 2, it is necessary to reduce the cell size so that the detection of UEs inside the coverage region is guaranteed. If larger cell sizes need to be supported, larger antennas with finer scan steps; i.e., higher number of time slots, would need to be deployed. Since we want to keep the total number of slots and with the maximum antenna dimensions of 12 × 12, the radius of the cell size under NLOS channels is chosen as R = 40 m to pose an equivalent problem to the LOS case discussed before. The procedure of choosing the appropriate scanning solutions is similar to the LOS case. Based on the required SNR (−13 dB) as shown in Section 5.2, we can calculate the required power at each receiver based on (12). As a result, the antenna dimensions as well as scanning directions at each time slots are designed to satisfy the required power received at each receiver in the region. Table 4 shows such a choice of antenna configuration and scanning position for the NLOS case.
Figure 11 shows the received power at UEs distributed along the x-axis. Similarly, as in the LOS case, it is observed that with the appropriate array configurations directed towards points on the x-axis at 10, 15, 25 and 35 m, all UEs acquire the required power levels for high probability of detection. From these choices, the BS antenna is then scanned azimuthally to fully cover the area of interest.
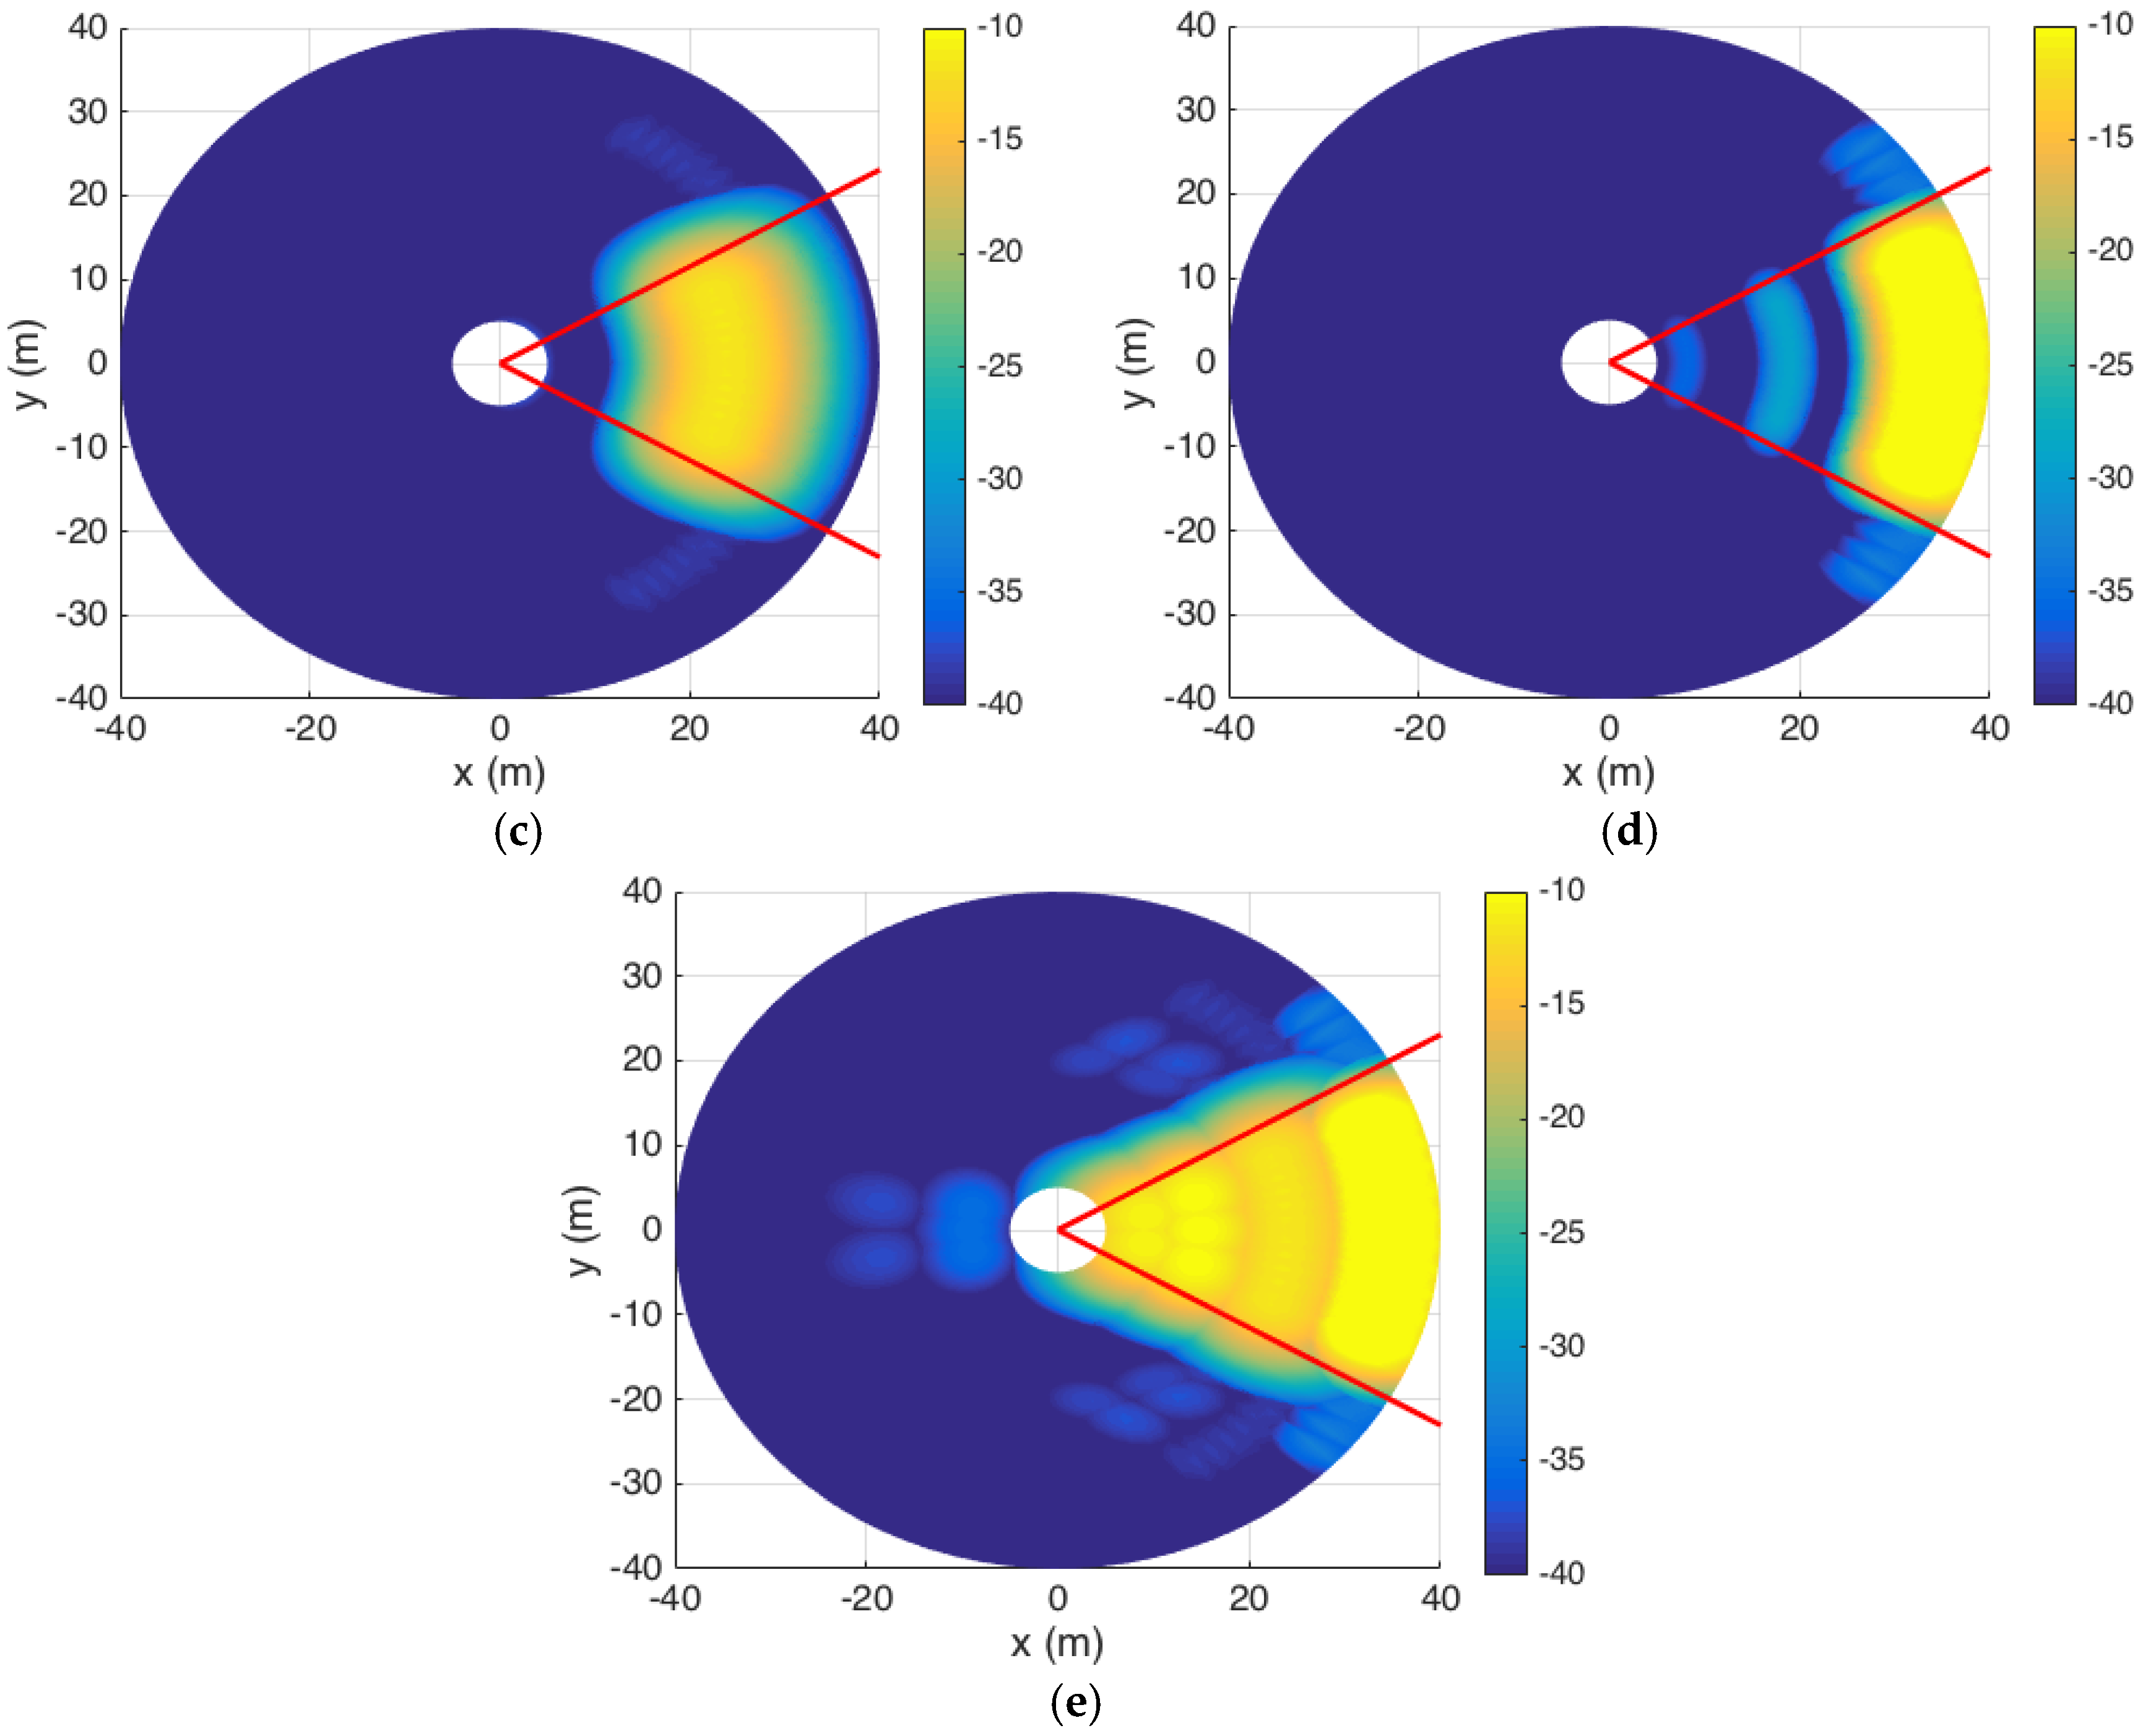
Figure 12 shows the color mapping of SNR levels after scanning for 25 slots. As similar to Section 5.2, we observe that the SNR levels within the entire area of interest are maintained at the required values; i.e., higher than −13 dB, which allows us to keep a low value of at the output of the GLRT detectors.
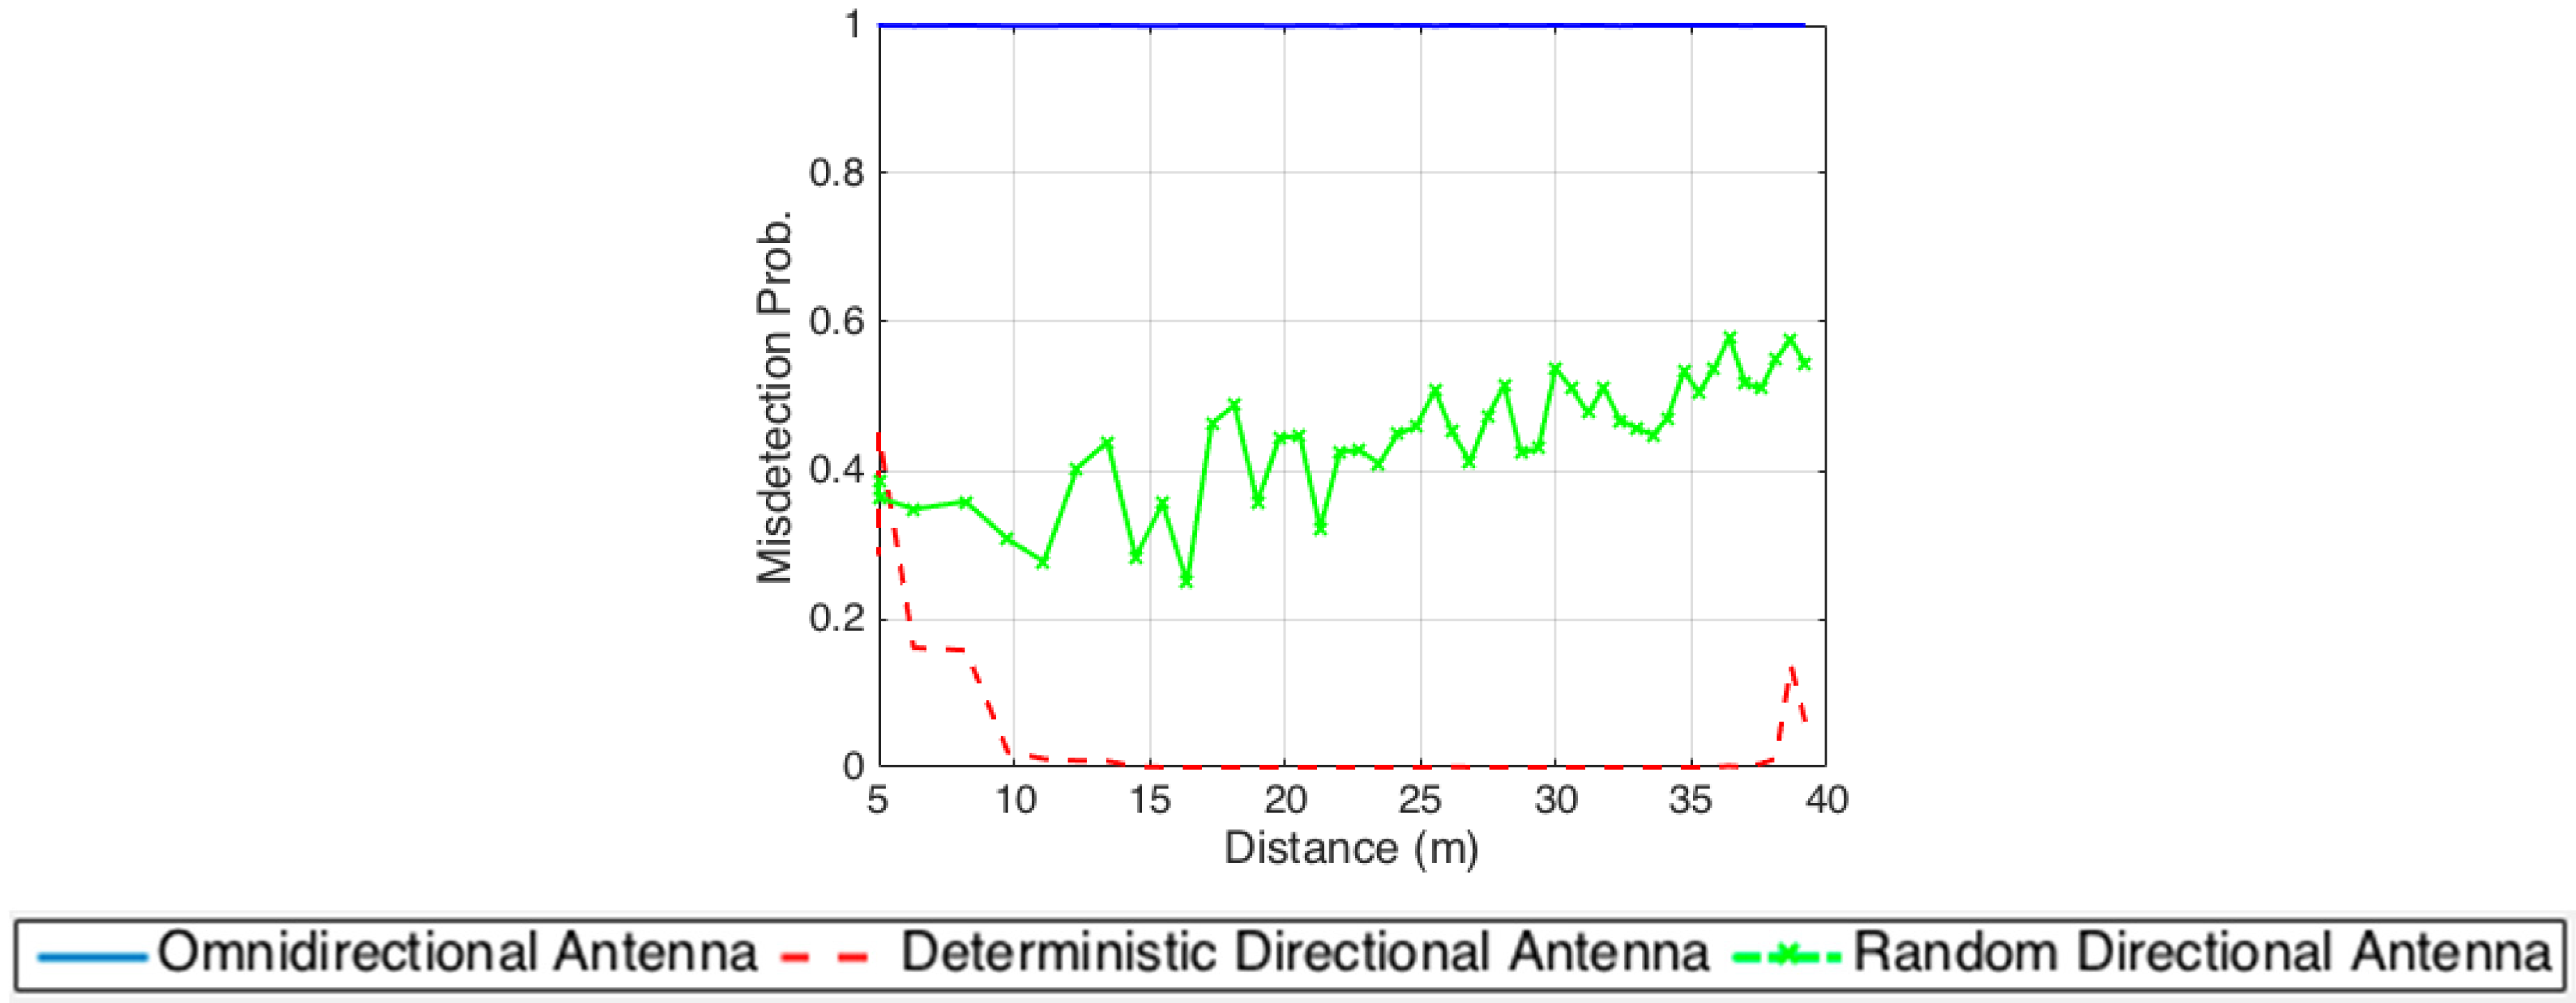
Similar with the LOS case, Figure 13 shows the misdetection probability versus the distance of a UE from the BS for three scenarios: (i) omnidirectional BS, (ii) random scanning with an 8 × 8 BS antenna array, and (iii) scanning with the proposed pattern of an adaptive array as described in Table 4.
As observed, under NLOS assumption, the proposed deterministic scanning scheme using an adaptive array achieves low misdetection rates (red dashed line) even for UEs located at ~40 m away from the BS. With an omnidirectional antenna at BS (blue line), the detection of PSS signals does not perform well since the misdetection probability at all UEs is 1 meaning that they are incapable of detecting the signals. This shows the drawback of omnidirectional antenna under NLOS channels. For the random scanning case using an 8 × 8 array antenna at BS, the misdetection rate (green-dashed-x line) fluctuates over the region. Although the performance of the random scanning concept is better than using omnidirectional antenna, the performance is still much less efficient than the use of the deterministic scanning scheme.
7. Conclusions
For mmWave cellular networks, the state-of-the-art work showed that omnidirectional PSS signal transmissions from a BS can generally achieve a lower misdetection rate for the UEs to detect the BS in an initial cell search compared to employing directional antennas scanning randomly over the coverage area. This paper further investigates the initial cell search problem to see whether one can exploit directional PSS signal transmissions of the BS with a carefully designed adaptive scanning scheme, instead of random scanning, to improve the performance of the initial cell search process. Under both the LOS and NLOS assumption, we designed such a BS scanning scheme with a set of directional antenna beam patterns, and showed that the misdetection rate for the UEs can be significantly reduced compared to conventionally explored methods using omnidirectional BS signal transmissions or random scanning with a directional BS signal.
Acknowledgments
This work was supported in part by the National Science Foundation under Grant 1456986.
Author Contributions
Toan Khanh Vo Dai performed the analysis of cell-searching procedure with the Generalized Likelihood Ratio Test (GLRT) detector using both line-of-sight (LOS) and non-line-of-sight (NLOS) assumption under the supervision of Ozlem Kilic. Hang Liu gave the valuable suggestion to conduct the work.
Conflicts of Interest
The authors declare no conflict of interest.
References
- Khan, F.; Pi, Z. Millimeter-Wave Mobile Broadband (MMB): Unleashing 3–300 GHz Spectrum. In Proceedings of the 34th IEEE Sarnoff Symposium, Princeton, NJ, USA, 3–4 May 2011; pp. 1–6. [Google Scholar]
- Mobile Traffic Forecasts: 2010–2020 Report; UMTS Forum Report 44; UMTS Forum: Zurich, Switzerland, 2011; volume 44, pp. 1–92.
- Khan, F.; Pi, Z. An Introduction to millimeter-wave mobile broadband systems. IEEE Commun. Mag. 2011, 49, 101–107. [Google Scholar]
- Akdeniz, M.R.; Liu, Y.; Samimi, M.K.; Sun, S.; Rangan, S.; Rappaport, T.S.; Erkip, E. Millimeter Wave Channel Modeling and Cellular Capacity Evaluation. IEEE J. Sel. Areas Commun. 2014, 32, 1164–1179. [Google Scholar] [CrossRef]
- Rangan, S.; Rappaport, T.S.; Erkip, E. Millimeter-Wave Cellular Wireless Networks: Potentials and challenges. Proc. IEEE 2014, 102, 366–385. [Google Scholar] [CrossRef]
- Elkashlan, M.; Duong, T.Q.; Chen, H.-H. Millimeter-wave communications for 5G: Fundamentals: Part I [Guest Editorial]. IEEE Commun. Mag. 2014, 52, 52–54. [Google Scholar] [CrossRef]
- Elkashlan, M.; Duong, T.Q.; Chen, H.H. Millimeter-wave communications for 5G–Part 2: applications [Guest Editorial]. IEEE Commun. Mag. 2015, 53, 166–167. [Google Scholar] [CrossRef]
- Balanis, C.A. Antenna Theory: Analysis and Design, 2nd ed.; John Wiley & Sons: Hoboken, NJ, USA, 2016. [Google Scholar]
- Zhao, H.; Mayzus, R.; Sun, S.; Samimi, M.; Schulz, J.K.; Azar, Y.; Wang, K.; Wong, G.N.; Gutierrez, F.; Rappaport, T.S. 28 GHz millimeter wave cellular communication measurements for reflection and penetration loss in and around buildings in New York city. 2013 IEEE Int. Conf. Commun. (ICC) 2013. [Google Scholar] [CrossRef]
- Violette, E.J.; Espeland, R.H.; DeBolt, R.O.; Schwering, F.K. Millimeter-wave propagation at street level in an urban environment. IEEE Trans. Geosci. Remote Sens. 1988, 26, 368–380. [Google Scholar] [CrossRef]
- Sato, K.; Manabe, T.; Ihara, T.; Saito, H.; Ito, S.; Tanaka, T.; Sugai, K.; Ohmi, N.; Murakami, Y.; Shibayama, M.; et al. Measurements of reflection and transmission characteristics of interior structures of office building in the 60-GHz band. IEEE Trans. Antennas Propag. 1997, 45, 1783–1792. [Google Scholar] [CrossRef]
- Tuan, N.; Toan, K.V.D.; Kilic, O. Rotman lens-fed aperture coupled array antenna at millimeter wave. In Proceedings of the 2016 IEEE International Symposium on Antennas and Propagation (APSURSI), Fajardo, Puerto Rico, 26 June–1 July 2016. [Google Scholar]
- Toan, K.V.D.; Kilic, O. Compact Rotman Lens Structure Configurations to Support Millimeter Wave Devices. Prog. Electromagn. Res. B 2016, 71, 91–106. [Google Scholar]
- Toan, K.V.D.; Kilic, O. Directional Array for Millimeter-Wave Cellular Networks. In Proceedings of the USNC-URSI National Radio Science Meeting, Boulder, CO, USA, 4–7 January 2017. [Google Scholar]
- Doan, C.H.; Emami, S.; Sobel, D.A.; Niknejad, A.M.; Brodersen, R.W. Design considerations for 60 GHz CMOS radios. IEEE Commun. Mag. 2004, 42, 132–140. [Google Scholar] [CrossRef]
- Zhang, Y.P.; Liu, D.X. Antenna-on-chip and antenna-in-package solutions to highly integrated millimeter-wave devices for wireless communications. IEEE Trans. Antennas Propag. 2009, 57, 2830–2841. [Google Scholar]
- Doan, C.H.; Emami, S.; Niknejad, A.M.; Brodersen, R.W. Millimeter-wave CMOS design. IEEE J. Solid-State Circuits 2005, 40, 144–155. [Google Scholar] [CrossRef]
- Rajagopal, S.; et al. Antenna array design for multi-gbps mmwave mobile broadband communication. In Proceedings of the Global Telecommunications Conference, Kathmandu, Nepal, 5–9 December 2011. [Google Scholar]
- Li, Q.C.; Niu, H.; Wu, G.; Hu, R.Q. Anchor-booster based heterogeneous networks with mmWave capable booster cells. In Proceedings of the Globecom Workshops (GC Workshops), Atlanta, GA, USA, 9–13 December 2013; pp. 93–98. [Google Scholar]
- 3GPP. Evolved Universal Terrestrial Radio Access (E-UTRA) and Evolved Universal Terrestrial Radio Access Network (E-UTRAN), Overall Description; Stage 2; TS 36.300 (release 10); 3GPP: Sophia Antipolis, France, 2010. [Google Scholar]
- Barati, C.N.; Hosseini, S.A.; Rangan, S.; Liu, P.; Korakis, T.; Panwar, S.S.; Rappaport, T.S. Directional cell discovery in millimeter wave cellular networks. IEEE Trans. Wirel. Commun. 2015, 14, 6664–6678. [Google Scholar] [CrossRef]
- Giordani, M.; Mezzavilla, M.; Barati, C.N.; Rangan, S.; Zorzi, M. Comparative analysis of initial access techniques in 5G mmwave cellular networks. In Proceedings of the 2016 Annual Conference on Information Science and Systems (CISS), Princeton, NJ, USA, 16–18 March 2016. [Google Scholar]
- Giordani, M.; Mezzavilla, M.; Zorzi, M. Initial access in 5G mmWave cellular networks. IEEE Commun. Mag. 2016, 54, 40–47. [Google Scholar] [CrossRef]
- Barati, C.N.; Hosseini, S.A.; Mezzavilla, M.; Korakis, T.; Panwar, S.S.; Rangan, S.; Zorzi, M. Initial Access in Millimeter Wave Cellular Systems. IEEE Trans. Wirel. Commun. 2016, 15, 7926–7940. [Google Scholar] [CrossRef]
- Ghosh, A.; Thomas, T.A.; Cudak, M.C.; Ratasuk, R.; Moorut, P.; Vook, F.W.; Rappaport, T.S.; MacCartney, G.R.; Sun, S.; Nie, S. Millimeter-wave enhanced local area systems: A high-data-rate approach for future wireless networks. IEEE J. Sel. Areas Commun. 2014, 32, 1152–1163. [Google Scholar] [CrossRef]
- Niu, Y.; Li, Y.; Jin, D.; Su, L.; Vasilakos, A.V. A survey of millimeter wave communications (mmWave) for 5G: Opportunities and challenges. Wirel. Netw. 2015, 21, 2657–2676. [Google Scholar] [CrossRef]
- Samimi, M.; Wang, K.; Azar, Y.; Wong, G.N.; Mayzus, R.; Zhao, H.; Schulz, J.K.; Sun, S.; Gutierrez, F.; Rappaport, T.S. 28 GHz angle of arrival and angle of departure analysis for outdoor cellular communications using steerable beam antennas in New York City. In Proceedings of the 2013 IEEE 77th Vehicular Technology Conference (VTC Spring), Dresden, Germany, 2–5 June 2013. [Google Scholar]
- Walfisch, J.; Bertoni, H.L. A theoretical model of UHF propagation in urban environments. IEEE Trans. Antennas Propag. 1988, 36, 1788–1796. [Google Scholar] [CrossRef]
- Har, D.; Xia, H.H.; Bertoni, H.L. Path-loss prediction model for microcells. IEEE Trans. Veh. Technol. 1999, 48, 1453–1462. [Google Scholar] [CrossRef]
- Trees, V.; Harry, L. Detection, Estimation, and Modulation Theory; John Wiley & Sons: Hoboken, NJ, USA, 2004. [Google Scholar]
- Kay, S.M. Fundamentals of statistical signal processing: Estimation theory. Technometrics 1995, 37, 465–466. [Google Scholar]
- Conte, E.; De Maio, A.; Ricci, G. CFAR detection of distributed targets in non-Gaussian disturbance. IEEE Trans. Aerosp. Electron. Syst. 2002, 38, 612–621. [Google Scholar] [CrossRef]
- Burgess, K.A.; Van Veen, B.D. Subspace-based adaptive generalized likelihood ratio detection. IEEE Trans. Signal Process. 1996, 44, 912–927. [Google Scholar] [CrossRef]
- Bose, S.; Steinhardt, A.O. Adaptive array detection of uncertain rank one waveforms. IEEE Trans. Signal Process. 1996, 44, 2801–2809. [Google Scholar]
- Robey, F.C.; Fuhrmann, D.R.; Kelly, E.J.; Nitzberg, R. A CFAR adaptive matched filter detector. IEEE Trans. Aerosp. Electron. Syst. 1992, 28, 208–216. [Google Scholar] [CrossRef]
- Kraut, S.; Scharf, L.L. The CFAR adaptive subspace detector is a scale-invariant GLRT. IEEE Trans. Signal Process. 1999, 47, 2538–2541. [Google Scholar] [CrossRef]
- Ciuonzo, D.; De Maio, A.; Orlando, D. On the Statistical Invariance for Adaptive Radar Detection in Partially Homogeneous Disturbance Plus Structured Interference. IEEE Trans. Signal Process. 2016, 65, 1222–1234. [Google Scholar] [CrossRef]
- Ciuonzo, D.; De Maio, A.; Orlando, D. A unifying framework for adaptive radar detection in homogeneous plus structured interference—Part I: On the maximal invariant statistic. IEEE Trans. Signal Process. 2016, 64, 2894–2906. [Google Scholar] [CrossRef]
- Ciuonzo, D.; De Maio, A.; Orlando, D. A unifying framework for adaptive radar detection in homogeneous plus structured interference—Part II: Detectors design. IEEE Trans. Signal Process. 2016, 64, 2907–2919. [Google Scholar] [CrossRef]
- Hammersley, J.M.; Handscomb, D.C. Monte Carlo Methods; Methuen: London, UK, 1964. [Google Scholar]
Figure 1.
Millimeter wave microcell considered in this paper.

Figure 2.
Periodical Primary Synchronization Signal (PSS) signal transmission.

Figure 3.
Signal-to-noise ratio (SNR) levels, (a) for line-of-sight (LOS) channels as a function of distance; (b) color mapping of SNR levels over the simulated microcell.
Figure 3.
Signal-to-noise ratio (SNR) levels, (a) for line-of-sight (LOS) channels as a function of distance; (b) color mapping of SNR levels over the simulated microcell.

Figure 4.
Misdetection probability of the Generalized Likelihood Ratio Test (GLRT) detector as a function of PSS SNR when omnidirectional antenna is used at the base station (BS) for a search time of one time slot and 25 time slots.
Figure 4.
Misdetection probability of the Generalized Likelihood Ratio Test (GLRT) detector as a function of PSS SNR when omnidirectional antenna is used at the base station (BS) for a search time of one time slot and 25 time slots.

Figure 5.
Demonstration of BS antenna illuminating the ground at a specific time slot.

Figure 6.
(a) Random beam locations on ground for the 25 time slots; (b) Corresponding coverage with random scan pattern using an 8 × 8 directional antenna.
Figure 6.
(a) Random beam locations on ground for the 25 time slots; (b) Corresponding coverage with random scan pattern using an 8 × 8 directional antenna.

Figure 7.
Received power levels along the x-axis for different array configurations under LOS conditions.
Figure 7.
Received power levels along the x-axis for different array configurations under LOS conditions.

Figure 8.
Deterministic optimal scanning pattern for BS using adaptive directional antennas under LOS condition; (a) with 4 × 4 antenna array; (b) 2–4 with 4 × 4 array; (c) 5 to 10 with 8 × 8 array (d) 11–25 with 12 × 12 array; (e) Coverage for 25 slots over the entire cell segment.
Figure 8.
Deterministic optimal scanning pattern for BS using adaptive directional antennas under LOS condition; (a) with 4 × 4 antenna array; (b) 2–4 with 4 × 4 array; (c) 5 to 10 with 8 × 8 array (d) 11–25 with 12 × 12 array; (e) Coverage for 25 slots over the entire cell segment.


Figure 9.
Misdetection probability of the GLRT detector as a function of distance for different scanning strategies using 25 slots of search time under LOS conditions.
Figure 9.
Misdetection probability of the GLRT detector as a function of distance for different scanning strategies using 25 slots of search time under LOS conditions.

Figure 10.
SNR levels for LOS and NLOS channels as a function of distance.

Figure 11.
Received power levels along the x-axis for different array configurations under NLOS conditions.
Figure 11.
Received power levels along the x-axis for different array configurations under NLOS conditions.

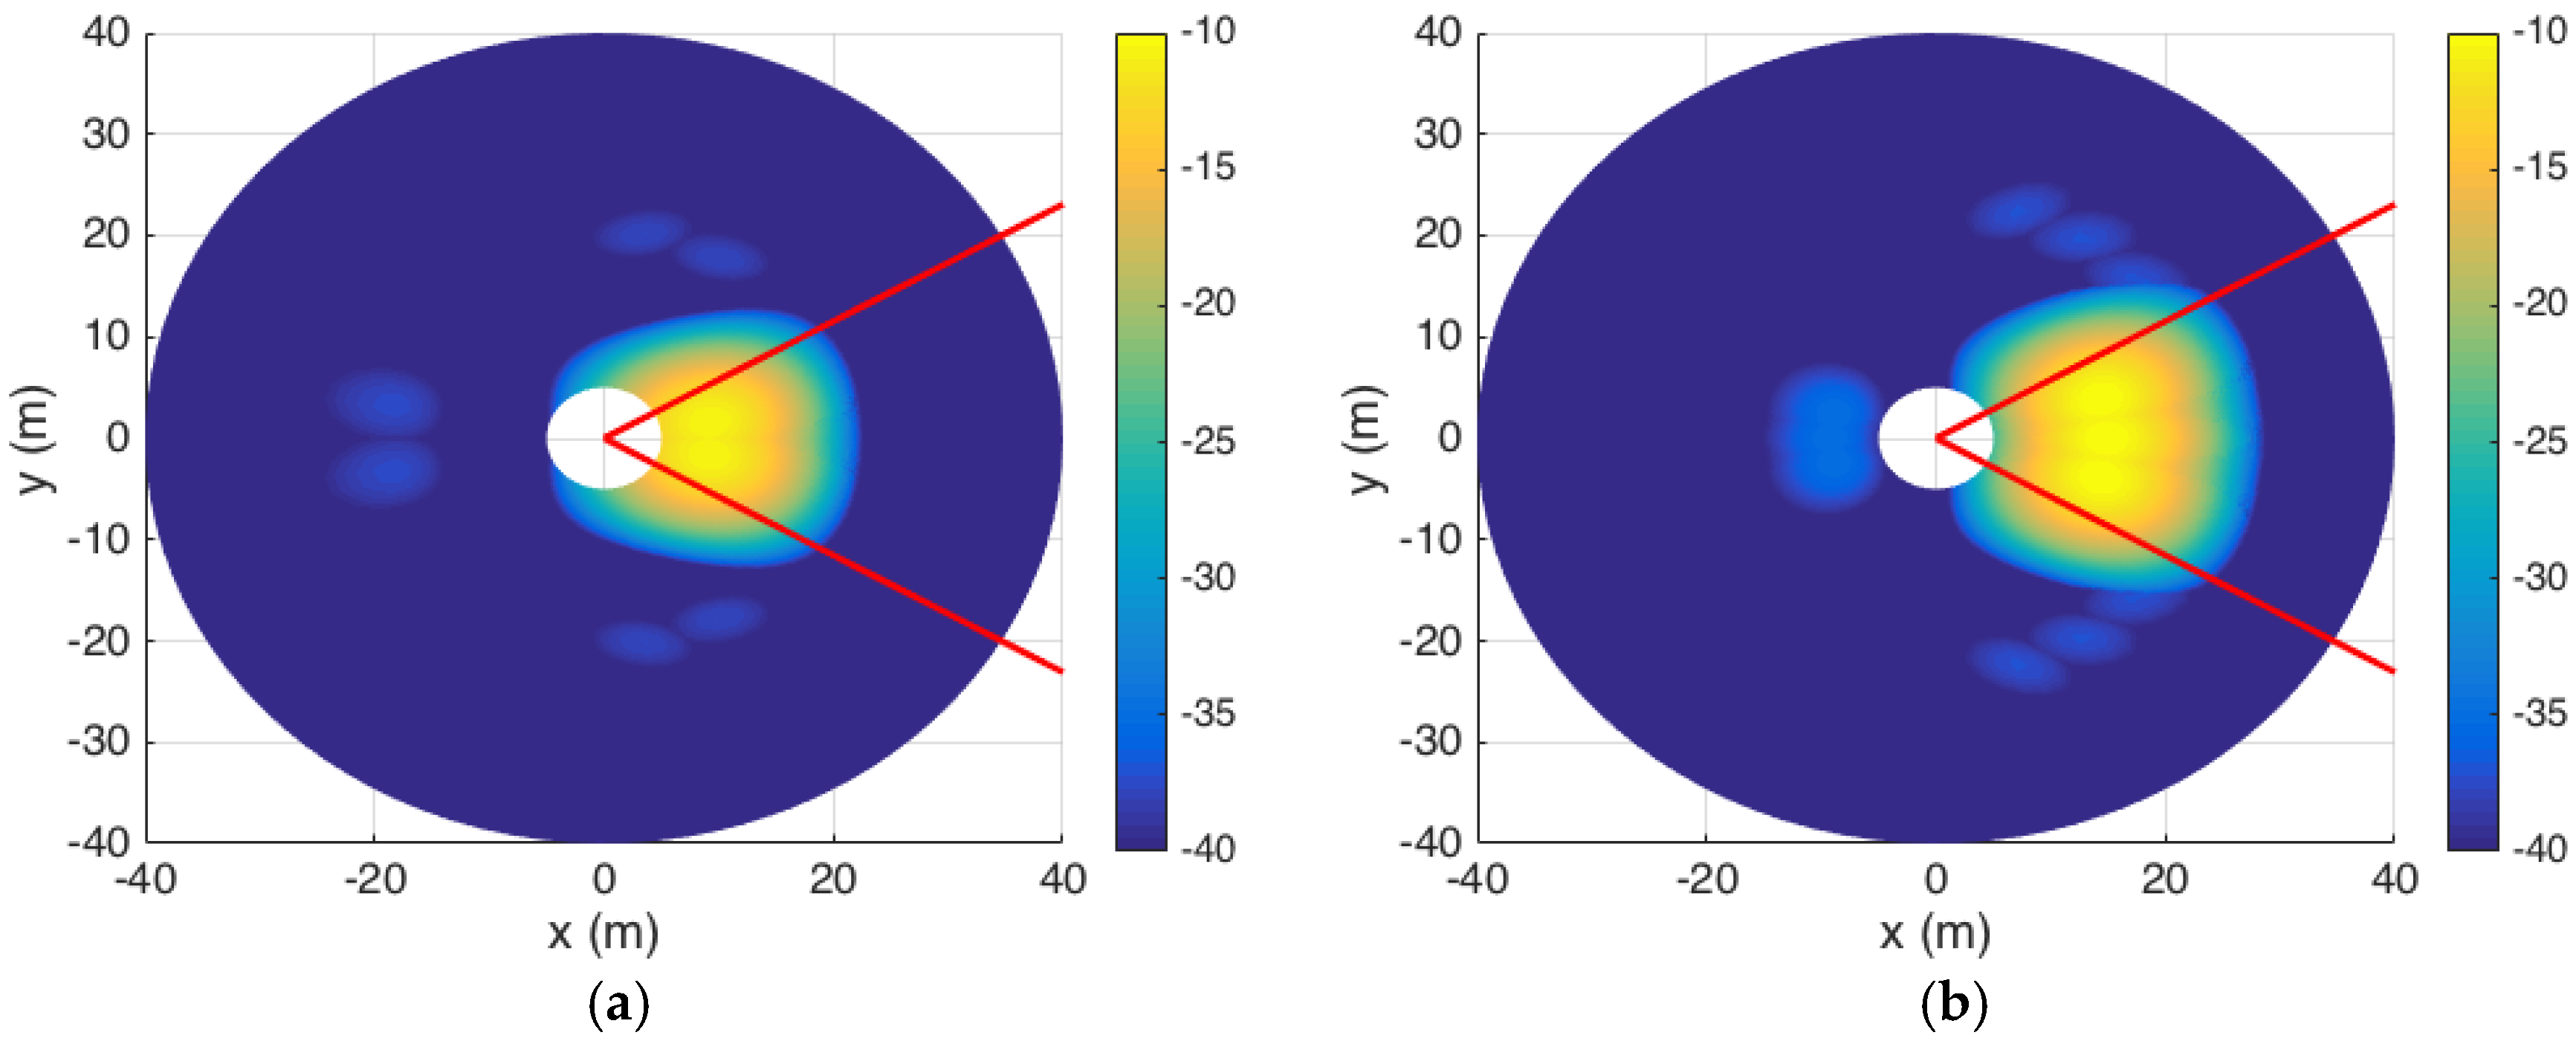
Figure 12.
Deterministic optimal scanning pattern for BS using adaptive directional antennas under NLOS condition; (a) 1–2 with 8 × 8 antenna array; (b) 3–5 with 8 × 8 array; (c) 6–15 with 8 × 8 array (d)16–25 with 12 × 12 array; (e) Coverage for 25 slots over the entire cell segment.
Figure 12.
Deterministic optimal scanning pattern for BS using adaptive directional antennas under NLOS condition; (a) 1–2 with 8 × 8 antenna array; (b) 3–5 with 8 × 8 array; (c) 6–15 with 8 × 8 array (d)16–25 with 12 × 12 array; (e) Coverage for 25 slots over the entire cell segment.


Figure 13.
Misdetection probability of the GLRT detector as a function of distance for different scanning strategies using 25 slots of search time under LOS conditions.
Figure 13.
Misdetection probability of the GLRT detector as a function of distance for different scanning strategies using 25 slots of search time under LOS conditions.


Table 1.
Parameters used for simulation on cell search procedure.
| Parameters | Value |
|---|---|
| PSS signal duration, | 100 |
| PSS signal period, | 5 |
| False alarm probability, | |
| Number of slots, | 25 slots |
| Carrier frequency, | 28 GHz |
| Transmitted Power, | 50 dBm |
| Noise level, | −159 dBm/Hz |
| Signal-to-noise ratio (SNR) level | Vary as function of distance |
Table 2.
Gain values and half-power beamwidth (HPBW) of different adaptive array configurations considered.
Table 2.
Gain values and half-power beamwidth (HPBW) of different adaptive array configurations considered.
| Antenna Configuration | Gain (dB) | HPBW |
|---|---|---|
| 4 × 4 | 12 | 27° |
| 8 × 8 | 18 | 13° |
| 12 × 12 | 21.5 | 9° |
Table 3.
Main beam direction and antenna configuration used for deterministic scanning solution under LOS conditions.
Table 3.
Main beam direction and antenna configuration used for deterministic scanning solution under LOS conditions.
| Case | Slot | Target Contours (R) | Scanning Angle () | Antenna |
|---|---|---|---|---|
| Case 1 | 1st–25th slots | Random | Random | 8 × 8 |
| Case 2 | 1st slot | 43 m | 0° | 4 × 4 |
| 2nd–4th slots | 96 m | −18°, 0°, 18° | 4 × 4 | |
| 5th–10th slots | 161 m | −25°, −15°,...,15°, 25° | 8 × 8 | |
| 11th–25th slots | 502 m | −27°, −23.15°,...,23.15°, 27° | 12 × 12 |
Table 4.
Main beam direction and antenna configuration used for deterministic scanning solution under NLOS conditions.
Table 4.
Main beam direction and antenna configuration used for deterministic scanning solution under NLOS conditions.
| Slot | Target Contours (R) | Scanning Angle (θ) | Antenna |
|---|---|---|---|
| 1st–2nd slots | 10 m | −10°, 10° | 8 × 8 |
| 3rd–5nd slots | 15 m | −15°, 0°, 15° | 8 × 8 |
| 6th–15th slots | 25 m | −20°, −15.56°,...,15.56°, 20° | 8 × 8 |
| 16th–25th slots | 35 m | −20°, −15.56°,...,15.56°, 20° | 12 × 12 |
© 2017 by the authors. Licensee MDPI, Basel, Switzerland. This article is an open access article distributed under the terms and conditions of the Creative Commons Attribution (CC BY) license (http://creativecommons.org/licenses/by/4.0/).
Share and Cite
MDPI and ACS Style
Vo Dai, T.K.; Kilic, O.; Liu, H. Improved Cell Search for mmWave Cellular Networks Using Deterministic Scanning Algorithm with Directional Array Antenna. Electronics 2017, 6, 42. https://0-doi-org.brum.beds.ac.uk/10.3390/electronics6020042
AMA Style
Vo Dai TK, Kilic O, Liu H. Improved Cell Search for mmWave Cellular Networks Using Deterministic Scanning Algorithm with Directional Array Antenna. Electronics. 2017; 6(2):42. https://0-doi-org.brum.beds.ac.uk/10.3390/electronics6020042
Chicago/Turabian StyleVo Dai, Toan Khanh, Ozlem Kilic, and Hang Liu. 2017. "Improved Cell Search for mmWave Cellular Networks Using Deterministic Scanning Algorithm with Directional Array Antenna" Electronics 6, no. 2: 42. https://0-doi-org.brum.beds.ac.uk/10.3390/electronics6020042
Note that from the first issue of 2016, this journal uses article numbers instead of page numbers. See further details here.