
A Galvanic Intrabody Method for Assessing Fluid Flow in Unilateral Lymphoedema
by
 ,
,
Clement Ogugua Asogwa
* ,
,
Johanis Aryo Bay
,
Patrick Mclaughlin
,
Stephen F. Collins
and
Daniel T. H. Lai
College of Engineering & Science, Victoria University, Melbourne, VIC 8001, Australia
*
Author to whom correspondence should be addressed.
Electronics 2017, 6(2), 47; https://0-doi-org.brum.beds.ac.uk/10.3390/electronics6020047
Submission received: 8 November 2016
/
Revised: 27 May 2017
/
Accepted: 12 June 2017
/
Published: 15 June 2017
Abstract
:Lymphoedema is a disease associated with abnormal functioning of the lymph that leads to swelling of the body due to accumulation of tissue fluid on the affected area. Tissue fluid contains ions and electrolytes that affect electrical conductivity. The flow of tissue fluid helps to distribute vital nutrients and other important elements necessary for healthy living. When tissue fluid is stagnated, a high concentration of electrolytes accumulate on the affected area, which in turn affects an electrical signal passing through that area to be minimally attenuated in relation to a free-flowing fluid. We demonstrate that a galvanic coupled signal propagating along a lymphoedema affected limb could capture these changes by the amount of attenuation the propagating signal experiences in time. Our results show that average rate of signal attenuation on a lymphoedema affected part of the body could be as slow as 0.16 dB/min, while the rate of signal attenuation on a healthy part is as high as 1.83 dB/min. This means that fluid accumulation could slow down the exchange of body electrolytes up to twice less the rate on an unaffected contralateral part of the body. Monitoring these changes by observing the average rate of change of a galvanic coupled signal attenuation on the affected body part can be used for diagnosing early developments of oedema in the body and for evaluating recovery in response to treatment procedures.
1. Introduction
Lymphoedema is a chronic disorder of the lymphatic system whereby lymphatic vessels and/or nodes malfunction and accumulate fluid and other elements in the surrounding tissue spaces [1]. The disorder causes imbalance between the interstitial fluid production and its transport leading to an unusual swelling of one or more limbs or the affected body part [2]. In lymphoedema disease, leaked fluids containing high molecular protein from lymphatic vessel remain stagnant under the skin and, if undiagnosed early and left untreated, can lead to progressive inflammation and damage to the affected body part [3,4]. Lymphoedema is progressive in nature; early diagnosis is important because it helps timely intervention mostly because there is not yet a standard solution for treatment [5,6], and efforts are mainly focused on management, to minimize swelling, restore functionality of the affected area of the body and prevent potential complications associated with the disease [7]. Owing to this, early detection and appropriate management can alleviate the symptoms and slow its progression [8].
According to a 2015 World Health Organization report, about 1.34 billion people are currently being threatened by lymphoedema disease [9]. A previous report by Moffat et al. suggested a growing increase in chronic lymphoedema with greater population among women [10]. A current study in Australia also suggests a growing prevalence of lymphoedema [2]. These reports draw attention to the diagnostic techniques, since at present, there is no complete cure, unless otherwise diagnosed at the earliest stage of development, which may be alleviated by good management techniques [11]. Some of the techniques for diagnosing lymphoedema include:
- i
- Physical examination and investigation of the history of the affected area.
- ii
- Limb volume measurement.
- iii
- Bioelectrical impedance spectroscopy method.
- iv
- Blood test and genetic test analysis.
- v
- Imaging techniques.
Lymphoedema can co-exist with other medical conditions that cause swelling [12]; consequently, a blood test is also used to examine the existential cause of oedema. The test is to ascertain if there are pathogenic microorganisms on the accumulated fluid, which makes it not an early diagnostic method, but a pin-point validation of the existence of lymphoedema or the cause of other fluid disorder. For example, when infection is suspected on a swollen body part, a further blood test is performed to verify the presence of a parasite [12]. Genetic testing is used for patients who have been diagnosed with primary lymphoedema [7]. The purpose of this test is to determine the presence of genes associated with diseases that cause lymphoedema and to be able to provide proper genetic counselling for the patient and to verify the probability of its re-occurrence along family lines. Some imaging techniques used for diagnosing fluid accumulation include magnetic resonance imaging (MIR), computed tomography (CT) and ultrasound [13]. These techniques are not available for day-to-day individual assessment. Moreover, they require real clinical training to operate, whereas cancer treatment patients and patients who have had axillary lymph dissection, which are at higher risk of lymph dysfunction or blockage [12], need a system for out-of-hospital checks in order to determine early development of fluid disorder. A common practice among clinicians for patients at risk of lymphoedema is limb volume measurement [14]. Limb volume measurement at best would help to ascertain the severity of lymphoedema and to assess progress in treatment management. Treatment with multi-layer inelastic lymphoedema bandaging (MLLB), for instance, is also monitored through limb volume measurement [14]. It is considered present if the swollen limb is more than 10% greater than the contralateral unaffected limb [8]. Therefore, limb volume measurement has limited success, and deviation from baseline is not easily determined. It is also prone to human error. A closely related practice for tracking sequential changes in the circumference of an affected limb is the circumferential limb measurements (CLM), which is subjective because it has no standard protocol [11]. Another frequently-used method in practice is bioelectrical impedance assessment [8]. Bioimpedance techniques are used either in a single or a multiple of frequencies. A single frequency bioimpedance is usually designed to analyse body impedance at 50 kHz. However, a 50-kHz current would be inhibited by cell membrane capacitance, which has high impedance at low frequencies. This affects its use for estimating body fluid, because cell membrane capacitance contributes significantly to the effective impedance of electrical signals across tissues [15]. Due to the capacitive behaviour of cell membranes, the frequency range required for measuring both the extracellular fluid (ECF) and intracellular fluid (ICF) resistances is usually at <5 MHz [16]. Cornish et al. [17] have suggested the use multi-frequency bioimpedance to diagnose the onset of lymphoedema on post-breast cancer treated patients; however, lymphoedema is chronic; therefore, research to improve or discover early diagnostic methods is still critical. Bioimpedance spectroscopy (BIS) was proposed as an improvement over the single and multi-frequency bioimpedance methods. BIS operates using a broad band of frequencies. It assumes a five cylinder model of the human body and takes into account the effects of non-conducting tissues embedded in both the ECF and ICF tissues that significantly contribute to the overall impedance of the body. It can calculate the extracellular impedance separately from the intracellular impedance, the impedance phase angle and also an estimate of the total body water [18]. A comparison of the measured value with a baseline can be used to predict the development of oedema. However, this can be affected by the initial physiological state of an individual, such as metabolism and dehydration levels. Rothlingershofer et al. [19] stated that severe dehydration could cause up to a 6% increase in muscle impedance. Thus, the impedance of the human body is dynamic and has significant impact on the expected outcome. Our goal is to use a galvanic coupling method, which relies on the attenuation of a propagating signal to detect changes in body fluid levels in a manner that will assist quick diagnosis and monitoring of lymphoedema disease. In laboratories, advanced technologies using imaging techniques are used to scan lymph vessels and nodes [13], but these require high laboratory skills. Since the tissue fluid in a lymphoedema affected part of the body is mostly stagnant, our aim is to develop a method that will detect very slow or stagnated movement of body fluid on a particular part of the body, which can help detect the earliest development of oedema on tissues using some of the protocols developed in our galvanic coupling intrabody circuit [20].
2. A New Diagnostic Method
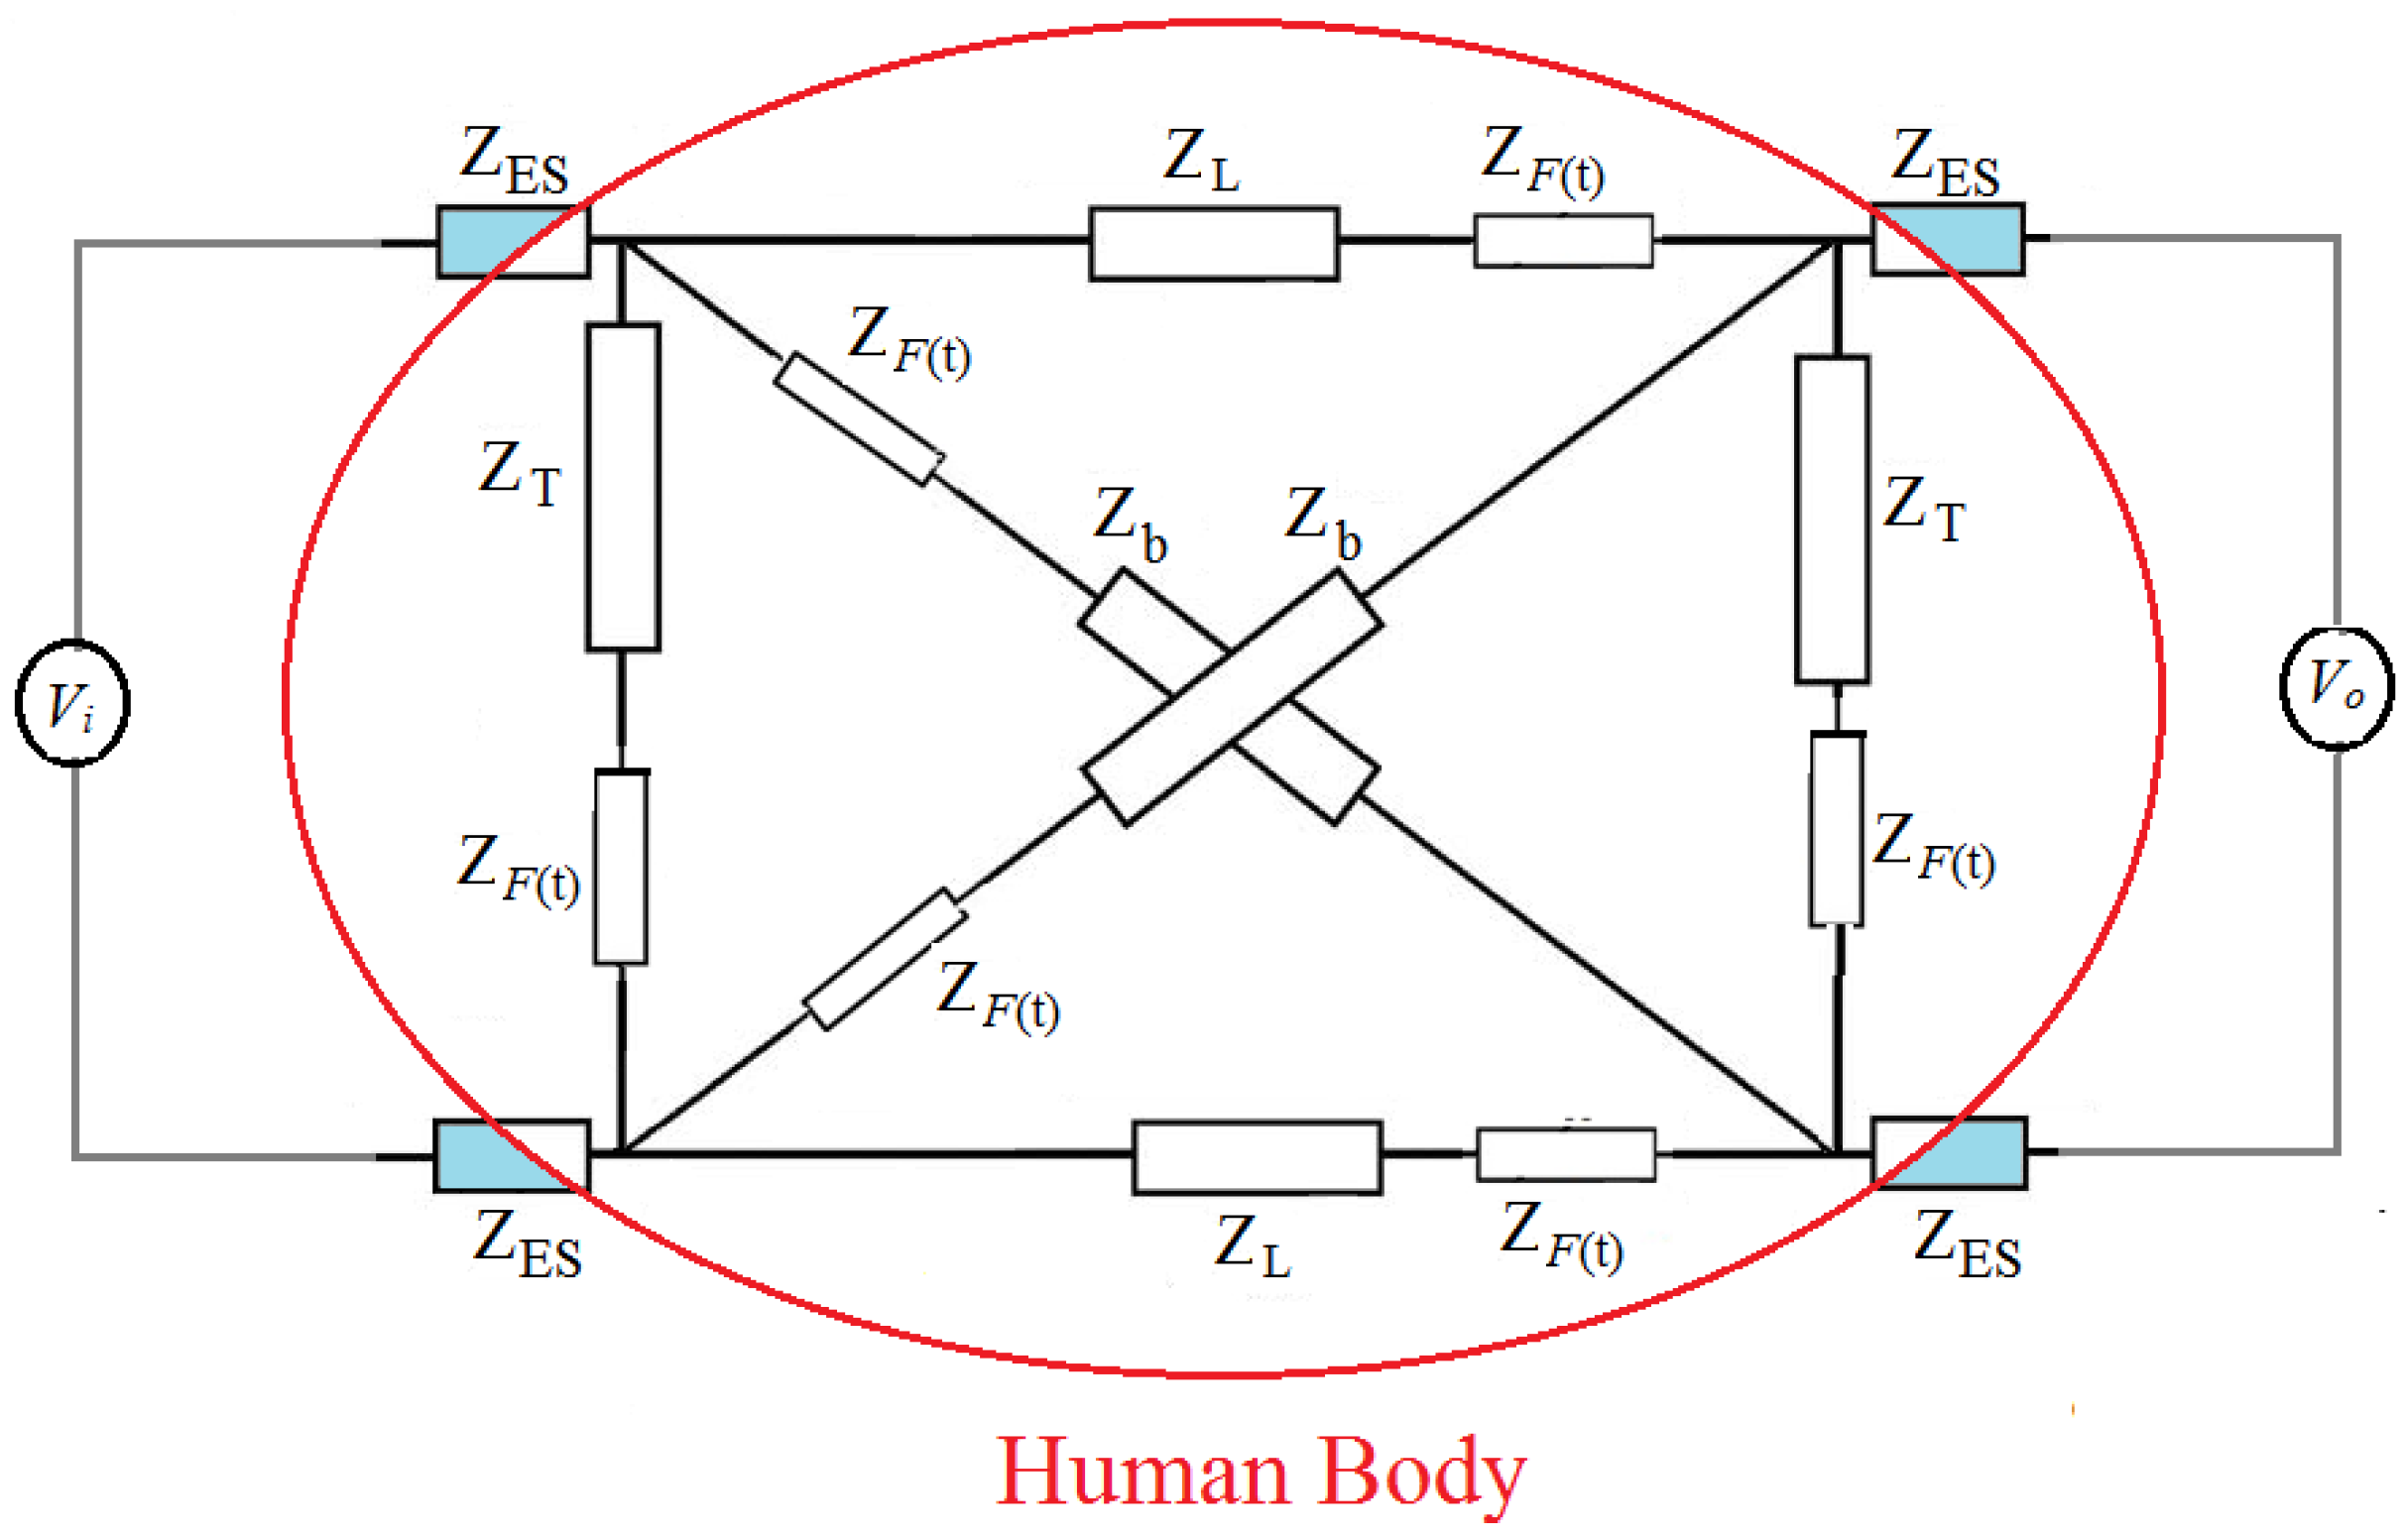
In a previous work, Asogwa et al. [20] showed that galvanic coupling signal propagating through the body changes as the body fluid level changes. Therefore, the attenuation can track changes in the amount of body fluid in real time using the circuit in Figure 1. The observed changes in the attenuation of an electrical signal passing through tissues can aid the diagnosis of body fluid disorder, such as lymphoedema. Thus, we modelled the propagation of an electrical signal passing through human tissues based on the input signal frequency, electrode-skin contact impedance [21], tissue dielectric properties [22], the human body physiological parameters [23], real-time dynamic changes in body fluid level [20] and the internal metabolic activities of an individual [24].
From Figure 1, corresponds to the impedance of the contact interface to the body at the transmitter and the receiver nodes, the transverse impedance, while is the cross impedance. is the transmit voltage, while is the output voltage at the receiver end with load . is the variable fluid impedance, and is the longitudinal impedance of the transmission path consisting of the skin, fat, muscle, bone, body fluid, cortical bone and bone marrow. If the overall impedance of the body varies in proportion to changing body fluid level by hydration or dehydration, then after fluid intake, as hydration occurs, the impedance of the body fluid decreases and causes a corresponding decrease in the signal attenuation of the electrical signal passing through the tissues. It has been stated that dehydration causes up to a 6% increase in muscle impedance [19]. Our predicted time-dependent impedance of the body fluid follows Equation (1) [20]:
where t is the time for the change in impedance to occur, is the impedance at time t = 0 just before hydration begins, is time to reach the state of water balance (hydration discontinues), is the impedance resulting from the water flowing in into the tissues and the ratio is a characteristic that predicts the rate of flow. is the time constant that characterises a particular individual.
From Equation (1), if the fluid level is relatively stagnant, the observed changes in attenuation(negative gain) would also be relatively invariable.
Therefore, after time interval :
is the impedance form for non-varying fluid level. Movement of body fluid due to hydration or dehydration causes tissue impedance to decrease or increase accordingly. Thus, if the body fluid flow is partial or insignificant over a period of time, the change in impedance would be partial or insignificant, and if the fluid flow stops, it would assume a static fluid model; and tissue impedance would be theoretically constant.
Therefore, if we denote as a set of the signal gain measured, from intervals. the average at is:
and = average value of the mean across time at a particular frequency. The variation across time from :
We propose that the value of gives us a time value of the signal variations in attenuation due to fluid flow and theorise that a high value of means a high deviation of the attenuation about the mean, which signifies normal fluid flow, while a low value of indicates low movement of tissue fluid on the measured area of the body. We shall investigate this proposition on both healthy and lymphoedema affected subjects. Since the response of each tissue component to electrical stimulation depends on the tissue’s dielectric properties, the conductivity would vary in accordance to the changes in ionic concentrations or movement at that frequency. This is because conductivity is proportional to the movement of the body electrolytes. If body fluid is not circulating properly, for example, due to lymphatic damage, ions accumulate under the skin. However, if the fluid is flowing, internal metabolic processes and physiological process would cause the concentration of the ions in time to vary randomly. The average change in time of the conductivity would vary partly due to intermittent hydration occurring or dehydration and or processes leading to body water homoeostasis balance [25]. Water appears in plasma and blood cells 5 min after consumption [26]. Thus, we theorise that a stagnant body fluid would have relatively lower deviation from the mean value of the attenuation observed in time, assuming other variables are also constant. Ideally, this implies that the average rate of change of signal attenuation can be used to diagnose, identify or monitor fluid accumulation or discharge in human body tissue inflammations, such as lymphoedema.
3. Experiments
3.1. Clinical Measurements: Pathological Lymphoedema Participants
Subjects were recruited in collaboration with the Lymphoedema Association of Victoria (LAV) with flyers advertised in LAV’s news letter and placements at the TSLclinic, a lymphoedema clinic specializing in compression garments. Participants were given time to read and sign the ethics form prior to the commencement of the experiment and are also required to provide medical evidence of a pathologically-diagnosed lymphoedema on the limb. Two groups, healthy and unhealthy participants, participated. Five subjects labelled L1–L5, who were diagnosed with unilateral lymphoedema, on the arm and one on the leg, participated in this study, and measurements were conducted at the TSL clinic. The healthy participants labelled H1–H4 had no previous diagnosis of lymphoedema and from observation had no swollen limb, but will be checked with CLM. We took CLM at fixed intervals on three different days. On the affected subjects, we measured the contralateral positions of the arms by marking both arms at 10-cm intervals from the wrist to the head of humerus. We classified two major areas, the mid-point of the ulna as the lower arm and the upper arm as the mid-point of the humerus of each participant. Subject with lymphoedema on the leg was measured along the longus muscle. Participant’s weight and height, lymphoedema diagnosis and current medication were recorded. Subjects wore light clothing and were bare-footed. Subject’s height was measured to the nearest 0.5 cm against the wall bare-footed and heels together with buttocks, shoulders and head touching the vertical wall surface and clear horizontal marking sighted. All measurements and records were made with the consent of the participant.
3.2. Clinical Measurements: Healthy Participants
A similar protocol was adopted for healthy volunteers, except the choice of the venue for the experiment. Participants were to choose between the university laboratory and their home. The condition for using the living room is to turn off all electronic appliances and any other potential sources of noise. The average room temperature was maintained at C throughout the experiment, as explained in Section 4. Four subjects participated in this test. We recorded the weight and the CLM, ensuring that the same position was measured on both arms similar to participants with lymphoedema.
3.3. Galvanic Coupling Measurements
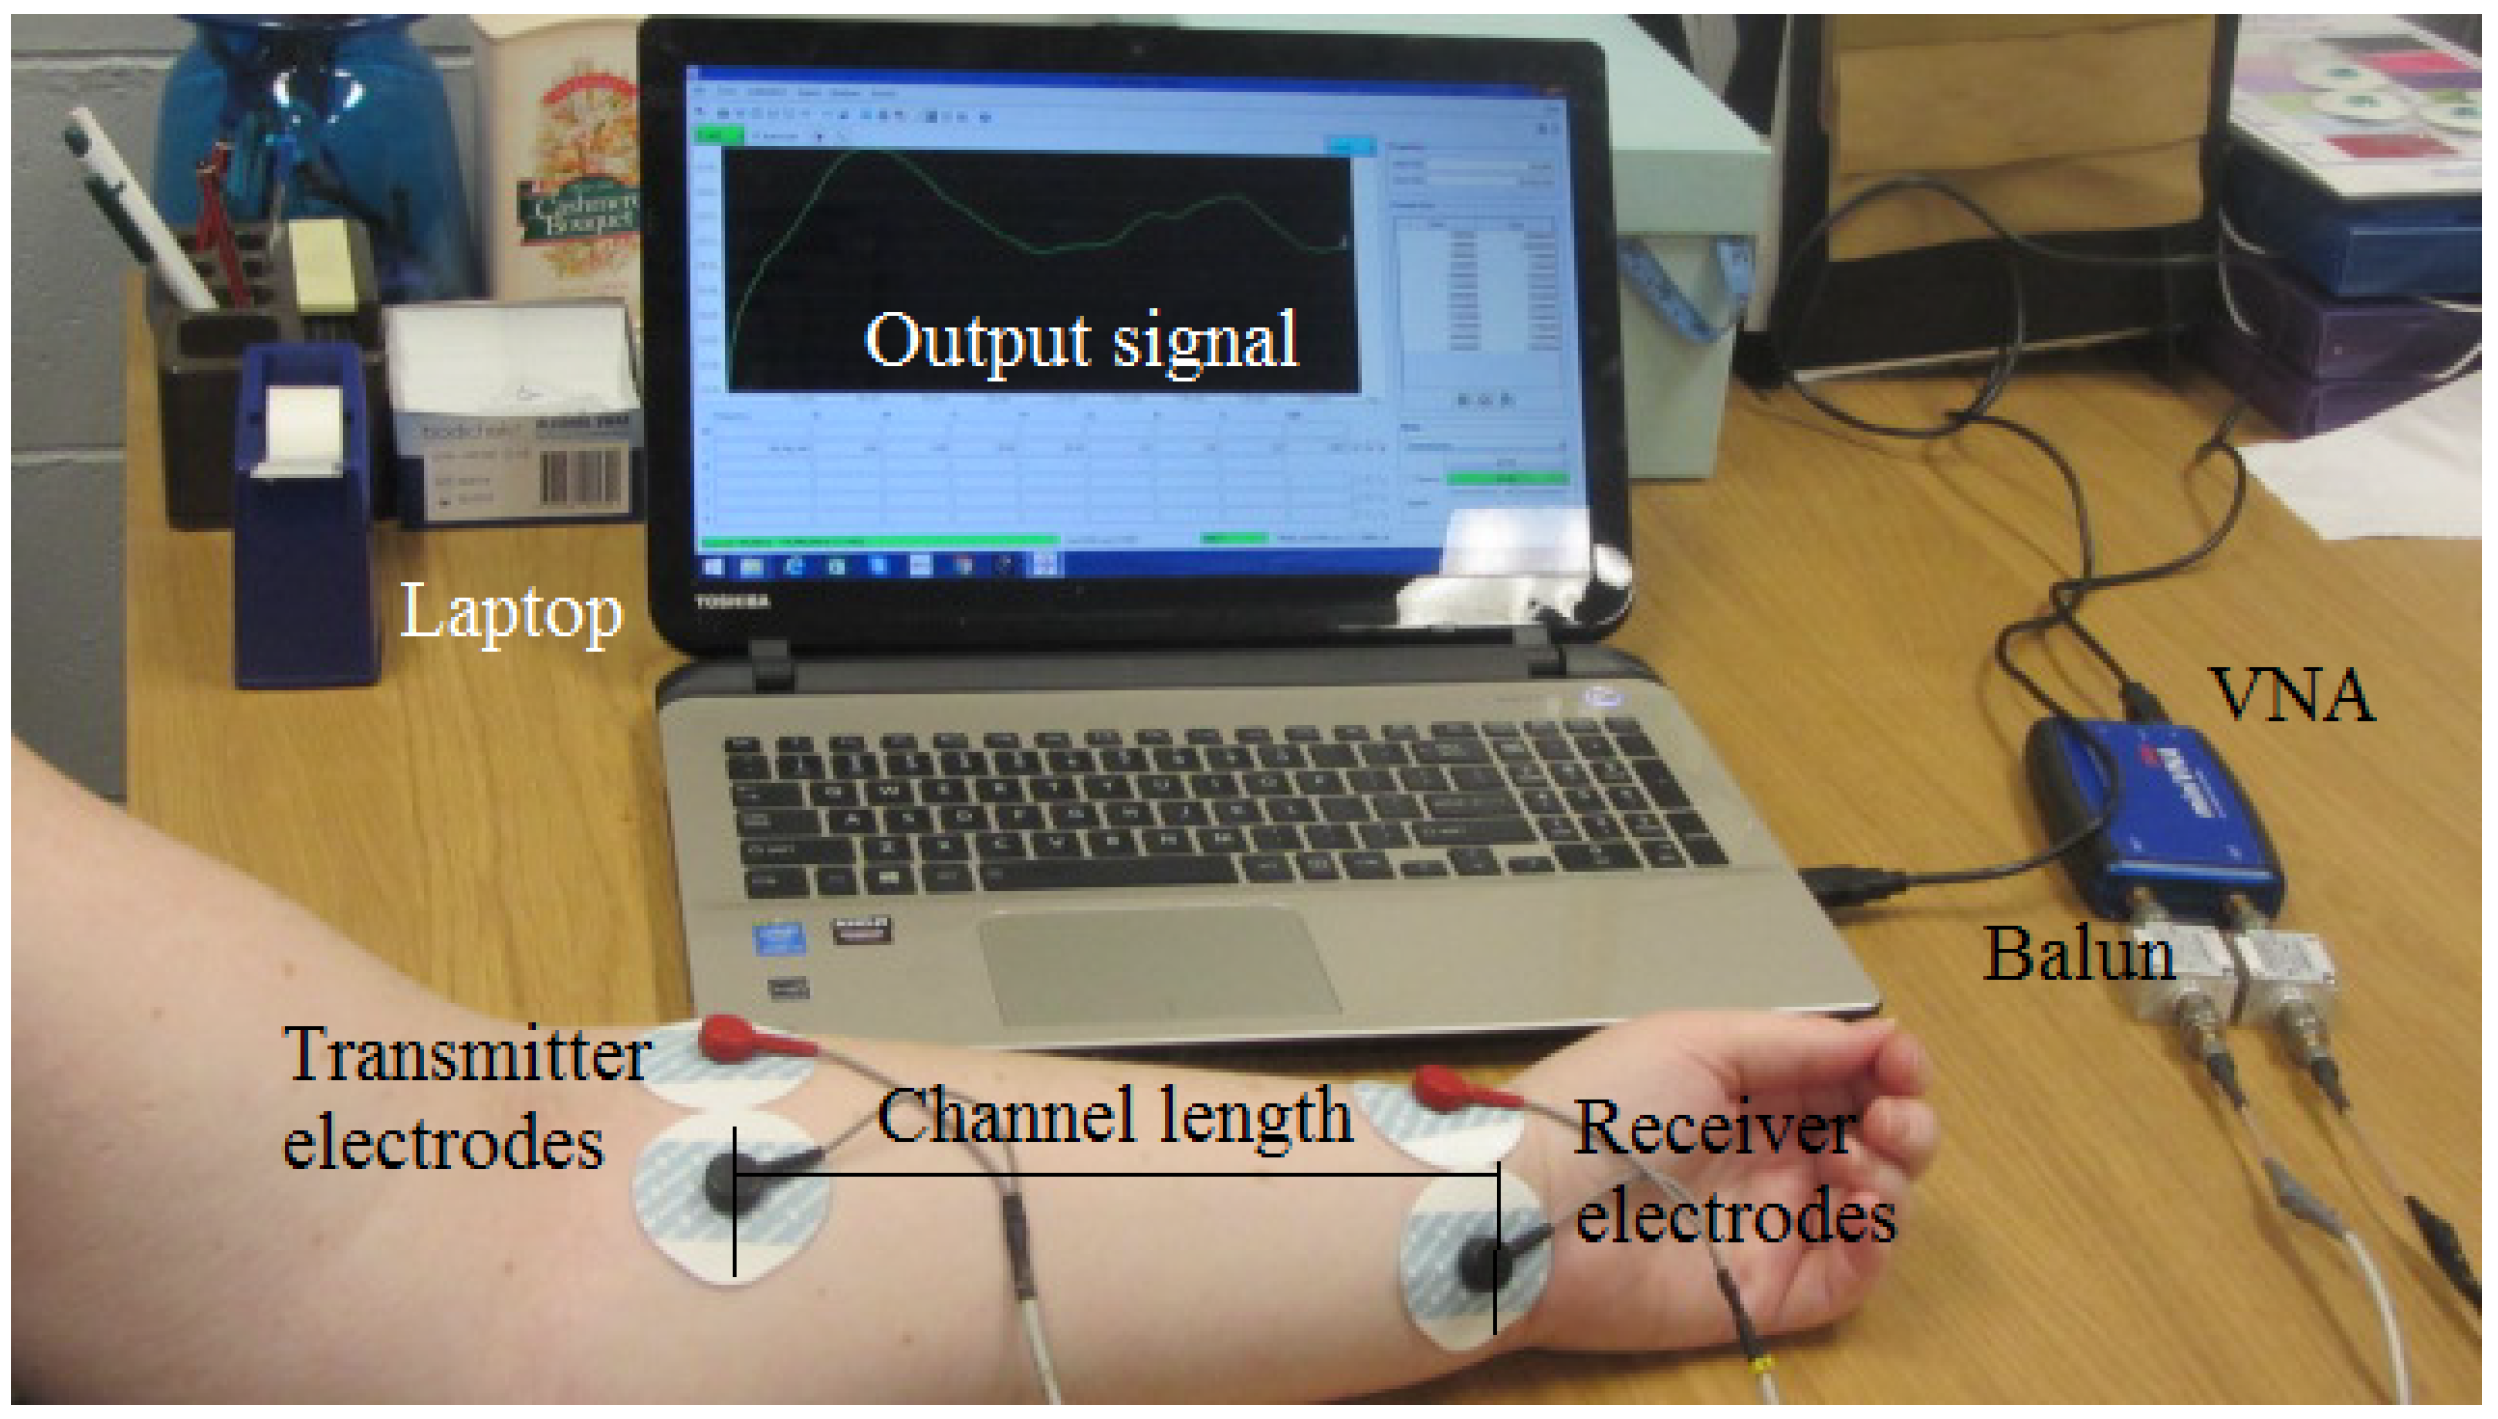
The galvanic coupling measurement procedure was the same for both healthy and unhealthy participants. Measurements were taken first without fluid restriction on Day 2 and after drinking following fluid restriction on Day 3. The measurement set-up as shown in Figure 2.
A mini Pro VNA, frequency range 100 kHz–200 MHz, manufactured by Mini Radio Solutions, baluns (Coaxial RF transformers, FTB-1-1+, turns ratio of one, manufactured by Mini-Circuits and bandwidth 0.2–500 MHz) and round pre-gelled self-adhesive Ag/AgCl snap single electrodes (1 cm diameter, manufactured by Noraxon Inc., Scottsdale, AZ, USA) were used. The baluns were used to electrically isolate the two ports of the VNA to ensure that the return current does not couple capacitively through the common ground. We measured 2.7 dB as the insertion loss of the balun, similar to manufactures specification of 2.0 dB between 800 kHz and 1.3 MHz. The VNA is set to sweep the constant interval frequency of range 300 kHz–200 MHz at 49 points with 0 dBm output power. Our frequency range lies between 800 kHz and 1.3 MHz, which matched those used in bioimpedance spectroscopy for whole-body fluid analysis [27], and lies in the region associated with the biological structure of living organisms. It has been stated that after ingestion, a propagating galvanic coupling signal would have maximum signal gain occurring between 900 kHz and 1.1 MHz [28]. Furthermore, this frequency falls within the range necessary to prevent radiation and human body antenna effects while ensuring good signal penetration into tissue spaces [22]. This frequency range lies within the safety limit set by the International Commission on Non-Ionizing Radiation Protection (ICNIRP, 1998) [29]. The Noraxon self-adhesive silver/silver-chloride electrodes (Ag/AgCl) are preferred because they are designed for both research and clinical use, contain hypoallergenic gel and can be used for two hours of measurement. They have better resistance to motion artefacts and refection compared to polarizable electrodes [30]. The distance between the transmit and receive electrodes is fixed to 20 cm. A sterilized hand glove was worn to ensure no direct skin contact with any of the subjects throughout the experiment. Nine subjects comprising 5 lymphoedema patients and 4 healthy individuals participated in the experiment. Subjects were asked to sit on a plastic chair with arms by the side to ensure the current was confined within the arm and avoiding external physical contact. All of the participants were told not to move as much as humanly possible. The measured arm resting on a wooden table (Figure 2) was insulated to ensure no current leakage and to ensure movement artefacts were minimized. The signal gain was measured 5 times at 3-min intervals, and the average was used. The experiment lasted for 30 min. Two separate experiments were conducted with the galvanic intrabody method; first, without fluid restriction and, second, with fluid restriction each on different days. Subject L5 was excluded on the third test, which required fluid restriction due to high blood pressure medication [31]. Fluid abstinence increases blood plasma concentration [32], which might affect blood pressure. On the third day, subjects were asked to abstain from fluid after supper till 10.00 a.m. The limb circumferences were again measured, and 350 mL of water were given to each subject to drink. five minutes were allowed for water to circulate into the body before measurement began [26]. This time, because of the initial fluid restriction, measurements were recorded for 20 min only to encourage the concentration and measurement of both arms were done simultaneously. Interference and background noises were minimised by switching off electronic devices and wireless systems around the vicinity. We also isolated communication cables away from power packs, and the laptop operated at battery mode. Since individual metabolism is different at different times of the day, we ensured that all measurements were done at 10.00 a.m. and that the average room temperature was maintained at C. Repeated measurements were taken and the average used to minimise measurement uncertainties. Measurements of healthy participants followed a similar procedure. All of the experiments followed the ethics procedures mandated by the Victoria University Human Ethics Research Committee.
4. Results
Table 1 lists the circumferential limb measurements on lymphoedema affected participants measured within six weeks on three random days, while Table 2 is similar measurements on the healthy participants.
Subjects L1 and L5 have unilateral lymphoedema on the left arm, while L2 and L4 have unilateral lymphoedema on the right arm. Subject L3 however has unilateral lymphoedema on the left leg. From the table, circumferential measurements on L1 BMI = 31.7 kg/m had a 13.0% increase in limb size on the upper limb, while the lower limb was larger by 29.6% on the first day of measurement. Repeated measurements on the second and third day showed little difference in CLM measurements and BMI. The affected limb consistently had a more than 10% increase in limb size on the upper limb and 29% on the lower limb in comparison with measurements on the contralateral limb. This ratio agrees with the standard classification for lymphoedema diagnosis [11] (the presence of oedema on a swollen limb if more than 10% greater than the contralateral unaffected limb). Similar observations were made on all of the other subjects, as well as differences in their body mass indices. L2 with BMI 31.3 kg/m has an affected upper limb greater than the contralateral limb by 27.5%, while the lower limb is greater by 11.1%. L3, BMI 29.1 kg/m, has the affected left leg greater in size than the contralateral right leg by 14.5%. L4 BMI 31.7 kg/m has the affected lower arm greater by 10.7%, but increased on Day 3 to 21.5%. The CLM measured on the affected upper limb of subject L5, BMI 24.5 kg/m, was 16.7%, while the affected lower limb was 9.7% greater than the contralateral part. Again, a repeat of the procedure on the healthy subjects (Table 2) provided a maximum ratio of 6.7% on the upper limb and 5.3% on the lower limb of subject H1, BMI 29.0 kg/m, while in subject H2, BMI 23.4 kg/m, the upper right limb is greater than the healthy left limb by 5.3% and the lower limb greater by 4.8%. Similar results were obtained on subjects H3 and H4. The data from the unhealthy and healthy participants reconfirm earlier pathological diagnosis of oedema on the lymphoedema affected participants and the absence of oedema on the healthy participants.
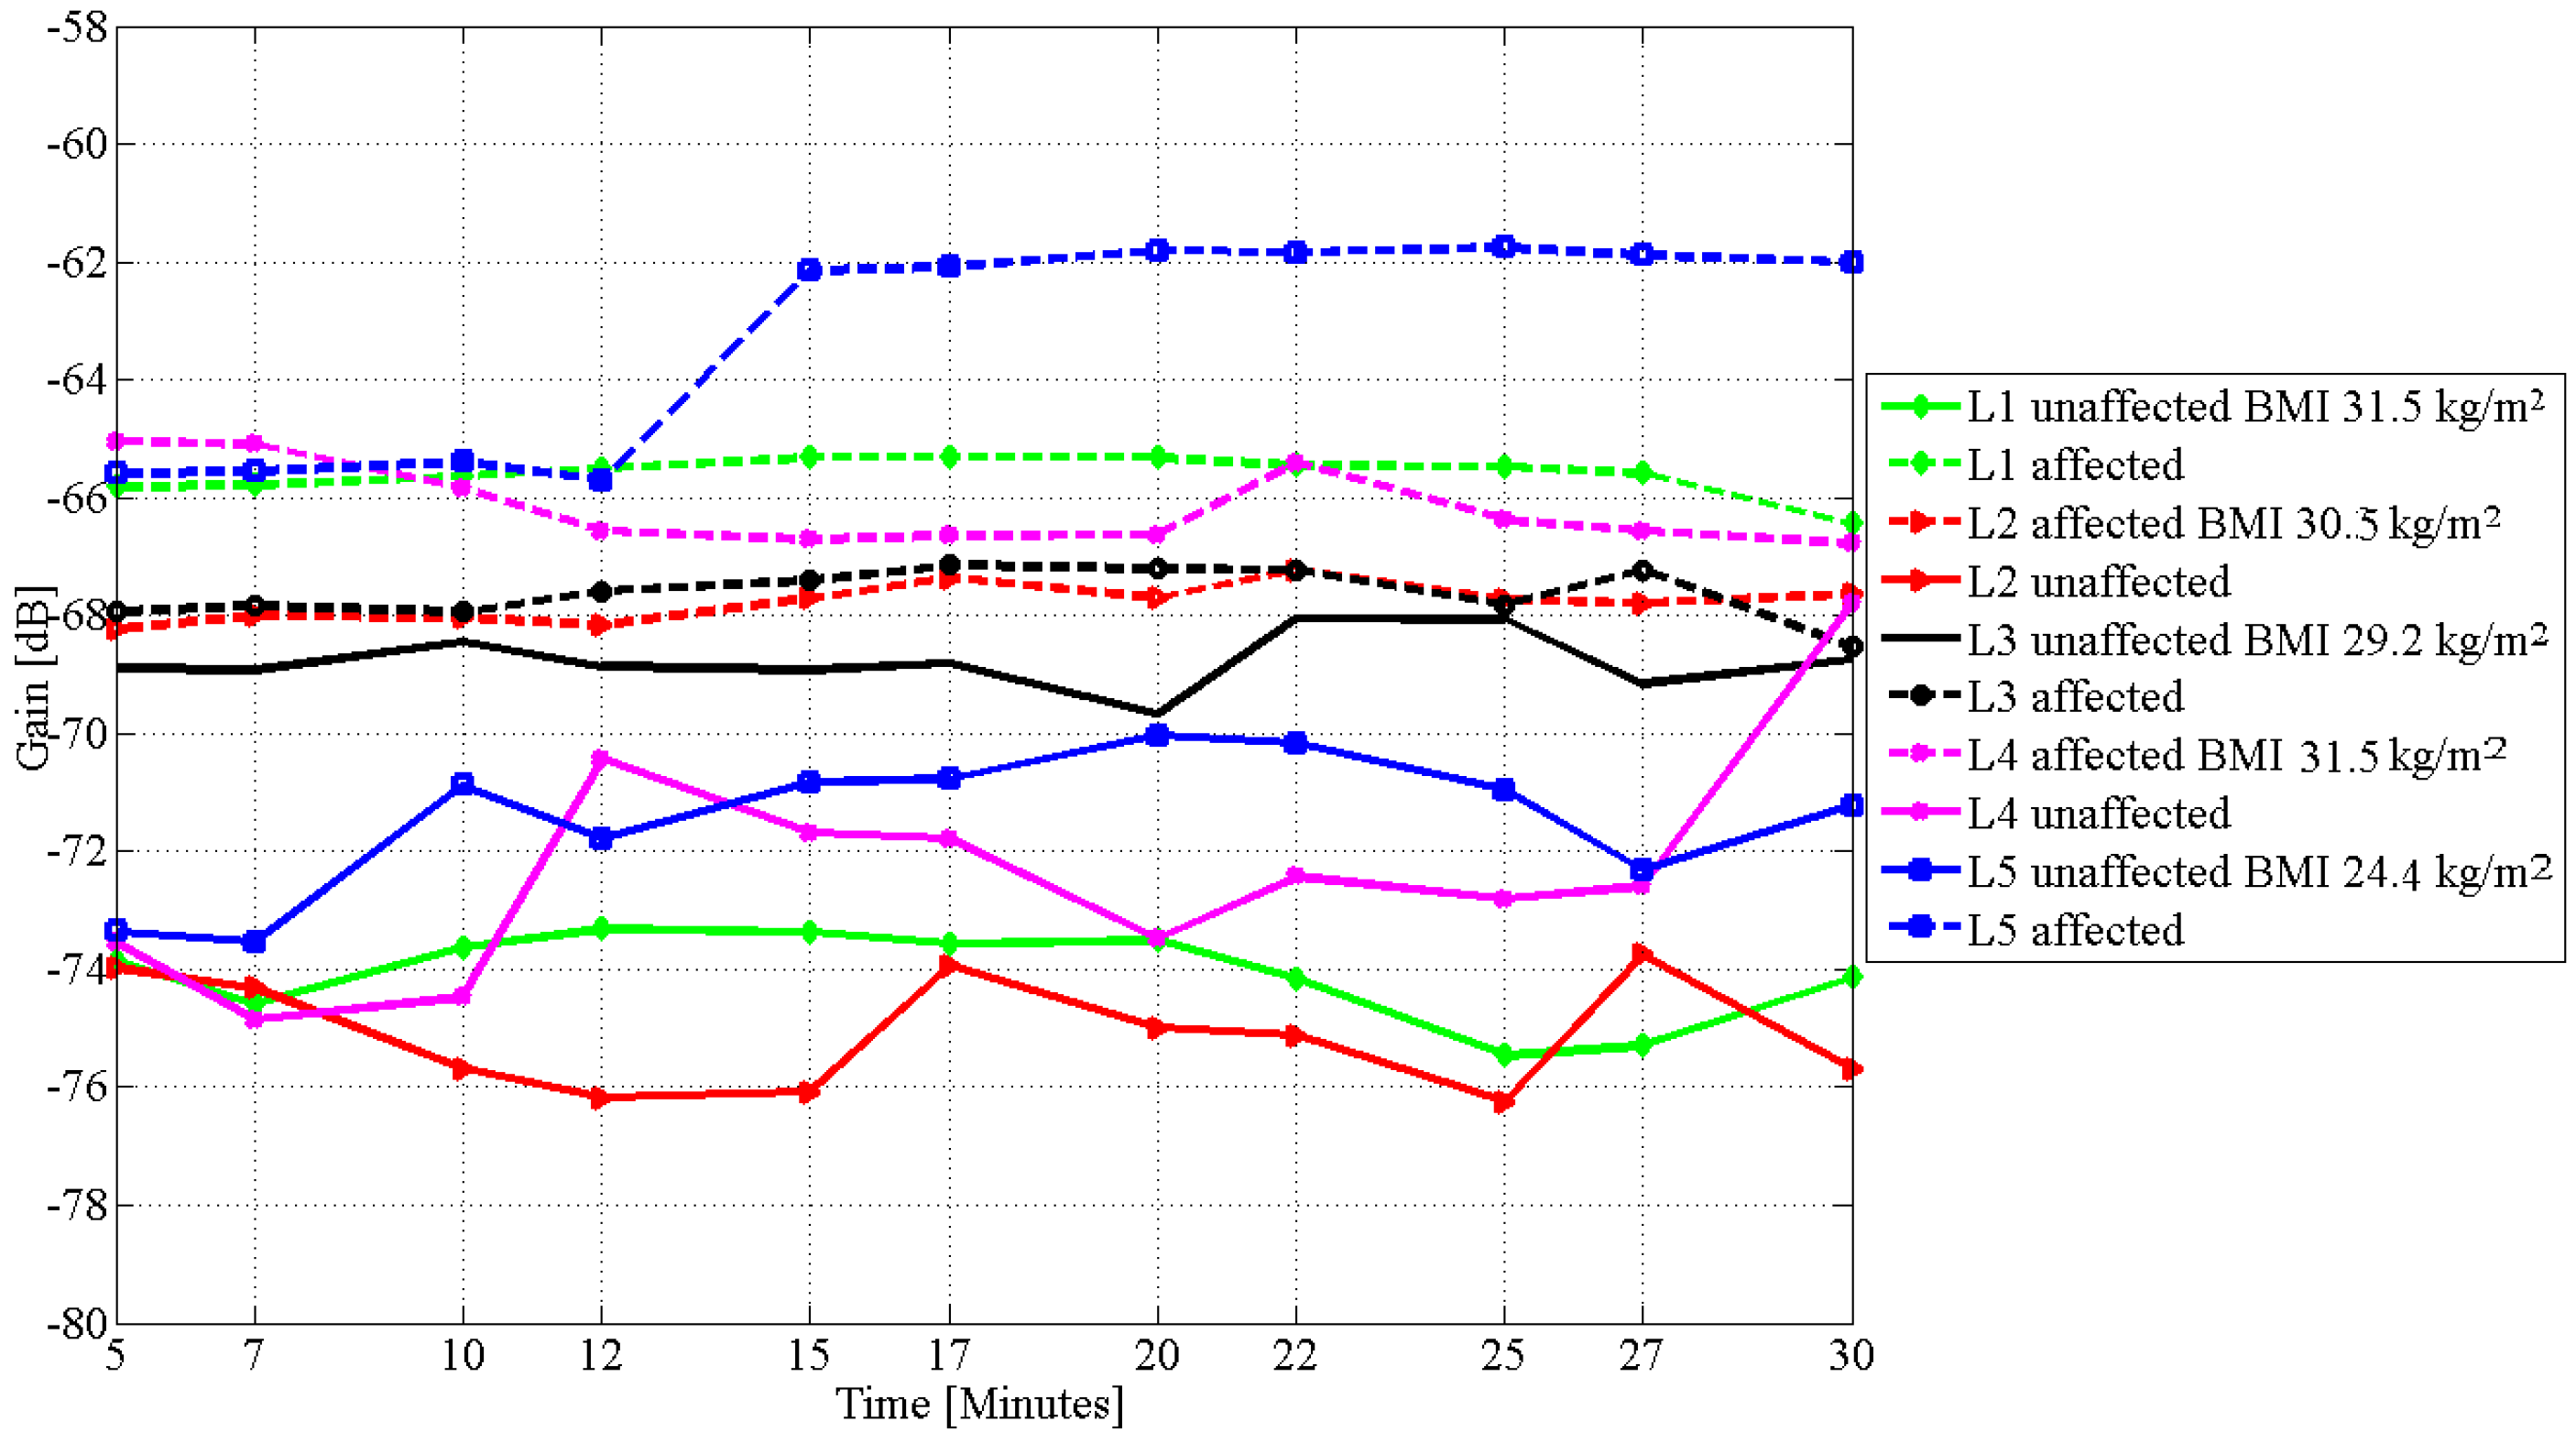
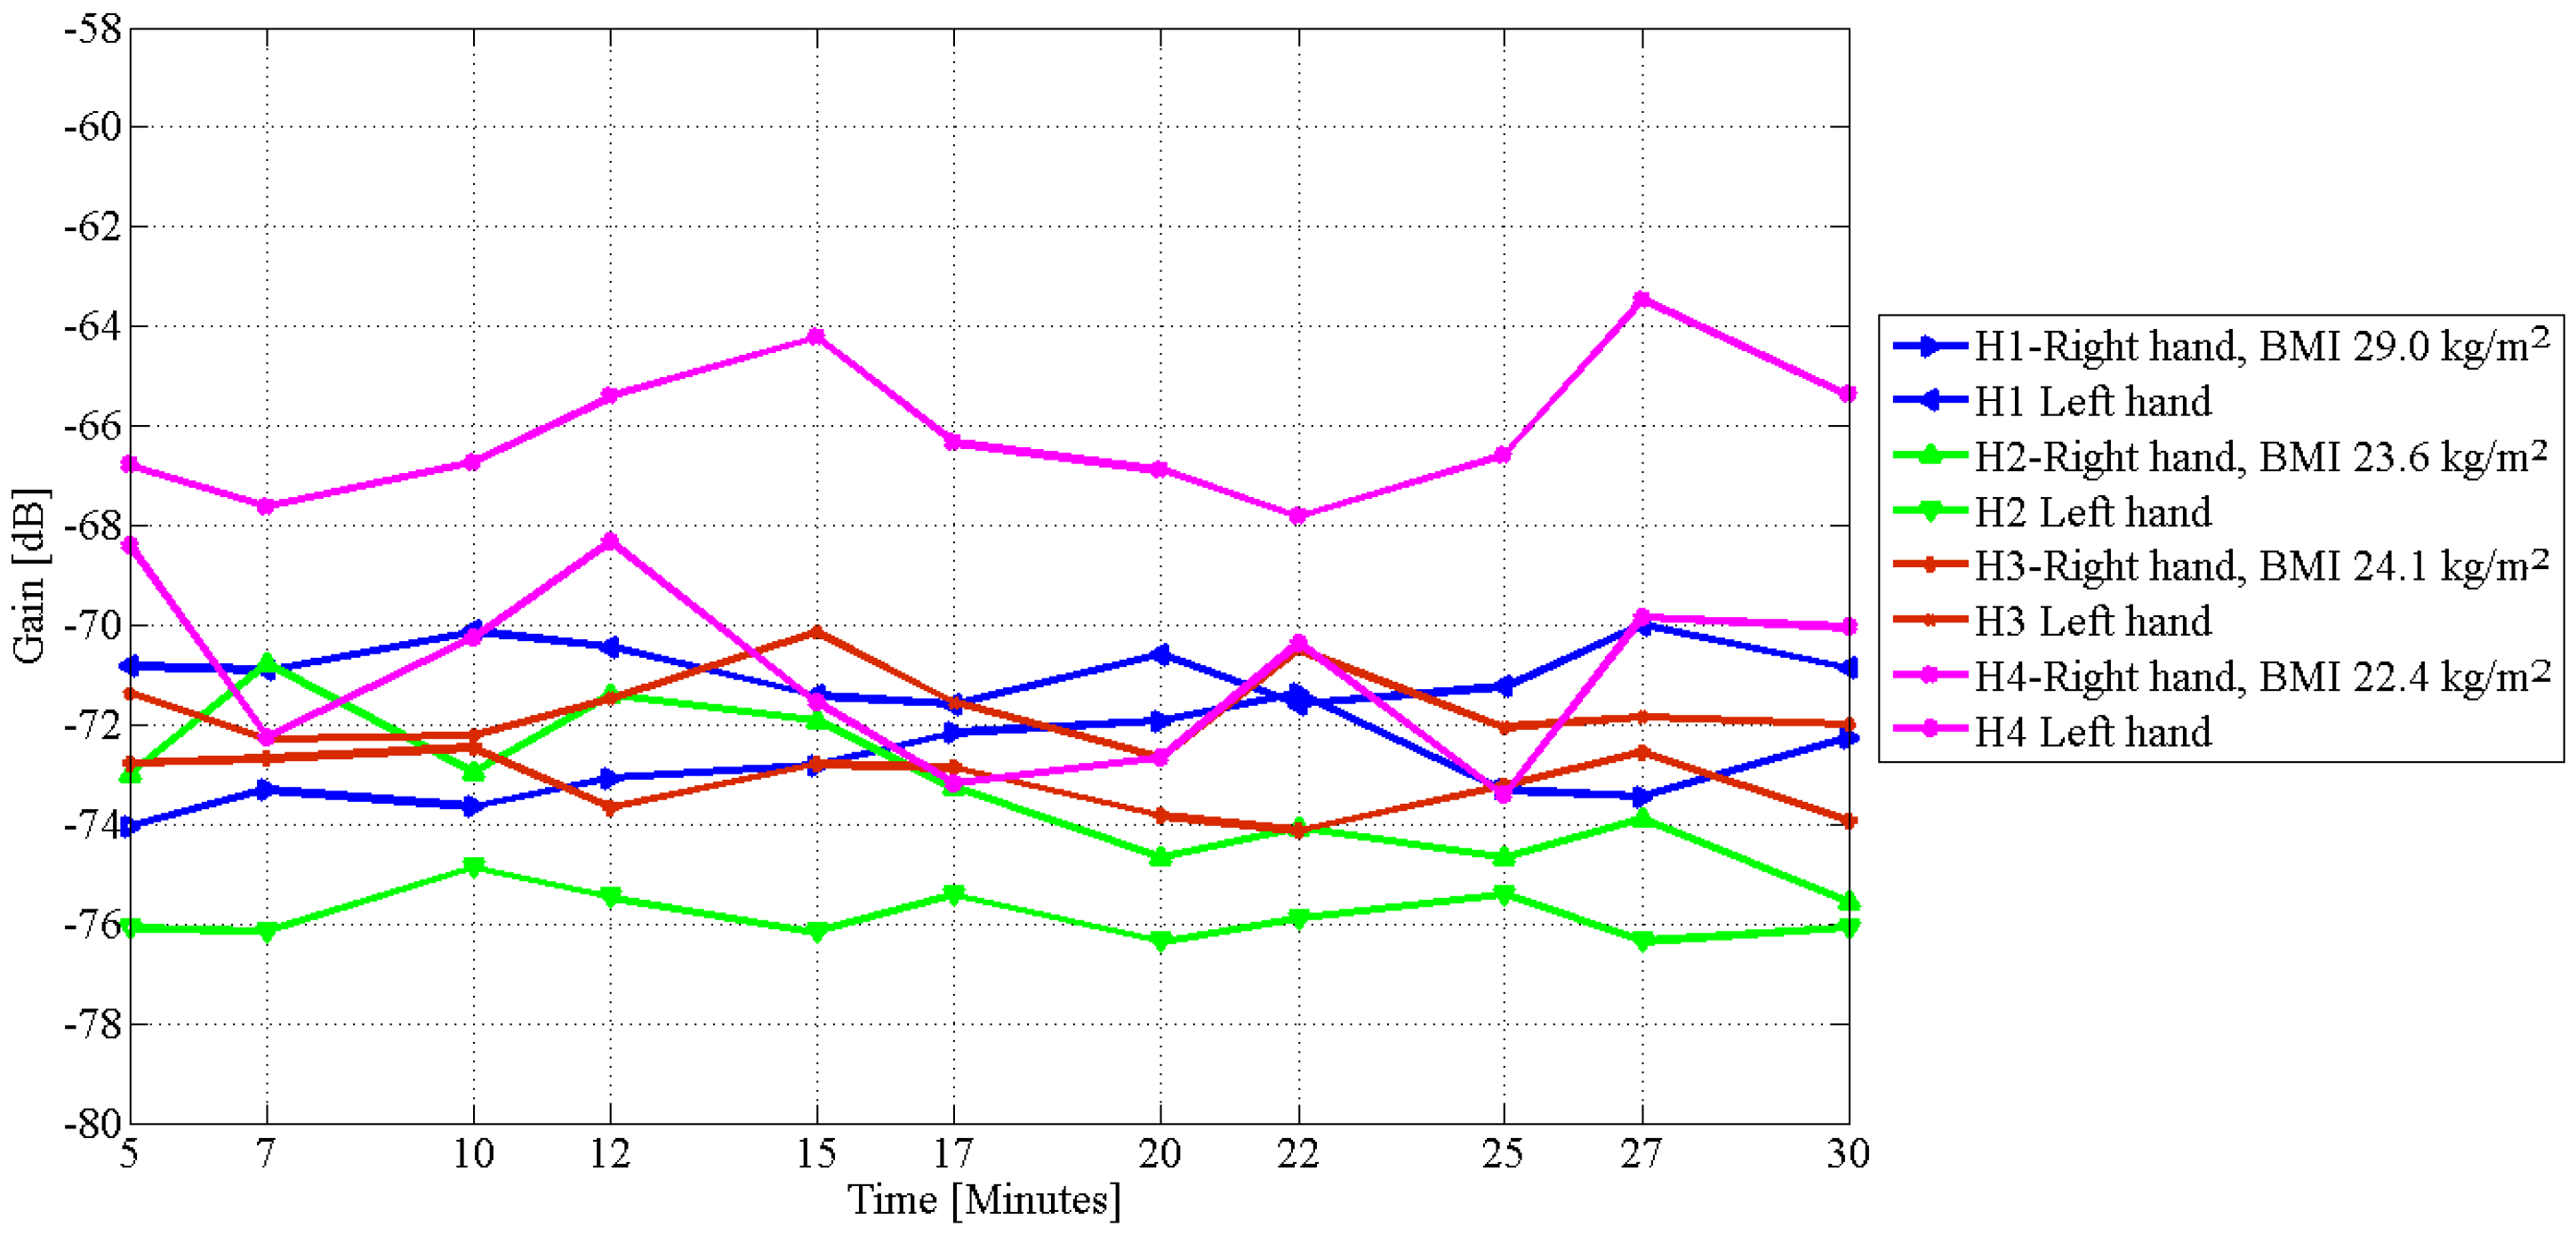
Figure 3 depicts the result of the galvanic measurement on lymphoedema affected subjects without fluid restriction, and Figure 4 is the galvanic measurement on healthy subjects without fluid restriction. Similarly, Figure 5 is the result after ingestion of water that followed a 10.00 p.m.–10.00 a.m. fluid restriction. The results show that limbs affected with oedema had higher signal gain or lower attenuation than the unaffected limbs without bias by fluid restriction, and subjects with high BMI usually had higher signal attenuation on the unaffected limbs than the unaffected limbs of subjects with low BMI. Signal gain before fluid restriction on the pathologically diagnosed limbs of subjects L1–L5 is between −65.0 and −68.0 dB, while the gains measured on the unaffected limbs are between −69.0 and −74.0 dB. Similar measurements on both arms of the healthy participants (Figure 4) were on average between −71.0 and −76.0 dB, except for subject H4, which may be due to the subject’s low BMI value and hydration.
Table 3 shows a comparison of the difference in CLM measurements between the affected and the unaffected limbs and the average difference in the gain of a galvanic signal passing through the unaffected and affected limbs. Subjects with a high difference in CLM also had a high difference in the magnitude of the signal, and subjects with high BMI had higher difference in the amplitude of the signal between the affected and the unaffected limbs.
An observation of the rate of flow shows a near steady rate of 0.05 dB/min in the first 25 min measured on subject L1, with maximum change occurring between 25 and 30 min at the rate of 0.26 dB/min on the lower limb of the lymphoedema affected arm. Similarly, the corresponding measurement on the contralateral limb, the unswollen lower limb of the same subject, showed a constantly changing signal gain with rates doubling the flow rate on the affected arm from 0.09 dB/min in the first 15 min to 0.42 dB/min in the next half of the experiment period. A similar observation was also made on subject L2. Measurements on the affected leg (subject L3) showed that the signal changed slowly at the rate of 0.07 dB/min on the affected leg, while the rate on the unaffected leg is about 56% more than the rate on the affected leg similar to observations on the arm. A comparison with the observation on the healthy subjects (Figure 5) shows more randomness in the signal gain on both hands of all of the subjects. Subject L5 was not permitted to continue in further testing, because he was medically at risk. The result on subject L5 (Table 4) suggests the possible effect of his medication on our measurements.
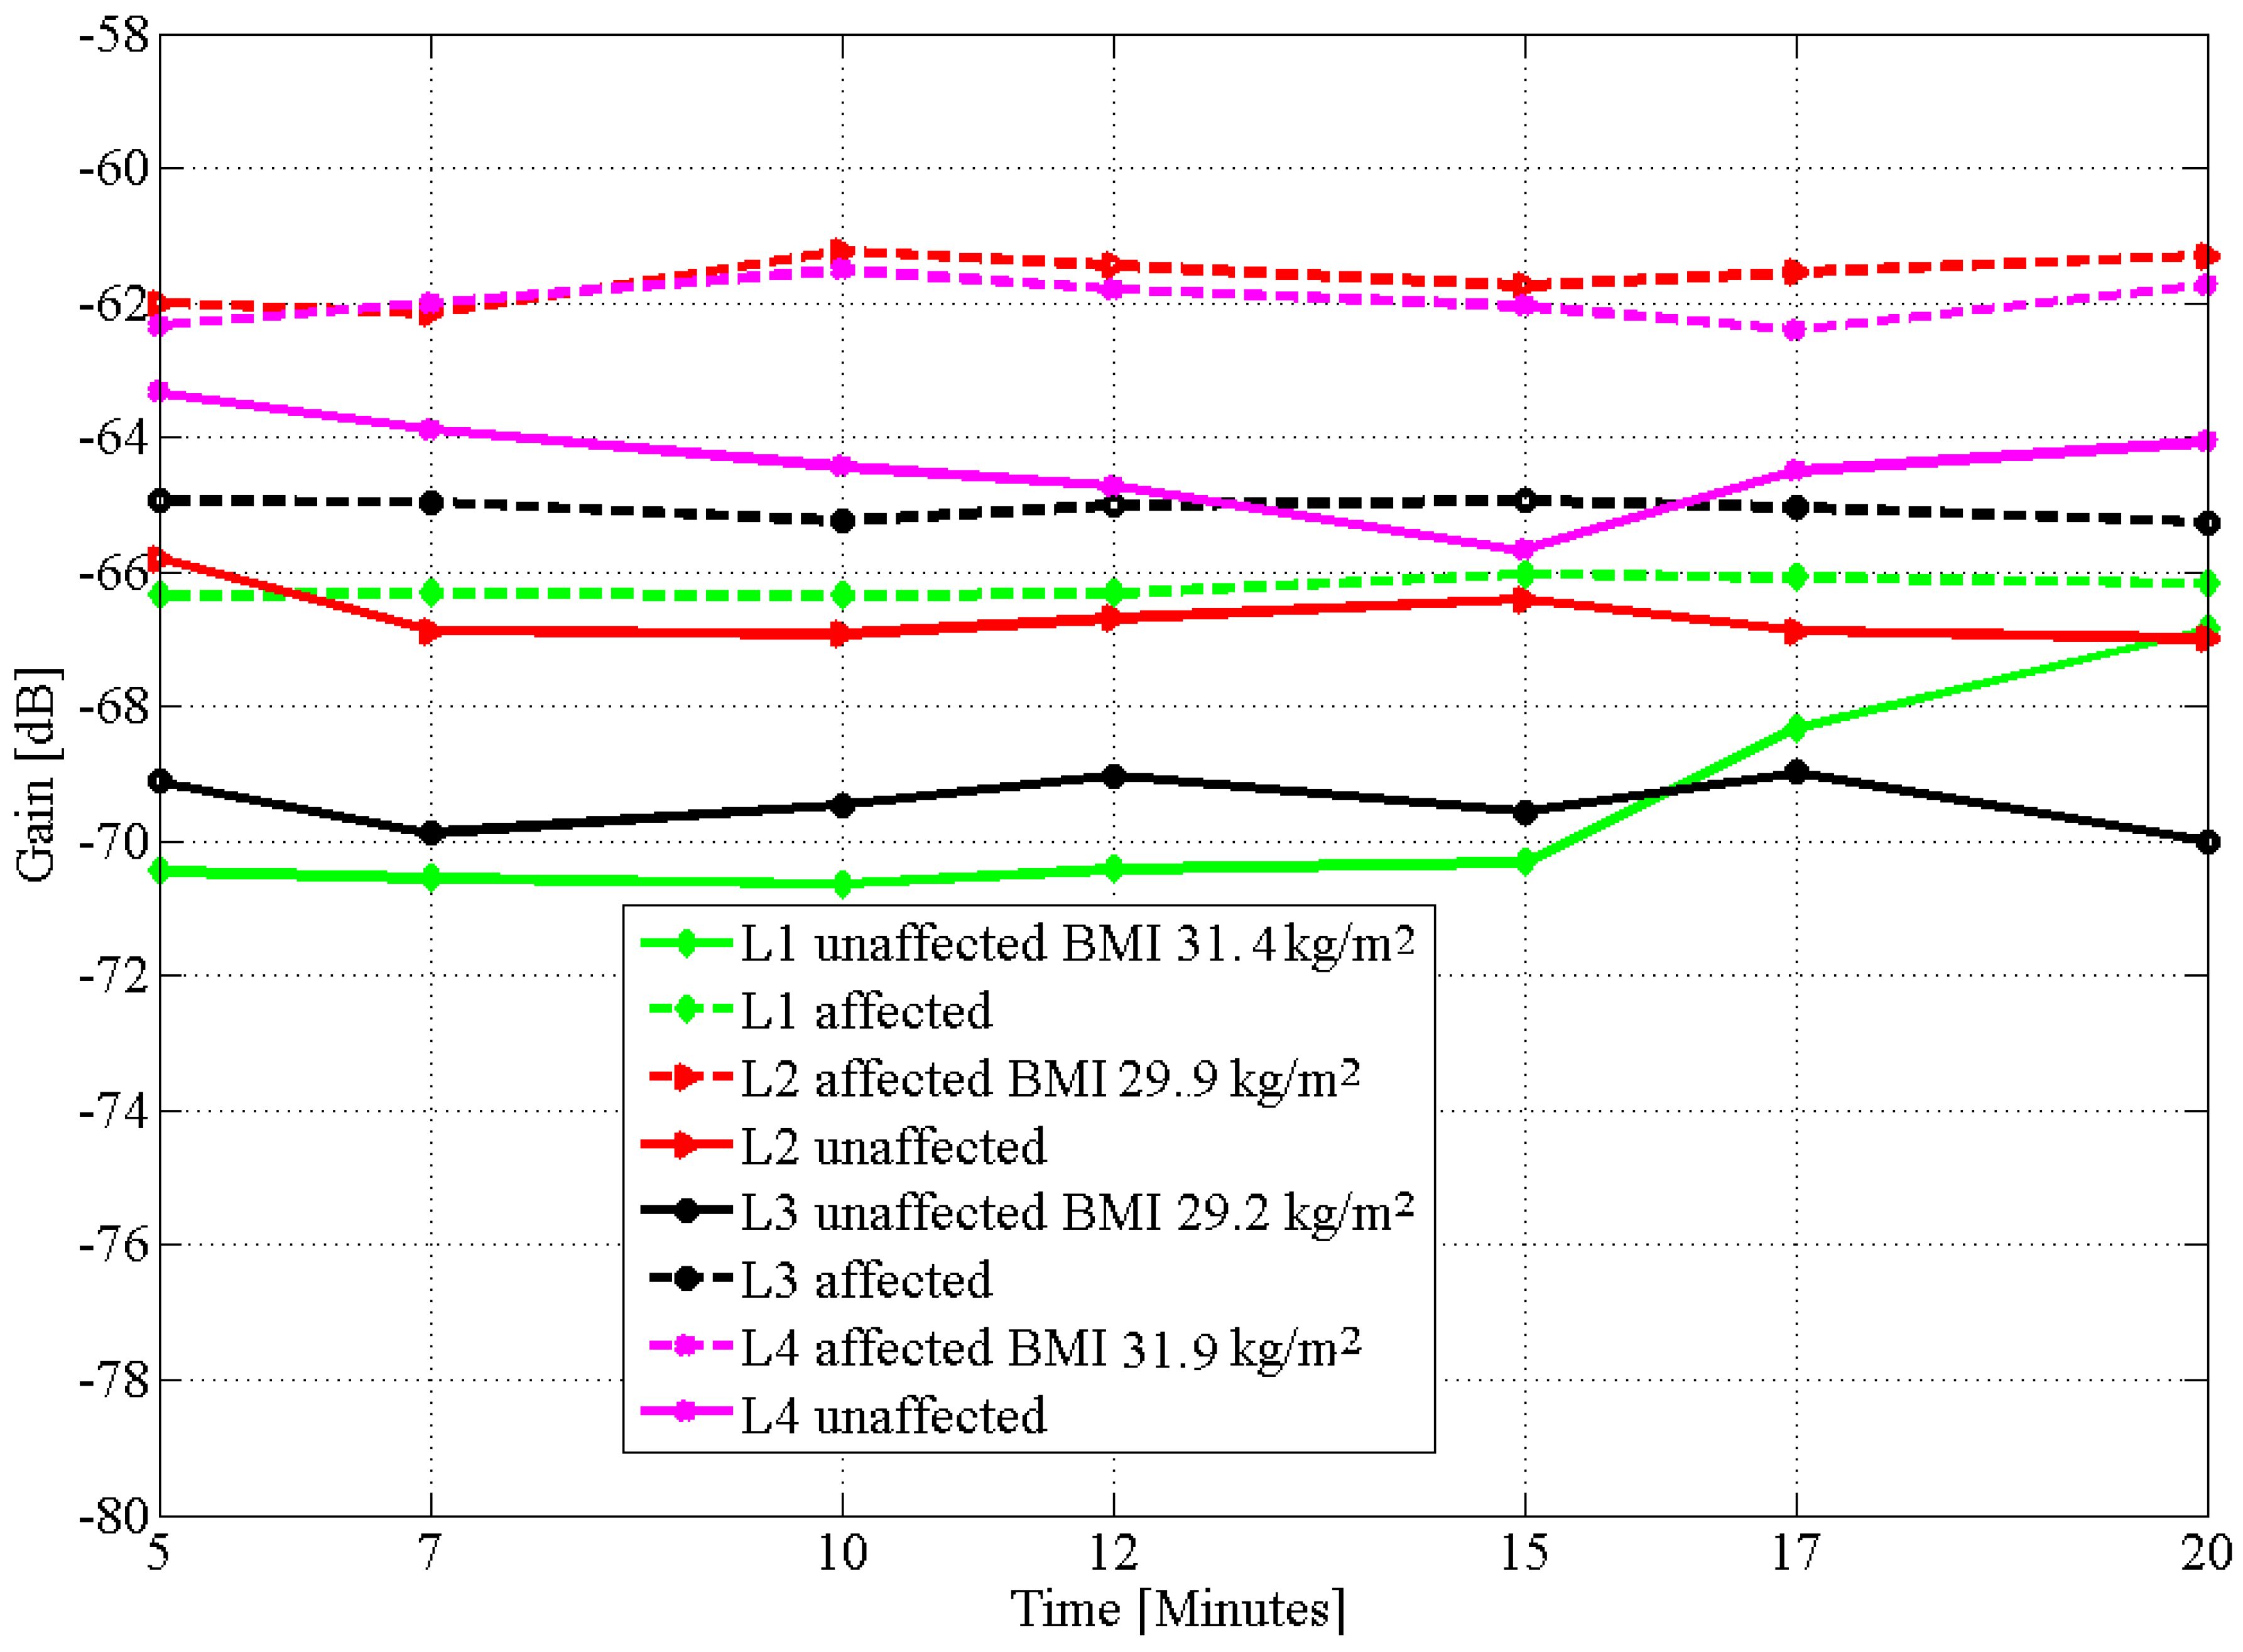
Figure 5 is the graph of the time-varying changes in signal gain with our galvanic measurement recorded after fluid restriction and intake of water. The differences between the graphs of the affected and the unaffected limbs are clear and explainable. In Figure 5, measurements started 5 min after fluid intake and lasted for 20 min. Fluid restriction before consumption was to induce initial dehydration, which would accelerate absorption and possible flow after fluid intake. Again, the result showed a near zero rate of change on the affected lower limb and 1.83 dB/min on the contralateral limb of the unaffected arm on subject L1. Subjects L2, L3 and L4 recorded 0.37, 0.15 and 0.35 dB/min on the affected limbs and 0.82, 0.44 and 0.83 dB/min on the unaffected limbs, respectively. Measurements on the healthy subjects (Figure 6) was 1.22 and 1.32 dB/min on the left and right limb of subject H1 and 0.59 and 0.72 dB/min on both left and right limbs of subject H2 with a similar pattern occurring on subjects H3 and H4. The hydration trends of healthy limbs follow our previous findings and showed that after the intake of water hydration start and finish time differs per individual, and at time , hydration ceases to occur [33].
Table 4 and Table 5 are the deviations in time. After fluid restriction and ingestion of water, the rate of change in the signal gain was still more than 100% slower than the unaffected arm. Contrarily, the rate of change in the attenuation of the signal on the healthy subject, H1 for example, was 1.22 dB/min on the left limb and 1.32 dB/min, 8.2% between the two arms. Participants with lymphoedema affected disease had as much as a 55% difference between the affected and the contralateral part. Subject L5, besides lymphoedema, is treated for high blood pressure with amlodipine, a drug to increase the flow of blood [31], and was excluded from continuing with the experiment. The gain on his affected arm without fluid restriction was −65.59 dB, while the unaffected arm was −73.36 dB, as proposed in our theory. However, the change in attenuation at each point of measurement was possibly altered by the amlodipine medication.
5. Discussion
Galvanic coupling intrabody signal attenuation changes with the change in human body fluid state [20]. However, in body fluid disorders, such as lymphoedema, there is a notable fluid retention caused by leakage or lymphatic vessel damage that leads to accumulation or stagnation of fluid on the affected body part [34]. In this paper, we demonstrate that signal attenuation on a unilateral lymphoedema is low and the rate of change partial, indicating blocked or unnatural fluid flow. Our circumferential limb volume measurements on both arms and legs of lymphoedema affected subjects showed more than a 10% increase in the volume of the swollen limb. This phenomenon was pathologically diagnosed and characterised as unilateral lymphoedema four and a half years ago on subject L1, three years ago on subjects L2 and L5 and sixteen years ago on subjects L3 and L4. Subjects’ medical records showed that the differences in volume between the left and right limbs were a result of fluid retention on the upper and lower left limb. The accumulation implies that there is an imbalance between fluid production and circulation [2], which we investigated on the affected arm and leg of our subjects with our galvanic coupling circuit.
Firstly, without fluid restriction and, secondly, with fluid restriction, the quantitative difference between CLM and the difference in signal amplitude between the affected and the unaffected arms (Table 3) show that subjects with a high difference in circumferential limb measurement also had a high difference in the average value of the measured signal amplitude. This implies that in a unilateral lymphoedema, the technology could also measure the severity of fluid accumulation. The mean deviation of the signal attenuation in time for the pathologically diagnosed subjects as given in Table 4 shows 0.26 and 0.16 dB/min without and with fluid restriction, respectively, on subject L1. Similarly, the deviations on the contralateral right arm were 0.81 and 1.83 dB/min, respectively. By defining as the time variation of the signal attenuation, we theorise from Equation (5) that a low value of means partial or stagnant fluid flow, while a high value of implies high deviation from the mean, which suggests movement of body fluid. Results obtained with and without fluid restriction show low values of on the affected arm and a high value of on the unaffected contralateral arm on the subjects with unilateral lymphoedema. Values between 0.15 and 0.37 dB/min are low and are measured on subjects that have lymphoedema, while values between 0.60 and 1.83 dB/min are high and occurred on subjects who were not pathologically diagnosed with lymphoedema. Table 5 is the deviation in time on the left and right arm of healthy subjects with both subjects arms slightly differing by 20%. Thus, both results show partial fluid flow on the affected lower limb with rates about twice slower than the unaffected arm (Figure 4 and Figure 5). Low flow rates are associated with high BMI values and high flow rates with low BMI. It is generally known that lymphoedema disease is associated with inadequate flow of body fluid [5,6]. The subjects in our study use a compression garment as treatment therapy to massage the affected tissue and reduce fluid accumulation on the affected part of the body [34,35]. Response to treatments such as this need to be monitored. Our empirical measurements detected evidence of fluid overload on the lower limb of each subject with attenuation rates twice lower on the affected arm contrary to concomitant changes observed on healthy subjects without oedema on any of the limbs.
6. Conclusions
In this paper, we show the use of galvanic coupled signal propagation to assess fluid accumulation and flow on a unilateral lymphoedema. The results show that fluid accumulation can slow the flow rate to at least twice less than the rate on an unaffected arm of the same subject and can increase highly if the subject dehydrates. Our predictions matched empirical measurements and show that body fluid flow can be monitored using galvanic coupled signal attenuation, and the measured differences in attenuation over a period of 20 min can be used to observe body fluid flow, which is essential for diagnosing early development of fluid disorder, such as lymphoedema, and for monitoring responses to treatment. However, we note that a more conclusive experiment is required on a large scale. Our future work will focus on this and developing a protocol that would ensure that other factors, such as medication, are factored in in the design.
Acknowledgments
The authors would like to thank Lina Cannalonga and all the staff at Therapist Support Laboratory (TSL) clinic, as well as the president and members of Lymphoedema Association of Victoria for their support and contribution during the conduct of this research.
Author Contributions
Clement Ogugua Asogwa designed the experimental protocol, conducted the measurements, analysed the data and reported the observations. Johanis Aryo Bay assisted in conducting the experiments. Patrick Mclaughlin assisted in participant recruitment, ethics application and review of the paper. Stephen F. Collins is the associate supervisor and co-authored the paper. Daniel T. H. Lai is the principal supervisor, designed the experiment protocol, analysed the data and provided data interpretation.
Conflicts of Interest
The authors declare no conflict of interest.
References
- Rockson, S.G. Lymphedema. Am. J. Med. 2001, 110, 288–295. [Google Scholar] [CrossRef]
- Hayes, S.C. Review of Research Evidence on Secondary Lymphoedema: Incidence, Prevention, Risk Factors and Treatment; National Breast and Ovarian Cancer Centre: Surry Hills, Australia, 2008. [Google Scholar]
- MacLaren, J. Skin changes in lymphoedema: Pathophysiology and management options. Int. J. Palliat. Nurs. 2001, 7, 381–388. [Google Scholar] [CrossRef]
- Foldi, E.; Jünger, M.; Partsch, H. The Science of Lymphoedema Bandaging. In European Wound Management Association (EWMA). Lymphoedema Bandaging in Practice London; MEP Ltd.: London, UK, 2005; pp. 1–4. [Google Scholar]
- Vojackova, N.; Fialova, J.; Hercogova, J. Management of lymphedema. Dermatol. Ther. 2012, 25, 352–357. [Google Scholar] [CrossRef]
- Cheville, A.L.; McGarvey, C.L.; Petrek, J.A.; Russo, S.A.; Taylor, M.E.; Thiadens, S.R. Lymphedema management. Semin. Radiat. Oncol. 2003, 13, 290–301. [Google Scholar] [CrossRef]
- Ramos, S.M.; O’Donnell, L.S.; Knight, G. Edema volume, not timing, is the key to success in lymphedema treatment. Am. J. Surg. 1999, 178, 311–315. [Google Scholar] [CrossRef]
- NLN Medical Advisory Committee. Position Statement of the National Lymphedema Network; National Lymphedema Network: Berkeley, CA, USA, 2011. [Google Scholar]
- World Health Organization (WHO). Global Programme to Eliminate Lymphatic Filariasis: Progress Report. 2015. Available online: http://www.who.int/mediacentre/factsheets/fs102/en/ (accessed on 17 December 2016).
- Moffatt, C.J.; Franks, P.J.; Doherty, D.C.; Williams, A.F.; Badger, C.; Jeffs, E.; Bosanquet, N.; Mortimer, P.S. Lymphoedema: An underestimated health problem. QJM 2003, 96, 731–738. [Google Scholar] [CrossRef]
- Moffatt, C.J.; Doherty, D.; Morgan, P. Best Practice for the Management of Lymphoedema; Lymphoedema Framework International Consensus; MEP Ltd.: London, UK, 2006; Volume 1, pp. 3–52. [Google Scholar]
- Kerchner, K.; Fleischer, A.; Yosipovitch, G. Lower extremity lymphedema: Update: Pathophysiology, diagnosis, and treatment guidelines. J. Am. Acad. Dermatol. 2008, 59, 324–331. [Google Scholar] [CrossRef]
- Ma, H.; Iafrati, M. Diagnosis and Management of Lymphedema. In Haimovici’s Vascular Surgery, 6th ed.; Wiley-Blackwell: Oxford, UK, 2012; pp. 1221–1235. [Google Scholar]
- Ridner, S.H.; Montgomery, L.D.; Hepworth, J.T.; Stewart, B.R.; Armer, J.M. Comparison of upper limb volume measurement techniques and arm symptoms between healthy volunteers and individuals with known lymphedema. Lymphology 2007, 40, 35–46. [Google Scholar]
- Grimnes, S.; Martinsen, Ø.G. Bioimpedance and Bioelectricity Basics; Elsevier Academic Press: London, UK, 2008. [Google Scholar]
- Jaffrin, M.Y.; Morel, H. Body fluid volumes measurements by impedance: A review of bioimpedance spectroscopy (BIS) and bioimpedance analysis (BIA) methods. Med. Eng. Phys. 2008, 30, 1257–1269. [Google Scholar] [CrossRef]
- Cornish, B.H.; Chapman, M.; Hirst, C.; Mirolo, B.; Bunce, I.H.; Ward, L.C.; Thomas, B.J. Early diagnosis of lymphedema using multiple frequency bioimpedance. Lymphology 2001, 34, 2–11. [Google Scholar]
- Matthie, J.R. Bioimpedance measurements of human body composition: Critical analysis and outlook. Expert Rev. Med. Devices 2008, 5, 239–261. [Google Scholar] [CrossRef]
- Rothlingshofer, L.; Ulbrich, M.; Hahne, S.; Leonhardt, S. Monitoring change of body fluid during physical exercise using bioimpedance spectroscopy and finite element simulations. J. Electr. Bioimped. 2011, 2, 79–85. [Google Scholar] [CrossRef]
- Asogwa, C.O.; Teshome, A.K.; Lai, D.T.H.; Collins, S.F. A Circuit Model of Real Time Human Body Hydration. IEEE Trans. Biomed. Eng. 2016, 63, 1239–1247. [Google Scholar] [CrossRef]
- Kibret, B.; Seyedi, M.; Lai, D.T.H.; Faulkner, M. Investigation of Galvanic Coupled Intrabody Communication using Human Body Circuit Model. IEEE J. Biomed. Health Inform. 2014, 18, 1196–1206. [Google Scholar] [CrossRef]
- Andreuccetti, D.; Fossi, R.; Petrucci, C. An Internet Resource for the Calculation of the Dielectric Properties of Body Tissues in the Frequency Range 10 Hz–100 GHz; Institute of Applied Physics, nello-carrara (IFAC-CNR): Florence, Italy, 2007; Available online: http://niremf.ifac.cnr.it/tissprop/ (accessed on 15 August 2015).
- Wegmueller, M.S.; Oberle, M.; Felber, N.; Kuster, N.; Fichtner, W. Signal transmission by galvanic coupling through the human body. IEEE Trans. Instrum. Meas. 2010, 59, 963–969. [Google Scholar] [CrossRef]
- Mifflin, M.D.; St Jeor, S.T.; Hill, L.A.; Scott, B.J.; Daugherty, S.A.; Koh, Y.O. A new predictive equation for resting energy expenditure in healthy individuals. Am. J. Clin. Nutr. 1990, 51, 241–247. [Google Scholar]
- Verbalis, J.G. Disorders of body water homeostasis. Best Pract. Res. Clin. Endocrinol. Metab. 2003, 17, 471–503. [Google Scholar] [CrossRef]
- Peronnet, F.; Mignault, D.; Du Souich, P.; Vergne, S.; Le Bellego, L.; Jimenez, L.; Rabasa-Lhoret, R. Pharmacokinetic analysis of absorption, distribution and disappearance of ingested water labelled with D2O in humans. Eur. J. Appl. Physiol. 2012, 112, 2213–2222. [Google Scholar] [CrossRef]
- Wabel, P.; Chamney, P.; Moissl, U.; Jirka, T. Importance of whole-body bioimpedance spectroscopy for the management of fluid balance. Blood Purif. 2009, 27, 75–80. [Google Scholar] [CrossRef]
- Asogwa, C.O.; Lai, D.T.H. Effect of Changing Body Fluid Levels on Intrabody Signal Propagation. In Ambient Intelligent and Smart Environments; IOS Press: Amsterdam, The Netherlands, 2016; Volume 21, pp. 552–559. [Google Scholar]
- Ahlbom, A.; Bergqvist, U.; Bernhardt, J.; Cesarini, J.; Grandolfo, M.; Hietanem, M.; Mckinlay, A.; Repacholi, R.; Sliney, D.; Stolwijk, J. Guidelines for limiting exposure to time-varying electric, magnetic, and electromagnetic fields (up tp 300 GHz). International commission on non-ionizing radiation protection. Health Phys. 1998, 74, 494–522. [Google Scholar]
- Day, S. Important Factors in Surface EMG Measurement; Bortec Biomedical Ltd.: Calgary, AB, Canada, 2002; pp. 1–17. [Google Scholar]
- Dahlof, B.; Sever, P.S.; Poulter, N.R.; Wedel, H.; Beevers, D.G.; Caulfield, M.; Collins, R.; Kjeldsen, S.E.; Kristinsson, A.; McInnes, G.T.; et al. Prevention of cardiovascular events with an antihypertensive regimen of amlodipine adding perindopril as required versus atenolol adding bendroflumethiazide as required, in the Anglo-Scandinavian Cardiac Outcomes Trial-Blood Pressure Lowering Arm (ASCOT-BPLA): A multicentre randomised controlled trial. Lancet 2005, 366, 895–906. [Google Scholar]
- Sands, J.M.; Layton, H.E. The physiology of urinary concentration: An update. Semin. Nephrol. 2009, 29, 178–195. [Google Scholar] [CrossRef]
- Asogwa, C.O.; Collins, S.F.; Mclaughlin, P.; Lai, D.T.H. A Galvanic Coupling Method for Assessing Hydration Rates. Electronics 2016, 5, 39. [Google Scholar] [CrossRef]
- Kloecker, R.J. Compression Garment for Selective Application for Treatment of Lymphedema and Related Illnesses Manifested at Various Locations of the Body. U.S. Patent 6436064, 20 August 2002. [Google Scholar]
- Brennan, M.J.; Miller, L.T. Overview of treatment options and review of the current role and use of compression garments, intermittent pumps, and exercise in the management of lymphedema. Cancer 1998, 83, 2821–2827. [Google Scholar] [CrossRef]
Figure 1.
The circuit diagram with the variable impedance component from dynamic changes in human body fluid volume. Reproduced with permission from [20], IEEE, 2016.
Figure 1.
The circuit diagram with the variable impedance component from dynamic changes in human body fluid volume. Reproduced with permission from [20], IEEE, 2016.

Figure 2.
Measurement of galvanic coupled signal gain on the affected left arm of a lymphoedema subject.
Figure 2.
Measurement of galvanic coupled signal gain on the affected left arm of a lymphoedema subject.

Figure 3.
Measurement of galvanic coupled signal gain at 900 kHz, on both arms of lymphoedema affected subjects without fluid restriction.
Figure 3.
Measurement of galvanic coupled signal gain at 900 kHz, on both arms of lymphoedema affected subjects without fluid restriction.

Figure 4.
Measurement of galvanic coupled signal gain at 900 kHz, on both arms of healthy subjects without fluid restriction.
Figure 4.
Measurement of galvanic coupled signal gain at 900 kHz, on both arms of healthy subjects without fluid restriction.

Figure 5.
Measurement of galvanic coupled signal gain at 900 kHz, after fluid restriction and intake of 350 mL, on both arms of lymphoedema affected subjects.
Figure 5.
Measurement of galvanic coupled signal gain at 900 kHz, after fluid restriction and intake of 350 mL, on both arms of lymphoedema affected subjects.

Figure 6.
Measurement of galvanic coupled signal gain at 900 kHz, after fluid restriction and intake of 350 mL, on both arms of healthy subjects.
Figure 6.
Measurement of galvanic coupled signal gain at 900 kHz, after fluid restriction and intake of 350 mL, on both arms of healthy subjects.


Table 1.
Circumferential limb measurements (CLM) measured in centimetres on lymphoedema (L) affected participants.
Table 1.
Circumferential limb measurements (CLM) measured in centimetres on lymphoedema (L) affected participants.
| Subject/Affected Limb | Day | BMI | Affected (CLM) | Unaffected (CLM) | % Difference | |||
|---|---|---|---|---|---|---|---|---|
| (kg/m) | Upper | Lower | Upper | Lower | Upper | Lower | ||
| L1 (left arm) | 1 | 31.7 | 39.0 | 35.0 | 34.5 | 27.0 | 13.0 | 29.6 |
| 2 | 31.5 | 39.2 | 35.0 | 34.5 | 27.0 | 13.6 | 29.6 | |
| 3 | 31.4 | 39.0 | 35.4 | 34.3 | 27.4 | 13.7 | 29.1 | |
| L2 (Right arm) | 1 | 31.3 | 37.0 | 25.0 | 29.0 | 22.5 | 27.5 | 11.1 |
| 2 | 30.5 | 36.8 | 25.3 | 29.0 | 22.7 | 26.8 | 11.4 | |
| 3 | 29.9 | 37.0 | 25.4 | 29.2 | 22.3 | 26.7 | 13.9 | |
| L3 (Left leg) | 1 | 29.1 | 43.5 | 28.8 | 38.0 | 26.0 | 14.5 | 10.7 |
| 2 | 29.2 | 43.6 | 29.2 | 38.1 | 26.3 | 14.4 | 11.0 | |
| 3 | 29.2 | 43.4 | 28.9 | 38.0 | 25.6 | 14.2 | 12.9 | |
| L4 (Right arm) | 1 | 31.7 | 36.0 | 31.0 | 34.0 | 28.0 | 5.70 | 10.7 |
| 2 | 31.5 | 36.0 | 31.0 | 34.5 | 28.0 | 4.30 | 10.7 | |
| 3 | 31.9 | 35.5 | 31.0 | 33.8 | 25.5 | 5.00 | 21.5 | |
| L5 (Left arm) | 1 | 24.5 | 31.5 | 26.0 | 27.0 | 23.7 | 16.7 | 9.7 |
| 2 | 24.4 | 31.5 | 26.0 | 27.0 | 23.2 | 16.7 | 12.1 | |
| 3 | 24.4 | 31.6 | 26.0 | 26.0 | 22.8 | 21.5 | 14.0 | |
Table 2.
CLM measured in centimetres on healthy (H) participants.
| Subject | Day | BMI | CLM Left Limb | CLM Right Limb | % Difference | |||
|---|---|---|---|---|---|---|---|---|
| (kg/m) | Upper | Lower | Upper | Lower | Upper | Lower | ||
| H1 | 1 | 29.2 | 31.5 | 27.4 | 29.6 | 26.0 | 6.4 | 5.3 |
| 2 | 29.0 | 31.5 | 27.4 | 29.7 | 26.0 | 6.1 | 5.3 | |
| 3 | 29.1 | 31.6 | 27.5 | 29.6 | 26.0 | 6.7 | 5.7 | |
| H2 | 1 | 23.1 | 28.2 | 24.8 | 29.7 | 26.0 | 5.3 | 4.8 |
| 2 | 23.6 | 28.6 | 25.0 | 30.2 | 26.3 | 5.6 | 5.2 | |
| 3 | 23.4 | 28.0 | 25.8 | 29.4 | 27.0 | 5.0 | 4.6 | |
| H3 | 1 | 24.1 | 30.4 | 25.5 | 29.5 | 25.0 | 3.1 | 2.0 |
| 2 | 24.1 | 30.4 | 25.6 | 29.5 | 25.0 | 3.1 | 2.2 | |
| 3 | 24.2 | 30.5 | 25.2 | 29.5 | 25.0 | 3.4 | 2.0 | |
| H4 | 1 | 22.6 | 26.2 | 23.4 | 25.0 | 23.0 | 4.8 | 1.7 |
| 2 | 22.4 | 26.0 | 23.5 | 25.0 | 23.0 | 4.2 | 2.2 | |
| 3 | 22.2 | 26.1 | 23.4 | 25.0 | 23.2 | 4.4 | 1.3 | |
Table 3.
Comparison of CLM and the average difference in galvanic signal amplitude between the affected and unaffected lower limbs.
Table 3.
Comparison of CLM and the average difference in galvanic signal amplitude between the affected and unaffected lower limbs.
| Subject | BMI | Percentage Change | Difference in Gain |
|---|---|---|---|
| kg/m | in CLM | dB | |
| L1 | 31.5 | 29.6 | 8.0 |
| L2 | 30.5 | 27.5 | 6.0 |
| L3 | 29.2 | 14.5 | 1.2 |
| L4 | 31.5 | 21.5 | 9.0 |
| L5 | 24.4 | 13.0 | 5.0 |
| Healthy Participants | |||
| BMI | CLM | Difference in Gain | |
| kg/m2 | Left and Right | dB | |
| H1 | 29.0 | 5.6 | 3.0 |
| H2 | 23.6 | 3.8 | 4.0 |
| H3 | 24.1 | 2.0 | 2.0 |
| H4 | 22.4 | 4.4 | 4.0 |
Table 4.
Deviation in time of propagating galvanic signal on lymphoedema affected participants, Day 2, without fluid restriction, and 3, after fluid restriction and ingestion of 350 mL of water.
Table 4.
Deviation in time of propagating galvanic signal on lymphoedema affected participants, Day 2, without fluid restriction, and 3, after fluid restriction and ingestion of 350 mL of water.
| Subject | Day | BMI | Affected | Unaffected |
|---|---|---|---|---|
| kg/m | dB/min | dB/min | ||
| L1 | 2 | 31.5 | 0.26 | 0.81 |
| 3 | 31.4 | 0.16 | 1.83 | |
| L2 | 2 | 30.5 | 0.24 | 0.93 |
| 3 | 29.9 | 0.37 | 0.82 | |
| L3 | 2 | 29.2 | 0.34 | 0.60 |
| 3 | 29.2 | 0.15 | 0.44 | |
| L4 | 2 | 31.5 | 0.81 | 3.79 |
| 3 | 31.9 | 0.35 | 0.83 | |
| L5 | 2 | 24.4 | 1.93 | 1.25 |
| 3 | - | - | - |
Table 5.
Deviation in time of galvanic signal attenuation on healthy participants, Day 2, without fluid restriction, and Day 3, after fluid restriction and ingestion of 350 mL of water.
Table 5.
Deviation in time of galvanic signal attenuation on healthy participants, Day 2, without fluid restriction, and Day 3, after fluid restriction and ingestion of 350 mL of water.
| Subject | Day | BMI | Left Limb | Right Limb |
|---|---|---|---|---|
| kg/m | (dB/min) | (dB/min) | ||
| H1 | 2 | 29.0 | 0.52 | 0.82 |
| 3 | 29.1 | 1.22 | 1.32 | |
| H2 | 2 | 23.6 | 1.16 | 1.54 |
| 3 | 23.4 | 0.59 | 0.72 | |
| H3 | 2 | 24.1 | 0.48 | 0.69 |
| 3 | 24.2 | 0.66 | 0.87 | |
| H4 | 2 | 22.4 | 2.02 | 2.06 |
| 3 | 22.3 | 2.14 | 2.31 |
© 2017 by the authors. Licensee MDPI, Basel, Switzerland. This article is an open access article distributed under the terms and conditions of the Creative Commons Attribution (CC BY) license (http://creativecommons.org/licenses/by/4.0/).
Share and Cite
MDPI and ACS Style
Asogwa, C.O.; Aryo Bay, J.; Mclaughlin, P.; Collins, S.F.; Lai, D.T.H. A Galvanic Intrabody Method for Assessing Fluid Flow in Unilateral Lymphoedema. Electronics 2017, 6, 47. https://0-doi-org.brum.beds.ac.uk/10.3390/electronics6020047
AMA Style
Asogwa CO, Aryo Bay J, Mclaughlin P, Collins SF, Lai DTH. A Galvanic Intrabody Method for Assessing Fluid Flow in Unilateral Lymphoedema. Electronics. 2017; 6(2):47. https://0-doi-org.brum.beds.ac.uk/10.3390/electronics6020047
Chicago/Turabian StyleAsogwa, Clement Ogugua, Johanis Aryo Bay, Patrick Mclaughlin, Stephen F. Collins, and Daniel T. H. Lai. 2017. "A Galvanic Intrabody Method for Assessing Fluid Flow in Unilateral Lymphoedema" Electronics 6, no. 2: 47. https://0-doi-org.brum.beds.ac.uk/10.3390/electronics6020047
Note that from the first issue of 2016, this journal uses article numbers instead of page numbers. See further details here.