A Segmentation-Cooperated Pansharpening Method Using Local Adaptive Spectral Modulation


1
Science and Technology on Complex Electronic System Simulation Laboratory, Space Engineering University, Beijing 101416, China
2
School of Space Information, Space Engineering University, Beijing 101416, China
*
Author to whom correspondence should be addressed.
Electronics 2019, 8(6), 685; https://0-doi-org.brum.beds.ac.uk/10.3390/electronics8060685
Submission received: 27 April 2019
/
Revised: 11 June 2019
/
Accepted: 14 June 2019
/
Published: 17 June 2019
(This article belongs to the Section Computer Science & Engineering)
Abstract
:In order to improve the spatial resolution of multispectral (MS) images and reduce spectral distortion, a segmentation-cooperated pansharpening method using local adaptive spectral modulation (LASM) is proposed in this paper. By using the k-means algorithm for the segmentation of MS images, different connected component groups can be obtained according to their spectral characteristics. For spectral information modulation of fusion images, the LASM coefficients are constructed based on details extracted from images and local spectral relationships among MS bands. Moreover, we introduce a cooperative theory for the pansharpening process. The local injection coefficient matrix and LASM coefficient matrix are estimated based on the connected component groups to optimize the fusion result, and the parameters of the segmentation algorithm are adjusted according to the feedback from the pansharpening result. In the experimental part, degraded and real data sets from GeoEye-1 and QuickBird satellites are used to assess the performance of our proposed method. Experimental results demonstrate the validity and effectiveness of our method. Generally, the method is superior to several classic and state-of-the-art pansharpening methods in both subjective visual effect and objective evaluation indices, achieving a balance between the injection of spatial details and maintenance of spectral information, while effectively reducing the spectral distortion of the fusion image.
1. Introduction
With the continuous progress of satellite and sensor technology, remote sensing image data with high spectral and spatial resolution can be acquired simultaneously. The spectral resolution can reach the nanometer level, while the spatial resolution can reach the submeter level. However, due to transmission bottlenecks and signal-to-noise ratio (SNR) limitations [1], the acquired remote sensing data have complementary characteristics, such as low-resolution multispectral (LRMS) images obtained at the expense of spatial resolution and panchromatic (PAN) images with lower spectral resolution and higher spatial resolution. To achieve high-resolution multispectral (HRMS) images, image fusion technology is required. By merging PAN images with LRMS images, the complementary information of the two can be integrated and the redundant information can be removed. This process is usually called pansharpening [2], which, as one branch of image fusion, aims to obtain HRMS images by injecting spatial details from PAN into LRMS. Furthermore, more accurate scene descriptions and more reliable interpretations can be provided.
Many studies have put forward theories on and methods for pansharpening. Component substitution (CS) methods and multiresolution analysis (MRA) methods are widely used traditional fusion methods [3,4]. The classic CS-based methods include intensity hue saturation (IHS) transform [5], principal component analysis (PCA) [6], Gram–Schmidt (GS) transform [7], band-dependent spatial detail (BDSD) [8], and so on. In general, if the spectral response of the MS bands does not completely overlap with that of the PAN band, the CS-based fusion will produce severe spectral distortion. To solve this problem, MRA methods based on spatial detail injection have been proposed. Within this family, the detailed spatial information of PAN obtained by multiscale decomposition is combined with the MS bands to obtain the fusion results. However, these methods also have spatial distortion problems, such as ringing or aliasing effects or blurring of contour and texture, due to their dependence on filtering operations. Wavelet transform [9], Laplace pyramid transform [10], curvelet transform [11], and contourlet transform [12] are all well-known MRA-based methods. Generalized Laplacian pyramid (GLP) [13,14], which also belongs to this family, has been widely used in pansharpening. Especially when the frequency response of the filter matches the modulation transfer function (MTF) of the MS sensor [15], the spatial details missing in MS images can be extracted from PAN image by using the MTF-GLP filter. Other methods also have been proposed in some research, such as fusion methods based on Bayesian theory [16,17]. A regularization solution is applied for solving ill-posed problems of reconstruction of HRMS images, exploiting approaches that are dependent on total variation penalization terms [18], and sparse representations of signal or compressed sensing theory [19,20,21]. Although these methods have achieved good performance, their practical application is limited by the computational burden caused by the optimization technology.
In summary, the main aim of existing pansharpening methods is to inject the spatial details extracted from PAN images into LRMS images to the maximum extent on the basis of maintaining the spectral information. According to literatures [3,4], the classic pansharpening framework can be roughly divided into two parts: extraction of spatial details based on PAN images and injection of extracted details into upsampled LRMS images the same size as the PAN images. In the step of injecting the extracted spatial details into MS bands, the addition or multiplication framework [22] can be used to weigh the extracted detail information. As for the extraction step, pansharpening methods can be divided into CS-based and MRA-based methods according to the different methods of extracting spatial details. CS-based methods obtain low-resolution PAN images through a linear combination of MS bands, while MRA-based methods produce low-resolution PAN images through multiscale decomposition. According to the spectral response characteristics of satellite sensors, there is a non-linear relationship between the PAN band and MS bands [23]. Accordingly, the approximate low-resolution version of PAN images that are generated by the CS-based method cannot fully reproduce the gray-scale features of the original images, often causing spectral distortion in the fusion image. The main features that distinguish the MRA-based methods are the filters used for detail extraction and the methods of injection gain. It is also noteworthy that estimation of the injection coefficient can be done by a global method based on the entire image or a local content-adaptive (CA) method. The global method has only one injection coefficient for each MS band, so it has low computational cost. A nonlinear image decomposition framework based on morphological operators was proposed in reference [24], which is a global detail injection method. Compared to the global method, the injection coefficients of the CA method are spatially variable and have a better fusion effect, especially in terms of spectral fidelity [13,25]. Local estimation of coefficients is usually achieved through sliding windows, but the cost of this scheme is high, therefore, a pansharpening method based on non-overlapping blocks to calculate the injection gains was proposed in reference [26]. However, the fixed structure of sliding windows ignores the actual spatial arrangement of the ground objects [23]. To solve this problem, the BDSD method based on image clustering was proposed in reference [27] and Gram–Schmidt adaptive and GLP pansharpening algorithms based on binary partition tree (GSA-BPT) were proposed in reference [28], achieving good performance. A Gram–Schmidt adaptive with histogram-adjusted (GSA-HA) method was proposed in a literature [29], where the k-means algorithm is used to segment PAN images through pixel clustering, then the weighted sum of groups of pixels is calculated by multiple regression to reduce the spectral distortion of fusion results. However, in the process of coefficient injection, because the spatial structure differences between PAN and MS and the relationship between MS bands are ignored, there are still problems of injection bias and spectral distortion, or manual intervention is needed in the process of pansharpening.
In this paper, in order to improve the fusion quality of MS and PAN images while reducing the spectral distortion, a pansharpening method based on local adaptive spectral modulation (LASM) and cooperation with segmentation is proposed. This method has an adaptive spectral modulation system and can adjust the segments according to the fusion feedback. In this method, the k-means algorithm is used to segment MS images to obtain connected component groups with similar spectral characteristics. The local injection coefficient matrix is estimated based on each group. MTF-GLP technology is used to extract the spatial details of MS and PAN images. To modulate the spectral information in the fusion result, LASM coefficients are constructed based on extracted image details and the spectral relationship between MS bands. By measuring the distance between fused HRMS images and upsampled LRMS images, the optimal number of connected component groups is adaptively selected to make the spectral features of the fused image as close as possible to the original LRMS image. Through the cooperation between fusion and segmentation, the local injection coefficient matrix and LASM coefficient matrix are estimated based on the connected component groups to optimize the pansharpening result, and the parameters of the segmentation algorithm are adjusted according to feedback from the fusion image. Finally, experimental results on GeoEye-1 and QuickBird satellite data sets show that the proposed pansharpening method can effectively enhance the spatial detail information and reduce the spectral distortion of fusion images.
This paper is organized as follows: The second part introduces the pansharpening problem and the key technology of pansharpening. The proposed LASM and the cooperative approach between pansharpening and segmentation are presented in the third part. A performance comparison and analysis are provided in the fourth part by experimental results on degraded and real image data from different satellites. The final part presents the study’s conclusions.
2. Model for the Pansharpening Problem
The pansharpening problem of MS and PAN images needs a fusion model to achieve a balance between injecting spatial details and preserving spectral information. This model can be either a global model based on the whole image or a local model based on the image context, such as spectral [30] or spatial [31] information.
Fusion of MS and PAN images yields a high-spatial-resolution MS image . While maintaining the spectral content of the MS image, the spatial details of the PAN image are injected into MS bands so that the fusion image achieves spectral diversity and the spatial resolution is the same as the original MS and PAN images. The definition of is
where is the number of MS bands, is the -th band of the MS image upsampled to meet the PAN image size, represents the -th band of the injection gain matrix, denotes the detail image of band extracted from the PAN image, represents the pixel-by-pixel multiplication operation between the injection coefficient matrix and the detail image, and is obtained by subtracting the corresponding low-resolution version of the PAN image from the histogram-matched PAN image.
Most existing fusion models only consider modulation coefficient estimation for the spatial detail part, but some fusion models add coefficient modulation for the spectral part. In literatures [32,33], the spectral modulation coefficients are introduced into the pansharpening methods, and thus the spectral information of the MS image can be better preserved. Based on this, the fusion model can be expressed as
where denotes the spectral modulation coefficient matrix for the -th band.
In this paper, the MRA-based scheme is adopted. The primary steps of the MRA-based pansharpening approach include the following: first, the original MS image is interpolated to obtain the upscaled MS image with the same size as the PAN image, then the low-resolution version of the PAN image is calculated by multiscale decomposition, and the corresponding injection gain matrix and spectral modulation coefficient matrix are calculated. Finally, spectral modulation and detail injection are completed according to Equation (2) to obtain the fusion image. The key technologies during the pansharpening process—detail image estimation, injection coefficient construction, and spectral modulation coefficient construction—are detailed below.
2.1. Detail Image Estimation
Since the relationship between the low-resolution version of the PAN image and the MS bands is non-linear, the weighted sum of MS bands cannot properly describe low-resolution PAN images with different land covers. However, the estimation of low-resolution PAN images directly affects the extraction of image details, so the MRA-based multiscale decomposition method is used in this paper to calculate the low-resolution version of PAN images.
The performance of the MRA-based method can be improved by frequency analysis of images according to the filter whose frequency response amplitude matches the MTF of the imaging system. A clearer geometric structure can be produced through this method than with an ideal MRA filter. In fact, the spatial frequency response of the Gaussian filter can be adjusted to match the MTF of the sensor. In this way, we can extract the detail information from the PAN image that cannot be obtained by the MS sensors because of the coarse spatial resolution.
MTF-GLP technology is used to calculate the detailed images [28] in this paper. Before the introduction of multiresolution wavelet analysis, Bert and Adelson [10] proposed the Laplacian pyramid (LP), which is a band-pass image decomposition method based on Gaussian pyramid (GP). The construction process of a Laplace image is as follows: perform low-pass filtering and downsampling of the original image to obtain an approximate image with coarse scale, that is, the low-pass approximate image can be obtained by decomposition. Then the approximate image after interpolation and filtering is subtracted from the original image, which is equivalent to band-pass filtering. The next level of decomposition is carried out on the obtained low-pass approximate image, and the multiscale decomposition is completed iteratively. This method has been proved to be suitable for the fusion of remote sensing images [14].
First, we calculate the low-resolution version of PAN image
where denotes the linear time-invariant filter and represents the convolution operation. The frequency response of approximates Gaussian shape and matches the gain at Nyquist cutoff frequency of the exact MTF of the sensor that acquires the -th MS band [15]. We subtract the low-resolution image from the PAN image to yield the spatial detail image
where is the PAN image after equalization according to and denotes the low-resolution version of .
2.2. Injection Coefficient Construction
Spectral characteristics will change according to different objects, regions, or environments [34], and therefore the spectral relationship of MS and PAN images is unfixed. Therefore, if we inject spatial details obtained with the PAN image into each MS band without considering the differences between local areas, the fusion quality of spectral and spatial aspects will be affected. It is a very important step to estimate the appropriate injection coefficient matrix, and then the spatial details obtained with the PAN image can be weighted by their respective coefficients and injected into each MS band. A regression-based model in literature [28] was employed to estimate the injection coefficients in this paper. In literature [28], regression analysis between low-resolution PAN images and MS bands was employed and expanded; the injection coefficient estimation based on image regions composed of pixels with similar spectral characteristics was performed. In this case, the injection coefficient matrix is calculated by
in which denotes the covariance and is the variance. According to Equation (5), the locally implemented expression on the local region is
where and represent the connected component groups containing pixel in images and , respectively. Since all pixels in the same connected component group will adopt the same gain coefficient after localization, we can make an adaptive adjustment to the injection weights of detail information guided by the spectral characteristics in the local region.
In this paper, k-means algorithm is used to segment MS images into connected component groups according to spectral characteristics, and local injection coefficients are estimated based on each connected component group.
2.3. Construction of Spectral Modulation Coefficient
According to literature [32], when extracting spatial information from PAN images, certain spatial details contained in the MS images should be removed, so they introduced a spectral modulation (SM) scheme for the fusion model that utilizes the Gaussian function to obtain the specific spatial details from the PAN and MS images, then SM coefficients can be constructed by removing the details in MS from the details in PAN. Desirable results for the preservation of spectral information have been obtained by this method. The calculation expression of the SM coefficient is
in which represents the PAN image, denotes the intensity component of the MS image, is the number of MS channels, and is the calculation of the maximum value of the corresponding MS band including the pixel point . The Gaussian convolution denotes a low-pass filter, represents the convolution calculation, and represents the scale factor in the Gaussian function.
In this paper, an improved spectral modulation approach based on SM is proposed to preserve spectral information.
3. Proposed Method
In this paper, the proposed pansharpening method mainly focuses on two parts: constructing LASM coefficient and introducing cooperation with segmentation into pansharpening.
3.1. LASM Coefficient for Pansharpening
3.1.1. LASM Coefficient Construction
Using the SM scheme proposed in literature [32] as a guide, in this paper, the MTF-GLP filter is used to replace the Gaussian filter used in Equation (7) to construct the spatial details of PAN and MS images. The calculation of PAN details is shown in Equations (3) and (4). MS details can be obtained by
where denotes the low-resolution version of the MS image. The detail image can be achieved by subtracting its low-resolution image from the MS image .
As we know, the fusion image needs to be able to reproduce the spectral features of the original MS image, including spectral features in a single band and the relationships among MS bands. In the fusion process, spatial enhancement is correlated with the extraction and injection of spatial structure in the PAN image, while spectral preservation is correlated with the bands and interbands in the MS image. As shown in Equation (7), the SM coefficient only considers the relationship between PAN spatial details and MS spatial details. In fact, optical remote sensing uses optical systems to collect and record reflected and emitted radiation from ground objects into space, while MS images have multiple bands and cover a wide range of reflectivity, and the same ground object may have significantly different reflection characteristics among different bands. Therefore, spectral preservation needs to consider the interband relationships of MS images [33], that is, the relationship between the MS channels is important to improve the spectral fidelity of the fusion results. Thus, we constructed the LASM coefficient based on the interband relationships of MS images and the spatial structure relationship to modulate the preservation of spectral information. First, the specific definition of adaptive spectral modulation coefficient is
where represents the spectral contribution ratio of the -th band to the MS image, which reflects the spectral differences of the pixels among different bands in the image. If the spectral contribution ratio of the -th band is slightly different, it means that the spectral information of MS inter-bandsis relatively similar, therefore, the corresponding modulation coefficients for the MS band have similar amplitudes. Equations of the LASM coefficients can be easily implemented locally by calculating on each connected component group obtained by image segmentation. The LASM coefficient of the image region containing pixel can be calculated as
where and represent the connected component groups containing pixel in detail image and , respectively; is the spectral contribution ratio of the local connected component group; and is the maximum value of the corresponding group covering the pixel point in the MS image. The pseudo-code for the LASM coefficient construction is summarized in Algorithm 1.
| Algorithm 1 Generating LASM coefficient | |
| Input: Upscaled image and detail image PAN | |
| Output: LASM coefficient matrix | |
| Begin | |
| Generate a bank of filters shaped on the MTF of sensor | |
| Extract the spatial details of MS image | |
| Segment into groups by k-means algorithm | |
| fordo | |
| for do | |
| Calculate the LASM coefficient for each connected component group as | |
| end for Gather in | |
| end for | |
| Gather in | |
| end | |
3.1.2. Performance Test of LASM
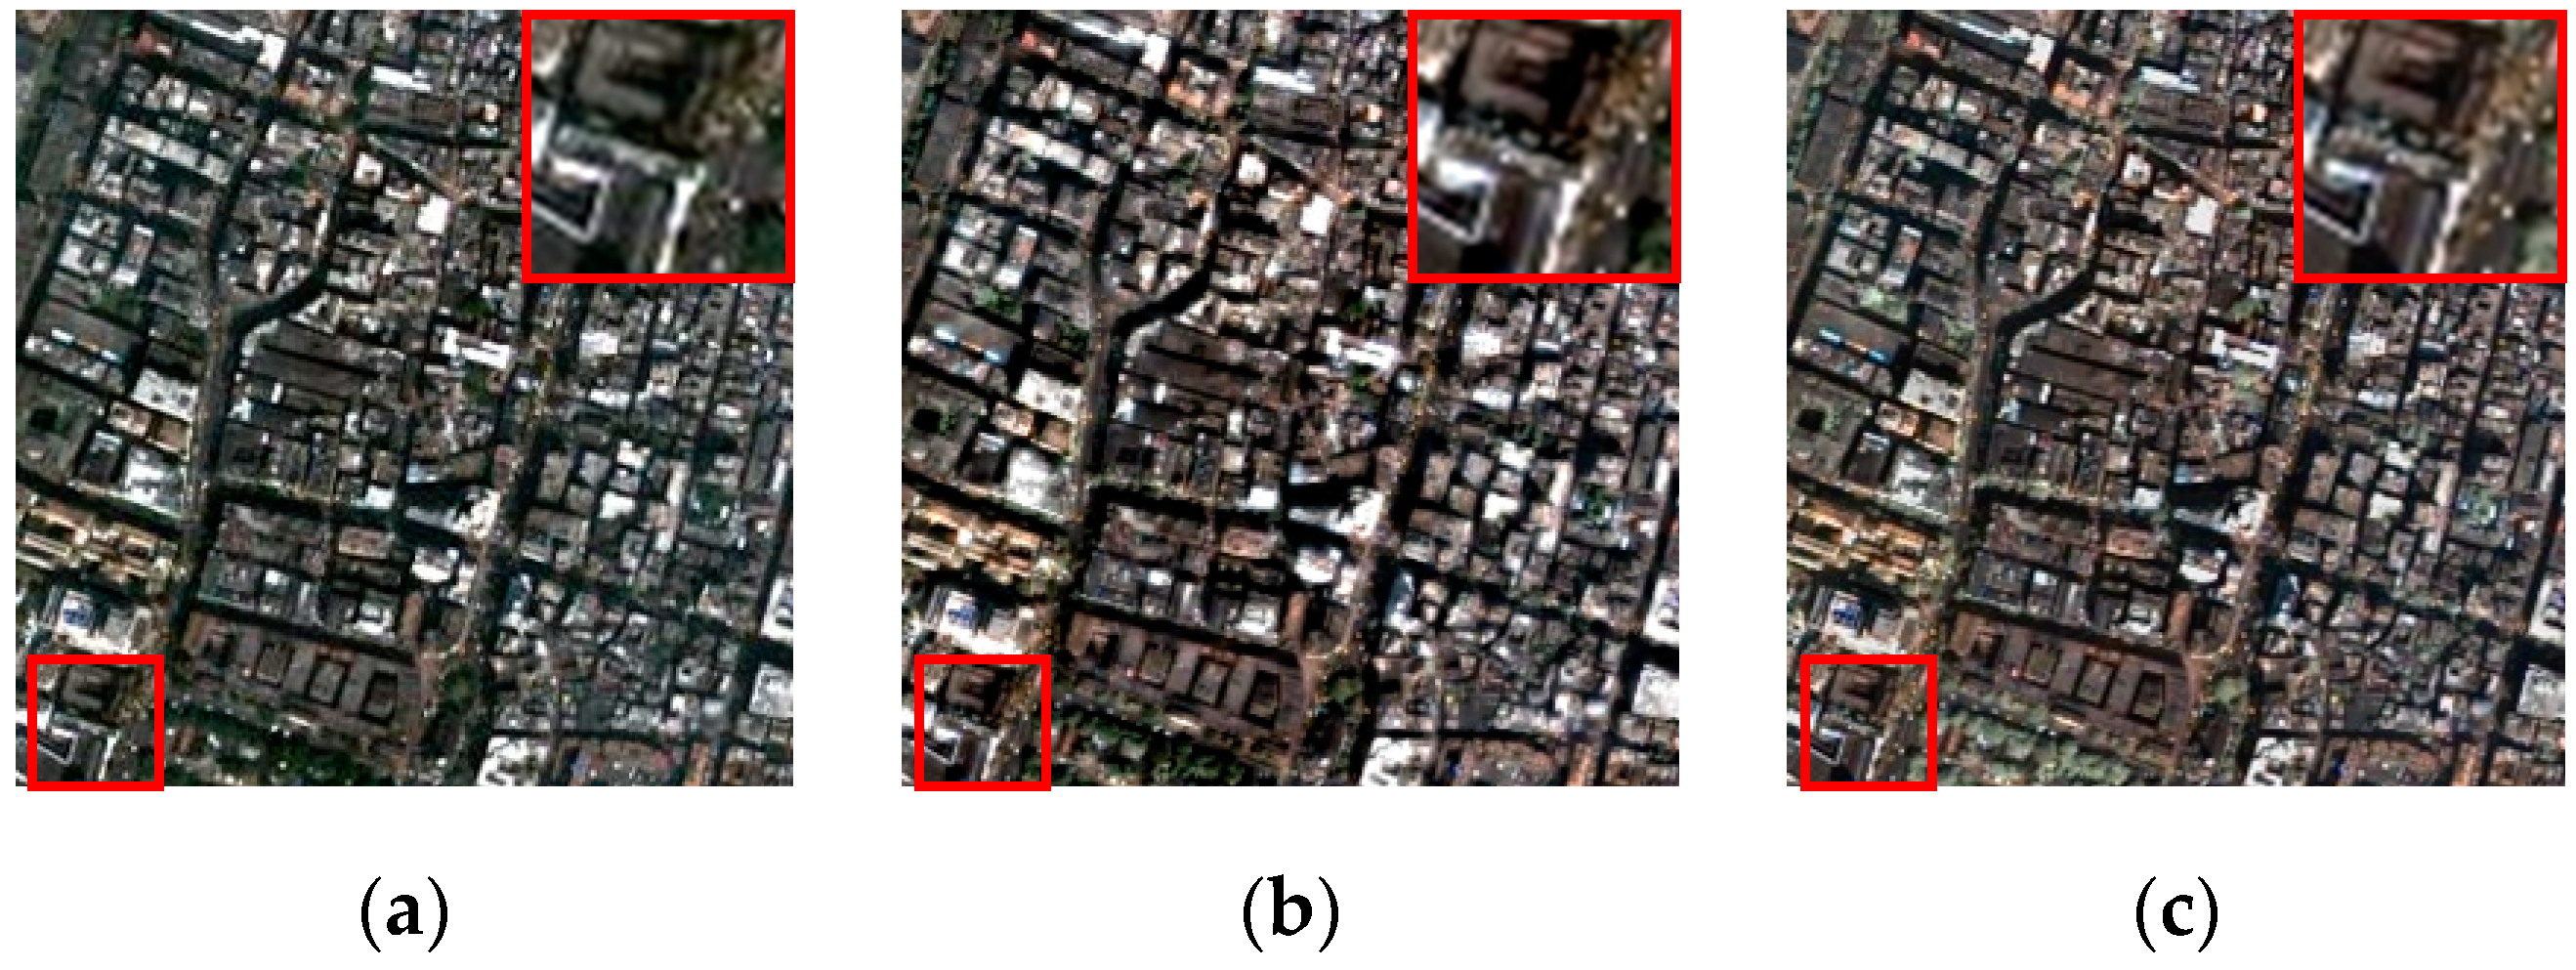
The method based on our proposed LASM was compared with the method without LASM and the method using SM [32] instead of LASM. A set of MS and PAN images from the GeoEye-1 satellite was selected as an example for comparative analysis. The reference image and the fusion results of these three methods are shown in Figure 1. Enlarged local details are shown in the lower left corner of the image. Six commonly used objective evaluation indices were adopted to evaluate the performance of the three methods: correlation coefficient (CC), structural similarity (SSIM), spectral angle mapper (SAM), root mean square error (RMSE), erreur relative globale adimensionnelle de synthèse (ERGAS), and universal image quality index (UIQI). The corresponding results of the evaluation indices are described in Table 1.
From Figure 1 we can see that the method that uses SM in place of the LASM coefficient [32] has certain spectral distortion compared with the reference image, and excessive detail injection occurs in some local areas. There is no obvious difference in visual effect between the methods with and without LASM. However, as illustrated in Table 1, the fusion result obtained by the method with LASM mostly achieves the best values of indices except the RMSE index. The optimal RMSE is obtained by the fusion method without LASM, and the LASM-based method is slightly lower than the best value. Generally speaking, compared with the method without LASM, the LASM-based method can achieve a better fusion result with improved spectral fidelity and enhanced spatial quality.
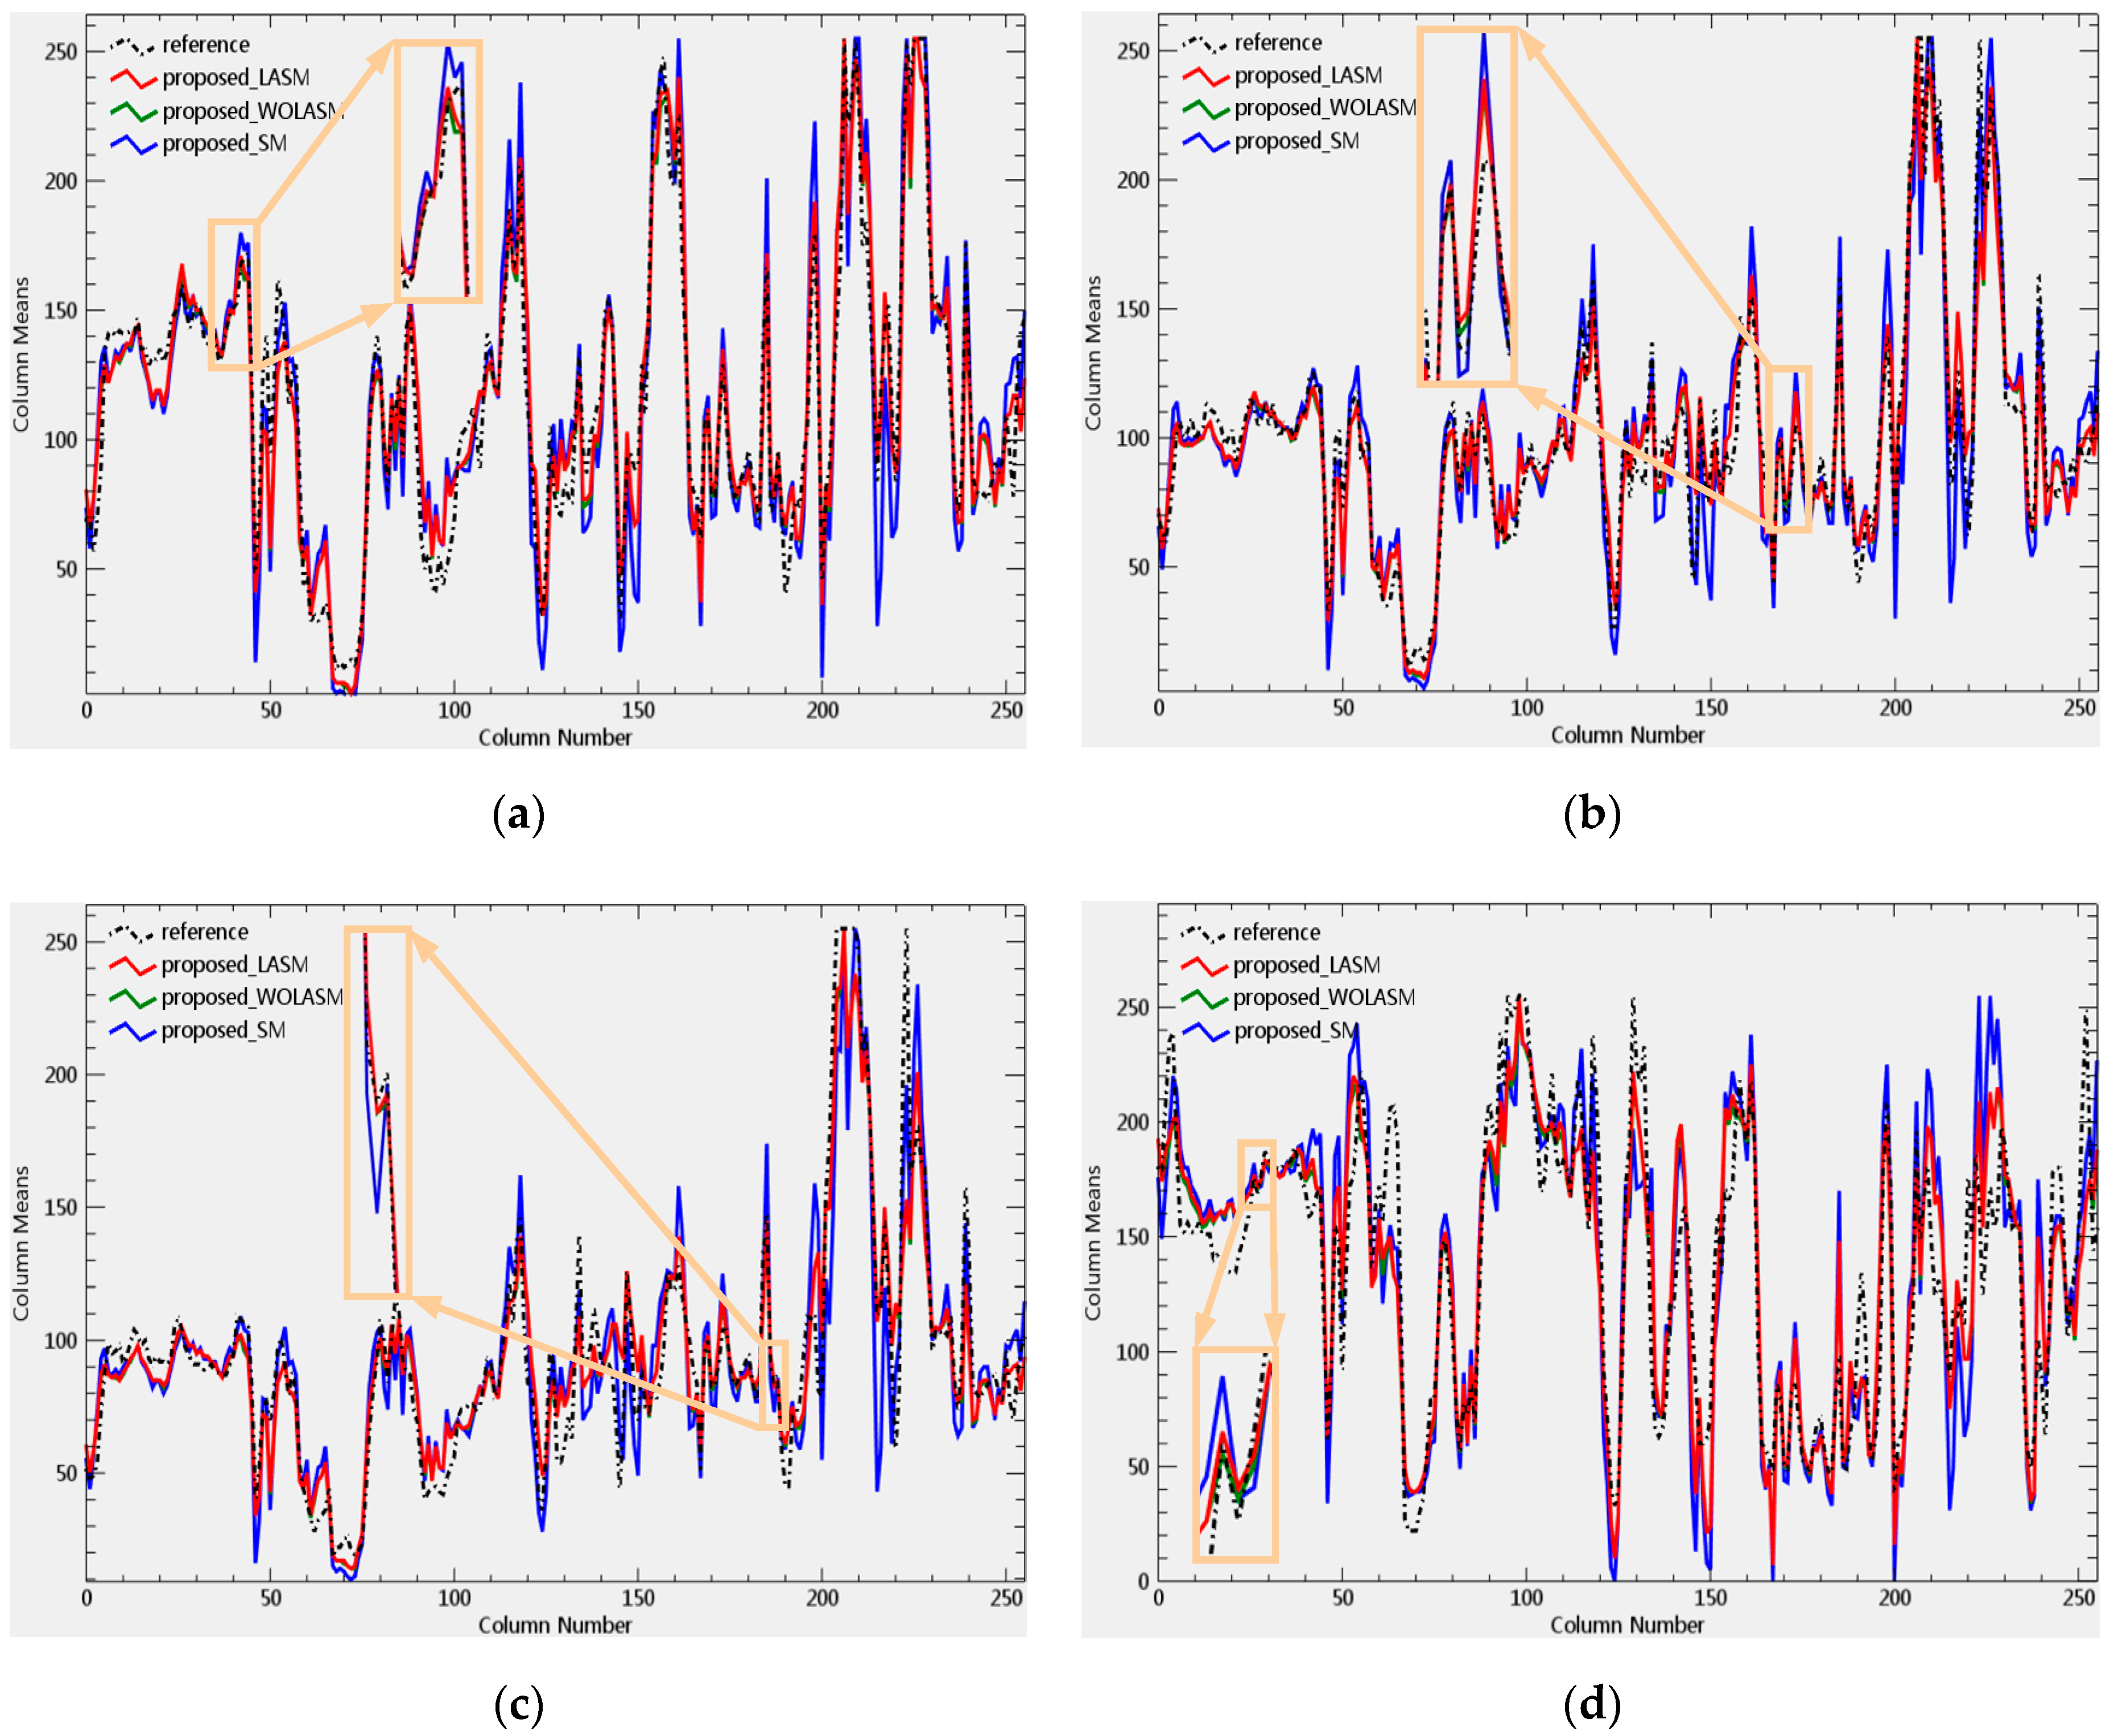
Figure 2 shows the spectral horizontal profile curves of the fusion images achieved by the above three methods. From this figure, we can see that there is a large deviation between the curve obtained by the SM-based method and that of the reference image. The curves acquired by the methods with and without LASM are relatively closer to the reference curve. According to the enlarged local details in the rectangular boxes, it is concluded that the highest spectral fidelity can be achieved by the LASM-based fusion method.
3.2. Cooperation between Pansharpening and Segmentation
3.2.1. Cooperation with Segmentation Using K-Means
In remote sensing image processing, segmentation and pansharpening are usually regarded as two interrelated steps, but they seldom cooperate with each other. Fusion results cannot be optimized according to the characteristics of segmentation methods, and segmentation results are seldom used to guide pansharpening [35]. Using the idea of cooperation between pansharpening and segmentation, image segmentation is applied to optimize the fusion results, and the parameters of the segmentation algorithm are adjusted according to the feedback from the fusion results. The locality of the pansharpening method based on image segmentation depends on the partitioning of connected component groups.
Many clustering algorithms can be selected in this part. The k-means algorithm is used for image segmentation in this paper, which is a classic clustering method based on partitioning and one of the top 10 data mining algorithms. K-means is based on distance similarity, which partitions according to the similarities between pixels. In order to improve spectral fidelity and reduce spectral distortion, the MS image is segmented by the spectral similarity of pixels. Pixels with the same spectral characteristics are clustered into the same connected component group, and do the same calculation for all the pixels in the same group, so that spatial details can be injected uniformly.
After the image is segmented into connected component groups based on the k-means algorithm, the local injection coefficients and LASM coefficients are calculated for each group, then they are applied to the local connected component groups, weighting the spectral information to be maintained and the spatial details to be injected. When the number of groups falls to one, we regard it as the global-based method.
The MS image is clustered into different pixel subsets through the k-means algorithm. The cosine of the angle between two vectors is used to measure the differences between individuals. Therefore, the distance function is defined as
in which is the cosine similarity between and , which denotes the correlation measure; is the pixel mean value of the connected component group ; is the spectral channel vector of pixel ; is the number of MS channels; denotes the clustering number, and represents the calculation of the modulus of vectors.
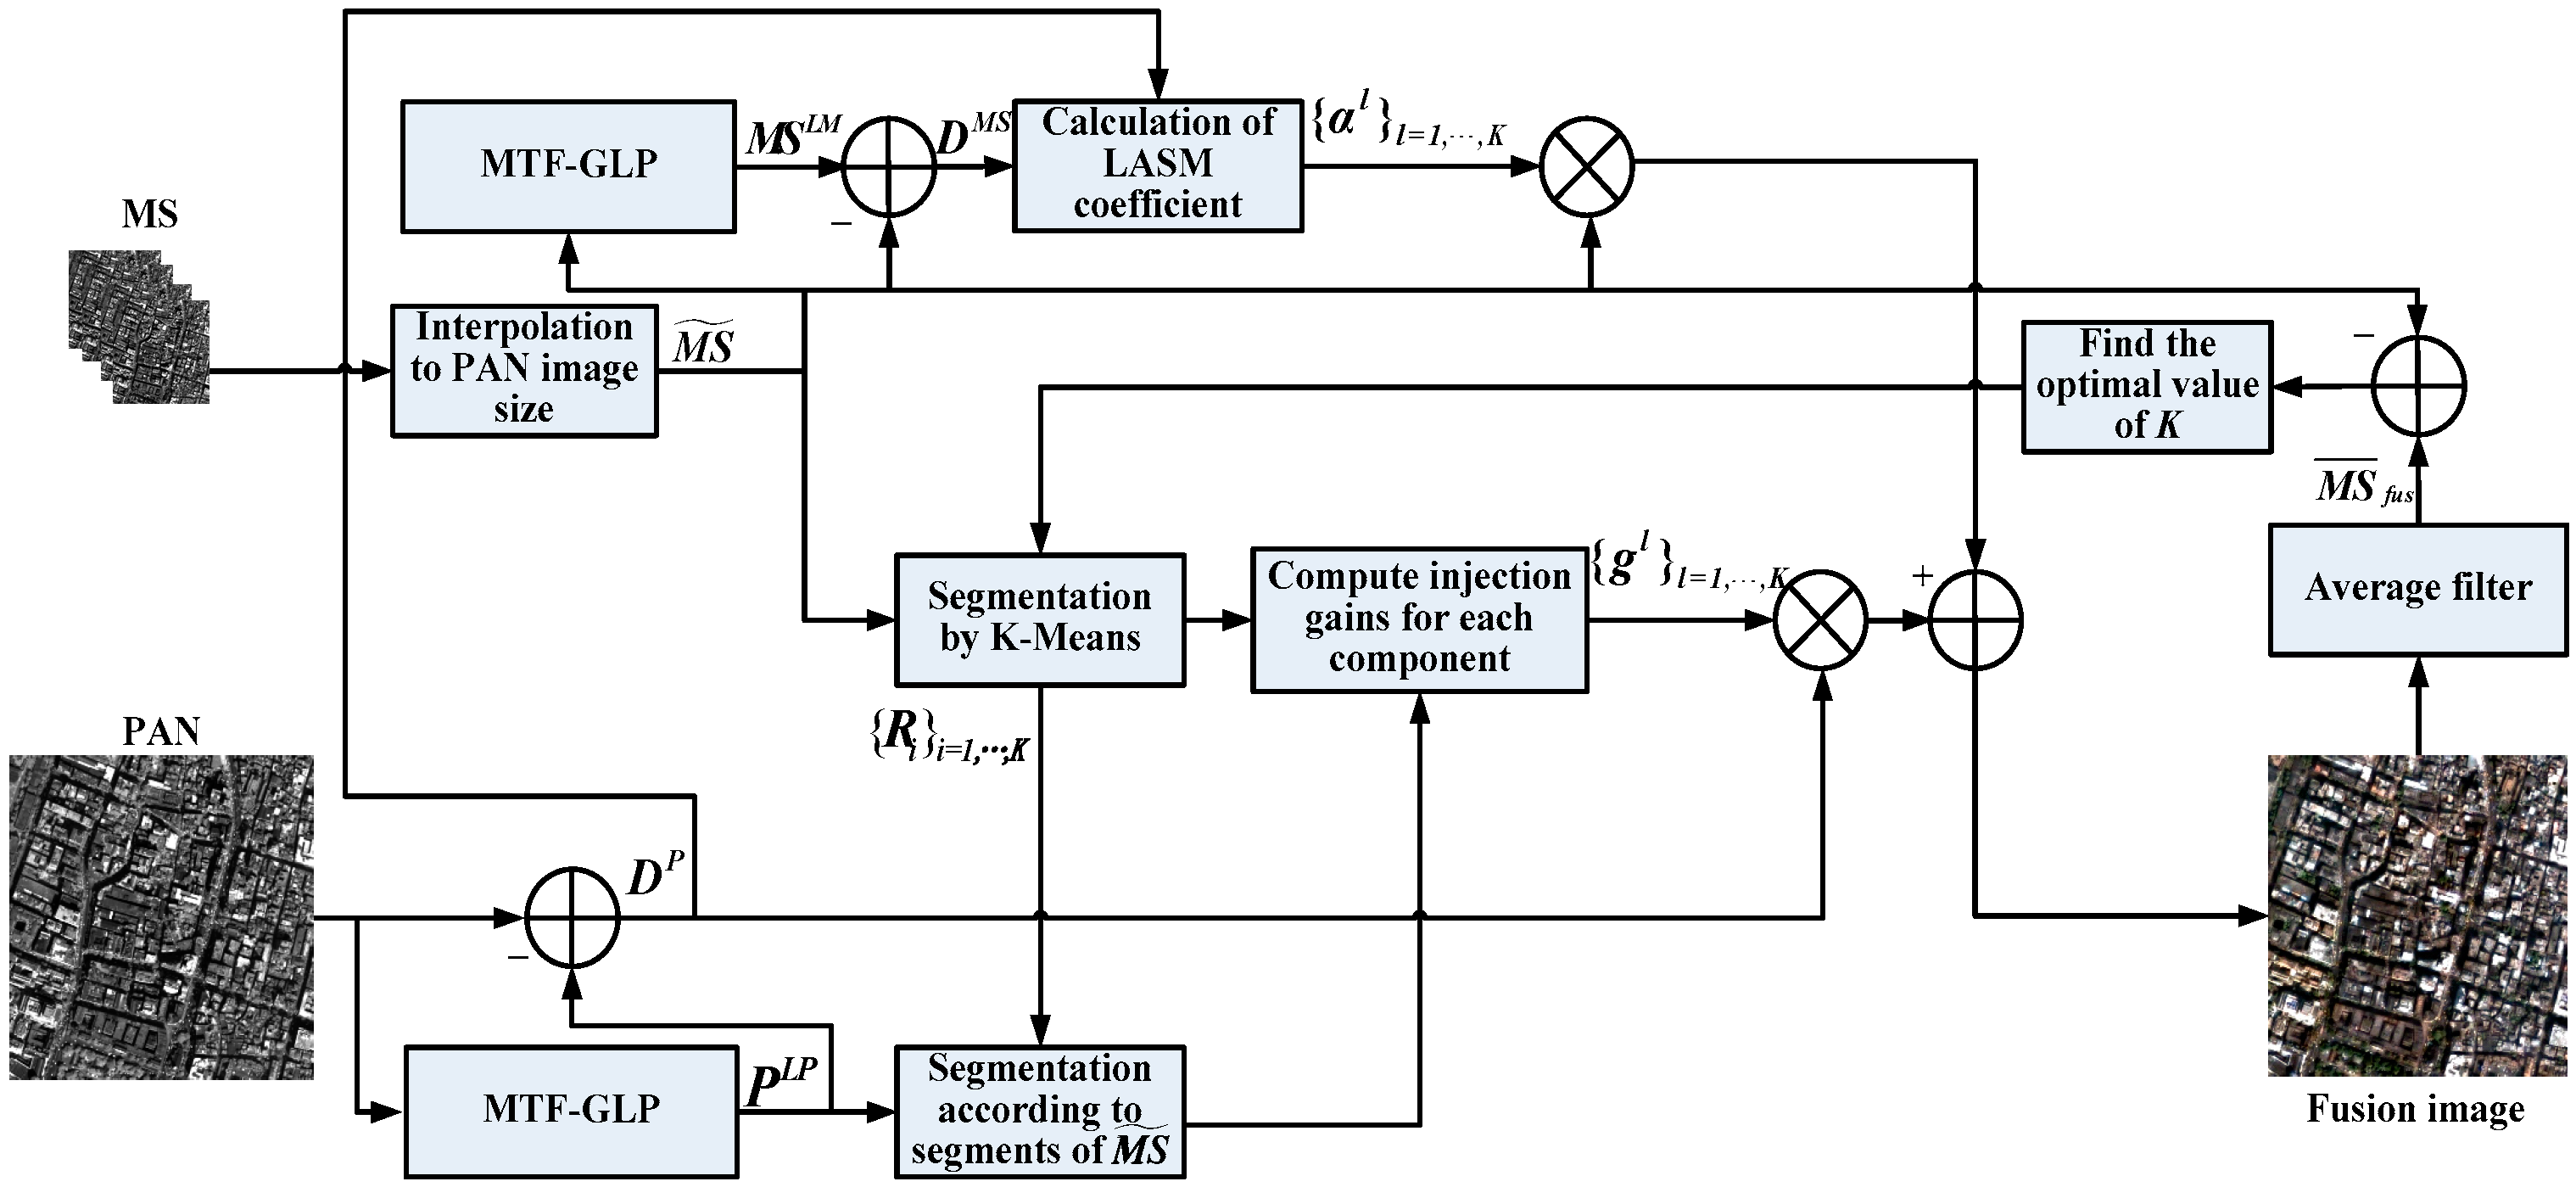
The value of in the k-means algorithm is the key parameter to obtain satisfactory segmentation results, but it depends on the different earth coverings of the MS image. In this paper, a method of cooperation between pansharpening and segmentation is proposed, which uses the fusion result to guide the adaptive selection of segmentation parameter and optimizes the fusion result based on image segmentation. Figure 3 shows the specific pansharpening process.
Our proposed method contains four major steps:
- Set the initial value , then use the random selection algorithm to select the initial focal point among all the pixels. Then use the k-means algorithm to cluster the MS image into groups according to the spectral similarity measurement, and the PAN image is segmented according to MS segments.
- The PAN detail image can be obtained by Equations (3) and (4). According to Equations (9) and (10), the MS detail image can be extracted. Construct the LASM coefficients according to Equations (13) and (14). The local injection coefficient matrix is obtained by Equation (6).
- Calculate fusion image by Equation (2). The difference between the upscaled MS image and the smoothed fusion image [29] is calculated aswhere is the index of the pixel vector in , which represents the -th group of pixels; denotes the HRMS image after average value filtering; and represents the calculation operation of the element number.
- , . Repeat steps 1–4, and select the optimal value of with the minimum difference and output the fusion image.
Here is the pseudo-code for the proposed pansharpening algorithm (Algorithm 2) based on cooperation with segmentation:
| Algorithm 2 Pansharpening algorithm based on cooperation with segmentation | |
| Input: Original MS and PAN images, range of segments [3, 9] | |
| Output: Fused image | |
| Begin | |
| Interpolate to the size of , yielding | |
| Extract the PAN detail image , in which | |
| fordo | |
| Obtain connected component groups of by k-means algorithm | |
| for do | |
| for do | |
| Compute injection gain coefficient for each group as | |
| end for | |
| Injection coefficients matrix | |
| Calculate LASM coefficient through Algorithm 1 | |
| Calculate fusion image | |
| end for | |
| Compute smoothed fused image as , in which is a mean filter | |
| Compute the difference | |
| end for | |
| Select optimal segments with minimum difference | |
| Compute final fusion result | |
| end | |
3.2.2. Performance Test of Cooperation with Segmentation
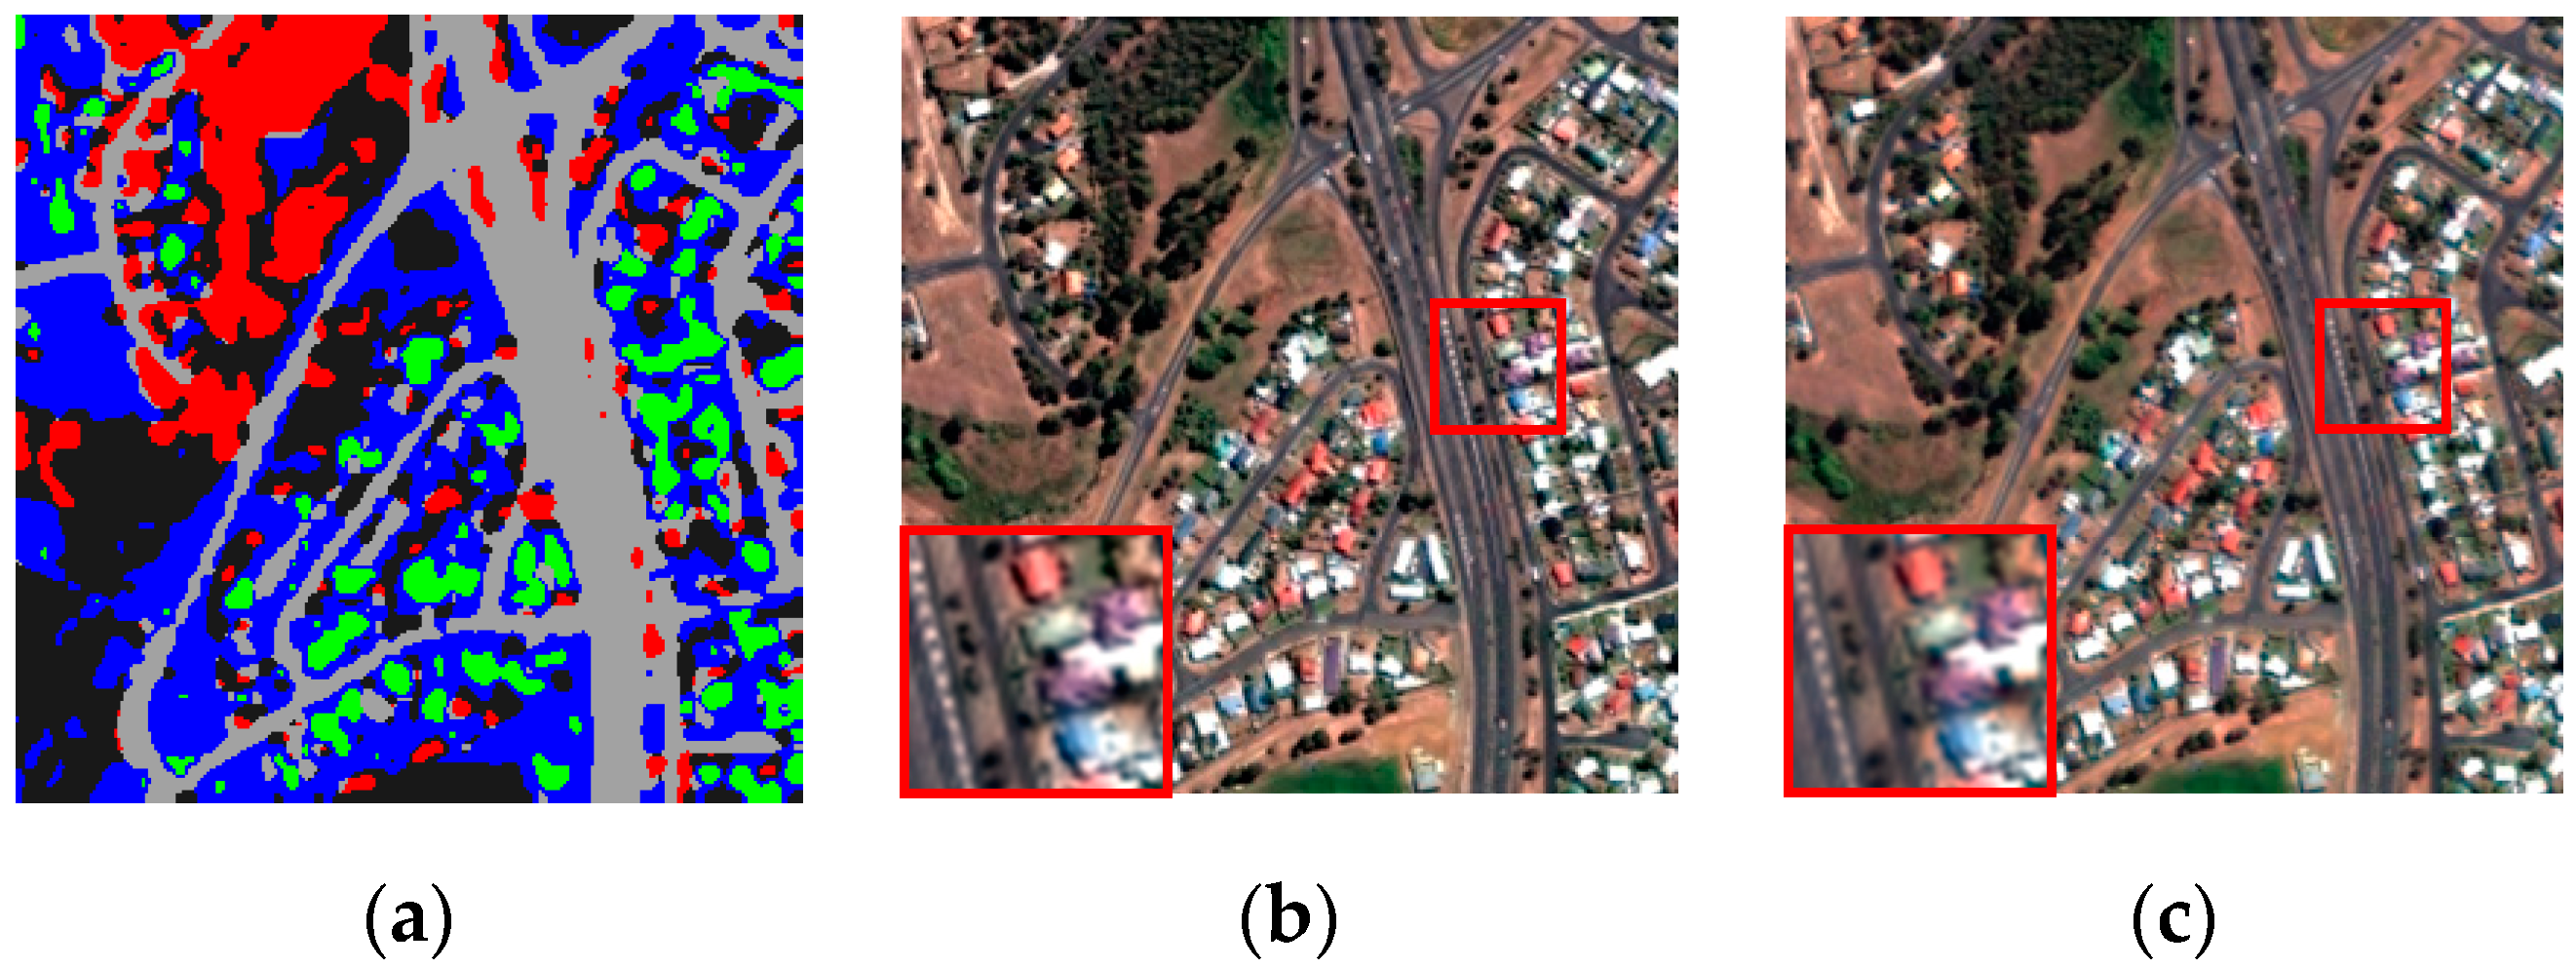
The proposed method based on cooperation with segmentation is compared with the method without segmentation. The example images from the GeoEye-1 satellite selected in Section 3.1.2 are used for the performance analysis in this part. The segmentation result is shown in Figure 4a. Figure 4b,c show the fusion results obtained by the method without segmentation and the method based on cooperation with segmentation, respectively.
As can be seen from Figure 4, the MS image is segmented into five connected component groups according to the spectral characteristics. It was concluded by the fusion results that the method based on cooperation with segmentation can achieve better spectral quality than the method without segmentation. For example, the red roof in the enlarged rectangular box suffers some color distortion. Performance of fusion results of Figure 4b,c are shown in Figure 5; the indices cannot be uniformly normalized, so the broken lines of the first three indices are enlarged for the convenience of comparison. It can be seen from this chart that the fusion result obtained by the method with segmentation achieves optimal values of indices. It shows that the spectral fidelity and the spatial quality are improved effectively by introducing the scheme of cooperation with segmentation.
K-means clustering is an unsupervised learning approach that tries to find natural categories of sample data. Without any prior knowledge, k-means clusters (or groups) data points with similar characteristics into different regions according to iteration rules. It is a real-time method with rapid convergence, easy implementation, and a simple concept. In most cases, the segmentation results obtained by k-means are satisfactory. The segmentation algorithms mentioned in literature [23] and literature [36] can be successfully applied in image segmentation, but these algorithms are relatively complex and require a large amount of computation. K-means may not always be able to get the global optimal solution, and if an initial value is not satisfactory, we may get a poor segmentation result, which will affect the pansharpening performance. For k-means clustering, we usually repeat the process a certain number of times and then get the best result. Through the cooperation between segmentation and pansharpening, we use the feedback from the fusion results to guide the segmentation process and get the optimal clustering.
4. Experimental Results and Comparisons
Degraded and real data sets from different satellites are used for experiment and analysis in this part. First, an experiment on degraded data set to assess the performance of the proposed method is performed. The fusion results can be compared with the reference images by visual and objective evaluation indices. Second, our proposed method is applied to real data sets for performance evaluation. Seven classic and popular pansharpening methods are used as the comparative methods, including à trous wavelet transform (ATWT) [4], GS [7], MTF matched GLP with context-based decision (MTF-GLP-CBD) [25], BDSD [8], morphological filter-half gradients (MF-HG) [24], GSA-BPT [28], and GSA-HA [29].
4.1. Data Sets
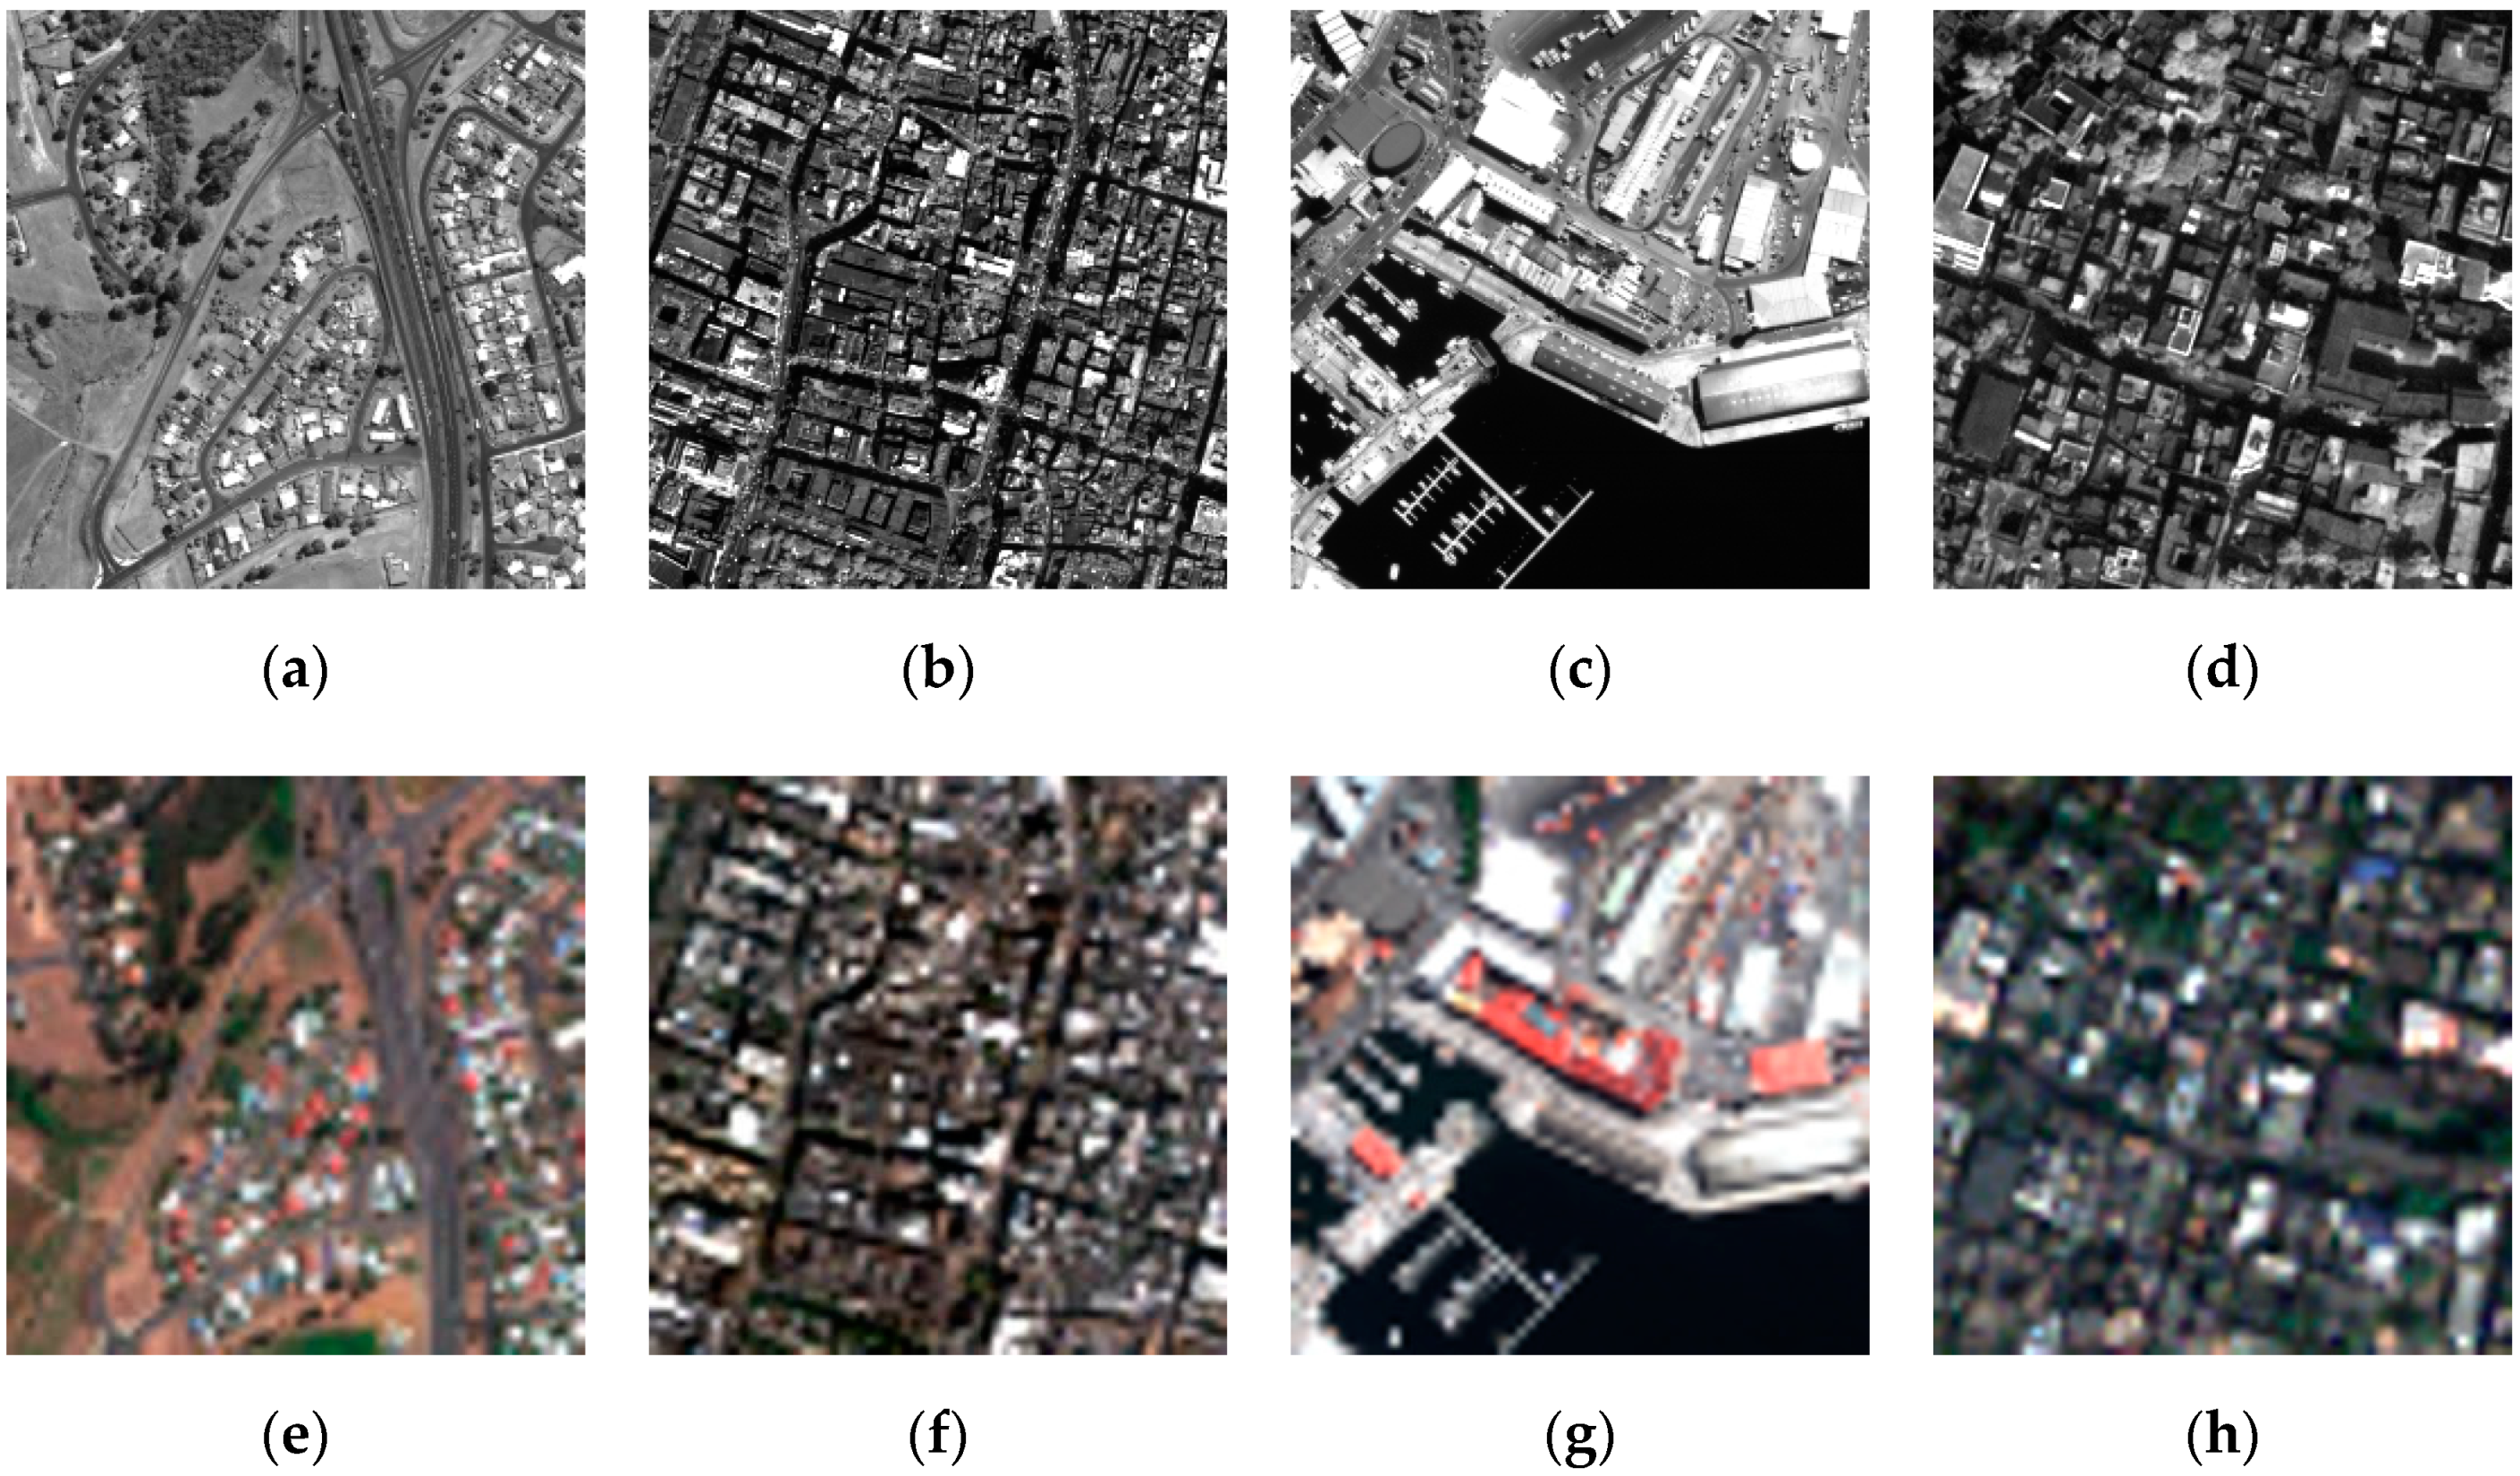
(1) GeoEye-1 data set: The experimental data set from the GeoEye-1 satellite is shown in Figure 6a,e,c,g, which are the degraded and real image pairs, respectively. This data set was acquired from Hobart, Australia on 24 February, 2009 and provides 0.5 m PAN and 2 m LRMS images.
(2) QuickBird data set: As shown in Figure 6b,f,d,h, both the degraded and real data sets from the QuickBird satellite are used for reduced- and full-resolution assessment. The QuickBird data set was captured from Sundarbans, India, on 21 November, 2002. The spatial resolution of the PAN and LRMS images is 0.7 m and 2.8 m, respectively.
The data sets collected from the GeoEye-1 and QuickBird satellites consist of one PAN band and four MS bands (R, G, B and NIR), but only R, G, and B bands are used for visual display. In the experiment, because there were no corresponding reference images in the data sets to evaluate the pansharpening performance, the original PAN and LRMS images were processed with MTF filtering and decimation to obtain the degraded data for fusion, hence the original LRMS image can be adopted as the reference. The degraded and real data from GeoEye-1 and QuickBird satellites were used to measure the performance of the pansharpening methods. The sizes of the PAN and LRMS images used in this paper are 256 × 256 and 64 × 64, respectively. The size of the reference image is 256 × 256.
4.2. Quality Indices
Evaluating the performance of the pansharpening methods mainly entails subjective visual analysis and objective evaluation. In this paper, six evaluation indices are selected for the reduced-resolution evaluation of the degraded data sets, and three indices are used for the full-resolution assessment of the real data sets.
(1) Reduced-resolution assessment: The six indices are: CC [37], SSIM [38], SAM [39], RMSE [40], ERGAS [3], and UIQI [41]. CC and SAM are used to measure spectral quality. Three indices account for spatial quality: SSIM, RMSE, and ERGAS. SSIM reflects the structural similarity between the reference image and the fusion image, while RMSE and ERGAS represent the difference between the two. UIQI is a global index used to measure spatial and spectral qualities.
(2) Full-resolution assessment: For the real data experiment, due to the lack of corresponding reference images, the quality with no reference (QNR) index [42] and two independent indices, the spectral distortion index and the spatial distortion index , are applied to the quality assessment. , consisting of and , is a global measurement of correlation, luminance, and contrast between two images.
4.3. Experiments on Degraded Data
As Figure 6 shows, two groups of degraded images from different satellites are used to test the proposed method. Figure 6a,e are the first group of images from the GeoEye-1 satellite data set, and 6b and f are the second group of images from the QuickBird satellite data set. The fusion results of these two groups of degraded data sets for the proposed pansharpening method and the comparison methods are shown in Figure 7; Figure 8, respectively. The first image in Figure 7 and Figure 8 is the reference image. The objective evaluation results are listed in Table 2 and Table 3.
By analyzing the fusion results in terms of subjective visual effects, it is easy to see that GS and MTF-GLP-CBD have relatively serious spectral distortion and blurred details. The fusion results obtained by ATWT, MF-HG, and GSA-HA maintain the spectral characteristics well, and the spatial details are relatively clear. The fusion results achieved by BDSD and GSA-BPT have excessive enhancement of some edge details compared to the reference image, which leads to certain spectral distortion. By comparison, the proposed method shows better agreement with the reference image in terms of both spatial and spectral characteristics.
As listed in Table 2 and Table 3, the evaluation indices of the fusion images from different approaches that are tested on the degraded image pairs can be compared. According to the objective quantitative results in Table 2, all the objective indices obtained by our proposed method, with the exception of SAM, are superior to those of the other seven methods. We obtained the suboptimal value of SAM; the optimal value was acquired by MF-HG. In Table 3, our method achieved the best value on five indices: CC, SSIM, RMSE, ERGAS, and UIQI. As the color in this group of images is relatively single, the minimum value of SAM is obtained by GS, and our proposed method achieves a near-optimal value. As mentioned in literature [43], evaluation of pansharpening mainly has two aspects. One is the injection of spatial information, which mainly represents the improvement of image spatial resolution. The other is the preservation of spectral information, which refers to the degree of damage to the original spectrum. Normally we cannot obtain both, that is, the injection of spatial details and the preservation of spectral information cannot both be superior, and some compromise may be required. Generally speaking, when the fusion results have better spatial quality, there will be some compromise in spectral maintenance.
4.4. Experiments on Real Data
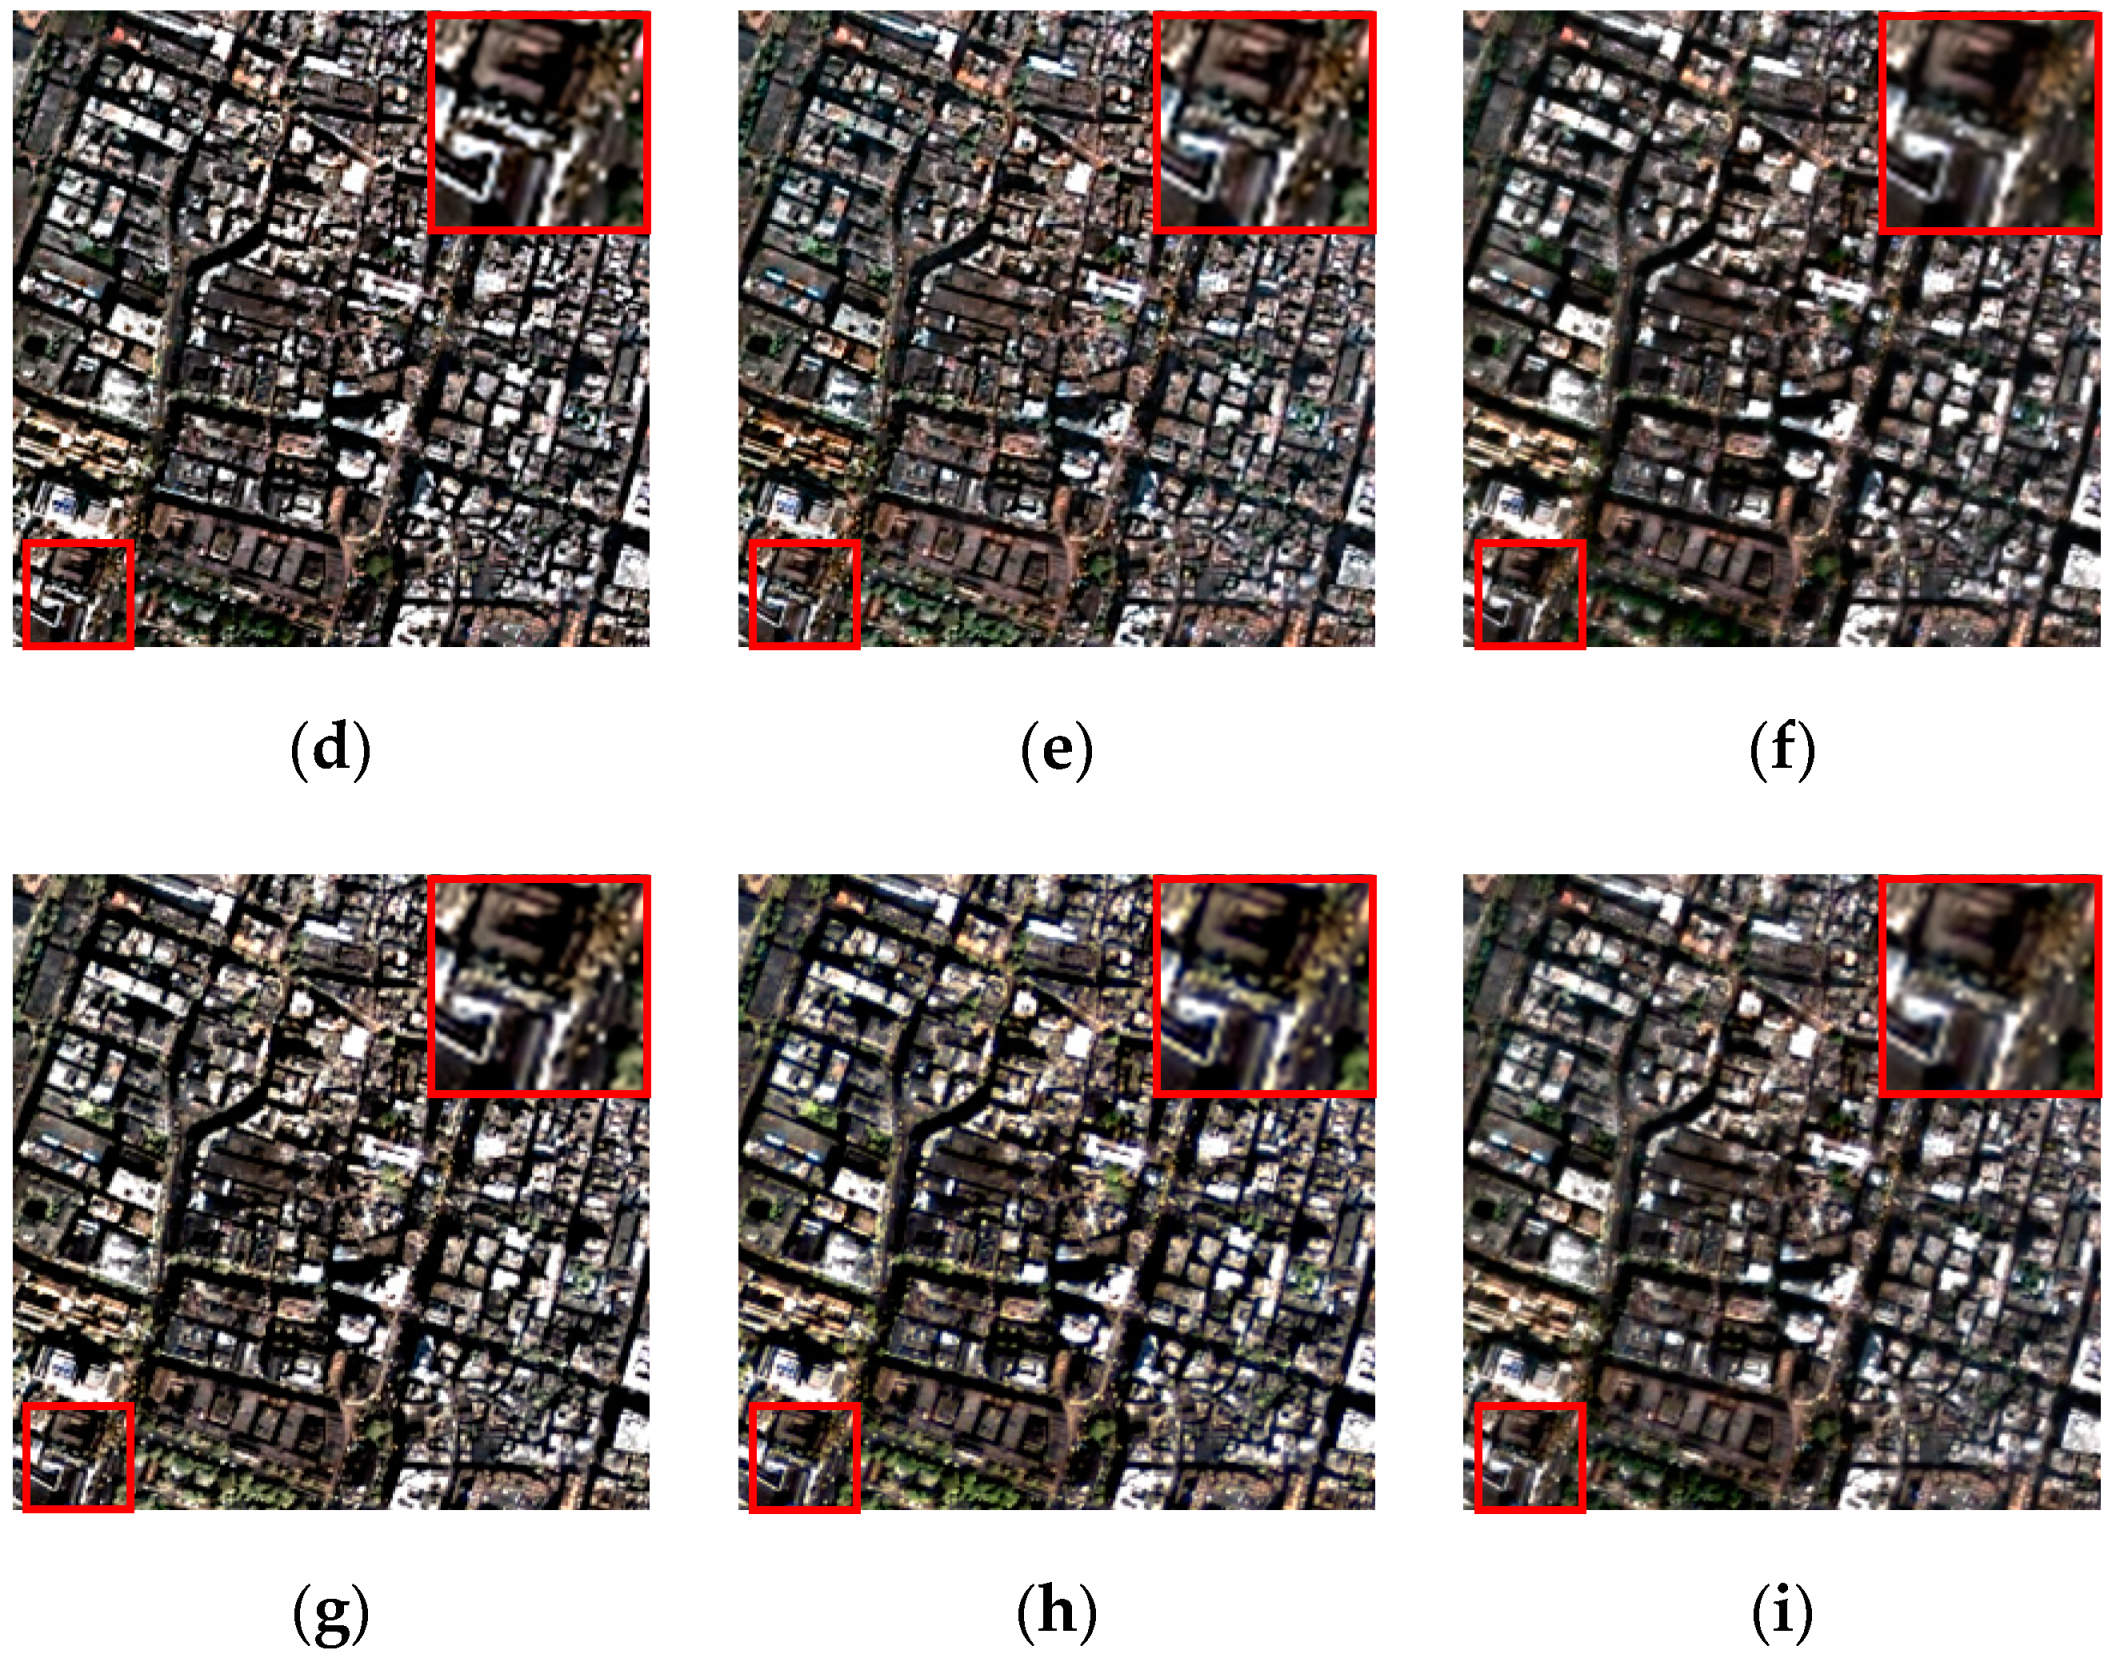
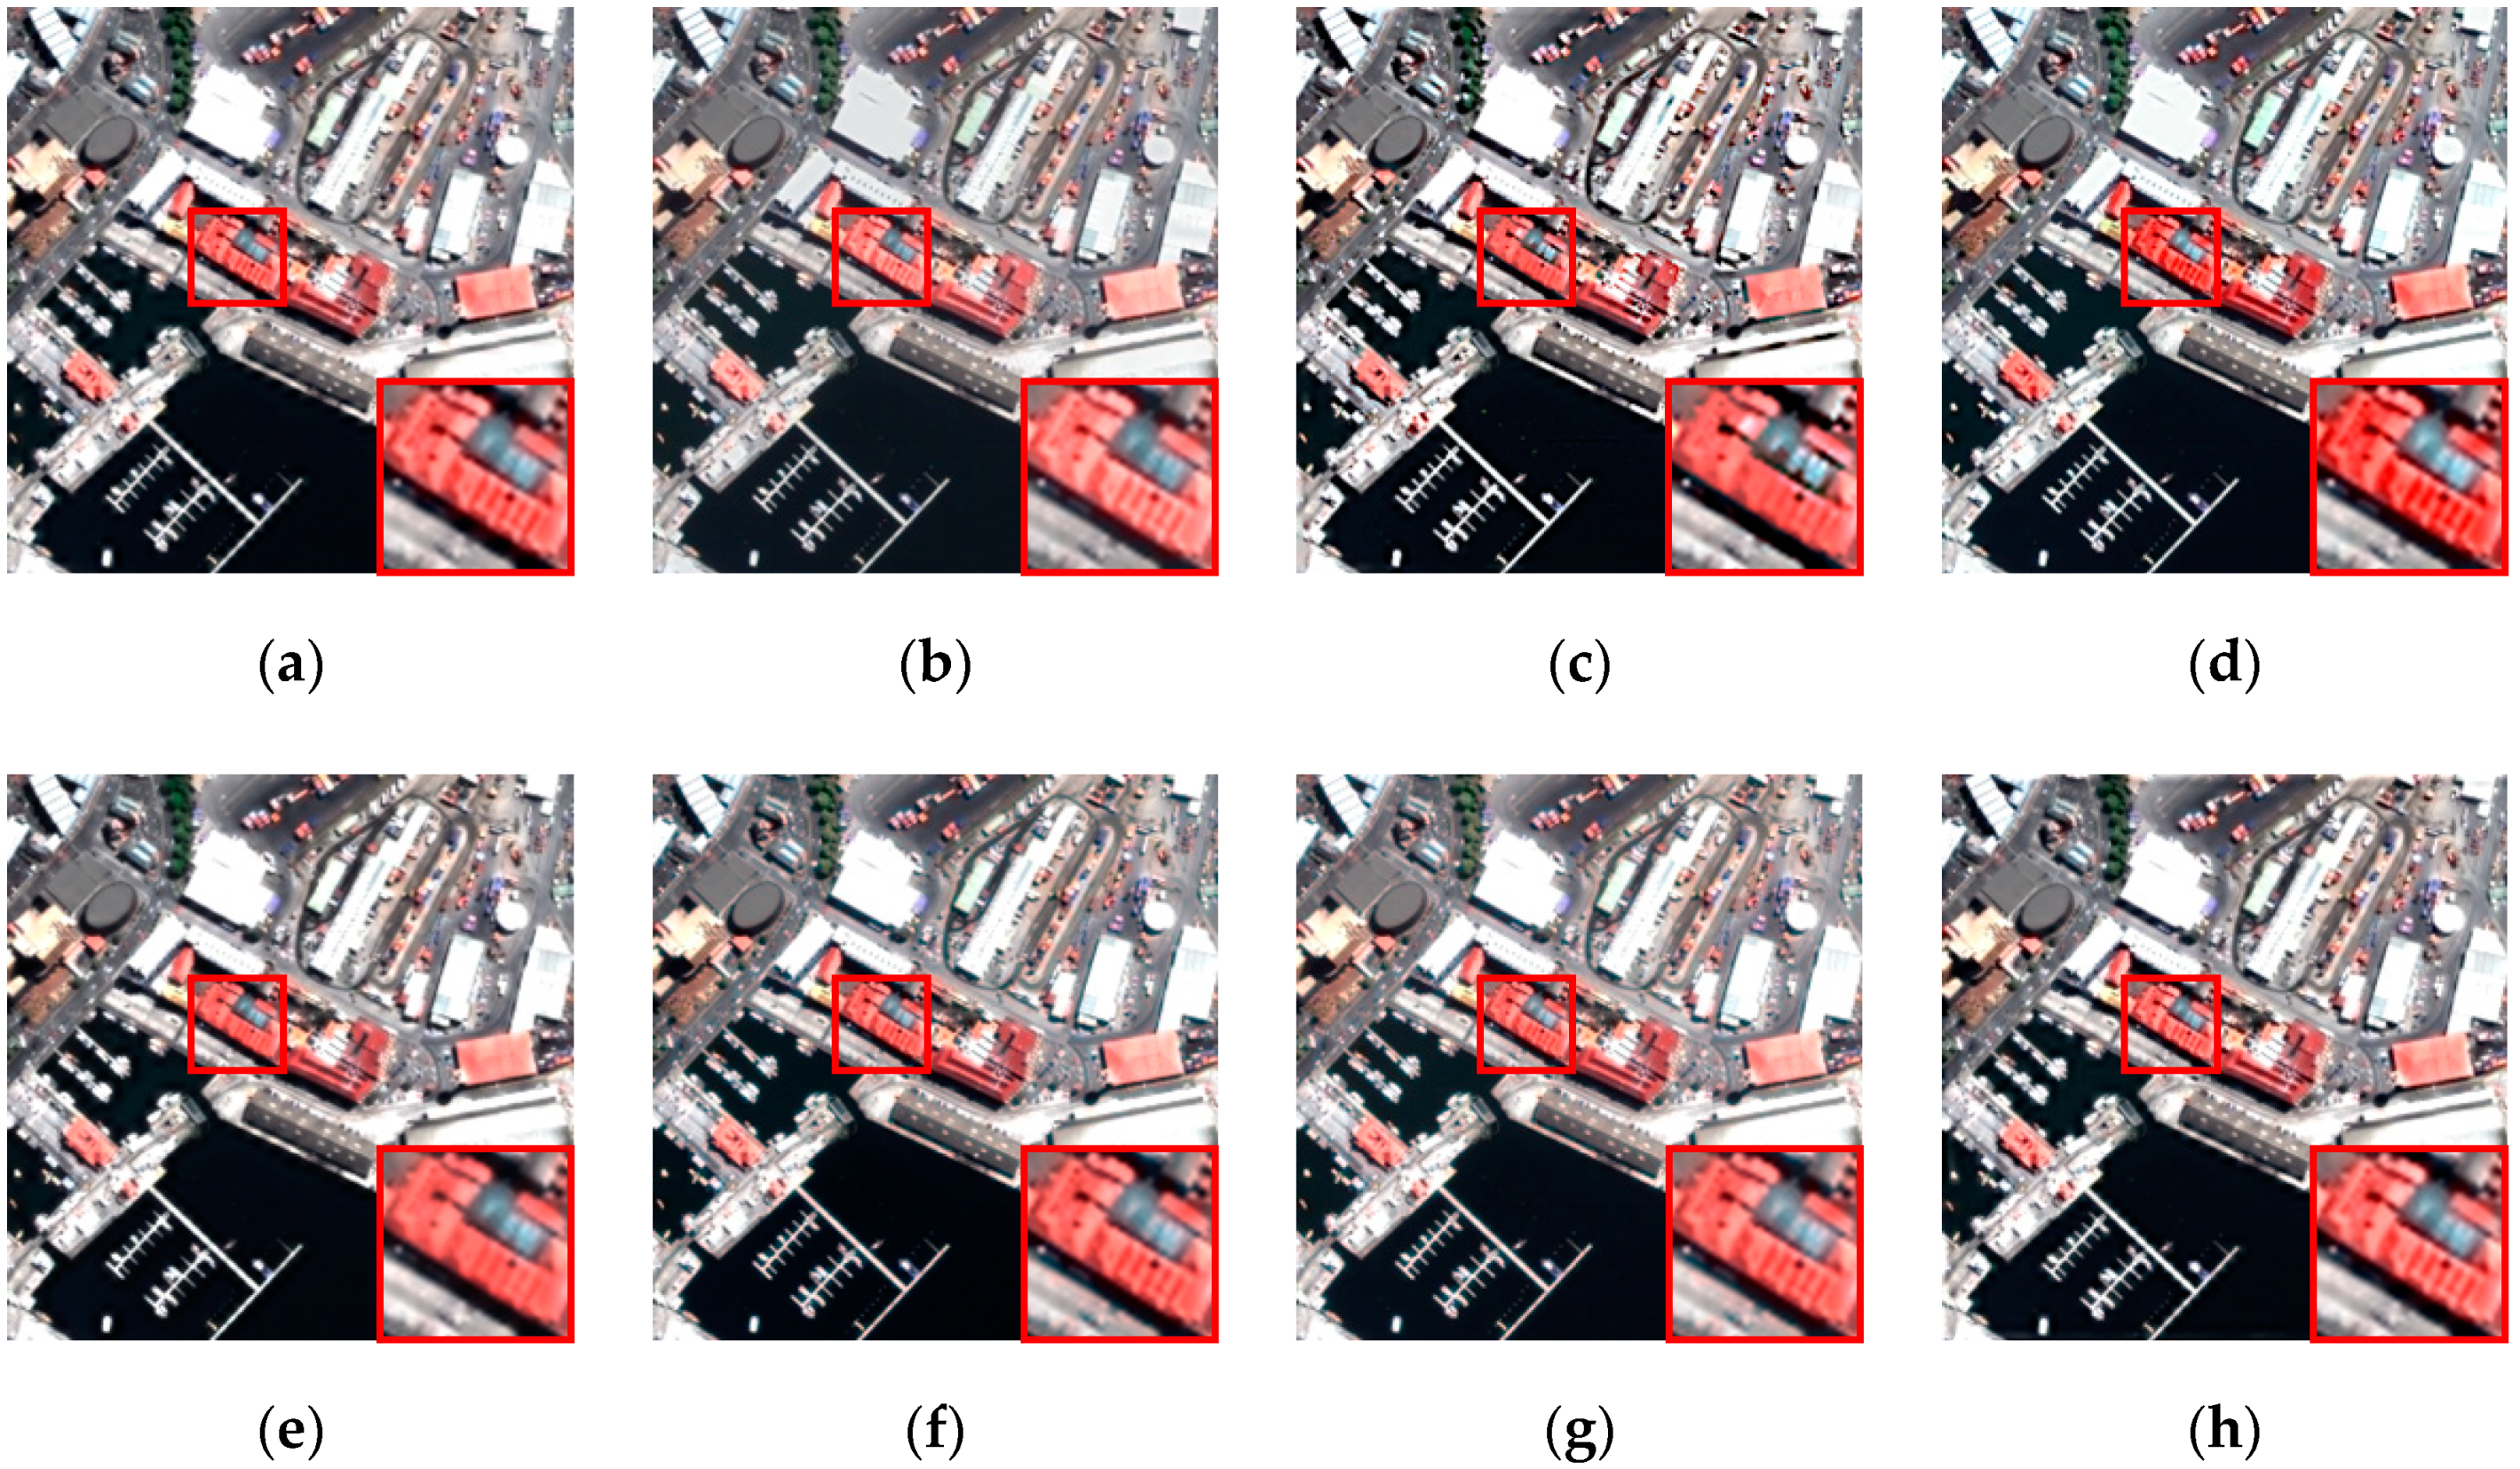
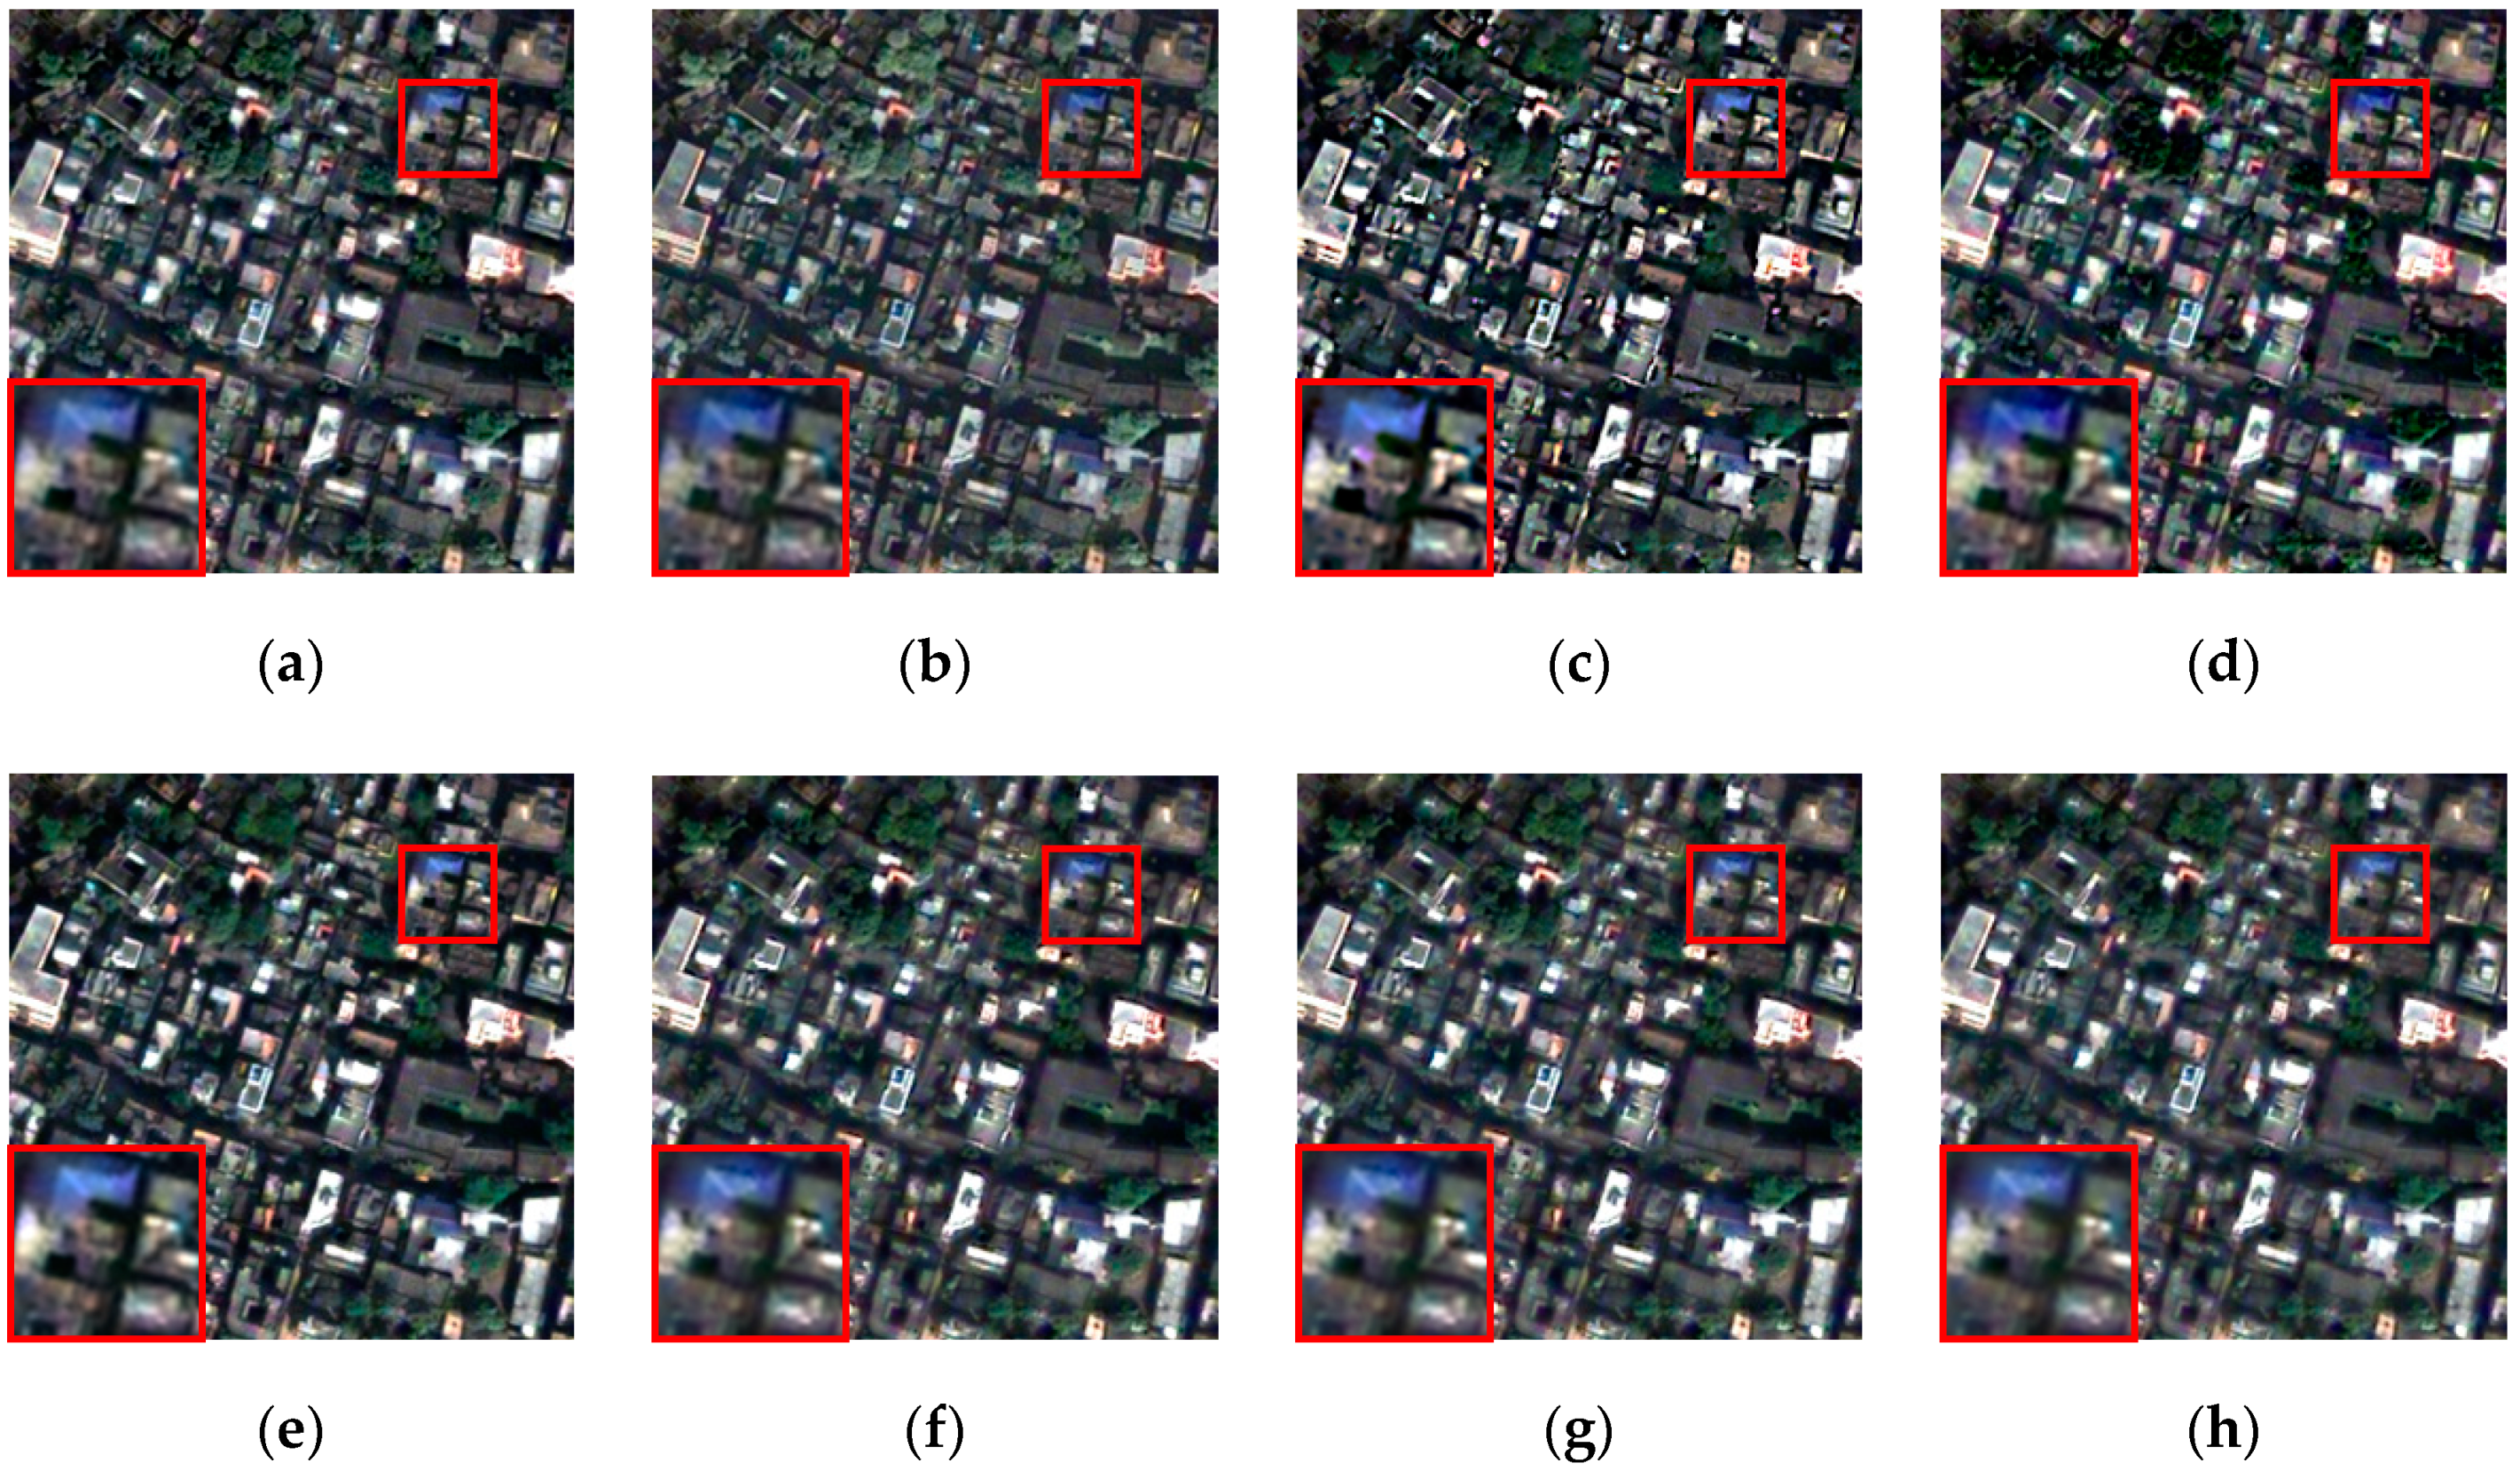
As shown in Figure 6c,g,d,h, two groups of real data sets from different satellites were applied to evaluate the performance of the proposed method in practical applications. The first set of images is from the GeoEye-1 satellite, as illustrated in Figure 6c,g, and the second set of real data shown in Figure 6d,h was collected from the QuickBird satellite. Figure 9 and Figure 10 show the fusion images of the comparison methods and the proposed method based on the two groups of real data in Figure 6, respectively. The corresponding objective evaluation indices are given in Table 4 and Table 5.
Based on a subjective visual evaluation of Figure 9, it can be seen that the fusion result produced by GS suffers from some blurring and a certain degree of spectral distortion. The fusion result of MTF-GLP-CBD has some intensity distortion and excessive contrast in local areas. The MF-HG fusion result has relatively clear spatial details but slight spectral distortion. BDSD obtained excessive spatial detailsin local areas and results in some color distortion. The fusion result of GSA-BPT suffers from some color degradation and spectral distortionin local areas. The fusion results produced by ATWT, GSA-HA, and our proposed method achieved better visual effects compared with the other methods.
Figure 10 shows the fusion results from the second group of the real data set. Subjectively, the fusion image of GS has darker colors and suffers from serious spectral distortion. It can be seen that the result from ATWT has relatively clear spatial details, but spectral distortion occurs in some local areas. The results produced by MTF-GLP-CBD and MF-HG have relatively high contrast, which leads to some intensity and spectral distortion. The fusion results of GSA-BPT, GSA-HA, BDSD, and our proposed method have relatively better visual quality. The BDSD result shows clearer spatial details as compared to the other three methods, but it is difficult to distinguish the spectral preservation from the visual effects of these four methods.
Table 4 and Table 5 list the objective assessment of Figure 9 and Figure 10, respectively. As can be seen from Table 4, the optimal values of the and QNR indices are obtained by GSA-HA and ATWT, respectively. The QNR index of our proposed method achieves a suboptimal value, and the value of the index obtained by the proposed method is also slightly higher than the optimal one. The best is obtained by our method. In this group of images, although the spectral distortion is reduced, some spatial information is also lost. Due to the introduction of spectral modulation in our method, the spatial quality may not be good enough in some cases. Table 5 shows the objective assessment of Figure 10, from which we can see that our proposed method achieves the best values of all three indices.
5. Conclusions
A pansharpening method based on local adaptive spectral modulation (LASM) construction and cooperation with segmentation is proposed in this paper. The k-means algorithm is used to segment low-resolution multispectral (LRMS) images; pixels with similar spectral characteristics are clustered into the same connected component group, then local injection coefficients are estimated based on the connected component groups. In this paper, we propose LASM for the modulation of spectral information in the fusion result, and the construction of LASM is based on extraction of details from original images and the local spectral relationships between multispectral (MS) bands. After the detail injection and spectral modulation are completed according to the fusion model, the optimal number of segments can be adaptively chosen by measuring the distance between the fusion result and the upsampled LRMS image, then we can make the spectral characteristics of the high-resolution multispectral (HRMS) image as close as possible to those of the original LRMS image. Using the idea of cooperation between pansharpening and segmentation, image segmentation is applied to optimize the fusion result, and the parameters of the segmentation algorithm are adjusted according to the feedback from the fusion image. Finally, experiments on degraded and real data sets from the GeoEye-1 and QuickBird satellites demonstrate the effectiveness and superiority of our proposed method. Compared with seven of the classic and state-of-the-art pansharpening methods, our method has advantages in spatial detail injection and spectral information preservation, while reducing spectral distortion.
However, in some cases, although spectral distortion is reduced, some spatial information is also lost. As for our method, due to its emphasis on spectral preservation, the spatial quality may not be good enough in some cases and its generalization ability remains to be improved. For this paper, segmentation is not discussed as a focus, but only as an optimization aid. In the next step, first we will focus on the influence of spectral characteristics and ground object complexity on pansharpening, and design different fusion strategies according to different image content, and then we will study more segmentation methods that can be used to cooperate with pansharpening and further improve the fusion quality.
Author Contributions
Conceptualization, L.W.; formal analysis, K.Q.; methodology, J.J.; validation, J.J. and K.Q.; writing—original draft preparation, J.J.; writing—review and editing, J.J.
Funding
This research was funded by the National Nature Science Foundation of China, grant number 61801513 and the Defense Equipment Pre-research Foundation, grant number 61420100103.
Conflicts of Interest
The authors declare no conflict of interest.
References
- Han, C.; Zhang, H.Y.; Gao, C.G.; Jiang, C. A remote sensing image fusion method based on the analysis sparse model. IEEE J. Sel. Top. Appl. Earth Observ. Remote Sens. 2016, 9, 439–453. [Google Scholar] [CrossRef]
- Thomas, C.; Ranchin, T.; Wald, L.; Chanussot, J. Synthesis of multispectral images to high spatial resolution: A critical review of fusion methods based on remote sensing physics. IEEE Trans. Geosci. Remote Sens. 2008, 46, 1301–1312. [Google Scholar] [CrossRef]
- Aiazzi, B.; Alparone, L.; Baronti, S.; Selva, M. Twenty-five years of pansharpening: A critical review and new developments. In Signal and Image Processing for Remote Sensing, 2nd ed.; Routledge: New York, NY, USA; Boca Raton, FL, USA, 2012; pp. 533–548. [Google Scholar]
- Vivone, G.; Alparone, L.; Chanussot, J.; Mura, M.D.; Garzelli, A.; Licciardi, G.A.; Restaino, R.; Wald, L. A critical comparison among pansharpening algorithms. IEEE Trans. Geosci. Remote Sens. 2015, 53, 2565–2586. [Google Scholar] [CrossRef]
- Carper, W.J.; Lillesand, T.M.; Kiefer, P.W. The use of intensity-hue-saturation transformation for merging SPOT panchromatic and multispectral image data. Photogramm. Eng. Remote Sens. 1990, 56, 459–467. [Google Scholar]
- Chavez, P.S.; Kwarteng, A.Y. Extracting spectral contrast in Landsat thematic mapper image data using selective principal component analysis. Photogramm. Eng. Remote Sens. 1989, 55, 339–348. [Google Scholar]
- Laben, C.A.; Brower, B.V. Process for Enhancing the Spatial Resolution of Multispectral Imagery Using Pan-Sharpening. U.S. Patent 6,011,875 A, 4 January 2000. [Google Scholar]
- Garzelli, A.; Nencini, F.; Capobianco, L. Optimal MMSE pan sharpening of very high resolution multispectral images. IEEE Trans. Geosci. Remote Sens. 2008, 46, 228–236. [Google Scholar] [CrossRef]
- Shensa, M.J. The discrete wavelet transform: Wedding the à trous and Mallat algorithms. IEEE Trans. Signal Process. 1992, 40, 2464–2482. [Google Scholar] [CrossRef]
- Burt, P.J.; Adelson, E.H. The Laplacian pyramid as a compact image code. IEEE Commun. Lett. 1983, 31, 532–540. [Google Scholar] [CrossRef]
- Nencini, F.; Garzelli, A.; Baronti, S.; Alparone, L. Remote sensing image fusion using the curvelet transform. Inf. Fusion 2007, 8, 143–156. [Google Scholar] [CrossRef]
- Cunha, A.L.; Zhou, J.P.; Do, M.N. The non-subsampled contourlet transform: Theory, design, and applications. IEEE Trans. Image Process. 2006, 15, 3089–3101. [Google Scholar] [CrossRef]
- Aiazzi, B.; Alparone, L.; Barducci, A.; Baronti, S.; Pippi, I. Multispectral fusion of multisensor image data by the generalized Laplacian pyramid. In Proceedings of the International Geoscience and Remote Sensing Symposium (IGARSS), Hamburg, Germany, 28 June–2 July 1999; pp. 1183–1185. [Google Scholar]
- Aiazzi, B.; Alparone, L.; Baronti, S.; Garzelli, A. Context-driven fusion of high spatial and spectral resolution images based on oversampled multiresolution analysis. IEEE Trans. Geosci. Remote Sens. 2002, 40, 2300–2312. [Google Scholar] [CrossRef]
- Aiazzi, B.; Alparone, L.; Baronti, S.; Garzelli, A.; Selva, M. MTF tailored multiscale fusion of high-resolution MS and Pan imagery. Photogramm. Eng. Remote Sens. 2006, 72, 591–596. [Google Scholar] [CrossRef]
- Fasbender, D.; Radoux, J.; Bogaert, P. Bayesian data fusion for adaptable image pansharpening. IEEE Trans. Geosci. Remote Sens. 2008, 46, 1847–1857. [Google Scholar] [CrossRef]
- Zhang, H.K.; Huang, B. A new look at image fusion methods from a bayesian perspective. Remote Sens. 2015, 7, 6828–6861. [Google Scholar] [CrossRef]
- Palsson, F.; Sveinsson, J.R.; Ulfarsson, M.O. A new pansharpening algorithm based on total variation. IEEE Geosci. Remote Sens. Lett. 2014, 11, 318–322. [Google Scholar] [CrossRef]
- Candès, E.J.; Romberg, J.; Tao, T. Robust uncertainty principles: Exact signal reconstruction from highly incomplete frequency information. IEEE Trans. Inf. Theory 2006, 52, 489–509. [Google Scholar] [CrossRef]
- Ghahremani, M.; Ghassemian, H.A. Compressed-Sensing-based pan-sharpening method for spectral distortion reduction. IEEE Trans. Geosci. Remote Sens. 2016, 54, 2194–2206. [Google Scholar] [CrossRef]
- Liu, Y.; Liu, S.P.; Wang, Z.F. A general framework for image fusion based on multiscale transform and sparse representation. Inf. Fusion 2015, 24, 147–164. [Google Scholar] [CrossRef]
- Vivone, G.; Restaino, R.; Mura, M.D.; Licciardi, G.; Chanussot, J. Contrast and error-based fusion schemes for multispectral image pansharpening. IEEE Geosci. Remote Sens. Lett. 2013, 11, 930–934. [Google Scholar] [CrossRef]
- Mura, M.D.; Vivone, G.; Restaino, R.; Chanussot, J. Context-adaptive pansharpening based on binary partition tree segmentation. In Proceedings of the International Conference on Image Processing (ICIP), Paris, France, 27–30 October 2014; pp. 3924–3928. [Google Scholar]
- Restaino, R.; Vivone, G.; Dalla, M.M.; Chanussot, J. Fusion of multispectral and panchromatic images based on morphological operators. IEEE Trans. Image Process. 2016, 25, 2882–2895. [Google Scholar] [CrossRef]
- Aiazzi, B.; Baronti, S.; Lotti, F.; Selva, M. A comparison between global and context-adaptive pansharpening of multispectral images. IEEE Geosci. Remote Sens. Lett. 2009, 6, 302–306. [Google Scholar] [CrossRef]
- Wang, H.X.; Jiang, W.S.; Lei, C.Q.; Qin, S.L.; Wang, J.L. A robust image fusion method based on local spectral and spatial correlation. IEEE Geosci. Remote Sens. Lett. 2014, 11, 454–458. [Google Scholar] [CrossRef]
- Garzelli, A. Pansharpening of multispectral images based on nonlocal parameter optimization. IEEE Trans. Geosci. Remote Sens. 2015, 53, 2096–2107. [Google Scholar] [CrossRef]
- Restaino, R.; Mura, M.D.; Vivone, G.; Chanussot, J. Context-adaptive pansharpening based on image segmentation. IEEE Trans. Geosci. Remote Sens. 2017, 55, 753–766. [Google Scholar] [CrossRef]
- Xu, Q.Z.; Zhang, Y.; Li, B.; Ding, L. Pansharpening using regression of classified MS and Pan images to reduce color distortion. IEEE Geosci. Remote Sens. Lett. 2015, 12, 28–32. [Google Scholar]
- Alparone, L.; Baronti, S.; Garzelli, A. Assessment of image fusion algorithms based on noncritically decimated pyramids and wavelets. In Proceedings of the Geoscience and Remote Sensing Symposium (IGARSS), Sydney, Australia, 9–13 July 2001; pp. 852–854. [Google Scholar]
- Zhukov, B.S.; Oertel, D.; Lanzl, F.; Reinhäckel, G. Unmixing-based multisensor multiresolution image fusion. IEEE Trans. Geosci. Remote Sens. 1999, 37, 1212–1226. [Google Scholar] [CrossRef]
- Zhou, X.R.; Liu, J.; Liu, S.G.; Cao, L.; Zhou, Q.M.; Huang, H.W. A GIHS-based spectral preservation fusion method for remote sensing images using edge restored spectral modulation. ISPRS J. Photogramm. Remote Sens. 2014, 88, 16–27. [Google Scholar] [CrossRef]
- Yang, Y.; Wu, L.; Huang, S.Y.; Tang, Y.J.; Wan, W.G. Pansharpening for Multiband Images With Adaptive Spectral–Intensity Modulation. IEEE J. Sel. Top. Appl. Earth Observ. Remote Sens. 2018, 9, 3196–3208. [Google Scholar] [CrossRef]
- Choi, J.; Yu, K.Y.; Kim, Y. A new adaptive component-substitution-based satellite image fusion by using partial replacement. IEEE Trans. Geosci. Remote Sens. 2011, 49, 295–309. [Google Scholar] [CrossRef]
- Chen, R.Y.; Zheng, C.; Shen, L.Z.; Li, G.Q.; Tan, L.N. Cooperation between fusion and segmentation for multisource image. Acta Electron. Sin. 2015, 43, 1994–2000. [Google Scholar]
- Salazar, A.; Igual, J.; Safont, G.; Vergara, L.; Vidal, A. Image applications of agglomerative clustering using mixtures of non-Gaussian distributions. In Proceedings of the 2015 International Conference on Computational Science and Computational Intelligence (CSCI), Las Vegas, NV, USA, 7–9 December 2015; pp. 459–463. [Google Scholar]
- Alparone, L.; Baronti, S.; Garzelli, A.; Nencini, F. A global quality measurement of pan-sharpened multispectral imagery. IEEE Geosci. Remote Sens. Lett. 2004, 1, 313–317. [Google Scholar] [CrossRef]
- Wang, Z.; Bovik, A.C.; Sheikh, H.R.; Simoncelli, E.P. Image quality assessment: From error visibility to structural similarity. IEEE Trans. Image Process. 2004, 13, 600–612. [Google Scholar] [CrossRef] [PubMed]
- Yuhas, R.H.; Goetz, A.F.H.; Boardman, J.W. Discrimination among semi-arid landscape endmembers using the Spectral Angle Mapper (SAM) algorithm. In Proceedings of the Summaries of the Third Annual JPL Airborne Geoscience Workshop, Boulder, CO, USA, 1–5 June 1992; pp. 147–149. [Google Scholar]
- Yang, Y.; Wu, L.; Huang, S.Y.; Wan, W.G.; Que, Y. Remote sensing image fusion based on adaptively weighted joint detail injection. IEEE Access 2018, 6, 6849–6864. [Google Scholar] [CrossRef]
- Wang, Z.; Bovik, A.C. A universal image quality index. IEEE Signal. Process. Lett. 2002, 9, 81–84. [Google Scholar] [CrossRef]
- Alparone, L.; Aiazzi, B.; Baronti, S.; Garzelli, A.; Nencini, F.; Selva, M. Multispectral and panchromatic data fusion assessment without reference. Photogramm. Eng. Remote Sens. 2008, 74, 193–200. [Google Scholar] [CrossRef]
- Zhang, L.P.; Shen, H.F. Progress and future of remote sensing data fusion. J. Remote Sens. 2016, 20, 1050–1061. [Google Scholar]
Figure 1.
Fusion results of multispectral (MS) and panchromatic (PAN) images from the GeoEye-1 data set: (a) reference image; (b) fusion image of spectral modulation (SM) based method; (c) fusion image of method without local adaptive spectral modulation (LASM); (d) fusion image of method using LASM.

Figure 2.
Horizontal spectral profiles of fusion results for test results in Figure 1: (a) Red band; (b) Green band; (c) Blue band; and (d) near-infrared (NIR) band. WOLASM, without LASM.
Figure 2.
Horizontal spectral profiles of fusion results for test results in Figure 1: (a) Red band; (b) Green band; (c) Blue band; and (d) near-infrared (NIR) band. WOLASM, without LASM.

Figure 3.
Flowchart of proposed pansharpening method. MTF-GLP, modulation transfer function matched generalized Laplacian pyramid.
Figure 3.
Flowchart of proposed pansharpening method. MTF-GLP, modulation transfer function matched generalized Laplacian pyramid.

Figure 4.
Segmentation and fusion results of example data from the GeoEye-1 satellite: (a) segmentation result by k-means; (b) fusion result of method without segmentation; and (c) fusion result based on cooperation with segmentation.
Figure 4.
Segmentation and fusion results of example data from the GeoEye-1 satellite: (a) segmentation result by k-means; (b) fusion result of method without segmentation; and (c) fusion result based on cooperation with segmentation.

Figure 5.
Performance of fusion results of Figure 4b,c.
Figure 5.
Performance of fusion results of Figure 4b,c.

Figure 6.
Experimental data sets used for assessment (images in a,e and c,g came from the GeoEye-1 satellite, and images in b,f and d,h were collected from the QuickBird satellite): (a) degraded PAN image 1; (b) degraded PAN image 2; (c) real PAN image 1; (d) real PAN image 2; (e) degraded MS image 1; (f) degraded MS image 2; (g) real MS image 1; and (h) real MS image 2.

Figure 7.
Fusion results of degraded data set from the GeoEye-1 satellite: (a) reference image; (b) à trous wavelet transform (ATWT); (c) Gram-Schmidt (GS); (d) MTF matched GLP with context-based decision (MTF-GLP-CBD); (e) band-dependent spatial detail (BDSD); (f) morphological filter-half gradients (MF-HG); (g) Gram–Schmidt adaptivebased on binary partition tree (GSA-BPT); (h) Gram–Schmidt adaptive with histogram-adjusted (GSA-HA); and (i) proposed method.

Figure 8.
Fusion results of degraded data set from the QuickBird satellite: (a) reference image; (b) ATWT; (c) GS; (d) MTF-GLP-CBD; (e) BDSD; (f) MF-HG; (g) GSA-BPT; (h) GSA-HA; and (i) proposed method.
Figure 8.
Fusion results of degraded data set from the QuickBird satellite: (a) reference image; (b) ATWT; (c) GS; (d) MTF-GLP-CBD; (e) BDSD; (f) MF-HG; (g) GSA-BPT; (h) GSA-HA; and (i) proposed method.


Figure 9.
Fusion results of real data set from the GeoEye-1 satellite: (a) ATWT; (b) GS; (c) MTF-GLP-CBD; (d) BDSD; (e) MF-HG; (f) GSA-BPT; (g) GSA-HA; and (h) proposed method.
Figure 9.
Fusion results of real data set from the GeoEye-1 satellite: (a) ATWT; (b) GS; (c) MTF-GLP-CBD; (d) BDSD; (e) MF-HG; (f) GSA-BPT; (g) GSA-HA; and (h) proposed method.

Figure 10.
Fusion results of real data set from the QuickBird satellite: (a) ATWT; (b) GS; (c) MTF-GLP-CBD; (d) BDSD; (e) MF-HG; (f) GSA-BPT; (g) GSA-HA; and (h) proposed method.
Figure 10.
Fusion results of real data set from the QuickBird satellite: (a) ATWT; (b) GS; (c) MTF-GLP-CBD; (d) BDSD; (e) MF-HG; (f) GSA-BPT; (g) GSA-HA; and (h) proposed method.


Table 1.
Performance evaluation results of Figure 1. CC, correlation coefficient; SSIM, structural similarity; SAM, spectral angle mapper; RMSE, root mean square error; ERGAS, erreur relative globale adimensionnelle de synthèse; UIQI, universal image quality index.
Table 1.
Performance evaluation results of Figure 1. CC, correlation coefficient; SSIM, structural similarity; SAM, spectral angle mapper; RMSE, root mean square error; ERGAS, erreur relative globale adimensionnelle de synthèse; UIQI, universal image quality index.
| Pansharpening Methods | Performance Indices | |||||
|---|---|---|---|---|---|---|
| CC | SSIM | SAM | RMSE | ERGAS | UIQI | |
| Proposed method with SM [32] | 0.9150 | 0.7997 | 6.6977 | 22.0090 | 4.8603 | 0.8897 |
| Proposed method without LASM | 0.9396 | 0.8342 | 5.8355 | 17.3958 | 3.9040 | 0.9185 |
| Proposed method with LASM | 0.9398 | 0.8345 | 5.8292 | 17.4075 | 3.8822 | 0.9190 |
Table 2.
Objective quantitative indices obtained by compared methods for degraded GeoEye-1 data set.
Table 2.
Objective quantitative indices obtained by compared methods for degraded GeoEye-1 data set.
| Quality Indices | Pansharpening Algorithms | |||||||
|---|---|---|---|---|---|---|---|---|
| ATWT | GS | MTF-GLP-CBD | BDSD | MF-HG | GSA-BPT | GSA-HA | Proposed | |
| CC | 0.9368 | 0.9358 | 0.8778 | 0.9373 | 0.9357 | 0.9334 | 0.9359 | 0.9398 |
| SSIM | 0.8283 | 0.8085 | 0.7299 | 0.8222 | 0.8318 | 0.8113 | 0.8244 | 0.8345 |
| SAM | 6.0425 | 6.0129 | 8.8873 | 6.806 | 5.7723 | 7.0064 | 7.3112 | 5.8292 |
| RMSE | 17.7293 | 19.7887 | 30.1107 | 18.3741 | 18.2025 | 19.4402 | 19.3590 | 17.4075 |
| ERGAS | 3.992 | 4.5528 | 6.8347 | 4.1927 | 4.1183 | 4.5577 | 4.3275 | 3.8822 |
| UIQI | 0.91505 | 0.88046 | 0.8257 | 0.91248 | 0.91306 | 0.904 | 0.9126 | 0.9190 |
Table 3.
Objective quantitative indices obtained by compared methods for degraded QuickBird data set.
Table 3.
Objective quantitative indices obtained by compared methods for degraded QuickBird data set.
| Quality Indices | Pansharpening Algorithms | |||||||
|---|---|---|---|---|---|---|---|---|
| ATWT | GS | MTF-GLP-CBD | BDSD | MF-HG | GSA-BPT | GSA-HA | Proposed | |
| CC | 0.9243 | 0.8912 | 0.8879 | 0.8766 | 0.9281 | 0.8960 | 0.9152 | 0.9301 |
| SSIM | 0.8119 | 0.8142 | 0.7019 | 0.7560 | 0.8185 | 0.7099 | 0.7673 | 0.8279 |
| SAM | 7.3188 | 6.2933 | 9.7456 | 8.0442 | 6.4970 | 8.4747 | 11.2664 | 6.9827 |
| RMSE | 24.8773 | 24.961 | 38.8924 | 30.8421 | 25.2616 | 36.3645 | 29.7974 | 23.5914 |
| ERGAS | 7.7099 | 7.6853 | 12.0453 | 9.4242 | 8.025 | 11.1851 | 9.1582 | 7.2349 |
| UIQI | 0.9020 | 0.8770 | 0.8160 | 0.8505 | 0.9016 | 0.8322 | 0.8748 | 0.9103 |
Table 4.
Objective quantitative indices obtained by compared methods for real GeoEye-1 data set.
| Quality Indices | Pansharpening Algorithms | |||||||
|---|---|---|---|---|---|---|---|---|
| ATWT | GS | MTF-GLP-CBD | BDSD | MF-HG | GSA-BPT | GSA-HA | Proposed | |
| 0.0140 | 0.0202 | 0.0161 | 0.0351 | 0.0253 | 0.0404 | 0.0200 | 0.0136 | |
| 0.0307 | 0.0416 | 0.0840 | 0.0308 | 0.0551 | 0.0341 | 0.0290 | 0.0394 | |
| QNR | 0.9558 | 0.9390 | 0.9012 | 0.9351 | 0.9210 | 0.9269 | 0.9516 | 0.9475 |
Table 5.
Objective quantitative indices obtained by compared methods for real QuickBird data set.
| Quality Indices | Pansharpening Algorithms | |||||||
|---|---|---|---|---|---|---|---|---|
| ATWT | GS | MTF-GLP-CBD | BDSD | MF-HG | GSA-BPT | GSA-HA | Proposed | |
| 0.0854 | 0.0778 | 0.0848 | 0.0353 | 0.0807 | 0.0368 | 0.0341 | 0.0306 | |
| 0.0688 | 0.1248 | 0.0523 | 0.0280 | 0.0587 | 0.0404 | 0.0414 | 0.0209 | |
| QNR | 0.8516 | 0.8070 | 0.8673 | 0.9377 | 0.8653 | 0.9243 | 0.9259 | 0.9491 |
© 2019 by the authors. Licensee MDPI, Basel, Switzerland. This article is an open access article distributed under the terms and conditions of the Creative Commons Attribution (CC BY) license (http://creativecommons.org/licenses/by/4.0/).
Share and Cite
MDPI and ACS Style
Jiao, J.; Wu, L.; Qian, K. A Segmentation-Cooperated Pansharpening Method Using Local Adaptive Spectral Modulation. Electronics 2019, 8, 685. https://0-doi-org.brum.beds.ac.uk/10.3390/electronics8060685
AMA Style
Jiao J, Wu L, Qian K. A Segmentation-Cooperated Pansharpening Method Using Local Adaptive Spectral Modulation. Electronics. 2019; 8(6):685. https://0-doi-org.brum.beds.ac.uk/10.3390/electronics8060685
Chicago/Turabian StyleJiao, Jiao, Lingda Wu, and Kechang Qian. 2019. "A Segmentation-Cooperated Pansharpening Method Using Local Adaptive Spectral Modulation" Electronics 8, no. 6: 685. https://0-doi-org.brum.beds.ac.uk/10.3390/electronics8060685
Note that from the first issue of 2016, this journal uses article numbers instead of page numbers. See further details here.