Correlating Espresso Quality with Coffee-Machine Parameters by Means of Association Rule Mining


Department of Control and Computer Engineering, Politecnico di Torino, Corso Duca degli Abruzzi 24, 10129 Torino, Italy
*
Author to whom correspondence should be addressed.
Electronics 2020, 9(1), 100; https://0-doi-org.brum.beds.ac.uk/10.3390/electronics9010100
Submission received: 29 November 2019
/
Revised: 30 December 2019
/
Accepted: 31 December 2019
/
Published: 4 January 2020
(This article belongs to the Special Issue Big Data Analytics for Smart Cities)
Abstract
:Coffee is among the most popular beverages in many cities all over the world, being both at the core of the busiest shops and a long-standing tradition of recreational and social value for many people. Among the many coffee variants, espresso attracts the interest of different stakeholders: from citizens consuming espresso around the city, to local business activities, coffee-machine vendors and international coffee industries. The quality of espresso is one of the most discussed and investigated issues. So far, it has been addressed by means of human experts, electronic noses, and chemical approaches. The current work, instead, proposes a data-driven approach exploiting association rule mining. We analyze a real-world dataset of espresso brewing by professional coffee-making machines, and extract all correlations among external quality-influencing variables and actual metrics determining the quality of the espresso. Thanks to the application of association rule mining, a powerful data-driven exhaustive and explainable approach, results are expressed in the form of human-readable rules combining the variables of interest, such as the grinder settings, the extraction time, and the dose amount. Novel insights from real-world coffee extractions collected on the field are presented, together with a data-driven approach, able to uncover insights into the espresso quality and its impact on both the life of consumers and the choices of coffee-making industries.
1. Introduction
Coffee, besides being one of the most popular beverages all over the world, remains a ritual in many cities, during work breaks and recreational times, both at home and in local business activities. While coffee is a general term for a key ingredient of many different drinks, espresso is among the most discussed variants in terms of quality issues.
Espresso is at the forefront of establishing the gold standards in terms of professional coffee brewing. In some countries, such as Italy, where 97% of adults drink espresso daily [1], espresso quality is a main driver for consumers’ habits in the city, able to move people from a coffee shop, namely a “bar”, to another nearby. The primary focus on espresso quality is also confirmed by a memorable slogan from a past advertising campaign of a top-level Italian coffee brand: “Espresso is a pleasure. If it isn’t good, what pleasure is it?”.
Espresso is not only an energizer of the daily life of many citizens, but also an economic driver, with a combined value of several billion euros in Italy only, from roasting to retailing coffee, to manufacturing machines for home, office, and bar usage. In 2018, each Italian had 2.2 daily espresso cups on average, i.e., 6 kg yearly, in one of the 150 thousand bars, with each bar using 1.2 kg of ground coffee daily to serve almost 200 coffees on average, and most of them were espresso, representing approximately one third of a medium bar turnover [1].
Espresso is an almost syrupy beverage generated by a machine, typically using a motor-driven pump, forcing pressurized hot water through finely ground coffee. Each espresso shot in a bar can generate one or two cups of coffee, being called, respectively, single or double, and requiring proportional amounts of ground coffee. Each cup can be normal, reduced or long, depending on the amount of water, with the same amount of ground coffee.
Both non-professional espresso enthusiasts and coffee brands or associations love to share their opinions, suggestions, and tricks to obtain the best espresso. According to common knowledge and online sources [1,2], such as the Italian Espresso National Institute, a perfect espresso depends on different variables: (i) the coffee blend as a core ingredient with an essential role; (ii) the grinder settings, being responsible for the right weight of coffee grounds and for how fine it is ground; (iii) the espresso machine, with professional machine-makers improving such technology over and over to promise the perfect espresso all the time; (iv) the barista, i.e., the human-in-the-loop preparing the espresso in the bar, from blend choice, to manual grinder settings, and to proper usage of the coffee machine and its brewing procedure.
The ideal portion of ground coffee for each cup is declared to be 7 ± 0.5 g, while the water pressure should be 9 ± 1 bar, the extraction time 25 ± 5 s, and the volume in cup 25 ± 5 mL.
For each variable, many issues arise when addressing espresso quality. For instance, while the right dose for a single cup of espresso is 7 g of coffee grounds, in presence of humidity, it is often recommended to grind the coffee more coarsely and vice-versa, hence, requiring manual adjustments to the grinder at least once a day. Besides the water pressure, the machine-pump pressure (15–18 atmospheres), and its temperature (88–95 °C) influence the espresso quality. Furthermore, the daily maintenance operations of a good barista, such as the cleaning/washing cycles, are crucial to maintain (as healthy as possible) the espresso-making machine.
In the current work, we provide a novel view on the correlation of coffee-making machine parameters and espresso quality. Among the plethora of different variables, we focus on (i) coffee ground size, (ii) ground amount, (iii) water pressure, and (iv) washing procedures.
The coffee ground derives from the process of coffee grinding from coffee beans. Small changes in the grind size can drastically affect the taste and the quality of the brewed espresso. In general, if the coffee is ground too coarse, the espresso can be under-extracted and less flavorful. On the other hand, too fine ground may result in an over-extracted and bitter coffee. The amount of ground itself impacts on quality, resulting in a too watery or bitter coffee. Water pressure must be set to brew the right coffee amount in a proper time, thus leading to the right flow rate determining an intense flavour. Finally, washing procedures are recommended to be applied to coffee-making machines to maintain a high-quality brewing. We investigate the effect of such regular operations and their absence on espresso quality.
To the best of the authors’ knowledge, this is the first research work applying a transparent machine-learning data-driven approach to exhaustively evaluate the combined effect of multiple variables on IoT-collected measurements of real-world espresso brewing. The current work contributions can be summarized as follows.
- It complements domain-expert-expected patterns with data-driven evidence and new knowledge extraction.
- It automatically identifies from data high-quality espresso shots generated by compensation behaviors of sub-optimal external variables.
- It pinpoints a methodology to determine sharper data-driven quality thresholds able to effectively detect actual top-quality espresso shots.
- It describes and applies a data-driven approach to analyze espresso quality correlations exhaustively and transparently.
Specifically related to the association rule methodology, we also provide a semantic classification of the extracted rules (see Section 5.4) to guide their interpretation by domain experts. Even if the semantic classification of association rules has already been proposed and used in different application contexts [3], this is the first application in the espresso quality assessment and, thanks to the direct interest of renowned coffee brands, it has the potential to become a reference in the field.
The paper is structured as follows. Section 2 discusses related works on quality assessment of espresso. Section 3 describes the real-world dataset and the experimental design. Section 4 introduces the association-rule data mining approach. Section 5 presents experimental results. In Section 6, a discussion of the insights from real-world coffee extractions is presented. Finally, Section 7 draws conclusions and outlines future works.
2. Related Work
The quality assessment of espresso is traditionally performed with human sensory panels. Despite human senses (sight, smell, taste, touch and hearing) being the most efficient instrument for quality evaluation, there are several limitations of human sensory panels in cost-effective and large scale applications [4]. Human quality controls require great costs in term of time, money and human resources, from the training phase to the actual quality tests. Moreover, the quality tests greatly depend on the expert skills, they are manual, subjective and not reproducible, since results may also depend on individual factors as fatigue or health condition of the panel members [4,5].
Considering these drawbacks, Gas Chromatography (GC) and Mass Spectroscopy (MS) techniques are frequently exploited for coffee quality control. Several works study the effect of different technical conditions on the final espresso quality. Authors in [6] study the influence of water pressure and classify coffee prepared at three different pressure levels exploiting Principal Components Analysis (PCA) and Discriminant Analysis (DA). The influence of pressure has also been studied in combination with the extraction temperature, and the analysis showed that the temperature and pressure settings from domain-expert guidelines (i.e., 92 °C and 9 bar) are close to the ones needed to obtain the best quality espresso coffee [7]. The effect on quality is also studied with respect to the extraction temperature [8], water composition [9], roasting conditions [10] and also of coffee/water ratio, type of coffee and roast combined [11]. Proton-transfer-reaction time-of-flight MS (PTR-ToF-MS) is also exploited for monitoring changes in the volatile composition and PCA and hierarchical cluster analysis are applied to differentiate between coffee types [12].
Gas Chromatography (GC) and Mass Spectroscopy (MS) techniques are however expensive, time-consuming and complex. They can often require a significant amount of time and human intervention to perform the analysis. For these reasons, many studies exploit Electronic Nose (EN) systems for coffee quality assessment. ENs perform reliable organoleptic analysis while being simpler and cheaper than GC/MS and their results are faster to be analyzed. An electronic nose is a device that consists of an array of chemical sensors for chemical detection and a pattern recognition system capable of identifying the specific components of an odor [13]. Several works that exploit EN systems apply PCA and Neural Networks (NN) for detecting defects in cup tests [14], for studying the difference in chemical attributes when the extraction time and grinding level are varied [15], for determining the roasting degree (coupled with GRNN) [16] and for distinguishing different coffee blends [17]. Also Support Vector Machines are often exploited, as in [5] to discriminate coffee types with the aim of recognizing the forgery of coffee blends and in [18] for distinguishing coffee blends. EN systems are also used in conjunction with GS/Olfactometry analysis, as in [19] where Linear Discriminant Analysis and NN techniques are applied for characterizing roasting degree and coffee beans from different countries. EN systems can be however too sensitive to small changes in smell and unstable when environmental condition changes [5]. Moreover, EN sensors may be sensitive also to background gases that are not of interest (e.g., water vapor) and gases not detectable by human noses (e.g., carbon monoxide) [20].
In our work, variables influencing espresso quality are collected by means of Internet of Things (IoT) sensors, embedded into professional espresso machines. Data are collected directly by the coffee machine internal sensors, sent through the mobile network, and analyzed in the cloud remotely. Coffee quality assessment can hence be performed in real-time and cost-effectively. The IoT sensor network combined with machine learning techniques provides a highly scalable approach, suitable for handling very large datasets. Data mining techniques are exploited to capture interesting correlations impacting coffee quality. The resulting model allows real-time detection of coffee quality level.
Several cited related works study the effect on quality of variables under the control of the industry, such as coffee blends, coffee types, roasting degree and roasting type. In our work, we concentrate on variables under the control of the barista, since industry-level variables are typically certified and of high quality. As in [21], the three variables, grinding grade, ground coffee amount, and pressure, that are under the barista control, are considered and discretized into three ranges. The authors study the impact on espresso volume, by providing an index of quality by means of a logistic model. In our work, three variables are exploited as quality indicators. Correlations between the three quality indexes and the three variables under the barista control are extracted by means of association rule mining. Finally, with respect to the related works, the proposed approach overcomes the scalability limitations of electronic noses and chemical techniques, which require a per-coffee inspection, by exploiting massive data collection by means of IoT devices on board of coffee machines and data-driven models that can be trained in the cloud.
Correlations among quality variables are extracted by means of association rule mining (ARM) [22]. This data mining technique automatically finds statistically relevant associations and relationships while being an explainable approach. ARM is applied to disparate contexts in different fields. Various real-world problems have been addressed with this technique. Rule mining has been extensively applied in manufacturing [23,24,25]. As an example, in [23], interesting patterns by means of association rules are generated for defect detection in semiconductor manufacturing. ARM has also been applied to the chemical domain, as in [26], to find frequent substructures of chemical compounds. Other applications are in the context of smart cities and smart homes [27], and for studying the impact of meteorological data on energy consumption [28]. Applications of ARM are also present in the food industry [29,30]. For instance, ARM is applied in [30], coupled with Internet of Things technology, to analyze safety risks in food supply chains with a real case study in the dairy industry. In [29], instead, it is applied to quality sustainability in the food supply chain with a case study in the red wine industry. Association rule mining techniques are also exploited in the emerging context of Big Data. Innovative ARM algorithms have been proposed to efficiently handle the increasing amount of digital data. Several parallel algorithms based on popular distributed computing frameworks, such as Apache Hadoop and Spark, have been proposed [31,32,33]. A recent and detailed review of Hadoop- and Spark-based scalable frequent itemset mining algorithms is provided in [34].
The growing use of IoT devices and sensors is leading to an increasing amount of data being generated in a continuous stream that dynamically evolves. Dynamic and stream data can be efficiently mined to extract emerging and novel patterns. In this scenario, recent applications presented the need of incremental mining. Incremental mining refers to the task of updating and maintaining discovered patterns over time when new data are generated and added. It deals with the generation of association rules by operating only on newly added data, considering the knowledge already derived from mining previously available data, without scanning the data again [35]. For dynamic datasets, different incremental algorithms have been proposed for mining association rules to maintain and dynamically update the discovered patterns [36,37,38,39,40,41]. Moreover, data streams are not only produced rapidly and continuously, but their distribution may also change over time. Hence, when managing high-rate streams of data, mining techniques should consider also the time component. ARM algorithms for data streams can effectively deal with data changing over time [42]. Depending on the stream data mining application, three stream data window-based processing models are used, named the landmark window model, damped window model, or sliding window model [42]. In the landmark window model, ARM is performed over the entire history of stream data from a specific point of time. In the damped window approach, data have a weight and the weight decreases with age. Finally, in the sliding window model, ARM is applied only on recently-generated data, defined by a fixed-length time window.
In the current work, coffee extraction data are collected by means of IoT sensors on board of coffee machines. Hence, real-world espresso brewing data are generated and sent at a high pace. Incremental data mining techniques for data streams could be efficiently exploited to maintain and dynamically update patterns and correlations from coffee extractions. Moreover, different window-based processing models could be applied to mine espresso extraction data streams. We intend to explore the analysis of changes of correlations over time and the impact of the applied window model in future works, as the current goal to show the potential of rule mining application to the context of static correlation analysis, which is still unexplored.
3. Dataset Description and Experimental Design
The dataset under analysis consists of real-world espresso brewing data. Each measurement describes an espresso extraction from professional coffee-making machines in a Northern Italian city. Coffee-making machines have been equipped with IoT devices able to remotely collect the operating parameters of each coffee shot. Collected data have been stored in a cloud-based repository, property of a leading international coffee brand, and analysis have been performed by extracting the portions of interest from the repository. Since the dataset is provided by a leading coffee company, we cannot disclose exact details of the real-world settings (e.g., the coffee-machine maker and model, the precise location and name of the bars). However, the proposed rule-mining approach can be successfully exploited in similar contexts and its results highlight general patterns and correlations of interest for domain experts.
Data have been collected to exhaustively investigate the combined effect of multiple (i) external variables and (ii) machine-cleaning procedures on espresso quality. (i.a) Coffee ground size, (i.b) coffee ground amount and (i.c) water pressure have been selected among the most influential external variables, while different machine-cleaning procedures have been applied to the different group heads of each machine, from (ii.a) golden-rule washing after each shot to (ii.b) no washing at all. The quality evaluation has been performed for each shot of coffee based on three variables selected by domain experts: the extraction time, the average flow rate, and the espresso volume.
An exhaustive set of coffees has been produced to observe the effect of non-optimal values on the espresso quality. For each external variable, different values are considered: ground size can be coarse, optimal, or fine; ground amount can be high, optimal, or low; brewing water pressure can be high, optimal, or low. Table 1 outlines the values of the investigated external variables. All possible combinations of the three external-variable values (e.g., optimal, high, low) have been included in the dataset, hence generating 33 = 27 possible input configurations. Furthermore, all external variables combinations have been tested with both cleaning conditions, i.e., (i) with proper washing operations and (ii) without any washing operation. In particular, washing operations include a quick purging step after each espresso brewing, which consists in flushing the group head of the machine with a small amount of hot water, hence removing residual coffee grounds and oils. Since the coffee-making machine used to collect the data has two identical group heads, one group head has been used with a no-cleaning policy, whereas the other followed a proper cleaning procedure.
All experiments are performed with the least possible variations on other influencing factors: same machine, same conditions of grinding pressure, coffee blend, and tamping pressure of the coffee grounds. The purpose of such experimental setting is to identify and quantify data-driven correlations among the three external variables (i.e., coffee ground size, coffee ground amount, water pressure) and espresso quality, limiting the effect of other operating conditions.
For each configuration among the 27 combinations of external variables (for instance: coarse ground size, optimal ground amount, and high water pressure), 40 espresso extractions have been performed: 20 out of the cleaned group head, and 20 out of the no-cleaning group head. Experiments have been repeated on a professional coffee-making machine, generating a datasets consisting of 1080 espresso extractions, of which half follow the no-cleaning policy (first group head), and half brewed with a proper washing procedure (second group head).
For each extraction (espresso brewing shot), the quality is evaluated. Actual perceived quality depends on many factors, such as the aroma, the body and density, the cream, the taste (e.g., the acidity, sweetness, bitterness), the final texture, the color intensity. Evaluating all these factors is time-consuming, expensive, and difficult, given their highly subjective nature and the requirement of manual intervention. However, objective characteristics exist to defines a high-quality espresso [2]. The most important domain-expert parameters are (i) the extraction time, (ii) the average flow rate, and (iii) the volume of espresso. For instance, the extraction time (also referenced as percolation time or brewing time in the following) crucially influences the quality of espresso coffee. Espressos brewed too quickly have a lighter body and higher acidity. Conversely, a too slow coffee brewing leads to a bitter and dry coffee. Hence, the espresso percolation time must be optimal to achieve the equilibrium of its hundreds of chemical compounds.
Determining the exact quality thresholds for extraction time, flow rate and espresso volume is a difficult task since they depend on many additional variables, such as the coffee blend, the espresso machine, the grinder, the barista and on cultural aspects and subjective preferences. However, in the current work, we present a two-stage approach. First, domain-expert popular threshold values are used, as described in Section 1. Then, data-driven values are suggested based on collected data, and the rule mining approach is performed.
The domain-expert quality thresholds used in our experiments are as follows: espresso volume from 20–30 mL, extraction time from 20–30 s. The values have been selected according to public literature, e.g., those published by the Specialty Coffee Association of Europe [2]. The flow rate thresholds derive from the above-mentioned ones, as the flow rate is the ratio of the volume by the time, hence obtaining the range 0.67–1.50 mL/s.
Given such thresholds, espresso extractions can be labelled with their quality assessment. Quality labels are optimal, too low or too high for each of the quality variables: volume, time, and flow. Table 2 recaps the domain-based threshold values and corresponding labels. During the experimental analysis, the domain-based quality thresholds will be challenged and finer data-driven values will be identified.
After the quality labeling, the dataset consists of 1080 samples, each representing an espresso extraction characterized as follows (see Table 1).
- External variables determined by human operators’ settings, with 20 samples for each of the 54 combinations of values:
- –
- coffee ground size, 3 values (coarse, optimal, or fine),
- –
- coffee ground amount, 3 values (high, optimal, or low),
- –
- brewing water pressure, 3 values (high, optimal, or low),
- –
- cleaning procedures, 2 values (properly executed or no cleaning performed).
- Quality variables measured by means of the internal coffee-machine sensors and remotely collected through the IoT network:
- –
- extraction time, 3 values (high, optimal, low),
- –
- flow rate, 3 values (high, optimal, low),
- –
- volume of coffee, 3 values (high, optimal, low).
4. Association Rule Mining Technique
Having a dataset consisting of transactional events, i.e., the 1080 espresso extractions, with categorical features, i.e., the threshold-based discretized values of the external and quality variables, association rule mining is a powerful data exploration approach which can be applied to exhaustively identify and quantify all possible correlations among variables in a human-readable form.
Let be a dataset whose generic record r is characterized by attributes , , …, . An item is a pair ( = value) and an itemset I is a set including one or more items. The support count of an itemset I denoted by is the number of records r containing I. The support of an itemset I denoted by is the percentage of records r containing I with respect to the total number of records r in the full dataset .
Frequent pattern mining is a data exploration technique that consists in finding relationships that occurs frequently among items in a database [43]. A pattern is considered of interest if it occurs with a frequency defined by means of a user-specified threshold. Specifically, an itemset is frequent when its support is greater than or equal to a minimum support threshold . Association rule mining is one of the most popular and applied frequent pattern techniques. It is is an exploratory data mining technique that models (potentially hidden) correlations in forms of association rules.
An association rule is an implication in the form , where X and Y are disjoint itemsets (i.e., ) [22]. X is called rule body or rule antecedent and Y rule head or rule consequent.
To evaluate the quality of an association rule, the support, confidence, and lift metrics are commonly exploited. Rule support → is the fraction of records containing both X and Y [22]. It represents the prior probability of , , and it indicates the probability that a record contains every item in X and Y. The support of the rule, , is computed as the support of the itemset , where indicates the union of itemsets X and Y. It is defined [22] as indicated in Equation (1), where is the dataset cardinality.
Rule confidence represents the strength of the implication and it is the conditional probability P(Y|X), that is, the probability that a transaction containing X also contains Y. It is the proportion of records that contain X which also contain Y. It is computed [22] as indicated in in Equation (2).
Finally, the lift of a rule X → Y measures the correlation between antecedent and consequent [43]. It is defined as indicated in Equation (3).
A lift ratio equal to 1.0 implies that itemsets X and Y are not correlated, i.e., they are statistically independent. A > 1 indicates a positive correlation, meaning that the occurrence of one likely leads to the occurrence of the other. The greater the lift ratio, the stronger the association, i.e., more meaningful and interesting correlations. Finally, < 1 indicates a negative correlation between itemsets X and Y, meaning that the occurrence of one implies the absence of the other one.
The problem of association rule mining consists in the extraction of all the association rules having rule support greater than and confidence greater than , where and are the corresponding support and confidence thresholds defined as parameters of the mining process [22]. The thresholds allow to control the statistical relevance of the extracted rules.
The process of rule mining can be decomposed in two steps. The first step is the computation of frequent itemsets, i.e., itemsets with support greater or equal to . The second step is the extraction of association rules from frequent itemsets. Let be F a frequent itemset, pairs X and are derived so that . The first step of the process is the most computationally expensive. Thus, several algorithms have been proposed to solve the problem of frequent itemset computation [22,44,45,46]. In the current work, we exploit the Apriori algorithm [45]. The Apriori algorithm relies on the so-called Apriori principle which states the following: if an itemset is frequent, then all its nonempty subsets are also frequent. Apriori consists on a bottom-up and level-wise search. Each iteration consists on (i) the candidate generation step and (ii) the generation of frequent itemsets. At each iteration k, candidate itemsets of length k + 1 are generated, where k is the number of items in the itemsets generated in the previous iteration. The candidate are pruned according to the Apriori principle. Hence, all candidate itemsets of length k + 1 which are a superset of an infrequent k-itemset are pruned. Then, the support of the generated candidates of length k + 1 is computed and candidates below are pruned. Finally, frequent itemsets are exploited to extract association rules (i.e., with confidence greater or equal to ).
In the current work, a record is a coffee extraction. Each extraction is characterized by six attributes, the three external variables (i.e., ground coffee amount and grinding and pressure) and the three quality indexes (i.e., percolation time, espresso volume and flow rate). The presence or absence of cleaning procedures have been used to split the dataset into two sub-datasets and . Rule extraction has been executed separately on both sub-datasets to compare the resulting rules.
5. Experimental Results
This section provides a description of the data cleaning procedures applied to the dataset (Section 5.1), a discussion of the domain-driven quality thresholds (Section 5.2), a proposal for data-driven quality thresholds (Section 5.3), and the experimental results of the rule mining (Section 5.4).
5.1. Data Cleaning
The dataset has been pre-processed according to the following data cleaning procedures, similarly to popular approaches [3,47,48]: (i) a domain-driven threshold-based filter has been applied, and (ii) a data-driven additional filter has been used.
The first threshold-based filter aims at removing outlier values being unacceptable for the phenomena under exam. For instance, purge operations (a brief washing cycle without coffee ground) can be recorded by the machine as an extraction with a very high flow and a very short time (e.g., up to 8 s). Threshold values of valid espresso extractions have been set to 10–40 ml and 10–40 s, thanks to suggestions from domain experts from a top-level international coffee brand.
The second data-driven filter aims at removing extreme values that, even if acceptable, would skew the results. To this aim, we removed 1% of the most extreme data values of quality indexes (the highest 0.5% and the lowest 0.5%). These threshold values were determined empirically to effectively remove outliers while preserving most of the collected data.
After the two-step cleaning procedure, 1027 samples remain out of the 1080 original records.
5.2. Domain-Driven Quality Evaluation
To evaluate the quality of the espressos with respect to the optimal external parameters, we firstly exploited domain-expert quality thresholds to assign quality labels to all variables. As declared in Section 3, the domain-driven thresholds are defined as follows:
- Espresso volume from 20 to 30 mL.
- Extraction time from 20 to 30 s.
- Consequently, flow rate from 0.67 to 1.50 mL/s.
All the experiments with quality index values in the optimal quality range are labelled as optimal, while they are labeled as low or high if values are lower or greater respectively. For instance, an espresso brewed in 35 s would be labeled as high for the extraction time, instead of optimal, since its extraction time is higher than the domain-expert quality threshold, which is 30 s. Similarly, an espresso brewed in 15 s would be labeled as low for the extraction time quality threshold, whose lowest value for the optimal range is 20 s. A recap of domain-based thresholds is reported in Table 2.
We evaluated the probability density of the three quality indexes. Table 3 shows the percentage distribution of the quality labels in the dataset. Most samples are labelled as optimal based on the volume and flow rate quality indexes (almost 98% and 90% respectively), while the extraction time is considered optimal in almost half of the coffee extractions. Hence, by applying domain-knowledge thresholds, almost all experiments have one or more quality indexes within the thresholds and consequently indicators of good quality. However, the experimental set was designed and performed predominantly in inappropriate conditions. Less than 4% of espressos in the dataset were brewed in an ideal configuration of external variables, whereas in the remaining 96% of samples, at least one external variable was set improperly on purpose.
Applying only public domain-expert thresholds yields to optimal labels for the majority of the experiments, even if the external variables are known to assume non-optimal ranges. The public domain-expert ranges are general enough to include espresso brewing of different espresso machines or operating conditions. Hence, we propose data-driven thresholds for capturing the effect on quality indexes of optimal external variables conditions.
5.3. Data-Driven Quality Thresholds
For the definition of data-driven quality thresholds, we considered only the optimal extractions, i.e., those performed with all the controlled external variables assuming an optimal value according to authoritative domain experts from a leading coffee industry: ground size, ground amount, and water pressure.
Mean and standard deviation of the three quality indexes, i.e., espresso volume, extraction time, and flow rate are computed on the optimal samples, i.e., perfect ground size, ground amount, and water pressure. The data-driven optimal range of quality index is defined as . Espresso extractions having outside of the optimal range are labelled as low or high, similarly to domain-based labeling described in Section 5.2. In Table 4, the obtained data-driven thresholds are reported.
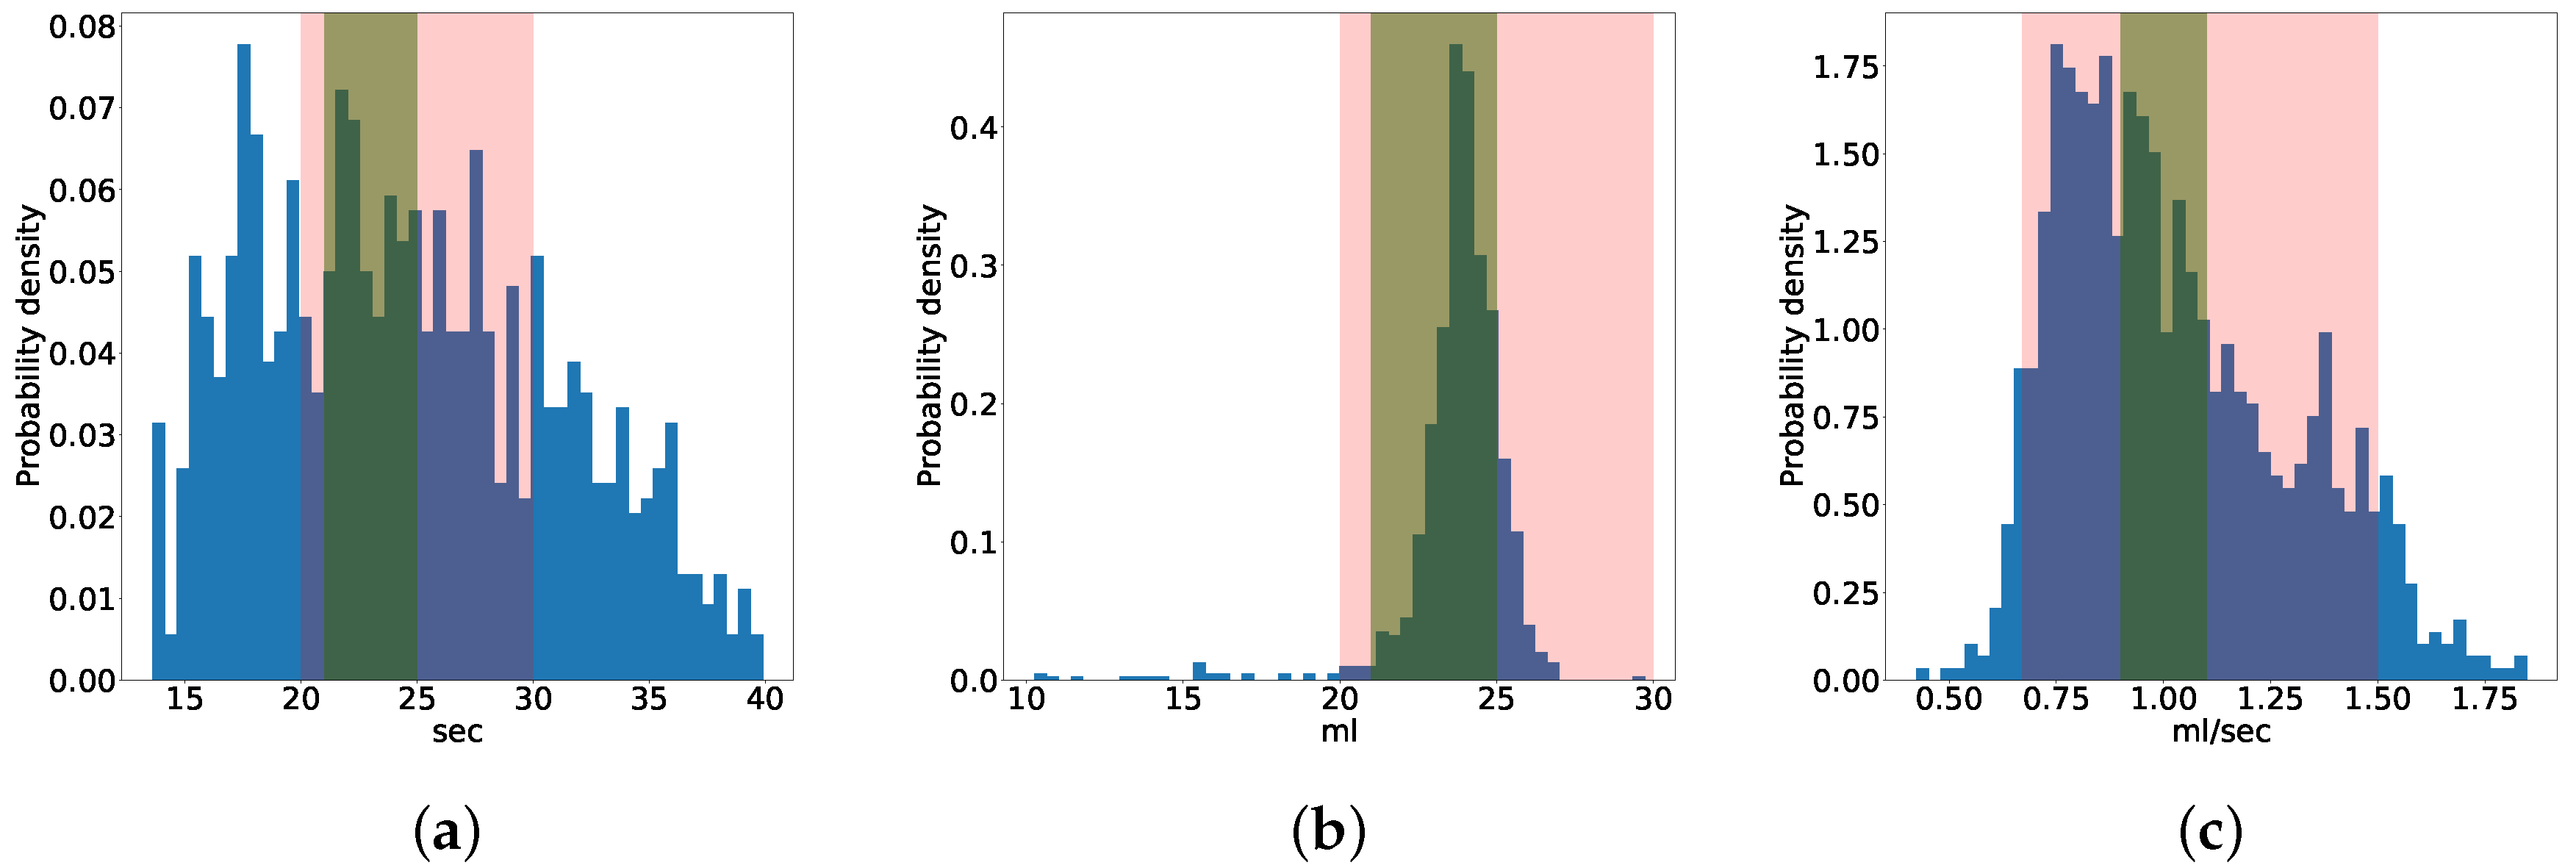
Figure 1 shows the discrete probability density function of the three quality indexes. The pink stripe indicates the domain-based optimal quality range, while the green one indicates the data-driven range. As described in Section 5.2, almost all the experimental samples have volume and flow levels in the optimal domain-based ranges. Data-driven thresholds are more selective and enclose less experimental extractions, especially for the percolation time and flow rate quality variables.
In Table 5, the percentage distributions of the data-driven quality labels within the samples of the dataset are reported. For the brewing time and flow rate, more than 70% of the extractions have non-optimal values (low and high values). The volume level is still optimal for the majority of the samples, i.e., more than 80% of the experiments. The volume has a lower variance, since the coffee-machine is typically set to reach a constant value in the quantity of the brewed coffee. More details on the volume quality index are investigated in Section 6.1.3.
5.4. Association Rule Mining
Association rule mining is performed on the data-driven labelled dataset. Parameters and are set to very low values so that all possible correlations are extracted; then, a sorting is performed and only the most interesting rules are analyzed, as detailed in the following. The parameter values set for the experimental sessions are and .
The experimental results are grouped according to the following criteria.
- Association rules identified on the full dataset, regardless of the cleaning procedure presence or absence, with specific focus on rules separately analyzed for each of the three quality indexes. In Table 6, Table 7 and Table 8 results are reported for percolation time, espresso volume, and flow rate, respectively. The corresponding discussion is provided in Section 6.1.
- Impact of the presence or absence of cleaning procedures on quality indexes. Results are reported in Table 9 and the discussion in provided in Section 6.2.
Since association rule mining can potentially extract a very large number of correlations, a typical post-processing phase entails the rule sorting according to an interestingness measure. In our context, we selected the lift and the confidence to identify the most interesting rules. Hence, all Tables report the most interesting subset of rules according to such metrics.
To guide the result discussion, provided in Section 6, rules are grouped into three types based on their meaning in the current application context: impact rules, root-cause rules and compensation rules, as detailed in the following.
- Impact rules study the influence of external variables on espresso quality. The rule head is a quality index with a non-optimal value and the rule body indicates the set of external variable values to which it is correlated. These rules investigate the main sources that determine espresso quality indexes.
- Root-cause rules have as rule antecedent the quality index and as rule consequent an external variable. These rules allow root-cause analysis, i.e., the identification of the causes of non-optimal values of quality indicators. Please note that even if correlation does not imply a cause-effect relation, we can determine such meaning by the application context.
- Compensation rules study the compensation effects. A compensation rule is a rule where the head is a quality index with an optimal value and the body has at least two external variables with not-optimal values. Therefore, it detects which configurations of not-optimal values allow to achieve high quality coffees despite one or more values are, in fact, not optimal.
6. Discussion
In this section, the most interesting association rules are discussed. Section 6.1 analyzes experimental results for each quality index, regardless of the cleaning procedure, i.e., on the full dataset. In Section 6.2, the rules capturing the different effect of cleaning procedures on quality indexes are examined.
6.1. Quality Indexes
This subsection separately discusses the effects of the different factors influencing the quality indexes: percolation time (Section 6.1.1), flow rate (Section 6.1.2), and volume (Section 6.1.3).
6.1.1. Factors Influencing the Percolation Time
In Table 6, association rules involving the percolation time are reported. Rules 1–15 represent impact rules, rules 16–19 compensation rules, and rules 20–25 are root-cause ones.
Rules 1–9 indicate the correlation of the external variables with high values of percolation time. As mentioned in Section 3, a slow coffee brewing is an index of low quality since the extracted espresso is (generally) dry and bitter.
Rule 1 indicates that if (i) the pressure is low, (ii) the amount of coffee ground is too high and (iii) the grinding is fine, the percolation time is high too. As described in Section 4, the rule confidence indicates how frequently the rule head occurs among all the groups containing the rule body. Rule 1 confidence is 100%. Hence, in all the analyzed coffee samples, if the external variables assume the values of the rule body, the brewing time is always above the optimal quality threshold. The motivation can be traced back to the slower water flow due to the lower water pressure, additionally hindered by the higher amount of too-fine ground. This condition results into a slower brewing.
Rules 2, 4 and 5 (Table 6) capture the correlation with high percolation time when only two out of the previous three external variables at the same time assume non-optimal values. The highest impact on percolation time is caused by the finer coffee ground size and higher dosage, with confidence 97%, regardless of the water pressure (Rule 2). This information is particularly relevant for the barista. Brew pressure value is set at first in the espresso machine calibration phase and it is periodically checked and controlled, typically by technicians. On the other hand, the size and amount of coffee ground are determined by the barista at each espresso extraction. The association rule indicates that the improper values of both the two variables are the most correlated with a high percolation time. Hence, the barista should properly adjust those two inputs to prevent bitter and dry espressos.
Rules 7–9 describe the correlation with high values of percolation time of one external variable at the time. The low pressure alone is the indicator of high percolation time with the highest confidence (80%). A lower pressure implies that the water has less force pushing through the coffee grounds in the portafilter and, as a consequence, espresso brewing requires more time. The second indicator is the fine grinding (Rule 8). Increasing the grind size entails finer ground, so that water takes longer to pass through the grinds, leading to a protracted extraction. The amount of ground is instead less correlated (confidence 58%) with a long extraction (see Rule 9). Increasing the amount of coffee ground increases the intensity and body of espresso. However, it could also increase the extraction time, since the water flow is more hindered by the higher amount of coffee ground. The confidence of an association rule indicates that this phenomenon is likely to occur but with less strength than the individual influence of the pressure and grinding size (respectively Rule 7 and 8).
Still following Table 6, we meet Rules 10–15, which investigate the relationships between external variables and short percolation time. Quicker espresso brewing leads to espressos with higher acidity and lighter body. Rule 10 captures the opposite behavior of Rule 1. If the external variables assume the opposite non-optimal values, the resulting time is low. The water flow is (i) strongly forced through the coffee grounds thanks to the higher pressure and it is less hindered by (ii) the lower coffee quantity and (iii) the smaller surface, due to the coarseness of coffee grounds. As a result, the brewing time is shorter. This behavior is observable for 100% of the experiments under analysis (confidence equal to 100%). It means that for each experiment with these non-optimal values of external variables, the percolation time is shorter than the optimal threshold. Rule 11 indicates that the two terms that are mostly linked with short brewing time are the coarse grinding and the high pressure. Finally, Rules 13–15 capture the correlation with low percolation time of each single external variable. The too coarse grinding is the most correlated variable, followed by the high pressure, and the low amount, with confidence 54%, 53% and 48% respectively.
Rule 16 describes the behavior when all the input parameters are optimal. Interestingly, the confidence of the rule is of 87%. This means that setting optimal input values does not always lead to an optimal percolation time. As described in Section 5.3, the thresholds of the three quality indexes are estimated from the experiments with optimal input values, computing average and standard deviation. The estimation considers experiments for both the operating conditions, cleaning and no-cleaning. The washing procedures have a great impact on quality indexes. The impact of such procedures on espresso quality is investigated and discussed in Section 6.2.
Rules 17–19 are compensation rules. Rule 17 indicates that, with optimal pressure, the high amount of coffee ground is compensated by its coarse grinding. As already discussed, high dosage hinders the water flow, while coarse grinding favors it. The result is thus a compensation effect. Such behavior changes if the pressure is not optimal. If the pressure is low, the compensation effect is instead achieved with a low dosage, with both coarse and optimal grinding (Rule 18 and 19 respectively).
Finally, we investigate the factors influencing high and low percolation time the most. The resulting association rules are the root-cause rules 20–25 (Table 6). The grinding level is individually the most discriminating factor, with confidence values of 58% and 56% for high and low percolation time, respectively (Rule 20 and 23). Then, the non-optimal values are attributable to the pressure (Rule 21 and 24) and lastly to the amount of coffee grounds (Rule 22 and 25).
6.1.2. Factors Influencing the Flow Rate
Table 7 shows the extracted association rules with respect to the flow rate. Rules 1–24 are impact rules, Rules 25–27 compensation rules, and Rules 28–31 represent root-cause rules.
Rules 1–8 presents the correlations of the external variables with high values of the flow rate. Rule 1 captures the expected behavior since it represents the worst condition for high flow rate. If (i) the amount of coffee ground is low, (ii) the ground is coarse and (iii) the pressure is high, the rule indicates that the flow rate is too high. The water flow rate is increased due to the higher pressure and it is less hindered (with respect to the optimal case) by the coarseness and low-dosage of coffee grounds. Rule 2 reveals that the coarseness of coffee grounds is correlated with high flow despite the optimal values of dosage and pressure. This correlation is observed in all experiments (confidence equal to 100%). Analogously, the low-dosage is associated with a high flow when the other two variables are optimal (Rule 5). The two external variables that are joint indicators of a high value of flow rate are the grinding and the pressure (as described by Rule 4). With very high confidence (90%), these two variables determine a high flow regardless of the ground dosage. This is furthermore underlined by Rule 6. The high dosage of coffee, that generally hinders the flow rate, is not sufficient for compensating the effect of high pressure and coarse coffee grounds. The rule indicates that with this configuration of external variables, with confidence 85%, the flow is high. In addition, the relevance of the coarse grinding and high pressure on the flow separately is pointed out by Rules 7 and 8 respectively.
Rules 9–24 study the effect of the external variables on the low flow rate. As expected, with confidence of 100%, Rule 9 captures the opposite behavior of Rule 1. The over dosage of fine-grained coffee grounds and the low pressure yield to a low value of flow rate. Rules 10–12 illustrate that if at least two of the external variables assume those non-optimal values, the flow is low. Rule 13 and 14 underline the relevance of the fine-grained coffee grounds on the flow. If the fine-graininess is coupled with the high amount of coffee or the low pressure, the flow is low (Rule 13 and 14 respectively). The heavy influence of the fine grinding is further highlighted by (i) Rules 15 and 16 and (ii) Rule 22. Rule 22 shows that, individually, the grinding is an index of low flow, with confidence equal to 74%. The individual effects of low pressure (69% of confidence) and high dosage are less strong than grinding settings. Rules 15 and 16 indicate that if the grinding is coarse, the lower dosage do not compensate the combined effect of coarseness and low pressure (Rule 15) and likewise the higher pressure with the higher amount. Hence, the extracted association rules highlight that there is no compensation effect for the coarse grinding. The barista should therefore carefully check the level of coarseness of the ground coffee to avoid a low flow rate.
The effect of low pressure on the flow rate can instead be compensated as shown by Rules 26 and 27. The lower dosage is able to compensate the impact of the low pressure either with optimal grinding (Rule 26 with confidence 80%) or coarse grinding (Rule 27 with confidence 70%).
Finally, Rules 28–31 confirm the previous insights. The flow is mostly influenced by the grinding size, with confidence 62% for the low flow (Rule 28) and 58% for the high flow (Rule 29), followed by the pressure (Rule 28 and 29).
6.1.3. Factors Influencing the Espresso Volume
We lastly analyze the influence of the external variables on espresso volume. The extracted association rules are reported in Table 8, with Rules 1–4 representing the impact rules, Rules 5–10 the compensation, and Rules 11–15 the root-cause.
Rules 1–4 capture the correlations for high (Rules 1–3) and low (Rule 4) volume. Their confidence and support values are very low for representing a strong correlation. Modeling the relation of input variables and non-optimal volume is arduous, since the volume is out-of-range only in scattering cases. In the experimental set, 1040 out of 1080 espresso extractions (96%) have at least one external variables with a non-optimal value. However, only the 17% of all the experiments have a non-optimal volume. In most of the cases (83%), the espresso volume is still in an optimal range. Espresso machines are in fact designed and calibrated to extract a pre-determined amount of coffee. The espresso volume is out of range only in extreme cases and combinations of the external variables. In most of the cases, the machines produce an adequate amount of coffee even in non-optimal conditions. It is therefore extremely important the control of the other quality indexes (percolation time and flow rate) for assessing the coffee quality, since they impact on the final flavour and body of the espresso despite the sufficient volume.
We focus on the compensation rules 5 and 7–10. Such rules are able to capture and quantify the phenomena of compensation that allow to obtain adequate values of espresso also in non-optimal conditions. Rule 5 indicates that, being the grinding level optimal, the under dosage of coffee grounds is compensated by a higher pressure. The confidence of the rule is 100%, hence this compensation effect is observable for all the extractions of the experimental set with this combination of external variables. Rule 8 illustrates that if the grinding level is optimal, the low amount of coffee does not impact on the espresso volume and it is generally still optimal (with confidence 95%). Moreover, Rules 7, 9 and 10 indicate that, if the amount of coffee grounds and their grinding level are optimal, the pressure level does not affect the volume (Rule 7) and it is optimal for each pressure level: optimal (Rule 7), high (Rule 9) and low (Rule 10).
Finally, Rules 11–15 indicate the external variables that are mostly associated with a non-optimal volume. Individually, the volume is affected by the dosage of coffee grounds. The increased volume is linked with the over dosage of grounds (Rule 11), while the low espresso quantity is associated with the under dosage (Rule 13).
6.2. Impact of Cleaning Procedures
In this Section, we evaluate the effect of cleaning procedure execution on quality indexes. We consider two experimental sub-datasets separately. In the first subset of extractions, generated by one group head of the coffee machine, no cleaning procedure is ever performed. In the second subset, generated by the second group head, a cleaning procedure is performed after each extraction. The cleaning procedure consists of a specific and well-known purging operation of the machine ducts. The purging removes excess coffee grinds and oils in the group head and helps the machine in maintaining the correct operating parameters. The association rule mining is performed separately on the two subsets, then the resulting rules are compared. The goal is to identify and analyze the different behaviors, studying the impact of cleaning procedures on espresso quality.
In Table 9, the association rules highlighting different patterns for the two procedures are reported. For each association rule, confidence, lift, and support are compared between the cleaning and no-cleaning datasets.
Rule 1 indicates that, being the coffee grinding optimal, high pressure is much more correlated with low percolation time when the cleaning procedure is performed, as the confidence values are 93% vs. 47%. When cleaning is performed, the excess of coffee grounds and oils is removed. Hence, espresso residuals do not hinder the water flow. As a result, the percolation time is shorter.
Rule 2 confirms the increased correlation of high pressure and cleaning procedures with a short percolation time. Regardless of the grinding level and coffee dosage, high pressure exhibits a stronger correlation with low percolation time if the purging is performed (confidence values are 70% vs. 43%). The behavior highlighted by Rule 2 and 3 is observed also for the flow rate. The high flow rate is more sensitive to high pressure when cleaning procedures are performed (Rule 6), especially when the grinding is optimal (Rule 5).
The low pressure, if coupled with coarse-grained coffee grounds (Rule 3) or a small amount of coffee (Rule 4), is instead more correlated with a longer time, if the group head is not cleaned. The effect of low pressure on the extraction time is likely to be intensified by the un-washed coffee residuals that constitute an obstacle for the flow rate. Rule 7 indicates that, with a optimal coffee amount, the lower flow is more correlated (95% of confidence) with finer ground coffee in no-cleaning conditions.
Rules 8–10 show that there is a higher compensation effect contrasting high pressure for the un-cleaned group head, as its confidence values are very high, in the range of 97–98%, whereas for the cleaned group the range is 58–78%. Rule 8 indicates that the effect of high pressure on the resulting coffee volume is compensated by a coarser ground coffee (97% of confidence). If the washing procedure is performed, the confidence is lower (58%). Despite these two non-optimal configurations of external values allow to generally obtain a proper amount of espressos with the uncleaned group head, Rule 11 of Table 6 and Rule 4 of Table 7 indicate that these configurations are associated with a short percolation time and high flow rate, regardless of the cleaning procedure. Hence, the resulting espressos may result in a greater acidity and a lighter body.
The high pressure is also compensated by an optimal grinding, particularly for the un-washed group head (97% of confidence), regardless of the coffee ground amount (Rule 9). This outcome is particularly interesting when compared with the observations derived by Rules 5 and 9 of Table 8. The latter two rules indicate that, if the behavior of cleaned and un-cleaned groups is not differentiated, the high pressure is compensated by the optimal grinding only if coupled by a low (Rule 5 of Table 8) or optimal (Rule 9 of Table 8) amount. Furthermore, in no-cleaning conditions, the high pressure could be also compensated by using a low amount of coffee ground (Rule 10 of Table 9). In Section 6.1.3, we observed that, if cleaning conditions are not considered, this compensation is generally observable (with confidence 100%) only with an optimal grinding.
Finally, Rule 11 indicates that if the purging procedure is not performed, a high volume of espresso is correlated with a finer ground coffee (74% of confidence). The same association rule has, instead, a very low confidence (12%) if the purging procedures are performed.
7. Conclusions
This work presented the analysis of a real-world dataset of espresso brewing by professional coffee-making machines. After a preliminary analysis on domain-based and data-driven quality thresholds, correlations among external variables and actual quality metrics are identified by means of association rule mining, a powerful, exploratory, exhaustive, and explainable approach. Results are expressed in the form of human-readable rules combining the variables of interest, such as the grinder settings, the extraction time, and the dose amount. To focus on the most interesting rules, we exploited the lift and the confidence measures, and provided a semantic classification into impact, root-cause, and compensation rules. The experimental results are discussed separately for each variable of interest. Finally, a special session has been devoted to the cleaning procedure effect on espresso quality.
The current work has been able to provide a data-driven confirmation of domain-knowledge expected patterns in espresso brewing, highlight compensation effects of sub-optimal external variables leading to high-quality espresso, and describe a data-driven approach to analyze real-world espresso-quality correlations exhaustively and transparently.
Rules extracted from data have been considered of high interest by domain experts of a major international coffee brand, since they were able to both confirm known effects and bring to the surface new unexpected correlations, hence laying solid foundations for further investigations able to provide competitive advantage in high-quality espresso brewing.
Future works aim to widen the scope of the analysis including more variables, such as different coffee-machine models, diverse coffee blends, environment humidity and temperature. Furthermore, a longer cleaning-procedure session would allow to better investigate the medium-term effect of such maintenance operations.
Author Contributions
All authors are equaly contributed to the research work and to the manuscript. All authors have read and agreed to the published version of the manuscript.
Funding
This research received funding from the SmartData@PoliTO center of Politecnico di Torino, Italy.
Conflicts of Interest
The authors declare no conflicts of interest.
References
- Rossi. Coffee in Italy or 101 Facts about Italian Coffee Culture. Available online: http://rossiwrites.com/italy/italy-for-foodies/coffee-in-italy-italian-coffee-culture (accessed on 28 November 2019).
- Istituto Nazionale Espresso Italiano. Espresso Italiano Certificato. Available online: http://www.espressoitaliano.org/files/File/istituzionale_inei_hq_en.pdf/ (accessed on 28 November 2019).
- Apiletti, D.; Baralis, E.; Cerquitelli, T.; D’Elia, V. Characterizing network traffic by means of the NetMine framework. Comput. Netw. 2009, 53, 774–789. [Google Scholar] [CrossRef]
- Loutfi, A.; Coradeschi, S.; Mani, G.K.; Shankar, P.; Rayappan, J.B.B. Electronic noses for food quality: A review. J. Food Eng. 2015, 144, 103–111. [Google Scholar] [CrossRef]
- Brudzewski, K.; Osowski, S.; Dwulit, A. Recognition of Coffee Using Differential Electronic Nose. IEEE Trans. Instrum. Meas. 2012, 61, 1803–1810. [Google Scholar] [CrossRef]
- Andueza, S.; Maeztu, L.; Dean, B.; de Peña, M.P.; Bello, J.; Cid, C. Influence of Water Pressure on the Final Quality of Arabica Espresso Coffee. Application of Multivariate Analysis. J. Agric. Food Chem. 2002, 50, 7426–7431. [Google Scholar] [CrossRef] [PubMed]
- Caprioli, G.; Cortese, M.; Cristalli, G.; Maggi, F.; Odello, L.; Ricciutelli, M.; Sagratini, G.; Sirocchi, V.; Tomassoni, G.; Vittori, S. Optimization of espresso machine parameters through the analysis of coffee odorants by HS-SPME–GC/MS. Food Chem. 2012, 135, 1127–1133. [Google Scholar] [CrossRef] [PubMed]
- Andueza, S.; Maeztu, L.; Pascual, L.; Ibáñez, C.; de Peña, M.P.; Cid, C. Influence of extraction temperature on the final quality of espresso coffee. J. Sci. Food Agric. 2003, 83, 240–248. [Google Scholar] [CrossRef]
- Navarini, L.; Rivetti, D. Water quality for Espresso coffee. Food Chem. 2010, 122, 424–428. [Google Scholar] [CrossRef]
- Schenker, S.; Heinemann, C.; Huber, M.; Pompizzi, R.; Perren, R.; Escher, R. Impact of Roasting Conditions on the Formation of Aroma Compounds in Coffee Beans. J. Food Sci. 2002, 67, 60–66. [Google Scholar] [CrossRef]
- Andueza, S.; Vila, M.A.; Paz de Peña, M.; Cid, C. Influence of coffee/water ratio on the final quality of espresso coffee. J. Sci. Food Agric. 2007, 87, 586–592. [Google Scholar] [CrossRef]
- Sánchez-López, J.A.; Zimmermann, R.; Yeretzian, C. Insight into the Time-Resolved Extraction of Aroma Compounds during Espresso Coffee Preparation: Online Monitoring by PTR-ToF-MS. Anal. Chem. 2014, 86, 11696–11704. [Google Scholar] [CrossRef]
- Gardner, J.W.J.W.; Bartlett, P.N. Electronic Noses: Principles and Applications; Includes Bibliographical References and Index; Oxford University Press: Oxford, NY, USA, 1999. [Google Scholar]
- Rodríguez, J.; Durán, C.; Reyes, A. Electronic nose for quality control of Colombian coffee through the detection of defects in “Cup Tests”. Sensors 2010, 10, 36–46. [Google Scholar] [CrossRef] [PubMed]
- Severini, C.; Ricci, I.; Marone, M.; Derossi, A.; De Pilli, T. Changes in the Aromatic Profile of Espresso Coffee as a Function of the Grinding Grade and Extraction Time: A Study by the Electronic Nose System. J. Agric. Food Chem. 2015, 63, 2321–2327. [Google Scholar] [CrossRef] [PubMed]
- Romani, S.; Cevoli, C.; Fabbri, A.; Alessandrini, L.; Dalla Rosa, M. Evaluation of coffee roasting degree by using electronic nose and artificial neural network for off-line quality control. J. Food Sci. 2012, 77, C960–C965. [Google Scholar] [CrossRef] [PubMed]
- Pardo, M.; Niederjaufner, G.; Benussi, G.; Comini, E.; Faglia, G.; Sberveglieri, G.; Holmberg, M.; Lundstrom, I. Data preprocessing enhances the classification of different brands of Espresso coffee with an electronic nose. Sens. Actuators B Chem. 2000, 69, 397–403. [Google Scholar] [CrossRef]
- Pardo, M.; Sberveglieri, G. Classification of electronic nose data with support vector machines. Sens. Actuators B Chem. 2005, 107, 730–737. [Google Scholar] [CrossRef]
- Michishita, T.; Akiyama, M.; Hirano, Y.; Ikeda, M.; Sagara, Y.; Araki, T. Gas chromatography/olfactometry and electronic nose analyses of retronasal aroma of espresso and correlation with sensory evaluation by an artificial neural network. J. Food Sci. 2010, 75, S477–S489. [Google Scholar] [CrossRef]
- Röck, F.; Barsan, N.; Weimar, U. Electronic Nose: Current Status and Future Trends. Chem. Rev. 2008, 108, 705–725. [Google Scholar] [CrossRef]
- Severini, C.; Derossi, A.; Fiore, A.G.; De Pilli, T.; Alessandrino, O.; Del Mastro, A. How the variance of some extraction variables may affect the quality of espresso coffees served in coffee shops. J. Sci. Food Agric. 2016, 96, 3023–3031. [Google Scholar] [CrossRef]
- Tan, P.N.; Steinbach, M.; Kumar, V. Introduction to Data Mining, 1st ed.; Addison-Wesley Longman Publishing Co., Inc.: Boston, MA, USA, 2005. [Google Scholar]
- Chen, W.C.; Tseng, S.S.; Wang, C.Y. A novel manufacturing defect detection method using association rule mining techniques. Expert Syst. Appl. 2005, 29, 807–815. [Google Scholar] [CrossRef]
- Da Cunha, C.; Agard, B.; Kusiak, A. Data mining for improvement of product quality. Int. J. Prod. Res. 2006, 44, 4027–4041. [Google Scholar] [CrossRef] [Green Version]
- Agard, B.; Kusiak, A. Data mining for subassembly selection. J. Manuf. Sci. Eng. 2004, 126, 627–631. [Google Scholar] [CrossRef]
- Dehaspe, L.; Toivonen, H.; King, R.D. Finding Frequent Substructures in Chemical Compounds. In Proceedings of the Fourth International Conference on Knowledge Discovery and Data Mining (KDD-98), New York, NY, USA, 27–31 August 1998; Volume 98, p. 1998. [Google Scholar]
- Yassine, A.; Singh, S.; Alamri, A. Mining Human Activity Patterns From Smart Home Big Data for Health Care Applications. IEEE Access 2017, 5, 13131–13141. [Google Scholar] [CrossRef]
- Di Corso, E.; Cerquitelli, T.; Apiletti, D. Metatech: Meteorological data analysis for thermal energy characterization by means of self-learning transparent models. Energies 2018, 11, 1336. [Google Scholar] [CrossRef] [Green Version]
- Ting, S.; Tse, Y.; Ho, G.; Chung, S.; Pang, G. Mining logistics data to assure the quality in a sustainable food supply chain: A case in the red wine industry. Int. J. Prod. Econ. 2014, 152, 200–209. [Google Scholar] [CrossRef]
- Wang, J.; Yue, H. Food safety pre-warning system based on data mining for a sustainable food supply chain. Food Control 2017, 73, 223–229. [Google Scholar] [CrossRef]
- Lin, X. Mr-apriori: Association rules algorithm based on mapreduce. In Proceedings of the 2014 IEEE 5th International Conference on Software Engineering and Service Science, Beijing, China, 27–29 June 2014; pp. 141–144. [Google Scholar]
- Apiletti, D.; Baralis, E.; Cerquitelli, T.; Garza, P.; Pulvirenti, F.; Michiardi, P. A parallel mapreduce algorithm to efficiently support itemset mining on high dimensional data. Big Data Res. 2017, 10, 53–69. [Google Scholar] [CrossRef]
- Apiletti, D.; Baralis, E.; Cerquitelli, T.; Garza, P.; Michiardi, P.; Pulvirenti, F. PaMPa-HD: A parallel MapReduce-based frequent pattern miner for high-dimensional data. In Proceedings of the 2015 IEEE International Conference on Data Mining Workshop (ICDMW), Atlantic City, NJ, USA, 14–17 November 2015; pp. 839–846. [Google Scholar]
- Apiletti, D.; Baralis, E.; Cerquitelli, T.; Garza, P.; Pulvirenti, F.; Venturini, L. Frequent Itemsets Mining for Big Data: A Comparative Analysis. Big Data Res. 2017, 9, 67–83. [Google Scholar] [CrossRef]
- Nath, B.; Bhattacharyya, D.; Ghosh, A. Incremental association rule mining: A survey. Wiley Interdiscip. Rev. Data Min. Knowl. Discov. 2013, 3, 157–169. [Google Scholar] [CrossRef]
- Ahmed, C.F.; Tanbeer, S.K.; Jeong, B.S.; Lee, Y.K. Efficient tree structures for high utility pattern mining in incremental databases. IEEE Trans. Knowl. Data Eng. 2009, 21, 1708–1721. [Google Scholar] [CrossRef]
- Lin, C.W.; Lan, G.C.; Hong, T.P. An incremental mining algorithm for high utility itemsets. Expert Syst. Appl. 2012, 39, 7173–7180. [Google Scholar] [CrossRef]
- Cheung, D.W.; Han, J.; Ng, V.T.; Wong, C.Y. Maintenance of discovered association rules in large databases: An incremental updating technique. In Proceedings of the Twelfth International Conference on Data Engineering, New Orleans, LA, USA, 26 February–1 March 1996; pp. 106–114. [Google Scholar] [CrossRef] [Green Version]
- Ayan, N.F.; Tansel, A.U.; Arkun, M.E. An Efficient Algorithm to Update Large Itemsets with Early Pruning. In Proceedings of the fifth ACM SIGKDD International Conference on Knowledge Discovery and Data Mining, San Diego, CA, USA, 22–27 August 1999; pp. 287–291. [Google Scholar]
- Lyu, X.; Ma, H. An Efficient Incremental Mining Algorithm for Discovering Sequential Pattern in Wireless Sensor Network Environments. Sensors 2019, 19, 29. [Google Scholar] [CrossRef] [PubMed] [Green Version]
- Aqra, I.; Abdul Ghani, N.; Maple, C.; Machado, J.; Sohrabi Safa, N. Incremental Algorithm for Association Rule Mining under Dynamic Threshold. Appl. Sci. 2019, 9, 5398. [Google Scholar] [CrossRef] [Green Version]
- Jiang, N.; Gruenwald, L. Research Issues in Data Stream Association Rule Mining. ACM Sigmod Rec. 2006, 35, 14–19. [Google Scholar] [CrossRef] [Green Version]
- Han, J.; Pei, J.; Kamber, M. Data Mining: Concepts and Techniques; Elsevier: Amsterdam, The Netherlands, 2011. [Google Scholar]
- Han, J.; Pei, J.; Yin, Y. Mining Frequent Patterns Without Candidate Generation. In Proceedings of the 2000 ACM SIGMOD International Conference on Management of Data, Portland, OR, USA, 14–19 June 2000; ACM: New York, NY, USA, 2000; pp. 1–12. [Google Scholar] [CrossRef]
- Agrawal, R.; Srikant, R. Fast Algorithms for Mining Association Rules in Large Databases. In Proceedings of the 20th International Conference on Very Large Data Bases (VLDB ’94), Santiago, Chile, 12–15 September 1994; Morgan Kaufmann Publishers Inc.: San Francisco, CA, USA, 1994; pp. 487–499. [Google Scholar]
- Zaki, M.J. Scalable algorithms for association mining. IEEE Trans. Knowl. Data Eng. 2000, 12, 372–390. [Google Scholar] [CrossRef] [Green Version]
- Apiletti, D.; Bruno, G.; Ficarra, E.; Baralis, E. Data cleaning and semantic improvement in biological databases. J. Integr. Bioinform. 2006, 3, 219–229. [Google Scholar] [CrossRef]
- Proto, S.; Ventura, F.; Apiletti, D.; Cerquitelli, T.; Baralis, E.; Macii, E.; Macii, A. PREMISES, a scalable data-driven service to predict alarms in slowly-degrading multi-cycle industrial processes. In Proceedings of the 2019 IEEE International Congress on Big Data (BigDataCongress), Milan, Italy, 8–13 July 2019; pp. 139–143. [Google Scholar]
Figure 1.
Distribution of values in the experimental dataset. (a) Percolation time, (b) Espresso volume, (c) Flow rate.
Figure 1.
Distribution of values in the experimental dataset. (a) Percolation time, (b) Espresso volume, (c) Flow rate.


Table 1.
Outline of dataset variables.
| Type | Name | Values |
|---|---|---|
| external variables | coffee ground size | coarse, optimal, fine |
| coffee ground amount | high, optimal, low | |
| water pressure | high, optimal, low | |
| operating conditions | cleaning procedure execution | true, false |
| quality evaluation | extraction time | high, optimal, low |
| espresso volume | high, optimal, low | |
| flow rate | high, optimal, low |
Table 2.
Domain-based quality thresholds.
| Quality Variable | Low | Optimal | High |
|---|---|---|---|
| extraction time (s) | <20 | [20–30] | >30 |
| volume (mL) | <20 | [20–30] | >30 |
| flow rate (mL/s) | <0.67 | [0.67–1.50] | >1.50 |
Table 3.
Domain-based quality thresholds. Distribution of samples in the dataset.
| Quality Index | Low | Optimal | High |
|---|---|---|---|
| volume (mL) | 2.5% | 97.5% | 0% |
| extraction time (s) | 28.1% | 49.7% | 22.2% |
| flow rate (mL/s) | 4.4% | 89.2% | 6.4% |
Table 4.
Data-driven quality thresholds.
| Quality Variable | Low | Optimal | High |
|---|---|---|---|
| volume (mL) | <21 | [21–25] | >25 |
| extraction time (s) | <21 | [21–25] | >25 |
| flow rate (mL/s) | <0.9 | [0.9–1.1] | >1.1 |
Table 5.
Data-driven quality thresholds. Distribution of samples in the dataset.
| Quality Index | Low | Optimal | High |
|---|---|---|---|
| volume (mL) | 3.4% | 82.8% | 13.8% |
| extraction time (s) | 32.3% | 23.4% | 44.3% |
| flow rate (mL/s) | 39.1% | 26.9% | 34.0% |
Table 6.
Association rules involving the percolation time correlations.
| RId | Body | Head | Conf (%) | Lift | Rule Sup (%) |
|---|---|---|---|---|---|
| 1 | amount = “high”, grinding = “low”, pressure = “low” | time = “high” | 100 | 2.26 | 3 |
| 2 | amount = “high”, grinding = “low” | time = “high” | 97 | 2.19 | 10 |
| 3 | amount = “high”, pressure = “low” | time = “high” | 95 | 2.15 | 8 |
| 4 | amount = “opt”, pressure = “low” | time = “high” | 95 | 2.14 | 11 |
| 5 | grinding = “low”, pressure = “low” | time = “high” | 94 | 2.13 | 10 |
| 6 | amount = “opt”, grinding = “low” | time = “high” | 90 | 2.03 | 10 |
| 7 | pressure = “low” | time = “high” | 80 | 1.79 | 25 |
| 8 | grinding = “low” | time = “high” | 78 | 1.75 | 26 |
| 9 | amount = “high” | time = “high” | 58 | 1.32 | 18 |
| 10 | amount = “low”, grinding = “high”, pressure = “high” | time = “low” | 100 | 3.09 | 3 |
| 11 | grinding = “high”, pressure = “high” | time = “low” | 87 | 2.69 | 10 |
| 12 | amount = “low”, pressure = “opt” | time = “low” | 76 | 2.35 | 9 |
| 13 | grinding = “high” | time = “low” | 54 | 1.67 | 18 |
| 14 | pressure = “high” | time = “low” | 53 | 1.65 | 18 |
| 15 | amount = “low” | time = “low” | 48 | 1.49 | 17 |
| 16 | amount = “opt”, grinding = “opt”, pressure = “opt” | time = “opt” | 87 | 3.74 | 3 |
| 17 | amount = “high”, grinding = “high”, pressure = “opt” | time = “opt” | 72 | 3.1 | 3 |
| 18 | amount = “low”, grinding = “high”, pressure = “low” | time = “opt” | 66 | 2.82 | 2 |
| 19 | amount = “low”, grinding = “opt”, pressure = “low” | time = “opt” | 62 | 2.67 | 2 |
| 20 | time = “high” | grinding = “low” | 58 | 1.75 | 26 |
| 21 | time = “high” | pressure = “low” | 56 | 1.79 | 25 |
| 22 | time = “high” | amount = “high” | 41 | 1.32 | 18 |
| 23 | time = “low” | grinding = “high” | 57 | 1.67 | 18 |
| 24 | time = “low” | pressure = “high” | 57 | 1.65 | 18 |
| 25 | time = “low” | amount = “low” | 51 | 1.49 | 17 |
Table 7.
Association rules involving the flow rate correlations.
| RId | Body | Head | Conf (%) | Lift | Rule Sup (%) |
|---|---|---|---|---|---|
| 1 | amount = “low”, grinding = “high”, pressure = “high” | flow = “high” | 100 | 2.94 | 3 |
| 2 | amount = “opt”, grinding = “high”, pressure = “opt” | flow = “high” | 100 | 2.94 | 4 |
| 3 | amount = “low”, grinding = “high”, pressure = “opt” | flow = “high” | 95 | 2.8 | 4 |
| 4 | grinding = “high”, pressure = “high” | flow = “high” | 90 | 2.66 | 10 |
| 5 | amount = “low”, grinding = “opt”, pressure = “opt” | flow = “high” | 87 | 2.57 | 3 |
| 6 | amount = “high”, grinding = “high”, pressure = “high” | flow = “high” | 85 | 2.5 | 3 |
| 7 | grinding = “high” | flow = “high” | 58 | 1.72 | 20 |
| 8 | pressure = “high” | flow = “high” | 54 | 1.6 | 19 |
| 9 | amount = “high”, grinding = “low”, pressure = “low” | flow = “low” | 100 | 2.55 | 3 |
| 10 | amount = “high”, grinding = “low”, pressure = “opt” | flow = “low” | 100 | 2.55 | 3 |
| 11 | amount = “high”, grinding = “opt”, pressure = “low”, | flow = “low” | 100 | 2.55 | 2 |
| 12 | amount = “opt”, pressure = “low”, grinding = “low” | flow = “low” | 97 | 2.49 | 4 |
| 13 | amount = “high”, grinding = “low” | flow = “low” | 97 | 2.48 | 10 |
| 14 | grinding = “low”, pressure = “low” | flow = “low” | 96 | 2.46 | 10 |
| 15 | amount = “low”, grinding = “low”, pressure = “low” | flow = “low” | 92 | 2.36 | 4 |
| 16 | amount = “high”, grinding = “low”, pressure = “high” | flow = “low” | 92 | 2.35 | 3 |
| 17 | amount = “opt”, grinding = “opt”, pressure = “low” | flow = “low” | 87 | 2.24 | 3 |
| 18 | amount = “opt”, pressure = “low” | flow = “low” | 86 | 2.19 | 10 |
| 19 | amount = “high”, pressure = “low” | flow = “low” | 84 | 2.14 | 7 |
| 20 | amount = “opt”, grinding = “low” | flow = “low” | 82 | 2.08 | 9 |
| 21 | amount = “opt”, grinding = “low”, pressure = “opt” | flow = “low” | 80 | 2.04 | 3 |
| 22 | grinding = “low” | flow = “low” | 74 | 1.88 | 24 |
| 23 | pressure = “low” | flow = “low” | 69 | 1.76 | 22 |
| 24 | amount = “high” | flow = “low” | 53 | 1.37 | 17 |
| 25 | amount = “opt”, pressure = “opt”, grinding = “opt” | flow = “opt” | 82 | 3.07 | 3 |
| 26 | amount = “low”, grinding = “opt”, pressure = “low” | flow = “opt” | 80 | 2.98 | 3 |
| 27 | amount = “low”, grinding = “high”, pressure = “low” | flow = “opt” | 79 | 2.94 | 3 |
| 28 | flow = “low” | grinding = “low” | 62 | 1.88 | 24 |
| 29 | flow = “high” | grinding = “high” | 58 | 1.72 | 20 |
| 30 | flow = “low” | pressure = “low” | 55 | 1.76 | 22 |
| 31 | flow = “high” | pressure = “high” | 55 | 1.6 | 19 |
Table 8.
Association rules involving the espresso volume correlations.
| RId | Body | Head | Conf (%) | Lift | Rule Sup (%) |
|---|---|---|---|---|---|
| 1 | amount = “high”, grinding = “low”, pressure = “low” | volume = “high” | 54 | 3.87 | 1 |
| 2 | amount = “high”, grinding = “low”, pressure = “opt” | volume = “high” | 49 | 3.51 | 2 |
| 3 | amount = “high”, grinding = “low” | volume = “high” | 47 | 3.37 | 5 |
| 4 | amount = “low”, grinding = “low”, pressure = “low” | volume = “low” | 12 | 3.67 | <1 |
| 5 | amount = “low”, grinding = “opt”, pressure = “high” | volume = “opt” | 100 | 1.21 | 4 |
| 6 | amount = “opt”, grinding = “opt”, pressure = “opt” | volume = “opt” | 98 | 1.18 | 4 |
| 7 | amount = “opt”, grinding = “opt” | volume = “opt” | 96 | 1.16 | 11 |
| 8 | amount = “low”, grinding = “opt” | volume = “opt” | 95 | 1.15 | 11 |
| 9 | amount = “opt”, grinding = “opt”, pressure = “high” | volume = “opt” | 95 | 1.15 | 4 |
| 10 | amount = “opt”, grinding = “opt”, pressure = “low” | volume = “opt” | 95 | 1.15 | 4 |
| 11 | volume = “high” | amount = “high” | 61 | 1.96 | 8 |
| 12 | volume = “high” | grinding = “low” | 58 | 1.74 | 8 |
| 13 | volume = “low” | amount = “low” | 54 | 1.58 | 2 |
| 14 | volume = “low” | pressure = “low” | 46 | 1.46 | 2 |
| 15 | volume = “high” | pressure = “low” | 44 | 1.42 | 6 |
Table 9.
Comparison of association rules for presence vs absence of cleaning procedures.
| RId | Body | Head | No-Cleaning | Cleaning | ||||
|---|---|---|---|---|---|---|---|---|
| Conf. (%) | Lift | Supp. (%) | Conf. (%) | Lift | Supp. (%) | |||
| 1 | grinding = “opt”, pressure = “high” | time = “low” | 47 | 1.63 | 6 | 93 | 2.52 | 11 |
| 2 | pressure = “high” | time = “low” | 43 | 1.5 | 15 | 70 | 1.88 | 22 |
| 3 | grinding = “high”, pressure = “low” | time = “high” | 89 | 1.83 | 10 | 55 | 1.36 | 7 |
| 4 | amount = “low”, pressure = “low” | time = “high” | 76 | 1.56 | 9 | 20 | 0.48 | 2 |
| 5 | grinding = “opt”, pressure = “high” | flow = “high” | 52 | 1.7 | 6 | 90 | 2.31 | 11 |
| 6 | pressure = “high” | flow = “high” | 45 | 1.48 | 16 | 70 | 1.79 | 22 |
| 7 | amount = “opt”, grinding = “low” | flow = “low” | 95 | 2.12 | 11 | 68 | 2.01 | 8 |
| 8 | grinding = “high”, pressure = “high” | volume = “opt” | 97 | 1.36 | 11 | 58 | 0.94 | 6 |
| 9 | grinding = “opt”, pressure = “high” | volume = “opt” | 97 | 1.36 | 12 | 75 | 1.21 | 9 |
| 10 | amount = “low”, pressure = “high” | volume = “opt” | 98 | 1.38 | 12 | 78 | 1.26 | 6 |
| 11 | volume = “high” | grinding = “low” | 74 | 2.27 | 9 | 12 | 33 | 46 |
© 2020 by the authors. Licensee MDPI, Basel, Switzerland. This article is an open access article distributed under the terms and conditions of the Creative Commons Attribution (CC BY) license (http://creativecommons.org/licenses/by/4.0/).
Share and Cite
MDPI and ACS Style
Apiletti, D.; Pastor, E. Correlating Espresso Quality with Coffee-Machine Parameters by Means of Association Rule Mining. Electronics 2020, 9, 100. https://0-doi-org.brum.beds.ac.uk/10.3390/electronics9010100
AMA Style
Apiletti D, Pastor E. Correlating Espresso Quality with Coffee-Machine Parameters by Means of Association Rule Mining. Electronics. 2020; 9(1):100. https://0-doi-org.brum.beds.ac.uk/10.3390/electronics9010100
Chicago/Turabian StyleApiletti, Daniele, and Eliana Pastor. 2020. "Correlating Espresso Quality with Coffee-Machine Parameters by Means of Association Rule Mining" Electronics 9, no. 1: 100. https://0-doi-org.brum.beds.ac.uk/10.3390/electronics9010100
Note that from the first issue of 2016, this journal uses article numbers instead of page numbers. See further details here.