Article

Road-Based Multi-Metric Forwarder Evaluation for Multipath Video Streaming in Urban Vehicular Communication

by
Ahmed Aliyu
1,*,
Abdul Hanan Abdullah
2,
Ismail Fauzi Isnin
2,
Raja Zahilah Raja Mohd. Radzi
2,
Arvind Kumar
3,
Tasneem S. J. Darwish
4 and
Usman Mohammed Joda
1
1
Department Mathematic, Faculty of Science, Bauchi State University Gadau, Bauchi State PMB 065, Nigeria
2
Department of Computer Science, Faculty of Engineering, University Technology Malaysia, Johor Bahru 81310, Malaysia
3
School of Computing Science & Engineering (SCSE), Galgotias University, Greater Noida, Gautam Buddh Nagar, Uttar Pradesh 201308, India
4
Department of Systems and Computer Engineering, Faculty of Engineering, Carleton University, Ottawa, ON K1S 5B6, Canada
*
Author to whom correspondence should be addressed.
Submission received: 31 August 2020 / Revised: 7 October 2020 / Accepted: 9 October 2020 / Published: 13 October 2020
(This article belongs to the Special Issue Vehicular Networks and Communications, Volume II)

Abstract

:
In video streaming over vehicular communication, optimal selection of a video packet forwarder is a daunting issue due to the dynamic nature of Vehicular Ad-hoc NETworks (VANETs)and the high data rates of video. In most of the existing studies, extensive considerations of the essential metrics have not been considered. In order to achieve quality video streaming in vehicular network, important metrics for link connectivity and bandwidth efficiency need to be employed to minimize video packet error and losses. In order to address the aforementioned issues, a Road-based Multi-metric Forwarder Evaluation scheme for Multipath Video Streaming (RMF-MVS) has been proposed. The RMF-MVS scheme is adapted to be a Dynamic Self-Weighting score (DSW) (RMF-MVS+DSW) for forwarder vehicle selection. The scheme is based on multipath transmission. The performance of the scheme is evaluated using Peak Signal to Noise Ratio (PSNR), Structural SIMilarity index (SSIM), Packet Loss Ratio (PLR) and End-to-End Delay (E2ED) metrics. The proposed scheme is compared against two baseline schemes including Multipath Solution with Link and Node Disjoint (MSLND) and Multimedia Multi-metric Map-aware Routing Protocol (3MRP) with DSW (3MRP+DSW). The comparative performance assessment results justify the benefit of the proposed scheme based on various video streaming related metrics.

1. Introduction

Noticeable progress has been made towards the deployment of Vehicular Ad-hoc NETworks (VANETs) for transportation systems [1]. Related government agencies and Intelligent Transportation System (ITS) organizations are conscious of the importance and feasibility of the VANETs in preventing accidents and improving the obtainable emergence response system [2]. In addition, the vehicle industries and researchers are exploring opportunities, which the VANETs can provide; for example, in the area of multimedia infotainment and location-centric advertisement [3]. The VANET is faced with some intimidating challenges that cause difficulty in video streaming provisioning at a satisfying level [4,5]. The overall challenges are the diverse densities, wide coverage region and the dynamic features of the vehicle nodes. In addition to these challenges, the video streaming has a stringent requirement to attain Quality of Services (QoS) [6,7]. However, video data are usually large, which also leads to other challenges of the video streaming. The stringent requirement including fewer packet losses, lower delay and higher bandwidth availability need to be achieved in order to attain quality video streaming [8]. Video streaming forwarding is anticipated to demand high network resources [9]. Therefore, the capability of VANETs can moderately support the video streaming [10]. Keeping in mind the aforementioned challenges, in this work, a scheme that improves optimal vehicle selection for quality video streaming has been proposed. However, some previous studies have been suggested for ensuring quality delivery based on multi-metric evaluation [11].
Xie et al. [9], utilized only vehicle location and ETX as the quality metric for video transmission, which are not enough considering the dynamic situation of VANETs. The ETX is a metric used to estimate the quality of path between two vehicles based on expected transmission count in a wireless network. However, the metric selects a path with minimum ETX between two vehicles but does not consider the hop count from source to destination vehicle. Meanwhile, in the proposed RMF-MVS scheme, the greedy based routing has been employed, which addressed the traversed high number of hop issue. Further, a scheme that considers the future and current position of the vehicle and the decoupling of video content transmission from the relay node transmission has been suggested. However, this is not enough to guarantee the optimal selection of the next forwarder vehicle considering the high video data rate and obstructions in the urban environment. However, in the proposed RMF-MVS scheme the accessible bandwidth availability has been considered to ascertain enough bandwidth for the video data streaming. In addition, the noise ratio in the signal, which is due to obstruction and interference of external objects, is also considered for forwarder vehicle selection.
Both Tripp-Barba et al. [10] and Mezher and Igartua [11] have suggested a scheme based on a multi-metric map-aware concept in order to achieve efficient data delivery. The suggested scheme in Tripp-Barba et al. [10] is based on normal data, that is, not video data. However, the video data transmission is considered in [11]. The multi-metric considered includes distance, vehicle density, vehicle trajectory, available bandwidth estimation and MAC layer losses. These metrics are important for the achievement of quality video delivery. However, some fundamental parameters, which are specific to the dynamicity of vehicular ad hoc networks, have not been considered. For example, in their approach, the trajectory of a next forwarding vehicle to the destination is estimated based on its distance and direction towards the destination vehicle. However, in the real vehicular situation, a vehicle moving towards the destination vehicle may decide to exit or stop its movement, the probability of vehicle stoppage needs to be considered when selecting a trajectory vehicle towards the destination vehicle.
In this context, in this work, several metrics including vehicle density on the Road (VDR), Vehicle TraJectory (VTJ), Hello message Received rate (HmRr), Accessible Bandwidth Estimation (ABE) and Signal to Interference plus Noise Ratio (SINR) have been considered for evaluating next forwarding vehicle selection. The video frames forwarded are split into three different frames, namely, I-frame, P-frame and B-frame, which are forwarded through multipath setting. I-frames are forwarded through a dedicated path, while both P and B frames are forwarded through another path. This concept enables higher priority for I-frames, which are the most important frames that interpret both P and B frames. Consequently, a Road-based Multi-metric Forwarder evaluation for Multipath Video Streaming (RMF-MVS) has been proposed considering link connectivity and bandwidth efficiency of a forwarding vehicle. The RMF-MVS scheme is further enhanced by adapting it to be a Dynamic Self-Weighting (DSW) score for forwarder vehicle selection evaluation. Specifically, the contributions of this study are stated as follows.
(1)
A link connectivity strategy for forwarder vehicle selection considering vehicle density on the road and vehicle trajectory.
(2)
An enhanced link connectivity considering response time evaluation based on hello message receive rate for forwarder vehicle selection.
(3)
Improved link quality estimation by employing accessible bandwidth estimation and signal to interference plus noise ratio.
(4)
Dynamic self-weighting score for multi-metric forwarder vehicle selection evaluation.
(5)
Validation based on extensive simulation results and critical analysis in comparison with state-of-the-art techniques.
The remaining parts of the paper are structured as follows. In Section 2, a comprehensive review of the related literatures is discussed. Section 3 presents the proposed RMF-MVS scheme with the Dynamic Self-Weighting (DSW) score mechanism. Section 4 presents the implementation and simulation results with their analysis and finally Section 5 concludes the paper. The related works based on video streaming in vehicular communication considering multi-metrics are discussed in the next section.

2. Related Works

This section presents a qualitative review of video streaming transmission in vehicular networks focusing on cross-layer oriented and multi-metric oriented video streaming. Section 2.1 and Section 2.2 explain cross-layer oriented and multi-metric oriented video streaming, respectively.

2.1. Cross-Layer Oriented Video Streaming

The cross-layer-based video streaming in vehicular networks is discussed considering the different works performed based on routing, MAC and/or application layer solutions. For example, a V2V video streaming based on Cross-layer Optimization for Overtaking (VCO2) assistance is proposed in order to reduce delay in video packet transmission while improving on-road overtaking safety [12]. A pre-recorded video streaming transmission between vehicles is suggested as a maneuvering system for overtaking assistance. It optimizes video streams such that, redundant video frames are skipped, transcoded and the frame rate are reduced for achieving efficient overtaking. The VCO2 is based on the IEEE 802.11p Enhanced Distributed Channel Access (EDCA). Nonetheless, the quality of the video content is not considered, since the PSNR and SSIM are not measured. Further, a mechanism which is Multi-flow and multi-driven for Video DElivery (MVIDE) is suggested to support pre-recorded video streaming over VANETs [13]. The mechanism performs the function of choosing best paths for pre-recorded video stream series. MVIDE is incorporated into the routing protocol to select paths by considering some characteristics, including application needs, multiple routes and dynamicity of vehicles.
In addition, cross-layer Techniques for grading the potential paths using Order Preference level by SImilarity type to Ideal Solution (TOPSIS) is introduced. MVIDE is further merged with Greedy Perimeter Stateless Routing protocol with Movement Awareness (GPSR-MA) [14,15] (GPSR-MA-MVIDE). Moreover, a real-world assessment of video transmission using IEEE 802.11p has been presented to explore the video content delivery challenges in VANETs (RMVT) [16]. The work is to measure the graphics quality of transmitted video using IEEE 802.11p V2V communication channel. Further, a scheme for measuring anticipated end-to-end delay in the graphics quality of the transmitted video information is suggested. In addition, a real-time scalable video codec is also proposed. A selective Rebroadcast mechanism for Video streaming over VANETs (ReViV) is proposed to relieve overloaded channels and assist in delivering video content in sparse network settings [17]. The mechanism chooses a fewer subset of rebroadcasting vehicles so as to reduce interference and attain higher video quality. The vehicles are grouped and graded based on their estimated positions and ability to reach out to other vehicles in the network by employing centrality parameters.
A Measurement-based analysis of Multi-hop pre-recorded video streaming Transmission (MTRM) using dedicated short-range communication devices is presented [18]. The performance of multi-hop transmission is measured to overcome the problem of high packet loss rate. High packet loss causes video quality degradation. The measurement also considers interference of the communication channel. Further, startup catching and retransmission strategies are introduced to enhance the video application. In addition, performance measurement of the retransmission strategy and analysis of the strategy are conducted. While the retransmission strategy adopted might lead to delay in the video transmission. However, the proposed video codec has not been adequately validated, because other validation parameters are not considered for ascertaining quality of the video. In addition, the road-based multi-metric is not considered in the aforementioned proposed works. Further, Section 2.2 discusses the related works in multi-metric oriented video steaming over vehicular network.

2.2. Multi-Metric Oriented Video Streaming

The multi-metric based video streaming is discussed based on different metrics considered in vehicular network, which are related to road-based metrics. In Xie et al. [9], a multipath video streaming solution based on node disjoint and link disjoint algorithm that employs Ad-hoc On-Demand Vector (AODV) routing concept has been suggested. However, the node-disjoint and link disjoint concepts are not sufficient to minimize the route coupling effect and wireless contention, because the signal coverage of the nodes in the multiple paths is not put into consideration during path selection. ETX and node disjoint concepts are considered as selection criteria for forwarding vehicle in video streaming. However, other connectivity metrics such as vehicle trajectory and vehicle density have not been considered for ascertaining vehicle connectivity during video transmission.
A novel Multichannel Error Recovery Video Streaming (MERVS) protocol is proposed to address the issue of high packet loss in VANETs [19]. MERVS uses an error recovery process for high quality and real-time video streaming. It sends video through two channels: Reliable and unreliable channel. It transmits I-frames through the reliable channel, while inter-frames are transmitted through the unreliable channel. In order to reduce delay, scalable reliable channel, quick start and priority queue were incorporated. However, MERVS lacks routing and a relay selection algorithm; hence, further study is required.
QoS-aware Hierarchical Web Caching (QHWC) scheme for online video streaming applications in Internet-based VANETs is presented to address bandwidth and delay challenges. The scheme considers mobile video streaming in order to attain qualitative video delivery at the receiver node [20]. In this proposal, new metrics including Query to Connectivity Ratio (QCR) and Load Utilization Ratio (LUR) are employed to maintain QoS for different video streaming applications. However, in a hierarchical web caching approach, a link breakage or dead node in one level of the hierarchy may cause failure of video message delivery.
Further, a Mobility-aware and Quality-driven Retransmission limit Adaptation Scheme for Video streaming over VANETs (MQRASV) is presented [21]. The adaptation scheme employs multi-objective optimization structure that concurrently reduces the likelihood of start-up delay and playback freeze of a streaming video at the destination vehicle. They are reduced by tweaking the MAC retransmission limit in relation to channel delay result and packet communication rate. In addition, the intervallic channel state approximation is carried-out at the RSU considering the information obtained from the Doppler shift effect and Received Signal Strength (RSS). Furthermore, two-hop transmission approach has been employed in the zone where the destination vehicle is found within transmission range of any of the RSU. However, despite its strength in terms of playback freeze and contention window, link breakage has not been considered in the scheme.
In addition, in Tripp-Barba et al. [10], a multi-metric based on map-aware routing protocol for vehicular network has been suggested. Metrics considered include vehicle density, distance, vehicle trajectory and available bandwidth for making forwarding decision. This aims to reduce packet delay and losses. However, since the urban scenario is considered, there is need to check the interference or noise in the signal based on Signal to Interference plus Noise Ratio (SINR). In addition, multimedia data is not employed in implementation and evaluation of the proposed protocol.
Further, a similar multi-metric map-aware routing protocol, which is based on multi-multimedia data for vehicular communication has been proposed. The multi-metric considered include distance, vehicle trajectory, vehicle density, MAC losses and available bandwidth for evaluating forwarding vehicle selection [11]. They are important for the achieving quality video delivery. However, some fundamental parameters, which are specific to the dynamicity of vehicular ad hoc network has not been considered. For example, in their approach, the trajectory of a next forwarding vehicle to the destination is estimated based on its distance and direction towards the destination vehicle. However, in the real vehicular network situation, a vehicle moving towards the destination vehicle may decide to exit or stop its movement, the probability of vehicle stoppage need to be considered when selecting a trajectory vehicle towards the destination vehicle. Another metric considered is the vehicle density, which is a very important metric for guaranteeing link connectivity in multipath forwarding.
The road vehicle density based on a given threshold has been employed in order to avoid higher congested roads. However, in their vehicle density estimation, both vehicle in-direction and opposite-direction of the destination vehicle are considered. This results in the redundant estimation of road vehicle density, since their trajectory estimations consider only vehicles in the direction of the destination vehicle, which is selected as a next forwarding vehicle. Therefore, the employment of multi-metric has a substantial impact in minimizing the video packet error and loss, increasing the receiving data rate and in turn improving the quality of the video streaming. A detailed discussion of the proposed Road-based Multi-metric Forwarder evaluation in Multipath Video Streaming (RMF-MVS) has been presented in Section 3.

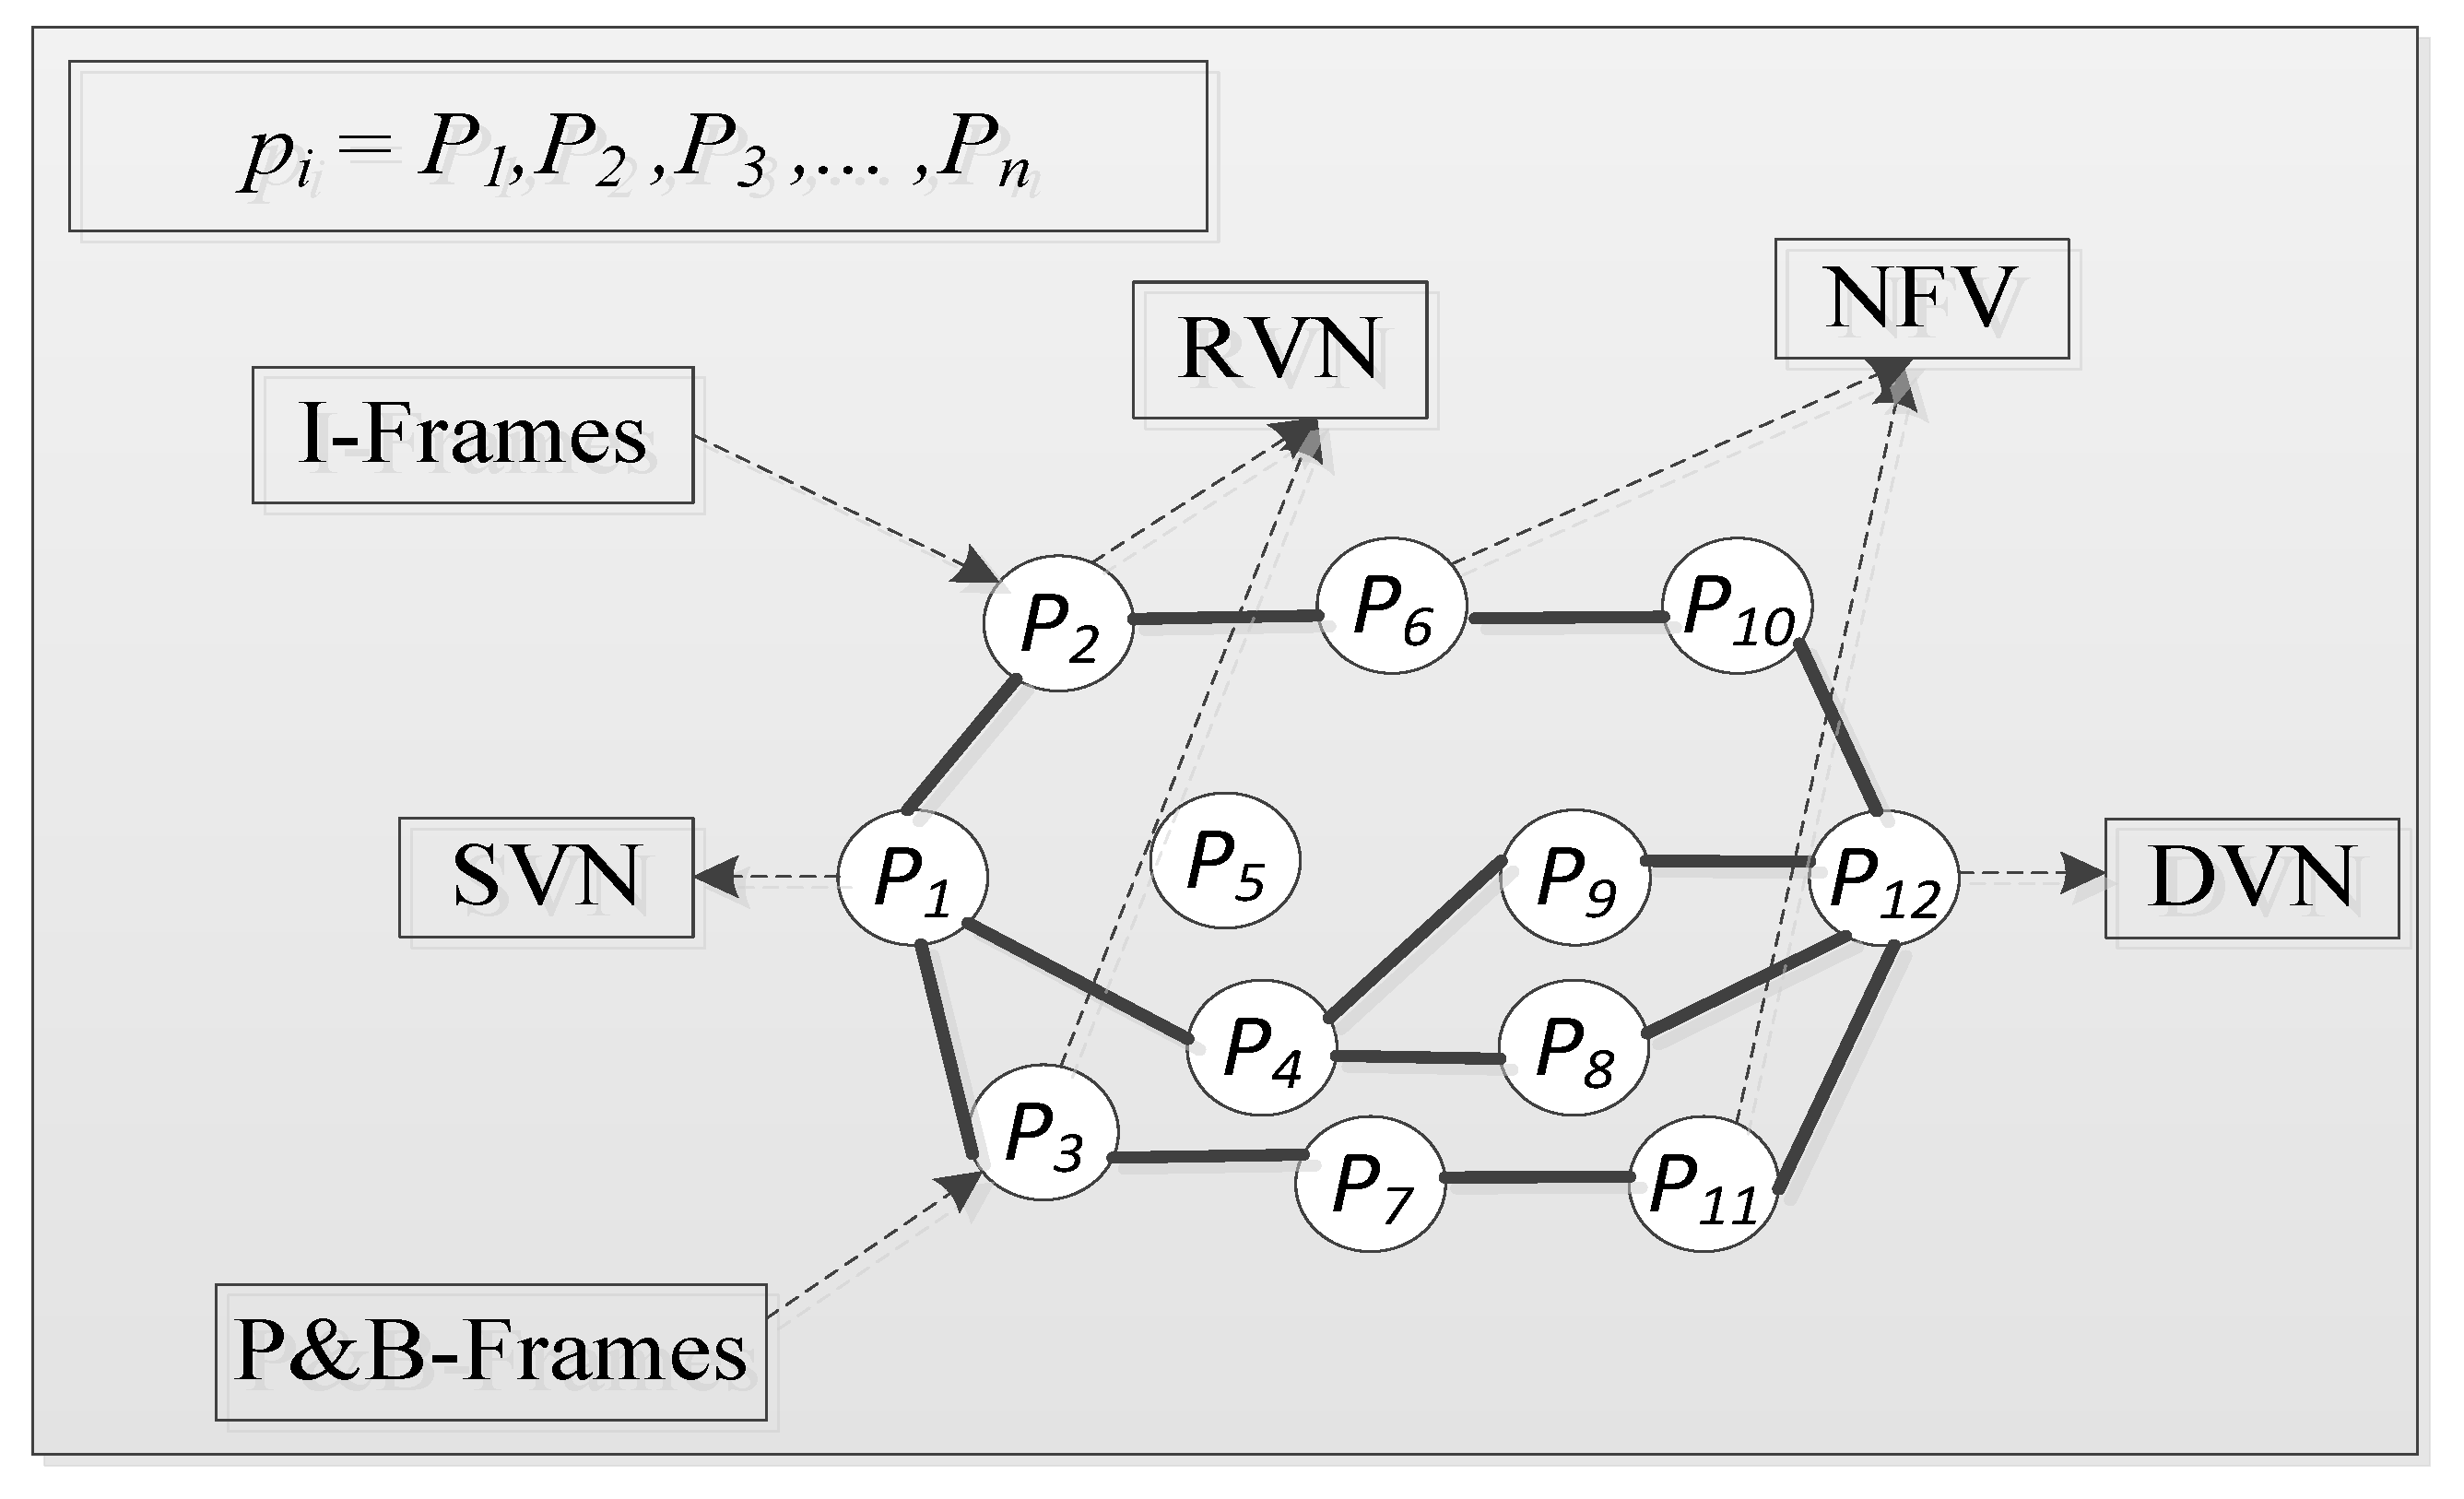
3. Road-Based Multi-Metric Forwarder Evaluation Scheme

The design of the Road-based Multi-metric Forwarder evaluation scheme for Multipath Video Streaming (RMF-MVS), which is based on multiple metrics including Vehicle Density of the Road (VDR), Vehicle TraJectory (VTJ), Hello Message Receive Rate (HmRr), Accessible Bandwidth Estimation (ABE) and Signal to Interference plus Noise Ratio (SINR) has been presented in this section. These metrics improve the selection of Next Forwarding Vehicle (NFV) for attaining quality video streaming delivery. The RMF-MVS scheme comprises of two stages, namely, information collection and video data forwarding stage. The information collection stage involves the exchange of information among neighboring vehicles via hello message. The video data forwarding stage performs video packet transmission from Source Vehicle Node (SVN) to the Destination Vehicle Node (DVN) based on the evaluated multi-metrics and dynamic self-weight score mechanism. The detailed discussion of the two stages is presented in Section 3.1 and Section 3.2. Figure 1 represents the concept of the whole road-based multi-metric video streaming transmission in a multipath setting.

3.1. Information Collection Stage

In this stage, the vehicle communicates with each other by exchanging a hello message. The exchange of the hello message provides information that the SVN or the Present Forwarding Vehicle (PFV) use to select among the candidate NFV. The hello message format includes the number of neighbors based on road-id of the candidate NFV and the timestamp for the receipt of the hello message. In addition, a counter for the hello messages is set, which gives the total number of hello messages received within the last one minute from each Candidate-Next Forwarding Vehicle (C-NFV). This counter is stored in Table of Neighbors’ Information (TNI), which is utilized to estimate hello message receive rate. The hello messages are exchanged among neighbors between the time intervals of everyone second based on the hello packet interval. This is feasible because urban settings are considered; hence, it is believed that vehicle speed is lower relatively compared to highway settings. There might be no vehicle that changes direction within 1 s. If any vehicle changes its direction, the packet is still forwarded, but at this point, the vehicle that receives the packet checks it TNI to see if there exist a vehicle that has the same direction with the last forwarder, and then send to that vehicle. All the aforementioned information are saved in the TNI, they are employed in selecting an optimal NFV for the video data transmission. The video packet information format of the scheme is provided in Figure 2. In addition, the concept in Section 4.2 is also employed to incorporate into the scheme and make it a full-fledged scheme.
Thus, the strategy of the dispersed vehicle estimation at the SVN for relay vehicle and the intermediate vehicle selection based on dispersed vehicle selection with SINR have been incorporated to this objective. The general assumption in geographic routing is that the SVN is already aware of the location and direction of the DVN in the network based on the GPS and location service system. Therefore, the greedy algorithm is modified such that it does not only consider the vehicle closer to the destination but also take into cognizance of the aforementioned multiple metrics. Consequently, due to the high data rate of the video, to achieve pathdiversity, lower delay and load balancing, thus the multipath transmission is employed. The aforementioned metrics are discussed in the following subsections.

3.1.1. Vehicle Density of the Road Estimation

The Vehicle Density of the Road (VDR) estimation is considered as one of the metrics for achieving optimal NFV selection, because the higher the density on the road the better the options for optimal NFV selection. In the VDR, there exist two directional vehicles including In-Direction Vehicle Density (IDVD) and Opposite Direction Vehicle Density (ODVD) as in [22]. The vehicles in the direction of the DVN are considered as the suitable C-NFV. In this study, the density of the ODVD is given minimal consideration based on their status. The density of the road is estimated based on the C-NFV that exist on that particular road, which is within the coverage area of the PFV. In the hello message, each vehicle sends information of its road-id to the neighbors that have a two-hop link to itself. Therefore, the VDR is estimated as the number of vehicles that resides within a road, which is in the coverage area of the PFV based on the two-hop link. The vehicles are collated based on their respective road-id, which is stored in the TNI. The amount of vehicles that are neighbors to C-NFV is divided by the hop count ( 2 Hop ), because every C-NFV collect information of vehicles in its two link coverage. It is presumed that the number of neighboring vehicles with their road-id can be used to determine which road has the highest vehicle density, in order to maintain connectivity. Even though, higher vehicular density might lead to congestion and wireless contention. However, the multiple paths considered have already separated the routes to avoid congestion based on route coupling. The VDR is computed as in Equation (1).
VDR = ( 3 × IDVD ) + ODVD 4 × 2 Hop
The NFV is selected based on the C-NFV that has the highest value of VDR. However, the ODVD is given a smaller value by multiplying it with 1 4 , which is three times lesser to the value of IDVD multiplied by 3 4 . This ensures that C-NFV moving towards the direction of the DVN is given higher priority. Thus, a threshold has been assigned as VDR max , where the VDR max is estimated based on the pilot simulation results obtained and the road density in [22]. Therefore, the VDR max is set to 100 vehicles/km. The C-NFV that has a larger amount of vehicles than the VDR max ( VDR > VDR max ) is considered as a congested network. Therefore, it is related as follows in Equation (2).
VDR =   { 1 VDR VDR max 0 VDR > VDR max
The VDR is estimated for the two multiple paths independently since the paths are dispersed. The road density of a C-NFV is compared with the other road density of the neighbor vehicles of a C-NFV and the road with the highest density that is not greater than the VDR max , is considered for selection. Therefore, the vehicle density of the road is considered as one of the important metrics that enable optimal NFV selection. This, in turn, improves the quality of the video transmission since the faster selection of NFV has been considered based on density of the vehicle on the road. The vehicle trajectory is discussed in the next subsection.

3.1.2. Vehicle Trajectory

The Vehicle TraJectory (VTJ), which is based on future position and distance between the PFV to C-NFV and to the DVN have been considered as an important parameter that can influence positively on the selection of the NFV that navigates towards the DVN. This can improve on the delivery time of the video streaming, hence improving the quality of the video streaming. The VTJ of the C-NFV is considered to complement the VDR metric because the VDR does not guarantee the successful delivery of video streaming in case of congestion; hence, there is a need for consideration of the future position of vehicles and their distance from the destination. The VTJ of a C-NFV is estimated as a function of present and the future distance of a C-NFV to the DVN from the PFV by employing the velocities v p i   and   v p j . It is employed to determine the track of the C-NFV, which in turn provides the navigation nearness of the C-NFV to the targeted DVN. It also estimate if the C-NFV is navigating away from the DVN based on the distance calculation and direction. The VTJ helps the PFV not to perform incorrect forwarding decision based on density and SINR without considering if the C-NFV is navigating towards the DVN, which can result to loss of video packet. Therefore, the trajectory of the C-NFV is essential and benefiting parameter for vehicular communication.
The VTJ ( C NFV ) of a C-NFV using the Future Distance FD ( C NFV DVN ) ( t i ) to the DVN at time t and the Present Distance to the DVN is PD ( C NFV DVN ) ( t 0 ) , here t 0 is assumed as zero ( 0 ) since it is the initial time. The FD ( C NFV DVN ) ( t i ) is estimated by computing the future position of the C-NFV based on its speed considering Equation (3). First, the distance between the C-NFV and the DVN needs to be estimated; it is estimated based on the position of both C-NFV and the DVN. The Euclidean distance is calculated for each of the C-NFV to the DVN as expressed in Equation (4). The speed of the C-NFV and DVN are considered as D ( C NFV DVN ) =   p C NFV   p DVN in relation to the condition given in Equation (7) [11]. The distance can be expressed as follows.
D ( C NFV ) ( t 0 ) =   p C NFV   p DVN
Thus, Equations (4) and (5) are derived by considering the present distance of C-NFV at t 0 = 0 and the future distance of C-NFV t = t i , respectively.
D ( C NFV DVN ) = ( p i ( C NFV ) p i ( DVN ) ) 2 + ( p j ( C NFV ) p j ( DVN ) ) 2
D ( C NFV ) ( t i ) =   p C NFV + ( v C NFV × t )   p DVN
The probability of stoppage of a speeding C-NFV P r ( STP C NFV ) has not been considered in the trajectory or vehicle tracking estimation. This is important because the behavior and decision of driver cannot be ascertained at any given time. Hence, the probability of stoppage of a speeding C-NFV has been introduced based on the number of changes in velocity Δ ( v i ) . The number of changes in velocity is based on the variation of different speed received within the different time of the hello message exchange including stopping at the traffic lights. Therefore, the C-NFV with lower variation in speed and closer to the DVN has been considered as one of the requirements for the NFV selection. The probability of C-NFV stoppage is estimated as in Equation (6). The C-NFV with a smaller value of P r ( STP C NFV ) and a smaller value of VTJ ( C NFV ) distance to the DVN is considered as one of the parameter for selecting NFV.
P r ( STP C NFV ) = 1 ( 1 i = 1 n Δ ( v i ) )
For the purpose of clarity, ω is substituted for P r ( STP C NFV ) , σ 0 is substituted for D ( C NFV ) ( t 0 ) , σ i is substituted for D ( C NFV ) ( t i ) and the distance between SVN and DVN D ( SVN DVN ) is replaced with τ in the following Equations (7)–(9).
VTJ ( C NFV ) =   { 1 ,   if   σ 0 × ( ω ) < R 1 , if   σ 0 × ( ω ) > Rand σ 1 × ( ω ) < R f ( σ 0 , σ i ) ,   if   σ 0 × ( ω ) , σ i × ( ω ) > Rand σ 0 × ( ω ) > σ i × ( ω ) g ( σ 0 , σ i ) ,   if   σ 0 × ( ω ) , σ i × ( ω ) > Rand σ 0 × ( ω ) < σ i × ( ω )
where
f ( σ 0 , σ i ) = σ i τ R τ
g ( σ 0 , σ i ) = σ 0 τ R τ
The evaluation of the VTJ is conducted at the two paths, which are computed at each vehicle of the multipath. The positions of C-NFV and DVN are represented as p C NFV   and   p DVN , respectively. The brackets . is the modulus function of a vector. The trajectory parameter value increases as the C-NFV navigates towards the DVN; it decreases as the C-NFV navigates away from the DVN, as shown in Equation (7). Considering the equation, four different situations of the tracking parameters are depicted. The first situation is when the C-NFV is within the transmission coverage R of the DVN with estimation of its probability of stoppage σ 0 × ( ω ) < R thus, the VTJ ( C NFV ) is given the highest value, which is 1 , in respective of the value of σ 1 × ( ω ) . The second situation is when the future distance C-NFV is within the transmission coverage of the DVN with the probability of its stoppage σ 0 × ( ω ) > R   and   σ 1 × ( ω ) < R ; hence, the VTJ ( C NFV ) is also given the highest value, that is 1 . The third situation is when the present distance and future distance of C-NFV are both greater than the transmission coverage with a probability of stoppage σ 0 × ( ω ) ,   σ i × ( ω ) > R . At this point, the condition σ 0 × ( ω ) > σ i × ( ω ) with estimation of its probability of stoppage at the subcase is considered, which means that the future distance of C-NFV to the DVN is less than the present distance of C-NFV to DVN. It means that the C-NFV is getting nearer to the DVN. The forth, which is the last situation, only the sub-case σ 0 × ( ω ) < σ i × ( ω ) is considered, it means that the future distance of C-NFV to the DVN is greater than the present distance of the C-NFV to the DVN. This implies that, the C-NFV is getting far apart from the DVN. Therefore, two functions f and g are introduced in Equations (8) and (9), respectively. Thus, the vehicle tracking is an important parameter for vehicular communication that can assist in selection of the optimal NFV, which improves the quality of the video delivery. The hello message receive rate, which can be related to the playback freezes and startup delay of a video packet has been discussed in the next subsection.

3.1.3. Hello Message Receive Rate

The hello message receive rate has been employed to justify playback freezes with startup delay, which is considered as another important parameter for achieving quality video streaming. The essence of employing this metric is based on consideration of the nature of data that is being transmitted from source to destination. However, the two different parameters considered in the previous subsections are very important but might not be adequate, because they may not guarantee the quality of the video. Minimum arrival time is required for better quality display if there is a delay in single packet most especially the I-frame, the whole of the previous packet might not be meaningful after the display. Thus, there is a need for a parameter that considers the video characteristics of the playback freezes. Despite estimating the VDR for selecting NFV that is within a particular road and estimating the vehicle trajectory towards the destination. There is still a need to take advantage of the Hello message Receive rate (HmRr) of each of the C-NFV in order to know the C-NFV has greater link connectivity with PFV. This will enable the estimation of how fast the C-NFVs can forward or deliver a video stream to destination.
The startup delay in video streaming is the latency between when the video packet is received to the time it starts streaming. The time when streaming starts depends on the number of video frames received within a specific period. The faster the video frames are delivered the faster the startup with lower delay. A lower startup delay translates to a better quality video. The playback freezes occur when there is no ample amount of video content in the buffer while the display has already started. This leads to breaking or stopping of streaming during video display. Streaming with zero or few playbacks freezes also translate to quality of the video streaming. Thus, both the playback freezes and the startup delay are defined as a function of delay in transmission from one vehicle to another.
The number of the received hello message from each of the neighbor vehicles is calculated. Every vehicle stores the number of hello messages received from each of its neighbors to the TNI. The PFV select the vehicle with the highest number of hello messages at the time of video forwarding. The vehicle with the highest hello message signifies that there is higher link connectivity with the PFV. Therefore, the following Equation (10) is employed to compute the number of hello message received rate of each C-NFV. The summation of all hello messages per C-NFV is compared with that of the other C-NFVs and then the C-NFV that has forwarded the highest hello message is chosen. The C-NFV with the highest value of H m R r is considered as a good C-NFV. The H m R r is computed to select two Relay Vehicle Node (RVN) at the SVN and the intermediary vehicles compute the H m R r to select single NFV up to the DVN.
T H m R r = i = 1 n H m R r
Here, it is assumed that the C-NFV with the highest hello message has a greater connectivity. Thus, the delay in video delivery is minimal, which lead to zero or fewer freezes with lower startup delay. Consequently, it helps in selecting an optimal vehicle that improves the quality of the video streaming transmission. The T H m , R r is the total number of the received hello message by the PFV. The next subsection discusses the accessible bandwidth estimation.

3.1.4. Accessible Bandwidth Estimation

In this subsection, the employment of Accessible Bandwidth Estimation (ABE), which is an important parameter metrics for achieving quality video streaming has been discussed. The VDR, VTJ and the H m R r are important metrics, but cannot determine the level of availability of bandwidth of the link between two vehicles. The ABE has been employed in some vehicular communication research works, for example, in [11,23]. The ABE is based on the wireless standard for vehicular communication, that is, IEEE 802.11p/WAVE protocol. Considering the fact that a video data has a high data rate, the consideration of the available bandwidth is very essential to achieve a better video quality and delivery. Therefore, the ABE has been considered as one of the metrics for video stream forwarding decision to assist in choosing optimal NFV. However, in some previous research works, the packet loss has been considered based on packet collision that occurs in the entire network scenario. This concept is not adequate since in ABE only the bandwidth of a link between two vehicles is feasible. Therefore, the ABE is estimated at each single link, that is, the link between the PFV and C-NFVs. The major phases of the ABE are synchronization of channel idle period and, back-off and collision phase. In the ABE, individual vehicles compute it idle duration via sensing of the channel medium. The wireless link idle duration of the transmitting vehicle ( ID tv ) and the receiving vehicle ( ID rv ) are estimated in ABE. Further, the back-off and collision phase are considered when a sender vehicle transmits a video packet and the medium of the receiving vehicle is not idle.
The operation process involves that each vehicle senses its channel medium and compute its idle time percentage. The ( ID tv ) and ( ID rv ) of a wireless link in ABE are computed based on link capacity C . The concept is that for communication to occur there is a need for both the transmitter and the receiver vehicle to be at an idle state, which is not realistic considering the high density of urban scenario. Due to this reason, it is difficult to synchronize the idle duration of both transmitting vehicle and the receiving vehicle. There is possibility of video packet loss due to video packet collision. Therefore, the ABE estimate the hello messages collision probability ( hm prob ). The probability of video packet ( vp ) collision of a given number of ( N ) vehicles with average speed ( Sp ) in an urban scenario is formulated in Equation (11).
prob ( vp ,   N ,   Sp ) = f ( vp ,   N ,   Sp ) × hm prob ( vp ,   N ,   Sp )
The   f ( vp ,   N ,   Sp ) is derived based on Lagrange polynomial interpolation as in Tripp-Barba et al. [23] by utilizing the video packet losses and the hello message losses obtained from the simulation. The overhead generated due to the binary exponential back-off of the collision phase has been derived based on [24]. Equation (12) represents the back-off estimation mechanism ( K ) , the duration difference between the transmission of two video frames is represented as D diff . The Distributed coordination Function Inter-frame Space (DIFS) (IEEE 802.11 standard, 2003) is a static range of time for vehicle node to access the channel medium when it is free for duration not longer than DIFS. The back off   ¯ is the average number of decremented back-off slot for a single frame.
K = DIFS + back off ¯ D diff
The two different phases, which are essential for estimating the ABE between transmitting and receiver vehicle, are integrated. In this study, the transmitting vehicle is considered as PFV, while the receiving vehicle is the NFV. The transmitting vehicle computes the ABE of each of the C-NFVs’ wireless link based on [23] as in Equation (13).
ABE C NFV = ( 1 K ) × ( 1 ( prob ( vp ,   N ,   Sp ) ) × ID rv × ID tv × C
At the final stage, the ABE C NFV is multiplied by C , which is the capacity of the link. Based on Equation (13), the value of the metric ( mt ABE ) ABE C NFV is within the range of 0 to 1, that is, 0 mt ABE C NFV 1 . The high value of ABE means a larger bandwidth capacity in the link created between the PFV and C-NFV, which is further divided by the link capacity C . Equation (14) represents the metric ABE ( mt ABE C NFV )   of a PFV to the C-NFV.
mt ABE C NFV = ABE C NFV C
Thus, the ABE has been considered as one of the major metrics for NFV selection requirement to attain better video transmission. The next metric considered for the selection decision is the signal to interference plus noise ratio.

3.1.5. Signal to Interference Plus Noise Ratio

Signal to Interference plus Noise Ratio (SINR) is also an essential parameter, most especially when considering a city/urban vehicular network settings. The SINR evaluates the level of interference and channel noise of the candidate NFV. This is important considering the obstructions in the road area such as tall vehicles and tall buildings. The different source of noise, which are from other communication devices is also estimated in SINR [25]. Meanwhile, the SINR has been employed, which is formulated as given in Equation (15). Therefore, considering the type of scenario employed in this study, which is an urban scenario, the interference and the noise have been adequately considered when selecting an NFV for quality video streaming transmission.
SIN R ( p i , p j ) = S PW F RD ( p i , p j ) × l ( p i p j ) φ + σ ( p j )
where p i is the transmitting vehicle position and p j signal receiver vehicle’s position; S PW is the transmitting signal power and F RD is the random fading between the transmitting vehicle and the receiving vehicle; l is the distance between p i   and   p j , while φ and σ represent the external noise and small short-noise of p j , respectively. Thus, the SINR is employed when selecting the best NFV for video streaming transmission.
The metrics discussed in Section 3.1.1, Section 3.1.2, Section 3.1.3, Section 3.1.4 and Section 3.1.5 are collected through the hello message broadcasted to all neighbor vehicles. The neighbor vehicles send information including their road-id and their directions, which are used to compute the VDR metric. The information based on position, speed and direction are used to estimate the VTJ metric of the C-NFV to the DVN. The information extracted from the hello message count is used to estimate the H m R r of the neighbor vehicles, which can improve on the playback freezes and the startup delay of the video streaming. Further, the time when the first hello message arrived to the PFV and the total quantity of hello messages received from an individual vehicle are employed to estimate the idle time and video packet losses, thus estimating the ABE of the wireless link. Finally, the positions, transmitting signal power based on the distance between positions are also employed to estimate the SINR of the link between the PFV and the C-NFV in the vehicular communication. The next section discussed the video streaming data forwarding stage.

3.2. Multi-Metric Video Streaming with Dynamic Self-Weigthting Score

In this subsection, the multi-metric is categorized into two (2), including multi-metric evaluation without and with dynamic self-weighting for video data forwarding, which involves the aforementioned metrics.

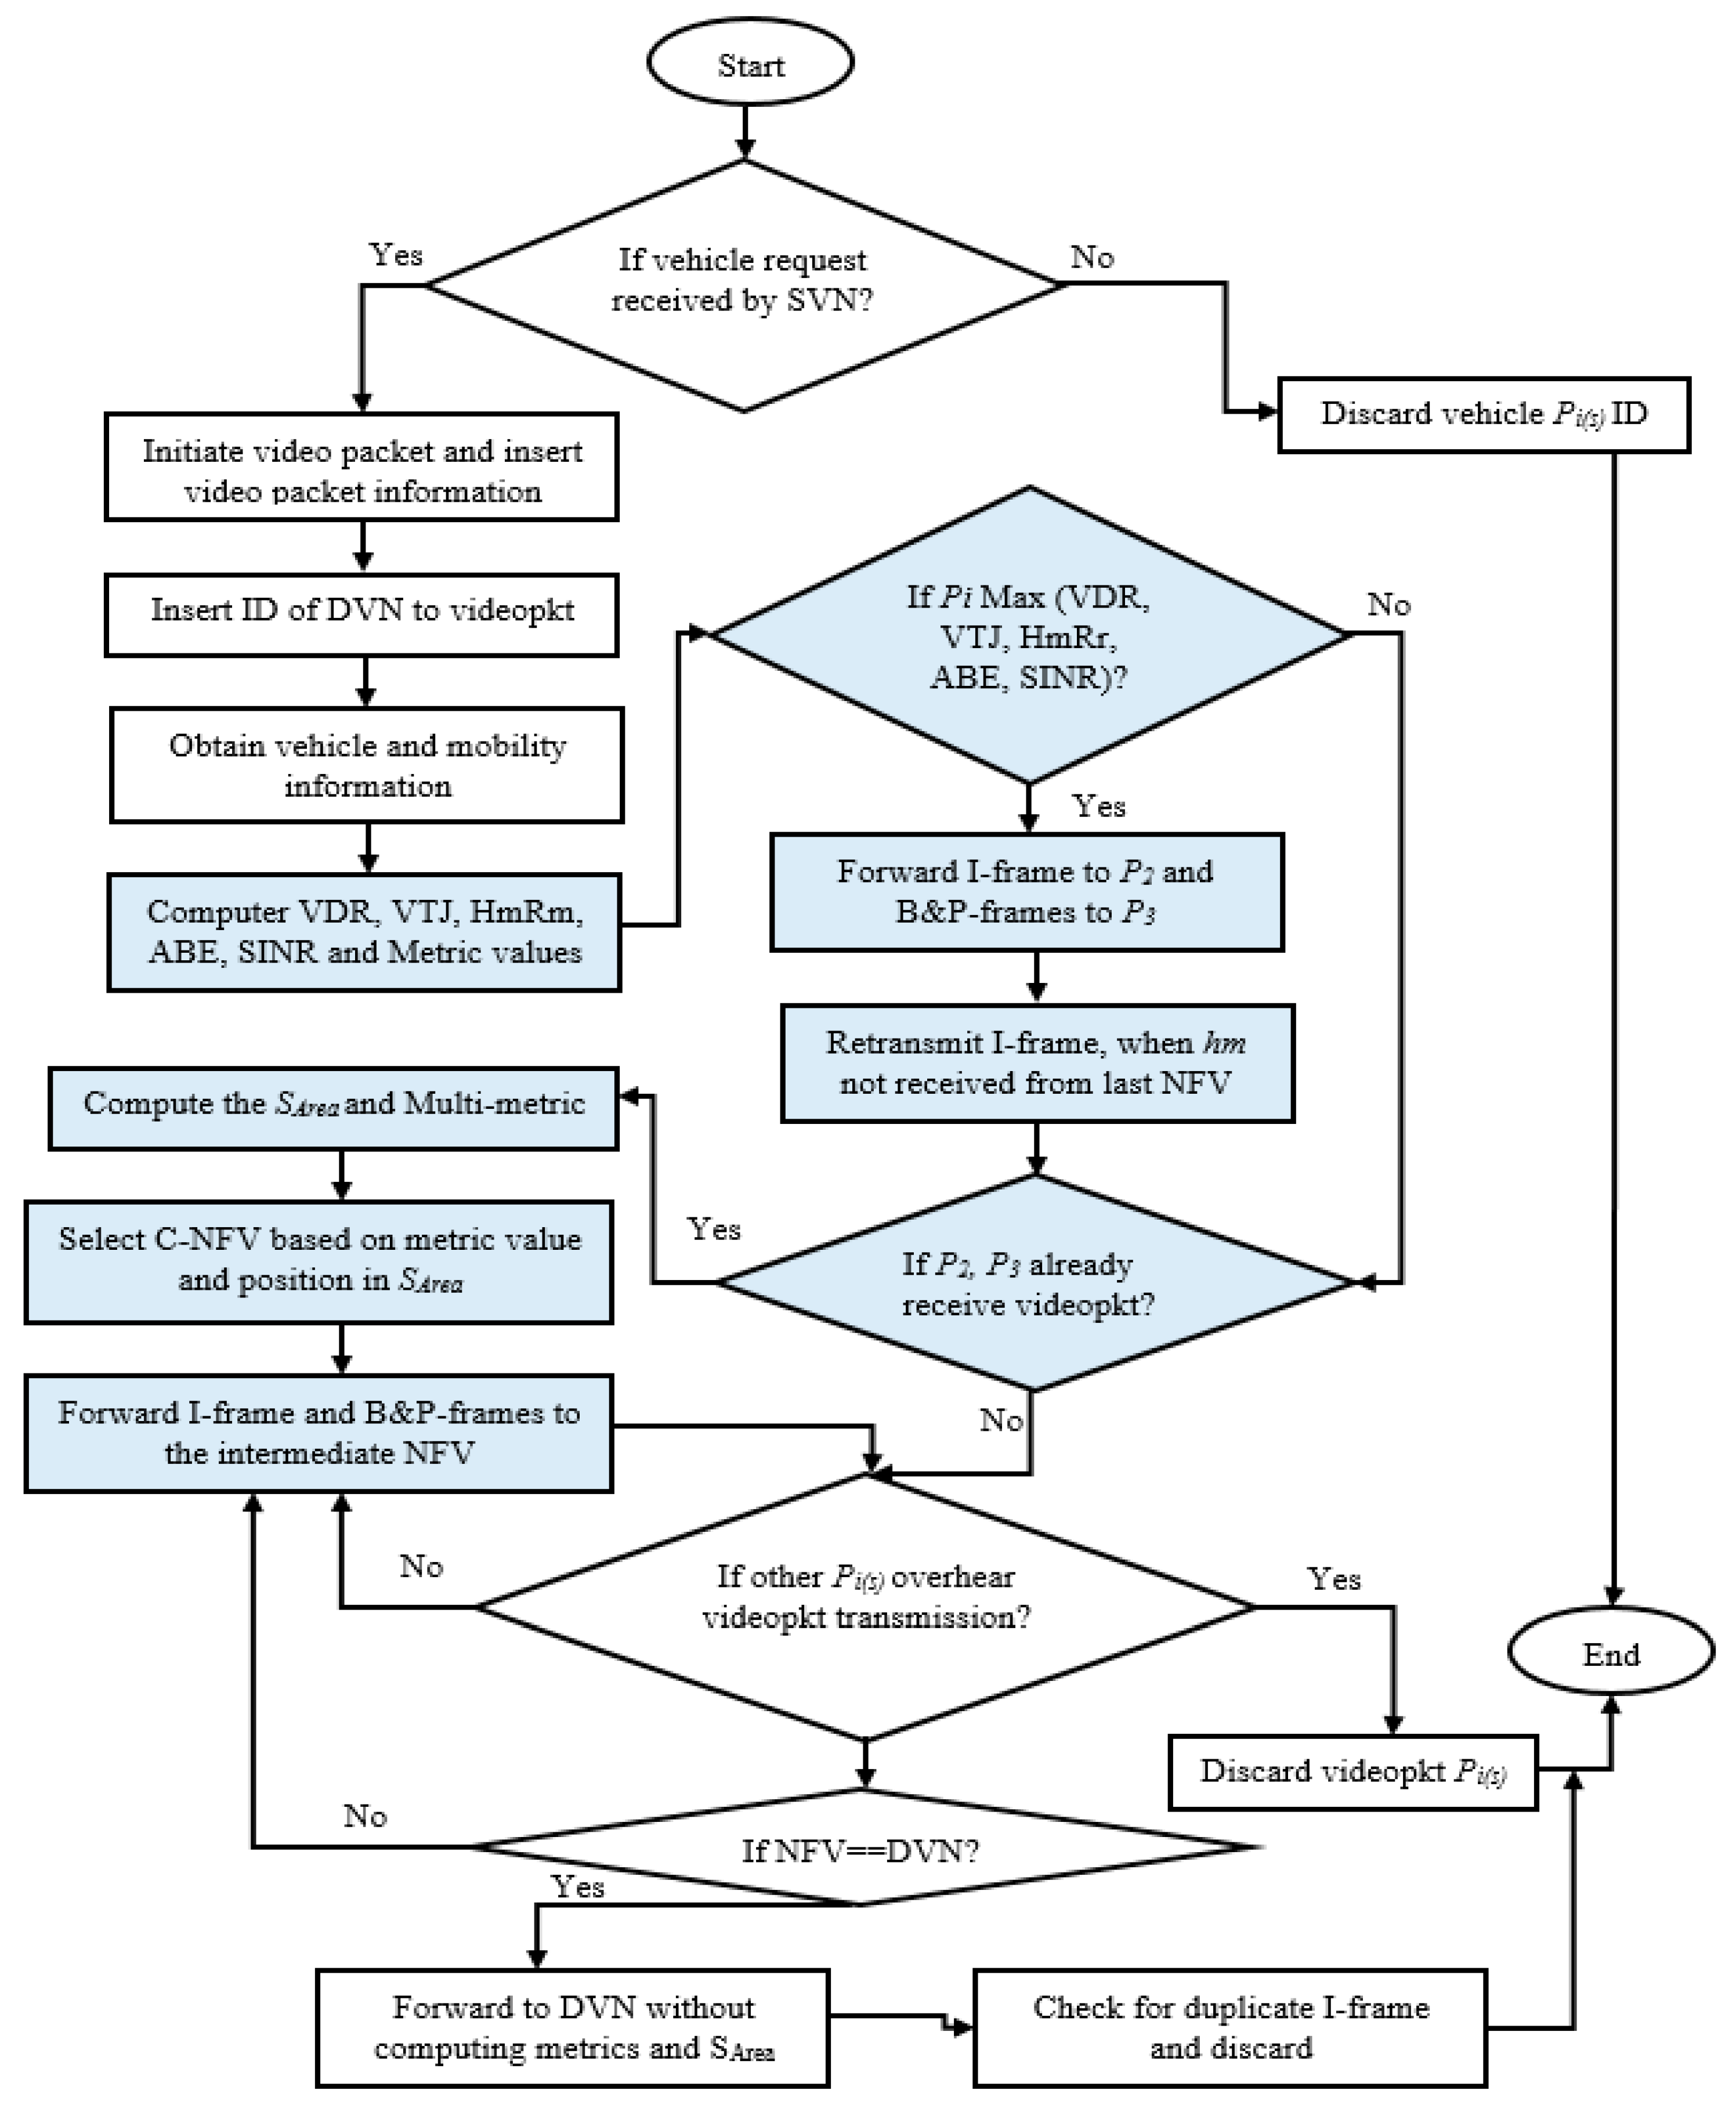
3.2.1. Multi-Metric Video Streaming without Dynamic Self-Weighting Score

The Multi-metric, which consist of VDR, VTJ, T H m R r ,   ABE and SINR as discussed in Section 3.1 have been employed for selecting optimal NFV. These metrics are computed in order to select optimal NFV. The concept of the video data forwarding considering different frames based on frame splitting has been discussed earlier in Section 1. Considering the number of multi-metrics employed, an equal fixed weight value has been assigned to each of the metrics in order to evaluate the most optimal C-NFV. The vehicle with the highest multi-metric score is considered as the most optimal NFV. The weight assigned is denoted as weights = wt 1 ,   wt 2 ,   ,   wt n , n represents the number of metrics, since the number of metrics utilized are five (5), n = 5 . The weight of each metric is given as 1 5 = 0.2 . Further, the weights wt n are allocated to the metrics mt n , which includes mt VDR ,   mt VTJ ,   mt T H m R r ,   mt ABE C NFV and mt SINR . These metrics are normalized since they have different units. Thus, the total summation of the multi-metric score for each of the C-NFV is represented in Equation (16) as follows.
mt C NFV = n = 1 5 mt n ( C NFV ) = mt VDR × wt 1 + mt VTJ × wt 2 + mt T HmRr × wt 3 + mt ABE   × wt 4 + mt SINR × wt 5
In Algorithm 1, the video data forwarding procedure is highlighted. Video packet and video ID are generated including I-frame, P-frame and B-frame as discussed earlier in Section 1. The algorithm employs the multiple metrics including VDR, VTJ, T H m R r , ABE and SINR. The five metrics are introduced into the video data forwarding algorithm in order to select an optimal NFV. Lines 1 to 10 calculate the metrics and identify the first two suitable vehicles as the RVNs, which are neighbors to the SVN for multipath transmission. At line 12, if a C-NFV is not selected as the RVN, then it is discarded. Line 13 to 19 involves the evaluation of the metrics in order to select a suitable vehicle as the NFV. A C-NFV with a maximum value of the five metrics is selected. Equal weighting factor has been assigned to the five metrics in order to assign equal priority to the metrics. In addition, after each packet forwarding, the PFV retransmit I-frame when hello message is not received from the last NFV within the period of one second, this is necessary in order to guarantee delivery of the important frame, which in turn improves the quality of the video streaming since UDP has been considered as the transmission protocol in this study. At the intermediary vehicles, lines 20 to 31 are invoked to compute the multi-metric for selecting the optimal NFV. Whenever video data is forwarded, information regarding the qualified vehicles is stored in the TNI at the vehicle P 2 . The forwarding of video data continues until the C-NFV is the DVN, then the video packet is forwarded to DVN. The DVN receives the video data compare and discard duplicate I-frame. Then the DVN rearranges video packet for streaming and the video data forwarding procedure terminates. Figure 3 depicts the flow of the multi-metric video streaming forwarding procedure.
Algorithm 1. Multi-metric Video Streaming Forwarding
I n i a t e :   v i d e o p a c k e t
I n i a t e :   v i d e o p k t i d
I n s e r t :   v i d e o p k t t p =   I _ f r a m e ,   P _ f r a m e ,   B _ f r a m e
I n s e r t :   I D o f D V N w h e n f o r w a r d i n g v i d e o p k t
O u t p u t : F o r w a r d v i d e o p k t f r o m S V N t o D V N
1:   P r o c e d u r e V i d e o D a t a F o r w a r d i n g ( p i ,   d a t a )
2:   I f v i d e o r e q u e s t r e c e i v e d b y S V N T h e n
3: O b t a i n s p e e d ,   v e h i c l e i d ,   r o a d i d ,   d i r e c t i o n ,   t i m e s t a m p ,   p o s i t i o n ,   H m c o u n t o f p i ( s )
4:   C o m p u t e V D R o f p i ( s ) u s i n g E q .   ( 1 )
5:   C o m p u t e V T J ( C N F V ) u s i n g E q .   ( 7 )
6:   C o m p u t e H m R r u s i n g E q .   ( 10 )
7:   C o m p u t e A B E ( C N F V ) u s i n g E q .   ( 14 )
8:   C o m p u t e S I N R u s i n g E q .   ( 15 )
9:     C o m p u t e M e t r i c v a l u e o f e a c h C N F V u s i n g E q u a t i o n   ( 16 )
10:   I d e n t i f y s u i t a b l e f i r s t t w o ( p i ( s ) R V N ) b a s e d o n S A r e a a n d m u l t i m e t r i c
11:       I n p u t I D f o r t h e s e l e c t e d f i r s t t w o   ( R V N = P 2 , P 3 )
12:   E l s e
13:   D i s c a r d p i ( s ) I D
14:   I f p i M a x ( V D R & & V T J ( C N F V ) & & H m R r & & A B E C N F V & & S I N R )   T h e n
15:   F o r w a r d v i d e o p k t t p ( I f r a m e ) & v i d e o p k t i d t o P 2 & o t h e r p i
16:      F o r w a r d v i d e o p k t t p ( P f r a m e , B f r a m e ) t o P 3 & o t h e r p i
17:   W a i t f o r R a n d A m t T i m e
18:   R e t r a n s m i t v i d e o p k t t p ( I _ f r a m e ) v i a P 2 p a t h
19:   E n d i f
20:   E l s e
21:   I f P 2 , P 3 a l r e a d y r e c e i v e s v i d e o p k t t p T h e n
22:   C o m p u t e t h e M u l t i m e t r i c s
23:         S e l e c t q u a l i f i e d C N F V b a s e d o n l i n e   14 16
24:         F o r w a r d v i d e o p k t t p f r o m P 2 ,   P 3 t o t h e i r N F V s
25:   I n p u t I D o f q u a l i f i e d N F V s t o T N I o f P 2 ,   P 3
26:   E n d i f
27:   E l s e
28:   I f p i n o t o p t i m a l T h e n
29:   D i s c a r d   ( v i d e o p k t p i ( s ) )
30:   E n d i f
31:   E l s e
32: F o r w a r d ( v i d e o p k t ) t o q u a l i f i e d N F V
33:   I f N F V = = D V N T h e n
34:         F o r w a r d ( v i d e o p k t ) t o D V N w i t h o u t c o m p u t i n g m e t r i c s
35:   C h e c k f o r d u p l i c a t e I F r a m e w i t h t h e s a m e I D a n d D i s c a r d o n e
36:   E l s e
37:   F o r w a r d ( v i d e o p k t ) t o N F V
38:   E n d i f
39:   E n d i f
40:   E n d P r o c e d u r e

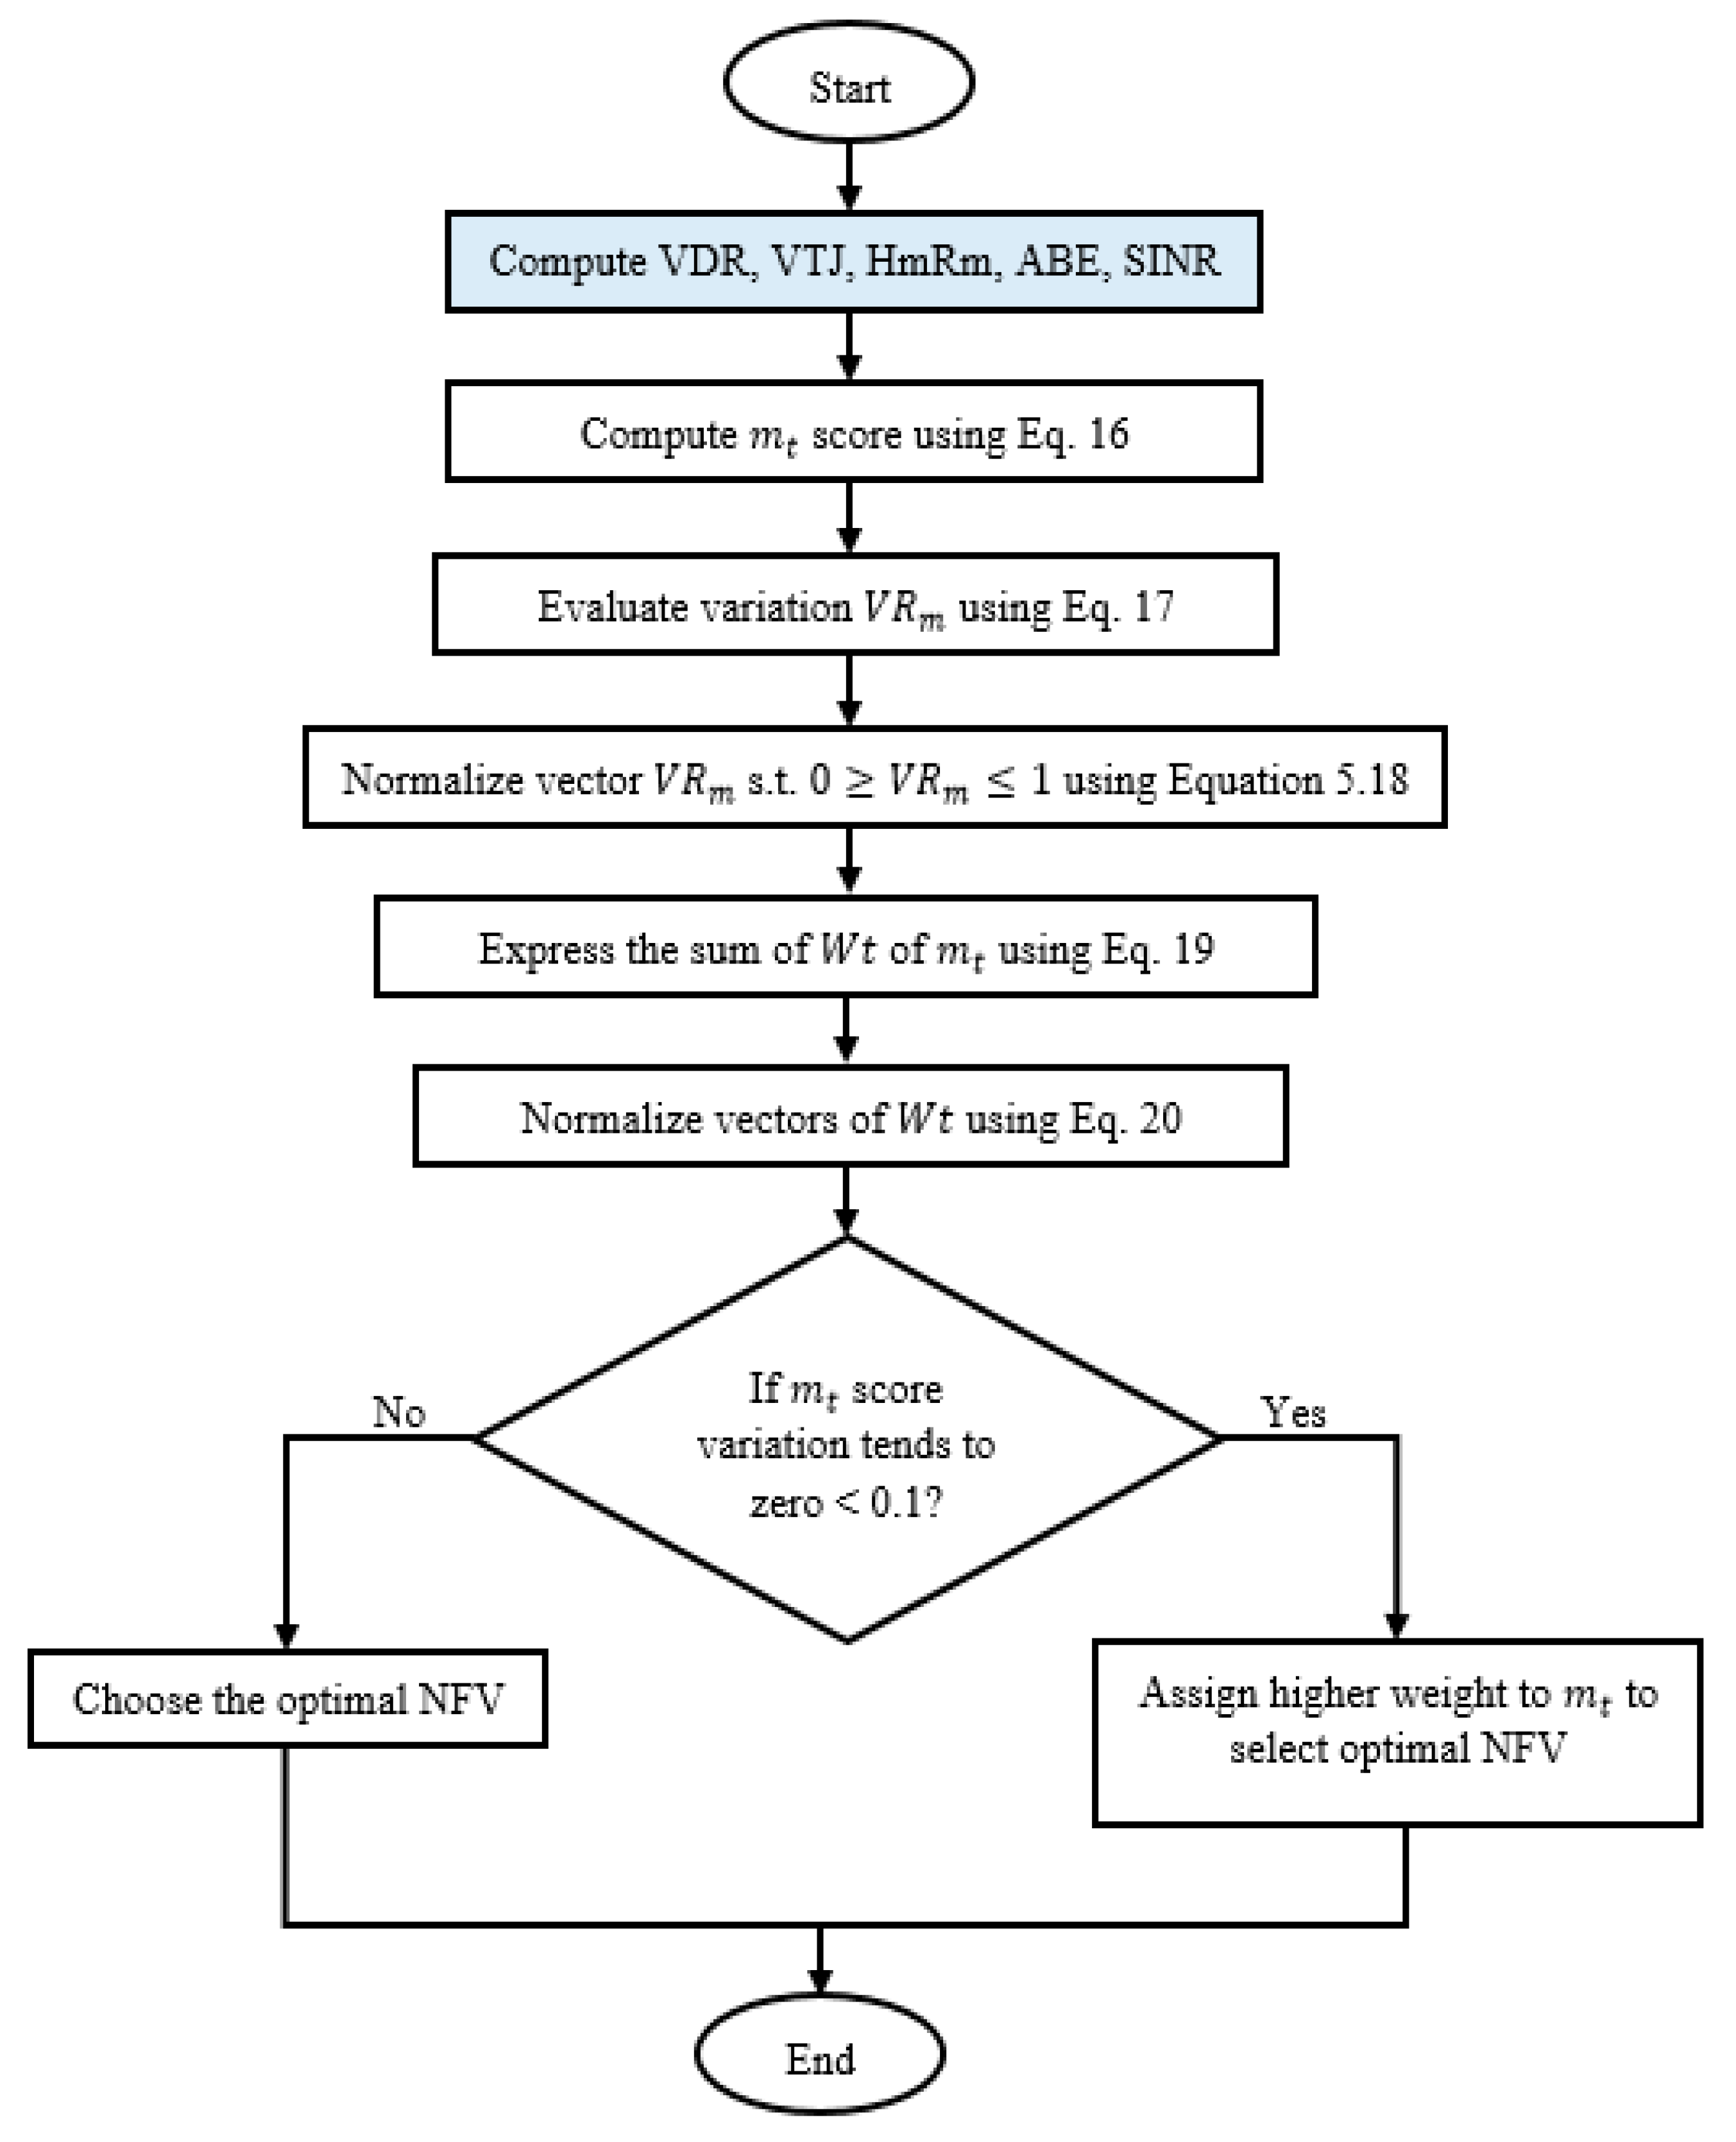
3.2.2. Multi-Metric Video Streaming with Dynamic Self-Weighting Score

In this subsection, the multi-metric score is further enhanced to be dynamically self-configured for obtaining a more realistic score in order to weight the multiple metrics. In most of the existing multi-metric forwarder schemes, equal or varied fixed weight value has always been assigned without considering the change in the network condition. Considering the nature of VANETs and most especially the urban scenario where there are several obstructions, there is a need to adapt the multi-metric forwarder scheme to be dynamic in operation.
The multi-metrics are made to be self-configured, that is, dynamic. The dynamic weighting score mechanism assigns weight to the different metrics based on the network situation. The dynamic weight score is better than the fixed variable or equal value weighting because a metric is usually important based on a certain situation in the VANETs environment. In selecting an optimal NFV, the PFV need to evaluate the optimality of the NFV. Moreover, several metrics are considered. In most of the previous work, the metrics are usually given equal or varied fixed value based on some assumption of perceived importance. However, this is not always true because some metrics become more important based on the current network situation. For example, considering VDR and SINR, the score for SINR might need to be given higher value compared to that of the vehicle density of the road when the vehicle is at the junction area, because of many obstructing objects. Both the SINR and vehicle trajectory are important metrics but in different situations. Therefore, a Road-based Multi-metric Forwarder evaluation for Multipath Video Streaming with Dynamic Self-Weighting (RMF-MVS + DSW) has been developed, which adapts to the network situation. The dynamic weight distribution categorizes vehicles in an enhanced pattern by assigning each metric a certain priority depending on the most recent network situations. In the DSW, higher weight score is assigned to the metric that has a lower value, which tends to zero, while metrics with a higher value closer to one are given lower weight. The whole idea is that the network conditions are collected and weights are provided in such a way that it adapts to the variable of the network condition. With this concept, the important metrics based on the network condition will not be assigned a smaller weight. This concept is carried out on all C-NFVs. Thus, it enhances the selection of optimal NFV. The overall weights of all metrics are not greater than one (1).
The PFV categorizes the C-NFV from the most suitable to the less suitable by employing the multi-metric score mechanism. The weights of the metrics can be assigned as Weights = wt 1 ,   wt 2 ,   .   .   . ,   wt n , the n represent the number of metrics, since the number of metrics utilized are five (5), n = 5 . These different metrics are calculated by the algorithm in order to have a dynamic update considering the current network situation of the C-NFV. The concept is to point out the metrics that can lead to better selection of the NFV among the C-NFVs.
The five metrics are represented as Metrics = mt 1 ,   mt 2 ,   mt 3 ,   mt 4 ,   mt 5 which are equal to VDR ,   VTJ ,   H m R r ,   ABE   and   SINR , respectively. Hence, the variation value of each metrics is represented as VR m between the time interval of t 0 and t 1 , such that t 1 > t 0 , derived as follows in Equation (17).
VR m =   { VR m 1 = ( mt 1 [ t 1 ] AV mt 1 [ t 1 ] ) ( mt 1 [ t 0 ] AV mt 1 [ t 0 ] ) 2 VR m 2 = ( mt 2 [ t 1 ] AV mt 2 [ t 1 ] ) ( mt 2 [ t 0 ] AV mt 2 [ t 0 ] ) 2     .     .     . VR m 5 = ( mt 5 [ t 1 ] AV mt 5 [ t 1 ] ) ( mt 5 [ t 0 ] AV mt 5 [ t 0 ] ) 2
where   0 mt n [ t 0 ] , mt n [ t 1 ] 1 and 0 AV mt n [ t 0 ] , AV mt n [ t 1 ] 1 , such that n ( 1 ,   5 ) . The mt n [ t 0 ] and mt n [ t 1 ] are the initial score of individual metrics mt n for period t 0 and t 1 , respectively. The AV mt n [ t 0 ] and AV mt n [ t 1 ] are the mean score value of metrics mt n computed for all the C-NFV. Thus, if VR m 0 , it depicts that the metrics mt n is becoming worst at the period ( t 1 t 0 ) , as a result of this, the variation value tends to zero VR m 0 . Consequently, a vector related to VR m is derived as VR m = ( VR m 1 ,   VR m 2 ,   ,   VR m 5 ) . Assuming that the maximum score of a vector VR m is VR m max ( x ) such that x ( 1   5 ) . The highest vector variation value is termed as the VR m max ( x ) . Then, it follows the normalization of the vectors VR m between 0 and 1 , that is,   0 VR m 1 ; the normalized vector is named N v , which is represented in Equation (18).
In order to make sure that the total sum of weights of the metrics is equal to the maximum value of one. Hence, a parameter τ value based on Equation (19) is formulated.
N v =   { N v 1 = V R m 1 V R m m a x ( x )     .     .     . N v ( x ) = V R m m a x ( x ) V R m m a x ( x ) = 1     .     .     . N v 5 = V R m 5 V R m m a x ( x ) .
τ = 1 n = 1 5 N v n
Further, vectors of weights Wt are normalized as follows in Equation (20):
Wt =   {     Wt 1 =   N v 1 × τ       .       .       . Wt x =   N v ( x ) × τ =   τ       .       .       .     Wt 5 =   N v 5 × τ .
Therefore, the weight scores ( Wt 1 , Wt 2 , Wt 3 , Wt 4 , Wt 5 ) of all the metrics are dynamically computed instead of assigning equal or varied fixed weight to the multiple metrics. In the case that, all metrics are becoming worst, which is a very rare situation, then all metrics are giving equal weight scores Wt n = 1 5 . However, this kind of situation is very difficult to occur. Thus, the dynamic self-weighting mechanism improves the optimality in the selection of NFV from the set of C-NFV. Thus, this leads to higher video packet delivery.
Algorithm 2 computes the multi-metric dynamic self-weighting score for optimal NFV selection. In line 1, the weighting score is initiated by computing the metrics and their corresponding scores, which is in lines 2 and 3, respectively. Line 4 evaluates the variation value, which is based on the difference between the average metric value of a C-NFV and the initial metric value at initial time and at a different period of time, that is, line 5. The V R m vector values are normalized to values between 0 and 1 and the sum of the weight values are equalized to a value of 1, which is in line 6. In line 7, the whole vector weight is normalized using Equation (20). Then, lines 8 and 9 test the variation of the metric value and then assign a higher weight value to the metric that tends to zero, otherwise the optimal NFV is selected based on the dynamic self-weighting of the metrics, which is in line 11. Lines 12 and 13 terminate the algorithm procedure. Figure 4 depicts the flow representation of the dynamic self-weighting score.
Algorithm 2. Dynamic Self-Weighting Score
   I n p u t : M u l t i m e t r i c v a l u e s
  Output: Dynamic self-weighting score for NFV selection
1:     P r o c e d u r e W e i g h t i n g s c o r e f o r N F V s
2:  C o m p u t e V D R ,   V T J ,   A B E , H m R r ,   S I N R
3:  C o m p u t e M u l t i m e r t r i c s c o r e u s i n g E q u a t i o n   16
4:  E v a l u a t e V R m V a r i a t i o n v a l u e o f m e t r i c s u s i n g E q u a t i o n   17
5:  N o r m a l i z e V e c t o r V R m ( 0 V R m 1 )   u s i n g E q u a t i o n   18
6: E x p r e s s t h e s u m o f w e i g h t s o f m e t r i c s = = 1   u s i n g E q u a t i o n   19
7:    N o r m a l i z e V e c t o r o f W t u s i n g E q u a t i o n   20
8:  I f m e t r i c s c o r e v a r i a t i o n i s h i g h ( V R m 0 )   t h e n
9: A s s i g n h i g h e r W t t o t h e m e t r i c f o r o p t i m a l N F V s e l e c t i o n
10:     E l s e
11:  S e l e c t o p t i m a l N F V b a s e d o n t h e W t s c o r e
12:     E n d i f
13:     E n d P r o c e d u r e
The whole concepts discussed in this section are implemented based on greedy-based geographic routing. The complete implementation process including simulation settings and performance evaluation of the proposed scheme are presented in Section 4.

4. Performance Evaluation

In this section, the simulation results achieved to assess the performance of the proposed schemes against the baseline schemes. The Performance evaluation is divided into two parts, namely, RMF-MVS and RMF-MVS+DSW. The results analyses of the proposed scheme are discussed in Section 4.1 and Section 4.2, respectively. The benchmarking schemes, which are the baseline work considered including Multimedia Multi-metric Map-aware Routing Protocol (3MRP) with Dynamic Self-Weighting (3MRP + DSW) by Mezher and Igartua [11] and Multipath Solution with Link and Node Disjoint for VANETs video streaming (MSLND) [9].
The proposed RMF-MVS with DSW is implemented using the prominent network simulator NS-2.34 Chen et al. [26], Simulator of Urban MObility (SUMO) Krajzewicz et al. [27] and Evalvid [28]. The NS-2 is a network simulator that enables the simulation of network communication. The SUMO employs the MObility model generator for VANETs (MOVE) [29]. It has the ability of creating a realistic model for mobility of vehicles in urban traffic scenario. The Evalvid has been employed for providing video frame and for video quality evaluation framework. The Manhattan city digital map with latitude: 39.191 to 39.184 and longitude of −96.574 to −96.563 is employed for the mobility and traffic environment setup (see Figure 5). The digital map structure and data are acquired from the OpenStreetMap contributors.
The summary of the simulation parameters are depicted in Table 1, which include the urban simulation area, simulation time, vehicle speed, number of vehicles, the MAC protocol, video resolution, video play duration, the transmission range, frequency bandwidth, propagation model, antenna model, traffic type, channel type, transmission protocol, hello packet timeout and scenarios. Some other MAC protocols such as 802.11b and 802.11a have been tested for vehicular communication. However, they are not efficient for speedy vehicles. The 802.11p has proved its efficiency in VANET and thus has been considered as the most suitable and efficient communication protocol for highly mobile vehicles.
The performance of RMF-MVS with DSW (RMF-MVS + DSW) has been evaluated considering two different cases including density of vehicle and video data rates. The evaluation is conducted in terms of different metrics, namely, Peak Signal to Noise Ratio (PSNR), Structural SIMilarity index (SSIM), Packet Loss Ratio (PLR) and End-to-End Delay (E2ED). Both PSNR and SSIM are well known metrics for evaluating Quality of Experience (QoE) in multimedia data transmission. The PSNR is the representation of ratio for the maximum value of a signal and the power of distortion that affects the video quality [17,30]. The SSIM index is employed to estimate the apparent similarity between the original video image and the forwarded video images [31,32]. The PLR is calculated based on the ratio of video packet drop to the actual amount of video packet transmitted from source vehicle to the destination vehicle [11,33], while the E2ED is the summation of time taken for video packet to be transmitted from source vehicle to destination vehicle [34,35].

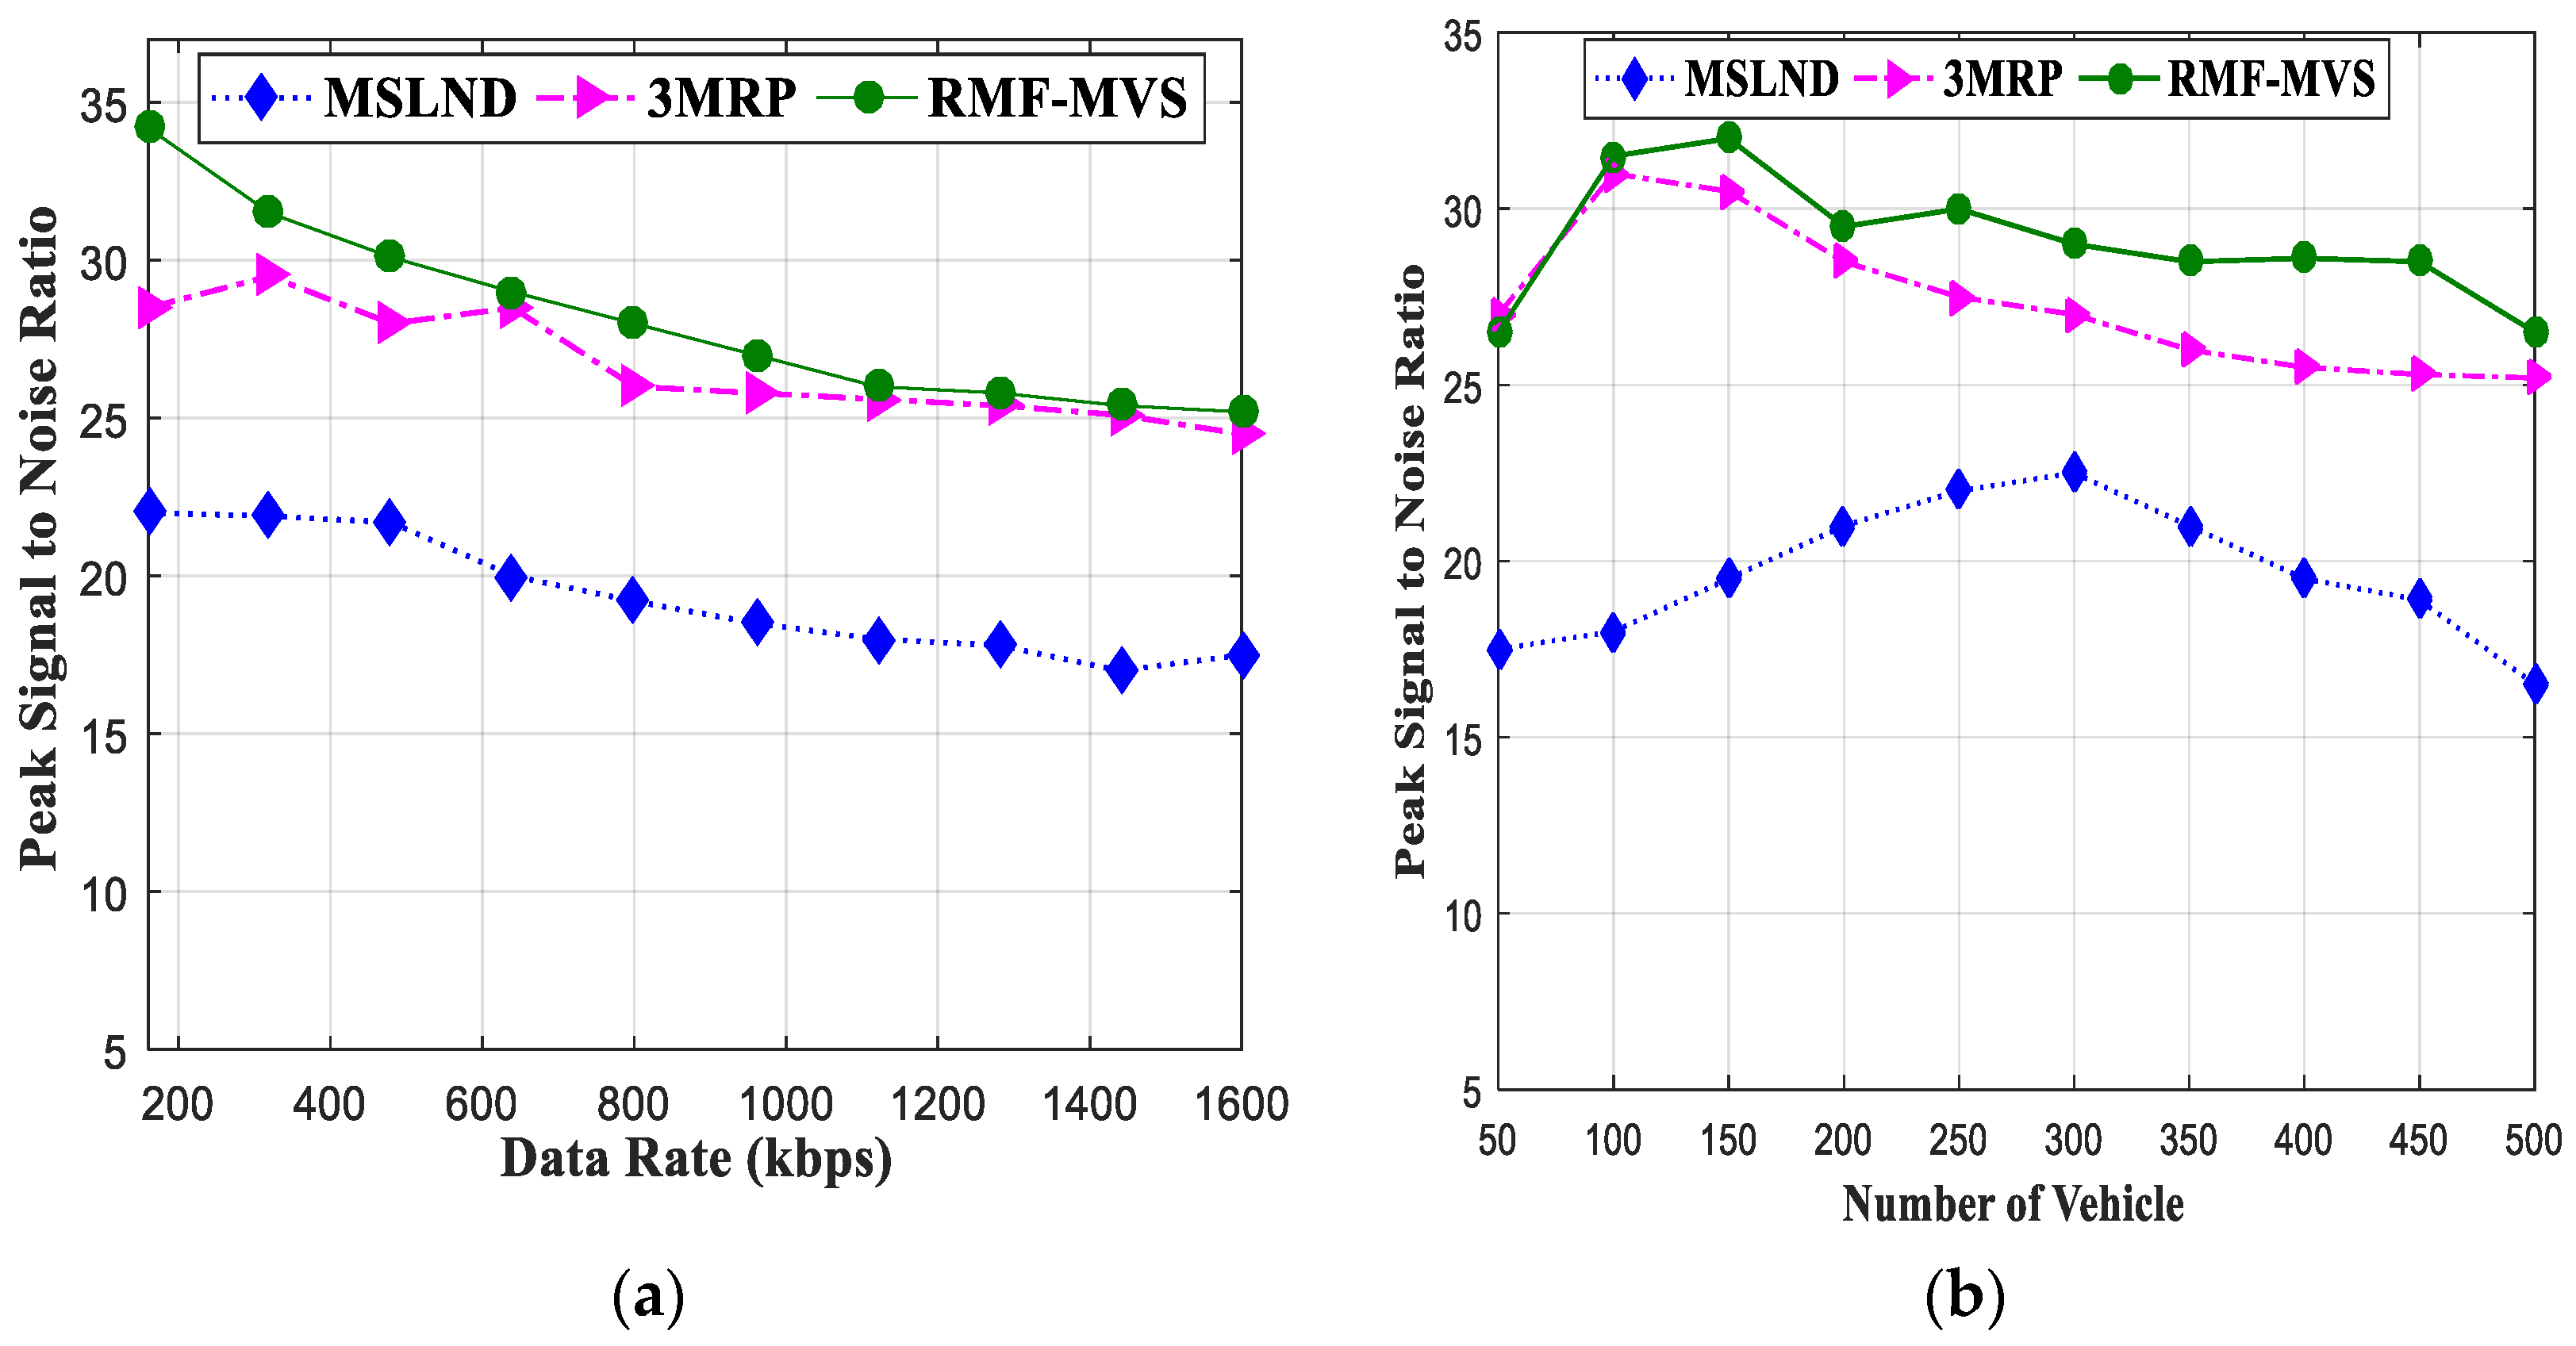
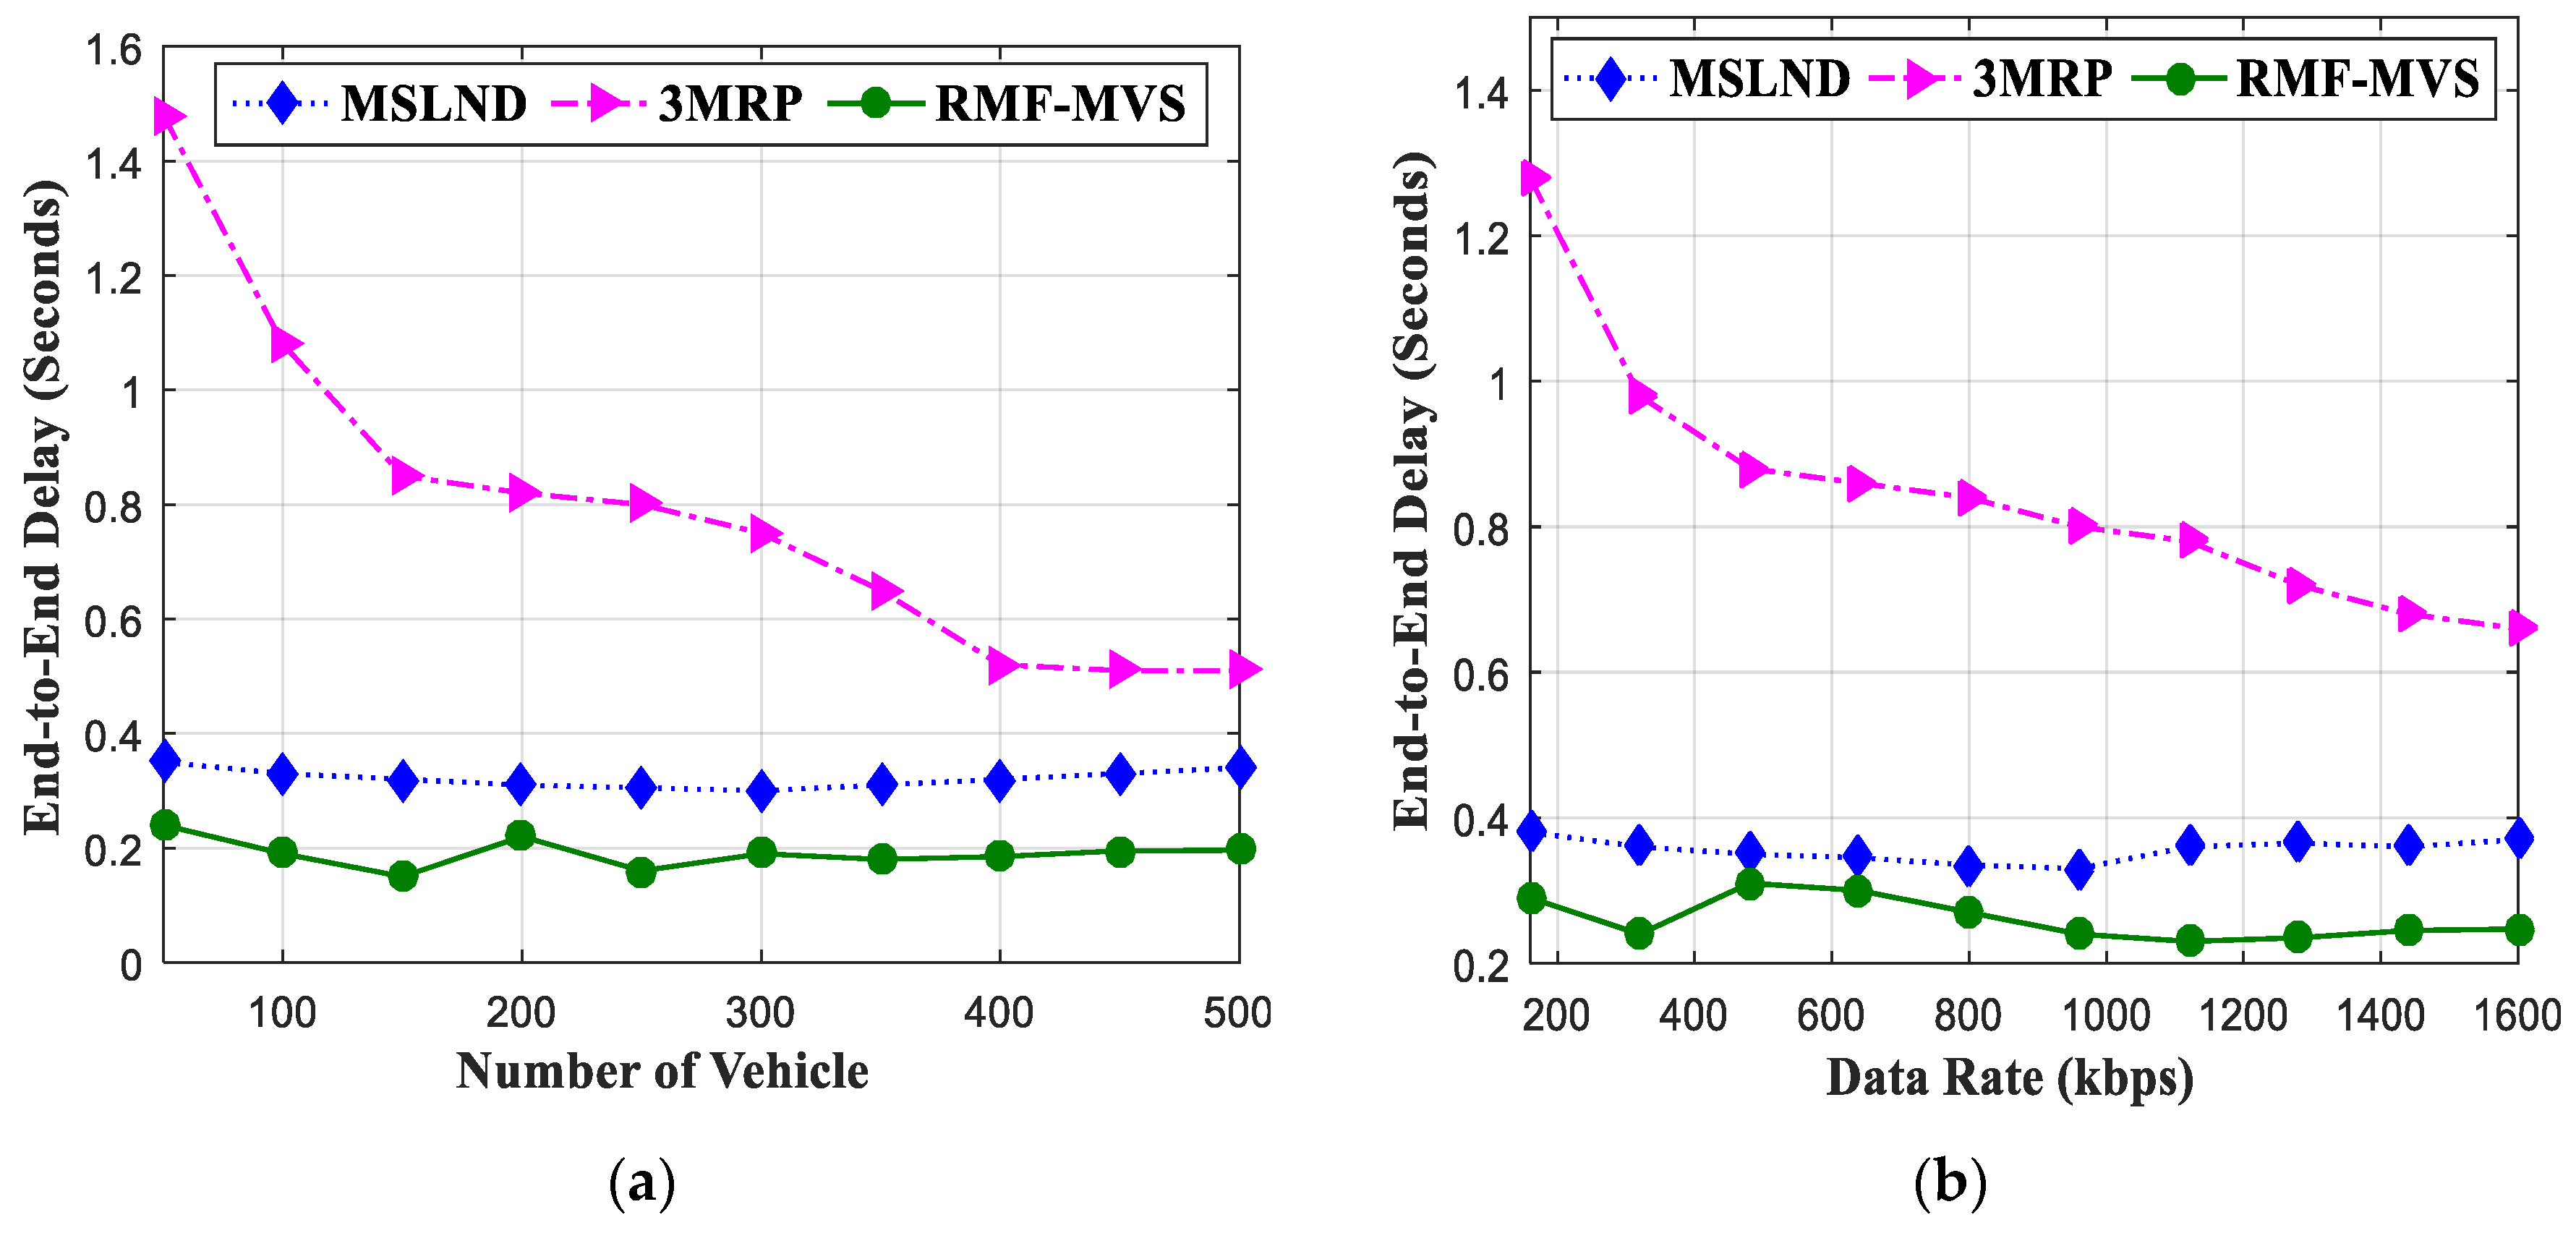
4.1. Result Analysis of RMF-MVS

The performance of RMF-MVS scheme is assessed in terms of PSNR, SSIM index, which are Quality of Experience (QoE) measure and E2ED, which is sometimes considered as Quality of Service (QoS) metric based on different densities of vehicles and different data rates of the video streaming. The proposed scheme is benchmarked against MSLND and 3MRP schemes. In Figure 6a, the PSNR of the video data based on different vehicle densities has been depicted. In the simulation, it is observed that the PSNR of the video increases as the number of vehicles increases, although with a small fluctuation in the increase and decrease. The PSNR of the video data starts to drop when the vehicle number is above 300. The PSNR relatively drops, but the video data still maintains reasonable value above the average value of the PSNR that is 20dB for the various densities considered. The increase in PSNR despite the high vehicle density might be connected to the road-based multiple metrics considered. Since, the metrics employed utilizes the vehicle advancement, road density and hello message receive rate of the NFV for video transmission. In addition, the high PSNR might be due to the presence of ample amount of vehicles that are available for video forwarding. Both the 3MRP and MSLND have lower video quality compared to the proposed RMF-MVS. Thus, RMF-MVS outperformed the two baseline schemes mentioned previously. The average percentage of video PSNR attained by 3MRP, MSLND and RMF-MVS are 68.4%, 44.1% and 72.7%, respectively. The following are the performance improvement on PSNR of the video data delivered by RMF-MVS with 50–500 vehicles against the two baseline schemes as 4.3% and 28.6%; that is, RMF-MVS outperforms 3MRP with 4.3% and MSLND with 28.6%.
In Figure 6b, the PSNR is studied alongside the various transmitted video data rate. The result depicts that the PSNR of the video is higher when the transmitted video size is small. However, a large amount of video transmitted also achieves relatively good PSNR. The video quality, which is indicated by the PSNR value decreases as the transmitted video size increases. The result shows that RMF-MVS outperforms the 3MRP and MSLND. The average percentage gains of the three schemes are 66.7%, 48.4% and 70.1% for 3MRP, MSLND and RMF-MVS, respectively. The percentage of performance improvement of RMF-MVS against 3MRP and MSLND are 3.4% and 21.7%, respectively.
Figure 7a depicts the structural similarity index of the video data in relation to different vehicle densities. Considering the results, the structural quality increases with fluctuation as the number of vehicles increases. The highest SSIM index was observed when the density of vehicles is 300. However, there is a little drop in SSIM index as the number of vehicles increases above 300. Despite the drop in SSIM index, the result is still significant because it is above the average value of the SSIM index value. The high SSIM index observed at the initial stage when the number of vehicles is 50–300 might be connected to the reason that the vehicle trajectory is considered when selecting the NFV by also considering the probability of vehicle stoppage. It can also be related to the hello message receive rate estimated before selecting an NFV for video transmission. The road vehicle density considered has influenced positively to the performance of the RMF-MVS scheme. The drop in video SSIM index might be due to the large congestion of vehicles interaction in order to transmit video data. Consequently, the result shows that RMF-MVS outperformed the 3MRP and MSLND in terms of the SSIM index. The percentage gains of the three schemes are 79.1%, 75.8% and 81.1% for 3MRP, MSLND and, RMF-MVS, respectively. The percentage of performance improvement of RMF-MVS against 3MRP and MSLND are 2.0% and 5.3%, respectively.
Figure 7b shows that SSIM index has been studied alongside the various transmitted video data rate. The result depicts that the SSIM index of the video increases as the transmitted data rate also increases until when the data rate reaches above 1000 kbps, then the SSIM index start to drop with a small variation. The video SSIM index has maintained above the average value of the SSIM index value. Therefore, the result shows that RMF-MVS outperformed the 3MRP and MSLND. The percentage gains of the three schemes are 79.6%, 75.01% and 82.5% for 3MRP, MSLND and RMF-MVS, respectively. The percentage of performance improvement of RMF-MVS against 3MRP and MSLND are 2.9% and 7.5%, respectively.
Figure 8a shows that both the MSLND and RMF-MVS have lower delay compared to the 3MRP. The E2ED has been plotted alongside various vehicle densities. The delay experienced in 3MRP might be related to the building obstruction detection tool incorporated into the video transmission scheme. While the MSLND also encountered some amount of delay, it is lower than that of 3MRP. The reason for delay encountered in MSLND is due to the TCP transmission protocols that are employed, which requires acknowledgement of video packet received. However, the RMF-MVS outperformed the 3MRP scheme because the RMF-MVS continues transmission via the selected RVN and NFV except if the vehicle is no more in the neighborhood of the PFV. The UDP employed does not requires acknowledgement, thus makes transmission faster. The percentage delay encountered is calculated based on the maximally allowable delay of 5 s. Thus, RMF-MVS, 3MRP and MSLND schemes have 3.8%, 15.9% and 6.4% as their performance, respectively. The percentage of performance improvement of RMF-MVS against 3MRP and MSLND are 12.1% and 2.6%, respectively.
Figure 8b depicts that RMF-MVS has the lowest delay compared to both the 3MRP and MSLND. The E2ED has been plotted alongside different data rates. The delay experienced in 3MRP might be connected to the high data rate transmitted, which causes queuing of video packets at the transmitting vehicle. In addition, the obstruction detection mechanism might also increase the transmission delay. The MSLND also has lower delay compared to that of 3MRP. However, the RMF-MVS outperforms the 3MRP scheme because the RMF-MVS estimates the advancement and road density of the C-NFV towards the DVN. The hello message receive rate of the C-NFV can also influence positively to the total delay encountered during transmission. The percentage delay encountered is estimated based on the maximally allowable delay of 5 s. Thus, RMF-MVS, 3MRP and MSLND schemes have 5.2%, 17.1% and 7.1%, respectively. The percentage of performance improvement of RMF-MVS against 3MRP and MSLND are 11.9% and 1.9%, respectively.

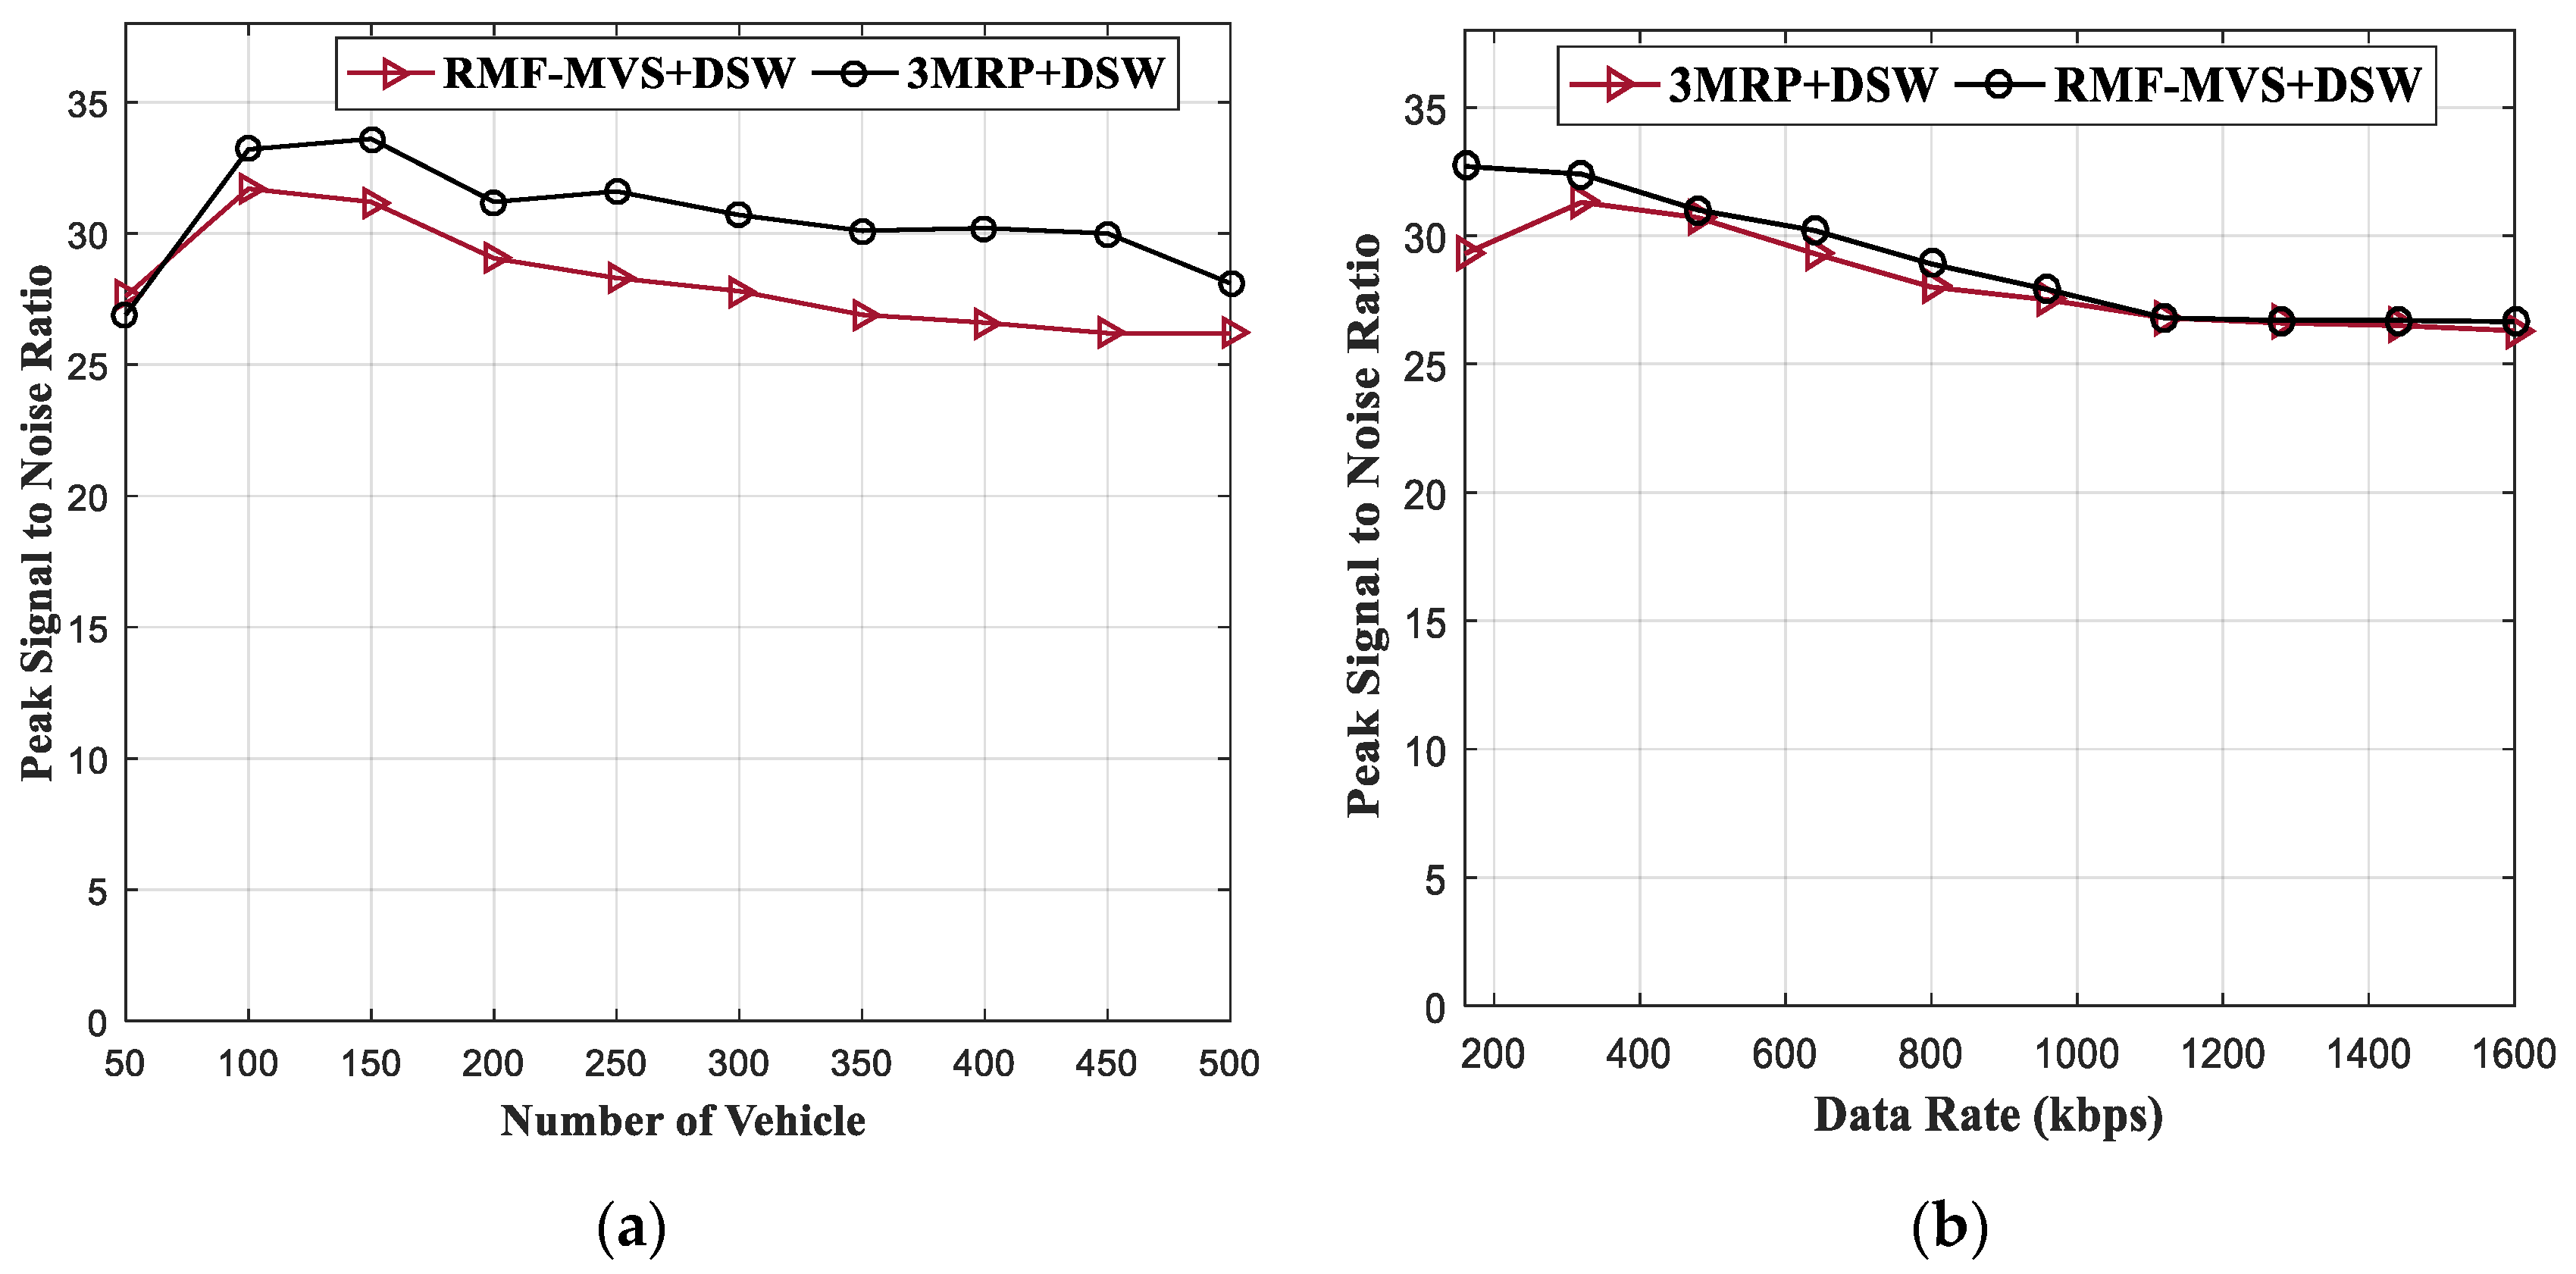
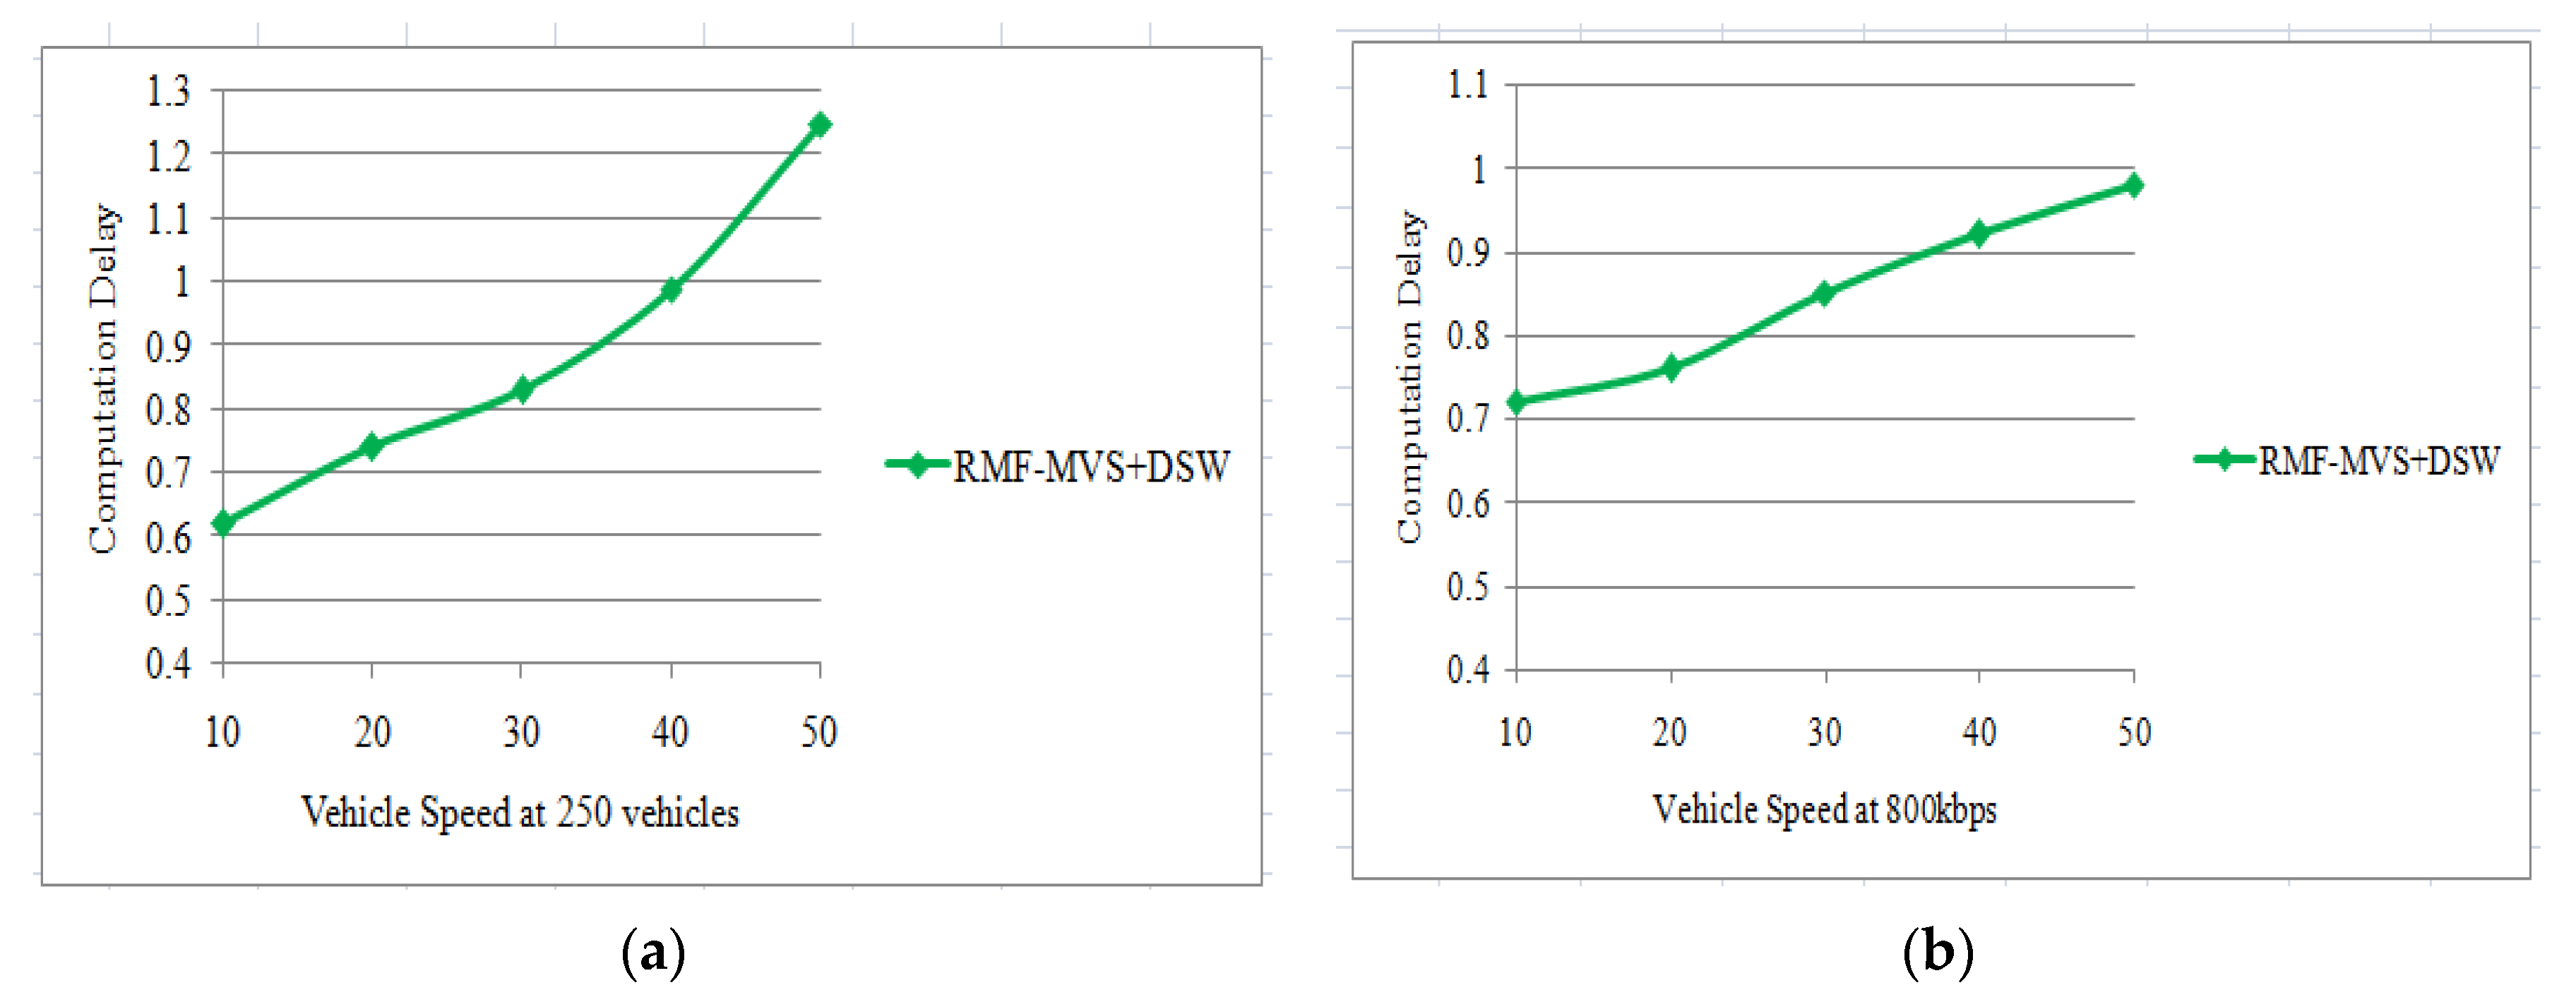
4.2. Result Analysis of RMF-MVS + DSW

The performance of RMF-MVS+DSW scheme is assessed in terms of PSNR, PLR and E2ED metrics based on different densities of vehicles and different data rates of the video streaming. The proposed scheme is benchmarked against 3MRP+DSW schemes. In Figure 9a, the PSNR of the video data based on different vehicle densities has been shown. In the simulation, it is observed that the PSNR of the video increases as the number of vehicles increases, as related in Figure 6a.
However, the performance of the video quality is higher for 3MRP + DSW and RMF-MVS + DSW compared to the non-dynamic 3MRP and RMF-MVS. This is due to dynamic weighting score because it estimates the real current value of a metric based on the network condition as at the time of video packet forwarding. Thus, better results are obtained. Meanwhile, the RMF-MVS + DSW outperformed the baseline 3MRP + DSW scheme in terms of the PSNR. Each of the 3MRP + DSW and RMF-MVS + DSW scheme achieved 70.4% and 76.4% performance, respectively. Therefore, the percentage performance improvement of the proposed scheme against the baseline scheme is 6.0%.
Figure 9b the PSNR of the video data based on varied data rates has been depicted. In the simulation, it is also observed that the PSNR of the video decreases as the volume of data increases, as correlated in Figure 6b. However, the performance of the video quality is higher for 3MRP + DSW and RMF-MVS + DSW compared to the non-dynamic 3MRP and RMF-MVS based on the different data rates. This is due to the dynamic weighting score as mentioned previously in the discussion of Figure 9a. Thus, better results were achieved. Meanwhile, the RMF-MVS + DSW outperformed the baseline 3MRP + DSW scheme in terms of the PSNR. The 3MRP + DSW and RMF-MVS + DSW scheme achieved 70.6% and 72.5% performance, respectively. Therefore, the percentage performance improvement of the proposed scheme against the baseline scheme is 1.9%.
Figure 10a shows results of the PLR metrics evaluation considering a different number of vehicles. Based on the simulation results, the PLR of the video data is relatively high but reduces as the number of vehicle increases. It is observed that the video packet loss is minimal as the number of the vehicle is greater than 300. However, the proposed RMF-MVS + DSW performed better than the existing 3MRP + DSW scheme. This is due to the fact that probability of vehicle stoppage has been considered for the vehicle trajectory estimation.
Likewise, the hello message receive rate and road vehicle density estimation with the higher value was given to the vehicle direction towards the destination. The 3MRP + DSW and RMF-DSW scheme attained 16.9% and 5.6% performance, respectively. Hence, the percentage performance improvement for the proposed scheme against the baseline scheme was 11.3%.
Figure 10b represents the results of the PLR metrics evaluation considering different data rates. Considering the results, the PLR of the video data is almost zero, which is very low, but increases as the data rate increases. It is observed that the video packet loss is high in the case of 3MRP + DSW from when the data rate is 800 kbps to 1600 kbps. However, the proposed RMF-MVS + DSW performed better than the existing 3MRP + DSW scheme. This is due to the consideration of the dynamic self-weight score for the multiple metrics employed. The 3MRP + DSW and RMF-MVS + DSW schemes 12.4% and 1.7% performance, respectively. Hence, the percentage performance improvement for the proposed scheme against the baseline scheme 10.7%.
Figure 11a depicts the results of 3MRP + DSW and RMF-MVS + DSW, which is based on different vehicle densities. In the multi-metrics with dynamic weight score, lower delay has been encountered compared to the normal 3MRP and RMF-MVS. From the results, the RMF-MVS + DSW outperforms the baseline scheme, that is, 3MRP + DSW. This is due to the multiple metrics considered for selection of optimal next forwarding vehicle. The multi-metric parameters are light-weight compared to the integration of REVsim for received signal strength evaluation of the candidate next forwarders. Thus, the delay of RMF-MVS + DSW is reduced compared to the 3MRP + DSW. The average percentage delay of 3MRP + DSW and RMF-MVS + DSW are 10.6% and 1.9%, respectively. Thus, the percentage performance improvement of the proposed scheme against the baseline scheme is 8.7%.
Figure 11b shows that RMF-MVS + DSW has a lower delay when compared to the 3MRP + DSW. The E2ED values were plotted alongside various data rates. The delay in the dynamic self-weighting score for the multi-metric is lower than the non-dynamic schemes, that is, 3MRP and RMF-MVS. Delay encountered in the 3MRP + DSW can be related to the high data rate transmitted, which causes queuing of video packets at the transmitting vehicle. Latency between the delivered data could affect the quality of the video at the decoding stage. However, the RMF-MVS + DSW outperform the 3MRP + DSW scheme. Thus, 3MRP + DSW and RMF-MVS + DSW schemes have 14.1% and 3.7% performance, respectively. The percentage performance improvement of RMF-MVS + DSW against 3MRP + DSW is 10.4%.
Figure 12a shows the computation delay of the proposed RMF-MVS + DSW considering different vehicle speed at a fixed number of vehicles. The number of vehicles is kept fixed at 250, while the vehicle speed is varied among10, 20, …, 50 km/h. It is observed that, the computation delay increases as the speed of the vehicles is increased. This is in connection with the intermittent disconnection among the highly mobile vehicle, thus leading to more time to computer multi-metric parameters. Similarly, Figure 12b depicts the computation delay of the RMF-MVS + DSW considering different vehicle speed with a fixed data rate at 800 kbps. The results demonstrate similar trend in terms of increase in computation delay as the speed of the vehicles are increased. This is also related to the connectivity problem in the process of multi-metric computation for next forwarding vehicle selection.

5. Conclusions and Future Work

In this paper, a Road-based Multi-metric Forwarder selection Evaluation in Multipath Video Streaming (RMF-MVS) scheme with DSW is proposed and simulated in order to assess its performance against the existing schemes including MSLND and 3MRP with and without DSW. The aim of the proposed scheme is to achieve optimal selection of the next forwarding vehicle for quality video streaming transmission in a multipath setting. The scheme employed most important road-based parameters including vehicle density on the road, vehicle trajectory, hello message received rate, accessible bandwidth availability and signal to interference plus noise ratio for evaluating next forwarding vehicle for video streaming. The simulation results demonstrate that the proposed scheme outperforms the state-of-the-art schemes. However, to further enhance the suggested scheme, future research study would be centered on multi-metric optimization based on quality parameters in order to attain quality video streaming in urban vehicular communication. Energy aware video offloading into edge of road things [36], vehicular trust based video transmission [37] and access control in video transmission under dense traffic environment [38] will be some of the quests in our future research direction in next hop based vehicular video transmission [39].

Author Contributions

Conceptualization, A.A.; Formal analysis, T.S.J.D.; Investigation, I.F.I.; Methodology, A.A., R.Z.R.M.R.; Resources, I.F.I.; Supervision, A.H.A., R.Z.R.M.R.; Validation, U.M.J., A.K.; Writing, A.A.; Review & Editing, T.S.J.D. All authors have read and agreed to the published version of the manuscript.

Funding

The research is supported by Ministry of Higher Education Malaysia (MOHE) and conducted in collaboration with Research Management Center (RMC) at University Teknologi Malaysia (UTM) under Fundamental Research Grant Scheme with grant number: R.J130000.7851.5F029. The authors appreciate greatly for the support.

Conflicts of Interest

The authors declare no conflict of interest.

References

  1. Kaiwartya, O.; Kumar, S. Enhanced caching for geocast routing in vehicular Ad Hoc network. In Intelligent Computing, Networking, and Informatics; Springer: NewDelhi, India, 2014; pp. 213–220. [Google Scholar]
  2. Aliyu, A.; Abdullah, A.H.; Kaiwartya, O.; Cao, Y.; Usman, M.J.; Kumar, S.; Lobiyal, D.; Raw, R.S. Cloud Computing in VANETs: Architecture, Taxonomy, and Challenges. IETE Tech. Rev. 2018, 35, 523–547. [Google Scholar] [CrossRef]
  3. Hassan, A.N.; Abdullah, A.H.; Kaiwartya, O.; Sheet, D.K.; Aliyu, A. Geographic forwarding techniques: Limitations and future challenges in IVC. In Proceedings of the Student Project Conference (ICT-ISPC), 2017 6th ICT International, Skudai, Malaysia, 23–24 May 2017; pp. 1–5. [Google Scholar]
  4. Bali, R.S.; Kumar, N.; Rodrigues, J.J. Clustering in vehicular ad hoc networks: Taxonomy, challenges and solutions. Veh. Commun. 2014, 1, 134–152. [Google Scholar] [CrossRef]
  5. Kaiwartya, O.; Kumar, S. Guaranteed geocast routing protocol for vehicular ad hoc networks in highway traffic environment. Wirel. Pers. Commun. 2015, 83, 2657–2682. [Google Scholar] [CrossRef]
  6. Aliyu, A.; Abdullah, A.H.; Kaiwartya, O.; Ullah, F.; Joda, U.M.; Hassan, A.N. Multi-Path video streaming in vehicular communication: Approaches and challenges. In Proceedings of the Student Project Conference (ICT-ISPC), 2017 6th ICT International, Skudai, Malaysia, 23–24 May 2017; pp. 1–4. [Google Scholar]
  7. Kaiwartya, O.; Kumar, S. Geocasting in vehicular ad hoc networks using particles warm optimization. In Proceedings of the International Conference on Information Systems and Design of Communication, Lisbon, Portugal, 16–17 May 2014; pp. 62–66. [Google Scholar]
  8. Aliyu, A.; Abdullah, A.; Kaiwartya, O.; Cao, Y.; Lloret, J.; Aslam, N.; Joda, U. Towards video streaming in IoT Environments: Vehicular communication perspective. Comput. Commun. 2018, 118, 93–119. [Google Scholar] [CrossRef] [Green Version]
  9. Xie, H.; Boukerche, A.; Loureiro, A.A. A multipath video streaming solution for vehicular networks with link disjoint and node-disjoint. IEEE Trans. Parallel Distrib. Syst. 2015, 26, 3223–3235. [Google Scholar] [CrossRef]
  10. Tripp-Barba, C.; Urquiza-Aguiar, L.; Igartua, M.A.; Rebollo-Monedero, D.; de la Cruz Llopis, L.J.; Mezher, A.M.; Aguilar-Calderón, J.A. A multimetric, map-aware routing protocol for VANETs in urban areas. Sensors 2014, 14, 2199–2224. [Google Scholar] [CrossRef] [PubMed] [Green Version]
  11. Mezher, A.M.; Igartua, M.A. Multimedia Multimetric Map-aware Routing protocol to send video-reporting messages over VANETs in smart cities. IEEE Trans. Veh. Technol. 2017, 66, 10611–10625. [Google Scholar] [CrossRef]
  12. Puangpronpitag, S.; Kasabai, P.; Suwannasa, A. Cross-layer optimization of Vehicle-to-Vehicle video streaming for overtaking maneuver assistance systems. In Proceedings of the Ubiquitous and Future Networks (ICUFN), 2013 Fifth International Conference, Da Nang, Vietnam, 2–5 July 2013; pp. 345–349. [Google Scholar]
  13. Quadros, C.; Cerqueira, E.; Santos, A.; Gerla, M. Amulti-flow-driven mechanism to support live video streaming on VANETs. In Proceedings of the Computer Networks and Distributed Systems (SBRC), Florianopolis, Brazil, 5–9 May 2014; pp. 468–476. [Google Scholar]
  14. Granelli, F.; Boato, G.; Kliazovich, D.; Vernazza, G. Enhanced gpsr routing in multi-hop vehicular communications through movement awareness. IEEE Commun. Lett. 2007, 11, 781–783. [Google Scholar] [CrossRef] [Green Version]
  15. Granelli, F.; Boato, G.; Kliazovich, D. MORA: A movement-based routing algorithm for vehicle ad hoc networks. In IEEE Workshop on Automotive Networking and Applications (AutoNet 2006); IEEE: San Francisco, CA, USA, 2006. [Google Scholar]
  16. Vinel, A.; Belyaev, E.; Lamotte, O.; Gabbouj, M.; Koucheryavy, Y.; Egiazarian, K. Video transmission over IEEE 802.11 p: Real-world measurements. In Proceedings of the Communications Workshops (ICC), 2013 IEEE International Conference, Budapest, Hungary, 9–13 June 2013; pp. 505–509. [Google Scholar]
  17. Bradai, A.; Ahmed, T. ReViV: Selective rebroadcast mechanism for video streaming over VANET. In Proceedings of the Vehicular Technology Conference (VTC Spring), 2014 79th IEEE, Seoul, Korea, 18–21 May 2014; pp. 1–6. [Google Scholar]
  18. Jiang, X.; Cao, X.; Du, D.H. Multihop transmission and retransmission measurement of real-time video streaming over DSRC devices. In Proceedings of the IEEE International Symposium on a World of Wireless, Mobile and Multimedia Networks 2014, Sydney, Australia, 19 June 2014; pp. 1–9. [Google Scholar]
  19. Xie, H.; Boukerche, A.; Loureiro, A.A. MERVS: A Novel Multichannel Error Recovery VideoS treaming Protocolfor Vehicle AdHoc Networks. IEEE Trans. Veh. Technol. 2016, 65, 923–935. [Google Scholar] [CrossRef]
  20. Kumar, N.; Zeadally, S.; Rodrigues, J.J. QoS-aware hierarchical web caching scheme for online video streaming applications in internet-based vehicular adhoc networks. IEEE Trans. Ind. Electron. 2015, 62, 7892–7900. [Google Scholar] [CrossRef]
  21. Asefi, M.; Mark, J.W.; Shen, X.S. Amobility-aware and quality-driven retransmission limit adaptation scheme for video streaming over VANETs. IEEE Trans. Wirel. Commun. 2012, 11, 1817–1827. [Google Scholar] [CrossRef]
  22. Darwish, T.S.; Bakar, K.A.; Haseeb, K. Reliable Intersection-Based Traffic Aware Routing Protocol for Urban Areas Vehicular Ad Hoc Networks. IEEE Intell. Transp. Syst. Mag. 2018, 10, 60–73. [Google Scholar] [CrossRef]
  23. Tripp-Barba, C.; AguilarIgartua, M.; UrquizaAguiar, L.; Mezher, A.M.; Zaldívar-Colado, A.; Guérin-Lassous, I. Available bandwidth estimation in GPSR for VANETs. In Proceedings of the Third ACM International Symposium on Design and Analysis of Intelligent Vehicular Networks and Applications, Barcelona, Spain, 3–8 November 2013; pp. 1–8. [Google Scholar]
  24. Sarr, C.; Chaudet, C.; Chelius, G.; Lassous, I.G. Bandwidth estimation for IEEE 802.11-based ad hoc networks. IEEE Trans. Mob. Comput. 2008, 7, 1228–1241. [Google Scholar] [CrossRef] [Green Version]
  25. Blaszczyszyn, B.; Mühlethaler, P.; Toor, Y. Maximizing throughput of Linear Vehicular Ad-hoc NETworks (VANETs)—Astochastic approach. In Proceedings of the Wireless Conference, EW 2009. European, Aalborg, Denmark, 17–20 May 2009; pp. 32–36. [Google Scholar]
  26. Chen, Q.; Schmidt-Eisenlohr, F.; Jiang, D.; Torrent-Moreno, M.; Delgrossi, L.; Hartenstein, H. Overhaul of IEEE 802.11 modeling and simulation in ns-2. In Proceedings of the 10th ACM Symposium on Modeling, Analysis, and Simulation of Wireless and Mobile Systems, Chania, Crete Island, Greece, 22–26 October 2007; pp. 159–168. [Google Scholar]
  27. Krajzewicz, D.; Hertkorn, G.; Rössel, C.; Wagner, P. Sumo (simulation of urban mobility). In Proceedings of the 4th Middle East Symposium on Simulation and Modelling, Naples, Italy, 27–29 October 2003; pp. 183–187. [Google Scholar]
  28. Klaue, J.; Rathke, B.; Wolisz, A. Evalvid–A framework for video transmission and quality evaluation. In Proceedings of the International Conference on Modelling Techniques and Tools for Computer Performance Evaluation, Urbana, IL, USA, 2–5 September 2003; pp. 255–272. [Google Scholar]
  29. Karnadi, F.K.; Mo, Z.H.; Lan, K.-C. Rapid generation of realistic mobility models for VANET. In Proceedings of the Wireless Communications and Networking Conference, WCNC 2007, Kowloon, China, 11–15 March 2007; pp. 2506–2511. [Google Scholar]
  30. Xie, F.; Hua, K.A.; Wang, W.; Ho, Y.H. Performance study of live video streaming over highway vehicular ad hoc networks. In Proceedings of the Vehicular Technology Conference, VTC-2007 Fall, 2007 66th IEEE, Baltimore, MD, USA, 30 September–3 October 2007; pp. 2121–2125. [Google Scholar]
  31. Piñol, P.; López, O.; Martínez, M.; Oliver, J.; Malumbres, M.P. Modeling video streaming over VANETs. In Proceedings of the 7th ACM Workshop on Performance Monitoring and Measurement of Heterogeneous Wireless and Wired Networks, Paphos, Cyprus, 21–22 October 2012; pp. 7–14. [Google Scholar]
  32. Immich, R.; Cerqueira, E.; Curado, M. Shielding video streaming against packet losses over VANETs. Wirel. Netw. 2016, 22, 2563–2577. [Google Scholar] [CrossRef]
  33. Razzaq, A.; Mehaoua, A. Video transport over VANETs: Multi-stream coding with multi-path and network coding. In Proceedings of the Local Computer Networks (LCN), 2010 35th IEEE Conference, Denver, CO, USA, 10–14 October 2010; pp. 32–39. [Google Scholar]
  34. Yang, Z.; Li, M.; Lou, W. Codeplay: Live multimer diastreaming in vanets using symbol-level network coding. In Proceedings of the Network Protocols (ICNP), 2010 18th IEEE International Conferenceon, Kyoto, Japan, 5–8 October 2010; pp. 223–232. [Google Scholar]
  35. Zaidi, S.; Bitam, S.; Mellouk, A. Hybrid error recovery protocol for video streaming in vehicle adhoc networks. Veh. Commun. 2018, 12, 110–126. [Google Scholar]
  36. Yadav, R.; Zhang, W.; Kaiwartya, O.; Singh, P.R.; Elgendy, I.A.; Tian, Y.C. Adaptive energy-aware algorithms for minimizing energy consumption and SLA violation in cloud computing. IEEE Access 2018, 6, 55923–55936. [Google Scholar] [CrossRef]
  37. Ahmed, M.N.; Abdullah, A.H.; Chizari, H.; Kaiwartya, O. F3TM: Flooding Factor based Trust Management Framework for secure data transmission in MANETs. J. King Saud Univ. Comput. Inf. Sci. 2017, 29, 269–280. [Google Scholar] [CrossRef] [Green Version]
  38. Ullah, F.; Abdullah, A.H.; Kaiwartya, O.; Cao, Y. TraPy-MAC: Traffic priority aware medium access control protocol for wireless body area network. J. Med. Syst. 2017, 41, 93. [Google Scholar] [CrossRef] [PubMed] [Green Version]
  39. Khasawneh, A.; Latiff, M.S.B.A.; Kaiwartya, O.; Chizari, H. Next forwarding nodes election in underwater wireless sensor networks (UWSNs): Techniques and challenges. Information 2017, 8, 3. [Google Scholar] [CrossRef] [Green Version]
Publisher’s Note: MDPI stays neutral with regard to jurisdictional claims in published maps and institutional affiliations.
Figure 1. Video Streaming Forwarding in Multipath Settings.
Electronics 09 01663 g001
Figure 2. Information Packet Format.
Electronics 09 01663 g002
Figure 3. Packet Forwarding-based Road-based Multi-metric Forwarder Evaluation scheme for Multipath Video Streaming (RMF-MVS) Flowchart.
Electronics 09 01663 g003
Figure 4. Dynamic Self-Weighting Score Flowchart.
Electronics 09 01663 g004
Figure 5. Simulation Scenario of Manhattan City Map.
Electronics 09 01663 g005
Figure 6. Signal to Noise Ratio (PSNR) Results Based on Different (a) Number of Vehicles and (b) Data Rates.
Electronics 09 01663 g006
Figure 7. Structural SIMilarity (SSIM) index Results Based on Different Number of (a) Vehicles and (b) Data Rates.
Electronics 09 01663 g007
Figure 8. Delay (E2ED) Results Based on Different Number of (a) Vehicles and (b) Data Rates.
Electronics 09 01663 g008
Figure 9. Based on Varied Number of (a) Vehicles and (b) Data Rates Considering Dynamic Weighting Score.
Electronics 09 01663 g009
Figure 10. Packet Loss Ratio (PLR) based on Varied Number of (a) Vehicles and (b) Data Rates Considering Dynamic Weighting Score.
Electronics 09 01663 g010
Figure 11. E2ED based on Varied Number of (a) Vehicles and (b) Data Rates Considering Dynamic Weighting Score.
Electronics 09 01663 g011
Figure 12. Computation Delay against Varied Number of (a) Mobility (Speed) at Fixed Number of Vehicles (250) and (b) Data Rates (800 kbps).
Electronics 09 01663 g012
Table 1. Simulation Parameter.
ParametersValues
Urban simulation area1000 × 1000 m2
Simulation time600 s
Vehicle speed2.78 to 13.89 m/s (10 to 50 km/h)
Number of vehicles50 to 500
MAC protocolIEEE 802.11p
Video resolution352 × 288
Video play duration139 s
Transmission range250 m
Frequency Bandwidth5.9 GHz
Propagation modelShadowing
Antenna modelOmni-directional
Traffic typeConstant Bit Rate
Channel typeWireless
Transmission ProtocolUDP
Hello packet timeout1 s
Scenarios High-density urban scenario
Comparison protocolMSLND, 3MRP and 3MRP + DSW
Metrics PSNR, SSIM index, PLR and E2ED

