
Machine Learning Consensus Clustering of Hospitalized Patients with Admission Hyponatremia

 , , , , , , , ,
Abstract
:1. Introduction
2. Materials and Methods
2.1. Patient Population
2.2. Data Collection
2.3. Clustering Analysis
2.4. Statistical Analysis
3. Results
4. Discussion
5. Conclusions
Supplementary Materials
Author Contributions
Funding
Institutional Review Board Statement
Informed Consent Statement
Data Availability Statement
Conflicts of Interest
References
- Hannon, M.J.; Verbalis, J.G. Sodium homeostasis and bone. Curr. Opin. Nephrol. Hypertens. 2014, 23, 370–376. [Google Scholar] [CrossRef]
- Thongprayoon, C.; Cheungpasitporn, W.; Yap, J.Q.; Qian, Q. Increased mortality risk associated with serum sodium variations and borderline hypo- and hypernatremia in hospitalized adults. Nephrol. Dial. Transplant. 2020, 35, 1746–1752. [Google Scholar] [CrossRef] [PubMed] [Green Version]
- Chewcharat, A.; Thongprayoon, C.; Cheungpasitporn, W.; Mao, M.A.; Thirunavukkarasu, S.; Kashani, K.B. Trajectories of Serum Sodium on In-Hospital and 1-Year Survival among Hospitalized Patients. Clin. J. Am. Soc. Nephrol. 2020, 15, 600–607. [Google Scholar] [CrossRef] [PubMed]
- Thongprayoon, C.; Cheungpasitporn, W.; Petnak, T.; Ghamrawi, R.; Thirunavukkarasu, S.; Chewcharat, A.; Bathini, T.; Vallabhajosyula, S.; Kashani, K.B. The prognostic importance of serum sodium levels at hospital discharge and one-year mortality among hospitalized patients. Int. J. Clin. Pract. 2020, 74, e13581. [Google Scholar] [CrossRef] [PubMed]
- Riggs, J.E. Neurologic manifestations of fluid and electrolyte disturbances. Neurol. Clin. 1989, 7, 509–523. [Google Scholar] [CrossRef]
- Renneboog, B.; Musch, W.; Vandemergel, X.; Manto, M.U.; Decaux, G. Mild chronic hyponatremia is associated with falls, unsteadiness, and attention deficits. Am. J. Med. 2006, 119, 71.e1–71.e8. [Google Scholar] [CrossRef] [PubMed]
- Ayus, J.C.; Achinger, S.G.; Arieff, A. Brain cell volume regulation in hyponatremia: Role of sex, age, vasopressin, and hypoxia. Am. J. Physiol. Renal Physiol. 2008, 295, F619–F624. [Google Scholar] [CrossRef] [PubMed]
- Hoorn, E.J.; Zietse, R. Hyponatremia and mortality: Moving beyond associations. Am. J. Kidney Dis. 2013, 62, 139–149. [Google Scholar] [CrossRef]
- Braun, M.M.; Barstow, C.H.; Pyzocha, N.J. Diagnosis and management of sodium disorders: Hyponatremia and hypernatremia. Am. Fam. Physician 2015, 91, 299–307. [Google Scholar] [PubMed]
- Goh, K.P. Management of hyponatremia. Am. Fam. Physician 2004, 69, 2387–2394. [Google Scholar] [PubMed]
- Rodriguez, M.; Hernandez, M.; Cheungpasitporn, W.; Kashani, K.B.; Riaz, I.; Rangaswami, J.; Herzog, E.; Guglin, M.; Krittanawong, C. Hyponatremia in Heart Failure: Pathogenesis and Management. Curr. Cardiol. Rev. 2019, 15, 252–261. [Google Scholar] [CrossRef] [PubMed]
- MacEachern, S.J.; Forkert, N.D. Machine learning for precision medicine. Genome 2021, 64, 416–425. [Google Scholar] [CrossRef] [PubMed]
- Thongprayoon, C.; Kaewput, W.; Kovvuru, K.; Hansrivijit, P.; Kanduri, S.R.; Bathini, T.; Chewcharat, A.; Leeaphorn, N.; Gonzalez-Suarez, M.L.; Cheungpasitporn, W. Promises of Big Data and Artificial Intelligence in Nephrology and Transplantation. J. Clin. Med. 2020, 9, 1107. [Google Scholar] [CrossRef] [Green Version]
- Cheungpasitporn, W.; Kashani, K. Electronic Data Systems and Acute Kidney Injury. Contrib. Nephrol. 2016, 187, 73–83. [Google Scholar] [CrossRef] [PubMed]
- Xue, Y.; Shen, J.; Hong, W.; Zhou, W.; Xiang, Z.; Zhu, Y.; Huang, C.; Luo, S. Risk stratification of ST-segment elevation myocardial infarction (STEMI) patients using machine learning based on lipid profiles. Lipids Health Dis. 2021, 20, 48. [Google Scholar] [CrossRef]
- Thongprayoon, C.; Kattah, A.G.; Mao, M.A.; Keddis, M.T.; Pattharanitima, P.; Vallabhajosyula, S.; Nissaisorakarn, V.; Erickson, S.B.; Dillon, J.J.; Garovic, V.D.; et al. Distinct Phenotypes of Hospitalized Patients with Hyperkalemia by Machine Learning Consensus Clustering and Associated Mortality Risks. QJM 2021, hcab194. [Google Scholar] [CrossRef]
- Zheng, Z.; Waikar, S.S.; Schmidt, I.M.; Landis, J.R.; Hsu, C.Y.; Shafi, T.; Feldman, H.I.; Anderson, A.H.; Wilson, F.P.; Chen, J.; et al. Subtyping CKD Patients by Consensus Clustering: The Chronic Renal Insufficiency Cohort (CRIC) Study. J. Am. Soc. Nephrol. 2021, 32, 639–653. [Google Scholar] [CrossRef] [PubMed]
- Yang, C.; Huang, S.; Cao, F.; Zheng, Y. Role of ferroptosis-related genes in prognostic prediction and tumor immune microenvironment in colorectal carcinoma. PeerJ 2021, 9, e11745. [Google Scholar] [CrossRef] [PubMed]
- Monti, S.; Tamayo, P.; Mesirov, J.; Golub, T. Consensus clustering: A resampling-based method for class discovery and visualization of gene expression microarray data. Mach. Learn. 2003, 52, 91–118. [Google Scholar] [CrossRef]
- Wilkerson, M.D.; Hayes, D.N. ConsensusClusterPlus: A class discovery tool with confidence assessments and item tracking. Bioinformatics 2010, 26, 1572–1573. [Google Scholar] [CrossRef] [Green Version]
- Rhee, C.M.; Ayus, J.C.; Kalantar-Zadeh, K. Hyponatremia in the Dialysis Population. Kidney Int. Rep. 2019, 4, 769–780. [Google Scholar] [CrossRef] [PubMed] [Green Version]
- Ravel, V.A.; Streja, E.; Mehrotra, R.; Sim, J.J.; Harley, K.; Ayus, J.C.; Amin, A.N.; Brunelli, S.M.; Kovesdy, C.P.; Kalantar-Zadeh, K.; et al. Serum sodium and mortality in a national peritoneal dialysis cohort. Nephrol. Dial. Transplant. 2017, 32, 1224–1233. [Google Scholar] [CrossRef] [PubMed] [Green Version]
- Sun, L.; Hou, Y.; Xiao, Q.; Du, Y. Association of serum sodium and risk of all-cause mortality in patients with chronic kidney disease: A meta-analysis and sysematic review. Sci. Rep. 2017, 7, 15949. [Google Scholar] [CrossRef] [Green Version]
- Waikar, S.S.; Mount, D.B.; Curhan, G.C. Mortality after hospitalization with mild, moderate, and severe hyponatremia. Am. J. Med. 2009, 122, 857–865. [Google Scholar] [CrossRef] [PubMed] [Green Version]


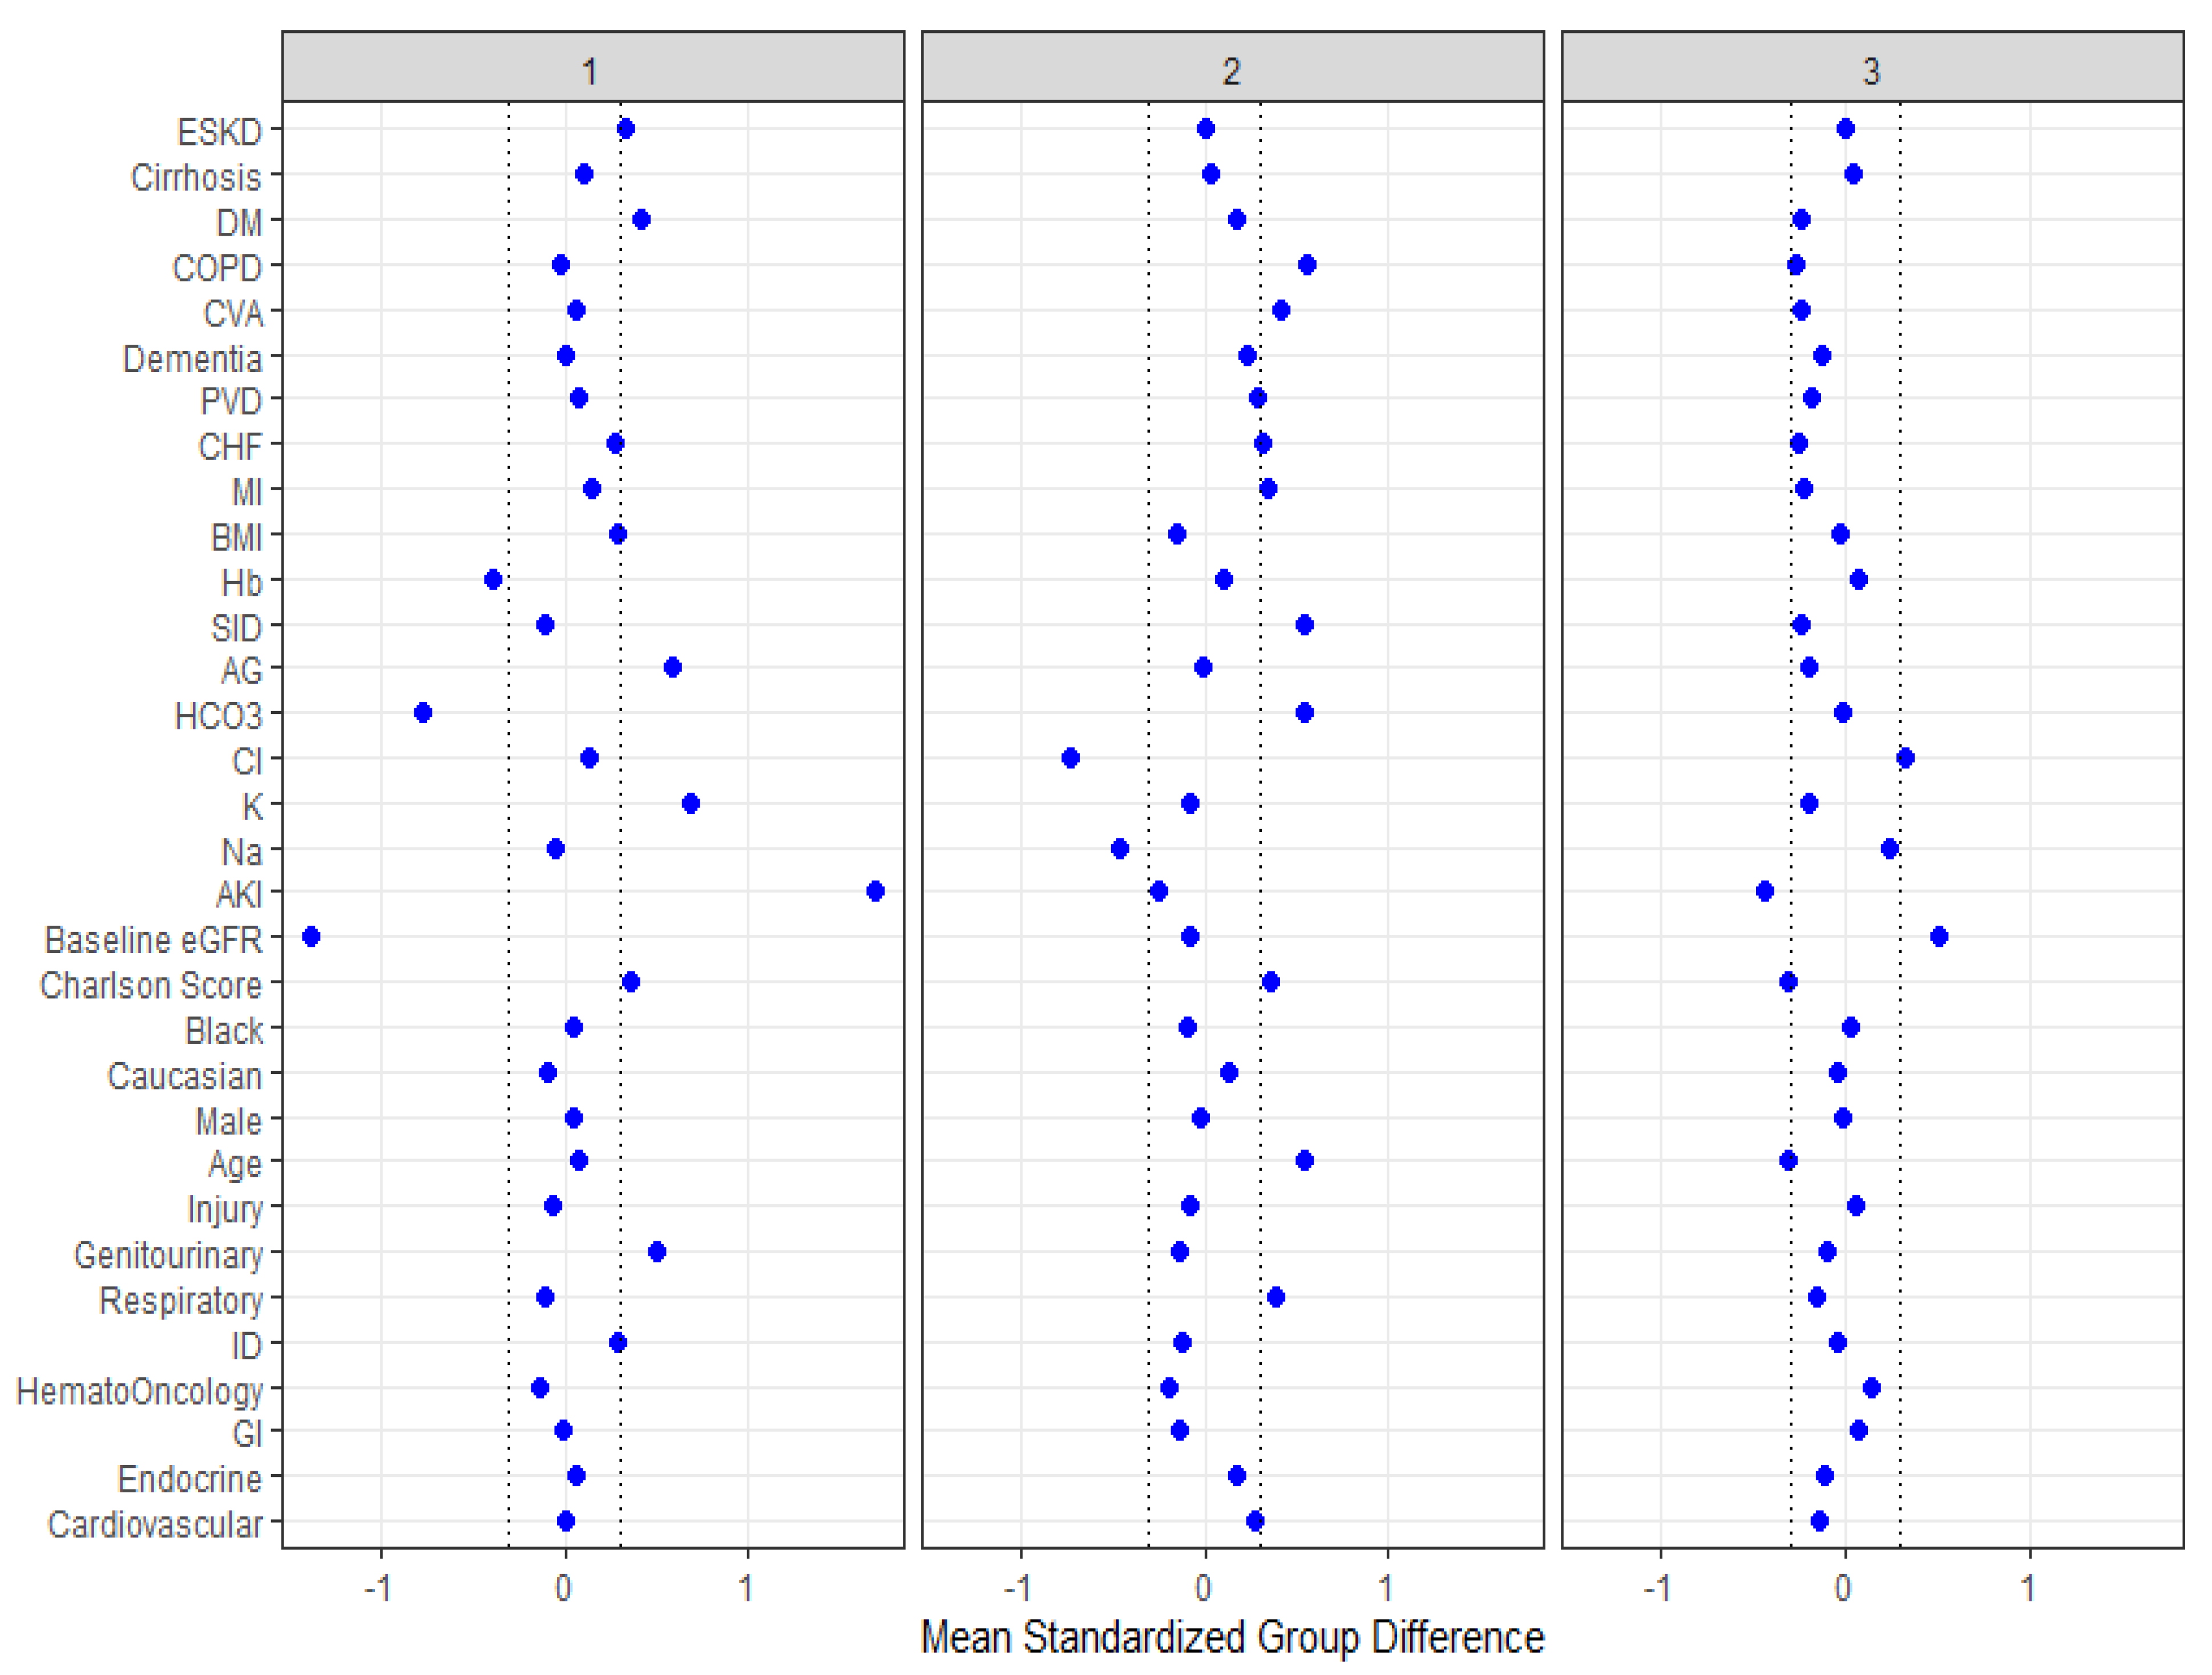
| Patient Characteristics | Overall | Cluster 1 | Cluster 2 | Cluster 3 | p-Value |
|---|---|---|---|---|---|
| (n = 11,099) | (n = 2033) | (n = 3064) | (n = 6002) | ||
| Age (years) | 65.0 ± 16.8 | 66.3 ± 15.3 | 74.2 ± 12.9 | 59.8 ± 17.0 | <0.001 |
| Male sex | 5678 (51) | 1095 (54) | 1538 (50) | 3045 (51) | 0.02 |
| Race | <0.001 | ||||
| White | 10268 (93) | 1829 (90) | 2943 (96) | 5496 (92) | |
| Black | 184 (2) | 47 (2) | 15 (0.1) | 122 (2) | |
| Others | 647 (6) | 157 (8) | 106 (3) | 384 (6) | |
| BMI (kg/m2) | 28.5 ± 7.5 | 30.7 ± 8.7 | 27.4 ± 6.7 | 28.3 ± 7.2 | <0.001 |
| Principal diagnosis | <0.001 | ||||
| Cardiovascular | 1747 (16) | 325 (16) | 791 (26) | 631 (11) | |
| Endocrine/metabolic | 628 (6) | 142 (7) | 300 (10) | 186 (3) | |
| Gastrointestinal | 1382 (12) | 247 (12) | 237 (8) | 898 (15) | |
| Genitourinary | 556 (5) | 326 (16) | 62 (2) | 168 (3) | |
| Hematology/oncology | 1496 (13) | 182 (9) | 211 (7) | 1103 (18) | |
| Infectious disease | 842 (8) | 313 (15) | 130 (4) | 399 (7) | |
| Respiratory | 817 (7) | 95 (5) | 529 (17) | 193 (3) | |
| Injury/poisoning | 1445 (13) | 224 (11) | 318 (10) | 903 (15) | |
| Other | 2186 (20) | 179 (9) | 486 (16) | 1521 (25) | |
| Charlson Comorbidity Score | 2.4 ± 2.7 | 3.3 ± 2.9 | 3.3 ± 2.8 | 1.6 ± 2.2 | <0.001 |
| Comorbidities | |||||
| Coronary artery disease | 959 (9) | 257 (13) | 560 (18) | 142 (2) | <0.001 |
| Congestive heart failure | 957 (9) | 335 (16) | 534 (17) | 88 (1) | <0.001 |
| Peripheral vascular disease | 454 (4) | 116 (6) | 300 (10) | 38 (0.6) | <0.001 |
| Dementia | 198 (2) | 38 (2) | 150 (5) | 10 (0.2) | <0.001 |
| Stroke | 971 (9) | 213 (10) | 626 (20) | 132 (2) | <0.001 |
| COPD | 1344 (12) | 229 (11) | 921 (30) | 194 (3) | <0.001 |
| Diabetes mellitus | 2896 (26) | 907 (45) | 1036 (34) | 953 (16) | <0.001 |
| Cirrhosis | 572 (5) | 222 (11) | 113 (4) | 237 (4) | <0.001 |
| End-stage kidney disease | 685 (6) | 660 (32) | 18 (1) | 7 (0.1) | <0.001 |
| Laboratory test | |||||
| eGFR (mL/min/1.73 m2) | 73 ± 31 | 30 ± 18 | 71 ± 23 | 89 ± 23 | <0.001 |
| Sodium (mEq/L) | 131 ± 4 | 131 ± 3 | 129 ± 5 | 132 ± 3 | <0.001 |
| Potassium (mEq/L) | 4.3 ± 0.7 | 4.8 ± 0.9 | 4.3 ± 0.7 | 4.2 ± 0.6 | <0.001 |
| Chloride (mEq/L) | 97 ± 5 | 98 ± 5 | 93 ± 6 | 99 ± 4 | <0.001 |
| Bicarbonate (mEq/L) | 25 ± 4 | 21 ± 5 | 27 ± 4 | 24 ± 3 | <0.001 |
| Anion gap | 9 ± 4 | 12 ± 5 | 9 ± 3 | 9 ± 3 | <0.001 |
| Strong ion difference | 38.3 ± 4.0 | 37.9 ± 4.6 | 40.4 ± 3.9 | 37.3 ± 3.3 | <0.001 |
| Hemoglobin (g/dL) | 11.9 ± 2.2 | 11.0 ± 2.3 | 12.1 ± 2.0 | 12.1 ± 2.2 | <0.001 |
| Acute kidney injury | 2254 (20) | 1793 (88) | 308 (10) | 153 (3) | <0.001 |
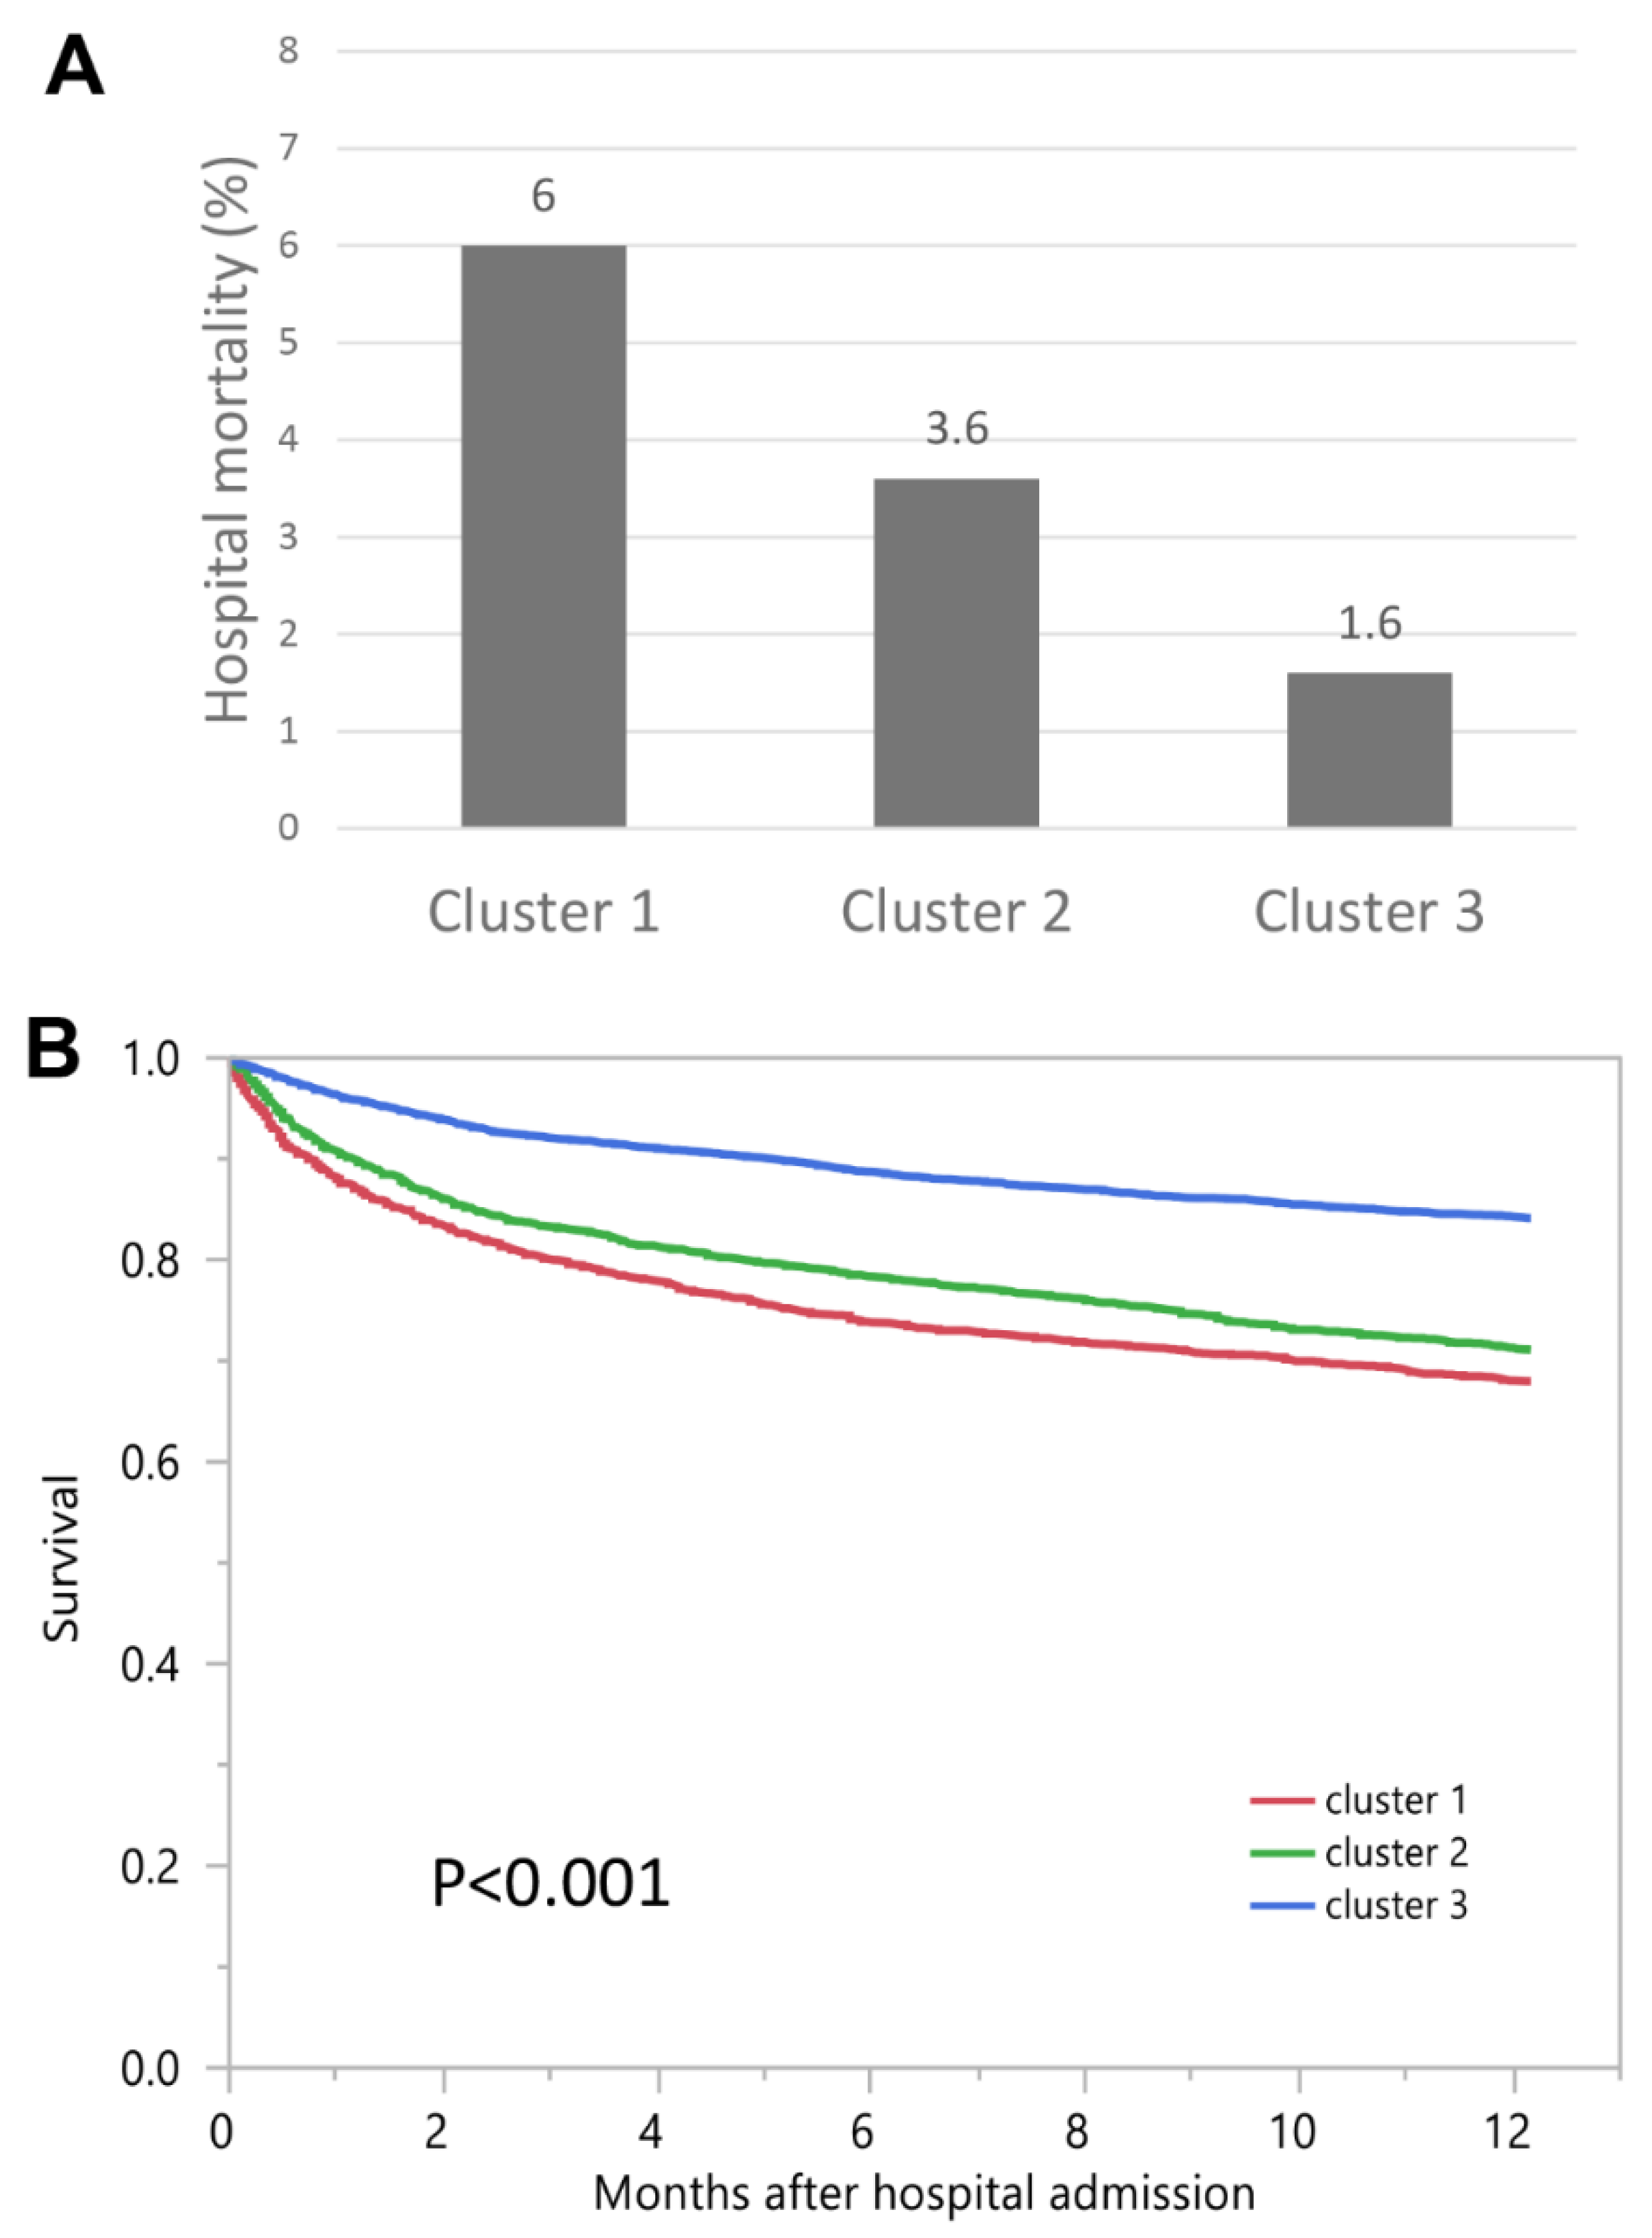
| Hospital-Mortality | OR (95% CI) | 1-Year Mortality | HR (95% CI) | |
|---|---|---|---|---|
| Cluster 1 | 6.0% | 3.89 (2.96–5.11) | 32.0% | 2.35 (2.11–2.62) |
| Cluster 2 | 3.6% | 2.31 (1.75–3.05) | 28.9% | 2.01 (1.82–2.23) |
| Cluster 3 | 1.6% | 1 (ref) | 15.9% | 1 (ref) |
Publisher’s Note: MDPI stays neutral with regard to jurisdictional claims in published maps and institutional affiliations. |
© 2021 by the authors. Licensee MDPI, Basel, Switzerland. This article is an open access article distributed under the terms and conditions of the Creative Commons Attribution (CC BY) license (https://creativecommons.org/licenses/by/4.0/).
Share and Cite
Thongprayoon, C.; Hansrivijit, P.; Mao, M.A.; Vaitla, P.K.; Kattah, A.G.; Pattharanitima, P.; Vallabhajosyula, S.; Nissaisorakarn, V.; Petnak, T.; Keddis, M.T.; et al. Machine Learning Consensus Clustering of Hospitalized Patients with Admission Hyponatremia. Diseases 2021, 9, 54. https://0-doi-org.brum.beds.ac.uk/10.3390/diseases9030054
Thongprayoon C, Hansrivijit P, Mao MA, Vaitla PK, Kattah AG, Pattharanitima P, Vallabhajosyula S, Nissaisorakarn V, Petnak T, Keddis MT, et al. Machine Learning Consensus Clustering of Hospitalized Patients with Admission Hyponatremia. Diseases. 2021; 9(3):54. https://0-doi-org.brum.beds.ac.uk/10.3390/diseases9030054
Chicago/Turabian StyleThongprayoon, Charat, Panupong Hansrivijit, Michael A. Mao, Pradeep K. Vaitla, Andrea G. Kattah, Pattharawin Pattharanitima, Saraschandra Vallabhajosyula, Voravech Nissaisorakarn, Tananchai Petnak, Mira T. Keddis, and et al. 2021. "Machine Learning Consensus Clustering of Hospitalized Patients with Admission Hyponatremia" Diseases 9, no. 3: 54. https://0-doi-org.brum.beds.ac.uk/10.3390/diseases9030054