Article

The Impact of Social Servicescape Factors on Customers’ Satisfaction and Repurchase Intentions in Mid-Range Restaurants in Baltic States

by
Mangirdas Morkunas
1,* and
Elzė Rudienė
2
1
Faculty of Economics and Business Administration, Vilnius University, Sauletekio Ave. 9, 01513 Vilnius, Lithuania
2
Business School, Vilnius University, Sauletekio Ave. 21, 01513 Vilnius, Lithuania
*
Author to whom correspondence should be addressed.
J. Open Innov. Technol. Mark. Complex. 2020, 6(3), 77; https://doi.org/10.3390/joitmc6030077
Submission received: 27 July 2020 / Revised: 1 September 2020 / Accepted: 3 September 2020 / Published: 7 September 2020
(This article belongs to the Special Issue Business Model Innovation)

Abstract

:
The present paper studies the importance of social servicescape factors to customer satisfaction in middle-priced restaurant services. This paper fills the existing literature gap on the importance of social servicescape factors onto customers’ satisfaction in middle-priced services. A survey of 514 respondents from three capitals of the Baltic States was conducted for the purpose of the present study. Descriptive statistics together with an independent samples t-test and partial least squares path analysis were employed for data processing. The results obtained confirmed the hypothesis about the importance of social servicescape attributes to customer satisfaction. The study also highlighted the difference in gender attitudes towards intangible aspects of service delivery. The research confirmed the existence of a relationship between customer satisfaction and repurchase intentions, although to a lesser extent than could have been anticipated from the literature review. The findings of the study covered by the present paper allow us to position middle-priced restaurants closer to luxury ones compared to casual restaurants

1. Introduction

The increasing debate on customer satisfaction in services put emphasis on intangible emotional factors in determining customer satisfaction in services provided [1,2,3]. This is being documented also in services that have a strong tangible component [4,5], making an emotional perception a focal point in concluding on the overall quality of services [6].
Such a shift from physical to emotional motives in determining the quality of services encourages both practitioners and academicians to identify the main intangible triggers, creating the positive experience to be broadly defined as social servicescape. The complexity of social servicescape research is composed of two components—difficulties in measuring intangible attributes [7] and the fact, that different services are being characterized by a different set of social servicescape attributes of varying importance [8]. This necessity for specific research in particular industries motivates us to reveal that social servicescape factors are principal in defining the customer satisfaction in middle-priced restaurants and inducing repurchase intentions.
The novelty of the research covered by the present paper lies in providing insights about the impact of intangible attributes to the perception of quality of middle-priced services. This is fairly new knowledge, as typically research is oriented at luxury service encounters [9,10,11] or casual service providers [12,13,14] leaving middle-priced services, especially restaurants, in the shadow of scientific interest.
The practical significance of the study is stressed by the fact that it was conducted in small countries with quite small numbers of tourists, and its restaurant industry must rely on repurchases and loyal customers in order to maintain its economic viability, contrary to primary tourist destination countries (e.g., Italy 63.2 million tourists or France 89.3 million tourists in 2018), where cultural heritage, natural and architectural landmarks create a potential consumer flow and restaurants should pay more attention to the physical factors of servicescape (in particular—location [15] in order to attract more customers and improve their financial results.
The aim of this paper is to reveal which social servicescape factors are most important in determining customer satisfaction in middle-priced restaurants.
This paper is structured as follows. The theoretical background consists of two parts providing comprehensive literature review on the influence of social servicescape factors onto customer satisfaction. The linkages between customer satisfaction and repurchase intentions are also emphasized. The methodological part consists of two subsections. The first part presents research design and hypotheses raised, the second part explains the data collection method and presents the results of the calculation of reliability indicators. The results section presents the obtained results and juxtaposes it with existing theoretical streams indicating not only congruence to prevailing scientific literature, but also some discrepancies, providing possible explanations for them. The discussion section provides comments on obtained results in the context of open innovations. The conclusion generalizes results and provides future research directions.

2. Theoretical Background

2.1. Social Servicescape and Its Implications on Customer Satisfaction

The concept of servicescape has secured its place in services marketing. Although prevailing theoretical streams tend to focus on physical dimension of servicescape [16,17,18,19,20] or see social servicescape as a complement to physical servicescape [21,22,23], more recent studies have provided evidence that social servicescape factors are fundamental in determining customer satisfaction [24].
Typically, social servicescape consists of three attribute groups: customer social servicescape, personnel social servicescape and social density [25]. The classical composition of physical and social attributes of servicescape is being offered to enhance by various additional factors. Rossenbaum and Massiah [26] propose a natural dimension to physical and social components of servicescape. Lee and Jeong [17] propose electronic environment attributes, Siguaw et al. [27] advocate on including safety dimension features into the servicescape mix, Dong and Siu [28] put forth customer’s predispositions to be included, Line et al. [29] propose soft attributes for enhancement of the servicescape model—word of mouth, place of attachment, etc. Due to its intangible nature and it being more difficult to measure, social servicescape dimension is offered to be enriched more broadly compared to physical servicescape [30].
Whilst social servicescape is a fairly new concept, introduced by Thombs and McColl-Kennedy in 2003 [31], studies on it gained momentum and currently are represented in a few interconnected spouts understanding social servicescape as a multidimensional construct responsible for the overall satisfaction with services [32], as an integral part of quality and assurance of satisfaction with services [33] or as a local temporary alternative to social norms [34]. Andres et al. [35] investigate a positive social servicescape impact, not only on customer satisfaction and consumer loyalty, but also on the word of mouth intentions. Social servicescape elements are even considered to be stress alleviating factors for consumers [36]. Lin et al. [37] demonstrate how social servicescape attributes determine overall satisfaction with restaurant services and influence future intentions through distinctive customer-to-customer interaction. Demoulin and Willems [38] show how failure to deliver social servicescape factors in an accustomed way irritates customers and dramatically lowers their satisfaction levels. It is even presumed that customers expect execution of social servicescape attributes at highest level to consider the delivery of services above an acceptable level, thus making the social servicescape dimension an indispensable part of any service. According to Song et al. [39], social servicescape factors are determinant in creating customer perceptions about high quality and uniqueness of restaurant services. Liu et al. [40] prove that social servicescape factors are detrimental in managing customer evaluations of experiential consumption, which also leads to positive word of mouth communications on a brand of the service provider. Line and Hanks [41] stress the importance of social servicescape factors in casual restaurant services by showing the moderating effect of crowding on the customer’s perceptions on service quality. Kim and Baker [42] see social servicescape as a facilitator of customer emotions, both positive and negative, stressing the emotional nature of social servicescape attributes. The role of servicescape in encouraging the desired behavior of consumers is also revealed by Hanks and Line [43].
Active personal interactions serve as a focal point in several studies carried out by Lin et al. [44], where servicescape is considered not only as a main contributor to satisfaction in B&B services, but also as an inducement to repurchase intentions.
Social density serves also as a main research object in Line and Hanks [45] studies indicating the importance of passive interactions between customers in creating the perception of overall quality of services. Social servicescape is also considered a substitution to social norms or social institutes [46] in small local places, where it can shape human behavior. It can also create positive images in consumers’ minds—another feature attributed to social servicescape [47], which, in turn is being converted to the satisfaction with services and repurchase intentions. This view was supported by Abdel-Aal et al. [48]; thus, as supportive factors, physical servicescape attributes were also analyzed. The provided possibility to “melt” within the perceived similar social environment is considered a positive factor in evaluating the services received [49].

2.2. Linkages between Customer Satisfaction and Repurchase Intentions

The findings in scientific literature [50] state that high quality customer experience is a sustainable competitive advantage that has a clear financial impact on businesses through building consumer loyalty. Some researchers have studied the direct link between its components and customer repurchase decisions or even loyalty [51]. More recent studies, however, tend to add additional elements into this chain [31]. Typically, customer satisfaction [52] is added into this relationship. In providing services, the most important aspects in defining perception of service quality are the so called “moments of truth” [53,54] which may also generate the negative experience usually generated by not very polite or competent personnel or antipathetic behavior of other customers. As satisfaction is closely linked to the quality of a service, it has a direct and strong impact on future behavioral intentions [55]. It has been even noticed that the effect of satisfaction on behavioral intentions is more significant than the direct perceived effect of service quality on future intentions, which directly leads to repeat purchases [2]. The role of intangible facets in drawing consumer satisfaction and intentions to repurchase was explored by Park et al. [53] who even stated that companies should focus more on intangible determinants (i.e., social servicescape) of customer satisfaction as they are more difficult to copy, thus become more sustainable from the viewpoint of business continuation. Customer satisfaction, as a focal factor in inducing repurchases, dominates the scientific literature and is being analyzed by Belas and Gabcova (2016), Kiran and Dilijit (2017), Gong and Yi (2017) [56,57,58]. Although the link between customer satisfaction and intended repurchases may look impregnable, there have been studies [59] that revealed the existence of mediating factors that could potentially contest the abovementioned relationship. Some of these factors, such as insufficient financial capacity of customer to perform repeated purchases even in a long perspective [60] are not applicable to mid-ranged restaurant services, some, such as psychological characteristics of customers [61] may weaken this satisfaction–repurchase link. Psychological motives influence customer satisfaction and intentions to repurchase even prevail over physical attributes of service delivery [62,63,64] and counter ex-ante attitudes towards selected services [65]. These discrepancies in prevailing scientific streams motivate us to investigate the relationship between customer satisfaction created by non-physical means (social servicescape factors) and intentions to repurchase specific restaurant services.

3. Methodology

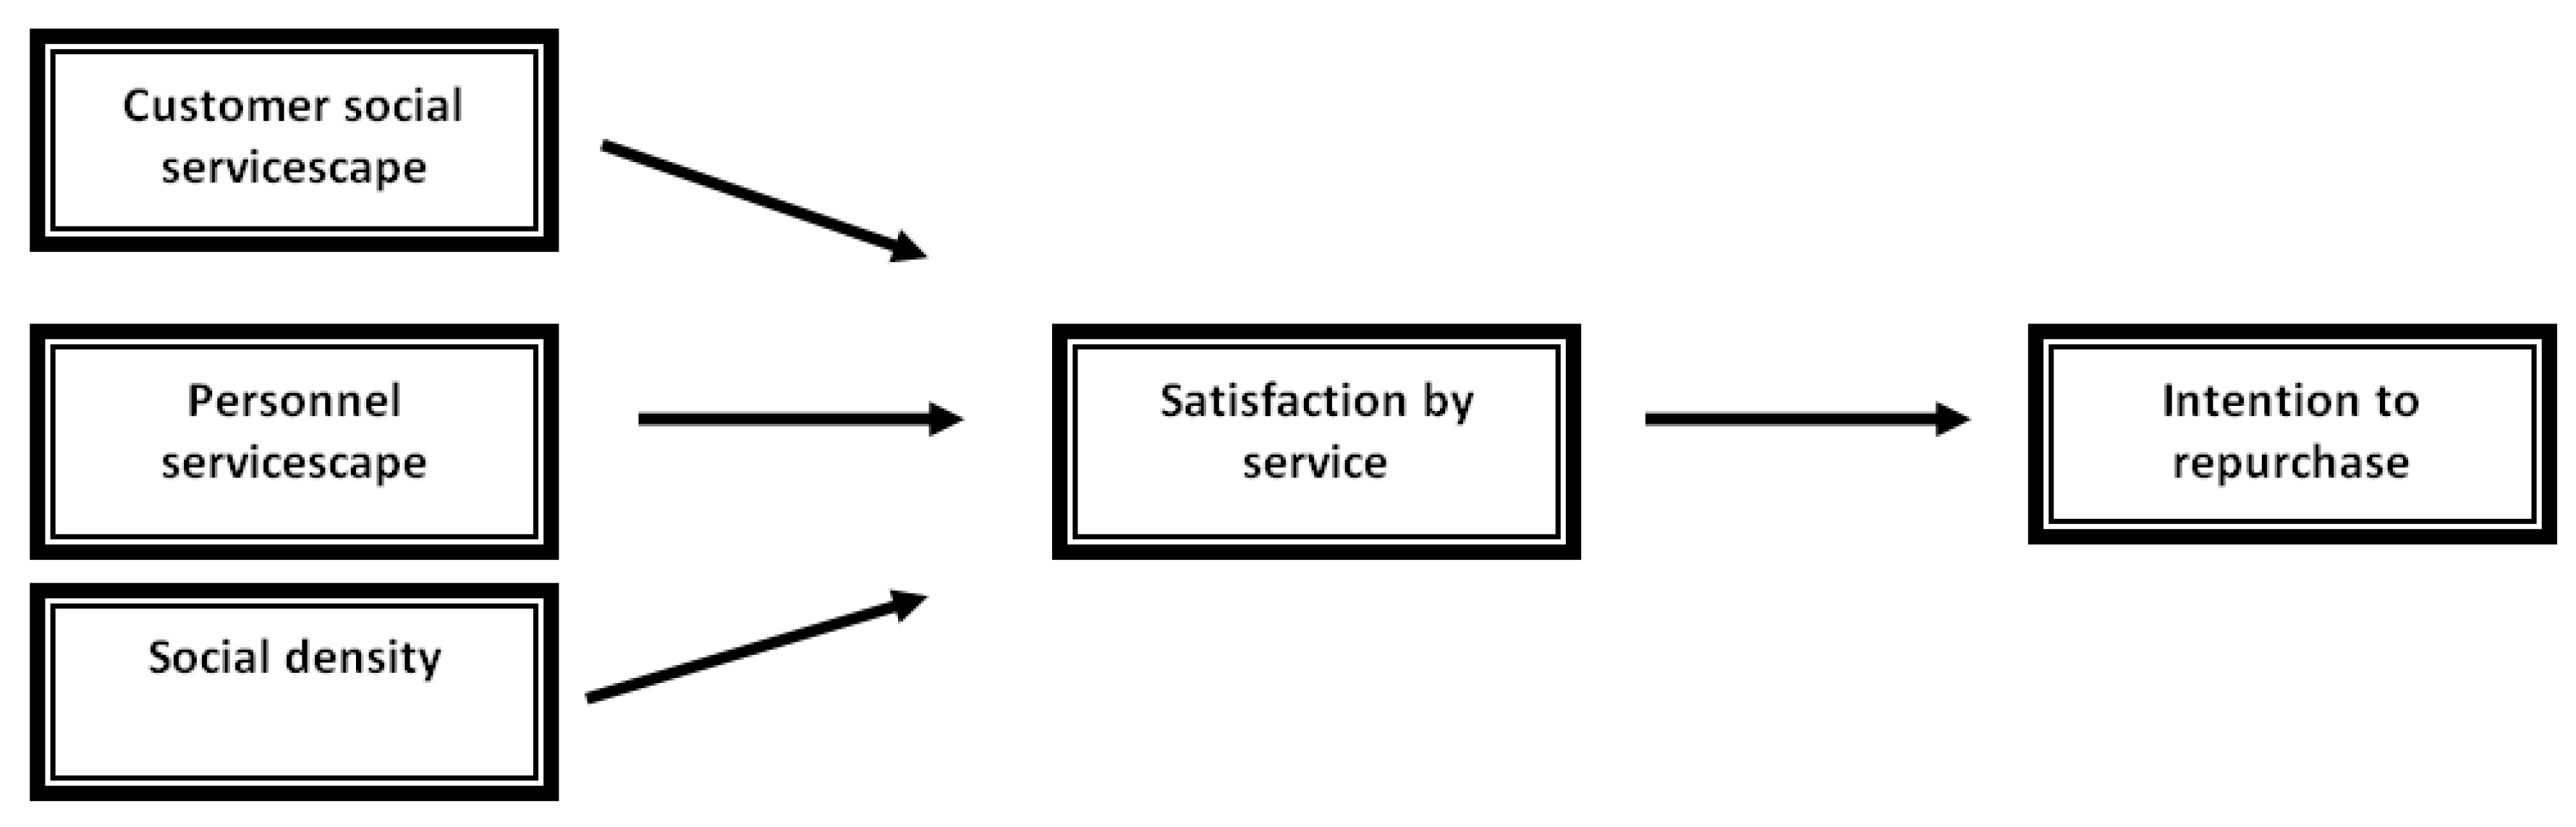
3.1. Research Model and Hypotheses

In order to assess the importance of several examined variables to another dependent variable, we used a descriptive statistics technique, which is a common tool for solving tasks of this character [66]. It was considered important to reveal the differences in attitudes towards social servicescape factors between men and women, therefore the authors of the study covered by the present paper conducted independent samples t-tests. The path analysis was conducted using the partial least squares method, which is a common tool in marketing research [67,68]
Following the overview of the prevailing theoretical streams and views related to social servicescape factors, we have raised four principal hypotheses:
Hypotheses 1 (H1).
Customer social servicescape factors affect customer satisfaction in mid-priced restaurant services.
Researchers have shown that consumers who experience the loss of social support due to negative life events, may counterbalance lost support by forming supportive relationships with people in the service places [69]. Likewise, consumers who experience illness themselves may also seek solace in service places by being among like-others [70].
Hypotheses 2 (H2).
Personnel servicescape has impact on customer satisfaction in mid-priced restaurant services.
Personnel servicescape is important because it appears to be the first point of contact when providing services [47] and impacts customer satisfaction. This involves assessment based on personnel effort with abilities that manifest through friendliness, empathy, or attentiveness. [71].
Hypotheses 3 (H3).
Social density has an impact on customer satisfaction in mid-priced restaurant services.
Most previous studies on service environment demonstrate that perceived social crowding affects consumer experiences negatively and report lower levels of consumer satisfaction [72,73], negative emotional responses [74], and avoidance behaviors [75].
Hypotheses 4 (H4).
Satisfaction by services has a positive impact on repeated purchases.
Olorunniwo et al. [76] reported that good service quality is positively related to customer satisfaction, which in turn leads to behavioral intention. Dong and Siu [28] documented that service quality plays an important role in customer evaluation of the service experience. Satisfied customers are more likely to have the intention to purchase more, repurchase, become loyal and recommend others to purchase [77,78,79].
In order to reveal the importance of social servicescape factors on customer satisfaction, three different question groups were developed, all measured by seven points on the Likert scale. It is a widely used method designed to obtain marketing information [80,81]. In data processing, the information obtained through this instrument is widely regarded as interval data [82,83] which allow parametric tests to be conducted [84].
The contextual model of the study is presented in Figure 1, where Customer social servicescape, Personnel servicescape and Social density are treated as exogenous latent variables and satisfaction by service as endogenous latent variable.

3.2. Data Collection and Reliability Indicators
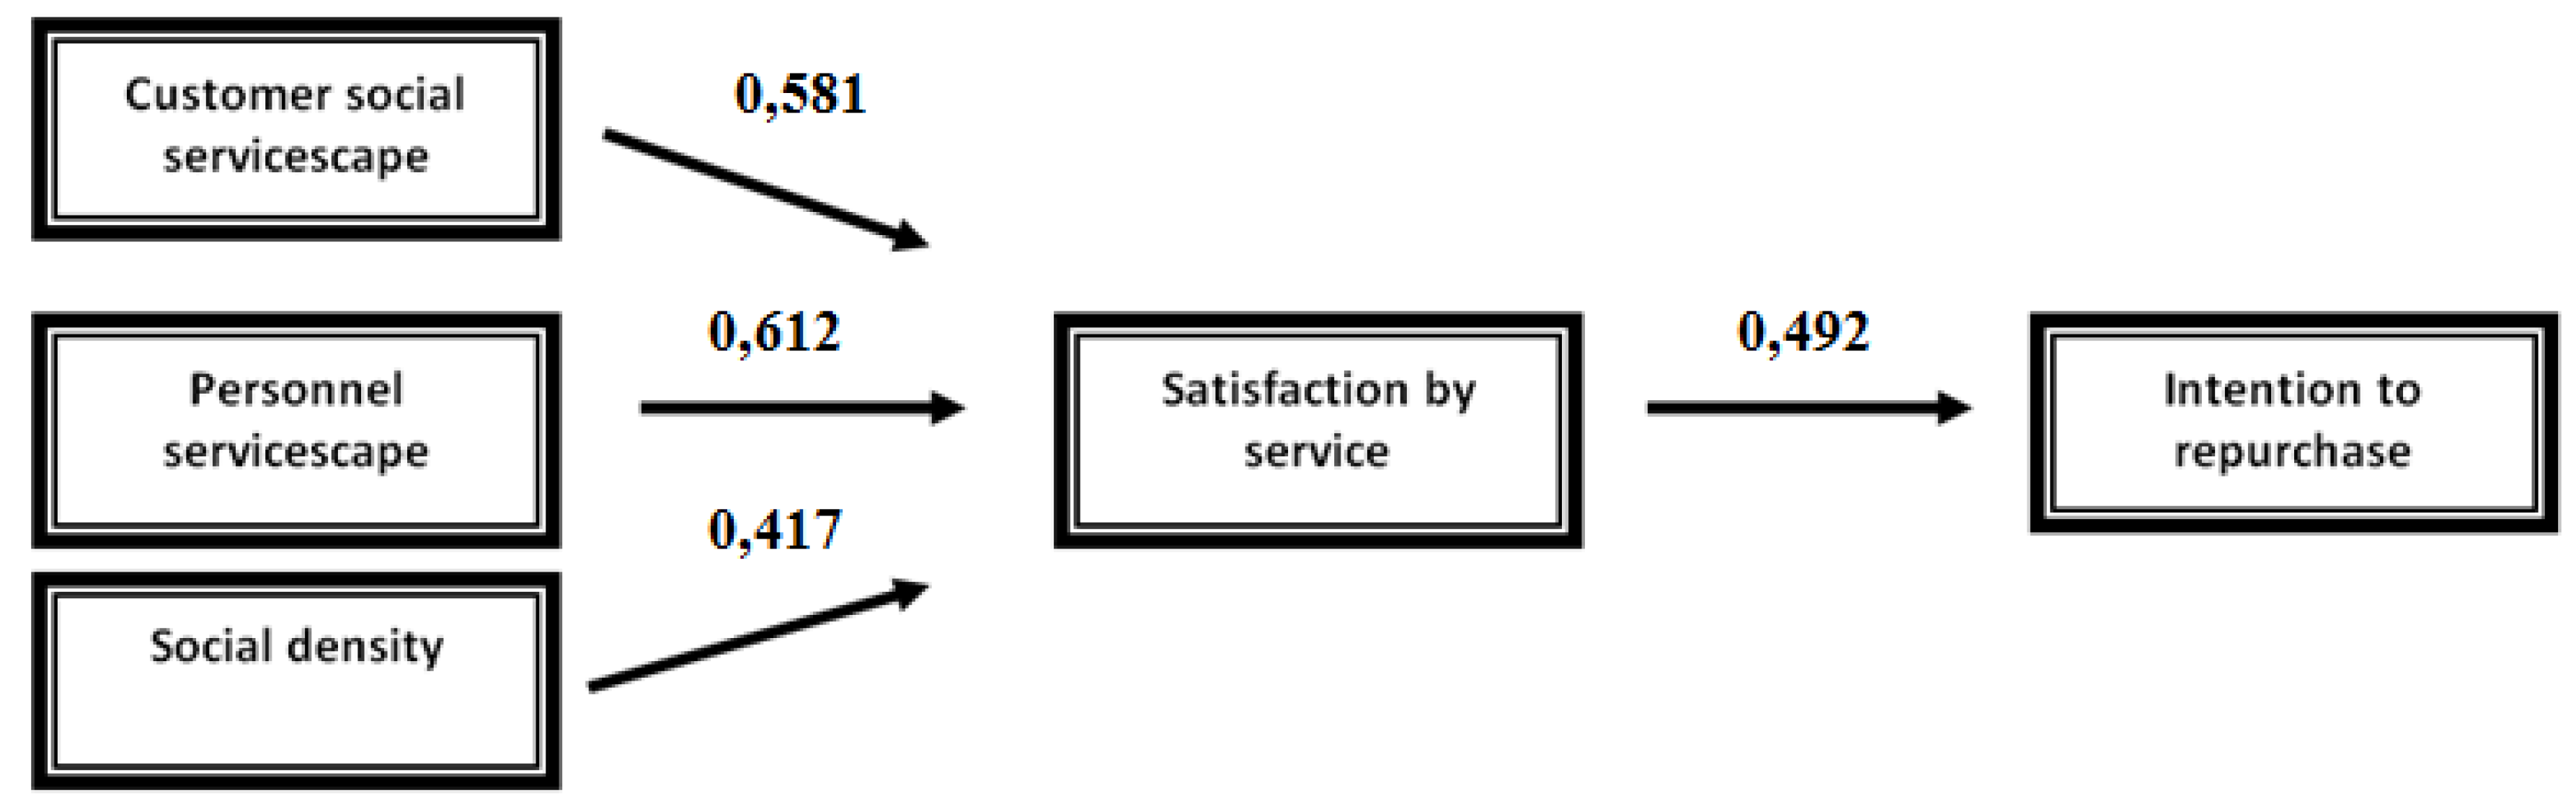
The original data were obtained using questionnaires that were filled by visitors of particular restaurants. The bulk of the surveys was obtained referring to an internet survey platform that served total 451 surveys. The online surveys were complemented with the data from the physical surveys—in total 106 carried out in Tallinn, Riga and Vilnius. After a statistical reliability test (Kolmogorov–Smironov) was conducted, we found that all 514 surveys were suitable for further analysis.
A middle-range restaurant was defined from a consumer perspective, e.g., represented by numbeo.com average for middle-priced restaurants, the measurement factor being a three-course bill for two persons. The given number was enhanced by ±15% interval, thus giving the price range for Vilnius EUR 31–42, EUR 34–46 in Riga and EUR 38.25–51.75 in Tallinn (based on numbeo.com data for April 2019). It is assumed that this value truly represents consumer perceptions about a middle-priced restaurant, as it is based on the average of 2363 entries in Vilnius, 3205 in Riga and 3041 in Tallinn, which is much more than the required 384 entries in each city to reach 95% confidence level with 5% error probability [85].
In order to check the reliability of measurement scales, we calculated Cronbach’s alpha coefficient that should be no less than 0.7 [86]. In our case, the customer social servicescape scale shows the reliability level of 0.802; personnel servicescape 0.854, social density of 0.761, customer satisfaction 0.778, intention for repurchase 0.902—so on that basis it can be concluded that all four scales are suitable for the study.
As the Likert scale was used for the purpose of the study, it is suggested to pay more attention to the median and not the mean, as contrary to the mean, the median is not so sensitive to extreme outliers which can impose bias to the final results [86]; so, for the purpose of the study covered by the present paper, we took both indicators into account and standard deviation was calculated for the purpose of measuring dispersion.
The bootstrapping approach (500 re-sampling) was employed in order to reveal whether or not the assumed relationships between analyzed variables really exist as depicted in Figure 1. The path coefficient is assumed to be within boundaries of −1 to 1, where −1 indicates a strong negative connection between variables, and 1 indicates a strong positive connection between the items being analyzed [67]. Chosen significance level: * p < 0.05, which is a common practice in a social research [87]. The structural model was verified by calculating R2 and Stone–Geisser (Q2) criterion. The goodness-of-fit (GoF) index was computed, as suggested for partial least squares path models [88]. The GoF index for present study is 0.53, which exceeds the 0.36 threshold [89] so the model can be characterized as good overall fit. R2 value for “Satisfaction by service” is 0.543 and for “Intention to repurchase” it is 0.471. It means that researched exogenous construct explains 54.3% and 47.1% of variance, respectively, which, according to Chin [90] is sufficient to obtain robust results. The obtained Q2 results (0.35 for “Satisfaction by service” and 0.32 for “Intention to repurchase”) are positive, indicating predictive relevance of independent variables to endogenous construct [91].

4. Results

The descriptive statistics for analyzed variable groups are presented in Table 1.
An analysis of the customer social servicescape led the authors of the paper to the conclusion that the most important factor in determining consumer satisfaction with restaurant services is similar behavior manners. It means that when choosing middle-priced restaurants customers expect other customers to act in a similar manner as themselves following the widely accepted social norms and behavior habits. Although different studies have suggested that it is a more common characteristic of higher priced restaurants [10], the study covered by the present paper allowed a conclusion that some of the formerly distinct features in differently priced restaurants of social servicescape are starting to converge. This shift may be attributed to the increasing popularity of low-priced restaurants and varying canteens, as a result of which middle-priced restaurants are relocated to a higher level, where people go not only to have a meal, but also to spend time and make an impression [9]. The second most important factor in this group was the similar social status. A lot of researchers [92,93,94] showed that people tend to feel more comfortable finding themselves among other persons of similar social status. The findings of the present study confirm this theory regarding the restaurant services. It may be attributed to the fact that the presence of a significant portion of people of apparently lower social status can diminish the impression the customer expected to deliver to his/her companion. The significant portion of people of obviously higher social class may make the customer feel uncomfortable or even to compromise his initial portrait in the eyes of his companion. Both situations will lead to negative emotions and subsequently very low level of satisfaction with services provided [44]. The expected similar appearance of customers can be explained by the fact that presumed social status requires corresponding appearance in customers’ perception, so these variables can be analyzed together. The importance of congruence in numbers of visitors, which was represented by research questions: ”when I go to the restaurant with the group of persons, I expect to find other groups in the restaurant” and “when I choose the restaurant for the date, it is important for me not to find a group of people celebrating” can be attributed to the social norms that impose the prohibition of disturbing plans and intentions of other people, as a restaurant is a widely accepted place for private conversations [95]. The composition and age of visitors were found to have a marginal effect on the satisfaction of visitors, signifying a high tolerance level of customers to different nationalities, races, religions and age groups. Although the analyzed composition of the visitors’ factor was of low importance in the Baltics, some regions, where national/religious disputes are on a high level, may show different results and restaurant owners in these regions may be forced to enhance their attention to this social servicescape factor.
By analyzing the importance of personnel social servicescape importance on customer satisfaction with middle-priced restaurant services, we see that congruence in willingness to communicate is of utmost importance. These findings are consistent with the other studies in the corresponding area [44] but may create confusion to restaurant owners willing to improve the satisfaction level of their customers. This is determined by the fact that it is quite hard to determine the willingness of new customers to communicate. Although customers in some Latin America or South Europe are more prone to communication [96] and a conversation of staff members with them would significantly improve overall satisfaction level with the restaurant services, it is hard to decide about this characteristic in some northern American or European countries, where discretion and personal space are of a high importance. Another important factor is the appearance of the serving personnel. It is obvious, that in sports bars no one expects to find a waiter with a bowtie, but, as became evident in our research, the similarity in appearance is of a high importance also in mid-priced restaurants. The age is not important. This finding in part contradicts Smedley [97] conclusions about importance of age in the service sector but goes along with Lestari et al.’s [98] conclusions about the importance of competence, good manners and empathy in serving people.
When researching social density, we have found that among all social servicescape factors the distance between the tables in a restaurant plays the second most important role in determining customer satisfaction. Questions, representing this variable were formed as: “for me it is important that I could easily go through the rows of tables without excusing visitors”, “for me it is important that my conversation could not be heard from another table”, “for me it is important that my sit is not be compromised by other visitors’ chairs”. These results confirmed the assumption that customers expect some privacy and ability to concentrate only on his/her companion when they go to middle-priced restaurant. Although a bigger number of tables in a restaurant may help to serve more customers and improve the financial performance of a restaurant, its owners should balance the social density in order to maintain customer satisfaction on a high level. The second most important factor in this category—number of tables in a restaurant—shows the preference of customers in the Baltic states to bigger restaurants. It may be attributed to the fact that a bigger number of tables helps customers to melt into the environment, not to attract too much attention to themselves, in that way maintaining privacy. The necessity of private tables, which was represented by questions: “if possible I would choose table, which is separated from the main hall”, “the ability to have a private dinner determines my choice between restaurants” confirms the assumption that even middle-priced restaurants are chosen for romantic evenings, and supporting measures that could reinforce this romantic private impression would significantly improve the satisfaction of restaurant services. Queues to the restrooms we attribute to so-called hygiene [99] factors and can easily be solved by technical means.
Comparison of means shows (Table 2) that, in general, men tend to pay less attention to social servicescape attributes of restaurants compared to women.
This finding cannot be further exploited as we did not research physical servicescape attributes of restaurants and this constraint does not allow us to conclude if men are paying more attention to physical servicescape compared to social servicescape, or they are more indifferent to the environment of restaurants in general, as compared to women.
When analyzing the second order constructs, such as satisfaction with the service (in a survey this was represented by statements: “I judge restaurant services by atmosphere provided”, “Social atmosphere is of utmost importance for me in a satisfaction with restaurant services”, “Trying to remember my experience about restaurant, I remember how I felt there”) and intention to revisit the restaurant (represented by the statements: “I would like to revisit this restaurant in the near future”, “I have a strong intention to bring my family and friends to visit this restaurant again”, “This restaurant would be my first choice over other restaurants”) we obtained the following results (Table 3):
Analysis of endogenous variables shows the same trend—women tend to be more demanding in restaurant services and towards attitudes to satisfaction and intention to revisit the same restaurant. This may be related to the fact that in western culture men tend to take responsibility for choosing the restaurant [100], so women are left with the responsibilities of judging the men’s choices. The decision can therefore be biased by the overall impression of the evening not allowing clear distinction between social servicescape and other attributes contributing to the whole atmosphere of the evening to which restaurant was a focal point [101].
When conducting path analysis, we found that all variables are significant under the predetermined confidence level of 0.05 and all are positively related. The path coefficient value for a customer social servicescape is 0.581, indicating quite strong influence [90] on the dependent variable, Customer satisfaction. The strongest influence can be noticed measuring Personnel servicescape and the least significant influence is exercised in Social density. Nevertheless, when analyzing variables independently, we found that social density was valued very highly in customer surveys, although statistical techniques show a bit lower but still high importance of this social servicescape facet on consumer satisfaction with restaurant services.
The positive relationship between satisfaction of restaurant services and intention to revisit it also exists, although not as high as we expected, indicating the path coefficient value of 0.492. This may be associated with the fact that research has been carried out in the Baltics where visiting mid-priced restaurants are still considered in part as a luxury [102] and even being satisfied with the services provided, not all customers are planning to revisit it again. All researched relationships and its’ strengths are represented in Figure 2 below.
Therefore, we were able to conclude that all four hypotheses originally formed for the purpose of the study were confirmed. Nevertheless, due to a quite high number of limitations some of the findings should be applied with caution in challenging the existing theoretical streams, especially in questioning a bold influence vector from customer satisfaction to repeated purchases.

5. Discussion: Social Servicescape Factors and Open Innovation in Restaurant Services

Accessibility and implementation of open innovation are considered to be key determinants assuring a steady development of the service industry [103]. They are also keys to success in the food industry [104] and restaurant services [105]. Restaurant open innovation can consist of ingredient open innovation, recipe open innovation, and service open innovation as follows. Food ingredient open innovation could be measured from the customer satisfaction or restaurant high ranking which is a reflection of a vast number of fresh ingredients. Menu recipe open innovation is the level of customer satisfaction or can be revealed in restaurant high ranking which, in turn, is a reflection of a high number of new and fascinating menus implemented. In addition, the restaurant service open innovation is a customer satisfaction of sophisticated and customized services [106]. As one of the more advanced steps in the implementation of open innovations in the restaurant business is the open innovation platform, which creates “combinative innovation and customer self-creation” [106] (p. 14). This concept also puts emphasis on customer-market information in the process of empowerment of open innovation. Data obtained from customers, which have potential to be used for improving companies’ performance, can be considered as a source of open innovation [107]. The findings of this study can serve for creation of open innovations by providing comprehensive insights into the importance of social servicescape factors in customer satisfaction, which, in turn, can be converted to loyalty [108]. The revealed importance of congruence levels in willingness to communicate between customers and staff in assuring customer satisfaction has also implications in creation of open innovations. It is documented that direct contact between client and service provider can help to co-create value and serve as innovation strategy for particular firms [109].
The disclosed differences in the evaluation of social servicescape attributes between men and women also show that women are the first to be targeted in order to increase the overall satisfaction in restaurant services provided. This finding expands Karatepe [110] conclusions about moderating the role of gender in customer satisfaction in services encountered. From the point of view of open innovation, these findings suggest that using information obtained from women in changing business processes in the middle-priced restaurant industry can lead to better results, as they are not only more demanding, but also in a position to judge on a man’s choice of a restaurant.
The findings of this present study can be considered as one of the few external sources of open innovation, as suggested by Bayona-Saez et al. [111] for marketing managers of middle-priced restaurants. The research clearly shows that customer expectations for middle-priced restaurant services are very similar to expectations for luxury restaurants and are associated more to intangible aspects of services encountered, such as appropriate behavior manners both from personnel and other customers side, privacy seeking and less to the physical dimension of restaurant services. These predispositions should be met both in providing and advertising middle-priced restaurant services.

6. Conclusions and Further Research Implications

The importance of social servicescape attributes on customer satisfaction was well documented in the present study. One of the conclusions of the study was that women are more cautious about social servicescape in evaluating the services provided. Compared to men, they tend to be more demanding of social environments of restaurant services. This difference is also reflected in intentions of revisiting the service provider, where we found men to be more likely to repurchase restaurant services they were satisfied with. These insights generate managerial implications reflecting the need for restaurant owners to pay more attention to women’s perception of service quality in order to increase satisfaction with their services and inducing possible repeated purchases or even creating preconditions for improving customer loyalty levels.
The highest rated facets of social servicescape belong to Social density group of factors indicating the strive for privacy when visiting middle-priced restaurants. This new finding allows us to classify mid-range restaurants closer to luxury level restaurants, where privacy and status seeking prevail over the bigger portions or fast delivery expected from casual restaurants [102]. This insight is important not only from a theoretical, but also from a practical point of view suggesting that mid-priced restaurant owners ought to target customer groups of upper middle-class consumers, offering them marketing strategies closer to luxury restaurants than casual ones.
Relative devaluation of Personnel servicescape features compared to other component groups of social servicescape can be attributed to the fact that in middle-priced restaurants proper personnel behavior and high congruence levels are taken for granted and have quite a limited potential for creating additional competitive advantage over other restaurants. Although failure to deliver these social servicescape attributes at the appropriate level may significantly impair the customer satisfaction level.
Research aimed at revealing the importance of social servicescape factors in the context of the whole expanded servicescape mix, mentioned in the literature review, could add new knowledge. The revealing reasons for different attitudes of men and women on social servicescape factors and its importance in determining customer satisfaction could be beneficial for marketing science. Further studies aimed at mediating factors to the relationship between customer satisfaction and intentions for repurchase would also possibly add new scientific knowledge.

Author Contributions

Conceptualization, M.M.; methodology, M.M.; formal analysis, E.R.; data curation, E.R.; writing—original draft preparation, M.M. and E.R.; writing—review and editing, M.M. All authors have read and agreed to the published version of the manuscript.

Funding

This research received no external funding.

Conflicts of Interest

The authors declare no conflict of interest.

References

  1. Gallarza, M.G.; Ruiz-Molina, M.E.; Gil-Saura, I. Stretching the value-satisfaction-loyalty chain by adding value dimensions and cognitive and affective satisfactions. Manag. Decis. 2016, 54, 981–1003. [Google Scholar] [CrossRef]
  2. Ladhari, R.; Souiden, N.; Dufour, B. The role of emotions in utilitarian service settings: The effects of emotional satisfaction on product perception and behavioral intentions. J. Retail. Consum. Serv. 2017, 34, 10–18. [Google Scholar] [CrossRef]
  3. Li, X.; Su, X.; Hu, X.; Yao, L. App users’ emotional reactions and festival satisfaction: The mediating role of situational involvement. J. Travel Tour. Mark. 2019, 36, 980–997. [Google Scholar] [CrossRef]
  4. Prayag, G.; Hosany, S.; Muskat, B.; Del Chiappa, G. Understanding the relationships between tourists’ emotional experiences, perceived overall image, satisfaction, and intention to recommend. J. Travel Res. 2017, 56, 41–54. [Google Scholar] [CrossRef] [Green Version]
  5. Rychalski, A.; Hudson, S. Asymmetric effects of customer emotions on satisfaction and loyalty in a utilitarian service context. J. Bus. Res. 2017, 71, 84–91. [Google Scholar] [CrossRef]
  6. Medina-Viruel, M.J.; López-Guzmán, T.; Gálvez, J.C.P.; Jara-Alba, C. Emotional perception and tourist satisfaction in world heritage cities: The Renaissance monumental site of úbeda and baeza, Spain. J. Outdoor Recreat. Tour. 2019, 27, 100226. [Google Scholar] [CrossRef]
  7. Ding, Y.; Keh, H.T. Consumer reliance on intangible versus tangible attributes in service evaluation: The role of construal level. J. Acad. Mark. Sci. 2017, 45, 848–865. [Google Scholar] [CrossRef]
  8. Loureiro, S.M.C. Medical tourists’ emotional and cognitive response to credibility and Servicescape. Curr. Issues Tour. 2017, 20, 1633–1652. [Google Scholar] [CrossRef]
  9. Lu, C.; Berchoux, C.; Marek, M.W.; Chen, B. Service quality and customer satisfaction: Qualitative research implications for luxury hotels. Int. J. Cult. Tour. Hosp. Res. 2015, 9, 168–182. [Google Scholar] [CrossRef]
  10. Chung, M.; Ko, E.; Joung, H.; Kim, S.J. Chatbot e-service and customer satisfaction regarding luxury brands. J. Bus. Res. 2018. [Google Scholar] [CrossRef]
  11. Herstein, R.; Gilboa, S.; Gamliel, E.; Bergera, R.; Ali, A. The role of private label brands in enhancing service satisfaction in the hotel industry: Comparing luxury and boutique hotels. Serv. Mark. Q. 2018, 39, 140–155. [Google Scholar] [CrossRef]
  12. Bufquin, D.; DiPietro, R.; Partlow, C. The influence of the DinEX service quality dimensions on casual-dining restaurant customers’ satisfaction and behavioral intentions. J. Foodserv. Bus. Res. 2017, 20, 542–556. [Google Scholar] [CrossRef]
  13. Kim, L.H.; Kim, D.J. Achieving relational outcomes in casual dining restaurants through consumer commitment. Curr. Issues Tour. 2017, 20, 178–203. [Google Scholar] [CrossRef]
  14. Nguyen, Q.; Nisar, T.M.; Knox, D.; Prabhakar, G.P. Understanding customer satisfaction in the UK quick service restaurant industry. Br. Food J. 2018, 120, 1207–1222. [Google Scholar] [CrossRef] [Green Version]
  15. Lee, C.J.; Wang, Y.C.; Cai, D.C. Physical factors to evaluate the servicescape of theme restaurants. J. Asian Archit. Build. Eng. 2015, 14, 97–104. [Google Scholar] [CrossRef] [Green Version]
  16. Johnstone, M.L. The servicescape: The social dimensions of place. J. Mark. Manag. 2012, 28, 1399–1418. [Google Scholar] [CrossRef]
  17. Lee, S.A.; Jeong, M. Effects of e-servicescape on consumers’ flow experiences. J. Hosp. Tour. Technol. 2012, 3, 47–59. [Google Scholar] [CrossRef]
  18. Nilsson, E.; Ballantyne, D. Reexamining the place of servicescape in marketing: A service-dominant logic perspective. J. Serv. Mark. 2014, 28, 374–379. [Google Scholar] [CrossRef]
  19. Theron, E.; Pelser, A. Using servicescape to manage student commitment towards a higher education institution. South. Afr. J. High. Educ. 2017, 31, 225–245. [Google Scholar] [CrossRef] [Green Version]
  20. Tankovic, A.C.; Benazic, D. The perception of e-servicescape and its influence on perceived e-shopping value and customer loyalty. Online Inf. Rev. 2018, 42, 1124–1145. [Google Scholar] [CrossRef]
  21. Namasivayam, K.; Lin, I.Y. The Servicescape. In Handbook of Hospitality Operations and IT; Routledge: Abingdon, UK, 2008; pp. 597–598. [Google Scholar]
  22. Kauppinen-Räisänen, H.; Rindell, A.; Åberg, C. Conveying conscientiousness: Exploring environmental images across servicescapes. J. Retail. Consum. Serv. 2014, 21, 520–528. [Google Scholar] [CrossRef]
  23. Olson, E.; Park, H.J. The impact of age on gay consumers’ reaction to the physical and social servicescape in gay bars. Int. J. Contemp. Hosp. Manag. 2019. [Google Scholar] [CrossRef]
  24. Yalinay, O.; Baxter, I.W.; Collinson, E.; Curran, R.; Gannon, M.J.; Lochrie, S.; Thompson, J. Servicescape and shopping value: The role of negotiation intention, social orientation, and recreational identity at the Istanbul Grand Bazaar, Turkey. J. Travel Tour. Mark. 2018, 35, 1132–1144. [Google Scholar] [CrossRef] [Green Version]
  25. Brocato, E.D.; Voorhees, C.M.; Baker, J. Understanding the influence of cues from other customers in the service experience: A scale development and validation. J. Retail. 2012, 88, 384–398. [Google Scholar] [CrossRef]
  26. Fisk, R.P.; Patrício, L.; Rosenbaum, M.S.; Massiah, C. An expanded servicescape perspective. J. Serv. Manag. 2011, 22, 471–490. [Google Scholar]
  27. Siguaw, J.A.; Mai, E.; Wagner, J.A. Expanding servicescape dimensions with safety: An exploratory study. Serv. Mark. Q. 2019, 40, 123–140. [Google Scholar] [CrossRef]
  28. Dong, P.; Siu, N.Y.M. Servicescape elements, customer predispositions and service experience: The case of theme park visitors. Tour. Manag. 2013, 36, 541–551. [Google Scholar] [CrossRef]
  29. Line, N.D.; Hanks, L.; Kim, W.G. An expanded servicescape framework as the driver of place attachment and word of mouth. J. Hosp. Tour. Res. 2018, 42, 476–499. [Google Scholar] [CrossRef]
  30. Mari, M.; Poggesi, S. Servicescape cues and customer behavior: A systematic literature review and research agenda. Serv. Ind. J. 2013, 33, 171–199. [Google Scholar] [CrossRef]
  31. Tombs, A.; McColl-Kennedy, J.R. Social-servicescape conceptual model. Mark. Theory 2003, 3, 447–475. [Google Scholar] [CrossRef]
  32. Line, N.D.; Hanks, L. The social servicescape: A multidimensional operationalization. J. Hosp. Tour. Res. 2019, 43, 167–187. [Google Scholar] [CrossRef]
  33. Nguyen, D.T.; DeWitt, T.; Russell-Bennett, R. Service convenience and social servicescape: Retail vs hedonic setting. J. Serv. Mark. 2012, 26, 265–277. [Google Scholar] [CrossRef]
  34. Tombs, A.G.; McColl-Kennedy, J.R. Social and spatial influence of customers on other customers in the social-servicescape. Australas. Mark. J. AMJ 2010, 18, 120–131. [Google Scholar] [CrossRef]
  35. Andrés, B.T.; Cervera-Taulet, A.; García, H.C. Social servicescape effects on post-consumption behavior. J. Serv. Theory Pract. 2016, 26, 590–615. [Google Scholar] [CrossRef]
  36. Lucia-Palacios, L.; Pérez-López, R.; Polo-Redondo, Y. Can social support alleviate stress while shopping in crowded retail environments? J. Bus. Res. 2018, 90, 141–150. [Google Scholar] [CrossRef]
  37. Lin, Y.C.; Lai, H.J.; Morrison, A.M. Social servicescape and Asian students: An analysis of spring break island bed and breakfast experiences in Taiwan. Tour. Manag. Perspect. 2019, 31, 165–173. [Google Scholar] [CrossRef]
  38. Demoulin, N.; Willems, K. Servicescape irritants and customer satisfaction: The moderating role of shopping motives and involvement. J. Bus. Res. 2019, 104, 295–306. [Google Scholar] [CrossRef]
  39. Song, H.; van Phan, B.; Kim, J.H. The congruity between social factors and theme of ethnic restaurant: Its impact on customer’s perceived authenticity and behavioural intentions. J. Hosp. Tour. Manag. 2019, 40, 11–20. [Google Scholar] [CrossRef]
  40. Liu, S.Q.; Bogicevic, V. Mattila, A.S. Circular vs. angular servicescape: “Shaping” customer response to a fast service encounter pace. J. Bus. Res. 2018, 89, 47–56. [Google Scholar] [CrossRef]
  41. Line, N.D.; Hanks, L. A holistic model of the servicescape in fast casual dining. Int. J. Contemp. Hosp. Manag. 2020, 32, 288–306. [Google Scholar] [CrossRef]
  42. Kim, Y.S.; Baker, M.A. I earn it, but they just get it: Loyalty program customer reactions to unearned preferential treatment in the social servicescape. Cornell Hosp. Q. 2020, 61, 84–97. [Google Scholar] [CrossRef]
  43. Hanks, L.; Line, N.D. The restaurant social servicescape: Establishing a nomological framework. Int. J. Hosp. Manag. 2018, 74, 13–21. [Google Scholar] [CrossRef]
  44. Lin, H.; Gursoy, D.; Zhang, M. Impact of customer-to-customer interactions on overall service experience: A social servicescape perspective. Int. J. Hosp. Manag. 2019, 87, 102376. [Google Scholar] [CrossRef]
  45. Line, N.D.; Hanks, L. The social servicescape: Understanding the effects in the full-service hotel industry. Int. J. Contemp. Hosp. Manag. 2019, 31, 753–770. [Google Scholar] [CrossRef]
  46. Line, N.D.; Hanks, L.; Zhang, L. Birds of a feather donate together: Understanding the relationship between the social servicescape and CSR participation. Int. J. Hosp. Manag. 2018, 71, 102–110. [Google Scholar] [CrossRef]
  47. Jang, Y.; Ro, H.; Kim, T.H. Social servicescape: The impact of social factors on restaurant image and behavioral intentions. Int. J. Hosp. Tour. Adm. 2015, 16, 290–309. [Google Scholar] [CrossRef]
  48. Abdel-Aal, E.; Abbas, J.E. Assessing Social and Physical Servicescape as Drivers of Hotels’ Image Formation: Customers Perspective. Int. J. Herit. Tour. Hosp. 2016, 10, 142–160. [Google Scholar]
  49. Hanks, L.; Line, N.; Yang, W. Status seeking and perceived similarity: A consideration of homophily in the social servicescape. Int. J. Hosp. Manag. 2017, 60, 1231–1232. [Google Scholar] [CrossRef]
  50. Halvorsrud, R.; Kvale, K.; Følstad, A. Improving service quality through customer journey analysis. J. Serv. Theory Pract. 2016, 26, 840–867. [Google Scholar] [CrossRef]
  51. Harris, L.C.; Ezeh, C. Servicescape and loyalty intentions: An empirical investigation. Eur. J. Mark. 2008, 42, 390–422. [Google Scholar] [CrossRef]
  52. Daunt, K.L.; Harris, L.C. Exploring the forms of dysfunctional customer behaviour: A study of differences in servicescape and customer disaffection with service. J. Mark. Manag. 2012, 28, 129–153. [Google Scholar] [CrossRef]
  53. Moran, G.; Muzellec, L.; Nolan, E. Consumer moments of truth in the digital context: How “search” and “e-word of mouth” can fuel consumer decision making. J. Advert. Res. 2014, 54, 200–204. [Google Scholar] [CrossRef] [Green Version]
  54. Krajnović, A.; Sikirić, D.; Bosna, J. Digital marketing and behavioral economics. Crodim: Int. J. Mark. Sci. 2018, 1, 33–46. [Google Scholar]
  55. de Oliveira Santini, F.; Ladeira, W.J.; Sampaio, C.H.; Perin, M.G. Online banking services: A meta-analytic review and assessment of the impact of antecedents and consequents on satisfaction. J. Financ. Serv. Mark. 2018, 23, 1678–1681. [Google Scholar] [CrossRef]
  56. Belás, J.; Gabčová, L. The relationship among customer satisfaction, loyalty and financial performance of commercial banks. Econ. Manag. 2016, 19, 132–147. [Google Scholar] [CrossRef]
  57. Kiran, K.; Diljit, S. Antecedents of customer loyalty: Does service quality suffice? Malays. J. Libr. Inf. Sci. 2017, 16, 95–113. [Google Scholar]
  58. Gong, T.; Yi, Y. The effect of service quality on customer satisfaction, loyalty, and happiness in five Asian countries. Psychol. Mark. 2018, 35, 427–442. [Google Scholar] [CrossRef]
  59. Thakur, R. The moderating role of customer engagement experiences in customer satisfaction–loyalty relationship. Eur. J. Mark. 2019, 53, 1278–1310. [Google Scholar] [CrossRef]
  60. Karasiova, Y.A. Сoциальнo-психoлoгические oсoбеннoсти пoстпoкупательскoгo пoведения = socio-psychological peculiarities of post-purchase behavior. Ph.D. Thesis, Russian State Governance University, Moscow, Russia, 2010. [Google Scholar]
  61. Bi, Q. Cultivating loyal customers through online customer communities: A psychological contract perspective. J. Bus. Res. 2019, 103, 34–44. [Google Scholar] [CrossRef]
  62. Friend, S.B.; Johnson, J.S.; Luthans, F.; Sohi, R.S. Positive psychology in sales: Integrating psychological capital. J. Mark. Theory Pract. 2016, 24, 306–327. [Google Scholar] [CrossRef] [Green Version]
  63. Castellanos-Verdugo, M.; Vega-Vázquez, M.; Oviedo-García, M.Á.; Orgaz-Agüera, F. The relevance of psychological factors in the ecotourist experience satisfaction through ecotourist site perceived value. J. Clean. Prod. 2016, 124, 226–235. [Google Scholar] [CrossRef]
  64. Chang, H.; Zhang, L. Psychological Contract Breach and Customer Satisfaction: A Study of Online Shopping. Serv. Mark. Q. 2019, 40, 172–188. [Google Scholar] [CrossRef]
  65. Oliver, R.L. Satisfaction: A Behavioral Perspective on the Consumer; Routledge: Abingdon, UK, 2014. [Google Scholar]
  66. McCusker, K.; Gunaydin, S. Research using qualitative, quantitative or mixed methods and choice based on the research. Perfusion 2015, 30, 537–542. [Google Scholar] [CrossRef] [PubMed]
  67. Henseler, J.; Ringle, C.M.; Sinkovics, R.R. The Use of Partial Least Squares Path Modeling in International Marketing. In New Challenges to International Marketing; Emerald Group Publishing Limited: Bingley, UK, 2009. [Google Scholar]
  68. Hair, J.F.; Sarstedt, M.; Ringle, C.M.; Mena, J.A. An assessment of the use of partial least squares structural equation modeling in marketing research. J. Acad. Mark. Sci. 2012, 40, 414–433. [Google Scholar] [CrossRef]
  69. Rosenbaum, M.S.; Massiah, A.C. When Customers Receive Support from Other Customers: Exploring the Influence of Intercustomer Social Support on Customer Voluntary Performance. J. Serv. Res. 2007, 9, 257–270. [Google Scholar] [CrossRef]
  70. Glover, T.D.; Parry, C.D. A third place in the everyday lives of people living with cancer: Functions of Gilda’s Club of Greater Toronto. Health Place 2009, 15, 97–106. [Google Scholar] [CrossRef] [PubMed]
  71. Specht, N.; Fichtel, S.; Meyer, A. Perception and attribution of employees’ effort and abilities: The impact on customer encounter satisfaction. Int. J. Serv. Ind. Manag. 2007, 18, 534–554. [Google Scholar] [CrossRef] [Green Version]
  72. Eroglu, S.A.; Machleit, K. An Empirical Study of Retail Crowding: Antecedents and Consequences. J. Retail. 1990, 66, 201–221. [Google Scholar]
  73. Machleit, K.; Eroglu, S.; Mantel, S.P. Perceived Retail Crowding and Shopping Satisfaction: What Modifies This Relationship? J. Consum. Psych. 2000, 9, 29–42. [Google Scholar] [CrossRef]
  74. Hui, K.M.; Bateson, J.E.G. Perceived Control and the Effects of Crowding and Consumer Choice on the Service Experience. J. Consum. Res. 1991, 18, 174–184. [Google Scholar] [CrossRef]
  75. Newman, J.A. Undiscovering Dimensionality in the Servicescape: Towards Legibility. Serv. Ind. J. 2007, 27, 15–18. [Google Scholar] [CrossRef]
  76. Olorunniwo, F.; Hsu, K.M.; Udo, G.J. Service quality, customer satisfaction, and behavioral intentions in the service factory. J. Serv. Mark. 2006, 20, 59–72. [Google Scholar] [CrossRef]
  77. Rust, R.T.; Williams, D.C. How length of patronage affects the impact of customer satisfaction on repurchase intention. J. Consum. Satisf. Dissatisf. Complain. Behav. 1994, 3, 126–138. [Google Scholar]
  78. Cronin, J.J., Jr.; Brady, M.K.; Hult, G.T.M. Assessing the effects of quality, value, and customer satisfaction on consumer behavioral intentions in service environments. J. Retail. 2000, 76, 193–218. [Google Scholar] [CrossRef]
  79. Ihtiyar, A.; Ihtiyar, H.G.; Galay, Y. Exploration of the antecedents and consequences of customers’ service experiences. J. Hosp. Tour. Insights 2018, 1, 367–386. [Google Scholar] [CrossRef]
  80. Naderi, I.; van Steenburg, E. Me first, then the environment: Young millennials as green consumers. Young Consum. 2018, 19, 280–295. [Google Scholar] [CrossRef] [Green Version]
  81. Hight, S.K.; Park, J.Y. Role stress and alcohol use on restaurant server’s job satisfaction: Which comes first? Int. J. Hosp. Manag. 2019, 76, 231–239. [Google Scholar] [CrossRef]
  82. Sullivan, G.M.; Artino, A.R. Analyzing and interpreting data from Likert-type scale. J. Grad. Med. Educ. 2013, 12, 541–542. [Google Scholar] [CrossRef] [Green Version]
  83. Jamieson, S. Likert scales: How to (ab)use them. Med. Educ. 2004, 38, 1212–1218. [Google Scholar] [CrossRef]
  84. Norman, G. Likert scales, levels of measurement and the “laws” of statistics. Adv. Health Sci. Educ. 2010, 2, 625–632. [Google Scholar] [CrossRef]
  85. Kardelis, K. Moksliniųtyrimųmetodologijairmetodai; Judex: Kaunas, Lithuania, 2002. [Google Scholar]
  86. Mooi, E.A.; Sarstedt, M. A Concise Guide to Market Research: The Process, Data, and Methods Using IBM SPSS Statistics; Springer: Berlin/Heidelberg, Germany, 2011. [Google Scholar]
  87. Amrhein, V.; Korner-Nievergelt, F.; Roth, T. The earth is flat (p > 0.05): Significance thresholds and the crisis of unreplicable research. Peer J. 2017, 5, e3544. [Google Scholar] [CrossRef] [PubMed] [Green Version]
  88. Tenenhaus, M.; Vinzi, V.E.; Chatelin, Y.M.; Lauro, C. PLS path modeling. Comput. Stat. Data Anal. 2005, 48, 159–205. [Google Scholar] [CrossRef]
  89. Wetzels, M.; Odekerken-Schröder, G.; van Oppen, C. Using PLS path modeling for assessing hierarchical construct models: Guidelines and empirical illustration. MIS Q. 2009, 33, 177–195. [Google Scholar] [CrossRef]
  90. Chin, W.W. The partial least squares approach to structural equation modeling. Mod. Methods Bus. Res. 1998, 295, 295–336. [Google Scholar]
  91. Henseler, J.; Ringle, C.M.; Sinkovics, R.R. The use of partial least squares path modelling in international marketing. Adv. Int. Mark. 2009, 20, 277–319. [Google Scholar]
  92. Wexley, K.N.; Alexander, R.A.; Greenawalt, J.P.; Couch, M.A. Attitudinal congruence and similarity as related to interpersonal evaluations in manager-subordinate dyads. Acad. Manag. J. 1980, 23, 320–330. [Google Scholar]
  93. Edwards, J.R. Problems with the use of profile similarity indices in the study of congruence in organizational research. Pers. Psychol. 1993, 46, 641–665. [Google Scholar] [CrossRef]
  94. Kosasih, U.; Wahyudin, W.; Prabawanto, S. September, An Analysis of Looking Back Method in Problem-Based Learning: Case Study on Congruence and Similarity in Junior High School. J. Phys. Conf. Ser. 2017, 895, 012074. [Google Scholar] [CrossRef]
  95. Tripathi, G.; Dave, K. Exploration of Service Quality Factors in the Restaurant Industry: A Study of Selected Restaurants in the New Delhi Region. In Hospitality Marketing and Consumer Behavior: Creating Memorable Experiences; Jauhari, V., Ed.; Apple Academic Press: Waretown, NJ, USA, 2017. [Google Scholar]
  96. Atkins, G.P. South America into the 1990s: Evolving International Relationships in A New Era; Routledge: Abingdon, UK, 2019; p. 211. [Google Scholar]
  97. Smedley, K. Age Matters: Employing, Motivating and Managing Older Employees; Routledge: Abingdon, UK, 2017. [Google Scholar]
  98. Lestari, S.I.P.; Ambarwati, R.; Agustina, T.; Muryani, E.; Andriani, A.; Alfani, M. The effect of customer’s orientation of service employee on customer’s satisfaction of health services. Int. J. Econ. Bus. Adm. 2019, 7, 270–278. [Google Scholar]
  99. Vilnai-Yavetz, I.; Gilboa, S. The effect of servicescape cleanliness on customer reactions. Serv. Mark. Q. 2010, 31, 213–234. [Google Scholar] [CrossRef]
  100. Collisson, B.; Howell, J.L.; Harig, T. Foodie Calls: When Women Date Men for a Free Meal (Rather Than a Relationship). Soc. Psychol. Personal. Sci. 2019. [Google Scholar] [CrossRef]
  101. Heung, V.C.; Gu, T. Influence of restaurant atmospherics on patron satisfaction and behavioral intentions. Int. J. Hosp. Manag. 2012, 31, 1167–1177. [Google Scholar] [CrossRef]
  102. Pilelienė, L.; Grigaliūnaitė, V. Vartotojųpasitenkinimo Čili pica picerijųpaslaugomisnustatymas. Organ. Sist. 2012, 64, 69–85. [Google Scholar]
  103. Chesbrough, H. Open Services Innovation: Rethinking Your Business to Grow and Compete in a New Era; John Wiley & Sons: Hoboken, NJ, USA, 2011. [Google Scholar]
  104. Acosta, M.; Coronado, D.; Ferrándiz, E. Trends in the Acquisition of External Knowledge for Innovation in the Food Industry. In Open Innovation in the Food and Beverage Industry; Woodhead Publishing: Cambridge, UK, 2013. [Google Scholar]
  105. Chesbrough, H.; Kim, S.; Agogino, A. Chez Panisse: Building an open innovation ecosystem. Calif. Manag. Rev. 2014, 56, 144–171. [Google Scholar] [CrossRef]
  106. Yun, J.J.; Park, K.; Gaudio, G.D.; Corte, V.D. Open innovation ecosystems of restaurants: Geographical economics of successful restaurants from three cities. Eur. Plan. Stud. 2020. [Google Scholar] [CrossRef]
  107. Shcherbak, V. Open innovations as a tool of restaurant business effective activity. Менеджмент 2016, 24, 115–127. [Google Scholar]
  108. Jin, N.; Line, N.D.; Merkebu, J. The impact of brand prestige on trust, perceived risk, satisfaction, and loyalty in upscale restaurants. J. Hosp. Mark. Manag. 2016, 25, 523–546. [Google Scholar] [CrossRef]
  109. Martinez, M.G. Co-Creation of Value with Consumers as an Innovation Strategy in the Food and Beverage Industry: The Case of Molson Coors ‘Talking Can’. In Open Innovation in the Food and Beverage Industry; Woodhead Publishing: Cambridge, UK, 2013; pp. 1353–1391. [Google Scholar]
  110. Karatepe, O.M. Service quality, customer satisfaction and loyalty: The moderating role of gender. J. Bus. Econ. Manag. 2011, 12, 278–300. [Google Scholar] [CrossRef] [Green Version]
  111. Bayona-Saez, C.; Cruz-Cázares, C.; García-Marco, T.; García, M.S. Open innovation in the food and beverage industry. Manag. Decis. 2017, 55, 526–546. [Google Scholar] [CrossRef] [Green Version]
Figure 1. The contextual model of the study.
Joitmc 06 00077 g001
Figure 2. Results of conceptual model.
Joitmc 06 00077 g002
Table 1. Descriptive statistics of analyzed variables.
ItemMeanMedianStd. Deviation
Customer Social Servicescape
Congruent physical appearance4.751.12
Congruent social status5.151.24
Congruent age3.430.91
Similar behavior manners5.861.26
Congruent number of visitors4.241.41
Congruent composition of visitors3.941.27
Cronbach’s alpha coefficient = 0.802
Personnel Servicescape
Congruent physical appearance4.141.26
Congruent willingness to communicate5.251.31
Congruent age2.930.96
Cronbach’s alpha coefficient = 0.854
Social Density
Number of tables in a restaurant5.351.33
Distance between sitting places5.761.2
The necessity of private tables4.141.04
Queues to restrooms5.150.93
Cronbach’s alpha coefficient = 0.761
Source: own calculations.
Table 2. Independent samples t-test.
Mean (Gender)t-Test for Equality of Means
MaleFemaletSig. (2-Tailed)
Social servicescape4.034.81−1.120.148
Personnel servicescape3.744.4−1.310.124
Social density4.585.29−1.670.071
Source: own calculations.
Table 3. Descriptive statistics and independent t-test results for endogenous variables.
Descriptive Statisticst-Test for Equality of Means
Mean
MeanMedianStd. DeviationMaleFemaletSig. 2-Tailed
Satisfaction by services provided4.950.865.24.5−1.310.151
Intentions to revisit4.751.1354.2−1.070.186
Source: own calculations.

