1. Introduction
Creating innovation with a sustainable environmental impact is of great importance for firms, which use open eco-innovation to raise performance and create economic and environmental value [
1,
2,
3,
4]. Every innovation strategy provides a clear direction for addressing strategic issues, the selection of the market where the company wants to enter and abilities to be developed [
5]. Although in the past firms adopted mainly internal research and development activities to create technology and products, this process being known as the closed innovation model [
6], in recent decades, the innovation framework has changed considerably, with many companies adopting an open innovation model, in which they use internal and external paths to develop and exploit new technology and products [
6].
Open innovation was stimulated predominately by Chesbrough [
6] and since then it has been subject to wide debate and extensive study in the literature of reference on innovation, with a special focus on innovation management [
7]. It corresponds to a model of organisation that includes the commercialization of firms’ internal and external ideas, following internal and external paths towards the market. This implies the search for knowledge flows from and to the firm environment, taking advantage of potential sources of ideas in third parties [
8,
9,
10]. This process resorts to complex networks of partners and external stakeholders, who cooperate through open innovation systems with inbound and outbound practices, to address the challenges posed by eco-innovation.
Concerning the challenges raised by eco-innovation, environmental deterioration is one of the most urgent ones and has led to firms’ increased interest in investing in sustainable innovations to allow sustainable production [
3,
11]. Therefore, eco-innovation emerges as the result of integrating the philosophy of sustainability in the context of the business innovation process, and is a type of innovation that in each phase of the life-cycle ensures solid reduction of risks, pollution and energy consumption/use compared to other alternatives [
12].
Eco-innovation occurs at the micro level, i.e., at the individual level, where capturing value is characterised by the position of power, unique experiences and absorptive capacity, and also at the macro level, i.e., in the ecosystem. At the same time, open innovation, besides occurring at the micro level also occurs at the meso level, the network level characterised by knowledge-sharing and building partnerships. Consequently, open innovation towards eco-innovation, i.e., open eco-innovation, is related to generating innovations that use inbound and outbound knowledge flows to stimulate internal innovation created with external stakeholders, aiming to have an impact on and create value for society and the environment, thereby working at the micro and macro levels and requiring a flow of knowledge from various actors [
4,
13,
14,
15].
The complexity of knowledge that is an integral part of many eco-innovations stimulates the need to work with partners through open innovation [
16], but the development of eco-innovations using open innovation has not yet been well studied [
17]. The literature also shows a gap regarding the knowledge sources used in eco-innovation, since it requires a multiple and heterogeneous set of sources, larger and more diverse that other technologies [
18]. Therefore, those industries are forced to go far beyond their core competences and the acquisition of external knowledge is a basic factor [
19]. This perspective leads to the importance of understanding the channels and sources of information through which eco-innovative firms benefit from external flows [
20].
It is extremely important to clarify those channels and how companies absorb and exploit them, for different reasons: first of all, the need to give scientific support to political decision-makers in elaborating instruments to maximize the use of open innovation systems in the environmental domain, stimulating firms’ interaction, capacities and learning; secondly, the fact that firms can open up to external sources of knowledge, helping them to overcome their internal limitations and the lack of resources and intangibles to support the creation of eco-innovations; and thirdly, the possibility of guiding these firms, in collaboration with external stakeholders responsible for the environment, to be more sustainable [
21,
22,
23,
24,
25,
26]. Therefore, this article contributes to analysis of the effects of open innovation and public policies oriented to generating eco-innovations in companies, based on assessment of inbound and outbound practices. Specifically, it also contributes to extending the very limited knowledge about the effects of inbound and outbound practices of open innovation and public policies on the eco-innovative performance of bioeconomy and non-bioeconomy firms, by using secondary data from the Community Innovation Survey (CIS)—CIS 2010. To do so, samples of firms from Slovakia, Spain, Hungary, Italy, Portugal and the Czech Republic are studied, considered moderately innovative countries by the Innovation Union Scoreboard 2010.
The article is structured as follows. It begins with a review of the literature on the inbound and outbound practices of open innovation, and eco-innovation, resulting in the proposal of a conceptual model. This is followed by the methodology, database, sample, the variables used and the method of estimation. Then the results are analysed and discussed. Finally, the conclusions, limitations and implications are presented.
2. Literature Review
2.1. Open Innovation: Inbound and Outbound Practices
The basic idea for the appearance of open innovation lies in the fact that organisations are not able to innovate in isolation, having to engage with different types of partners in order to acquire new ideas and resources to be able to become competitive [
27,
28]. Stimulated by Chesbrough [
6] and contrasting with the conventional view of innovation as an activity within the firm’s limits, open innovation refers to the flow of valuable ideas originating inside or outside the firm, and this can reach the market also from inside or outside the firm. In other words, open innovation assumes that firms should make use of not only external sources for innovation and external paths to the market, but also internal knowledge through external paths to the market [
29].
Reflecting on what had been learnt from practising open innovation and trying to emphasize the intentional nature of knowledge flows leaving and entering the firm [
30], the concept was revised by Chesbrough, Vanhaverbeke and West [
13], and open innovation came to be regarded as the intentional use of internal and external knowledge flows to accelerate internal innovation and expand markets for the external use of innovation. For Vrande et al. [
31], the intentional exit of knowledge or exploitation of technology causes innovation activities to raise existing technological capacities outside the organisation’s limits, while intentional entry or exploration of technology is related to innovation activities which capture and obtain benefits arising from external sources of knowledge to improve current technological developments. In other words, exploitation involves undertakings based on internal knowledge, internal licensing of intellectual property and involvement with employees, while exploration implies customer involvement in the process of innovation, external licensing of intellectual property and tertiarization of R&D.
Dahlander and Gann [
27] argue that open innovation deals with ideas that arise and can be commercialized inside or outside the firm, since this implies firms using multiple sources of knowledge, accelerating the advantages of developing internal ideas that are not immediately launched on the market. Later, Chesbrough and Bogers [
32] say that open innovation is a distributed process of innovation and based on knowledge flows managed through organisational borders. Open innovation is a concept in evolution and is no longer the linear and bilateral process of transactions and collaborations within the innovation process, but a wider, dynamic process with network and multi-collaborative participation in an ecosystem of open innovation (European Commission, 2016) [
33].
According to Dahlander and Gann [
27], open innovation presents advantages such as: (i) reflecting social and economic changes in work patterns where professionals seek a portfolio of careers, rather than a job for life with a single employer, meaning firms must find new ways to access talents who perhaps do not want to be employed by others exclusively and directly; (ii) exploitation of the benefits of globalization, which has expanded the size of the market, allowing a greater division of work; (iii) improved market institutions, such as intellectual property rights, risk capital and technological standards, allowing the organisation to exchange ideas; and (iv) new technology allows new forms of collaboration and coordination, contributing to reducing geographical distances. On the other hand, Manzini et al. [
34] also mentioned the potential disadvantages of open innovation, which include the loss of control, increased managerial and organisational complexity, and consequently, increased costs.
In addition, various studies, highlighted among them Laursen and Salter [
35], Rothaermel and Deeds [
36], Rohrbeck et al. [
37] and Chiang and Hung [
38], draw attention to the positive and negative effects of open innovation systems. As positive effects, Laursen and Salter [
35], Rothaermel and Deeds [
36] and Chiang and Hung [
38] mention increased profit, R&D performance, product innovation, greater access to sources of knowledge and the success of new products on the market. Concerning negative effects, Laursen and Salter [
35], Rothaermel and Deeds [
36] and Torkkeli et al. [
39] highlight excessive costs of exploration for external flows of knowledge, the struggle to control knowledge assets and negative attitudes towards open innovation.
Open innovation practices are in accordance with the diversity of forms used in knowledge transfer, i.e., inbound and outbound, also known as outside-in and inside-out, respectively. In inbound OI, knowledge flows from the external environment towards the focal firm; vice versa, in outbound OI, knowledge internally developed flows in the direction of the external environment [
40]. In the literature on open innovation, inbound and outbound are designated in various ways, for example: principal processes of open innovation in R&D management [
41]; dimension as to the direction of the knowledge flow in relation to the firm [
27]; and also typology of open innovation [
42].
The systematization proposed by Dahlander and Gann [
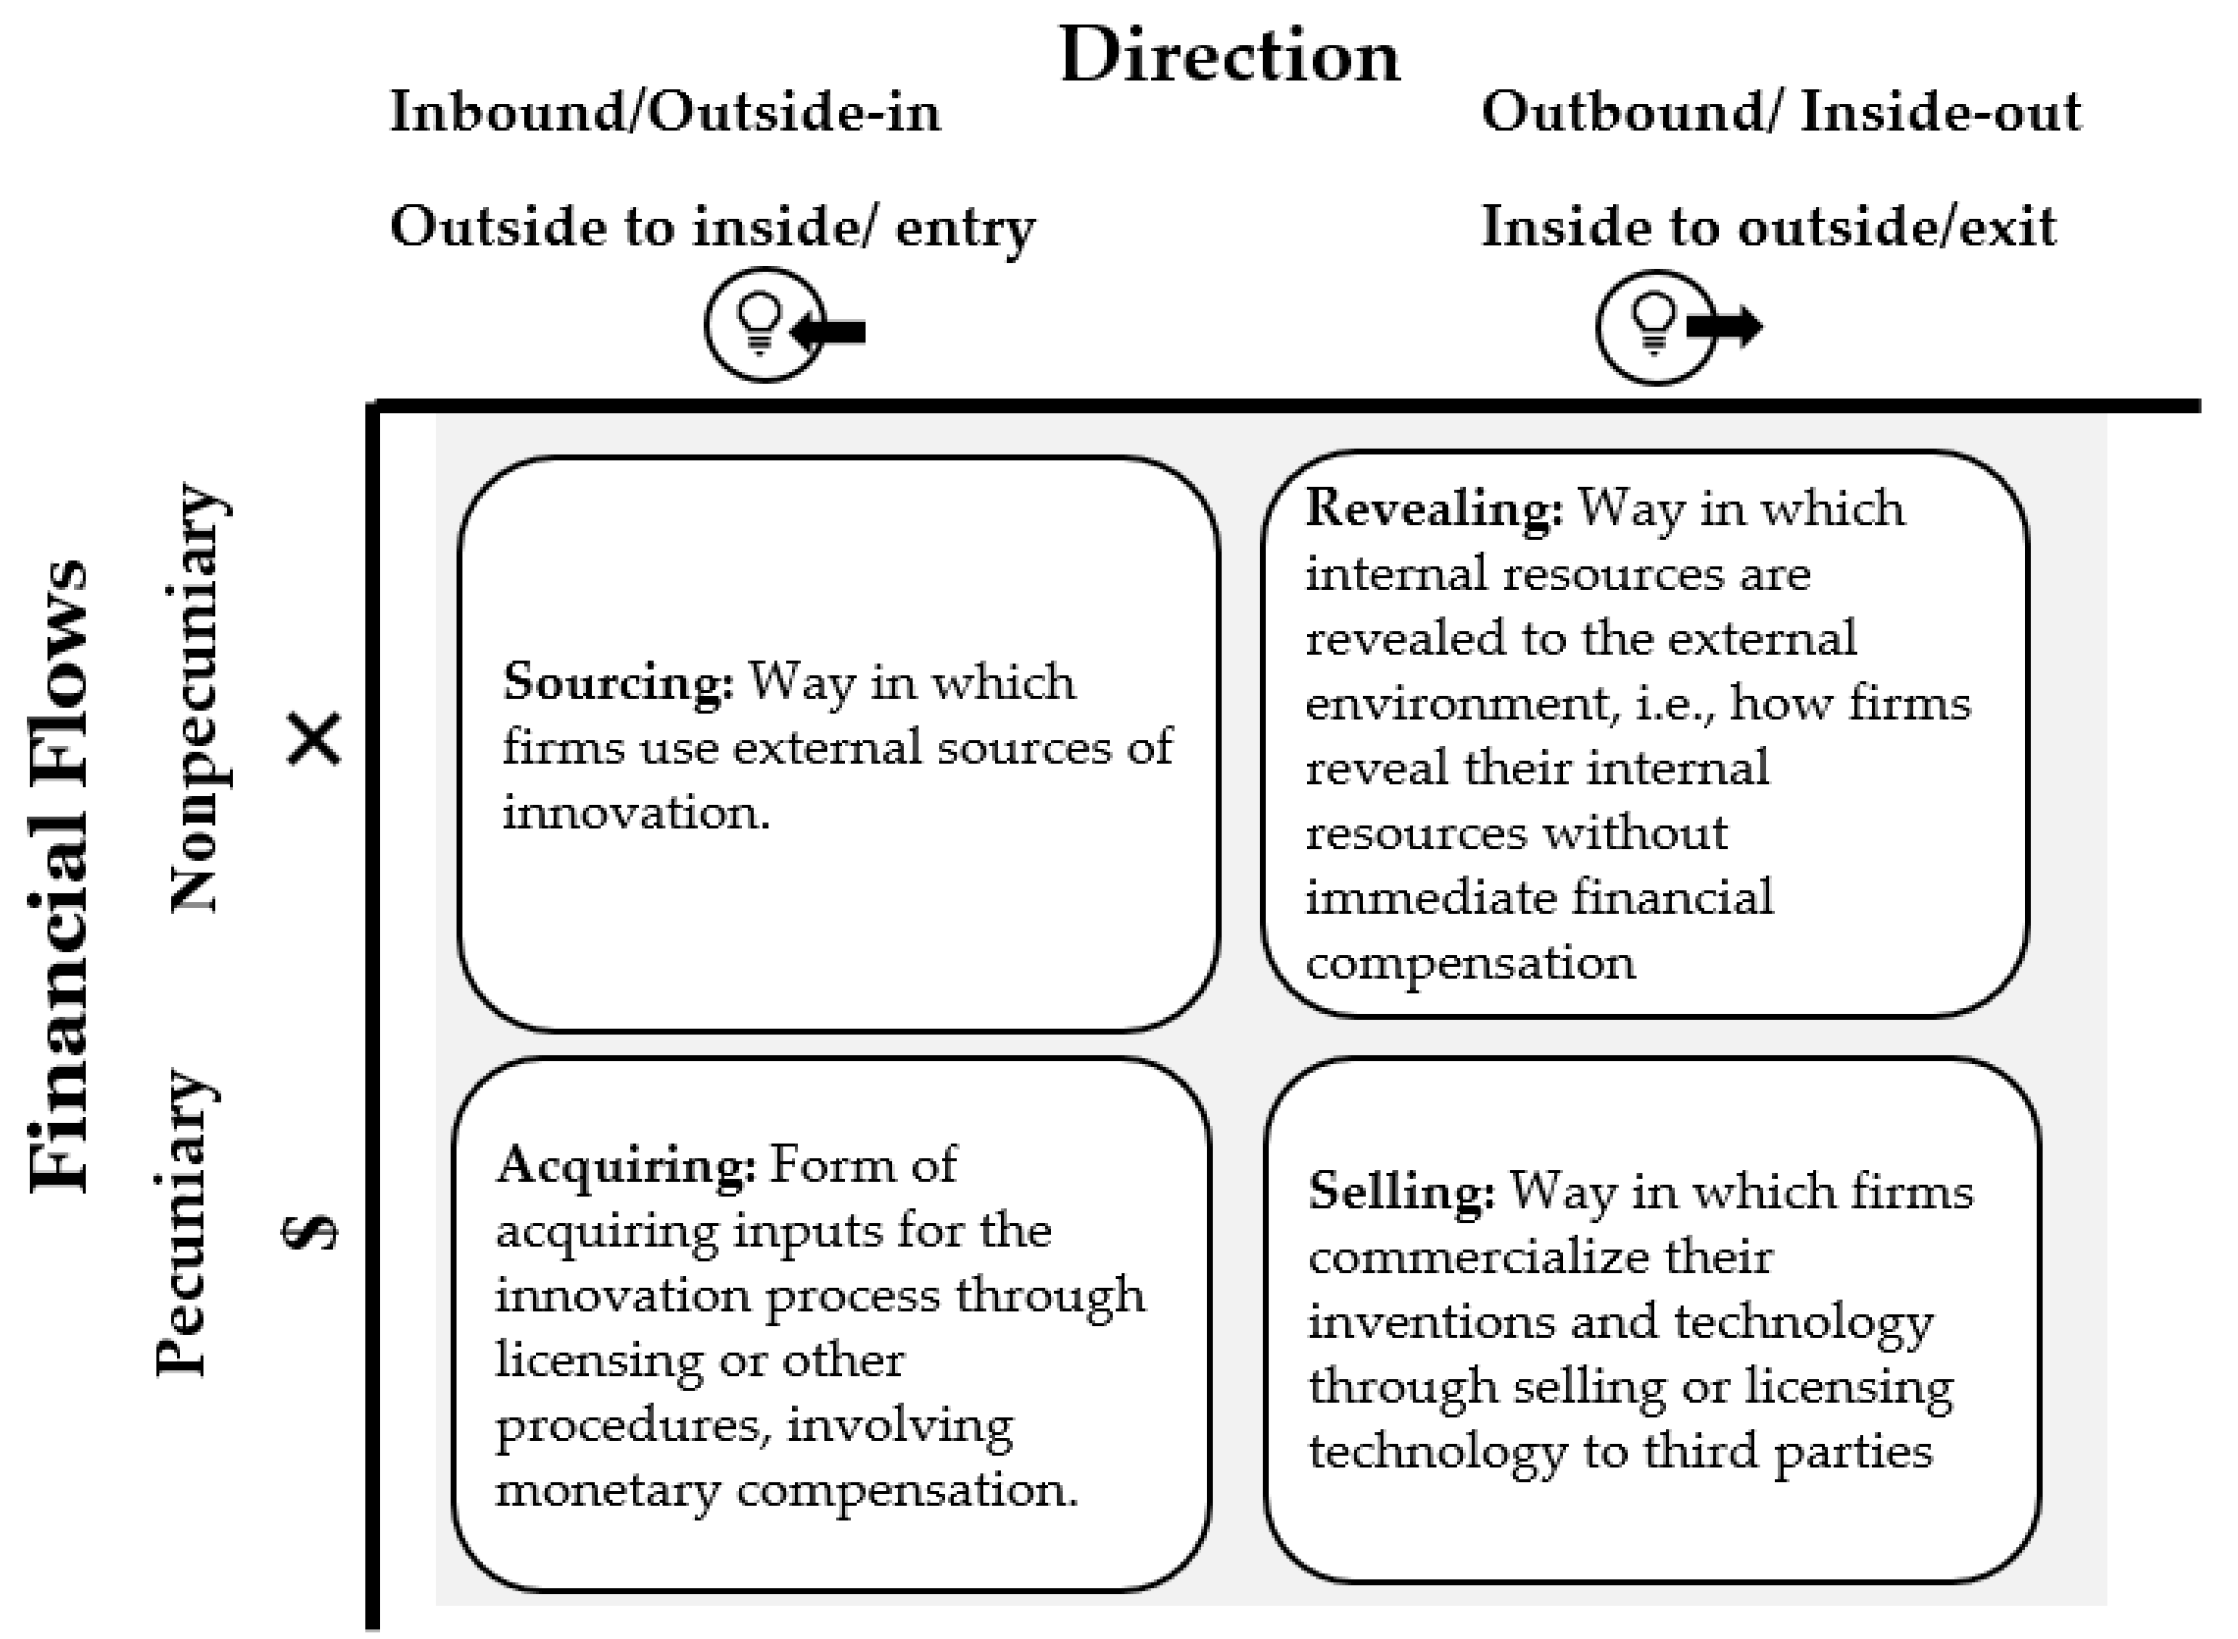
27] concerning open innovation presents two main dimensions: direction of the knowledge flow in relation to the firm (inbound x outbound) and the involvement of monetary exchange (non-pecuniary vs. pecuniary), and consequently of the main types of openness: sourcing; acquiring; revealing; and selling; is among the most commonly used and is therefore adopted in this study as the operational model of the components of inbound and outbound practices (
Figure 1). Inbound practices are types of openness in which external resources can be provided to the internal environment with firms being able to do this via sourcing and acquiring. Sourcing corresponds to an entry that does not involve non-pecuniary exchanges, with an implicit synergy between internal processes and open information available without strict financial liabilities. On the other hand, acquiring is an entry that involves pecuniary exchanges, including all forms of purchasing technology and R&D efforts. Regarding outbound practices, these are types of openness whereby internal resources can be provided to the external environment. Firms can do this via revealing and selling. Revealing is an exit that does not involve pecuniary exchange and concerns knowledge-sharing with the partner network without immediate financial benefit, whereas selling corresponds to an exit involving monetary exchange, allowing total leverage of the R&D investment in partnership with actors able to bring those results to the market.
It is noted that Chesbrough and Brunswicker [
43] use these same forms of inbound and outbound practices for a different purpose, i.e., to classify explicitly the range of open innovation activities, and not to propose and operationalize forms of inbound and outbound practices as is done in this study. With the due difference, it is noted that taking as reference the first column of
Figure 1, the inbound activities including non-pecuniary exchanges characterised by the supply of ideas and external knowledge from suppliers, clients, the competition, consultants, universities, research organisations and others, also require the development of synergistic relations, understood as indispensable for internal innovation and mutually beneficial management of open information flows with the partners involved, competitors or otherwise [
44]. Here, activities involve, for example, client and consumer co-creation processes, crowdsourcing, consortia financed by the public sector in R&D or informal networking. In addition, inbound activities that cover pecuniary exchanges involve acquiring a typology of openness, through the acquisition of inventions and inputs via informal and formal monetary connections, involving an accumulation of competences. These activities include entry licensing of intellectual property, R&D contracts, intermediaries specialized in open innovation, competitions for ideas and start-ups, innovation awards for suppliers or university research grants.
Moving to the second column of
Figure 1, non-pecuniary outbound practices imply a revealing strategy, through which the firm reveals its internal resources to the external environment, sharing knowledge with external partners, but without any financial benefit, with this generally occurring in situations where there are highly uncertain regimes of appropriability and where the protection of inventions is too costly. This practice includes participation in public norms or donations to common goods or non-profit organisations. In relation to pecuniary outbound practices, these are characterised by a form of selling that can involve both out-licensing of intellectual property and the sale of products on the market, assuming total leverage of investment in R&D collaboration with partners able to spread the results [
45]. These strategies can cover a number of activities, namely joint-ventures, spin-offs, incubation and the sale of market-ready products.
Among the activities presented above are firms that will choose which activities are more convenient for their purposes, i.e., inbound, transmitting internal use of external knowledge; outbound, external use of internal knowledge, and also mixed open innovation, requiring active collaboration between partners to innovate, resulting from orchestrating inbound and outbound activities. Firm activities aiming to make efficient use of inbound and outbound activities need consideration, not only concerning how to absorb resources, but also the use of solutions to enable sustainable actions on firms’ internal and external borders. Moreover, the success of open innovation practices is generally associated with increased efficiency in the general performance of the firm’s innovation, where the gain mechanics, regarding performance, include the internal and external increase of a set of competences and access to external sources of knowledge, as well as the internal resource economy and the generation of profits from internal intellectual property which is not directly incorporated in market products [
43].
In an environment of open innovation, it is essential for firms to develop various dynamic resources to manage their resources effectively, both internally and externally. Conventionally, in the inbound context, there is emphasis on absorption capacity, as suggested by Cohen and Levinthal [
46], but as firms began to be increasingly interested in selling their technology as a form of outbound innovation, research on open innovation has evolved to mainly consider the inbound process, study the outbound process and emphasize the need for knowledge capacities [
47,
48]. The inventive capacity in technology exchange markets, as well as the desorptive capacity of licensors is reflected in the studies by Shin et al. [
47] and Hu et al. [
49] on outbound open innovation.
Inventive capacity refers to firms’ internal capacity to create innovative knowledge, after identifying unsatisfied needs in the market, influenced by the firm’s existing knowledge stock in the form of its patent portfolio and citations of patents and technological range [
50]. The protection of patents is therefore a strategic advantage for firms to benefit from outbound open innovation, especially in certain technological domains, for example, the pharmaceutical or biotechnological sectors, since this can reduce transaction costs in technological markets. As technological knowledge is of an intangible nature, its licensing is characterised by its complexity, with greater disturbances due to being involved in technology-intensive environments. Furthermore, the licence of a contract with external partners is highly complex due to information asymmetry [
51,
52]. In this competitive scenario, the firm’s inventive capacity is related to licensors’ fame and the firm’s set of competences and resources owned. That resource stock makes firms’ inventive capacity more interesting for licensees, including firms’ patent stock and high-level researchers, and contributes to better collective awareness of potential partners and collaborators. In addition, licensees are interested in increasing their own prestige by establishing partnerships with this type of licensor who has strong inventive capacities, ensuring a relationship of mutual trust. Briefly, licensees with greater inventive capacity also have a greater chance of out-licensing their technology [
53,
54].
Desorptive capacity refers to firms’ capacity to indicate and exploit opportunities for technology transfer, based on their outbound strategies [
47]. This capacity is linked to the firm’s dynamic capacities, meaning that they intentionally generate, increase and change their resource bases. It is also related to the firm’s previous experiences with out-licensing contracts, which in a market characterised by high turbulence, is a major advantage in obtaining lower transaction costs. These competences learned from the firm’s previous technological trajectories are extremely important in turbulent and competitive environments [
47].
According to Shin et al. [
47], and Nonaka [
54], knowledge management processes are differentiated by exploitation, exploration and retention of knowledge so that for firms to be able to retain knowledge from inter-firm collaboration, there must be connection capacity. Connection capacity is related to the alliance and firms’ relational capacities, ensuring licensors’ priority access to external sources of knowledge without complete acquisition. The larger the set of connections and collaborators firms have, the easier the process of managing relations between these external parties tends to be, achieving greater benefits from maintaining external knowledge [
47,
55].
Firms are coming under increased pressure to combine resources from multiple stakeholders due to growing innovation rates, highly complex global supply chains and in a growing context of catastrophes and environmental problems. Moreover, environmental problems can limit the firm’s growth, leading to the attractiveness of sustainable innovations requiring diverse interactions and sources of knowledge [
47,
54]. In addition, in the area of sustainable, environmentally friendly innovation, in particular, to create eco-innovation, the role of the main users and suppliers is crucial. This arises from the basic assumption that eco-innovation results from highly complex, systemic and interlinked processes involving a set of different stakeholders, as well as the interactions of multiple internal and external factors, transmitting practices of inbound, outbound and combined innovation [
56].
2.2. Eco-Innovation
Given the growing concern about the environmental impact of products and their resource-intensive production, a greater number of companies have considered introducing eco-innovation to create simultaneously economic and environmental value [
2,
3,
57]. The concept of eco-innovation relates to organizational sustainability and circular economies [
58]. Fussler and James [
59] were the first to use the term eco-innovation, defining it as a new product or new process that adds value for the business or the client, with a significant reduction in environmental impacts.
The most widely accepted definition of eco-innovation is the one proposed by Kemp and Pearson [
12] and complemented by Horbach et al. [
15], according to whom eco-innovation is the production, application or exploitation of goods, services, production processes, organisational structures or management methods that represent something new for the firm or user over their life-cycle, representing the reduction of environmental risks and pollution, implying the limitation of negative impacts resulting from intensive use of resources, for example, energy, compared to relevant alternative options. Consequently, eco-innovation directed to openness, i.e., open innovation, is related to the creation of innovations that use inbound and outbound flows of knowledge to stimulate internal innovation created with external stakeholders, aiming to have an impact and create value for society and the environment, thereby working at both the micro and macro levels and requiring a flow of knowledge from various actors [
4,
13,
14,
15].
In the scenario of open eco-innovation, the mentality shared between partners is the entry and exit of knowledge and its exploitation to attain objectives intrinsically connected with the ecosystem [
60]. Consequently, at the macro level, i.e., the ecosystem, capturing environmental value involves a broad and complex set of stakeholders, besides producers and consumers, i.e., eco-systemic performance, the global impact, the regional environment and social value [
61]. Here, value includes not only the generation of economic value, but also social and ecological value, for example, improvement in the quality of air and water, preservation of resources, employment growth, reduced pollution and others [
62,
63]. In this connection, at the meso level, i.e., the network level characterised by sharing knowledge and forming partnerships, there is a diversity of organisational cultures, network structures in development and unbalanced power conflicts that can affect decision-making processes at the micro (firm) level, which in turn can also influence the macro level, the environmental and social level [
14].
The systemic nature of eco-innovation requires a multi-faceted knowledge base which is unlikely to exist in one company [
15]. It also needs a network of stakeholders to satisfy the permeability between the firm and the external environment, with each stakeholder having the role of bringing knowledge to be exploited and generating value added for all the partners involved [
60]. This is not just a question of how each stakeholder creates and captures value added, but mainly how the group of partners acts as a knowledge base for the purpose of generating and capturing value among partners linked through a collaborative scheme of open innovation focused on a common context and mission, so as to contribute to an agenda of industrial sustainability [
64,
65].
As eco-innovation is of a multi-faceted nature, the literature has witnessed the emergence of an approach centred on the determinant drivers of eco-innovation, structured in three main branches: (i) market attraction; (ii) technological impulse; and (iii) regulatory effects.
Concerning the perspective of market attraction, previous studies indicate that eco-innovation results from expectations of turnover, the search for new eco-innovations; previous economic performance; and benefits for the consumer [
66,
67,
68,
69].
In relation to the technological impulse, the literature has concentrated on firms’ R&D activities, amount of knowledge capital, organisational systems and management focused on environmental innovations [
66,
70,
71,
72].
Concerning regulatory effects, previous studies were concentrated on the roles of environmental policies and standards for the adoption of eco-innovation [
73]. Regarding this last aspect, this study has a particularly relevant role, in that it contributes to enriching the analysis of the effects of adopting public policies on eco-innovative performance.
Not only the determinants, but also the enablers of eco-innovation have been subject to much debate. For example, the industrial innovation links and inter-firm networks can enable eco-innovation, providing firms with resources that disguise the lack of scale economies [
74]. In addition, partnerships formed with stakeholders outside firms’ supply chain, such as knowledge-intensive business services (KIBS), research institutions, universities and competitors, are even more important for eco-innovation than for other types of innovation [
75]. The same effect is noted in cooperation for innovation in R&D [
76], where universities and business suppliers are indicated as the main partners when considering the impact of eco-innovations.
Of great importance is how firms practising eco-innovation look for external sources of knowledge to be able to innovate, which can be characterised by the extent and depth of the search for knowledge [
35]. The extent corresponds to the set of sources available to firms, noting that eco-innovative firms have wider, more diversified sources, since they need more external sources of knowledge than other innovative firms [
77,
78].
Eco-innovative companies are therefore forced into different regulatory frameworks, which means preparation to cope with knowledge requirements; for example, the need to have scientific knowledge from universities and R&D laboratories about the materials and processes to use, the set of environmental norms to consider when innovating in collaboration with agencies and suppliers’ ability to provide sustainable production inputs. All this diversity in the supply of knowledge reveals the necessary extent of eco-innovation, which cannot be found in just a few knowledge suppliers. Moreover, eco-innovation is polyvalent, requiring a combination of various objectives and their internal harmonization. These diverse objectives cover production efficiency, quality, environmental standards and others, requiring additional sources of knowledge from diverse origins [
18,
19,
79].
It is also important to address the depth of eco-innovations that involve providing depth to external knowledge sources. In the specific case of eco-innovations, external knowledge sources are generally distant from firms’ core business, having access to alternative knowledge, which can be an obstacle to its implementation. So firms must undertake deeper interaction with the acquisition of knowledge, in order to enable absorption and exploitation of viable knowledge [
78]. Eco-innovative companies also have difficulty in finding the right cooperation partner, needing a deeper, sustainable inter-connection after forming the collaboration, which increases the importance of selection and maintenance processes for these firms [
80].
Not only can eco-innovative firms’ search for knowledge sources be difficult, but also management and exploitation of these sources can be complex and costly, in that not only distance is important but also that the shortage of green management competences to exploit them. Here, the absorption capacity of eco-innovative firms, i.e., the innovator’s capacity to detect, acquire and exploit knowledge sources, is fundamental. Social integration mechanisms increase the absorption capacity of eco-innovative firms, through use of their organisational capacities, as occurs with the capacity for connection and socialization, which stimulate communication flows and favour the external spread of knowledge and its very socialization [
8,
81].
2.3. Design of the Research Hypotheses and the Conceptual Model
Based on the discussion present in the literature reviewed above, a renewed research framework was designed regarding inbound and outbound open innovation practices and also public policies, as explanatory variables of eco-innovative performance as the dependent variable. Concerning inbound open innovation practices related to the transmission and internal use of external knowledge, these practices are measured through the intermediary of various (non-pecuniary) sources and also through (pecuniary) acquisition. As for outbound open innovation practices corresponding to external use of internal knowledge, these are measured either through (non-pecuniary) revealing or (pecuniary) selling. The dependent variable is product innovation and process innovation, resulting in eco-innovative performance. In addition, company size and whether in 2010 it belonged to a group of companies are included in the study as control variables.
Returning to inbound practices, concerning sourcing, the empirical study by Ketata et al. [
82] with data on 1.124 German companies reveals that the extent and depth of knowledge sources improve sustainable innovations. Ghisetti et al. [
60], using the CIS 2006–2008 for 11 European countries, obtain similar results, confirming that knowledge sources (extent and depth) are positively associated with the introduction of eco-innovation, but they do not distinguish between the influences of different sources of information.
The interests and needs of all partners in a highly uncertain and complex environment make external knowledge sources particularly important [
82]. According to Laursen and Salter [
35], actors such as suppliers, users and competitors are seen as market sources providing a soft opening, with the share of information without entering into bonding, juridical agreements. Market sources help companies to gather and absorb information about customers’ needs and demand, as well as exploiting information about their competitors’ eco-innovation programmes. Authors such as Geffen and Rothenberg [
83] and Kammerer [
68] mention that knowledge coming from suppliers and customers is relevant for eco-innovation. Regarding the effect of these sources, in both process and product innovation, Marzucchi and Montresor [
84] find that the knowledge coming from suppliers, clients, competitors, industrial associations, fairs and conferences is highly relevant for all types of eco-innovation, but especially for process innovations related to reducing material or energy, as far as end-of-pipe technology or the implementation of ecological products is concerned.
For institutional sources of information based on knowledge arising from science and related more directly to national innovation systems (universities, governments and public research institutes), Bönte and Dienes [
85] detected a significantly positive influence of institutional sources (universities) on eco-innovation. Despite the empirical evidence of a positive influence of knowledge from institutional sources on innovation, only Marzucchi and Montresor [
84] and Del Río et al. [
86] differentiate its effects in terms of process innovation and product innovation. Marzucchi and Montresor [
84] show that these sources influence environmentally efficient technology, such as processes to reduce material or energy consumption, but not the introduction of environmental products. In contrast, Del Río et al. [
86] only find positive influences of knowledge from institutional sources on product innovation.
By forming partnerships with other firms or non-commercial organisations, companies improve their capacity to introduce new processes or products. Those that engage in cooperation gain access to the knowledge or synergistic skills of complementary partners and capitalize on entry spillovers [
87,
88,
89], so that they can have access to technology which otherwise could not be acquired on the market [
90], aiming to reduce the multiplication of R&D efforts; lessen the risks and costs associated with innovation projects [
91]; and obtain economies of scale [
88]. Firms can contribute to creating a strong and densified network of multilevel cooperation and alliances involving all the stakeholders [
92]. Studies on the influence of cooperation in R&D on eco-innovation produce converging results. For example, for De Marchi [
76], cooperation is more important for the introduction of eco-innovations than for any other type of innovation. Collaborative networks with universities and public institutions are also essential stimulants of all types of eco-innovation [
93,
94]. Horbach et al. [
18] observe a significant influence of cooperation in R&D, but only for processes with an environmental benefit for firms related to dangerous substances.
Still in relation to inbound practices, but now concerning acquiring, which is pecuniary entry of innovation, Rouvien [
95] states that the acquisition of new equipment, as a form of incorporated knowledge, should mainly stimulate process innovations. Companies can also gain access to an external knowledge base through developing external R&D sub-contracting operations or acquiring technology from external partners, i.e., via licensing. These operations involve pecuniary exchanges for ideas acquired externally, but can also complement the firm’s internal knowledge, increasing the likelihood of successful exploitation and exploration. Unlike the acquisition of patented licences, external acquisition of R&D is beneficial only if it shows some complementarity to the focal firm’s internal knowledge [
89].
However, empirical evidence of the influence of external R&D on eco-innovation is contradictory. The longitudinal study by Horbach [
67] shows that improved technological capacities through R&D activities triggers eco-innovations. Later, Horbach et al. [
15,
18] find a slightly negative influence, but only in process innovations with environmental benefits in related areas, such as energy, dangerous material and recycling. De Marchi [
76] and Marzucchi and Montresor [
84] do not find a significant influence of acquiring external knowledge, in the form of patents or licences, on eco-innovation. According to Bönte and Dienes [
85] and Li-Ying et al. [
96], firms involved in external R&D are less likely to introduce process innovations regarding energy and material efficiency. That theoretical statement is corroborated by transversal results obtained at the company level which reveal significant complementarities between internal and external R&D for products, but not for process innovations [
97]. In the light of these considerations and previous empirical results, the following research hypothesis is considered:
Hypothesis 1 (H1). Inbound open innovation practices have a positive relation with eco-innovative performance.
Hypothesis 1a (H1a). Non-pecuniary flows of inbound open innovation practices have a positive relation with eco-innovative performance.
Hypothesis 1b (H1b). Pecuniary flows of inbound open innovation practices have a positive relation with eco-innovative performance.
Concerning outbound open innovation practices, previous empirical evidence is very scarce [
98], with this being a neglected issue [
99]. Nuvolari [
100] proposes that companies reveal their ideas to their competitors without any identifiable negative consequence. Through revealing, using a marketing lens, firms can increase their reputation [
101], goodwill [
102], brand recognition [
103] and their target-public [
104].
From the technological point of view, revealing can be beneficial when companies use crowdsourcing as a source of knowledge, instead of trying to solve problems internally or hiring a specialist supplier [
105,
106]. Revealing is also used to obtain feedback from customers [
107], manufacturers and even competitors [
108].
Still, in relation to inbound practices, but regarding selling, which involves pecuniary exchanges and activities such as licensing, Inauen and Schenker-Wicki [
109] find a significant impact on the performance of innovation accompanied by a greater probability of radical innovations that can be critically important for R&D managers. Mazzola et al. [
110] also underline the fact that external licensing produces a positive impact on innovation performance. This leads to the following research hypothesis:
Hypothesis 2 (H2). Outbound open innovation practices have a positive relation with eco-innovative performance.
Hypothesis 2a (H2a). Non-pecuniary flows of outbound open innovation practices have a positive relation with eco-innovative performance.
Hypothesis 2b (H2b). Pecuniary flows of outbound open innovation practices have a positive relation with eco-innovative performance.
Study of the literature on the determinant factors of eco-innovation has highlighted the assumed importance of public policies in designing incentives able to promote strategic conduct and practices tending to reinforce eco-innovation [
15,
111]. Popp [
112] found empirical evidence that firms’ decisions on innovation were stimulated mainly through national regulations, but eco-innovations can also be motivated by international regulations, as in the case of air pollutants in Japan, where the catalyst of eco-innovation was regulations in the United States of America [
113].
Horbach [
67] concluded that public policies and the motivation to make cost savings are the main determinant factors of eco-innovation. Jänicke [
111] argues that intelligent regulations have an important role in political competition for eco-innovation and can be identified as a driver of eco-innovation. The study by Khanna et al. [
114], making a distinction for environmental regulation, proposes that anticipated regulation and the presence of complementary assets are important vehicles for the creation of incentives to innovation. Another important contribution to this debate was made by Kammerer [
68], by revealing that the effects of regulations on innovation vary according to the area of environmental impact. Therefore, a distinction should be made between eco-innovations aiming to improve the energy efficiency of materials and the reduction of greenhouse gas emissions (GGE), contributing to improved recycling or reducing negative environmental impacts on the water and the soil. More recently, Ghisetti and Rennings [
115] and Triguero et al. [
116] indicate the positive effect of public support in the form of subsidies for firms adopting environmental innovation. Leitão et al. [
117], in the context of Portuguese high-tech companies, also find a positive effect of public policies. This leads to the following hypothesis:
Hypothesis 3 (H3). Public policies have a positive relation with eco-innovative performance.
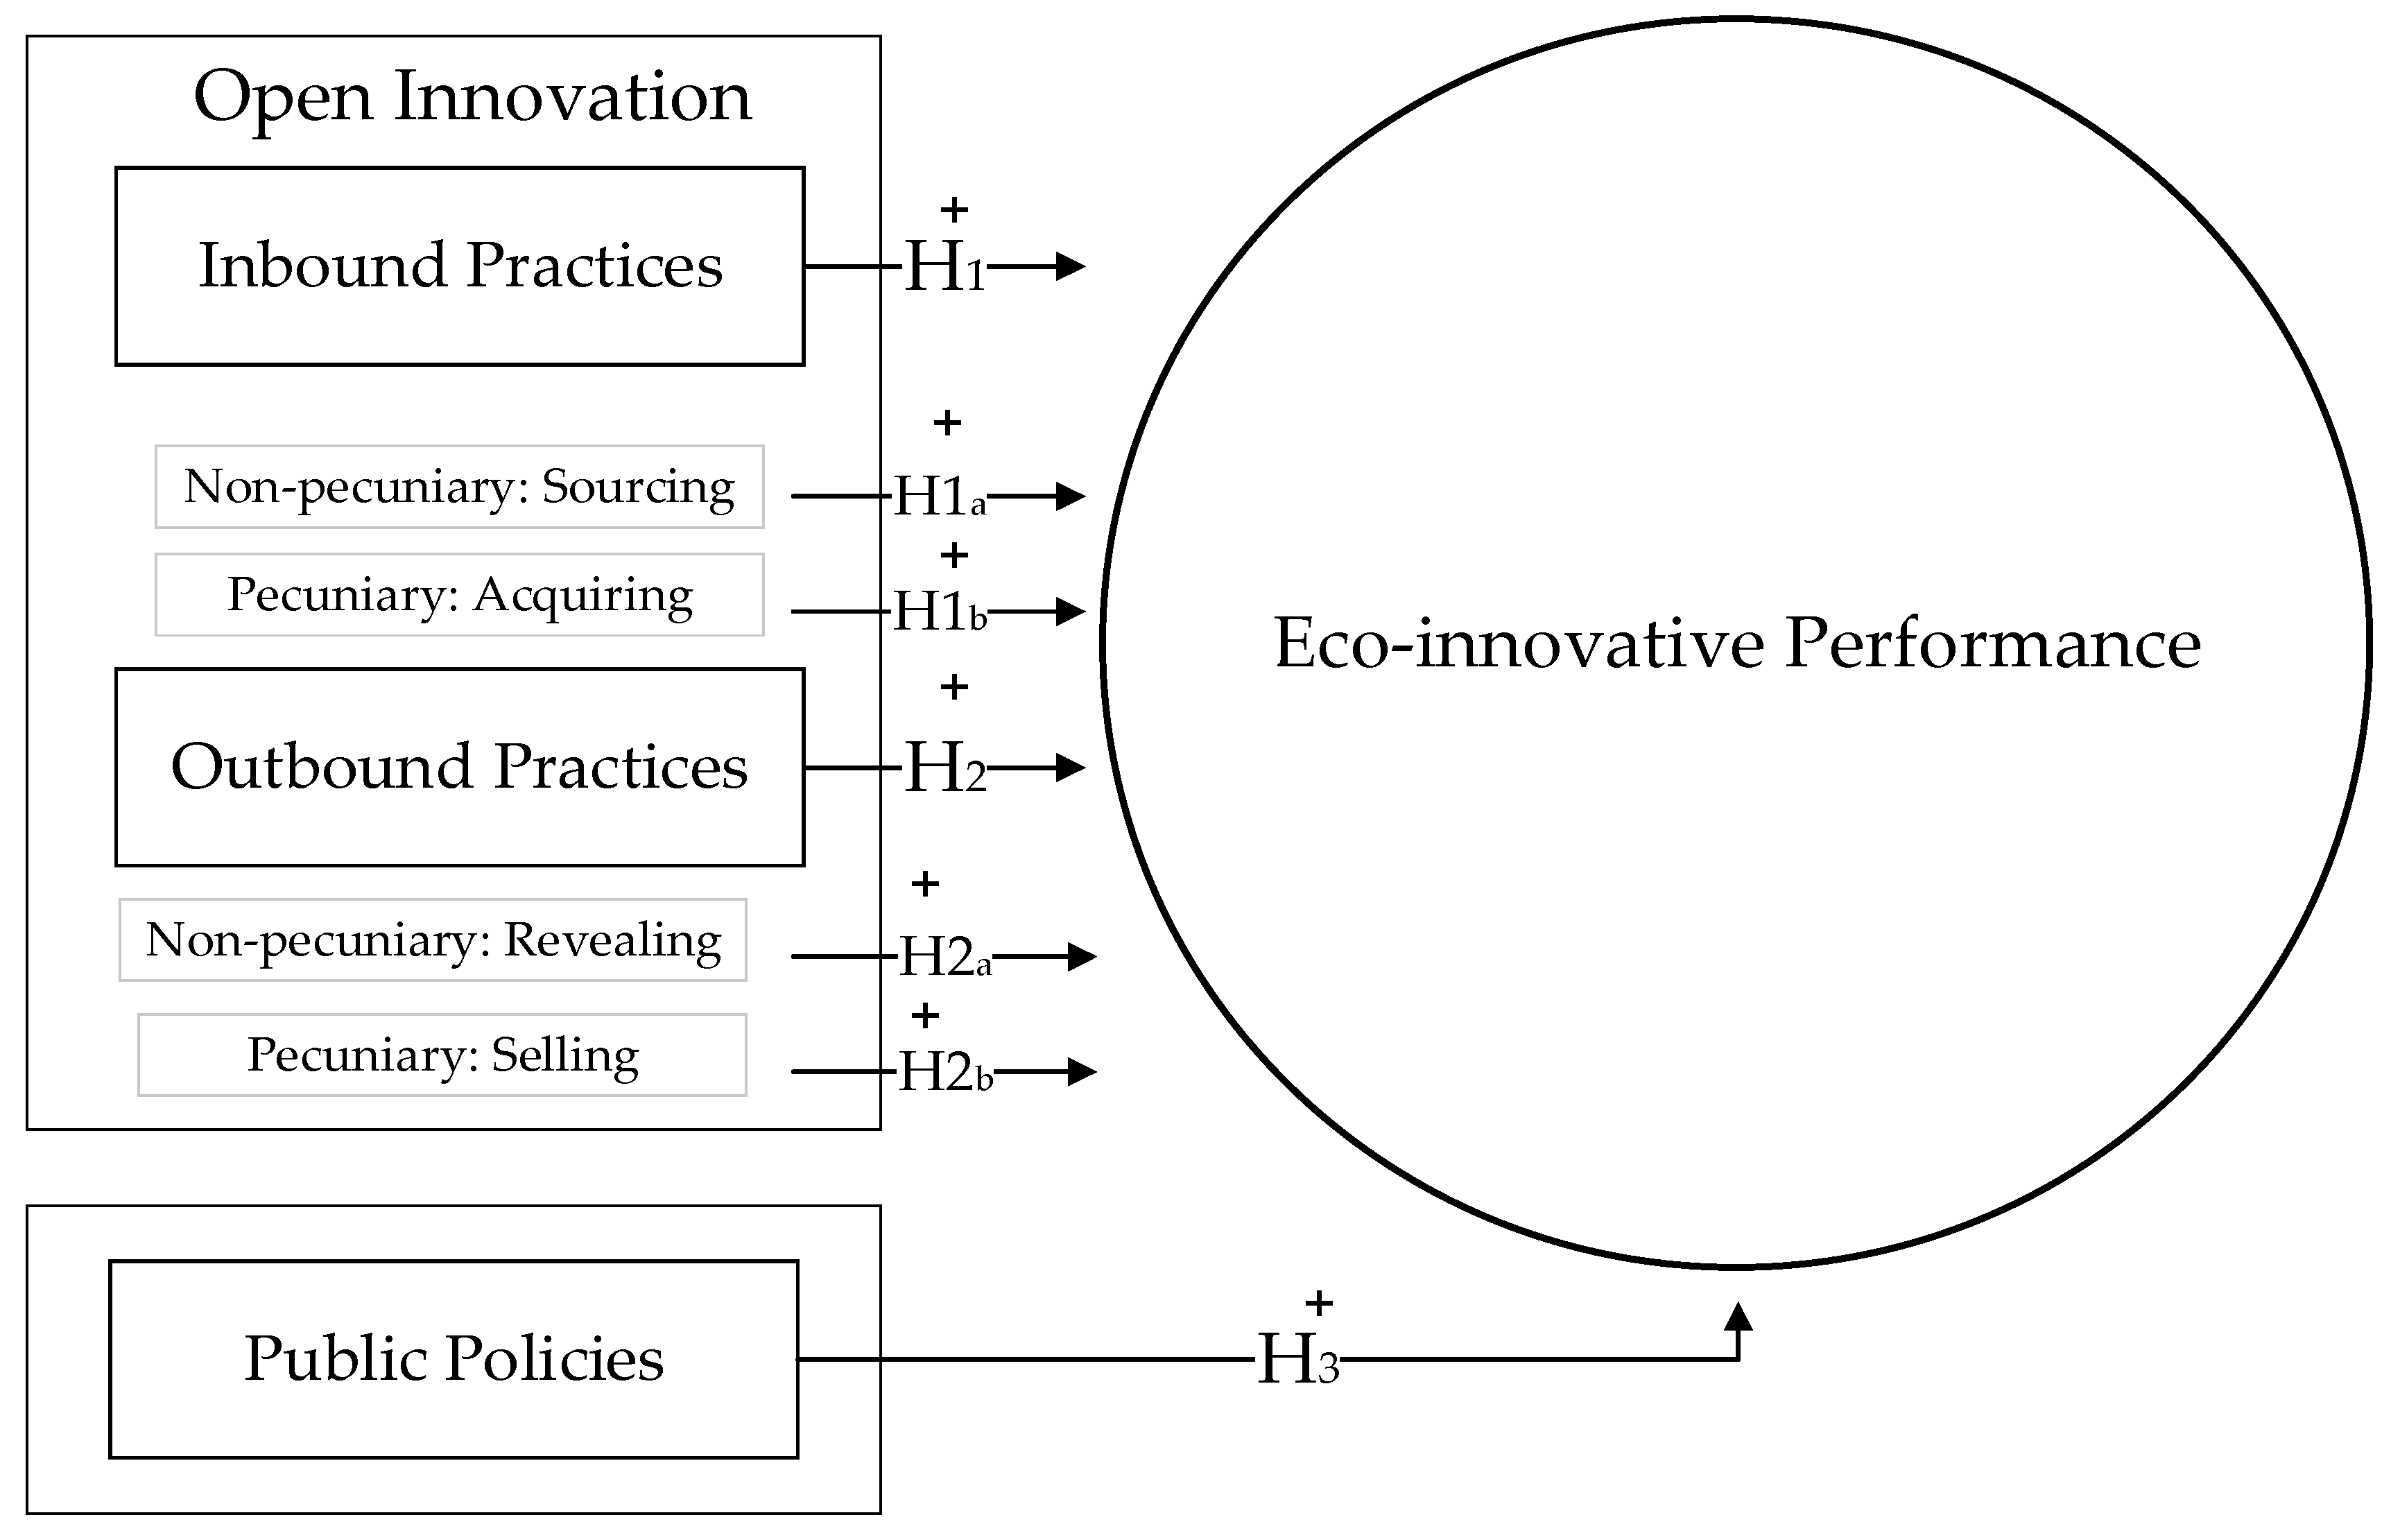
Considering the complexity of the theoretical references reviewed and the set of previous empirical evidence,
Figure 2 proposes a conceptual model of analysis, which aims to simplify the analysis framework developed in the following section of this study, exploring the relations between the inbound and outbound practices of open innovation, public policies and eco-innovative performance.
3. Methodology
3.1. Database and Sample
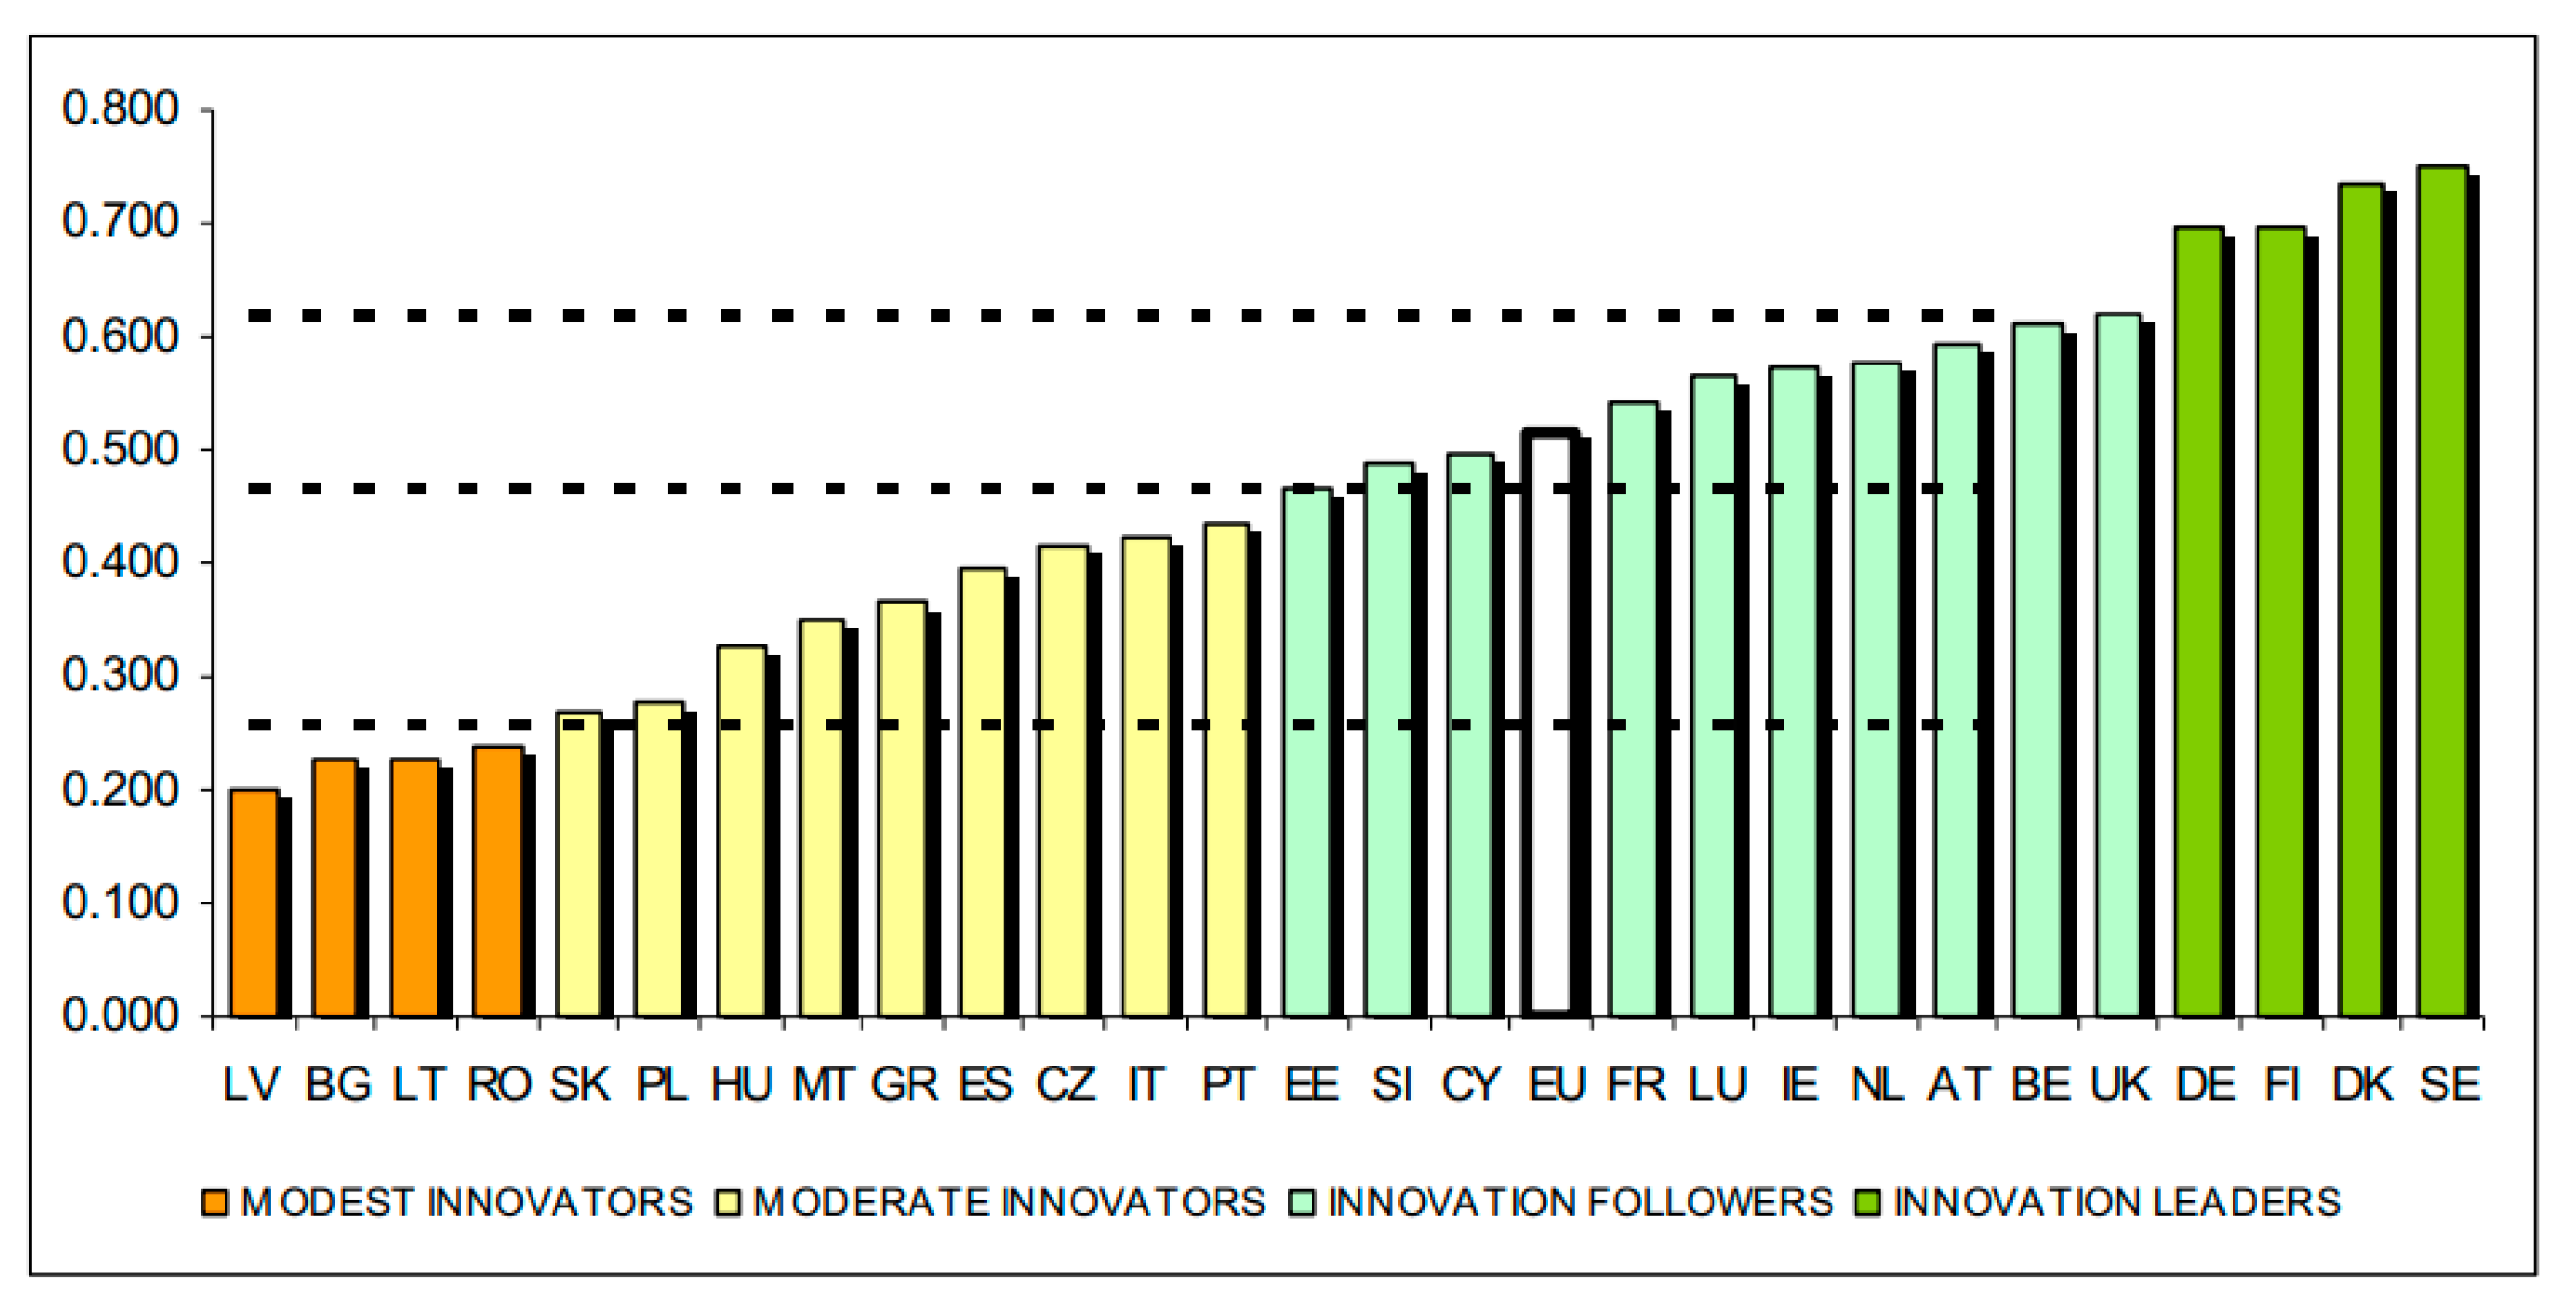
The database used for this research corresponds to the Community Innovation Survey 2010, which provides information about sectors’ innovation capacity according to firm type, about the different types of innovation and various aspects of an innovation’s development, such as objectives, information sources, public financing, expenditure on innovation, etc. The data available are used to produce samples for European Union (EU) member states considered moderate innovators, according to the results of the 2010 edition of the Innovation Union Scoreboard. In the empirical test, only the available data from CIS 2010 were used, for a group of moderate innovators (cf.
Figure 3), namely: Slovakia (SK); Spain (ES); Hungary (HU); Italy (IT); Portugal (PT); and the Czech Republic (CZ). For that reason, it was not possible to include the other countries in the group, namely: Greece (GR); Malta (MT); and Poland (PL).
Analysis of the bio-economy has attracted growing interest among academics [
118,
119,
120] policy-makers [
121,
122] and institutions of international reference, including the European Commission [
123]. This justifies the focus of the present empirical study on the bioeconomy sector, with the available data being used to produce six samples of firms related to the bioeconomy, located in: Slovakia; Spain; Hungary; Italy; Portugal; and the Czech Republic. Following the official statistical classification of economic activities in the EU (NACE rev. 2), the total sample was divided into “bioeconomy firms”; and “non-bioeconomy firms” (see
Table A1, in
Appendix A). It is noted that bioeconomy covers the production of renewable biological resources and the conversion of these resources and waste flows into products with value added, such as food, animal fodder, biological-based products and EU bio-energy [
123]. The bioeconomy requires vast amounts of biomass that current value chains cannot provide [
124].
For better understanding of the total samples and the sub-samples of bioeconomy and non-bioeconomy firms,
Table 1 shows the number of “bioeconomy firms” and “non-bioeconomy firms”, as well as presents their composition in relation to firm size. The Slovakian sample contains 2363 companies of which 343 are bioeconomy firms and 2050 non-bioeconomy firms; the Spanish sample is made up of 34,550 firms, 6279 being bioeconomy and 28,271 non-bioeconomy; the Hungarian sample contains 4683 firms, 1228 being bioeconomy and 3410 non-bioeconomy; the Italian sample contains 18,328 firms, 2280 being bioeconomy and 16,048 non-bioeconomy; and the Portuguese sample contains 6060 firms, 1223 being bioeconomy and 4937 non-bioeconomy. The sample of 5151 Czech firms is made up of 1435 bioeconomy firms and 3716 non-bioeconomy. In general, both bioeconomy and non-bioeconomy firms are small or medium-sized.
The sub-samples of “bioeconomy firms” and “non-bioeconomy firms” were tested empirically, using multivariate tobit regression models, considering the research hypotheses resulting from the previous literature review and the subsequent design of the conceptual model proposed here.
3.2. Variables and Model Specification
This study focuses on the effects of inbound and outbound practices of open innovation and public policies on eco-innovative performance. Therefore, the variables of “Reduce the material and energy used by unit produced” (ORME) and “Reduce the environmental impact” (OREI), with the original designation (in brackets) of the variables of CIS 2010, are the dependent variables resulting in eco-innovative performance. These are polytomous variables that analyse the importance, in the period 2008 to 2010, of the firm introducing innovative products and processes, i.e., equal to 0, if the introduction of new or significantly improved products or processes was irrelevant; equal to 1 if the introduction of product or process innovation was of low importance, and 2 if the introduction of new or significantly improved products or processes was of medium-high importance.
As for the independent variables, this research used the variables associated with inbound and outbound practices of open innovation as well as public policies. Besides the dependent and independent variables, included as control variables were: size (SIZE_3); and group (GP). For the size variable (SIZE_3), firms with up to 50 employees are small firms, those with between 50 and 249 employees are medium-sized and those with 250 or more employees are large firms. The group variable (GP) can determine the influence of belonging to a group of firms.
As already mentioned, to estimate the proposed model and test empirically the research hypotheses and the conceptual model, this study adopted the tobit regression model. The tobit regression model developed by Tobin [
125] belongs to a class of econometric techniques traditionally considered as censored regression models [
126], having been projected to estimate relations between variables when there is censor on the left or right of the dependent variable. The tobit model can be written as a latent regression model y
xβ
ε with a continuous result that is observed or not observed. Following Cong [
127], the result observed for the observation
i is defined as:
where:
a is the lower censor limit and
b is the upper censure limit. The tobit model assumes that the error term follows normal distribution; ε∼ N (0;
). Depending on the issue in question, the amount of interest in a tobit model can be the censored result
or the result without censor
Amemiya [
128] extended the univariate tobit model to the multivariate model, creating the MVTOBIT, its usefulness lying mainly in that dependent variables are determined as a whole. In this study, the tobit multivariate model is used to explain two types of eco-innovation: process eco-innovation:
; and product eco-innovation:
. The multivariate tobit assumes that the density of articulation function behaves with a normal multivariate distribution with a mean of zero, constant variances and a constant correlation between the error terms. Using the MVTOBIT command on STATA the parameters β are estimated using the maximum likelihood method.
The variables in the conceptual model are presented in
Table 2 below.
4. Results
The multivariate tobit model was estimated for the sub-samples of bioeconomy and non-bioeconomy for the moderately innovative countries. For each sub-sample, the dependent variables identified and described above (ORME and OREI) were used. It is noted that for better understanding of the data, descriptive statistics were calculated for both sub-samples of the different countries studied, but they are not presented here to limit the length of the document. The VIF (Variance Inflation Factor) was also calculated, and according to Hair et al. [
129], as values of
VIF < 10 were obtained, potential problems of multicollinearity are not identified.
The estimation process began with the test of a univariate tobit model, which was found to be statistically significant for all sub-samples and countries represented here. For example, 313 bioeconomy firms in Slovakia show a logarithmic likelihood of −131.113 (ORME) and −127.207 (OREI); with a
p value of 0.000 and 0.000, respectively, corroborating that the models are statistically significant. For the 2050 non-bioeconomy firms in Slovakia, with a logarithmic likelihood of −1068.832 (ORME) and −1158.779 (OREI) and the
p value of 0.000 and 0.000, the models are also statistically significant. The same model, i.e., univariate tobit, is seen to be statistically significant when considering the other countries, and the same goes for the multivariate tobit model which is statistically significant for the sub-samples and all the countries studied (cf.
Table 3)
Assuming that all the models are statistically significant, the results found are now presented, according to the response axes expressed in the research hypotheses, opting to present only the results of estimating the multivariate tobit model, for two reasons. Firstly, the dependent variable being tested for different values, and secondly, not finding substantial differences in the results obtained and in the associated levels of statistical significance and maximum likelihood.
Continuing to present the results for the multivariate tobit (
Table A2 in
Appendix B) and beginning with Slovakian bioeconomy firms, inbound practices are significant and have a positive influence on process (ORME) and product (OREI) innovation. Outbound practices involving a non-pecuniary flow do not show significant evidence. Pecuniaries are significant and have a positive effect on process (ORME) and product (OREI) innovation. As for public policies, these show mixed significant evidence in process innovation (ORME), with the FUNLOC variable having a positive influence and the FUNGMT variable having a negative influence. In product innovation (OREI), public policies are significant and have a positive effect. Firm size (SIZE) is only significant with a positive influence on product innovation (OREI), with no evidence regarding process innovation (ORME).
The results for Slovakian non-bioeconomy firms show that non-pecuniary inbound practices are significant and have a positive influence on process innovation (ORME), but for product innovation (OREI) the evidence is mixed. Also non-pecuniary inbound practices are significant, but the evidence is mixed for both process (ORME) and product (OREI) innovation. Non-pecuniary outbound practices do not present significant evidence for either type of innovation, but pecuniaries are significant with a positive influence on process (ORME) and product (OREI)innovation.
Public policies and company size (SIZE) are significant and have a positive influence on process (ORME) and product (OREI) innovation
The results for Spanish bioeconomy firms demonstrate that inbound practices are significant with a positive influence on process (ORME) and product (OREI) innovation. Non-pecuniary outbound innovation practices do not present evidence of their behaviour, whereas pecuniaries have a significant influence on both types of innovation. Public policies have a positive significant relation with process innovation (ORME) with mixed evidence regarding product innovation (OREI). The fact of a company belonging to a group (GP) has a positive influence on process (ORME) and product (OREI) innovation.
The results for Spanish non-bioeconomy firms are almost identical to those found for bioeconomy firms, except for the fact of a firm belonging to a group (GP) not presenting evidence of significance for process innovation (ORME), despite having a significantly positive influence on product innovation (OREI).
The results for Hungarian bioeconomy firms indicate that inbound practices have a positive and significant influence on process innovation (ORME) and product innovation (OREI). Regarding non-pecuniary outbound practices, there is no evidence of their behaviour and pecuniaries are significant and have a positive influence on both innovations. Public policies are significant and have a positive influence on process (ORME) and product (OREI) innovation. The fact of a company belonging to a group (GP) has a positive influence on process innovation (ORME), but this is not found for product innovation (OREI).
The results for Hungarian non-bioeconomy firms indicate that inbound practices have a positive and significant influence on process innovation (ORME) and product innovation (OREI). As for outbound practices, these influence process innovation (ORME) positively and significantly, but there is no evidence of their effect on product innovation (OREI). Pecuniary outbound practices are significant with a positive influence on process (ORME) and product (OREI) innovation. Public policies present mixed evidence on process innovation (ORME) and although significant have a negative influence on product innovation (OREI). Company size (SIZE) is significant and shows a positive influence on process (ORME) and product innovation (OREI).
The results for Italian bioeconomy firms show that non-pecuniary inbound practices have a positive, significant influence on process (ORME) and product (OREI) innovation. Regarding pecuniary inbound practices, these are significant and have a positive influence on process innovation (ORME) with the evidence being mixed for product innovation (OREI). Non-pecuniary outbound practices show no evidence, whereas pecuniaries are significant with a positive influence on both types of innovation. As for public policies, these are significant with a positive influence on process innovation (ORME), with the evidence being mixed for product innovation (OREI). Company size (SIZE) is significant and has a positive influence on both process (ORME) and product (OREI) innovation.
The results for Italian non-bioeconomy firms show that inbound practices are significant and have a positive influence on process (ORME) and product (OREI) innovation. Non-pecuniary outbound practices show no evidence, while pecuniaries are significant with a positive influence on both types of innovation. As for public policies, these are significant, having a positive influence on process (ORME) and product (OREI) innovation. Firm size (SIZE) is significant and has a positive influence on both process (ORME) and product (OREI) innovation, but the fact of a firm belonging to a group (GP) is significant and has a negative influence on product innovation (OREI).
The results for Portuguese bioeconomy firms show that inbound practices are significant and have a positive influence on process (ORME) and product (OREI) innovation. Non-pecuniary outbound practices do not show statistical evidence, while pecuniaries are significant and have a positive influence on both types of innovation. As for public policies, these present mixed evidence regarding process innovation (ORME) and product innovation (OREI). For firm size (SIZE) and belonging to a group (GP), no significant evidence is found.
The results for Portuguese non-bioeconomy firms reveal that non-pecuniary inbound practices are significant and have a positive influence on process (ORME) and product (OREI) innovation. In addition, pecuniary inbound practices are significant and with a positive influence on process innovation (ORME), while for product innovation (OREI) the evidence is mixed. Non-pecuniary outbound practices show no evidence with associated statistical significance, while pecuniaries are significant and have a positive influence on both types of innovation. As for public policies, these show no evidence in relation to process innovation (ORME), while for product innovation (OREI) the evidence is mixed. Firm size (SIZE), is significant and has a positive influence on process (ORME) and product (OREI) innovation.
The results for bioeconomy firms in the Czech Republic show that inbound and outbound innovation practices are significant and have a positive influence on process (ORME) and product (OREI) innovation. As for public policies, these are significant and have a positive influence on both types of innovation. Firm size (SIZE) is significant and has a positive influence on process innovation (ORME), but regarding product innovation (OREI) no significant evidence was found.
The results for Czech non-bioeconomy firms show that inbound practices are significant and have a positive influence on process (ORME) and product (OREI) innovation. Non-pecuniary inbound practices show no evidence of their behaviour, whereas pecuniaries are significant and have a positive influence on both types of innovation. As for public policies, these are significant and have a negative influence on both types of innovation. Firm size (SIZE) is significant and has a positive influence on process (ORME) and product (OREI) innovation.
In general, the results of the multivariate tobit suggest that inbound practices, involving either non-pecuniary or pecuniary flows, have a positive influence on eco-innovative performance. It should be noted that the results obtained for the multivariate tobit suggest non-pecuniaries show mixed evidence, as occurs with non-bioeconomy firms in Slovakia. Regarding outbound practices, these also have a positive influence on eco-innovative performance, but those involving non-pecuniary flows only reveal a significantly positive influence for bioeconomy firms in Slovakia and also for non-bioeconomy firms in Hungary and only in relation to process innovation. As for public policies, these show a positive influence on eco-innovative performance, despite detecting various cases of mixed evidence and even a negative influence. Besides the above, the multivariate tobit also suggests that size (SIZE) has a positive influence on eco-innovative performance. A summary of the results is presented in
Appendix B,
Table A2. For a more detailed analysis, consult
Table A3,
Table A4,
Table A5,
Table A6,
Table A7 and
Table A8, also in
Appendix B.
5. Discussion
After presenting the results, they will now be discussed in relation to the research hypotheses. Considering Hypothesis H1, proposing a positive effect of inbound open innovation practices on eco-innovative performance. This hypothesis is confirmed for the bioeconomy and non-bioeconomy sub-samples and for all countries studied. H1 is not rejected, since for the different countries various significant variables stand out. For example, for Slovakia, sources of information from competitors or other firms in the same sector of activity (SCOM) on the sourcing side, and acquisition of other external knowledge (ROEK) on the acquiring side, are always significant, whether focusing on process or product innovation, or bioeconomy or non-bioeconomy firms. For Spain, all the sources considered in this study, i.e., sources of information in competitors or other firms in the same sector of activity (SCOM); consultants, laboratories or private R&D institutions (SINS) State laboratories or other public bodies (SGMT); information from scientific journals and technical/professional publications (SJOU) and professional or business associations (SPRO) on the sourcing side, and external acquisition of R&D activities (RRDEX) and acquisition of machinery, equipment and software (RMAC) on the acquiring side, are always significant, whether focusing on process or product innovation or bioeconomy or non-bioeconomy firms. In Hungary too, sources of information in competitors or other firms in the same sector of activity (SCOM) on the sourcing side, and external acquisition of R&D activities (RRDEX), as well as the acquisition of machinery, equipment and software (RMAC) on the acquiring side, are always significant, whether focusing on process or product innovation, or bioeconomy or non-bioeconomy firms. In Italy, sources of information in competitors or other firms in the same sector of activity (SCOM); consultants, laboratories or private R&D institutions (SINS) information from scientific journals and technical/professional publications (SJOU) and professional or business associations (SPRO), on the sourcing side, and external acquisition of R&D activities (RRDEX) and the acquisition of machinery, equipment and software (RMAC), on the acquiring side, are always significant in process or product innovation, for both types of firms. In Portugal, sources of information in competitors or other firms in the same sector of activity (SCOM); consultants, laboratories or private R&D institutions (SINS) information from scientific journals and technical/professional publications (SJOU) and professional or business associations (SPRO) are always significant, in process or product innovation and in bioeconomy or non-bioeconomy firms. In Portugal, on the acquiring side, the acquisition of machinery, equipment and software (RMAC) has a significantly positive effect on eco-innovation, considering the results of the multivariate tobit model. For the Czech Republic, sources of information in scientific journals and technical/professional publications (SJOU) on the sourcing side, and the acquisition of machinery, equipment and software (RMAC) on the acquiring side, are always significant in process or product innovation and whatever the type of firm considered.
The results are in line with previous studies by Geffen and Rothenberg [
83] and Kammerer [
68], who state that knowledge coming from suppliers and clients is relevant for eco-innovation. Bönte and Dienes [
85] also mention that institutional sources (universities) have a significant influence on eco-innovation. At the same time, considering the result of De Marchi [
76], who underlines that cooperation is more important for the introduction of eco-innovations that other types of innovation, the results obtained here contribute to ratifying the importance of cooperation for eco-innovation. This claim is supported by the following variables: cooperation with firms in the same group (CO11); clients or consumers (CO31); competitors or other firms in the same sector of activity (CO41); consultants, laboratories or private R&D institutions (CO51); universities or other higher education institutions: (CO61); State laboratories or other public bodies with R&D activities (CO71). For inbound practices, on the acquiring side, Rouvinen [
95] argues that the acquisition of new equipment, as a form of incorporated knowledge, should encourage mainly process innovations.
Hypothesis H2 assumes a positive relation between outbound open innovation practices and eco-innovative performance. A positive effect is confirmed for bioeconomy and non-bioeconomy firms. In greater detail, on the revealing side, for Slovakia, Spain and Portugal, there is no significant evidence in favour of revealing, but for Italy, the results indicate a negative relation and for Hungary and the Czech Republic the results indicate a positive relation. Therefore, the results are in line with Nuvolari [
100], who concludes that firms reveal their ideas to their competitors with no identifiable negative consequence. On the selling side, highlighted are variables such as R&D activities carried out in the firm (RRDIN); new or significantly improved goods (INPDGD); new or significantly improved services (INPDSV); among others. So the results agree with the previous findings of Cassiman and Veugelers [
130], who state that when firms invest more in internal R&D activities, they become more prepared to absorb external knowledge, and therefore, innovate.
Horbach [
67], Kesidou and Demirel [
131], Horbach et al. [
15] and Triguero et al. [
94] are examples of studies agreeing with the third hypothesis of this research, i.e., public policies have a positive relation with eco-innovative performance. In this study, H3 is not rejected for bioeconomy and non-bioeconomy firms.
6. Conclusions
This study analyses the effects of inbound and outbound open innovation practices and public policies on eco-innovative performance, for bioeconomy and non-bioeconomy firms in moderately innovative countries. Inbound practices consider the non-pecuniary flows corresponding to sourcing and the pecuniary flows corresponding to acquiring, while outbound practices consider the non-pecuniary flows corresponding to revealing and pecuniary flows corresponding to selling.
In terms of general results, inbound practices of the sourcing and acquiring type, outbound practices of the revealing and selling type and public policies show a positive relation with eco-innovative performance. Concerning inbound practices of the sourcing type, for bioeconomy firms, from the results obtained, all the sources considered in this study, i.e., sources of information in competitors or other firms in the same sector of activity (SCOM); consultants, laboratories or private R&D institutions (SINS) State laboratories or other public bodies (SGMT); information from scientific journals and technical/professional publications (SJOU) and professional or business associations (SPRO) are significant for both process and product innovation (see the results, for example, for bioeconomy firms in Spain and Portugal.
Cooperative relations are also incorporated in inbound practices of the sourcing type, revealing that for bioeconomy firms, cooperation with firms in the same group (CO11) is only positive in product innovation in Portugal and cooperation with universities or other higher education institutions (CO61) and negative in process innovation in Slovakia. For inbound practices of the sourcing type, and for non-bioeconomy firms, the results are similar, for example, in the specific case of Spain, all the sources considered in this study are positive and significant, for both process and product innovation.
Still for inbound practices, but of the acquiring type and for bioeconomy firms, it should be noted that external acquisition of R&D activities (RRDEX) is positive and significant in both process and product innovation, as shown by the results for Slovakia and Hungary, although for Italy the results show a significantly negative influence, for both types of innovation. Also, for inbound practices of the acquiring type, but for non-bioeconomy firms, the acquisition of machinery, equipment and software (RMAC), they always show a positive and significant influence on process and product innovation.
Regarding outbound practices, the revealing mode for bioeconomy firms operationalized through non-financial incentives for employees to develop new ideas, such as: free time and recognition (MNFIN); this is seen to be significant and positive for both process and product innovation as observed from the results for the Czech Republic. Considering outbound practices, the revealing mode for non-bioeconomy firms through non-financial incentives for employees to develop new ideas, such as: free time and recognition (MNFIN); is also significant and positive, in terms of process and product innovation, observed through the results obtained for Hungary.
For selling mode outbound practices and for bioeconomy and non-bioeconomy firms, R&D activities carried out in the firm (RRDIN); and new or significantly improved goods (INPDGD) show a positive and significant relation in both process and product innovation.
The empirical evidence now obtained sheds new light and provides both theoretical and empirical contributions to the positive and significant influence of open innovation outbound practices on eco-innovation; in particular, the pecuniary flows, since for non-pecuniary ones, it was only possible to detect a positive relationship for the cases of Bioeconomy companies of the Czech Republic and non-Bioeconomy companies of Hungary, which are two examples of transition economies with an upward innovative profile on the pathway to the maturity of open innovation processes.
These results advance the still limited knowledge about the importance associated with the implementation of open innovation outbound practices on the eco-innovative performance of companies belonging to a strategic sector, worldwide; that is, the Bioeconomy sector, since the previous empirical evidence regarding this sector, with increased strategic importance in the face of global climate change, are still scarce or even neglected in the literature and references on open innovation.
As for public policies, public financial support coming from Local or Regional Administration (FUNLOC) is shown to be significant and positive for both process and product innovation, as confirmed for Spain and Italy. Besides the influences described above, size and the fact of the firm belonging to a group, they also produce a significantly positive influence on process and product innovation.
This study has some implications. In terms of theory, it improves understanding of inbound and outbound practices. For example, besides considering sourcing, inbound practices also consider acquiring, and besides considering revealing, outbound practices also incorporate selling.
Regarding implications for innovation managers, they should consider the need to balance internal and external knowledge that improves environmental performance, because as argued by Rothaermel and Alexandre [
132], the level of ambidexterity can allow firms to configure and raise their internal and external knowledge resources, in terms of the influence of technology supply strategies on environmental performance. Concerning public policies, public financing bodies should consider the results presented here, for example, in decision-making processes that imply the allocation of funds for activities aiming for open eco-innovation.
One of the main limitations of this study arises from the lack of information observed in successive surveys from CIS 2012 until the most recent CIS 2018, particularly for the variables referring to eco-innovative performance. Another limitation is the lack of studies of reference addressing the effects of, above all, outbound practices on eco-innovative performance. Another concerns the analysis being limited to bioeconomy and non-bioeconomy firms, as industrial and service companies could also be interesting, considering their prominence in economies.
Finally, in terms of future research, it would be interesting to study in greater depth the effects associated with inbound and outbound open innovation practices and public policies on the eco-innovative performance of firms with different profiles of technological intensity, based on a comparison between modest, moderate, follower and leader countries in innovation.


