1. Introduction
Over the past few decades, the concept of innovation has become a hot research topic [
1]. The Organization for Economic Cooperation and Development (OECD) constantly accentuates the potential for innovation at both national and firm levels for the long-term economic growth [
2]. Innovation has been the central interest of entrepreneurs and policymakers for firms’ growth and economic development, and it is considered that market competition is an important determinant of firms’ inducement to innovate [
3]. Development of innovation is also required because of the rise in global competition, rapid technical changes, uncertainty, changing customer demands and shorter product lifecycles. Therefore, considerable attention has been received by innovation for securing a sustainable competitive advantage [
4,
5]. According to Gunday, Ulusoy, Kilic and Alpkan [
6], every kind of innovation (process, product, marketing and organizational innovation) has a positive influence on operational performance. Therefore, companies must create new products, services and processes for competing in an ever-changing environment, and must adopt innovation as a way of life for getting dominance. According to Long, Abdul Aziz, Kowang and Ismail [
7], innovation must be added to the essential organizational performance metrics. There are several studies that demonstrate the impact of innovation on business performance. In those studies, identification of the drivers (actual practices employed by organizations) that determine innovation was an underscored issue [
8]. In order to outpace the global competition, and ensure sustainable competitive advantage, companies must innovate incrementally and radically in processes and technology rather than just managing the existing products and services [
9]. Most studies have focused on process and product innovation, despite there being various other typologies of innovations [
10]. The core of process innovation is to maximize the production processes’ flexibility, minimize production costs and improve the products’ quality [
11]. Process innovation is about significant changes in production and delivery methods [
5] and this process innovation is supplemental to product innovation [
12].
There are different useful practices that can promote process innovation (PI) individually and effectively, and function as a mechanism to increase a company’s competitive advantage [
13]. However, PI in manufacturing organizations is not at a satisfactory level due to change in customer expectations, growing demand for innovativeness, volatility in market, increasing complexity and uncertainty, autocratic leadership style [
14,
15], rapid technological changes and shorter product lifecycles in the current era of intense global competition [
16,
17]. One important possible cause is the issue of limited resources which can be tangible as well as intangible and lack of effective strategic planning. Given the scarcity of valuable resources, firms must find ways of efficiently deploying such resources [
18]. Therefore, it becomes a difficult task for manufacturing organizations to efficiently manage their scarce resources and place simultaneous efforts on all the practices that exert impact on process innovation. In the literature, there appears an obvious gap regarding the contribution of drivers to PI, and the effect carriers between drivers and PI [
9]. Research studies have examined these practices in bits and pieces, highlighting the research gap where none of the studies have discussed all the influential practices in a single study to measure the relationships among key practices that affect PI [
11,
19]. Through searching in peer-reviewed databases and to the best of authors’ knowledge, there is a dearth of literature that evaluates which practices are critical in the evaluation of PI and this area remains unexplored. The current study would fill this gap by identifying the drivers and mediators as well as their roles and contributions to the process innovation.
Specifically, current research aims to study three things. First, to determine the associations between lean manufacturing (LM), organizational culture (OC), human resource management (HRM), total quality management (TQM) and supply chain management (SCM) and between the TQM, SCM and PI; second, to examine if TQM and SCM play a mediating role between LM, OC, HRM and PI; third, to analyze the proposed model to elucidate the relationships among LM, OC, HRM, SCM, TQM and PI through empirical examination. Thus, the research study would establish some very unequivocal guidelines for the practitioners seeking process innovation in their organizations. The knowledge gained would assist operational managers in understanding the enabling practices of PI to achieve long-term operational performance, and thereby achieving competitiveness in performing daily operational activities. The recommended strategies will set a benchmark for manufacturing organizations, and would leave a room for improvement in their operations. This study would also contribute to the existing body of knowledge of the best practices that influence PI. Scholars and academicians may find this information useful to be considered as a reference for further research on PI implementation in the manufacturing organizations.
This paper commences with a literature review that looks into the present state of LM, HRM, OC, SCM, TQM and PI. Then for testing the proposed model, empirical research using structural equation modelling follows. The final sections present the findings, implications and future recommendations.
2. Literature Review and Hypotheses Development
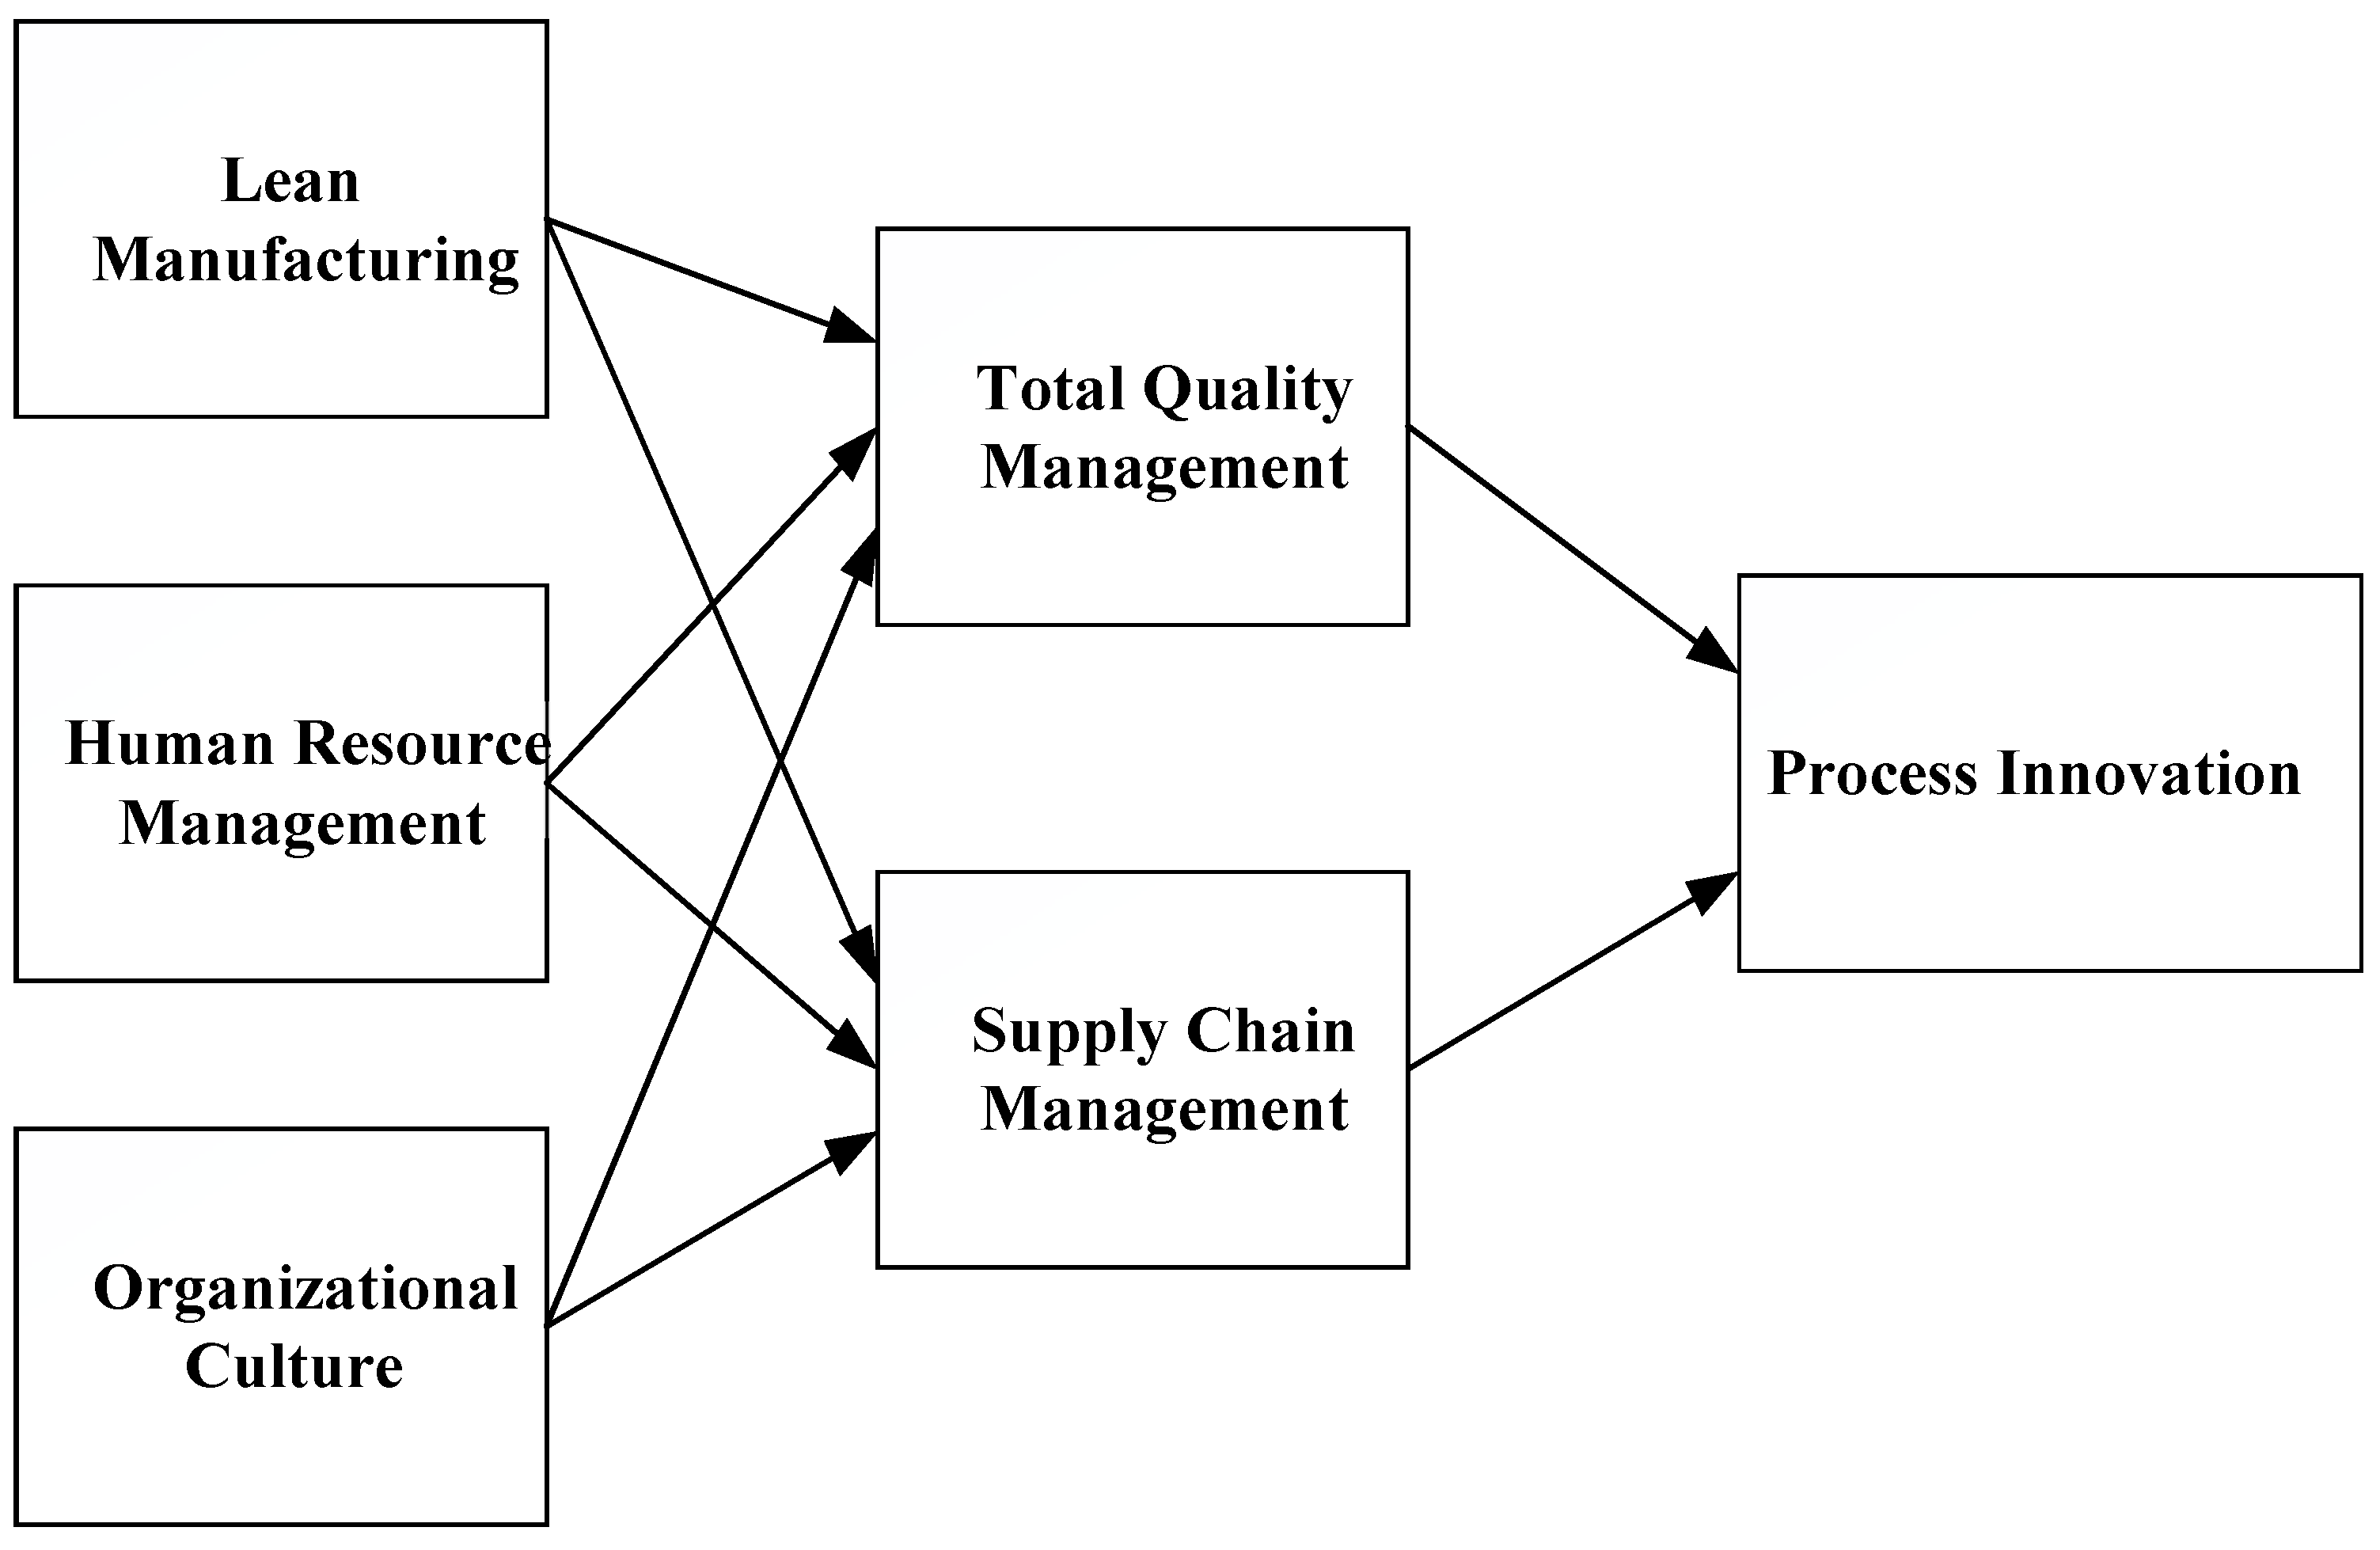
What we do, affects the outcome, so the link between practices and process innovation is an analytic truth, not a synthetic statement worth empirical scrutiny. However, this is not a challenge. The challenge is in justifying and examining which practices have a competitive value. The typical dependent variable in a practice-innovation study is some kind of process innovation. Different practices influencing process innovation in manufacturing organizations have been identified from the existing literature along with the theoretical grounds for the purpose of framework construction. Based on the literature review, the importance of LM, HRM, OC, TQM and SCM to PI can be established, and we argue that these interrelated variables can affect PI. In the following subsections, we establish the relationships between LM, HRM, OC, TQM, SCM and PI as portrayed in the proposed model in
Figure 1. In this model, there is an integration of different studies that hold certain parts of the model separately. For instance, numerous studies suggest the direct effects of LM, HRM and OC on PI [
2,
5,
9,
20,
21], while our study considers TQM and SCM as explanatory variables through which LM, HRM and OC affect PI. Likewise, many studies have reported the effects of TQM and SCM on PI [
7,
22,
23,
24], while our study considers LM, HRM and OC as the drivers of TQM and SCM in enhancing firm’s process innovation.
2.1. Lean Manufacturing and Total Quality Management
Lean philosophy, originated in 1950 by Toyota, is characterized by improvement in system flow, application of only value-adding steps and time and elimination of waste. The goal of Lean Manufacturing (LM) is minimized defects and inventories, increased efficiency and product variety, and it continuously eliminates waste through problem-solving [
25]. Implementation of LM leads to a reduction in human effort, product development time and manufacturing space up to 50% and improvements in quality up to 500%. Various management practices focusing on quality, waste reduction and supplier management are included in the multidimensional approach of lean production [
26].
On the other hand, quality is a powerful strategic weapon for competing internationally. According to R.Y.Y. Hung et al. [
22], TQM is about enhancing employees’ involvement, reforming corporate culture and continual improvement in quality for getting organizational specific goals. Prajogo and Sohal [
10] pointed out that the greatest influential dimensions of TQM are top management commitment, continuous improvement, employee participation and customer focus. Reed, Lemak and Mero [
27] showed that various TQM researchers had agreed on five TQM practices which are leadership, training, team, customer focus and culture. TQM practices can be categorized into mechanistic or hard elements and organic or soft elements. Customer focus, strategic planning, process management and analysis are included in mechanistic elements while people management and leadership are included in organic elements [
28].
The tool of lean behavior in the form of 13 lean practices realized the world-class quality [
29]. LM and just-in-time (JIT) terms are often used interchangeably because both have the same practices [
30,
31]. In fact, the Americanized version of JIT is LM, and has become more prevalent [
30]. According to Kannan and Tan [
32], all JIT practices are significantly correlated to TQM practices. It has been found that JIT is the foundational antecedent to TQM considering the ultimate goal of fulfilling customer requirements [
33], for JIT affects TQM practices by minimizing the cycle time variation and lead times [
34]. Similarly, Phan, Nguyen, Nguyen and Matsui [
35] confirmed a significant relationship between JIT and TQM. Aoun, Hasnan and Al-Aaraj [
36] also corroborate that, in general, lean practices have a significant and positive influence on TQM. Therefore, it is hypothesized that:
Hypothesis 1 (H1). LM is positively associated with TQM.
2.2. Lean Manufacturing and Supply Chain Management
SCM practices gained popularity in the 1990s when there was intense competition in delivering products and services at a low cost. SCM practices are the activities that encourage efficient management of supply chain, and bring benefits for all the members of supply chain [
37]. SCM activities are used to proficiently integrate the suppliers, manufacturers, warehouses, transporters, retailers and customers [
38]. Nowadays, the real competition is not between the organizations but among the supply chains of organizations [
39]. As SCM practices interact with each other, therefore, they must be employed as an integrated scheme [
40]. Petrovic-Lazarevic, Sohal and Baihaiqi [
41] also confirmed that SCM practices cover both upstream and downstream aspects of SCM.
LM has been implemented in different economic sectors for improving competitiveness in recent decades. There is a need to address the deployment of LM practices and principles across the supply chain [
42]. LM help achieves efficient transactions and communications among suppliers and customers, and hence develop supply chain relationships [
43]. In this perspective, spreading lean practices throughout the supply chain is important for deriving the potential benefits of LM [
44]. Since LM is the systematic elimination of waste out of an organization’s operations, the role of LM, a long-term philosophy, cannot be denied in achieving world-class SCM performance [
38]. Therefore, in order to strengthen the operational expertise in a global environment, companies should manage lean principles by configuring their supply chain globally [
45]. As a matter of fact, the concept of lean is very common in SCM to achieve maximum benefits from a supply chain in a highly responsive market. Considering the foregoing arguments, the following hypothesis can be formulated.
Hypothesis 2 (H2). LM is positively related with SCM.
2.3. Human Resource Management and Total Quality Management
Many scholars consider HRM as a field of study that enriches expertise at individual, team, organization and societal levels, intending to improve performance at each level [
46]. Based on the literature, the HRM construct is represented by a group of five dimensions, that are, benefits and compensation, training and education, communicative management style, employee development and selection [
47]. According to Pfeffer and Jeffrey [
48], HRM practices include employment security, careful/selective hiring, high reimbursement, decentralization, extensive training and sharing of information throughout the organization. Due to these good routines, skilled and talented personnel are retained in an organization [
49,
50].
Yang [
51] stated that synergy among all the above-mentioned HRM practices is very critical for the TQM implementation in an organization. The ‘training and education’ dimension of HRM has the greatest influence on TQM implementation followed by benefits and compensation and employee development and selection. In order to successfully implement TQM, Gunasekaran [
52] presented seven major strategies, out of which six are related to HRM. Vanichchinchai [
43] also proved that the most common enhancers of TQM are the HRM practices. Therefore, it can be asserted that HRM department has a central role in the successful implementation of TQM, and, moreover, better organizational results are produced because of productive cooperation between HRM and TQM. The result of multiple regression analysis by Tawalbeh and Jaradat [
53] also demonstrate that HRM practices have a statistically significant impact on TQM implementation. Thus, the current study assumes that HRM is positively associated with TQM. Therefore:
Hypothesis 3 (H3). HRM is positively related with TQM.
2.4. Human Resource Management and Supply Chain Management
HRM improves SCM practices because the actions of individuals contribute toward SCM success. In this regard, job description flexibility, organization of the team, teamwork training and performance indicators have a significant relationship with SCM performance [
46]. Smith–Doerflein et al. [
47] claimed that a suitable HRM system is a significant constituent for effective supply chain implementation. According to Madani and Wajeetongratana [
54] and Khan, Taha, Ghouri, Khan and Ken [
55], HRM practices are the significant determinants of SCM strategies in a company, and there is an increase in the value-added chain because of motivated and trained employees as part of HRM. Furthermore, integration of human resource and supply chain management creates a value chain system, and develops a unique strategy to gain a competitive advantage. SCM success is activated and enhanced by implementing sophisticated HRM practices [
55]. HRM, in terms of compensation’s impact on retention of managers, has emerged as a top priority in SCM in this rising globalization [
56]. Menon [
57] found that human resource practices of a flexible job description and team management and teamwork are significantly connected to satisfaction with supply chain performance. Thus, in view of these arguments, we propose:
Hypothesis 4 (H4). HRM is positively related to SCM.
2.5. Organizational Culture and Total Quality Management
Organizational culture (OC) is the common values, norms and beliefs among the organization’s members, and the way in which people think and behave. It is the personality of an organization which makes it unique in the eyes of insiders and outsiders. OC guides members of the company in daily work activities [
58]. It is agreed that when employees feel good, they will do better. That is why business leaders always want to create such type of organizational culture/corporate culture in which there is enjoyment, flexible working hours and creativity. Many important characteristics of an OC are tacit, highly complex and difficult to imitate. The OC is characterized by five dimensions: Learning and development, collaboration and support, contribution in decision making, forbearance for conflicts and risk and power-sharing [
59]. According to Zu, Robbins and Fredendall [
60], the sharing of values, beliefs, pattern and assumptions by the members represent OC.
OC plays a critical role in receiving acceptance, and facilitating initiatives like TQM implementation [
58]. Gimenez-Espin, Jiménez-Jiménez and Martinez-Costa [
61] have rightly pointed out that OC is one of the most important variables in the success or failure of TQM implementation. An organizational culture, possessing features of adhocratic and clan culture, called intermediate or mixed culture has a higher positive impact on TQM practices because the variables of continual improvement and customer orientation are present in both adhocratic and clan cultures. Hybrid internal and external orientation is included in this mixed culture to promote flexibility. P. M. Lee, Khong, Ghista, and Rad [
62] also claimed that there should be collaborated OC for TQM to be succeeded. According to Zu et al. [
60], group, developmental, hierarchical and rational cultures are four different types of culture in an organization. All types of culture except hierarchical culture have a significant positive influence on different TQM practices’ implementation. Empirical evidence showed that OC fits best with TQM system and is the significant determinant of TQM success. So, policies of managing the business and development of TQM practices are shaped by beliefs and values underlying an OC. Thus, this study hypothesizes:
Hypothesis 5 (H5). Organizational culture is positively associated with TQM.
2.6. Organizational Culture and Supply Chain Management
In the field of operations management, the most important concept is supply chain management (SCM). Consideration of different organizational culture types is conducive for implementing SCM in an organization as the organizational culture can specify the related suppliers, employees, customers and competitors [
63]. There are different supply chain strategies (SCS) in a company, and for effective implementation of any kind of strategy, they should be aligned with a particular OC. For example, efficient SCS is suitable in a hierarchical culture, rational culture naturally supports responsive SCS, risk-hedging SCS practices are used in a group culture, and, implementation of agile SCS is supported in case of developmental culture [
64]. Among the four profiles of OC, the flatness profile is characterized by four OC cultures: development, rational, group and hierarchical, and three supply chain integration (SCI) dimensions: supplier, customer and internal integration. Cao, Huo, Li and Zhao [
65] conclude that organizational culture, specifically its developmental and group categories, positively influence all three dimensions of supply chain integration. Moreover, rational culture is positively linked with internal integration, while hierarchical culture is negatively related to internal as well as with customer integration. Therefore, it is necessary for managers to assess and adjust OC for supply chain integration. Put in other words, critical dimensions of cultural orientation play a significant role in the successful implementation of SCM, and there must be consistency between cultural dimensions and SCM strategies [
66]. Thus, this study hypothesizes:
Hypothesis 6 (H6). Organizational culture is positively connected with SCM.
2.7. Total Quality Management and Process Innovation
Innovation is the most important element to boost the economy of a country [
3]. Innovation means offering new products and services or continue old ones at a much lower cost for enhancing the performance of an organization. For an individual, firm or industry, a perception that an idea, offering or process is new is called innovation [
1]. There are two major innovation types: technological, which comprises process and product innovations, and nontechnological, which includes marketing and organizational innovations [
67]. The most common dimensions of company innovation are process innovation and product innovation [
11]. The process innovation, which is the concern of the current study, is about implementing improved or new delivery or production methods, and the core of process innovation is the optimization of the sequence of the production procedures [
11]. It can assist an organization in reducing its production cost, improving production volume and enhancing environment-friendly production [
68].
TQM practices are helpful in generating an environment that supports innovation. In order to launch and develop new products or services, companies need to be innovative in an effort to match the customer needs and expectations at best [
28]. TQM practices promote innovation in an organization acting not only as the foundation but also a vital catalytic agent of the innovation. The principal function of TQM is the development of organizational culture and a fertile environment in which employee involvement is encouraged, which, in turn, leads to process improvement, quality advancement, knowledge creation and process innovation. The various TQM practices critical to innovation success are leadership, customer focus, process focus, employee focus, quality focus and continual improvement [
22]. Previous empirical studies also confirm that innovation is significantly influenced by elements of TQM [
69,
70]. According to Long et al. [
7], people management, process management and customer focus are the most influential among different TQM practices that have positive impact on innovation. In this study, TQM practices collectively explained 75.8% variance of the innovation. Likewise, V.-H. Lee and Ooi [
71] proved that TQM implementation would bring improvement in process innovation. In the same way, R.Y.-Y. Hung, Lien, Fang and McLean [
72] confirm that TQM practices have direct effect on both product innovation and process innovation. According to Antunes, Quirós and Justino [
73], TQM practices provide the conditions for adopting PI strategies. In reality, TQM works as a vehicle for an organization in order to become innovative [
74]. So, based on the literature review, the following hypothesis is proposed in this study:
Hypothesis 7 (H7). TQM practices are positively related with PI.
2.8. Supply Chain Management and Process Innovation
In these days of competitive markets, SCM is one of the main drivers to enhance the economic performance and control costs of a firm. The different SCM practices such as strategic partnership with suppliers, link with customers, information sharing, IT, internal operations and training productively sway firms’ innovation (product innovation and process innovation) regardless of whether the firms are located in developed or developing countries [
23] (Chong et al., 2011). In a study by Soosay, Hyland and Ferrer [
75], R
2 value demonstrated that SCM practices in both the upstream and downstream supply chain explained 58.9% innovation [
24]. Consequently, this study hypothesizes that:
Hypothesis 8 (H8). SCM practices are positively related to PI.
2.9. The Mediating Roles of TQM and SCM between LM and PI
In the entire supply chain, lean thinking is very important because it eliminates waste, produces more with less, and hence increase competitiveness [
76]. Therefore, LM, JIT and TPS are also used interchangeably because of their same practices. In manufacturing organizations, there is a positive and moderate to strong impact of lean practices on process innovation which in turn enhances operational performance [
9]. Abdallah et al. [
25] claimed that LM practices are more linked to incremental or continuous innovation rather than radical innovation, and there is a direct link between LM and process innovation.
Based on the literature review, the importance of LM, TQM and SCM to PI can be established, and previous studies have examined how these important firm practices are related to PI [
23,
33,
42,
68]. Although, the previous studies have not examined the interconnected nature of these practices, particularly in terms of how they relate to one another and PI. However, we argue that LM is coupled with TQM and SCM practices of firms, that sequentially influence firms’ process innovation. So, we propose the following two hypotheses based on the above-mentioned arguments:
Hypothesis 9 (H9). TQM mediates the relationship between LM and PI.
Hypothesis 10 (H10). SCM mediates the relationship between LM and PI.
2.10. The Mediating Effect of TQM and SCM between HRM and PI
Employees can detect potential improvements and initiate innovations because of their frequent contact with products and processes [
21]. HRM practices facilitate innovation in an organization and the innovation being developed mediate the association between HRM and performance [
46]. Different HRM practices like employment security, training, intrinsic and extrinsic rewards, compensation and benefits are more conducive to innovation [
20]. Arvanitis, Seliger, and Stucki [
77] also confirmed that HRM practices are strongly linked to innovation propensity or inclined towards innovation. Job security, reward, training and development, task composition, autonomy and feedback are the best HRM practices for encouraging innovative work behavior, therefore, it can be deduced that individuals are the cornerstone of every innovation [
21].
As mentioned above, the effect of HRM on TQM, SCM and PI, and the effect of both TQM and SCM on PI were examined separately [
54,
78]. Nevertheless, our study considers that TQM and SCM can be intermediaries in the relationship between HRM and PI. In other words, it can be reasoned that HRM leads to TQM and SCM, and which, in turn, cause to improve PI. Thus, this study poses the following hypotheses:
Hypothesis 11 (H11). TQM mediates the relationship between HRM and PI.
Hypothesis 12 (H12). SCM mediates the relationship between HRM and PI.
2.11. The Mediating Effect of TQM and SCM between OC and PI
Since organizational culture influences the behavior of employees, it causes employee acceptance for innovation. When empirically tested, organizational culture turns out to be a key determinant of firm innovation [
65]. There are different types of culture in an organization that affect the implementation of different practices. Adhocracy, clan, market and hierarchy cultures are different types, out of which adhocratic culture specifically is the best predictor of innovation because it stimulates creativity, initiative, entrepreneurial mindset, risk-taking attitude and is externally oriented [
5]. Innovation is the key to organizational survival and different layers (like norms, innovative behavior and artifacts) of organizational culture support innovation [
2]. It has also been observed from previous studies that a single culture type is not suited for the overall organizational effectiveness, but there must be a mixed culture [
35]. On the basis of evidence supported by the studies, a culture can act as an obstacle against innovation or it can foster it [
63]. Furthermore, significant characteristics of OC are highly complex, tacit and difficult for the competitors to imitate, therefore, OC can be a source of distinguished advantage [
5].
As mentioned above, several studies suggest the direct effect of OC on PI. Similarly, numerous studies focus on the effects of TQM on PI [
22,
70], and the impacts of SCM on PI [
23,
24]. Implicitly, the preceding discussion suggests that TQM and SCM mediate the relationship between OC and PI. Specifically, organizations can use OC application to cultivate the level of TQM and SCM, which, in turn, would enhance PI. Consequently, this study proposes TQM and SCM as explanatory variables through which OC affects PI. Therefore, we hypothesize as follows:
Hypothesis 13 (H13). TQM mediates the relationship between OC and PI.
Hypothesis 14 (H14). SCM mediates the relationship between OC and PI.
The hypotheses developed here can be portrayed into a model as demonstrated in
Figure 1.
3. Methodology
3.1. Research Design
In order to empirically test the proposed hypotheses, a statistical technique ‘Structural Equation Modelling’ (SEM) using Analysis of Moment Structures (AMOS
®) 24 was used. There are 2 components of SEM: Confirmatory Factor Analysis (CFA), to validate the measurement model between observed and unobserved variables; and Path Analysis (PA), to fit the structural model with the latent variables [
79]. In the first evaluation, there is a testing of indicators’ validity while the second evaluation stipulates the mode by which a particular latent variable causes change in the other latent variable either directly or indirectly [
80]. This 2-step approach ensures that only the constructs that have a good measure will be used in the structural model. Between the hypothesized model and the sample data, a goodness-of-fit was found out in SEM. Fitness of measurement and structural models were assessed through 3 measures, which were, relative Chi-square ratio over degree of freedom (
), Goodness of Fit Index (GFI) and Root Mean Square Error Approximation (RMSEA).
3.2. Sample and Procedure
In order to collect data for model validation and hypotheses testing, a questionnaire was employed as a measurement tool to receive responses on a 5-point Likert scale (1 = Strongly disagree to 5 = Strongly agree). It was structured into 2 sections, namely, demographic profiles of the respondents and scale for the measures. The population of this study comprised industrial segments of Pakistan: large-scale textile; cement; and sugar industries. Presidents, CEOs, directors or managers of different functional areas and senior supervisors of Pakistani companies from various industrial sectors were the titles of key informants, and it was expected that respondents were very knowledgeable for answering the survey questionnaire. Emails, post and personal visits to respondents were used for the distribution of questionnaires. A total of 1143 respondents were approached employing convenient sampling technique. Several measures were taken to ensure that the sample was reasonably representative including collecting data in large amounts and approaching all from CEOs/directors to supervisors. The survey was circulated, and responses were received between October 2019 and March 2020. Until the end of the data collection period, 606 of them responded at a rate of 53%.
Table 1 shows the results of the analysis of demographics. Analysis of demographic information of the respondents from three different kinds of industries observes that: 71% were textile organizations, 20% were sugar organizations and 9% of organizations were from cement industry. Upper-level managers (including presidents, CEOs and directors) were 67 (11%) and middle-level managers (including managers of different functional areas and senior supervisors) were 539 (89%). Further, 116 (19.1%) of respondents possessed less than or equal to 10 years of experience, 432 (71.3%) had 11–20 years of experience, whereas 58 (9.6%) of the respondents had more than 20 years of experience.
3.3. Measures
The questionnaire employed established scales from the existing literature as detailed in
Appendix A. We used 5 items in the criteria to measure process innovation. These criteria were: determining and eliminating nonvalue-adding activities in production, decreasing variable cost, increasing output quality in manufacturing, determining and eliminating nonvalue-adding activities in delivery and increasing delivery speed. These measures were derived from a previous empirical study of Gunday et al. [
6]. The reported Cronbach’s alpha was 0.86. The organizational culture was assessed using a 5-item scale from Ke and Wei [
59] with internal consistency of 0.88. While we adopted a 16-item scale for TQM from R.Y.Y. Hung et al. [
22] with reliability value of 0.92. Whereas, we measured LM using 13 items [
26]. The stated value of Cronbach’s alpha was 0.94. Similarly, the measure for HRM has comprised of 12 items derived from a previous study [
51]. The internal consistency value of 0.89 shows enough reliability of the items. Finally, we used a 9-item scale based on previous research of Koh, Demirbag, Bayraktar, Tatoglu and Zaim [
81] to measure SCM. Cronbach’s coefficient alpha was 0.91. Originally, there were 12 items but 3 items were removed in the study because of the low loading coefficients.
Table 2 shows the measurement scales and the corresponding references for each construct.
4. Data Analysis and Results
4.1. Descriptive Analysis
The descriptive statistics for LM (Lean Manufacturing), HRM (Human Resource Management), OC (Organizational Culture), TQM (Total Quality Management), SCM (Supply Chain Management) and PI (Process Innovation) have been presented in
Table 3. For LM, the mean value was 3.72 and standard deviation was 0.61. The mean and standard deviation of HRM was 3.62 and 0.59, respectively. While the mean of OC was 3.67, with a standard deviation of 0.61. TQM obtained a mean of 3.68 and standard deviation of 0.53. For SCM, the mean was 3.64 and standard deviation was 0.49. Finally, the mean and standard deviation of PI were 3.65 and 0.55, respectively. Assessment of kurtosis and skewness showed that data were normally distributed. Most of the values were less than 10 for Kurtosis and −1.0 to +1.0 for skewness, indicating adequate ranges for normality [
79].
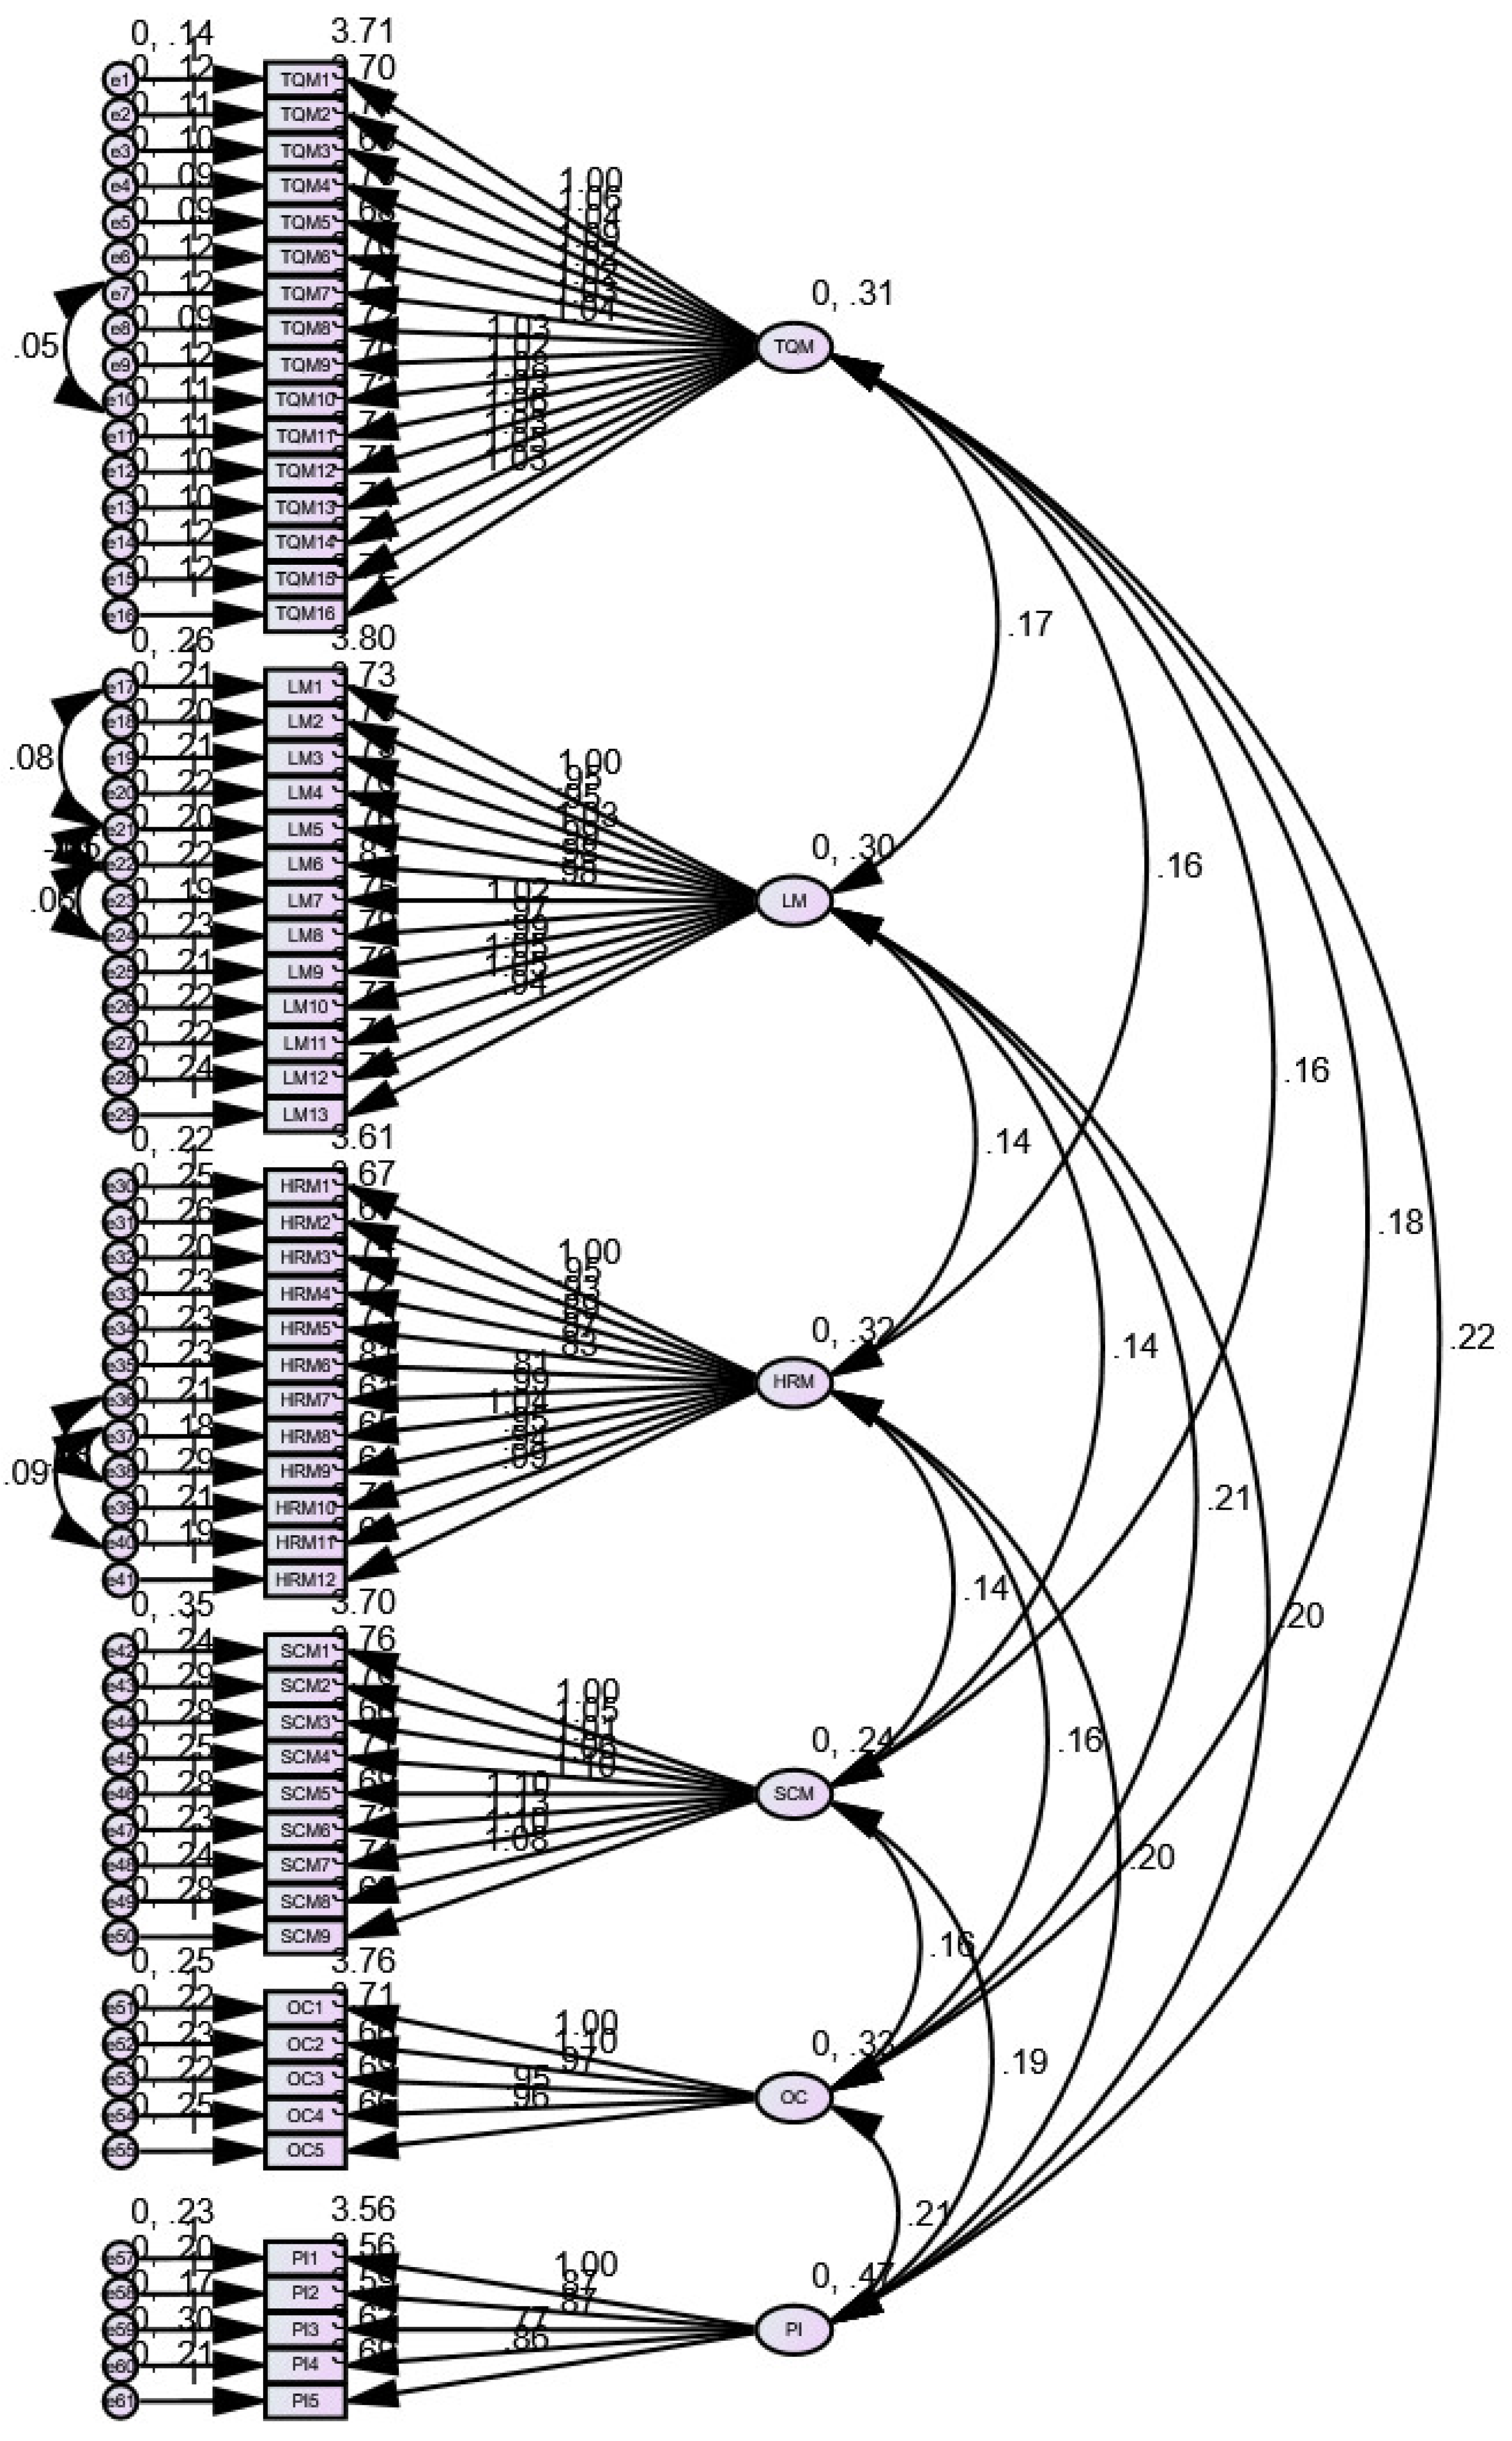
4.2. Measurement Model
There can be some sort of measurement error in measuring the abstract and theoretical concepts. The measurement model of SEM is a footstep for reducing this error. Therefore, CFA is recommended because of its foundation on a theory elucidating measurement error and testing for unidimensional model. Accordingly, CFA was conducted to test the validity of the six measures by observing the factor structure of variables as shown in
Figure 2. The study employed the estimation method of maximum likelihood (ML) which confirms uni-dimensionality of the constructs if all items load dominantly on their corresponding factors, and hence establishes validity. The measurement model has been illustrated in
Figure 1, whereas Cronbach’s alpha values for the scale reliability and outcomes of the CFA are shown in
Table 4.
4.2.1. Model Fit
Model fit is used to evaluate whether the model fits the data appropriately or not. By employing several different tests given below, goodness-of-fit of the model to data has been assessed. From the goodness-of-fit indices, there is an indication of model acceptance.
Chi-square value (CMIN) is the discrepancy measure amid the hypothesized model and the empirical data. It is not used for measuring the model fitness because it depends on sample size. However, ratio of CMIN/DF is computed for this purpose, and the ratio ≤2 means a well-fitted model, ratio = 3–5 indicates acceptable fit and while ratio ≥5 signifies that the value is not acceptable. Goodness-of-fit index (GFI ≤ 1) is where the relative variance amount in the sample covariance matrix is measured. There is a perfect fit if the value is 1. As sample size increases, GFI tends to be larger. There is an indication of good fit if GFI > 0.95 and an acceptable fit if GFI < 0.65. In covariance structure modeling, the most informative criterion is root mean square error of approximation (RMSEA). Its value < 0.05 shows a good fit, and values from 0.08 to 0.10 signify average fit and above 0.10 specifies a poor fit. The model under consideration demonstrates a satisfactory fit as the normed chi-square ) = (4640.002/1689) = 2.75 (<3.00), RMSEA = 0.054 and GFI = 0.796, signifying acceptable unidimensionality for the constructs.
4.2.2. Reliability of the Variables
Cronbach’s alpha is used for measuring the internal consistency or how closely a set of items are aligned. Cronbach’s alpha value is between 0 and 1; higher internal consistency in case of higher value [
82]. Cronbach’s alpha values of the measures, listed in
Appendix B, are above the threshold value of 0.70 showing that the measures in this research have good reliability.
4.2.3. Construct Validity
Validity is another condition after reliability analysis to evaluate the goodness of a measure. In the present study, the construct validity has been established after confirming the face validity, convergent validity and discriminant validity. As measurement items were adopted from the past studies, so face validity has been established. After deleting three items of SCM (see footnote of
Appendix A for details) due to low loading coefficients, CFA results for the rest of the items have been shown in
Appendix B. The convergent validity was established because all the items were significant at
p < 0.001 with loadings more than 0.50 ranging from 0.635 to 0.885 on their underlying constructs and all the constructs had AVE values above the set criterion of 0.5 [
83]. Discriminant validity measures the extent of unique difference among measures of different latent variables or the verification that items of different variables are truly evaluating those variables. It is computed by comparing the square root of shared AVE of latent constructs with the respective inter-construct correlation estimates. It can be observed from
Table 4 that square roots of AVE estimates are greater than their corresponding inter-construct correlations, hence good discriminant validity is reflected from the current measurement model.
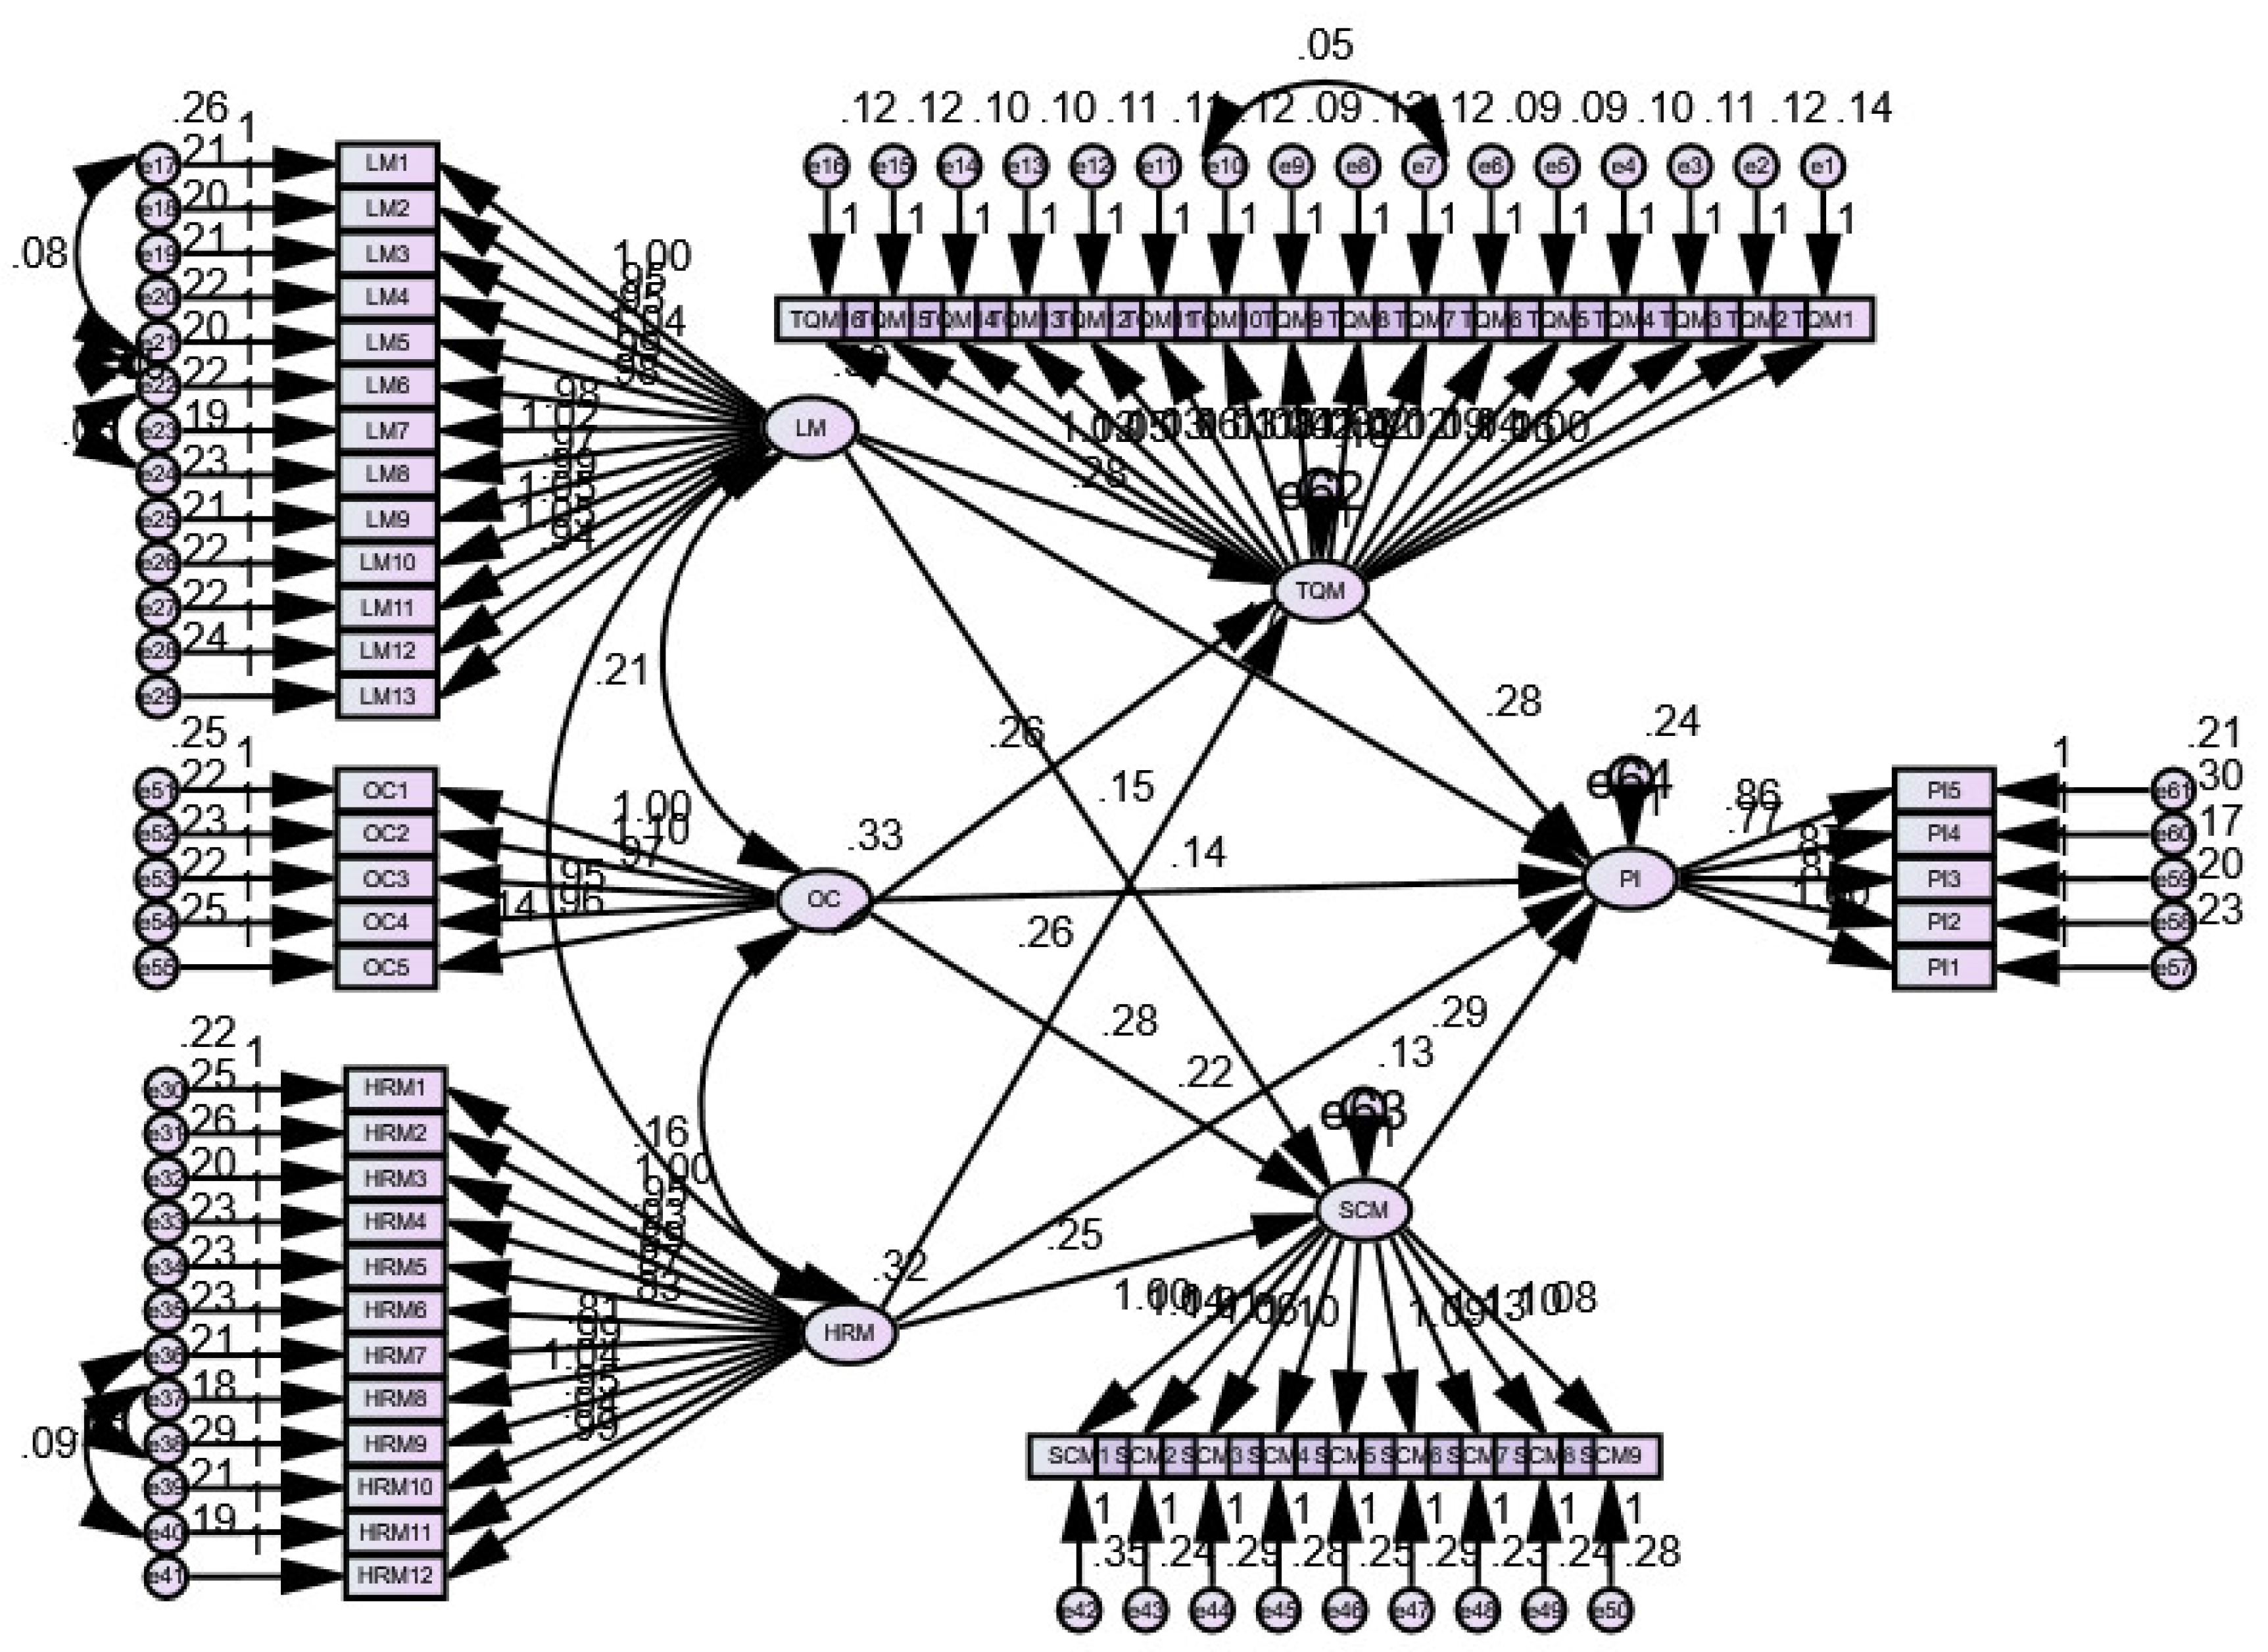
4.3. Structural Model
After establishing good convergent and discriminant validities, the second step is the analysis of the regression part of the latent variables (structural model). The structural model provides a possible explanation of variations in the values of latent variables because of direct and indirect influences of other latent variables [
80]. The structural model, exhibited in
Figure 3, was also checked for goodness of fit. The normed chi-square
) is 2.766 (4674.301/1690), RMSEA is 0.054 and GFI is 0.798, supporting the model’s acceptable fit.
Path Analysis and Hypothesis Testing
Path analyses were conducted for the specification of the direct and indirect effects of exogenous variables.
Figure 3 is a path diagram which portrays the hypothesized relationships among the constructs based on existing literature. OC, LM and HRM are exogenous variables, while TQM, SCM and PI are endogenous variables.
The significance of the structural model relationships was determined by the bootstrapping procedure as reported in
Table 5. The results show that LM has positive and significant links with TQM (β = 0.273,
p < 0.05); and SCM (β = 0.170,
p < 0.05), HRM has positive and significant relationships with TQM (β = 0.257,
p < 0.05) and SCM (β = 0.284,
p < 0.05) and OC has positive and significant associations with TQM (β = 0.265,
p < 0.05) and SCM (β = 0.334,
p < 0.05). Thus, the empirical data support the earlier stated hypotheses H
1–H
6. Eventually, TQM (β = 0.227,
p < 0.05) and SCM (β = 0.209,
p < 0.05) were each related to process innovation, which corroborates H
7 and H
8.
Now, in order to examine the mediating effects of TQM and SCM, we followed the guidelines of Zhao, Lynch Jr, and Chen [
84]. We determined the strength of mediating effects through the computation of variance accounted for (VAF) value. The VAF value greater than 80% is considered as full mediation, the value from 20% to 80% means partial mediation, and no mediation if the value is less than 20%. The further findings of the study reported in
Table 6 reveal that there are partial mediation effects present in the model. TQM partially mediated the effects of LM, HRM and OC on PI, with the indirect effects (a × b) (β = 0.062, 0.058 and 0.060) and direct effects (c) (β = 0.135, 0.178 and 0.119) respectively. Similarly, SCM partially mediated the effects of LM, HRM and OC on PI with indirect effects (a × b) (β = 0.036, 0.059 and 0.069) and direct effects (c) (β = 0.135, 0.178 and 0.119) respectively. Thus, H
9–H
14 were partially supported by empirical pieces of evidence.
5. Discussion
The research model confirms and extends the previous studies that interlink LM, HRM, OC, TQM, SCM and PI. There are positive relationships of LM, HRM and OC with TQM and SCM based on the foregoing results, therefore, the hypotheses H
1–H
6 have been approved. The relationships of H
1 through H
6 show the importance of LM, HRM and OC as enablers of TQM and SCM. The significant effects imply that by placing focus on HRM, LM and OC, manufacturing organizations can boost the successful implementation of TQM and SCM practices. The results established are consistent with previous studies [
85]. For example, Dubey and Singh [
29] concluded that the relationship between LM and TQM is significant which endorses H
1. A positive and significant relationship has been found between LM and SCM as stated in H
2. This finding is supported by the results of C. D. Singh et al. [
38] who established that LM and SCM are positively associated. The hypothesis H
3, which states that HRM has a significant positive influence on TQM, is supported by the results of the current study. This result is similar to the decisions reached by Vanichchinchai [
43]. Gunasekaran [
52] also found that HRM dimensions have a noteworthy link with TQM. Hypothesis H
4 is also supported by the outcomes presented in the previous section. This hypothesis states that there is a positive relationship between HRM and SCM, and is supported by the similar findings of Gómez-Cedeño et al. [
46].
Our results also validate the relationship between OC and TQM (H
5). The study performed by Gimenez-Espin et al. [
61] is consistent with our findings which reinforced a strong positive linkage between OC and TQM. Furthermore, the conclusion, drawn by Zu et al. [
60], also supports our findings. Moreover, a positive effect of OC on SCM (H
6), reinforced by our results, is in line with the decisions made by Mello and Stank [
66]. A later study conducted by Cao et al. [
65] additionally confirms the significant and positive association of OC and SCM. Similarly, the empirical evidence confirmed the H
6 and H
7 hypotheses. These ratify that TQM and SCM are positively related to process innovation which demonstrates that successful employment of TQM and SCM also plays an important part in cultivating PI. The past empirical investigation by Zehir et al. [
70] also proved that TQM is positively related to PI. Moreover, Sadikoglu and Zehir [
69] have empirically ascertained that TQM implementation efforts can lead to process innovation. Likewise, our study shows that SCM capability has a significant impact on PI supported by Chong et al. [
23] and Soosay et al. [
75].
Furthermore, LM, HRM and OC can significantly enhance PI as shown in
Table 6. These analytical results of direct effects are consistent with those obtained by [
5,
20,
25,
85]. Furthermore, it was found from the bootstrapping technique that 21% to 37% effects of LM, HRM and OC on PI were explained through TQM and SCM. There is the execution of mediation analysis in this study using the Baron and Kenny [
86] causal approach. The initial causal variables were LM, HRM and OC, the criterion variable was PI, and the mediating variables were TQM and SCM. The mediation analysis results were both TQM and SCM exhibit partial mediation in the relationships between: LM and PI; HRM and PI; and OC and PI. The direct effect of LM, HRM and OC on PI were β = 0.135, 0.178 and 0.119, respectively. Similarly, the indirect effects (>20%) of LM, HRM and OC on PI through TQM are β = 0.062, 0.058 and 0.060 and through SCM are β = 0.036, 0.059 and 0.069 in the order given, which show that partial mediating effects of TQM and SCM exist. The findings communicate that the effect of TQM and SCM cannot be negated in improving the PI and organizations should take concrete steps that foster TQM and SCM. So, the results of this study also support hypotheses H
9–H
14.
6. Theoretical and Practical Implications
The current study has substantial theoretical and practical contributions. In order to study the connection amid various practices of interest, namely: LM, HRM, OC, TQM, SCM and PI, there is a development of a theoretical framework. The importance of such relationships cannot be denied because they clarify the effects of five constructs on PI. This investigation also concludes that TQM and SCM partially mediate the relationships of LM, HRM and OC on PI, which insinuates that organizations should form strategies for the effective implementation of TQM and SCM practices in order to improve PI. The results of this study, confirming all the hypotheses between the constructs, implies that there are moderate to strong and positive inter-dimensional correlations. The contribution of this work is novel in that it provides thorough insights into the nature of the inspected interdependencies. The relations of LM, HRM, OC, TQM, SCM and PI can be used as a theoretical basis for future discussions.
This research is also valuable for the operational managers to comprehend the role and effect of different practices on PI in framing the strategies to effectively improve PI within their organizations. This study would help prioritize the practices recommending that managers of manufacturing organizations should place additional focus on LM, HRM and OC practices to achieve enhanced process innovation, and ultimately sustainable competitive power. LM, HRM and OC also act as drivers of TQM and SCM, which implies that managers must look for ways to facilitate TQM and SCM practices within internal functions, as well as across the firm boundaries. Interestingly, this study proposed that TQM and SCM are the mediators between LM, HRM, OC and PI, and this conclusion brings about a deeper insight for those who are in search of newer conversance in the domain of PI. Considering the resource constraints faced by all the organizations, it is advised to the decision-makers to implement a manageable number of practices instead of pursuing all of them simultaneously. The managers may also use the questionnaire to implement the research framework for the self-assessment of practices that influence PI. This might help harvest the benefits by reassessing the practices which require more thorough implementation. A better understanding of the importance of PI may also be beneficial for the practitioners to become a truly market-oriented firm. It seems that the findings of this study are especially important for those firms that function in extremely turbulent settings. Consequentially, this can assist firms to survive in financially unhealthy business environments, and withstand the current economic downturn. In this way, our study proposes unequivocal and rewarding real-world implications in order to choose strategies and allocate resources for improving a firm’s PI. Indeed, when innovation becomes a way of life of a firm, it is transformed into its competitiveness. Succinctly, the most critical catalyst in a company’s success may be a successful innovation platform.
7. Conclusions
This paper aimed to find out the practices that contribute significantly to the process innovation in manufacturing organizations. This research investigated the relationships of LM with TQM and SCM, OC with TQM and SCM, and HRM with TQM and SCM, as well as the effects of TQM and SCM on process innovation. Structural equation modeling, being a more robust modeling technique, was used to validate the hypothesized model. LM, HRM and OC turned up as significant predictors and drivers of process innovation, and TQM and SCM were also emerged as important determinants. Considering all the results, it can be presumed that TQM and SCM partially mediate the relationships between LM, HRM, OC and PI. Hence, it can be concluded that the implementation level of carriers (TQM and SCM practices) should be enhanced to strengthen and enrich process innovation.
The current study recommends that manufacturing organizations should focus on implementing well-organized and resourceful LM, OC and HRM practices by providing up-to-date training to their workforce, cultivating work skills, refining service quality, continually improving processes, enhancing worker gratification and devotion by the suitable rewarding system and boosting teamwork culture. All these practices would better the process innovation and competitiveness of manufacturing organizations in operational performance domains. Thus, the operational managers would be able to comprehend the role and effect of different constructs on PI in framing the strategies to effectively improve PI within their organizations. The research has certain limitations to be overcome in future studies, such as limited industry participation, lack of qualitative data, fewer practices in the model.
8. Limitations and Future Research Directions
Despite the important findings and implications produced by this study, there are some inherent but noteworthy, limitations, mostly related to the nature of design and sample. First, survey items of innovation construct are related to process innovation due to the focus and scope of the study. Therefore, the outcomes should not be generalized to other types of innovations. Second, the empirical validation of the model was carried out through research data collected from three industries, and it may limit the generalizability of the results. Future studies are required with samples collected from other industries with intangible products such as services. Furthermore, a financial crisis may dominate in the sample companies’ environment, and may have influenced the efforts of the companies to innovate. Accordingly, these circumstances should be considered carefully while generalizing the findings of the present study. The questionnaire had no qualitative data. However, a better understanding of the causal mechanism between the said variables and PI is the expected interviews with members from the firms that are included in the sample. Therefore, the current research framework can be further improved and expanded in the future. Lastly, the study presents only a few practices (mostly discussed in existing literature), that influence PI, and to overcome this limitation is a part of the future research agenda.
Author Contributions
Conceptualization, A.A. and A.A.A.; methodology, A.A.A. and A.M.; software, A.I.; validation, A.A, and A.M.; formal analysis, A.M.; investigation, A.A.A.; resources, A.A.A.; data curation, A.A.; writing—original draft preparation, A.A.A.; writing—review and editing, A.M.; visualization, A.I.; supervision, A.M.; project administration, A.A. All authors have read and agreed to the published version of the manuscript.
Funding
The authors received no funding for this research work.
Acknowledgments
This work has been adapted from the Ph.D. thesis of the primary author (Asif Arshad Ali). The thesis deposited in the repository of the Higher Education Commission (HEC), Pakistan, may be retrieved from there.
Conflicts of Interest
The authors declare that there are no conflicts of interest regarding the publication of this paper.
Data Availability
The data used to support the findings of this study are available from the corresponding author upon request.
Appendix A
Table A1.
Description of the practices analyzed.
Table A1.
Description of the practices analyzed.
| Practice | Measure/Indicator/Dimensions | Item/Question |
|---|
| Lean Management | JIT (Just in time) | Reducing production lot size |
| Reducing setup time |
| Focusing on a single supplier |
| Implementing preventive maintenance activities |
| Cycle time reduction |
| Reducing inventory exposes manufacturing, distribution and scheduling problems |
| Waste minimization | Using new process equipment or technologies |
| Using quick changeover techniques |
| Continuous/one-piece flow |
| Using a pull-based production system/Kanban |
| Flow management | Removing bottlenecks |
| Using error-proofing techniques/Poka-yoke |
| Eliminate waste |
| Org. Culture | Learning and development | There is a culture that emphasizes individual learning and development. |
| Participative decision making | There is a culture that encourages employees to participate in the firm’s decision-making process. |
| Power-sharing | We have a culture that has a little focus on turf, politics and status. |
| Support and collaboration | Employees are willing to cooperate with each other and ready to offer needed help. |
| Tolerance for conflicts and risk | A culture in which the organization accepts conflicts and risks. |
| HRM | | Human resource planning |
| Recruiting and selection |
| Work design and analysis |
| Training and education |
| Job rotation |
| Leadership development |
| Performance appraisal |
| Incentive compensation |
| Benefits and profit-sharing |
| Employee development |
| Employee security and health |
| Employee relations |
| |
| TQM | Top management support | Top managers in my department set clear goals for quality improvement. |
| Top managers in this organization follow-up on suggestions for improvement. |
| Top managers in this organization allocate resources to improve quality. |
| Top management is supportive of suggestions for improving the way things are done. |
| Employee involvement | There is a strong commitment to quality at all levels of this organization. |
| People are encouraged to verbalize how things could improve supervisory reinforcement. |
| People in this organization have a relatively high level of authority over their work-related decisions. |
| People in this organization constantly look for ways to improve their work. |
| Continuous improvement | Continuous quality improvement is an important goal of this organization. |
| People in this organization are continually looking for better ways of doing their work to avoid errors. |
| People in this organization are constantly improving their business processes. |
| People in my work unit analyze their work products to look for ways of doing a better job. |
| Customer focus | This company refers to customer needs to develop their business strategies. |
| This company encourages people to listen to the customer when they need to make decisions. |
| People in my work unit know their customers. |
| I think of my customers while working. |
| SCM | | Close partnership with customers, |
| Close partnership with suppliers, |
| Just in time supply, |
| Subcontracting, |
| Supply chain benchmarking, |
| Strategic planning |
| Many suppliers, |
| Few suppliers |
| Holding safety stocks |
| * Outsourcing |
| * 3PL (Third-party logistics) |
| * e-procurement |
| Process innovation | | Determining and eliminating nonvalue-adding activities in production processes |
| Decreasing variable cost components in manufacturing processes, techniques, machinery and software. |
| Increasing output quality in manufacturing processes, techniques, machinery and software. |
| Determining and eliminating nonvalue-adding activities in delivery related processes. |
| Decreasing variable cost and/or increasing delivery speed in delivery related logistics processes. |
Appendix B
Table A2.
Scale validity and reliability.
Table A2.
Scale validity and reliability.
| Constructs | SL | p-Value | AVE | Cronbach’s Alpha |
|---|
| Organizational Culture | | | 0.584 | 0.875 |
| Org_Cul1 | 0.756 | *** | |
| Org_Cul2 | 0.805 | *** |
| Org_Cul3 | 0.758 | *** |
| Org_Cul4 | 0.758 | *** |
| Org_Cul5 | 0.742 | *** |
| Lean Management | | 0.578 | 0.947 |
| LM1 | 0.731 | *** | |
| LM2 | 0.755 | *** |
| LM3 | 0.759 | *** |
| LM4 | 0.776 | *** |
| LM5 | 0.763 | *** |
| LM6 | 0.770 | *** |
| LM7 | 0.751 | *** |
| LM8 | 0.787 | *** |
| LM9 | 0.741 | *** |
| LM10 | 0.761 | *** |
| LM11 | 0.779 | *** |
| LM12 | 0.779 | *** |
| LM13 | 0.726 | *** |
| Human Resource Management | | 0.551 | 0.937 |
| HRM1 | 0.767 | *** | |
| HRM2 | 0.727 | *** |
| HRM3 | 0.715 | *** |
| HRM4 | 0.750 | *** |
| HRM5 | 0.712 | *** |
| HRM6 | 0.699 | *** |
| HRM7 | 0.692 | *** |
| HRM8 | 0.771 | *** |
| HRM9 | 0.812 | *** |
| HRM10 | 0.706 | *** |
| HRM11 | 0.756 | *** |
| HRM12 | 0.790 | *** |
| Total Quality Management | | 0.754 | 0.980 |
| TQM1 | 0.833 | *** | |
| TQM2 | 0.861 | *** |
| TQM3 | 0.870 | *** |
| TQM4 | 0.883 | *** |
| TQM5 | 0.881 | *** |
| TQM6 | 0.885 | *** |
| TQM7 | 0.860 | *** |
| TQM8 | 0.860 | *** |
| TQM9 | 0.884 | *** |
| TQM10 | 0.852 | *** |
| TQM11 | 0.879 | *** |
| TQM12 | 0.868 | *** |
| TQM13 | 0.883 | *** |
| TQM14 | 0.880 | *** |
| TQM15 | 0.861 | *** |
| TQM16 | 0.854 | *** |
| Supply Chain Management | | 0.501 | 0.899 |
| SCM1 | 0.635 | *** | |
| SCM2 | 0.724 | *** |
| SCM3 | 0.676 | *** |
| SCM4 | 0.695 | *** |
| SCM5 | 0.732 | *** |
| SCM6 | 0.707 | *** | | |
| SCM7 | 0.751 | *** | | |
| SCM8 | 0.738 | *** | | |
| SCM9 | 0.704 | *** | | |
| Process Innovation | | 0.619 | 0.888 |
| P_Inn1 | 0.817 | *** | | |
| P_Inn2 | 0.803 | *** | | |
| P_Inn3 | 0.821 | *** | | |
| P_Inn4 | 0.696 | *** | | |
| P_Inn5 | 0.790 | *** | | |
References
- Abdallah, A.B.; Phan, A.C.; Matsui, Y. Investigating the effects of managerial and technological innovations on operational performance and customer satisfaction of manufacturing companies. Int. J. Bus. Innov. Res. 2016, 10, 153. [Google Scholar] [CrossRef]
- Hogan, S.J.; Coote, L.V. Organizational culture, innovation, and performance: A test of Schein’s model. J. Bus. Res. 2014, 67, 1609–1621. [Google Scholar] [CrossRef]
- Haneda, S.; Ito, K. Organizational and human resource management and innovation: Which management practices are linked to product and/or process innovation? Res. Policy 2018, 47, 194–208. [Google Scholar] [CrossRef]
- Naranjo-Valencia, J.C.; Jiménez-Jiménez, D.; Sanz-Valle, R. Studying the links between organizational culture, innovation, and performance in Spanish companies. Rev. Latinoam. de Psicol. 2016, 48, 30–41. [Google Scholar] [CrossRef] [Green Version]
- Prajogo, D.; Power, D.J.; Sohal, A.S. The role of trading partner relationships in determining innovation performance: An empirical examination. Eur. J. Innov. Manag. 2004, 7, 178–186. [Google Scholar] [CrossRef]
- Gunday, G.; Ulusoy, G.; Kilic, K.; Alpkan, L. Effects of innovation types on firm performance. Int. J. Prod. Econ. 2011, 133, 662–676. [Google Scholar] [CrossRef] [Green Version]
- Long, C.S.; Aziz, M.H.A.; Kowang, T.O.; Ismail, W.K.W. Impact of TQM practices on innovation performance among manufacturing companies in Malaysia. South. Afr. J. Ind. Eng. 2015, 26, 75. [Google Scholar] [CrossRef]
- Brown, S.L.; Eisenhardt, K.M. Product development: Past research, present findings, and future directions. Acad. Manag. Rev. 1995, 20, 343–378. [Google Scholar]
- Möldner, A.K.; Garza-Reyes, J.A.; Kumar, V. Exploring lean manufacturing practices’ influence on process innovation performance. J. Bus. Res. 2020, 106, 233–249. [Google Scholar] [CrossRef]
- Prajogo, D.I.; Sohal, A.S. The relationship between TQM practices, quality performance, and innovation performance. Int. J. Qual. Reliab. Manag. 2003, 20, 901–918. [Google Scholar] [CrossRef] [Green Version]
- Psomas, E.; Kafetzopoulos, D.; Gotzamani, K. Determinants of company innovation and market performance. TQM J. 2018, 30, 54–73. [Google Scholar] [CrossRef]
- Crowley, F. Product and service innovation and discontinuation in manufacturing and service firms in Europe. Eur. J. Innov. Manag. 2017, 20, 250–268. [Google Scholar] [CrossRef]
- Koc, T.; Ceylan, C. Factors impacting the innovative capacity in large-scale companies. Technovation 2007, 27, 105–114. [Google Scholar] [CrossRef]
- Denekamp, H.J. Weaknesses in the Manufacturing Strategy: A Case Study. 2017. Available online: https://essay.utwente.nl/73328/1/Denekamp_BA_BMS.pdf (accessed on 2 June 2020).
- Ojha, R.; Vij, A.K.; Vrat, P. Manufacturing excellence and its critical factors. J. Adv. Manag. Res. 2014, 11, 312–332. [Google Scholar] [CrossRef]
- Al-Sa’Di, A.F.; Abdallah, A.B.; Dahiyat, S.E. The mediating role of product and process innovations on the relationship between knowledge management and operational performance in manufacturing companies in Jordan. Bus. Process. Manag. J. 2017, 23, 349–376. [Google Scholar] [CrossRef]
- Fok-Yew, O.; Ahmad, H.; Baharin, S. Operational excellence and change management in Malaysia context. J. Organ. Manag. Stud. 2013, 1–14. [Google Scholar] [CrossRef] [Green Version]
- De Massis, A.; Audretsch, D.; Uhlaner, L.; Kammerlander, N. Innovation with Limited Resources: Management Lessons from the G erman M ittelstand. J. Prod. Innov. Manag. 2018, 35, 125–146. [Google Scholar]
- Arshad, A.; Mahmood, A.; Salam, A. Prioritising the practices that influence the operational performance of manufacturing organisations using hybrid AHP-topsis analysis. S. Afr. J. Ind. Eng. 2020, 31, 65–77. [Google Scholar] [CrossRef]
- Díaz-Fernández, M.; Bornay-Barrachina, M.; Lopez-Cabrales, A. HRM practices and innovation performance: A panel-data approach. Int. J. Manpow. 2017, 38, 354–372. [Google Scholar] [CrossRef]
- Bos-Nehles, A.C.; Renkema, M.; Janssen, M. HRM and innovative work behaviour: A systematic literature review. Pers. Rev. 2017, 46, 1228–1253. [Google Scholar] [CrossRef]
- Hung, R.Y.Y.; Lien, B.Y.-H.; Yang, B.; Wu, C.-M.; Kuo, Y.-M. Impact of TQM and organizational learning on innovation performance in the high-tech industry. Int. Bus. Rev. 2011, 20, 213–225. [Google Scholar] [CrossRef]
- Chong, A.Y.-L.; Chan, F.T.; Ooi, K.-B.; Sim, J. Can Malaysian firms improve organizational/innovation performance via SCM? Ind. Manag. Data Syst. 2011, 111, 410–431. [Google Scholar] [CrossRef]
- Khalil, M.K.; Khalil, R.; Khan, S.N. A study on the effect of supply chain management practices on organizational performance with the mediating role of innovation in SMEs. Uncertain Supply Chain Manag. 2019, 7, 179–190. [Google Scholar] [CrossRef]
- Abdallah, A.B.; Dahiyat, S.E.; Matsui, Y. Lean management and innovation performance. Manag. Res. Rev. 2019, 42, 239–262. [Google Scholar] [CrossRef]
- Rahman, S.; Laosirihongthong, T.; Sohal, A.S. Impact of lean strategy on operational performance: A study of Thai manufacturing companies. J. Manuf. Technol. Manag. 2010, 21, 839–852. [Google Scholar] [CrossRef]
- Reed, R.; Lemak, D.J.; Mero, N.P. Total quality management and sustainable competitive advantage. J. Qual. Manag. 2000, 5, 5–26. [Google Scholar] [CrossRef]
- Hoang, D.T.; Igel, B.; Laosirihongthong, T. The impact of total quality management on innovation. Int. J. Qual. Reliab. Manag. 2006, 23, 1092–1117. [Google Scholar] [CrossRef]
- Dubey, R.; Singh, T. Understanding complex relationship among JIT, lean behaviour, TQM and their antecedents using interpretive structural modelling and fuzzy MICMAC analysis. TQM J. 2015, 27, 42–62. [Google Scholar] [CrossRef]
- Nawanir, G.; Teong, L.K.; Othman, S.N. Impact of lean practices on operations performance and business performance. J. Manuf. Technol. Manag. 2013, 24, 1019–1050. [Google Scholar] [CrossRef]
- Taj, S. Lean manufacturing performance in China: Assessment of 65 manufacturing plants. J. Manuf. Technol. Manag. 2008, 19, 217–234. [Google Scholar] [CrossRef]
- Kannan, V. Just in time, total quality management, and supply chain management: Understanding their linkages and impact on business performance. Omega 2005, 33, 153–162. [Google Scholar] [CrossRef]
- Green, K.W.; Inman, R.A.; Sower, V.E.; Zelbst, P.J. Impact of JIT, TQM and green supply chain practices on environmental sustainability. J. Manuf. Technol. Manag. 2019, 30, 26–47. [Google Scholar] [CrossRef]
- Zelbst, P.J.; Green, J.K.W.; Sower, V.E.; Abshire, R.D. Impact of RFID and information sharing on JIT, TQM and operational performance. Manag. Res. Rev. 2014, 37, 970–989. [Google Scholar] [CrossRef]
- Phan, A.C.; Nguyen, H.T.; Matsui, Y. Effect of total quality management practices and JIT production practices on flexibility performance: Empirical evidence from international manufacturing plants. Sustainability 2019, 11, 3093. [Google Scholar] [CrossRef] [Green Version]
- Aoun, M.; Hasnan, N.; Al Aaraj, H. Relationship between lean practices, soft total quality management and innovation skills in Lebanese hospitals. East. Mediterr. Health J. 2018, 24, 269–276. [Google Scholar] [CrossRef]
- Li, S.; Ragu-Nathan, B.; Ragu-Nathan, T.; Rao, S.S. The impact of supply chain management practices on competitive advantage and organizational performance. Omega 2006, 34, 107–124. [Google Scholar] [CrossRef]
- Singh, C.D.; Singh, R.; Mand, J.S.; Singh, S. Application of lean and JIT principles in supply chain management. Int. J. Manag. Res. Bus. Strategy 2013, 2, 85–98. [Google Scholar]
- Kumar, A.; Kushwaha, G. Supply chain management practices and operational performance of fair price shops in India: An empirical study. LogForum 2018, 14, 85–99. [Google Scholar] [CrossRef]
- Truong, H.Q.; Sameiro, M.; Fernandes, A.C.; Sampaio, P.; Duong, B.A.T.; Duong, H.H.; Vilhena, E. Supply chain management practices and firms’ operational performance. Int. J. Qual. Reliab. Manag. 2017, 34, 176–193. [Google Scholar] [CrossRef]
- Petrovic-Lazarevic, S.; Sohal, A.; Baihaiqi, I. Supply chain management performance the Australian manufacturing industry. Comput. Ind. Eng. 2007, 43, 97–109. [Google Scholar]
- Martínez-Jurado, P.J.; Moyano-Fuentes, J. Information Resources Management Association. In Lean Management and Supply Chain Management; IGI Global: Pennsylvania, PA, USA, 2018; pp. 1208–1242. [Google Scholar]
- Vanichchinchai, A. The effect of lean manufacturing on a supply chain relationship and performance. Sustainability 2019, 11, 5751. [Google Scholar] [CrossRef] [Green Version]
- Cherrafi, A.; Garza-Reyes, J.A.; Kumar, V.; Mishra, N.; Ghobadian, A.; ElFezazi, S. Lean, green practices and process innovation: A model for green supply chain performance. Int. J. Prod. Econ. 2018, 206, 79–92. [Google Scholar] [CrossRef]
- Ravet, D. Lean Production: The Link between Supply Chain and Sustainable Development in an International Environment; Colloque Franco-Tchèque Trends in international business: Lyon, France, 2011. [Google Scholar]
- Gómez-Cedeño, M.; Castán-Farrero, J.M.; Guitart-Tarrés, L.; Matute-Vallejo, J. Impact of human resources on supply chain management and performance. Ind. Manag. Data Syst. 2015, 115, 129–157. [Google Scholar] [CrossRef]
- Doerflein, K.A.S.; Tracey, M.; Tan, C.L. Human resource management and supply chain effectiveness: An exploratory study. Int. J. Integr. Supply Manag. 2011, 6, 202. [Google Scholar] [CrossRef]
- Lawrence, P.; Pfeffer, J. The human equation: Building profits by putting people first. Adm. Sci. Q. 1998, 43, 956. [Google Scholar] [CrossRef]
- Abdullah, Z.; Ahsan, N.; Alam, S.S. The effect of human resource management practices on business performance among private companies in Malaysia. Int. J. Bus. Manag. 2009, 4, 65–72. [Google Scholar] [CrossRef] [Green Version]
- Apospori, E.; Nikandrou, I.; Brewster, C.; Papalexandris, N. HRM and organizational performance in northern and southern Europe. Int. J. Hum. Resour. Manag. 2008, 19, 1187–1207. [Google Scholar] [CrossRef]
- Yang, C. The impact of human resource management practices on the implementation of total quality management. TQM Mag. 2006, 18, 162–173. [Google Scholar] [CrossRef]
- Gunasekaran, A. Agile manufacturing: A framework for research and development. Int. J. Prod. Econ. 1999, 62, 87–105. [Google Scholar] [CrossRef]
- Tawalbeh, H.F.; Jaradat, M. The Associations among Human Resource Management (HRM) practices, Total Quality Management (TQM) practices and competitive advantages. J. Soc. Sci. (COES RJ-JSS) 2020, 9, 505–534. [Google Scholar] [CrossRef]
- Madani, M.; Wajeetongratana, P. The effects of culture and human resources management policies on supply chain management strategy. Pol. J. Manag. Stud. 2019, 19, 235–248. [Google Scholar] [CrossRef]
- Khan, N.R.; Taha, S.M.; Ghouri, A.M.; Khan, M.R.; Ken, Y.C. The Impact of HRM practices on supply chain management success in SME. SSRN Electron. J. 2013, 9, 177–189. [Google Scholar] [CrossRef] [Green Version]
- Hohenstein, N.-O.; Feisel, E.; Hartmann, E. Human resource management issues in supply chain management research. Int. J. Phys. Distrib. Logist. Manag. 2014, 44, 434–463. [Google Scholar] [CrossRef]
- Menon, S.T. Human resource practices, supply chain performance, and wellbeing. Int. J. Manpow. 2012, 33, 769–785. [Google Scholar] [CrossRef]
- Eniola, A.; Olorunleke, G.K.; Akintimehin, O.O.; Ojeka, J.D.; Oyetunji, B. The impact of organizational culture on total quality management in SMEs in Nigeria. Heliyon 2019, 5, e02293. [Google Scholar] [CrossRef] [Green Version]
- Ke, W.; Wei, K.K. Organizational culture and leadership in ERP implementation. Decis. Support. Syst. 2008, 45, 208–218. [Google Scholar] [CrossRef] [Green Version]
- Zu, X.; Robbins, T.L.; Fredendall, L.D. Mapping the critical links between organizational culture and TQM/Six Sigma practices. Int. J. Prod. Econ. 2010, 123, 86–106. [Google Scholar] [CrossRef]
- Gimenez-Espin, J.A.; Jiménez-Jiménez, D.; Martínez-Costa, M. Organizational culture for total quality management. Total. Qual. Manag. Bus. Excel. 2013, 24, 678–692. [Google Scholar] [CrossRef]
- Rad, A.M.M. The impact of organizational culture on the successful implementation of total quality management. TQM Mag. 2006, 18, 606–625. [Google Scholar] [CrossRef] [Green Version]
- Sung, H.; Kim, S. The effect of organizational culture on supply chain management in uncertain environments. Asia Pac. J. Mark. Logist. 2019, 31, 1003–1026. [Google Scholar] [CrossRef]
- Roh, J.J.; Hong, P.; Park, Y. Organizational culture and supply chain strategy: A framework for effective information flows. J. Enterp. Inf. Manag. 2008, 21, 361–376. [Google Scholar] [CrossRef]
- Cao, Z.; Huo, B.; Li, Y.; Zhao, X. The impact of organizational culture on supply chain integration: A contingency and configuration approach. Supply Chain Manag. Int. J. 2015, 20, 24–41. [Google Scholar] [CrossRef]
- Mello, J.E.; Stank, T.P. Linking firm culture and orientation to supply chain success. Int. J. Phys. Distrib. Logist. Manag. 2005, 35, 542–554. [Google Scholar] [CrossRef]
- Atalay, M.; Anafarta, N.; Sarvan, F. The Relationship between innovation and firm performance: An empirical evidence from Turkish automotive supplier industry. Procedia-Soc. Behav. Sci. 2013, 75, 226–235. [Google Scholar] [CrossRef] [Green Version]
- Chenavaz, R. Dynamic pricing, product and process innovation. Eur. J. Oper. Res. 2012, 222, 553–557. [Google Scholar] [CrossRef]
- Sadikoglu, E.; Zehir, C. Investigating the effects of innovation and employee performance on the relationship between total quality management practices and firm performance: An empirical study of Turkish firms. Int. J. Prod. Econ. 2010, 127, 13–26. [Google Scholar] [CrossRef]
- Zehir, C.; Ertosun Öznur, G.; Zehir, S.; Müceldilli, B. Total quality management practices’ effects on quality performance and innovative performance. Procedia-Soc. Behav. Sci. 2012, 41, 273–280. [Google Scholar] [CrossRef] [Green Version]
- Lee, V.H.; Ooi, K.-B. Applying the Malcolm Baldrige National Quality Award criteria: An approach to strengthen organisational memory and process innovation. Total. Qual. Manag. Bus. Excel. 2014, 26, 1373–1386. [Google Scholar] [CrossRef]
- Hung, R.Y.-Y.; Lien, B.Y.-H.; Fang, S.-C.; McLean, G.N. Knowledge as a facilitator for enhancing innovation performance through total quality management. Total. Qual. Manag. Bus. Excel. 2010, 21, 425–438. [Google Scholar] [CrossRef]
- Antunes, M.G.; Quirós, J.T.; Justino, M.D.R.F. The relationship between innovation and total quality management and the innovation effects on organizational performance. Int. J. Qual. Reliab. Manag. 2017, 34, 1474–1492. [Google Scholar] [CrossRef]
- Singh, P.J.; Smith, A.J. Relationship between TQM and innovation: An empirical study. J. Manuf. Technol. Manag. 2004, 15, 394–401. [Google Scholar] [CrossRef]
- Soosay, C.A.; Hyland, P.W.; Ferrer, M. Supply chain collaboration: Capabilities for continuous innovation. Supply Chain Manag. Int. J. 2008, 13, 160–169. [Google Scholar] [CrossRef] [Green Version]
- Marodin, G.A.; Frank, A.G.; Tortorella, G.L.; Fetterman, D.C. Lean production and operational performance in the Brazilian automotive supply chain. Total. Qual. Manag. Bus. Excel. 2017, 30, 370–385. [Google Scholar] [CrossRef]
- Arvanitis, S.; Seliger, F.; Stucki, T. The relative importance of human resource management practices for innovation. Econ. Innov. New Technol. 2016, 25, 769–800. [Google Scholar] [CrossRef]
- Bayo-Moriones, A.; Merino-Díaz-De-Cerio, J. Human resource management, strategy and operational performance in the Spanish manufacturing industry. Management 2002, 5, 175. [Google Scholar] [CrossRef]
- Kline, R.B. Principles and Practice of Structural Equation Modeling; Guilford: New York, NY, USA, 2011. [Google Scholar]
- Byrne, B. SEM with AMOS: Basic Concepts, Applications, and Programming; Routledge: London, UK, 2001. [Google Scholar]
- Koh, S.L.; Demirbag, M.; Bayraktar, E.; Tatoglu, E.; Zaim, S. The impact of supply chain management practices on performance of SMEs. Ind. Manag. Data Syst. 2007, 107, 103–124. [Google Scholar] [CrossRef]
- Al-Refaie, A.; Ghnaimat, O.; Ko, J.H. The effects of quality management practices on customer satisfaction and innovation: A perspective from Jordan. Int. J. Prod. Qual. Manag. 2011, 8, 398. [Google Scholar] [CrossRef]
- Al-Refaie, A. Effects of human resource management on hotel performance using structural equation modeling. Comput. Hum. Behav. 2015, 43, 293–303. [Google Scholar] [CrossRef]
- Zhao, X.; Lynch, J.G.; Chen, Q. Reconsidering Baron and Kenny: Myths and truths about mediation analysis. J. Consum. Res. 2010, 37, 197–206. [Google Scholar] [CrossRef]
- Ali, A.A.; Mahmood, A.; Ahmad, A.; Ikram, A. Boosting up operational performance of manufacturing organizations through interpretive structural modelling of enabling practices. Math. Probl. Eng. 2020, 2020, 1–11. [Google Scholar] [CrossRef]
- Baron, R.M.; Kenny, D.A. The moderator-mediator variable distinction in social psychological research: Conceptual, strategic, and statistical considerations. J. Pers. Soc. Psychol. 1986, 51, 1173. [Google Scholar] [CrossRef]
| Publisher’s Note: MDPI stays neutral with regard to jurisdictional claims in published maps and institutional affiliations. |
© 2020 by the authors. Licensee MDPI, Basel, Switzerland. This article is an open access article distributed under the terms and conditions of the Creative Commons Attribution (CC BY) license (http://creativecommons.org/licenses/by/4.0/).


