Article

The Role of Green Innovation between Green Market Orientation and Business Performance: Its Implication for Open Innovation

by
Bambang Tjahjadi
1,*,
Noorlailie Soewarno
1,
Hariyati Hariyati
2,
Lina Nasihatun Nafidah
1,
Nanik Kustiningsih
1 and
Viviani Nadyaningrum
1
1
Faculty of Economics and Business, Universitas Airlangga, Surabaya 60286, Indonesia
2
Faculty of Economics, Universitas Negeri Surabaya, Surabaya 60231, Indonesia
*
Author to whom correspondence should be addressed.
J. Open Innov. Technol. Mark. Complex. 2020, 6(4), 173; https://0-doi-org.brum.beds.ac.uk/10.3390/joitmc6040173
Submission received: 26 October 2020 / Revised: 27 November 2020 / Accepted: 27 November 2020 / Published: 1 December 2020

Abstract

:
The focus of this research was to investigate the effect of green market orientation on business performance. For that purpose, this research tested that green market orientation has a direct effect on business performance, that green market orientation affects green innovation, and that green innovation affects business performance. As a quantitative research, partial least squares structural equation modeling (PLS–SEM) was used to test the hypotheses. Data were collected by using both online and offline questionnaires from owners/managers of the manufacturing micro, small- and medium-sized enterprises (MSMEs) in the East Java Province of Indonesia. A total of 175 respondents participated in this study. The results show that green market orientation has a positive and direct effect on business performance. The results empirically support the theory of sustainability and entrepreneurship in the research setting of Indonesian MSMEs. The results also imply that the owners/managers of MSMEs need to balance economic, environmental, and social issues in their business. In the era of sustainable development and environmental awareness, manufacturing MSMEs need to adopt a green market orientation and carry out green innovation in their business processes to obtain a better business performance.

1. Introduction

In the last few decades, the world has faced very serious environmental problems. Many countries have issued environmental regulations in an effort to overcome worsening environmental problems [1,2,3]. Since 1980, China has enacted environmental regulations to address environmental problems in the country [4]. The European Community has instructed an effective restriction of the use of certain hazardous substances (RoHS), as well as electronic and electrical equipment (WEEE), since 2006 [5]. The Indonesian Ministry of Environment and Forestry has developed an environment performance rating system (PROPER) to encourage companies to apply green economy principles [6]. In line with Sustainable Development Goals (SDGs), the responsible consumption and production is one of the targets that must be achieved by 2030, by all member states of the United Nations (UN).
The increasingly stringent environmental regulations have encouraged people to be responsible for the environment. Many people choose to buy green products, to minimize their impact on environment [1], are willing to support environmental protection, are environmentally responsible, and tend to seek information and learn about green products [7]. The emergence of green consumers has changed the new competitive landscape in the business world [8]. Companies must pay attention to environmentally friendly competitors in the era of green business [9,10]. Companies are increasingly oriented towards environmentally friendly markets to meet the needs of green consumers [11] in line with the increasing demand for green products [12]. Therefore, the green market plays a crucial role for companies in the era of sustainability. The green market refers to a market where consumers and competitors are aware of environmentally friendly products and processes. Thus, the green market orientation should be the company’s focus in the era of sustainable development. Research with specific topics on green market orientation is still rarely carried out in developing countries, especially in the research setting of small- and medium-sized enterprises (MSMEs).
As the number of green consumers increases, this research expands the construct of market orientation to green market orientation. Green market orientation affects business performance because it increases public awareness to protect environment, therefore triggering companies to adopt environmentally friendly business practices [13,14]. Furthermore, the construct of innovation as a mediating variable is also expanded to become green innovation in line with the increased responsibility of companies to meet the expectations of stakeholders. Green innovation is an innovation that allows the company to reduce adverse impacts on the environment and respond to the green market. In a green market, a company competes with green competitors to meet the needs of green customers who are aware of environmentally friendly products. Therefore, they have the opportunity to improve their environmental performance [15] and financial performance [16]. To strengthen the research framework, this study employs the sustainability theory and entrepreneurship theory. Sustainability theory states that business performance is influenced by the way companies balance social, economic, and environmental interests [17,18]. The Triple Bottom Line, as a business sustainability model, should be implemented because it provides benefits in environmental, social, and economic dimensions [19,20]. In the era of sustainable competition, business actors are required to continue to innovate to meet market needs [21,22,23]. Thus, it is in line with entrepreneurship theory emphasizing the importance of innovation for long-term growth [24]. Through innovation, entrepreneurs can contribute to economic growth in developing countries [25].
The results of previous studies on the effect of market orientation on business performance are still inconsistent. Research by Kirca et al. [26] showed that market orientation increases profits. Lee et al. [27] conducted a study on 156 food-service franchise firms registered with the Korea Fair Trade Committee and showed that market orientation directly improves financial and non-financial performance. As proven by Salehzadeh et al. [28], market orientation has a direct and positive effect on financial performance, customers, internal processes, and learning and growth. Another study by Länsiluoto et al. [29] in Finnish SMEs proved that market orientation has a direct effect on non-financial performance. Conversely, other scholars reveal different results. Uzkurt et al. [30] conducted research on 117 companies on Turkey’s Top 500 Companies and proved that market orientation does not directly affect company performance. Research by Ho et al. [31] on 190 actors in a beef cattle value chain in Vietnam’s Central Highlands showed that there is no significant relationship between market orientation and performance. This research gap justifies further studies. This study proposes green innovation as a mediating variable on green market orientation–business performance relationship.
This research continues the works of Fatoki [8], Papadas [13], and Chan et al. [4] and proposes some opportunities for future research. As suggested by Chan et al. [4], future research should identify various types of institutional or external pressures and investigate their effects on green innovation. Following the suggestion, this research employs green market orientation as a predictor of green innovation. Papadas [13] also suggested that future research should focus on a specific sector or industry to understand how green marketing orientation operates in different settings. Therefore, this research is based on manufacturing MSMEs. Finally, Fatoki [8] recommended that other studies can test the effect of green marketing orientation on performance, using other measures. As suggested, this study uses both financial and non-financial indicators to measure business performance, as well as employing a mediation research model involving green market orientation, green innovation, and business performance, which remains rare in the research setting of Indonesian MSMEs.
Green market orientation is an expansion of market orientation which can be adopted by companies to create superior value in the era of sustainable development. A company that focuses on green market orientation aims to improve competitiveness in an increasingly competitive business environment. Green marketing activities are implemented by companies to provide environmentally friendly products for consumers [32,33]. The first step that an environmentally friendly market–oriented company needs to take is to implement green innovation [14]. Green innovation is adopted by companies, to reduce waste that affects environmental damage. Green innovation emphasizes the creation of environmentally friendly products or processes that can meet requirements to protect the environment [34,35]. Through green innovation, companies can develop innovations such as green managerial innovation [36], green organizational innovation [37], green product innovation [4], and green process innovation [38].
Business performance is the end result of an organization’s efforts in managing its resources [39]. Performance is a reflection of the way an organization manages its resources so that it determines the survival of the organization [40,41]. Green innovation practices allow companies to develop capabilities that lead to improved business performance [37,42]. Green innovation will improve company performance consisting both financial and non-financial performance [43]. Improved environmental performance is the result of green innovation implemented by a company [22,38]. Environmental practices adopted by companies will increase competitiveness, making the company so better [44]. Thus, green innovation is important for environmentally friendly market-oriented companies because it affects business performance.
Manufacturing MSMEs in East Java Province, Indonesia, play important role in improving economic and environment performance. First, manufacturing MSMEs have contributed to the East Java’s GRDP of 54.98 percent and absorbed 78 percent of the workforce [45]. Second, the manufacturing industry is a sector contributing to environmental problems. High production activities are often not balanced with preserving natural resources [6]. Third, Indonesia as a member of the United Nations has targets that must be achieved by 2030, such as achieving the implementation of a 15-year framework for responsible consumption and production, managing chemicals and hazardous waste, and achieving sustainable business practices [46].
The main focus of this research is to investigate the mediating role of green innovation on the effect of green market orientation on business performance. Theoretically, this study strengthens the sustainability theory and entrepreneurship theory by providing empirical evidence on the mechanism of how green market orientation affects business performance via green innovation. Practically, this research implies that Indonesian manufacturing MSMEs need to adopt a green market orientation and apply green innovation, to create better business performance. The rest of this article is organized as follows: Section 2 explains the relevant literature and hypothesis development. Section 3 presents the methodology. Section 4 elaborates the empirical results and discussions. Section 5 describes the conclusions, limitations, and suggestions for future research.

2. Literature Review

Business sustainability is a major issue in many countries around the world. Sustainable development focuses on three pillars, namely economic, social, and environmental [47,48]. Sustainable development is a development process based on the principle of fulfilling the present needs without sacrificing the needs of future generations [18,23,49]. As stated by Jabareen [50], a sustainable design aims to create eco-forms which are energy efficient and designed for long life. Without any support from companies, the sustainable development will not be successful [51,52]. Therefore, manufacturing companies need to pay attention to factors affecting their business sustainability, especially handling the issues of responsible consumption and production.
The theory of corporate sustainability is operationalized in the Triple Bottom Line (TBL) concept [52]. Elkington [53] stated that TBL refers to “the simultaneous pursuit of economic prosperity, environmental quality and social equity”. Companies should accommodate these three aspects in their business processes to achieve a sustainable performance. Thus, companies should not focus only on financial aspects but also on social and environmental responsibilities [54]. By implementing TBL, companies will increase their competitive advantage [55], gain financial benefits [56], and improve their company’s reputation [19].

2.1. Effect of Green Market Orientation on Business Performance

Market orientation is an organizational strategy which is a very effective and efficient way to build behavior necessary for creating superior value and continuous superior performance for buyers [57]. Market-oriented companies will obtain information on buyer needs and competitor activities, and then coordinate them, to create superior customer value [57,58,59]. The emergence of green consumers and green competitors has changed the business world, causing it to become increasingly concerned with environmental issues [9,10]. To achieve sustainable development, companies need to apply environmental principles, to minimize the use of hazardous or toxic substances, resources, and energy [60]. Environmentally friendly marketing activities aim to build a long-term relationship with consumers and other stakeholders by focusing on environmental responsibility [61]. Therefore, green market orientation plays an important role in achieving the success of business processes in an era of environmental awareness.
To achieve a better business performance, a company needs to adopt environmentally friendly practices [13]. A study by Fraj et al. [62] on 361 manufacturing firms of a European country revealed that green marketing strategy can lead companies to improve operational performance and marketing performance. Research by Amegbe et al. [63] in Ghana showed that green marketing orientation improves the SME performance, such as employee satisfaction, employee retention, customer satisfaction, and image. In summary, the more important the role of green marketing orientation, the higher the business performance. Based on the previous arguments, the first hypothesis is proposed.
Hypotheses 1 (H1).
Green market orientation has a positive effect on business performance.

2.2. Effect of Green Market Orientation on Green Innovation

Environmental pressure has driven consumer awareness towards protecting the environment. Consumers prefer to buy products that have a smaller impact on environment and encourage them to care about the environment [1]. Green consumers also trigger the emergence of a green industry [12,64]. The increasing demand for green products causes companies to make environmentally friendly innovations so that their business will continue [65]. Entrepreneurial innovation plays a crucial role in economic development [66]. Therefore, green innovation can be used as a strategic effort to reduce negative impacts of business processes on environment so that it contributes to environment sustainability.
Previous studies have shown that market orientation is the antecedent of innovation [66,67]. Research by Song et al. [68] in Chinese manufacturing firms showed that market orientation affects innovation performance. Customer demand and competitor pressure are the main factors in encouraging companies to carry out green innovation, aiming to provide more value-added benefits [21,22,69]. Lin et al. [22] conducted a study in the Taiwan hybrid-vehicle industry and proved that market demand for green products has a positive effect on green product innovation and green process innovation. As stated by Vilkaite-Vaitone and Skackauskiene [14], the first step for companies adopting green marketing is to develop green products. Thus, the more important the role of green marketing orientation, the more important the green innovation. Based on the previous justification, the second hypothesis is proposed:
Hypotheses 2 (H2).
Green market orientation has a positive effect on green innovation.

2.3. Effect of Green Innovation on Business Performance

Green innovation refers to product and process innovations that involve energy saving, pollution prevention, waste recycling, and environmentally friendly product design [34]. A company carries out green product innovation in order to comply with environmental regulations and increase competitiveness [5]. A company adopts green innovation in order to reduce waste generated from production processes. Environmental action that is a part of sustainable programs plays a crucial role in improving environmental, social, and economic performance [70]. A company will generate a higher profit by developing, producing, and selling environmentally friendly products that provide environmental and social benefits [71]. Research by Weng et al. [2] on manufacturing and service firms in Taiwan empirically proved that green innovation practices improve environmental performance and firm performance. Research by Chan et al. [4] on manufacturing industries in China revealed that green product innovation drives cost efficiency and firm profitability. Green process innovation has a direct and positive effect on organizational and environmental performance [38]. Green innovation should be applied because it provides strategic opportunities for the company. In summary, the better the green innovation, the higher the business performance. Based on the previous arguments, the third hypothesis is proposed:
Hypotheses 3 (H3).
Green innovation has a positive effect on business performance.

2.4. Mediating Effect of Green Innovation on Green Market Orientation–Business Performance Relationship

The increasingly stringent environmental regulations have changed the pattern of production and consumption of consumers, making them become more environmentally responsible. Consumers prefer to buy products that are environmentally friendly [7]. Companies are increasingly oriented towards environmentally friendly markets, to increase their social and environmental responsibilities [38]. Green product innovation and green process innovation are adopted by companies to meet the needs of green consumers and minimize the negative impact of manufacturing processes on environment. Thus, adopting green innovation is crucial for a company to overcome pressures from customers, competitors, and regulators [22,72]. Green innovation plays an important role in creating a competitive advantage in the era of environmental awareness [34,36]. Green innovation implemented in manufacturing MSMEs will have a significant impact on business performance [37]. Therefore, the more important the role of green market orientation, the more important the green innovation, and furthermore the higher the business performance. Based on the previous description, the fourth hypothesis is proposed:
Hypotheses 4 (H4).
Green innovation mediates the effect of green market orientation on business performance.

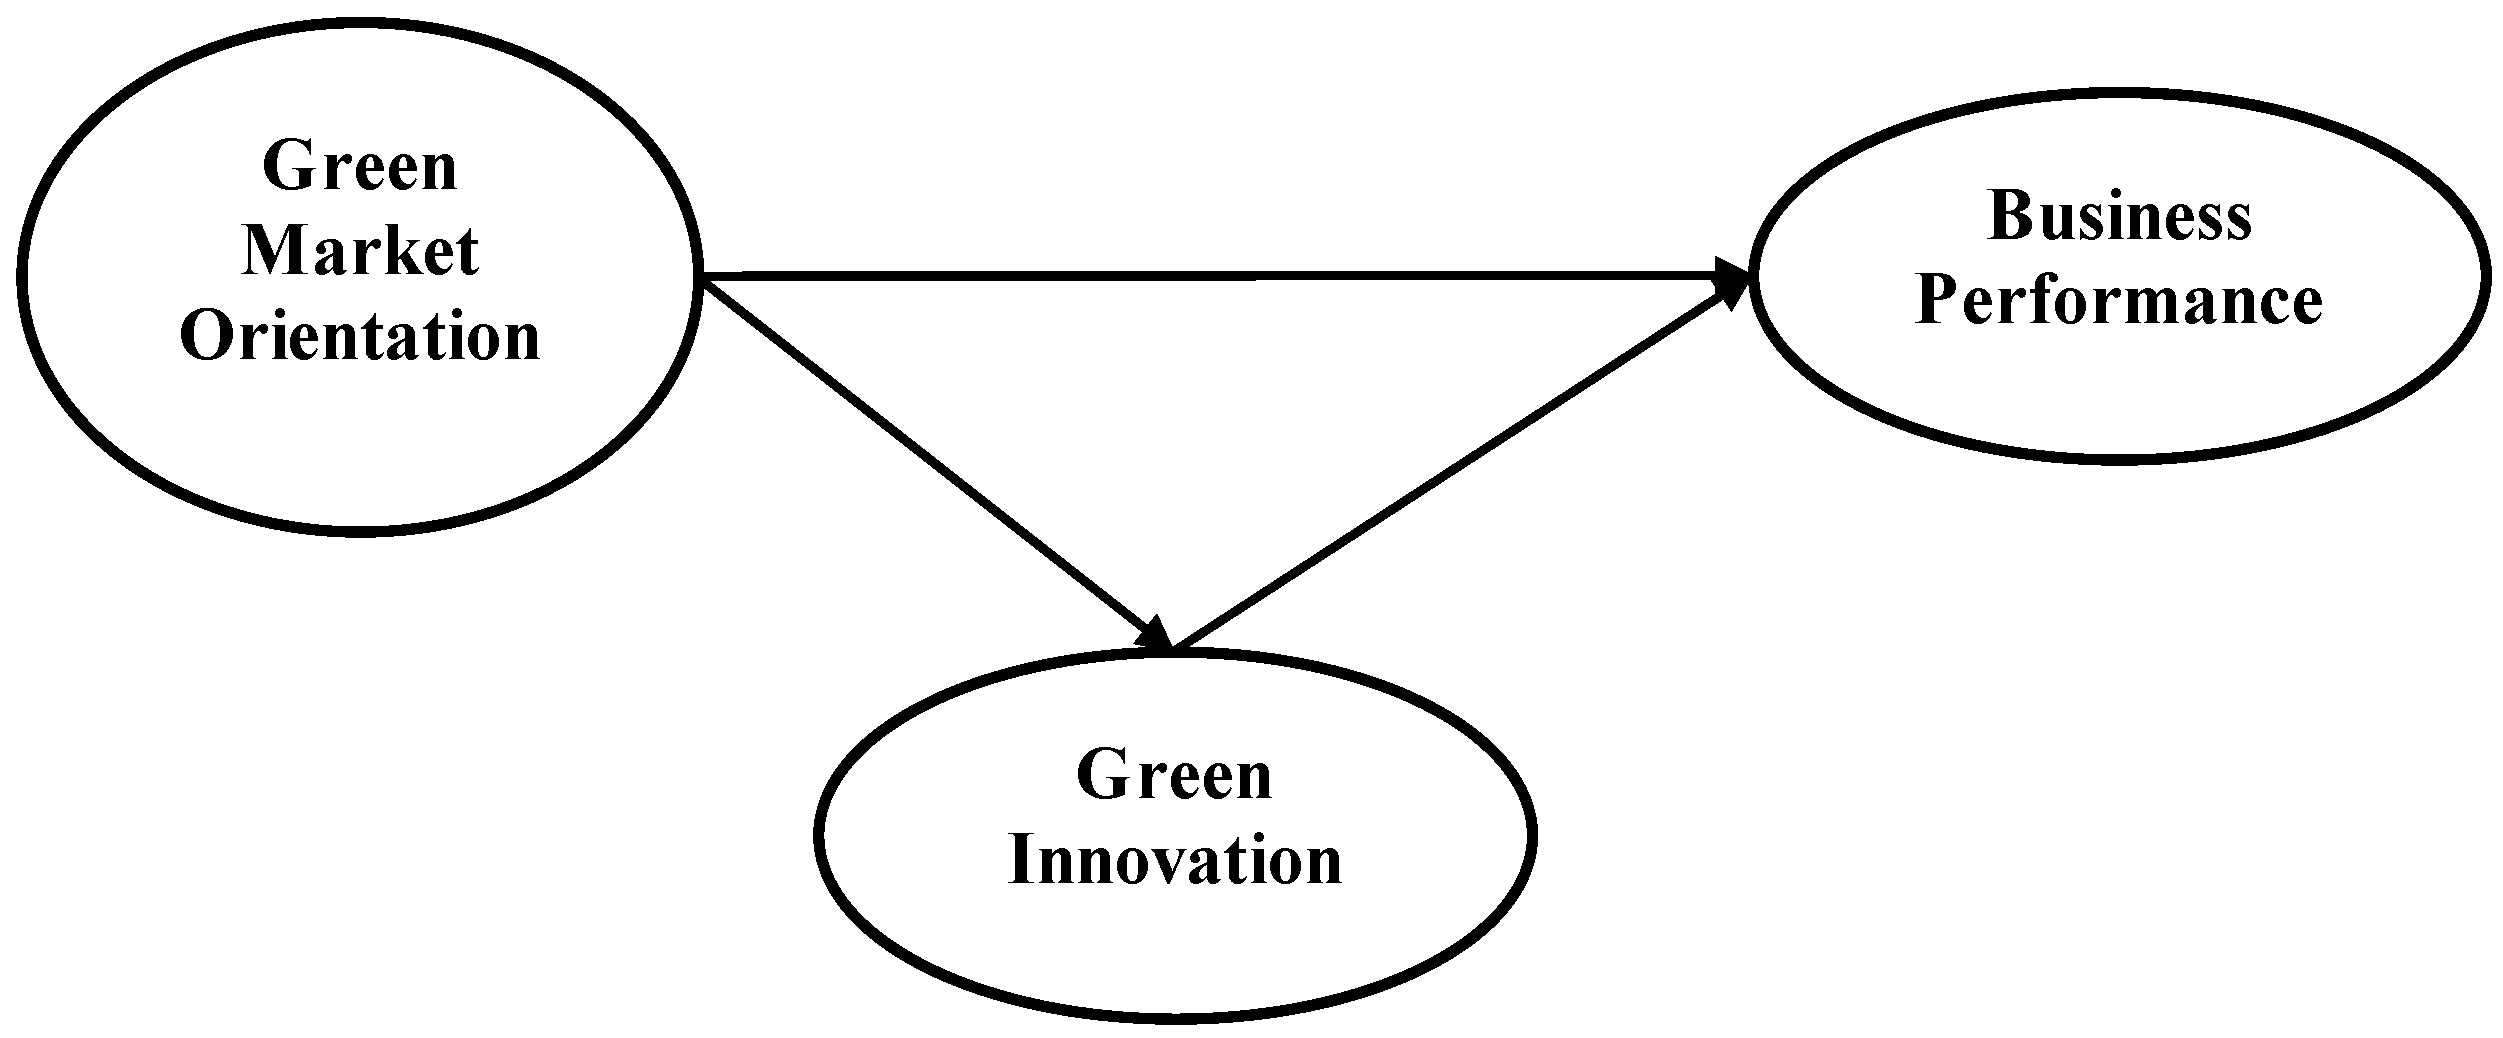
2.5. Research Framework

Based on the hypotheses developed, Figure 1 depicts the framework of this research, which is based on the theory of sustainability and entrepreneurship. This simple model describes the mediating role of green innovation on the effect of green market orientation on business performance.

3. Methodology

3.1. Research Design

This research is designed as a quantitative research study focusing on empirically investigating the effect of green market orientation on business performance. Thus, the following scenario, involving a two-step approach, was performed, to test the mediating effect of green innovation [73,74]. First, this research estimates the direct effect of green market orientation on business performance. Second, this research simultaneously estimates the effect of green market orientation on business performance, and the indirect effect of green market orientation on business performance via green innovation. When those indirect effects are significant, then green innovation can be a variable that mediates the relationship between green market orientation and business performance. Following Chin [75,76] and Nitzl [77], this research used PLS–SEM to test the hypotheses. PLS–SEM is considered suitable because of its capability in simultaneously process several independent and dependent variables, testing for mediation relationships, and handling a relatively small sample size and treating multicollinearity problems.

3.2. Data Collection

Data of the owners/managers of manufacturing MSMEs were obtained from the database of the Office of Cooperatives and MSMEs of East Java Province. A quota sampling method was applied to save on the cost and time. There are 38 cities in the East Java Province. As many as 20 questionnaires were allocated to each city. Therefore, 760 questionnaires were sent to owners/managers of the manufacturing MSMEs as respondents of the study. Before being distributed, the questionnaire was tested to 30 MSMEs in Surabaya city. The result of the pilot test confirmed the validity and reliability of the instrument. The Cronbach’s alpha of each construct was above 0.6. At the end of the survey period, as many as 175 respondents had participated in this study, and therefore the response rate was 23 percent.

3.3. Definitions and Measurements

3.3.1. Green Market Orientation

Green market orientation in this study is defined as perceived business strategies and activities to provide goods or services focusing on green consumers. To measure green market orientation, ten statements of Deshpandé and Farley [78], as well as Fatoki [8], were adopted and slightly modified to accommodate the issue of environmentally friendly market orientation. This research used the Likert scale, with ratings from “strongly disagree (1)” to “strongly agree (5)”. Those statements consist of the following items:
(1)
Customer satisfaction encourages my company to run an environmentally friendly business.
(2)
My company always commits and serves environmentally friendly customers.
(3)
My company provides employees and customers with information on environmentally friendly products and services.
(4)
My company’s competitive advantage is determined by environmentally friendly customer-oriented knowledge.
(5)
My company always measures customer satisfaction through environmentally friendly products and services attributes.
(6)
My company has a customer service that operates regularly.
(7)
My company invests more in environmentally friendly products and services than those of competitors.
(8)
My company believes that this business exists to serve environmentally friendly customers.
(9)
My company provides information for customers to assess quality of environmentally friendly products and services.
(10)
My company communicates customer satisfaction data to all employees regularly.

3.3.2. Green Innovation

Green innovation was perceived as product innovation and environmentally friendly processes carried out by companies, in order to reduce the impact of their business processes on the environment. To measure green innovation, eight statements were adopted from Chen et al. [34] and Soewarno [10]. A five-point Likert scale was used, rating from “strongly disagree (1)” to “strongly agree (5)”.
The statements are as follows:
(1)
My company has selected environmentally friendly raw materials in product development.
(2)
My company has used energy-efficient raw materials in product development.
(3)
My company has carried out efficiency of raw materials for the production process in product development.
(4)
My company has evaluated that the product is easy to reuse, recycle, and decompose.
(5)
My company has effectively reduced the emission of hazardous substances or waste in the production process.
(6)
My company has effectively recycled waste and emissions in the production process.
(7)
My company has effectively reduced the consumption of water, electricity, or oil in the production process.
(8)
My company has effectively made innovations to reduce the use of raw materials in the production process.

3.3.3. Business Performance

Business performance reflects the way a company manages its resources and the end results of its efforts in terms of financial and nonfinancial measures. Business performance in this research is defined as the perceived financial and non-financial performance achieved during the last three years. To measure the business performance, twelve statements were developed from the Balanced Scorecard perspectives of Kaplan and Norton [39]. A five-point Likert scale was used, rating from “strongly disagree (1)” to “strongly agree (5)”. The statements representing the perspectives of financial, customer, internal business process, and learning and growth are as follows, addressing the last three years:
(1)
The company’s sales tend to increase.
(2)
My company has succeeded in making various efforts for cost efficiency.
(3)
My company’s profit tends to increase.
(4)
My company is able to sell quality products at affordable prices and deliver them on time.
(5)
Customer complaints tend to decrease.
(6)
My company has been able to build an image and reputation so that loyal customers have increased.
(7)
My company has been able to improve the quality of production and services.
(8)
My company has been able to acquire new customers and retain old customers.
(9)
My company has been able to innovate on products.
(10)
Employees’ skills tend to improve.
(11)
The ability to process information using computer tends to improve.
(12)
Cooperation among employees tends to be better.

4. Results/Findings

4.1. Characteristics of Respondents

Table 1 shows the characteristics of respondents. In general, most of the respondents have experience of less than five years (61 percent). Their business is mostly in the food and beverage manufacturing industry (49 percent). Most respondents have an average annual revenue of less than or equal to 300 million rupiah (88 percent). The number of employees is between one to four people (73 percent).

4.2. Descriptive Statistics

The results of the descriptive statistics show the values of the mean, standard deviation, median, and mode of each indicator, as presented in Table 2. The mean value of 4.265 demonstrates that the respondents strongly agree with the green market orientation. The mean value of 4.218 means that the respondents strongly agree with the green innovation questionnaire items. The mean value of 4.130 means the respondents agree with the business performance questionnaire.

4.3. Measurement Model Analysis

The relationship between measurement items and construct was examined by using the measurement model analysis, consisting of the reliability and validity tests. Following Kock [79], the WARP-PLS software was used because of its ability to simultaneously test both direct and indirect effects. In this step, item and construct reliability, and convergent and discriminant validity for the constructs were also performed. This research used a cutoff point of 0.60, indicating that the specific measure contains at least 60 percent of the variance of a latent variable [75,76].
The results of the second iteration showed that all measurement items have significant loading values of above 0.60, as presented in Table 3. The results proved that the composite reliability (CR) coefficients for each construct were above 0.70, indicating that all constructs were reliable [80,81]. To test the validity of constructs, this research used the convergent and discriminant validity tests. As suggested by Fornell and Larcker [82], the AVE (Average Variance Extracted) was used to test the convergent validity. The AVE value must be greater than 0.50, to ensure that measurement error does not dominate the variance in the construct [83]. The results showed that the AVEs were above 0.50, demonstrating the evidence of convergent validity as stated by Hulland [84]. The discriminant validity test was performed in this research, to find out whether a construct shared more variance with its measures, as compared to other constructs. Therefore, a comparison between the square roots of AVEs with the correlation between constructs was performed. In order to pass the discriminant validity test, the results of the comparison must show that the square root of AVE of a construct is greater than the correlation between the construct with another construct [85]. The results in Table 4 proved that the discriminant validity was fulfilled. This concluded that the measurement model met the requirements of being reliable and valid. Thus, the next step, namely structural model analysis, can be carried out.

4.4. Structural Model Analysis

To test the hypotheses, structural model analysis was employed. This model was used to determine the effect of green market orientation on business performance directly or indirectly mediated by green innovation. A step-wise approach was used in performing structural model analysis [73,84,86]. First, this research examined whether green market orientation directly affects business performance. Second, by adding green innovation as a mediating variable, this research investigated whether green innovation mediates green market orientation–business performance relationship. Table 5 (Panel A) shows that green market orientation has a positive effect on business performance (β coefficient = 0.67; p < 0.01); therefore, H1, which stated that green market orientation has a positive effect on business performance, is supported. Further analysis was carried out by adding green innovation as a mediating variable. The results show that green market orientation affects green innovation (β coefficient = 0.70; p < 0.01), and green innovation affects business performance (β coefficient = 0.33; p < 0.01). Hence, the H2 and H3 are supported. As shown in Table 5 (Panel B), the effect of green market orientation on business performance after adding green innovation as a mediating variable remains significant (β coefficient = 0.43; p < 0.01). Thus, this result has proven that green innovation mediates the effect of green market orientation on business performance; therefore, H4 is supported.
To determine the level of mediation of green innovation on the effect of green market orientation on business performance, this research employed the variance accounted for (VAF) for the following reasons. First, it does not require any assumptions about the distribution of variables [87] (p. 81). Second, it has higher statistical power [81] (p. 223). As stated by Hair et al. [88] (p.746), the VAF < 20 percent indicates no mediation, the VAF 20–80 percent means a partial mediation, and the VAF > 80 percent demonstrates a full mediation. The value of the VAF was calculated by using the following formula:
VAF = Indirect   Effect ( Indirect   Effect + Direct   Effect )
VAF = 0.70 × 0.33 ( ( 0.70 × 0.33 ) + 0.67 )
VAF = 0.231 0.901 = 0.2564
The result shows the VAF value of 0.2564 or 25.64 percent. Thus, it confirms that green innovation partially mediates the effect of green market orientation on business performance.

5. Discussion on Open Innovation in MSMEs: Trend, Motives, and Management Challenge

The first hypothesis, which states that green market orientation has a positive effect on business performance, is supported. As stated by the sustainability theory, a company needs to address the issue of environmental awareness, to achieve a sustainable performance. Green market orientation as a type of marketing strategy will enhance business performance if it is properly managed. The results of this research confirm the sustainability theory and provide additional empirical evidence for previous studies [8,63,64]. This research has confirmed the importance of green-market-orientation strategy in enhancing the business performance of MSMEs in an era of environmental awareness. This is also in line with the emergence of green consumers and green competitors. The owners/managers of MSMEs need to implement green market orientation to direct companies to provide environmentally friendly products, to stay ahead of competition, and to coordinate opportunities in the market. MSMEs that are oriented towards environmentally friendly markets should implement the principle of sustainability in their business activities to improve business performance. Thus, the better the implementation of green market orientation, the better the business performance.
The second hypothesis, which states that green market orientation has a positive effect on green innovation, is also supported. As stated by the entrepreneurship theory, a company needs to continuously innovate in order to have a sustainable performance. This result is in line with the previous studies [22,67,68]. In today’s environmentally conscious era, consumers tend to buy environmentally friendly products and encourage companies to carry out environmentally friendly business practices. Therefore, manufacturing MSMEs need to focus on green innovation to meet market needs. Green market orientation drives companies to improve product innovations, to produce environmentally friendly products and process innovations, to minimize the negative impact of their business processes on the environment. Thus, owners/managers of MSMEs need to have an understanding that the increase in green market orientation will encourage green innovations in the company.
The third hypothesis, which states that green innovation has a positive effect on business performance, is supported. The results provide additional empirical evidence for previous research [2,4,38]. These results indicate that, in the era of environmentally conscious business competition, the role of green innovation is very crucial for manufacturing MSMEs. Green innovation enables manufacturing MSMEs to drive sustainable production and to contribute to performance achievement. The implementation of green innovation will produce a better business performance, such as cost efficiency, increased profit, improved product quality, and better reputation. Thus, the owners/managers of MSMEs need to better understand their need to continuously innovate in green product innovations and green process innovations, to achieve a better business performance.
The fourth hypothesis, which states that green innovation mediates the effect of green market orientation on business performance, is also supported. This result confirms and provides empirical evidence for the sustainability theory and the entrepreneurship theory in the Indonesian MSMEs research setting. This study also provides a deeper understanding to the owners/managers of MSMEs in East Java on the mechanism of how green market orientation affects business performance via green innovation. This study convinces the owners/managers of MSMEs regarding the mediating role of green innovation on green market orientation–business performance relationship. Therefore, it is crucial to encourage green product innovations and green process innovation, to meet green consumers’ needs, as well as to compete with green competitors.

6. Conclusions

The focus of this research was to investigate the mediating role of green innovation on green market orientation–business performance relationship. Using a sample of 175 manufacturing MSMEs in the East Java Province, Indonesia, this research proves that green market orientation has a positive effect on business performance. Furthermore, it has proven that green innovation mediates the effect of green market orientation on business performance. Manufacturing MSMEs are one of the contributors to environmental problems in Indonesia. Lack of implementation of environmentally friendly business practices has caused environmental problems that must be seriously addressed. In the era of sustainable development, MSMEs need to pay attention to factors that can affect their business sustainability, especially environmental, social, and economic factors. MSMEs need to be environmentally friendly market–oriented to contribute to sustainability, meet the needs of green consumers, and improve business performance.
This research provides more comprehensive knowledge on the importance of green innovation in in green market orientation–business performance relationship. Companies that are oriented towards environmentally friendly markets will carry out business practices by minimizing their impact on the environment. Therefore, companies need to apply green innovation to carry out environmentally friendly business processes and provide environmentally friendly products. The results of this research imply that, by performing green innovation, the company will obtain an improved business performance. Thus, Indonesian manufacturing MSMEs need to understand the important role of green innovation as a tool for carrying out environmentally friendly business practices, to improve business performance in an environmentally conscious era.

6.1. Contribution to Theory

All of the hypotheses studied are supported. This means that this research provides empirical evidence for the development of both sustainability and the entrepreneurship theories. Green market orientation has a crucial role in enhancing business performance. The result has confirmed the relationship and provided the empirical evidence in the research setting of Indonesian MSMEs. Sustainability theory states that companies have to address social, environment, and economic issues, to achieve sustainable business performance. Green-market-orientation strategy is needed to fulfill green market demand, and it also requires green innovation to provide environmentally friendly products and processes and to compete with competitors. Furthermore, the better the green innovation, the higher the business performance. This study theoretically demonstrates the mechanism of how green market orientation affects business performance via green innovation.

6.2. Contribution to Practice

Practically, this research model offers a comprehensive knowledge for the owners/managers of Indonesian manufacturing MSMEs who need to improve their business performance in the era of sustainable development. This research indicates that they need to review their marketing strategy and investigate the role of green market orientation and green innovation in their companies. More specifically, the review of marketing strategies includes re-segmentation, retargeting, and repositioning of products in environmentally oriented markets and executes those strategies accordingly. This new perspective of marketing strategy also demands changes in production processes, in order to align with green-market-orientation goals. Supplier selection, production, and distribution processes must meet environmentally friendly requirements and regulations. In the era of environmental concern, manufacturing MSMEs should have an environmentally friendly market and business processes. However, it should also be understood that operating in an environmentally friendly market is not enough to directly improve business performance. They should encourage green innovation, to minimize the negative impact of operational processes on the environment and meet the needs of green consumers and other stakeholders. Innovative capacity must be improved to enhance business performance [89]. Thus, this research implies that the Indonesian manufacturing MSMEs need to adopt a green market orientation and to carry out green innovation, to achieve a better business performance.

6.3. Contribution to Society

Environmental issues have become a worldwide problem that needs to be seriously addressed. This research offers a simple model on how to improve business performance in the era of sustainable development, which brings many benefits to society. Indonesian manufacturing MSMEs are one of contributors to environmental problems. The research model and results of this research have provided evidence for society regarding the importance of improving business performance via green market orientation and green innovation. Thus, when manufacturing MSMEs in Indonesia apply this model, they will contribute to society in the forms of environmentally friendly products, resource efficiency, and quality-of-life improvements.

7. Research Limitations

This research is not without limitations. First, it heavily relied on the survey method. The survey method has weaknesses related to the ability of respondents to provide the required information, limitation of items in the questionnaire, and human bias in filling out the questionnaire. Future studies are encouraged to use secondary data. Second, it employed PLS–SEM to test the hypotheses. Future studies are encouraged to use an alternative method, such as an experimental method to get a better cause–effect relationship. Third, it focused on manufacturing MSMEs in East Java, Indonesia, with a relatively small sample size due to the Covid-19 pandemic. It was difficult to meet with owners/managers of MSMEs during the survey period. Therefore, the data collection depended greatly on online questionnaires. Fourth, not all owners/managers of MSMEs have the same expertise in responding to electronic questionnaires, making data collection more difficult. Finally, there was a limited time framework of this research. Therefore, the researchers could not conduct in-depth interviews to better portray the real situation faced by MSMEs. Although this research has limitations, it still offers both theoretical and practical benefits and supports the owners/managers by providing a mechanism of how green innovation plays a crucial role in the green market orientation–business performance relationship.

Author Contributions

Conceptualization, B.T. and N.S.; Methodology, B.T. and H.H.; Validation, L.N.N. and N.K.; Formal Analysis, N.S. and N.K.; Investigation, L.N.N. and V.N.; Resources, V.N., H.H. and N.S.; Data Curation, V.N. and L.N.N.; Writing-Original Draft Preparation, H.H., L.N.N. and N.K.; Writing-Review & Editing, B.T. and N.S.; Supervision, B.T. and N.S.; Project Administration, L.N.N. and V.N.; Funding Acquisition, B.T. All authors have read and agreed to the published version of the manuscript.

Funding

This research was funded by Universitas Airlangga.

Conflicts of Interest

The authors declare no conflict of interest.

References

  1. Chang, N.-J.; Fong, C.-M. Green product quality, green corporate image, green customer satisfaction, and green customer loyalty. Afr. J. Bus. Manag. 2010, 4, 2836–2844. [Google Scholar]
  2. Weng, H.-H.R.; Chen, J.-S.; Chen, P.-C. Effects of green innovation on environmental and corporate performance: A stakeholder perspective. Sustainability 2015, 7, 4997–5026. [Google Scholar] [CrossRef] [Green Version]
  3. Li, H.; Zhang, J.; Osei, E.; Yu, M. Sustainable development of China’s industrial economy: An empirical study of the period 2001–2011. Sustainability 2018, 10, 764. [Google Scholar] [CrossRef] [Green Version]
  4. Chan, H.K.; Yee, R.W.; Dai, J.; Lim, M.K. The moderating effect of environmental dynamism on green product innovation and performance. Int. J. Prod. Econ. 2016, 181, 384–391. [Google Scholar] [CrossRef]
  5. Dangelico, R.M.; Pujari, D. Mainstreaming green product innovation: Why and how companies integrate environmental sustainability. J. Bus. Ethics 2010, 95, 471–486. [Google Scholar] [CrossRef]
  6. Environmental Pillar: Indicator of Sustainable Development. 2018. Available online: https://www.bps.go.id/publication/2018/12/07/436ef7afce66e6828f3ff7c3/pilar-lingkungan--indikator-pembangunan-berkelanjutan-2018.html (accessed on 14 February 2019).
  7. Kumar, P.; Ghodeswar, B.M. Factors affecting consumers’ green product purchase decisions. Mark. Intell. Plan. 2015, 33, 330–347. [Google Scholar] [CrossRef]
  8. Fatoki, O. Green Marketing Orientation and Environmental and Social Performance of Hospitality Firms in South Africa. Found. Manag. 2019, 11, 277–290. [Google Scholar] [CrossRef] [Green Version]
  9. DeBoer, J.; Panwar, R.; Rivera, J. Toward a place-based understanding of business sustainability: The role of green competitors and green locales in firms’ voluntary environmental engagement. Bus. Strategy Environ. 2017, 26, 940–955. [Google Scholar] [CrossRef]
  10. Soewarno, N.; Tjahjadi, B.; Fithrianti, F. Green innovation strategy and green innovation. Manag. Decis. 2019, 57, 3061–3078. [Google Scholar] [CrossRef]
  11. Tseng, S.-C.; Hung, S.-W. A framework identifying the gaps between customers’ expectations and their perceptions in green products. J. Clean. Prod. 2013, 59, 174–184. [Google Scholar] [CrossRef]
  12. Zhou, Y. The role of green customers under competition: A mixed blessing? J. Clean. Prod. 2018, 170, 857–866. [Google Scholar] [CrossRef]
  13. Papadas, K.; Avlonitis, G.; Carrigan, M. Green marketing orientation: Conceptualization, scale development and validation. J. Bus. Res. 2017, 80, 236–246. [Google Scholar] [CrossRef]
  14. Vilkaite-Vaitone, N.; Skackauskiene, I. Green marketing orientation: Evolution, conceptualization and potential benefits. Open Econ. 2019, 2, 53–62. [Google Scholar] [CrossRef] [Green Version]
  15. Costantini, V.; Crespi, F.; Marin, G.; Paglialunga, E. Eco-innovation, sustainable supply chains and environmental performance in European industries. J. Clean. Prod. 2017, 155, 141–154. [Google Scholar] [CrossRef]
  16. Tariq, A.; Badir, Y.; Chonglerttham, S. Green innovation and performance: Moderation analyses from Thailand. Eur. J. Innov. Manag. 2019, 22, 446–467. [Google Scholar] [CrossRef]
  17. Fauzi, H.; Svensson, G.; Rahman, A.A. “Triple bottom line” as “Sustainable corporate performance”: A proposition for the future. Sustainability 2010, 2, 1345–1360. [Google Scholar] [CrossRef] [Green Version]
  18. Goyal, P.; Rahman, Z.; Kazmi, A.A. Corporate sustainability performance and firm performance research. Manag. Decis. 2013, 51, 361–379. [Google Scholar] [CrossRef]
  19. Svensson, G.; Wagner, B. Implementing and managing economic, social and environmental efforts of business sustainability. Manag. Environ. Qual. 2015, 26, 195–213. [Google Scholar] [CrossRef]
  20. Braccini, A.M.; Margherita, E.G. Exploring organizational sustainability of industry 4.0 under the triple bottom line: The case of a manufacturing company. Sustainability 2019, 11, 36. [Google Scholar] [CrossRef] [Green Version]
  21. Horbach, J.; Rammer, C.; Rennings, K. Determinants of eco-innovations by type of environmental impact—The role of regulatory push/pull, technology push and market pull. Ecol. Econ. 2012, 78, 112–122. [Google Scholar] [CrossRef] [Green Version]
  22. Lin, R.-J.; Chen, R.-H.; Huang, F.-H. Green innovation in the automobile industry. Ind. Manag. Data Syst. 2014, 114, 886–903. [Google Scholar] [CrossRef]
  23. Khurana, S.; Haleem, A.; Mannan, B. Determinants for integration of sustainability with innovation for Indian manufacturing enterprises: Empirical evidence in MSMEs. J. Clean. Prod. 2019, 229, 374–386. [Google Scholar] [CrossRef]
  24. Aghion, P.; Festré, A. Schumpeterian growth theory, Schumpeter, and growth policy design. J. Evol. Econ. 2017, 27, 25–42. [Google Scholar] [CrossRef]
  25. González-Pernía, J.L.; Jung, A.; Peña, I. Innovation-driven entrepreneurship in developing economies. Entrep. Reg. Dev. 2015, 27, 555–573. [Google Scholar] [CrossRef]
  26. Kirca, A.H.; Jayachandran, S.; Bearden, W.O. Market Orientation: A Meta-Analytic Review and Assessment of its Antecedents and Impact on Performance. J. Mark. 2005, 69, 24–41. [Google Scholar] [CrossRef] [Green Version]
  27. Lee, Y.-K.; Kim, S.-H.; Seo, M.-K.; Hight, S.K. Market orientation and business performance: Evidence from franchising industry. Int. J. Hosp. Manag. 2015, 44, 28–37. [Google Scholar] [CrossRef]
  28. Salehzadeh, R.; Pool, J.K.; Tabaeeian, R.A.; Amani, M.; Mortazavi, M. The impact of internal marketing and market orientation on performance: An empirical study in restaurant industry. Meas. Bus. Excell. 2017, 21, 273–290. [Google Scholar] [CrossRef]
  29. Länsiluoto, A.; Joensuu-Salo, S.; Varamäki, E.; Viljamaa, A.; Sorama, K. Market orientation and performance measurement system adoption impact on performance in SMEs. J. Small Bus. Manag. 2018, 57, 1027–1043. [Google Scholar] [CrossRef]
  30. Uzkurt, C.; Kimzan, H.S.; Yılmaz, C. A case study of the mediating role of innovation on the relationship between environmental uncertainty, market orientation, and firm performance. Int. J. Innov. Technol. Manag. 2016, 13, 1750003. [Google Scholar] [CrossRef]
  31. Ho, K.L.P.; Nguyen, C.N.; Adhikari, R.; Miles, M.P.; Bonney, L. Exploring market orientation, innovation, and financial performance in agricultural value chains in emerging economies. J. Innov. Knowl. 2017, 3, 154–163. [Google Scholar] [CrossRef]
  32. D’Souza, C.; Taghian, M.; Sullivan-Mort, G.; Gilmore, A. An evaluation of the role of green marketing and a firm’s internal practices for environmental sustainability. J. Strateg. Mark. 2015, 23, 600–615. [Google Scholar] [CrossRef]
  33. Ahmadzadeh, M.; Eidi, F.; Kagopour, M. Studying the effects of environmental commitments on green marketing strategies. Int. J. Econ. Perspect. 2017, 11, 816–823. [Google Scholar]
  34. Chen, Y.-S.; Lai, S.-B.; Wen, C.-T. The influence of green innovation performance on corporate advantage in Taiwan. J. Bus. Ethics 2006, 67, 331–339. [Google Scholar] [CrossRef]
  35. Song, W.; Yu, H. Green innovation strategy and green innovation: The roles of green creativity and green organizational identity. Corp. Soc. Responsib. Environ. Manag. 2017, 25, 135–150. [Google Scholar] [CrossRef]
  36. Chiou, T.-Y.; Chan, H.K.; Lettice, F.; Chung, S.H. The influence of greening the suppliers and green innovation on environmental performance and competitive advantage in Taiwan. Transp. Res. Part E Logist. Transp. Rev. 2011, 47, 822–836. [Google Scholar] [CrossRef]
  37. Singh, M.P.; Chakraborty, A.; Roy, M. The link among innovation drivers, green innovation and business performance: Empirical evidence from a developing economy. World Rev. Sci. Technol. Sustain. Dev. 2016, 12, 316–334. [Google Scholar] [CrossRef]
  38. El-Kassar, A.-N.; Singh, S.K. Green innovation and organizational performance: The influence of big data and the moderating role of management commitment and HR practices. Technol. Forecast. Soc. Chang. 2018, 144, 483–498. [Google Scholar] [CrossRef]
  39. Kaplan, R.S.; Norton, D.P. Strategy Maps: Converting Intangible Assets into Tangible Outcomes; Hadvard Business Press: Brighton, UK, 2004. [Google Scholar]
  40. Wang, Y.; Bhanugopan, R.; Lockhart, P. Examining the quantitative determinants of organizational performance: Evidence from China. Meas. Bus. Excell. 2015, 19, 23–41. [Google Scholar] [CrossRef]
  41. Muthuveloo, R.; Shanmugam, N.; Teoh, A.P. The impact of tacit knowledge management on organizational performance: Evidence from Malaysia. Asia Pac. Manag. Rev. 2017, 22, 192–201. [Google Scholar] [CrossRef]
  42. Cheng, C.C.; Yang, C.-L.; Sheu, C. The link between eco-innovation and business performance: A Taiwanese industry context. J. Clean. Prod. 2014, 64, 81–90. [Google Scholar] [CrossRef] [Green Version]
  43. Huang, J.-W.; Li, Y.-H. Green innovation and performance: The view of organizational capability and social reciprocity. J. Bus. Ethics 2015, 145, 309–324. [Google Scholar] [CrossRef]
  44. Bagur-Femenias, L.; Llach, J.; del Mar Alonso-Almeida, M. Is the adoption of environmental practices a strategical decision for small service companies? Manag. Decis. 2013, 51, 41–62. [Google Scholar] [CrossRef]
  45. Industri Kecil Menengah Serap 78 Persen Tenaga Kerja di Jatim. Available online: http://kominfo.jatimprov.go.id/read/umum/industri-kecil-menengah-serap-78-persen-tenaga-kerja-di-jatim (accessed on 14 February 2019).
  46. Indicators of Indonesia’s 2019 Sustainable Development Goals (TPB). Available online: https://www.bps.go.id/publication/2019/12/25/7ac89aed4ab8a22260d63ceb/indikator-tujuan-pembangunan-berkelanjutan--tpb--indonesia-2019.html (accessed on 14 February 2019).
  47. Hansmann, R.; Mieg, H.A.; Frischknecht, P. Principal sustainability components: Empirical analysis of synergies between the three pillars of sustainability. Int. J. Sustain. Dev. World Ecol. 2012, 19, 451–459. [Google Scholar] [CrossRef]
  48. Strezov, V.; Evans, A.; Evans, T.J. Assessment of the economic, social and environmental dimensions of the indicators for sustainable development. Sustain. Dev. 2016, 25, 242–253. [Google Scholar] [CrossRef]
  49. Azevedo, S.G.; Carvalho, H.; Duarte, S.; Cruz-Machado, V. Influence of green and lean upstream supply chain management practices on business sustainability. IEEE Trans. Eng. Manag. 2012, 59, 753–765. [Google Scholar] [CrossRef]
  50. Jabareen, Y. A new conceptual framework for sustainable development. Environ. Dev. Sustain. 2008, 10, 179–192. [Google Scholar] [CrossRef]
  51. Barkemeyer, R.; Holt, D.; Preuss, L.; Tsang, S. What happened to the ‘development’in sustainable development? Business guidelines two decades after Brundtland. Sustain. Dev. 2014, 22, 15–32. [Google Scholar] [CrossRef] [Green Version]
  52. Chang, R.-D.; Zuo, J.; Zhao, Z.-Y.; Zillante, G.; Gan, X.-L.; Soebarto, V. Evolving theories of sustainability and firms: History, future directions and implications for renewable energy research. Renew. Sustain. Energy Rev. 2017, 72, 48–56. [Google Scholar] [CrossRef]
  53. Elkington, J. Cannibals with Forks: The Triple Bottom Line of 21st Century Business; Capstone: Oxford, UK, 1997. [Google Scholar]
  54. Coffman, M.; Umemoto, K. The triple-bottom-line: Framing of trade-offs in sustainability planning practice. Environ. Dev. Sustain. 2010, 12, 597–610. [Google Scholar] [CrossRef]
  55. Markley, M.J.; Davis, L. Exploring future competitive advantage through sustainable supply chains. Int. J. Phys. Distrib. Logist. Manag. 2007, 37, 763–774. [Google Scholar] [CrossRef]
  56. Gimenez, C.; Sierra, V.; Rodon, J. Sustainable operations: Their impact on the triple bottom line. Int. J. Prod. Econ. 2012, 140, 149–159. [Google Scholar] [CrossRef]
  57. Narver, J.C.; Slater, S.F. The Effect of a Market Orientation on Business Profitability. J. Mark. 1990, 54, 20–35. [Google Scholar] [CrossRef]
  58. Chabowski, B.R.; Mena, J.A. A Review of Global Competitiveness Research: Past Advances and Future Directions. J. Int. Mark. 2017, 25, 1–24. [Google Scholar] [CrossRef]
  59. Masa’deh, R.E.; Al-Henzab, J.; Tarhini, A.; Obeidat, B.Y. The associations among market orientation, technology orientation, entrepreneurial orientation and organizational performance. Benchmarking 2018, 25, 3117–3142. [Google Scholar] [CrossRef]
  60. Glavič, P.; Lukman, R. Review of sustainability terms and their definitions. J. Clean. Prod. 2007, 15, 1875–1885. [Google Scholar] [CrossRef]
  61. Moravcikova, D.; Krizanova, A.; Kliestikova, J.; Rypakova, M. Green marketing as the source of the competitive advantage of the business. Sustainability 2017, 9, 2218. [Google Scholar] [CrossRef] [Green Version]
  62. Fraj, E.; Martínez, E.; Matute, J. Green marketing strategy and the firm’s performance: The moderating role of environmental culture. J. Strateg. Mark. 2011, 19, 339–355. [Google Scholar] [CrossRef]
  63. Amegbe, H.; Owino, J.O.; Nuwasiima, A. Green Marketing Orientation (GMO) and Performance of SMEs in Ghana. Am. J. Manag. 2017, 11, 99–109. [Google Scholar]
  64. Lu, L.; Bock, D.; Joseph, M. Green marketing: What the Millennials buy. J. Bus. Strateg. 2013, 34, 3–10. [Google Scholar] [CrossRef]
  65. Sarkar, A. Green branding and eco-innovations for evolving a sustainable green marketing strategy. Asia-Pac. J. Manag. Res. Innov. 2012, 8, 39–58. [Google Scholar] [CrossRef]
  66. Block, J.H.; Fisch, C.O.; Van Praag, M. The Schumpeterian entrepreneur: A review of the empirical evidence on the antecedents, behaviour and consequences of innovative entrepreneurship. Ind. Innov. 2016, 24, 61–95. [Google Scholar] [CrossRef]
  67. Beck, L.; Janssens, W.; Debruyne, M.; Lommelen, T. A study of the relationships between generation, market orientation, and innovation in family firms. Fam. Bus. Rev. 2011, 24, 252–272. [Google Scholar] [CrossRef]
  68. Nasution, H.N.; Mavondo, F.T.; Matanda, M.J.; Ndubisi, N.O. Entrepreneurship: Its relationship with market orientation and learning orientation and as antecedents to innovation and customer value. Ind. Mark. Manag. 2011, 40, 336–345. [Google Scholar] [CrossRef]
  69. Song, J.; Wei, Y.S.; Wang, R. Market orientation and innovation performance: The moderating roles of firm ownership structures. Int. J. Res. Mark. 2015, 32, 319–331. [Google Scholar] [CrossRef]
  70. Kammerer, D. The effects of customer benefit and regulation on environmental product innovation.: Empirical evidence from appliance manufacturers in Germany. Ecol. Econ. 2009, 68, 2285–2295. [Google Scholar] [CrossRef]
  71. Kopnina, H. Sustainability: New strategic thinking for business. Environ. Dev. Sustain. 2015, 19, 27–43. [Google Scholar] [CrossRef] [Green Version]
  72. Porter, M.E.; van der Linde, C. Green and competitive: Ending the stalemate. Harv. Bus. Rev. 1995, 73, 120–134. [Google Scholar]
  73. Baron, R.M.; Kenny, D.A. The moderator–mediator variable distinction in social psychological research: Conceptual, strategic, and statistical considerations. J. Personal. Soc. Psychol. 1986, 51, 1173–1182. [Google Scholar] [CrossRef]
  74. Hair, J.; Ringle, C.; Sarstedt, M. PLS-SEM: Indeed a silver bullet. J. Mark. Theory Pract. 2011, 19, 139–151. [Google Scholar] [CrossRef]
  75. Chin, W.W. Issues and opinion on SEM. MIS Q. 1998, 51, 1173–1182. [Google Scholar]
  76. Chin, W.W. The partial least squares approach to structural equation modelling. In Modern Methods for Business Research; Marcoulides, G.A., Ed.; Lawrence Erlbaum Associates Publisher: London, UK, 1998; pp. 295–336. [Google Scholar]
  77. Nitzl, C. The use of partial least squares structural equation modelling (PLS-SEM) in management accounting research: Directions for future theory development. J. Account. Lit. 2016, 37, 19–35. [Google Scholar] [CrossRef]
  78. Deshpandé, R.; Farley, J.U. Measuring market orientation: Generalization and synthesis. J. Mark. Focused Manag. 1998, 2, 213–232. [Google Scholar] [CrossRef]
  79. Kock, N. Advantages of nonlinear over segmentation analyses in path models. Int. J. E-Collab. 2016, 12, 1–6. [Google Scholar] [CrossRef] [Green Version]
  80. Nunnaly, J.C. Psychometric Theory; McGraw-Hill: New York, NY, USA, 1967. [Google Scholar]
  81. Hair, J.F.; Black, W.C.; Babin, B.J.; Anderson, R.E. Multivariate Data Analysis, 7th ed.; illustrated and revised; Pearson Education Limited: Harlow, UK, 2013. [Google Scholar]
  82. Vandenbosch, M.B. Confirmatory compositional approaches to the development of product spaces. Eur. J. Mark. 1996, 30, 23–46. [Google Scholar] [CrossRef]
  83. Hulland, J. Use of partial least squares (PLS) in strategic management research: A review of four recent studies. Strateg. Manag. J. 1999, 20, 195–204. [Google Scholar] [CrossRef]
  84. Hartmann, F.; Slapničar, S. How formal performance evaluation affects trust between superior and subordinate managers. Account. Organ. Soc. 2009, 34, 722–737. [Google Scholar] [CrossRef]
  85. Fornell, C.; Larcker, D.F. Evaluating structural equation models with unobservable variables and measurement error. J. Mark. Res. 1981, 18, 39–50. [Google Scholar] [CrossRef]
  86. Luft, J.; Shields, M.D. Mapping management accounting: Graphics and guidelines for theory-consistent empirical research. Account. Organ. Soc. 2003, 28, 169–249. [Google Scholar] [CrossRef]
  87. Sholihin, M.; Ratmono, D. Analisis SEMPLS Dengan WarpPLS 3.0 Untuk Hubungan Nonlinier Dalam Penelitian Sosial dan Bisnis; Andi Offset: Yogyakarta, India, 2013; p. 81. [Google Scholar]
  88. Hair, J.F.; Black, W.C.; Barry, J.; Rolph, E.A. Multivariate Data Analysis, 7th ed.; Prentice Hall International: New York, NY, USA, 2010; p. 746. [Google Scholar]
  89. Rakthai, T.; Aujirapongpan, S.; Suanpong, K. Innovative Capacity and the Performance of Businesses Incubated in University Incubator Units: Empirical Study from Universities in Thailand. J. Open Innov. Technol. Mark. Complex. 2019, 5, 33. [Google Scholar] [CrossRef] [Green Version]
Figure 1. Conceptual research framework.
Joitmc 06 00173 g001
Table 1. Characteristics of respondents.
ClassificationDescriptionFrequency
TotalPercentage
Experience≤5 years10761
6–10 years 4526
11–15 years 106
>15 years 137
Total175100
ProductsFood and Beverages8549
Crafts and Accessories3218
Dress/Fashion85
Traditional Batik2313
Bag53
Shoes32
Others1911
Total175100
Average Annual Revenue≤Rp300 million rupiah15488
>Rp300 million–Rp2.5 billion148
>Rp2.5 billion–Rp50 billion74
Total175100
Number of employees1–4 people12773
5–19 people4123
20–99 people74
Total175100
Source: data processed by researchers.
Table 2. Results of descriptive statistics.
Construct MeanCategory
Green Market Orientation4.3Strongly agree
Green Innovation4.2Strongly agree
Business Performance4.1Agree
IndicatorsMeanSDMinMaxMedianMode
GMO 14.60.71.05.05.05.0
GMO 24.50.71.05.05.05.0
GMO 34.50.71.05.05.05.0
GMO 44.30.81.05.04.04.0
GMO 54.30.81.05.04.05.0
GMO 63.81.11.05.04.04.0
GMO 74.10.81.05.04.04.0
GMO 84.30.81.05.04.05.0
GMO 94.20.81.05.04.05.0
GMO 104.00.91.05.04.04.0
GI 14.50.71.05.05.05.0
GI 24.40.71.05.05.05.0
GI 34.40.81.05.04.05.0
GI 43.91.11.05.04.05.0
GI 54.50.71.05.05.05.0
GI 64.01.11.05.04.05.0
GI 74.20.91.05.04.05.0
GI 84.01.01.05.04.05.0
BP 13.81.01.05.04.04.0
BP 24.00.91.05.04.04.0
BP 33.71.01.05.04.04.0
BP 44.10.81.05.04.04.0
BP 54.10.91.05.04.04.0
BP 64.40.71.05.04.05.0
BP 74.30.71.05.04.04.0
BP 84.30.81.05.04.05.0
BP 94.30.71.05.04.05.0
BP 104.20.81.05.04.04.0
BP 114.10.91.05.04.04.0
BP 124.20.71.05.04.04.0
Source: data processed by researchers. Notes: Interval = (highest score − lowest score)/number of scores interval = (5 − 1)/5 = 0.8. Criteria of the average respondents’ answers: (1) 1.00 < α < 1.79, strongly disagree; (2) 1.80 < α < 2.59, disagree; (3) 2.60 < α < 3.39, neutral; (4) 3.40 < α < 4.19, agree; and (5) 4.20 < α < 5.00, strongly agree. GMO, green market orientation; GI, green innovation; BP, business performance.
Table 3. Reliability and convergent validity.
ConstructLoadingp-Values
Green Market Orientation (Composite Reliability = 0.948; AVE = 0.648)
GMO 10.726<0.001
GMO 20.823<0.001
GMO 30.810<0.001
GMO 40.847<0.001
GMO 50.849<0.001
GMO 60.647<0.001
GMO 70.779<0.001
GMO 80.862<0.001
GMO 90.869<0.001
GMO 100.808<0.001
Business Performance (Composite Reliability = 0.955; AVE = 0.661)
BP 10.758<0.001
BP 20.776<0.001
BP 30.744<0.001
BP 40.824<0.001
BP 60.873<0.001
BP 70.864<0.001
BP 80.831<0.001
BP 90.846<0.001
BP 100.833<0.001
BP 110.728<0.001
BP 120.851<0.001
Green Innovation (Composite Reliability = 0.909; AVE = 0.557)
GI 10.784<0.001
GI 20.803<0.001
GI 30.818<0.001
GI 40.712<0.001
GI 50.761<0.001
GI 60.702<0.001
GI 70.695<0.001
GI 80.683<0.001
Note: AVE: Average Variance Extracted. Source: data processed by researchers.
Table 4. Discriminant validity.
Green Market OrientationBusiness PerformanceGreen Innovation
Green Market Orientation0.8050.6620.678
Business Performance0.6620.8130.619
Green Innovation0.6780.6190.747
Source: data processed by researchers.
Table 5. Summary of the structural model analysis.
Panel A (before Including Green Innovation as the Mediating Variable)
Hypothesesβ CoefficientDecision
Green Market Orientation > Business
Performance
0.67 ***Supported
Panel B (after including green innovation as the mediating variable)
Hypothesesβ CoefficientDecision
Green Market Orientation > Business
Performance
0.43 ***Supported
Green Market Orientation > Green Innovation0.70 ***Supported
Green Innovation > Business Performance0.33 ***Supported
HypothesesVAFDecision
Green Market Orientation > Green Innovation > Business Performance25.64 percentPartial Mediation, Supported
Source: data processed by researchers. Notes: (1) *** p < 0.01; (2) VAF value is between 20 and 80 percent.
Publisher’s Note: MDPI stays neutral with regard to jurisdictional claims in published maps and institutional affiliations.

