Knowledge Sharing and Transfer in an Open Innovation Context: Mapping Scientific Evolution


Abstract
:1. Introduction
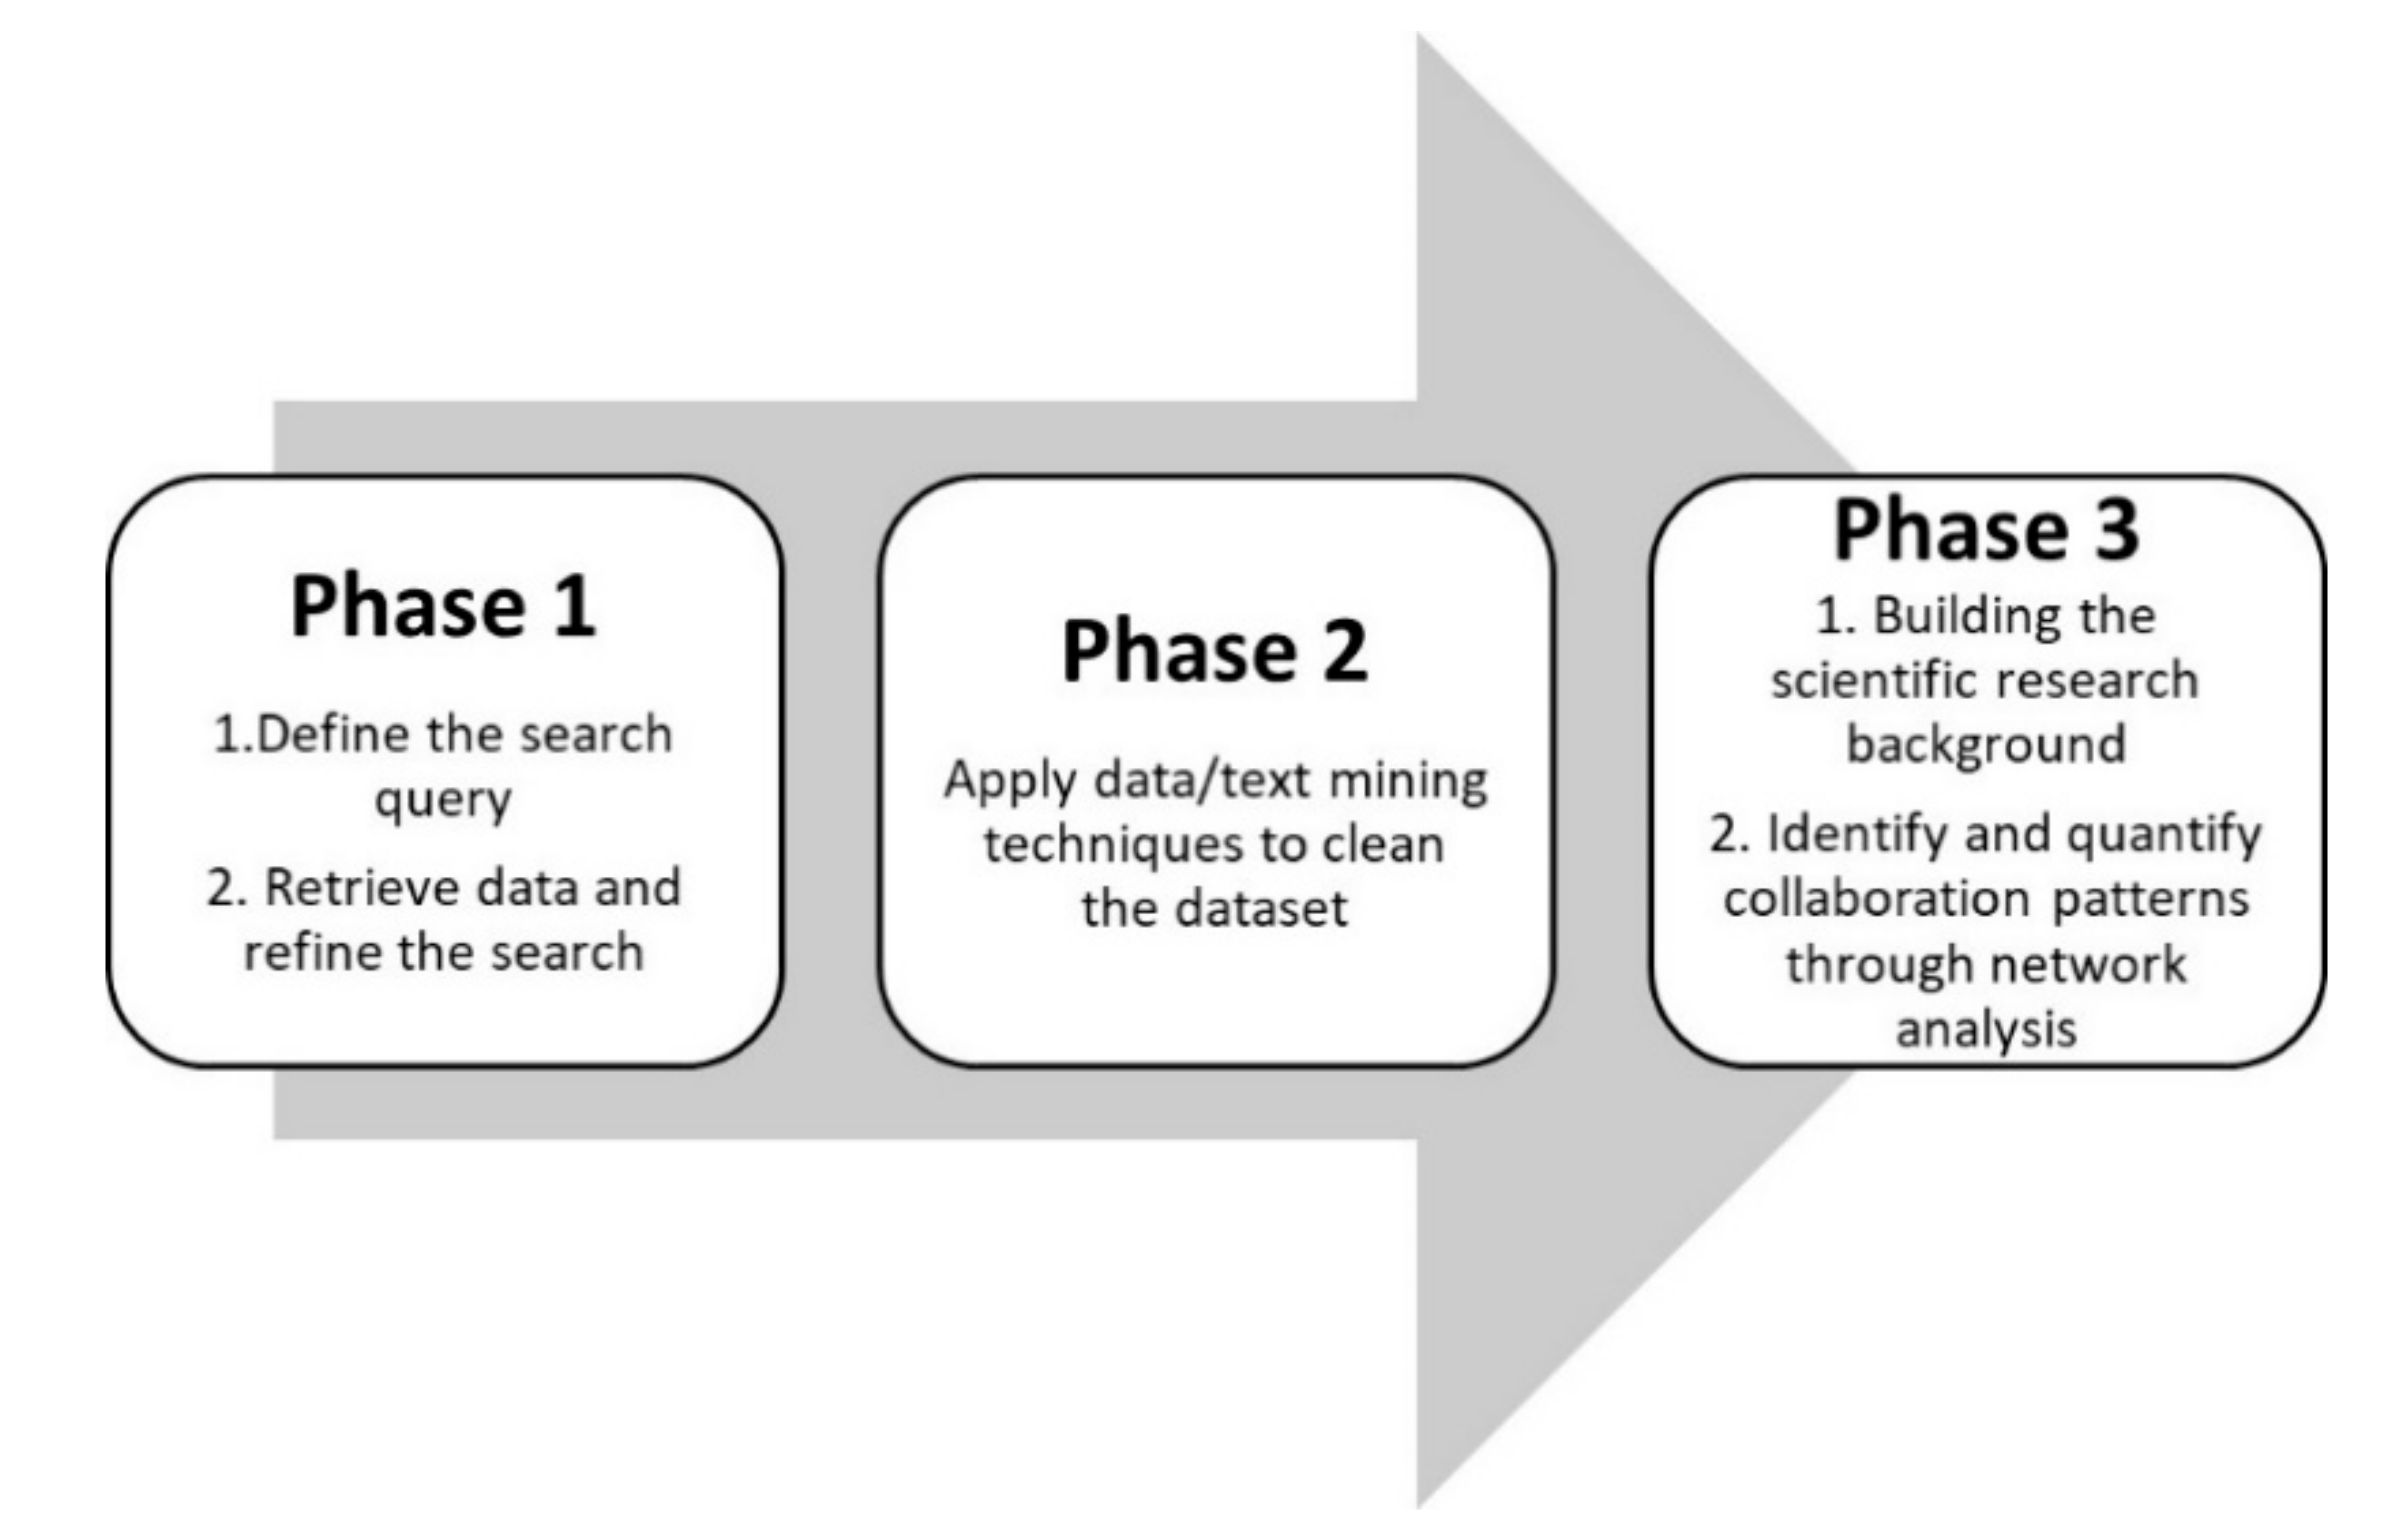
2. Methods
3. Results
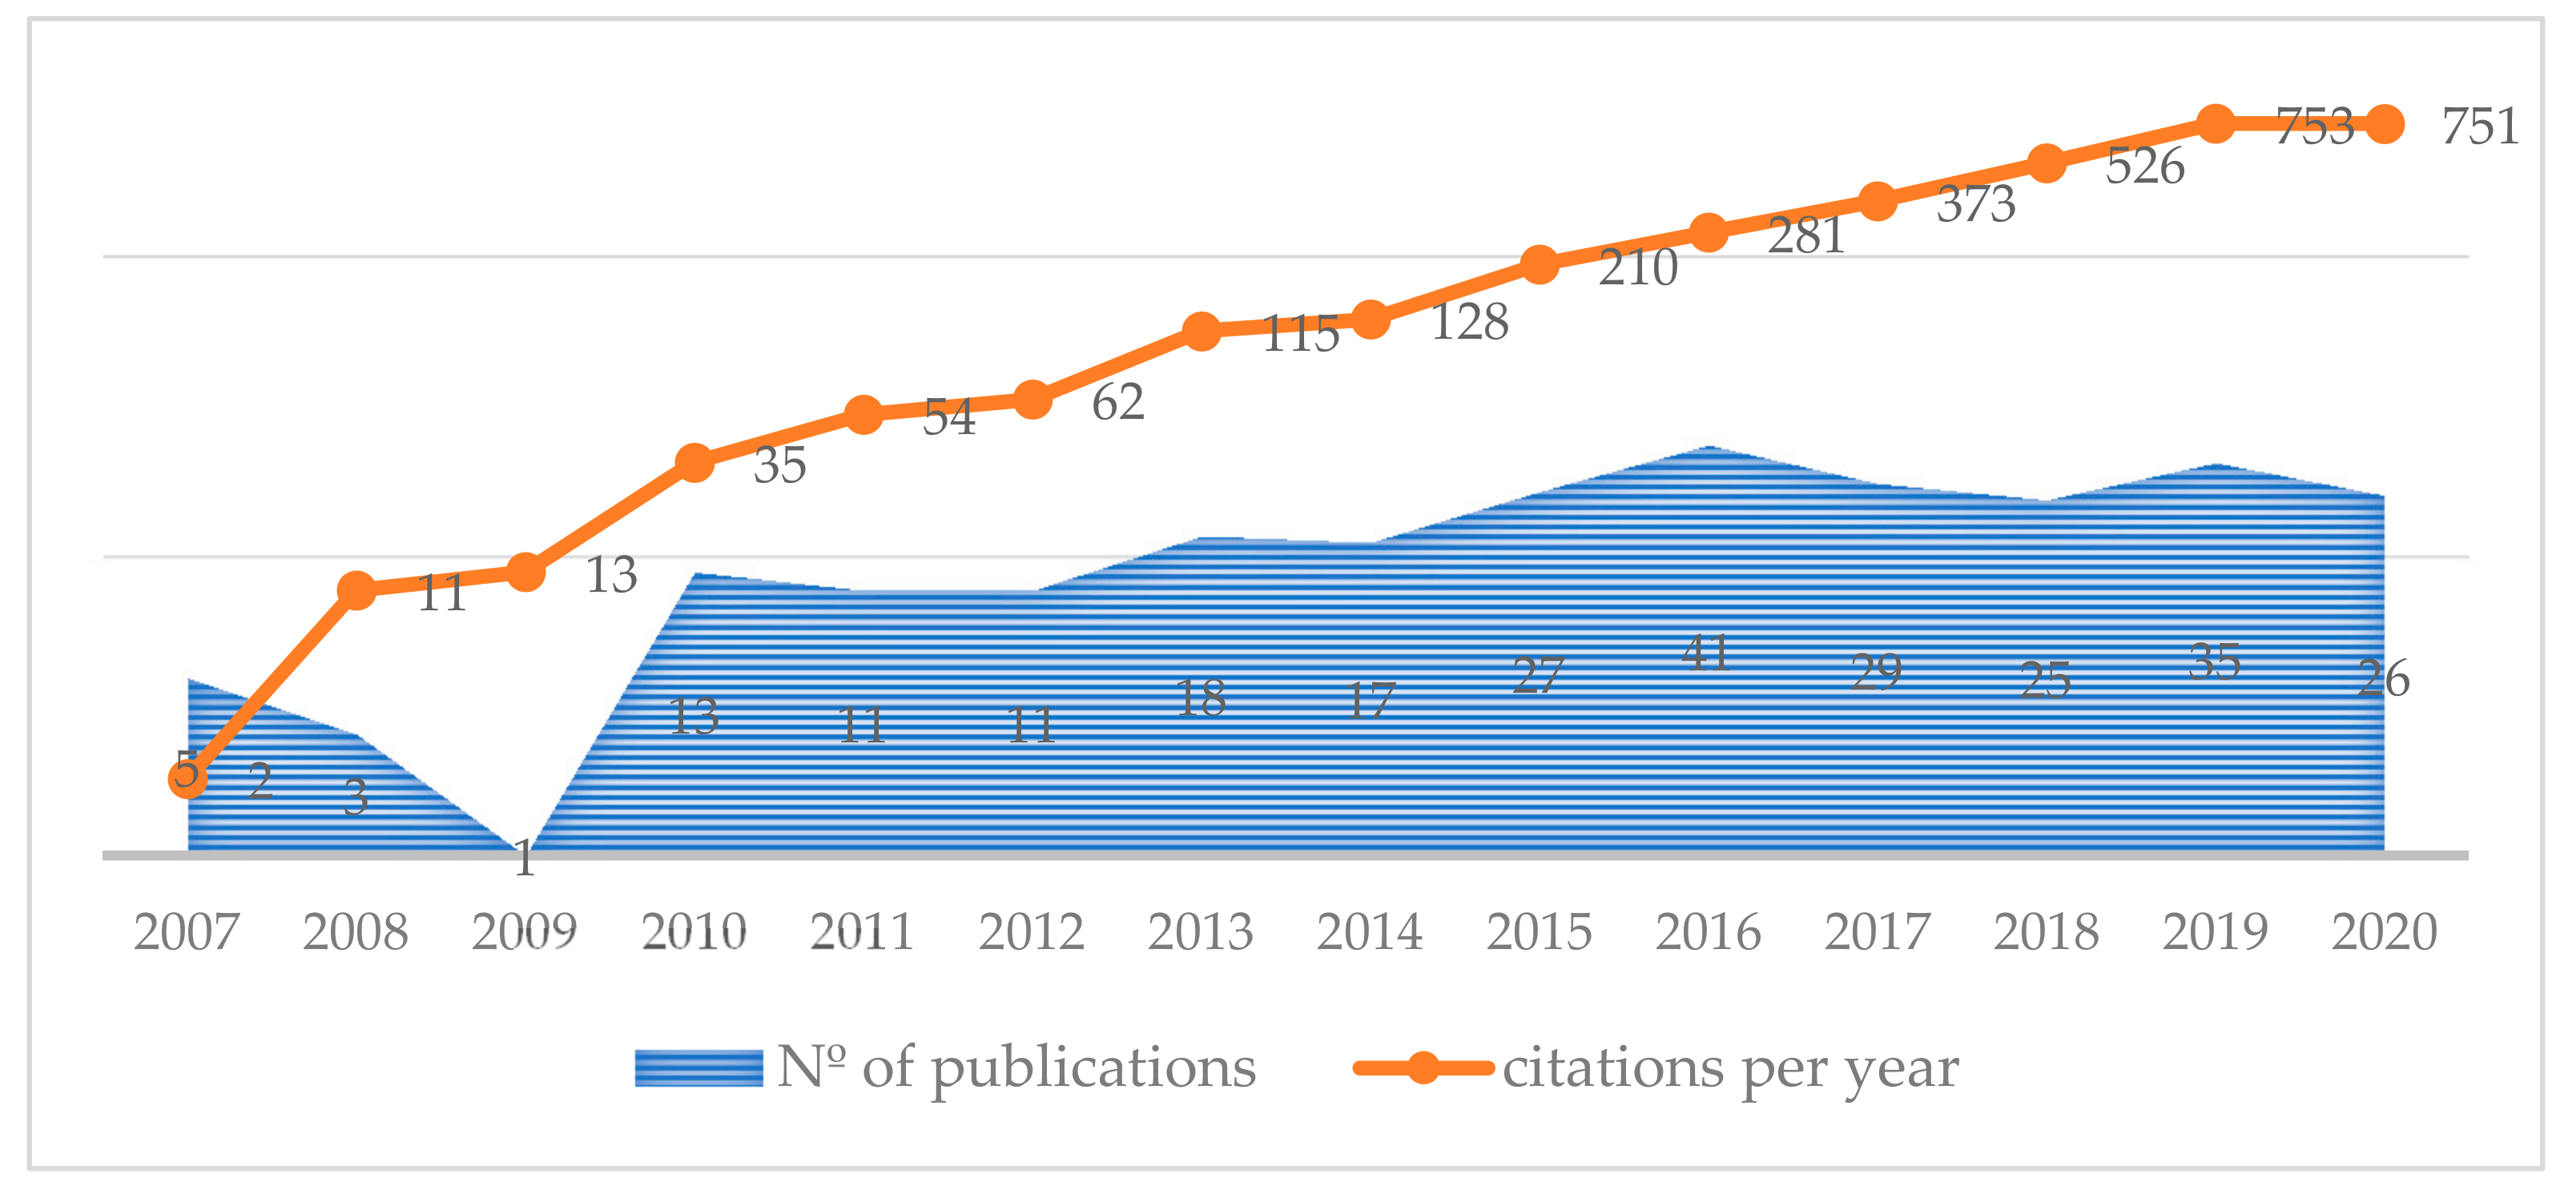
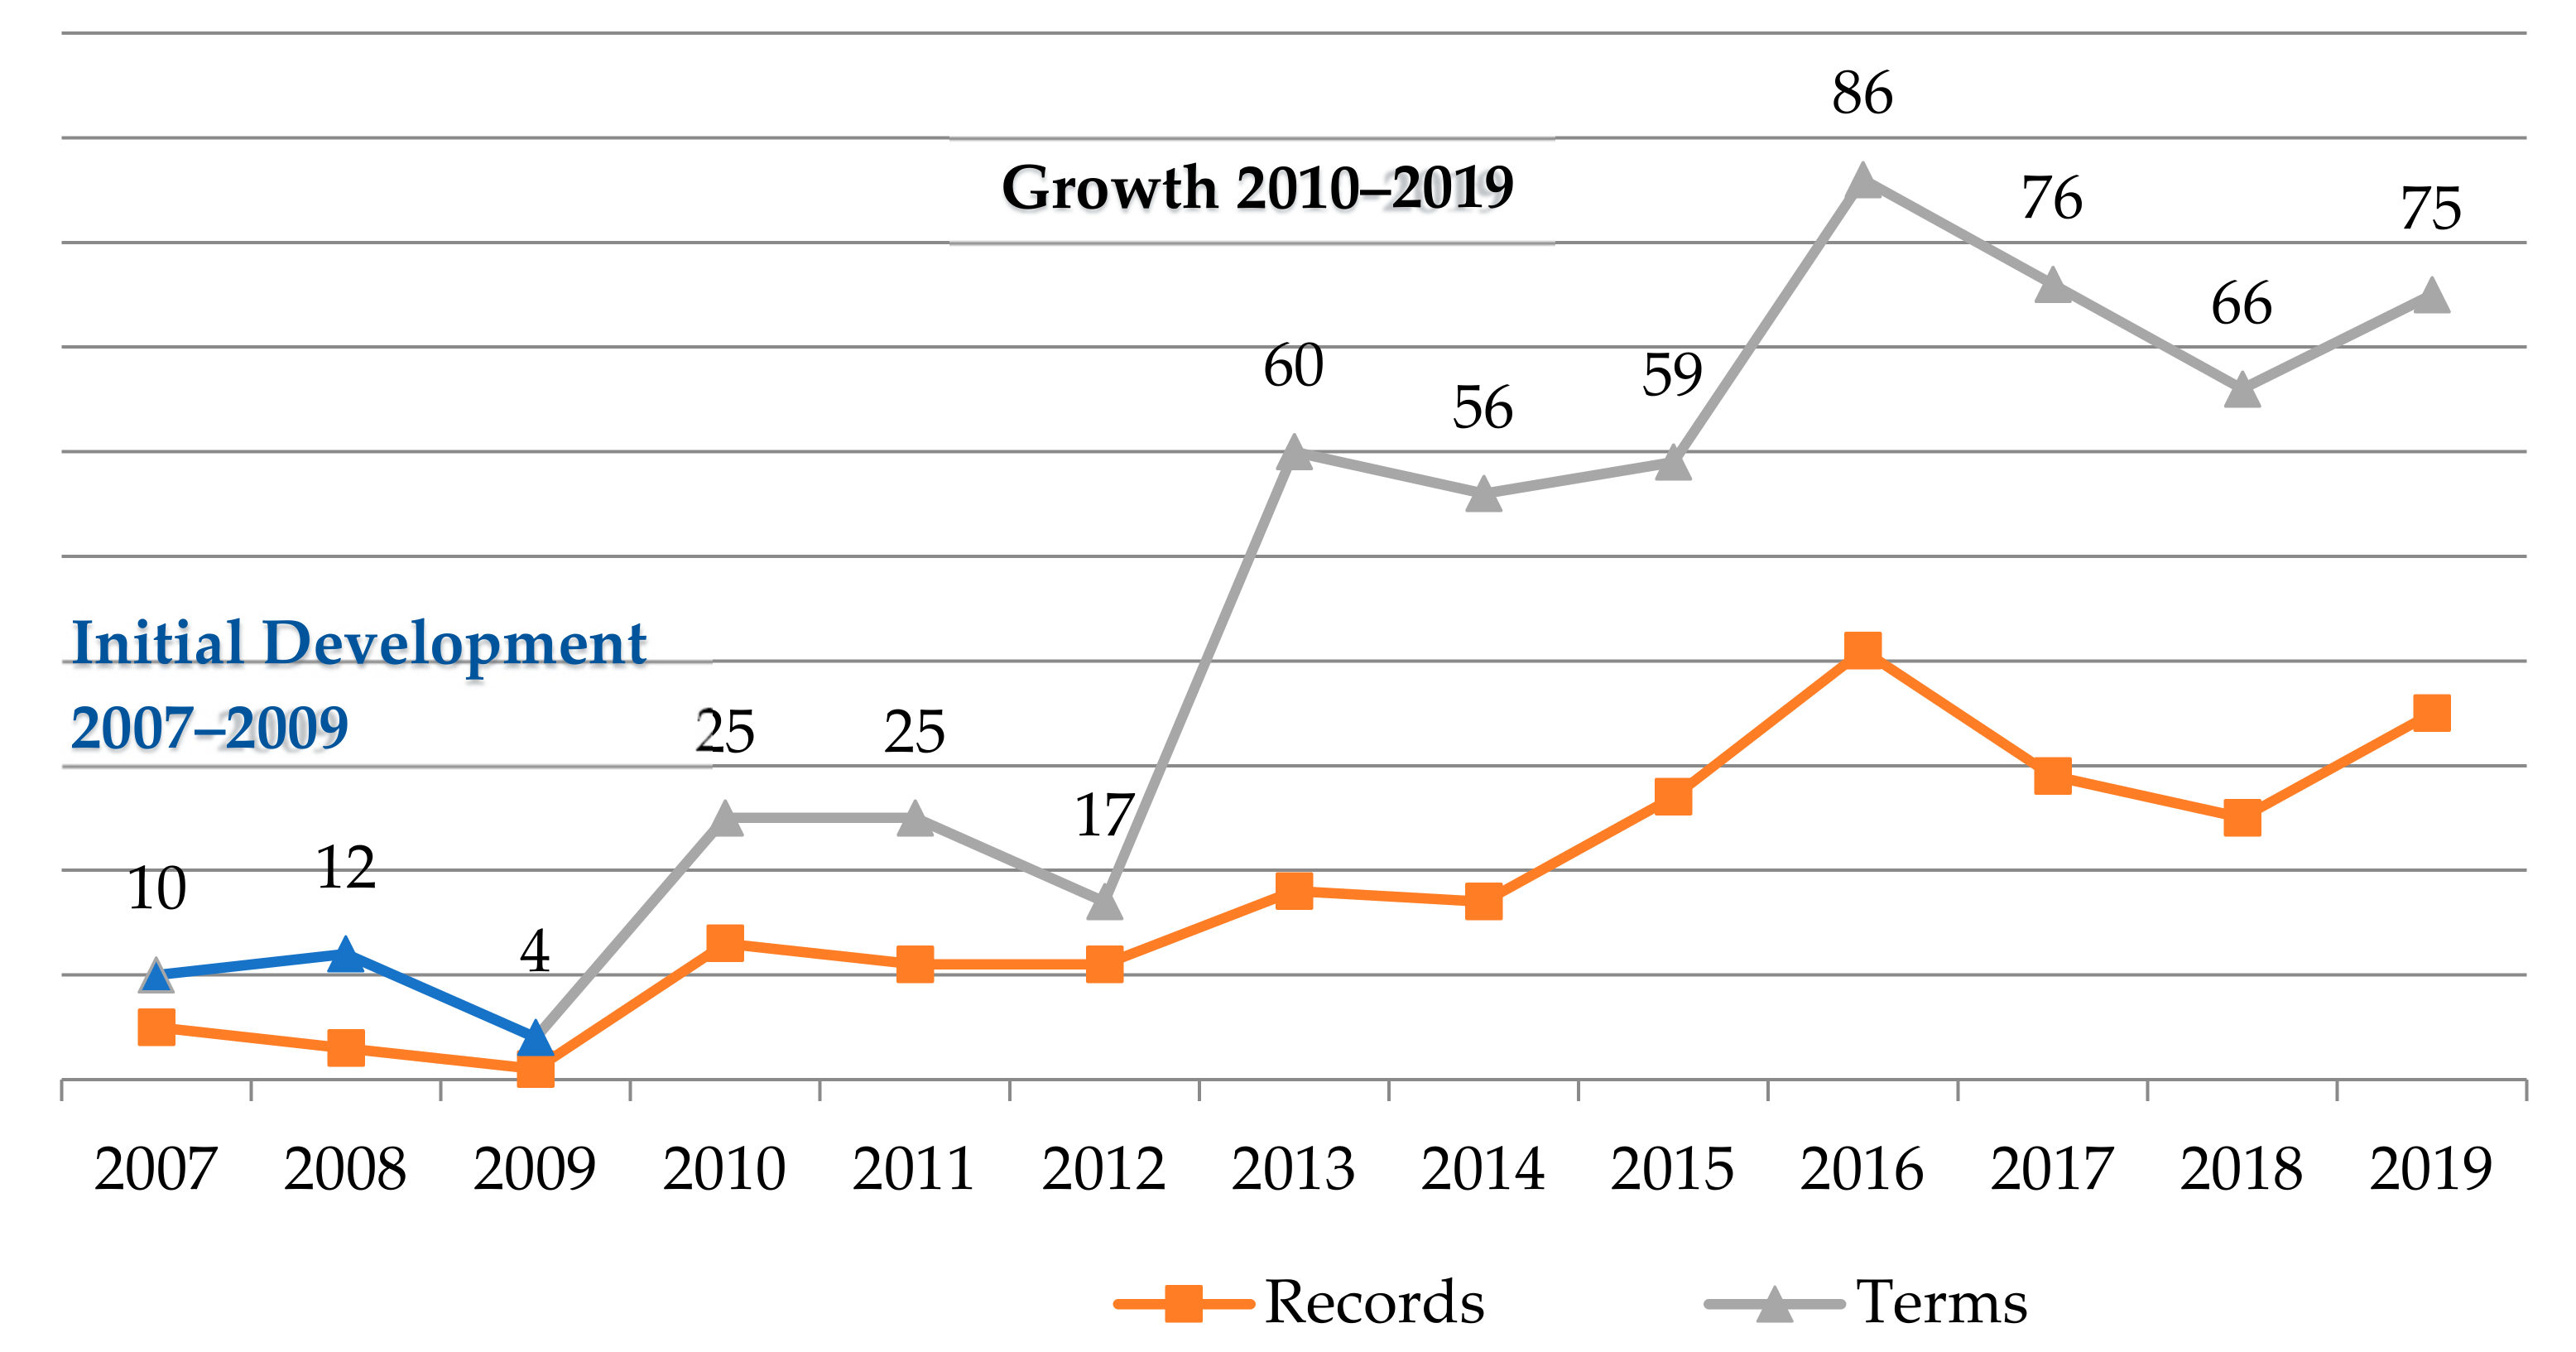
3.1. Research Trends: Publications and Citations
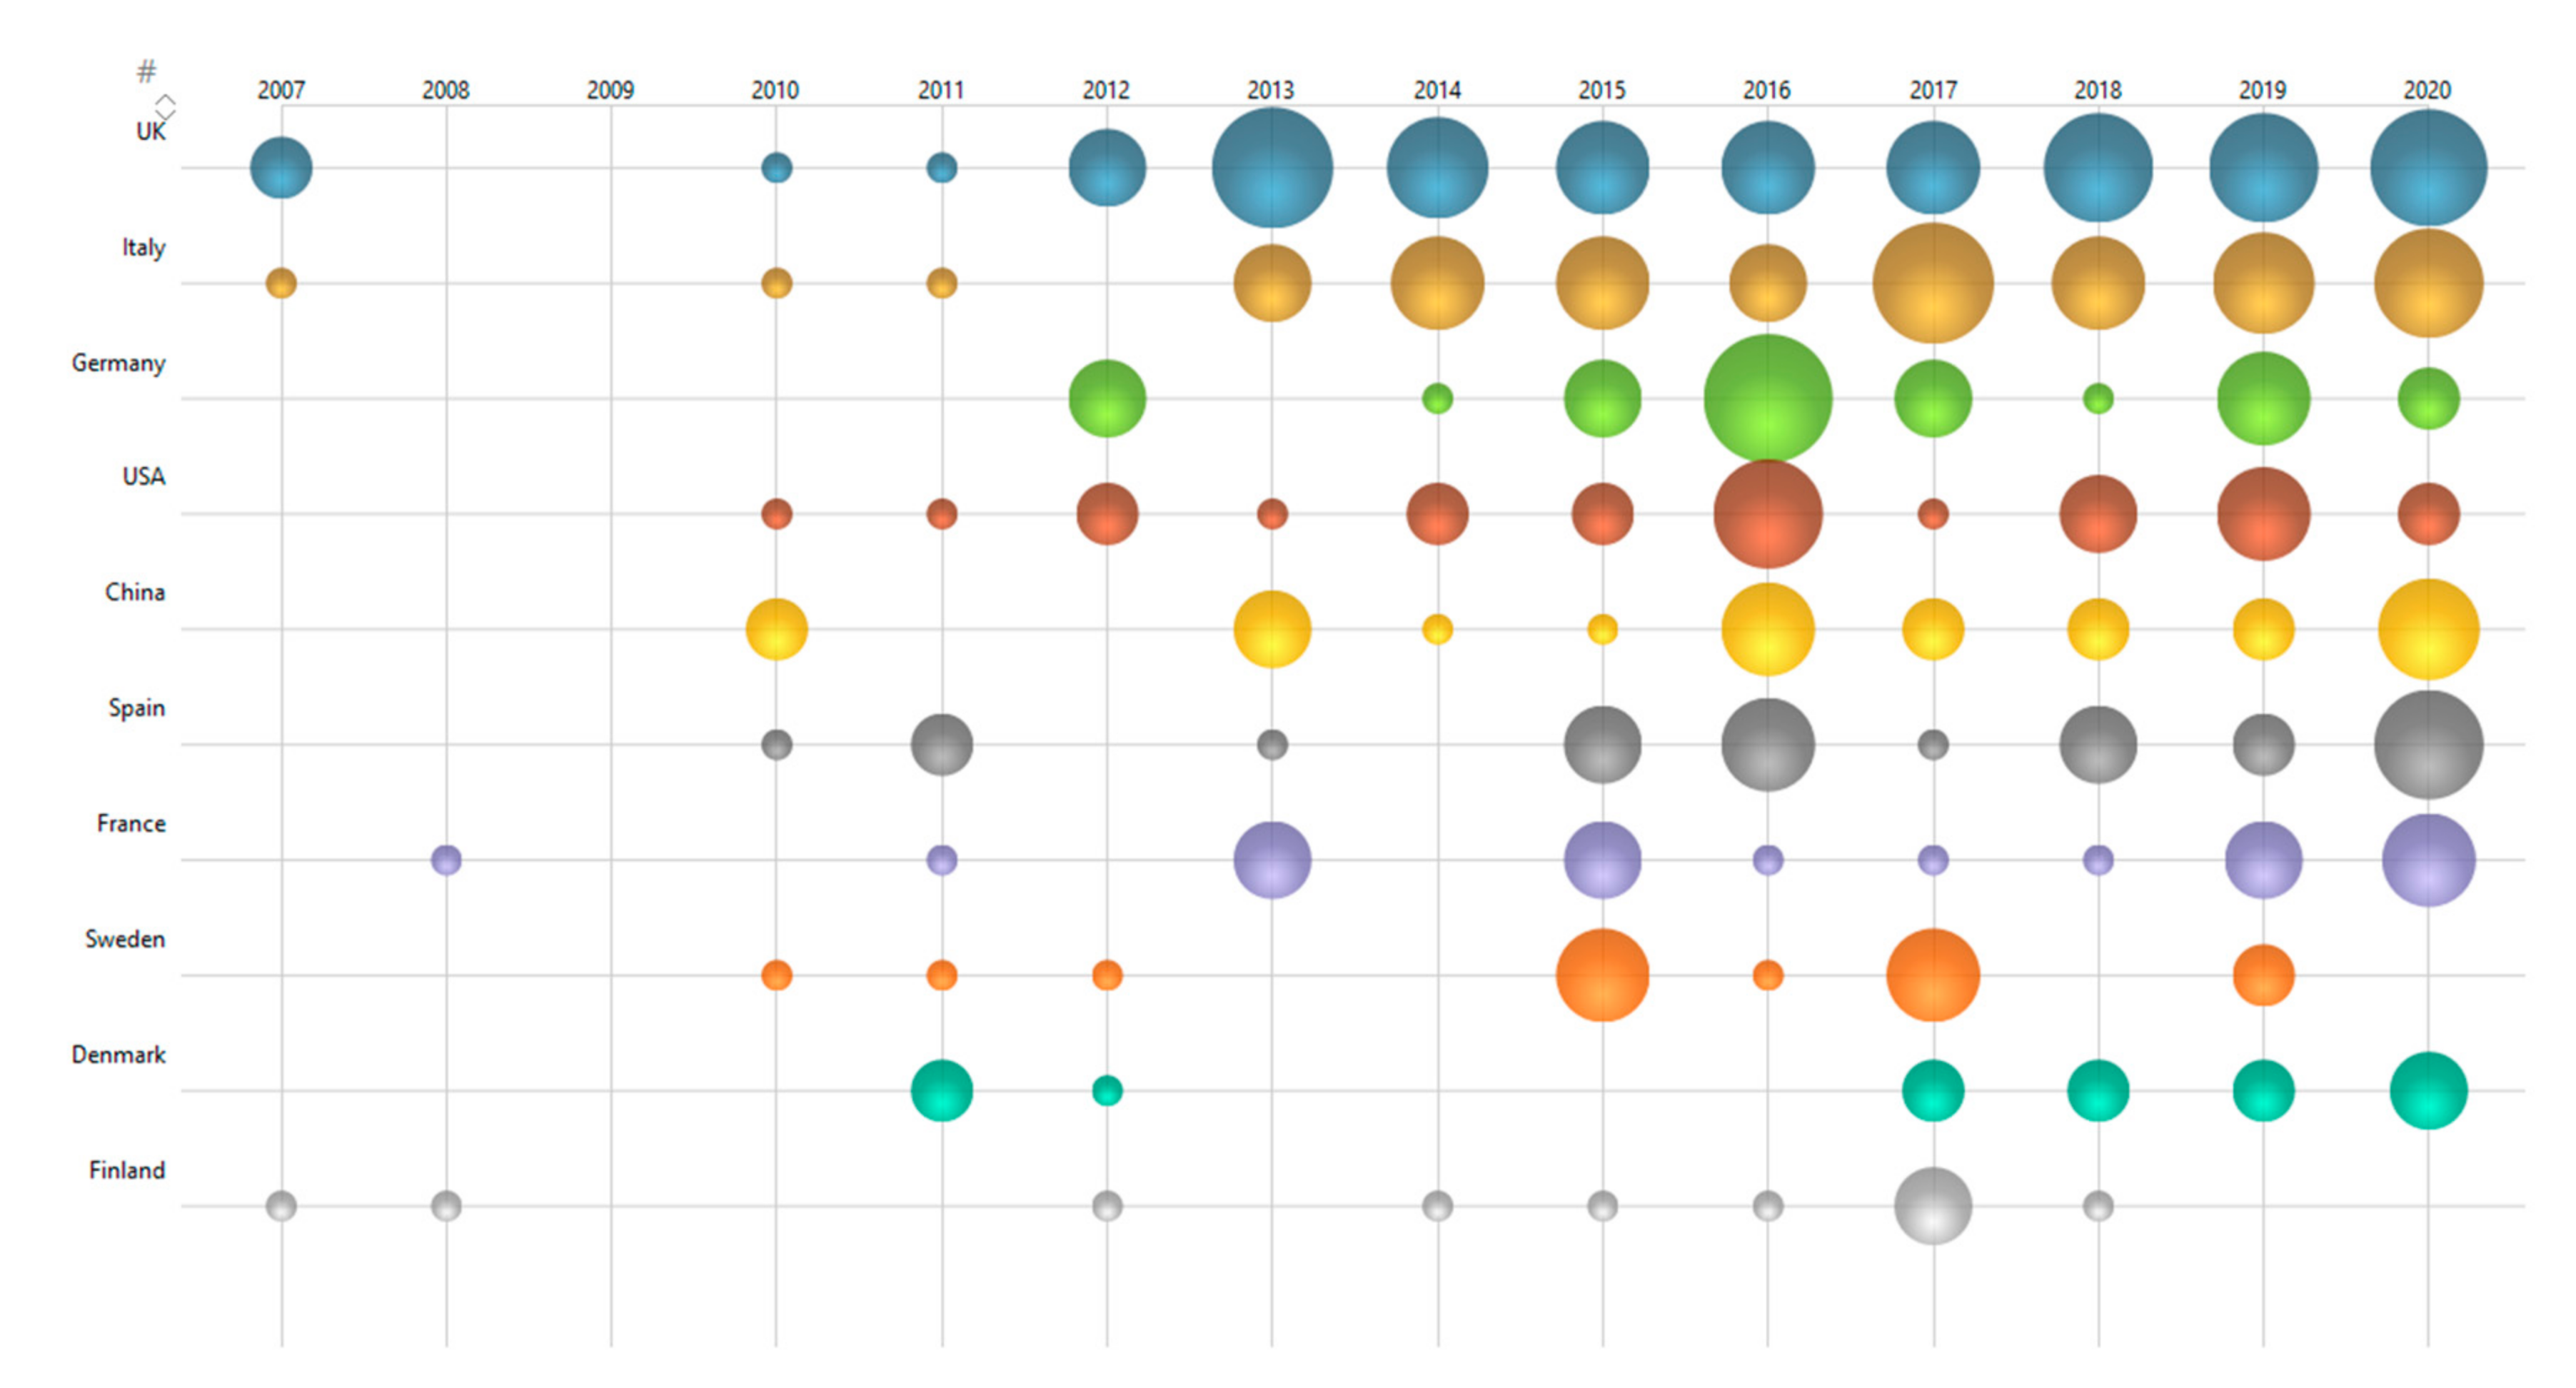
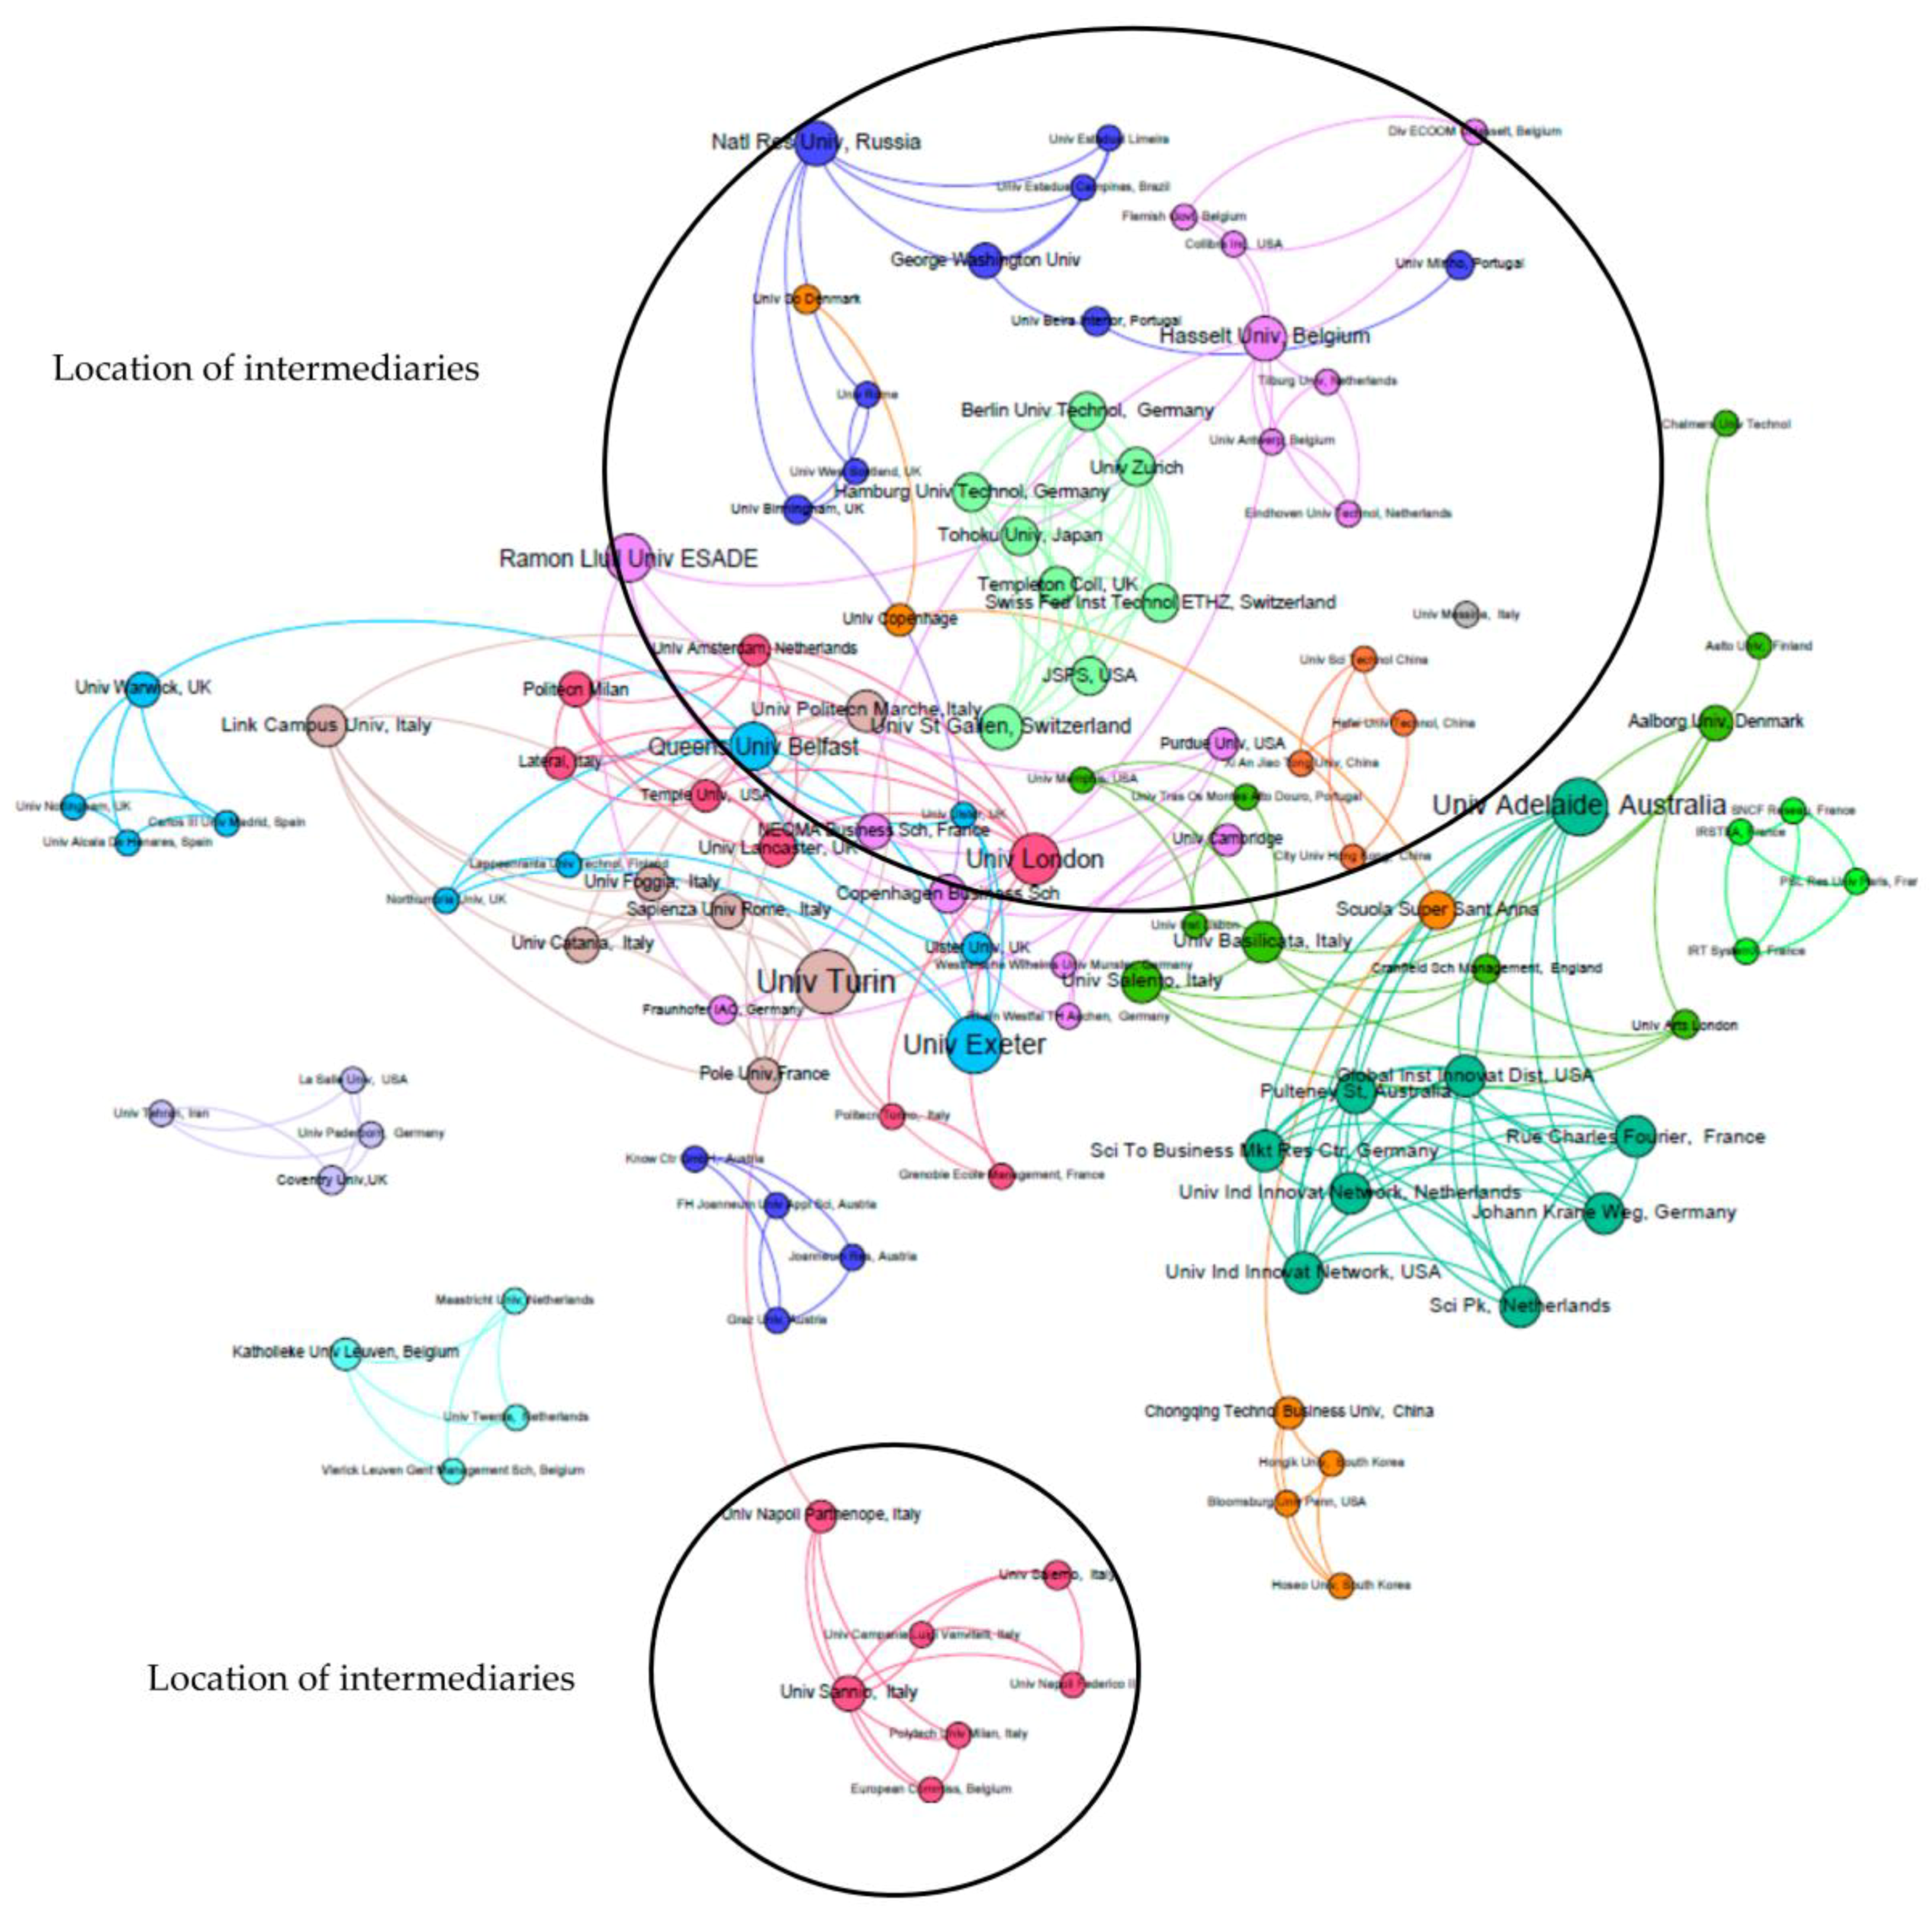
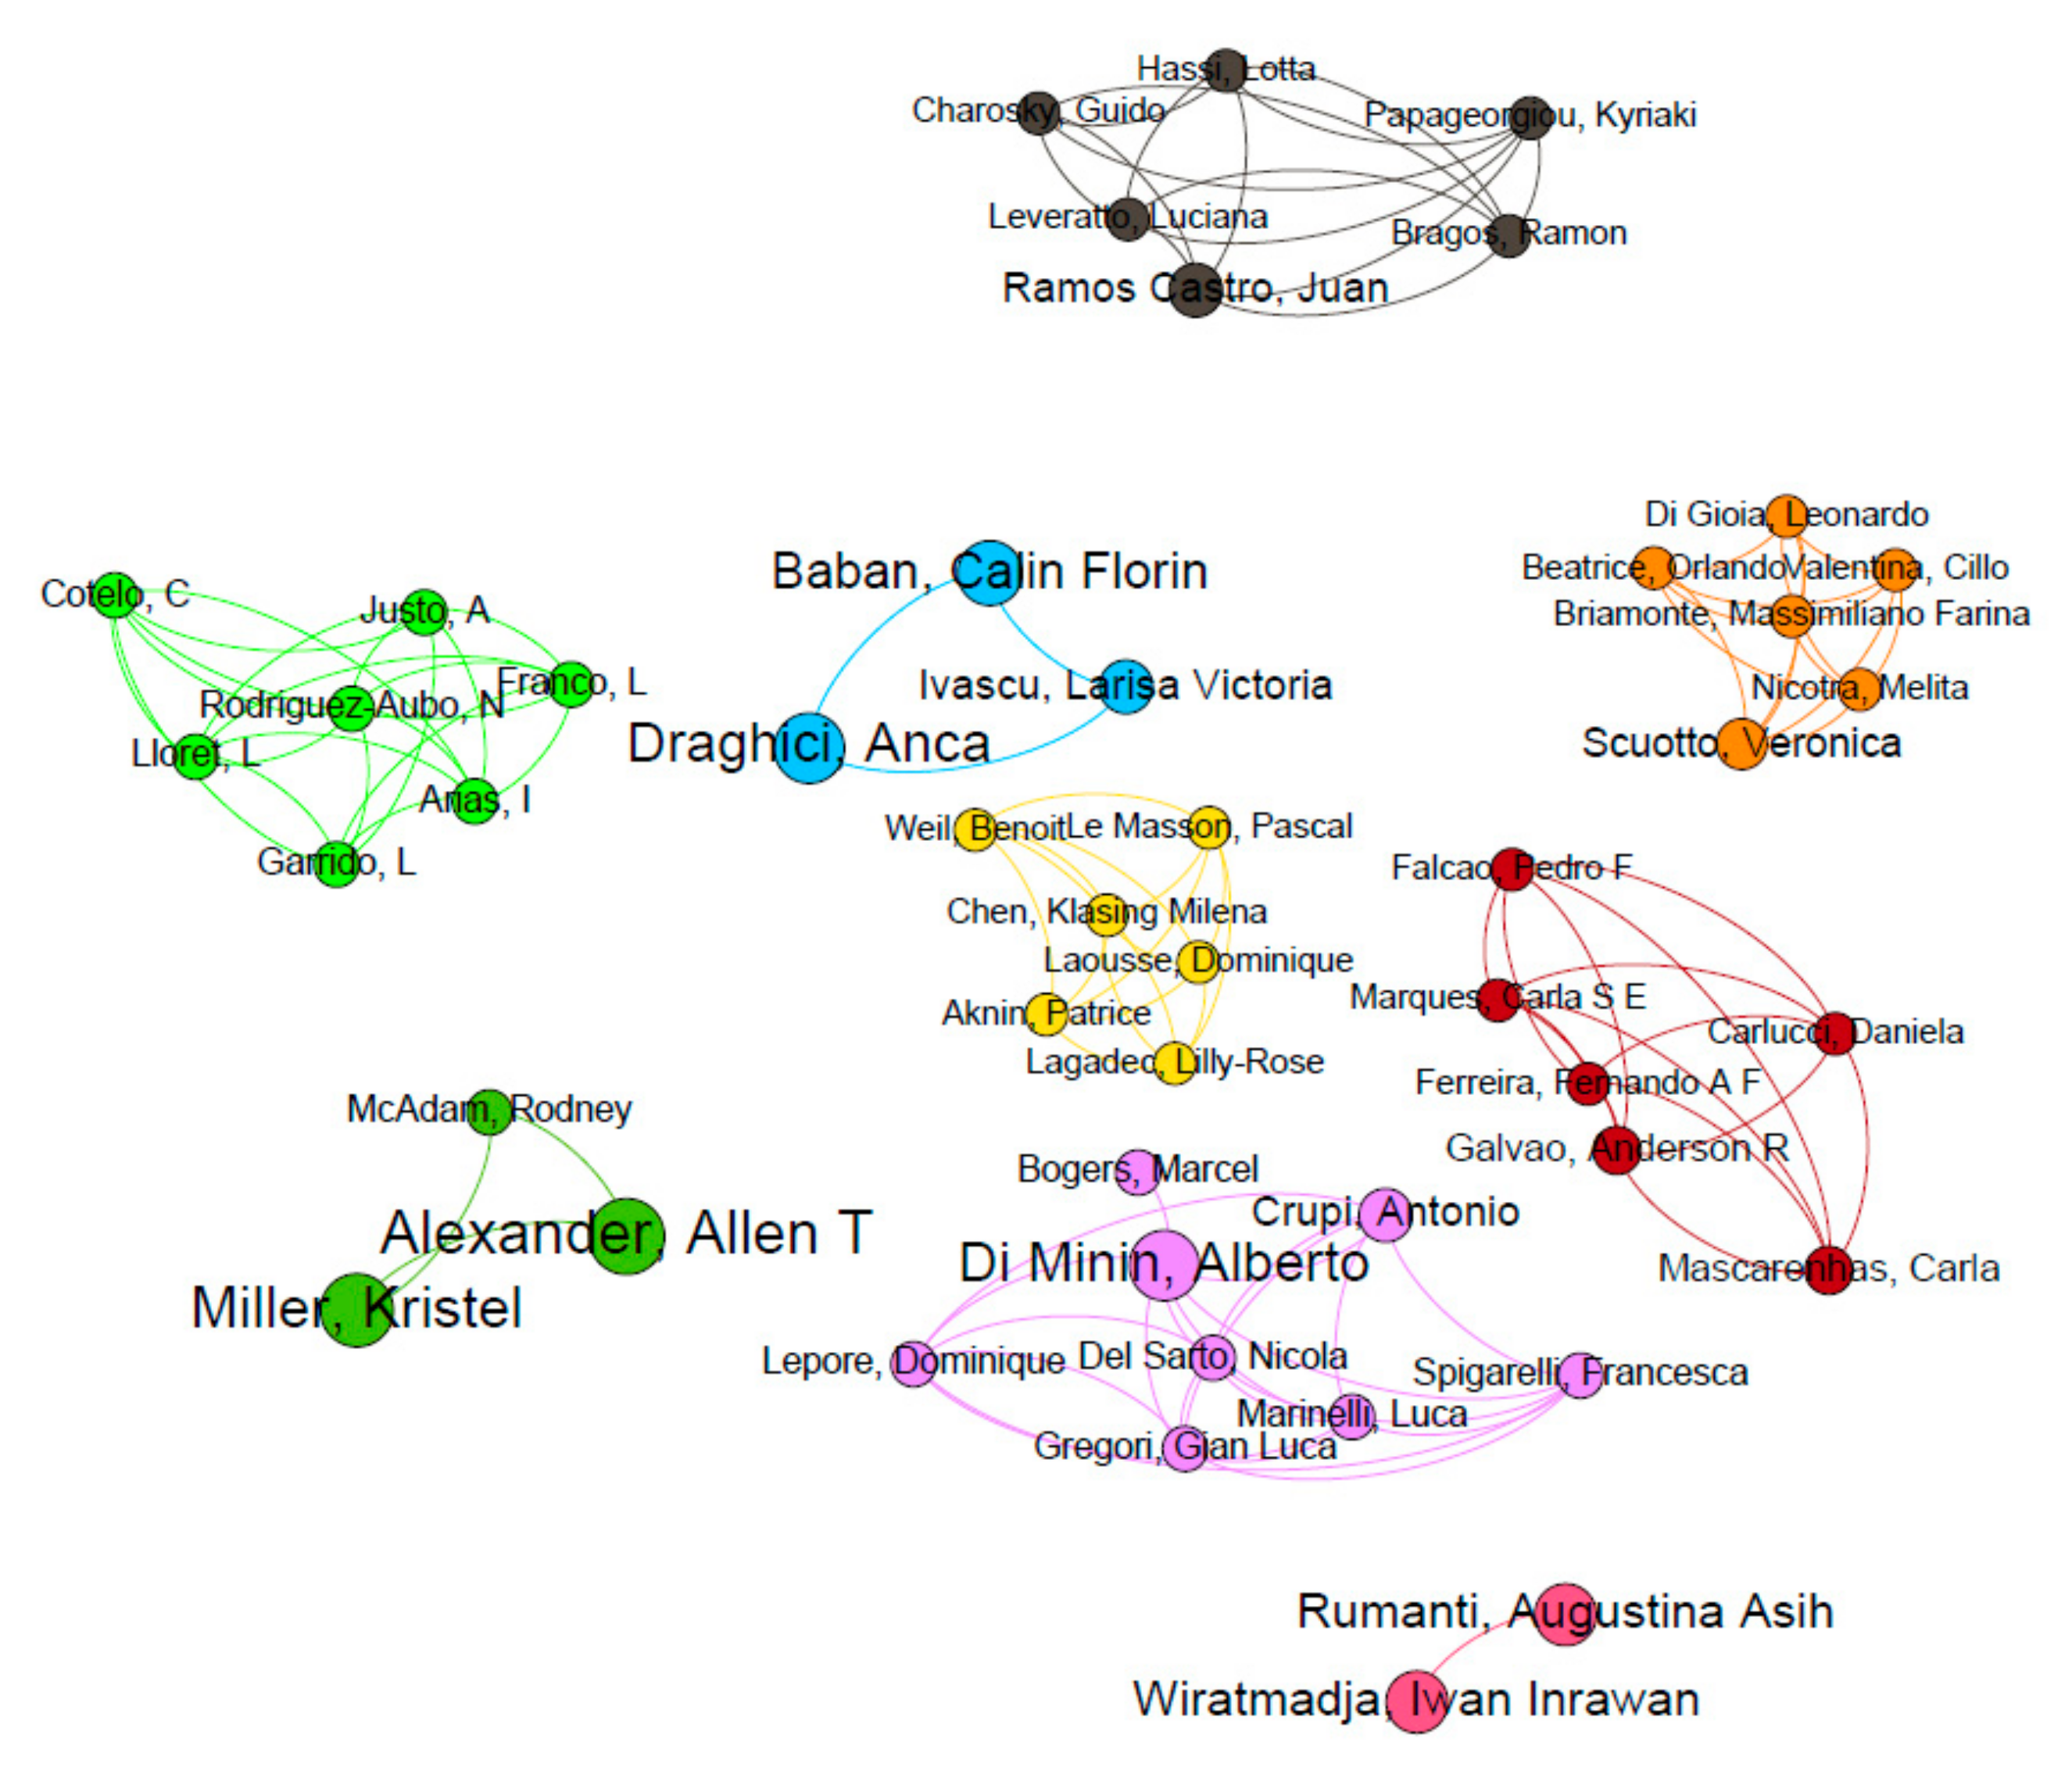
3.2. Main Producers in Research
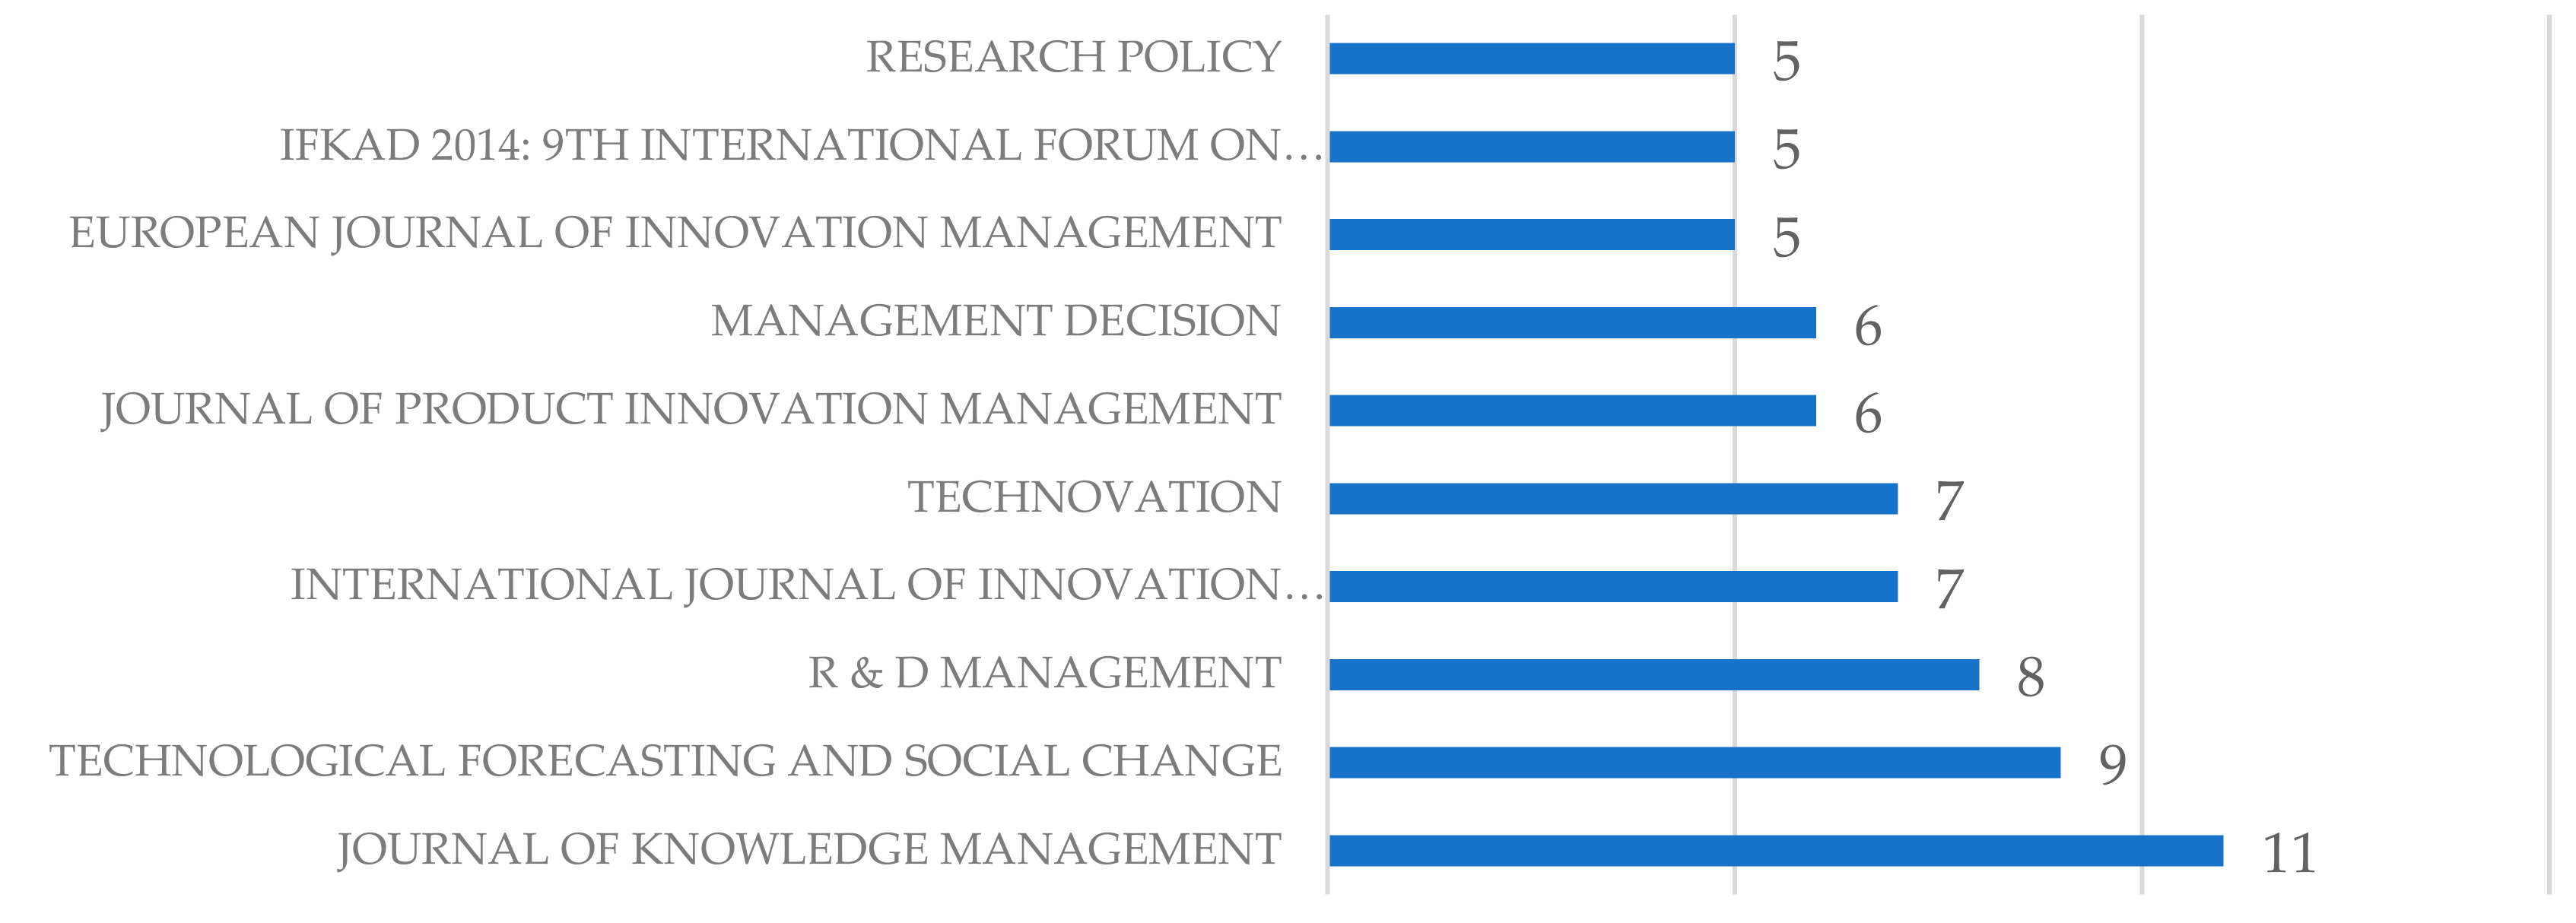
3.3. Sources of Diffusion
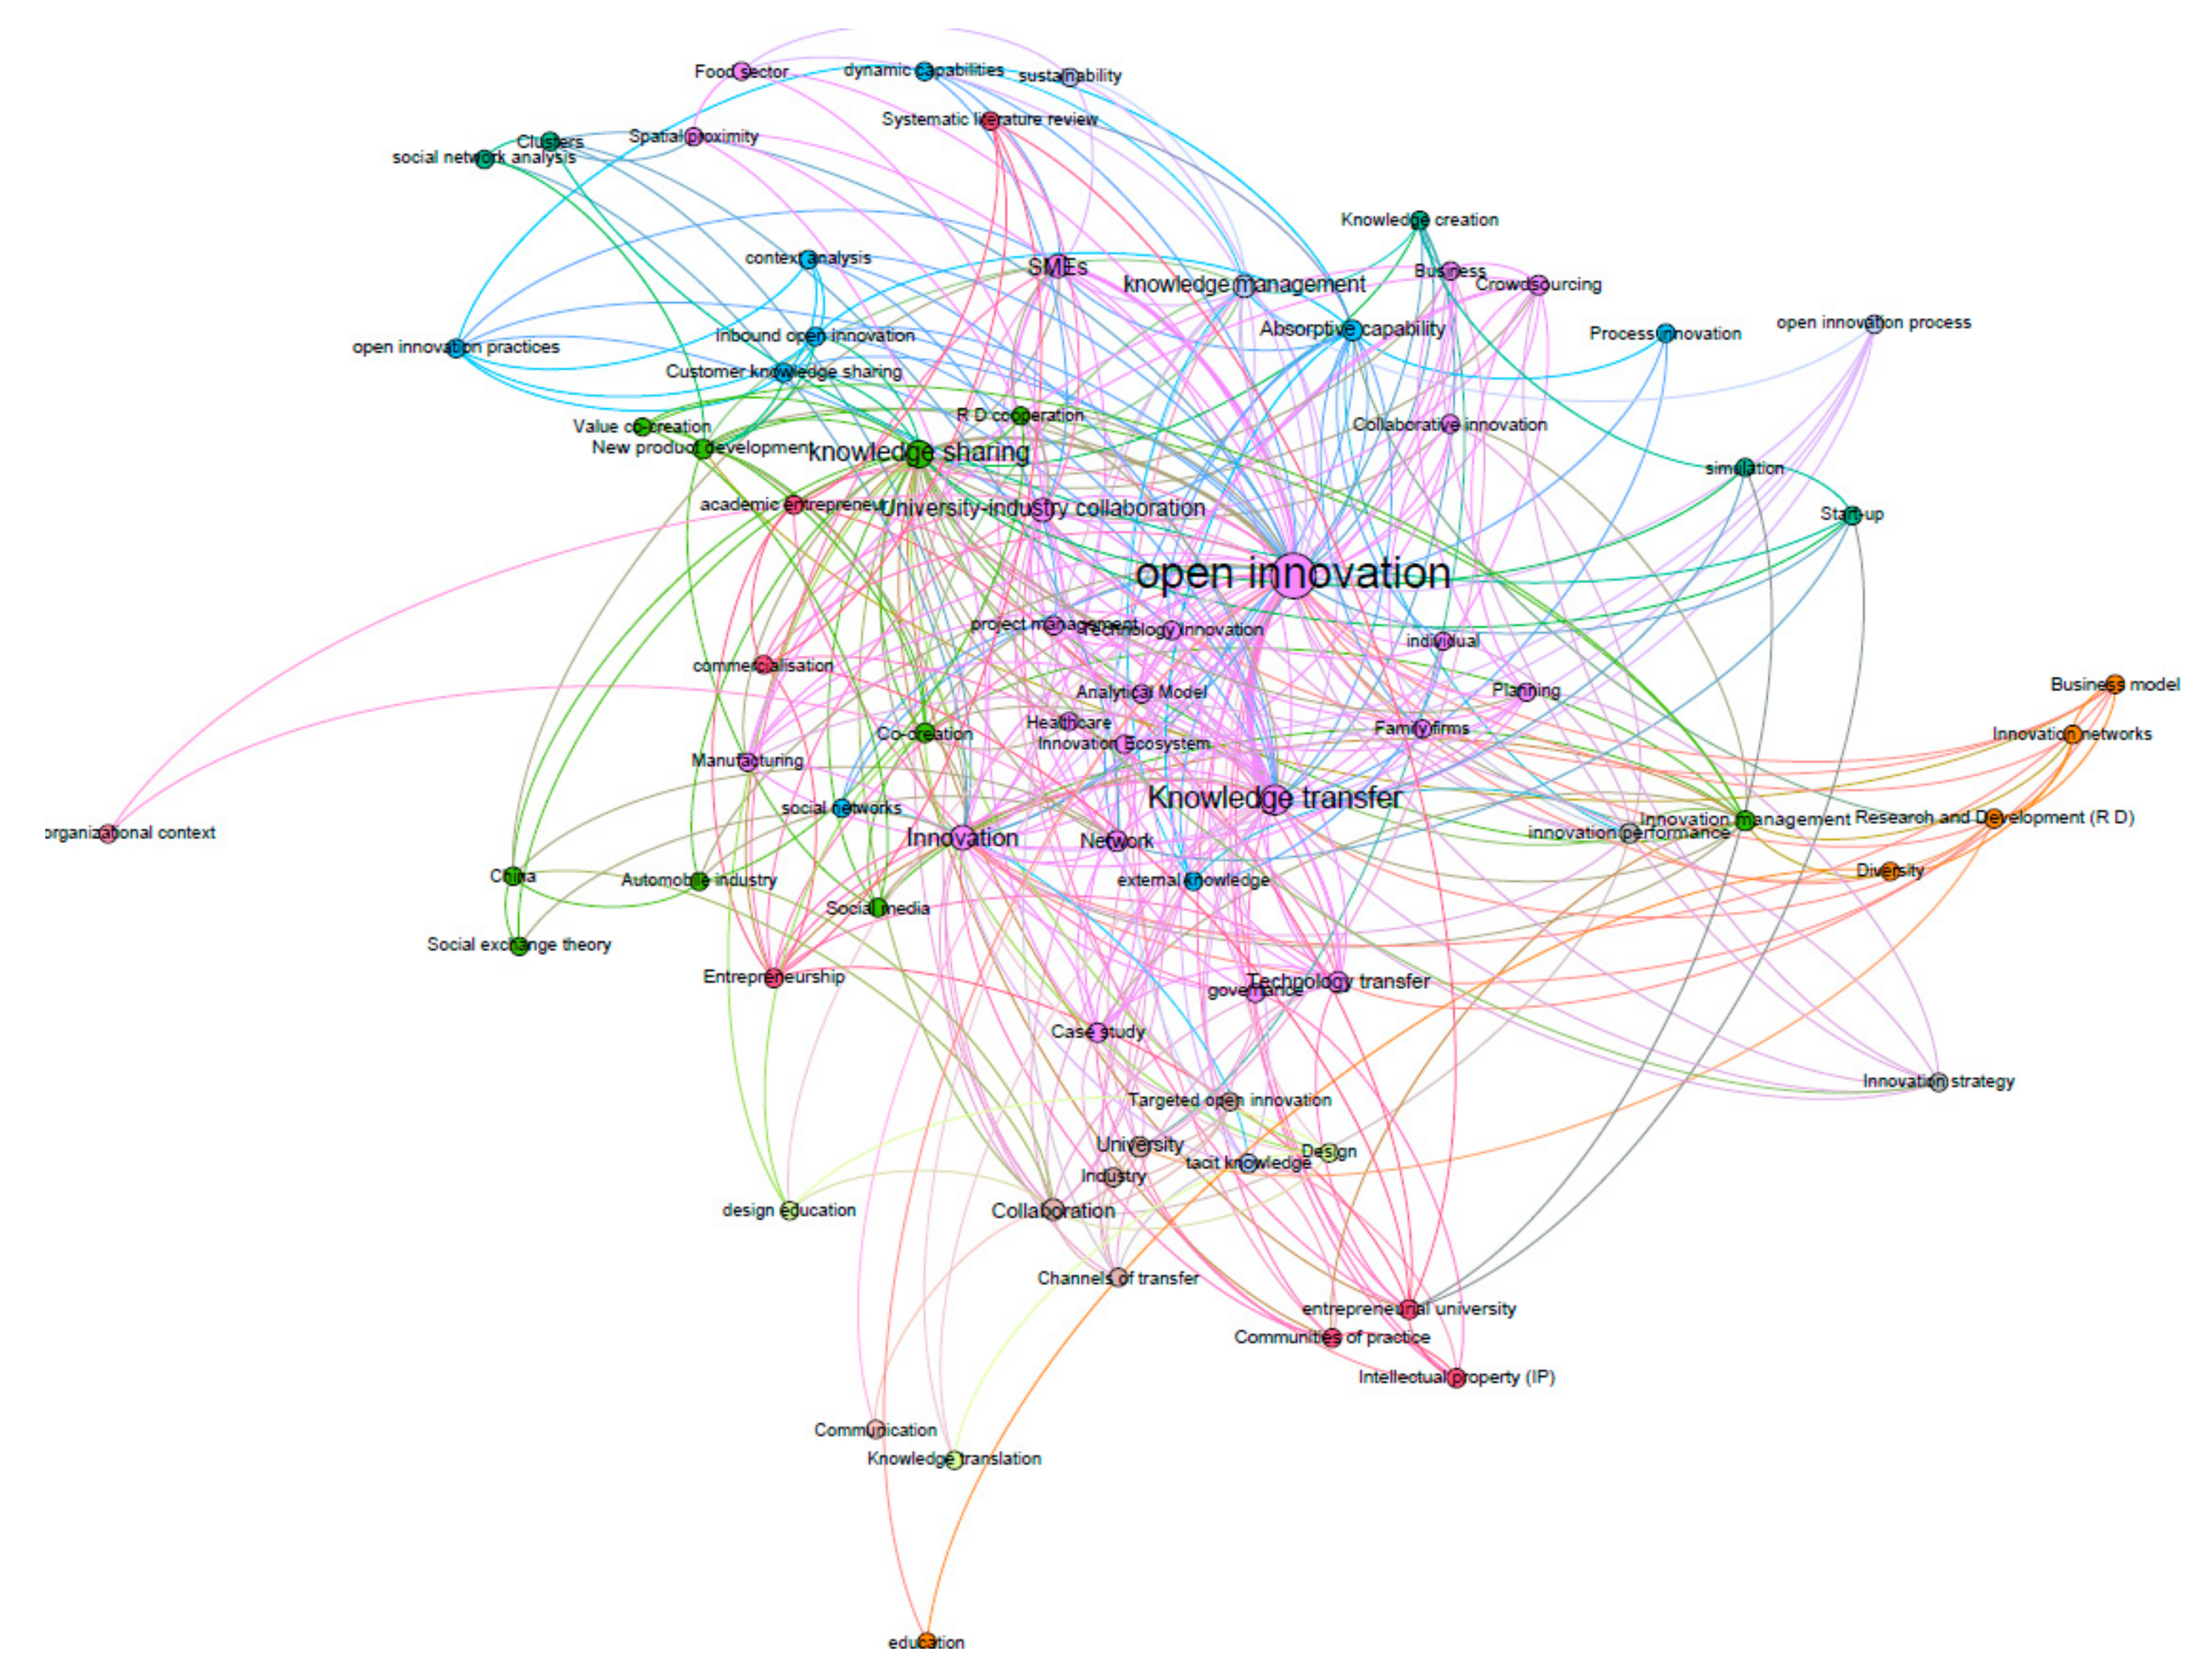
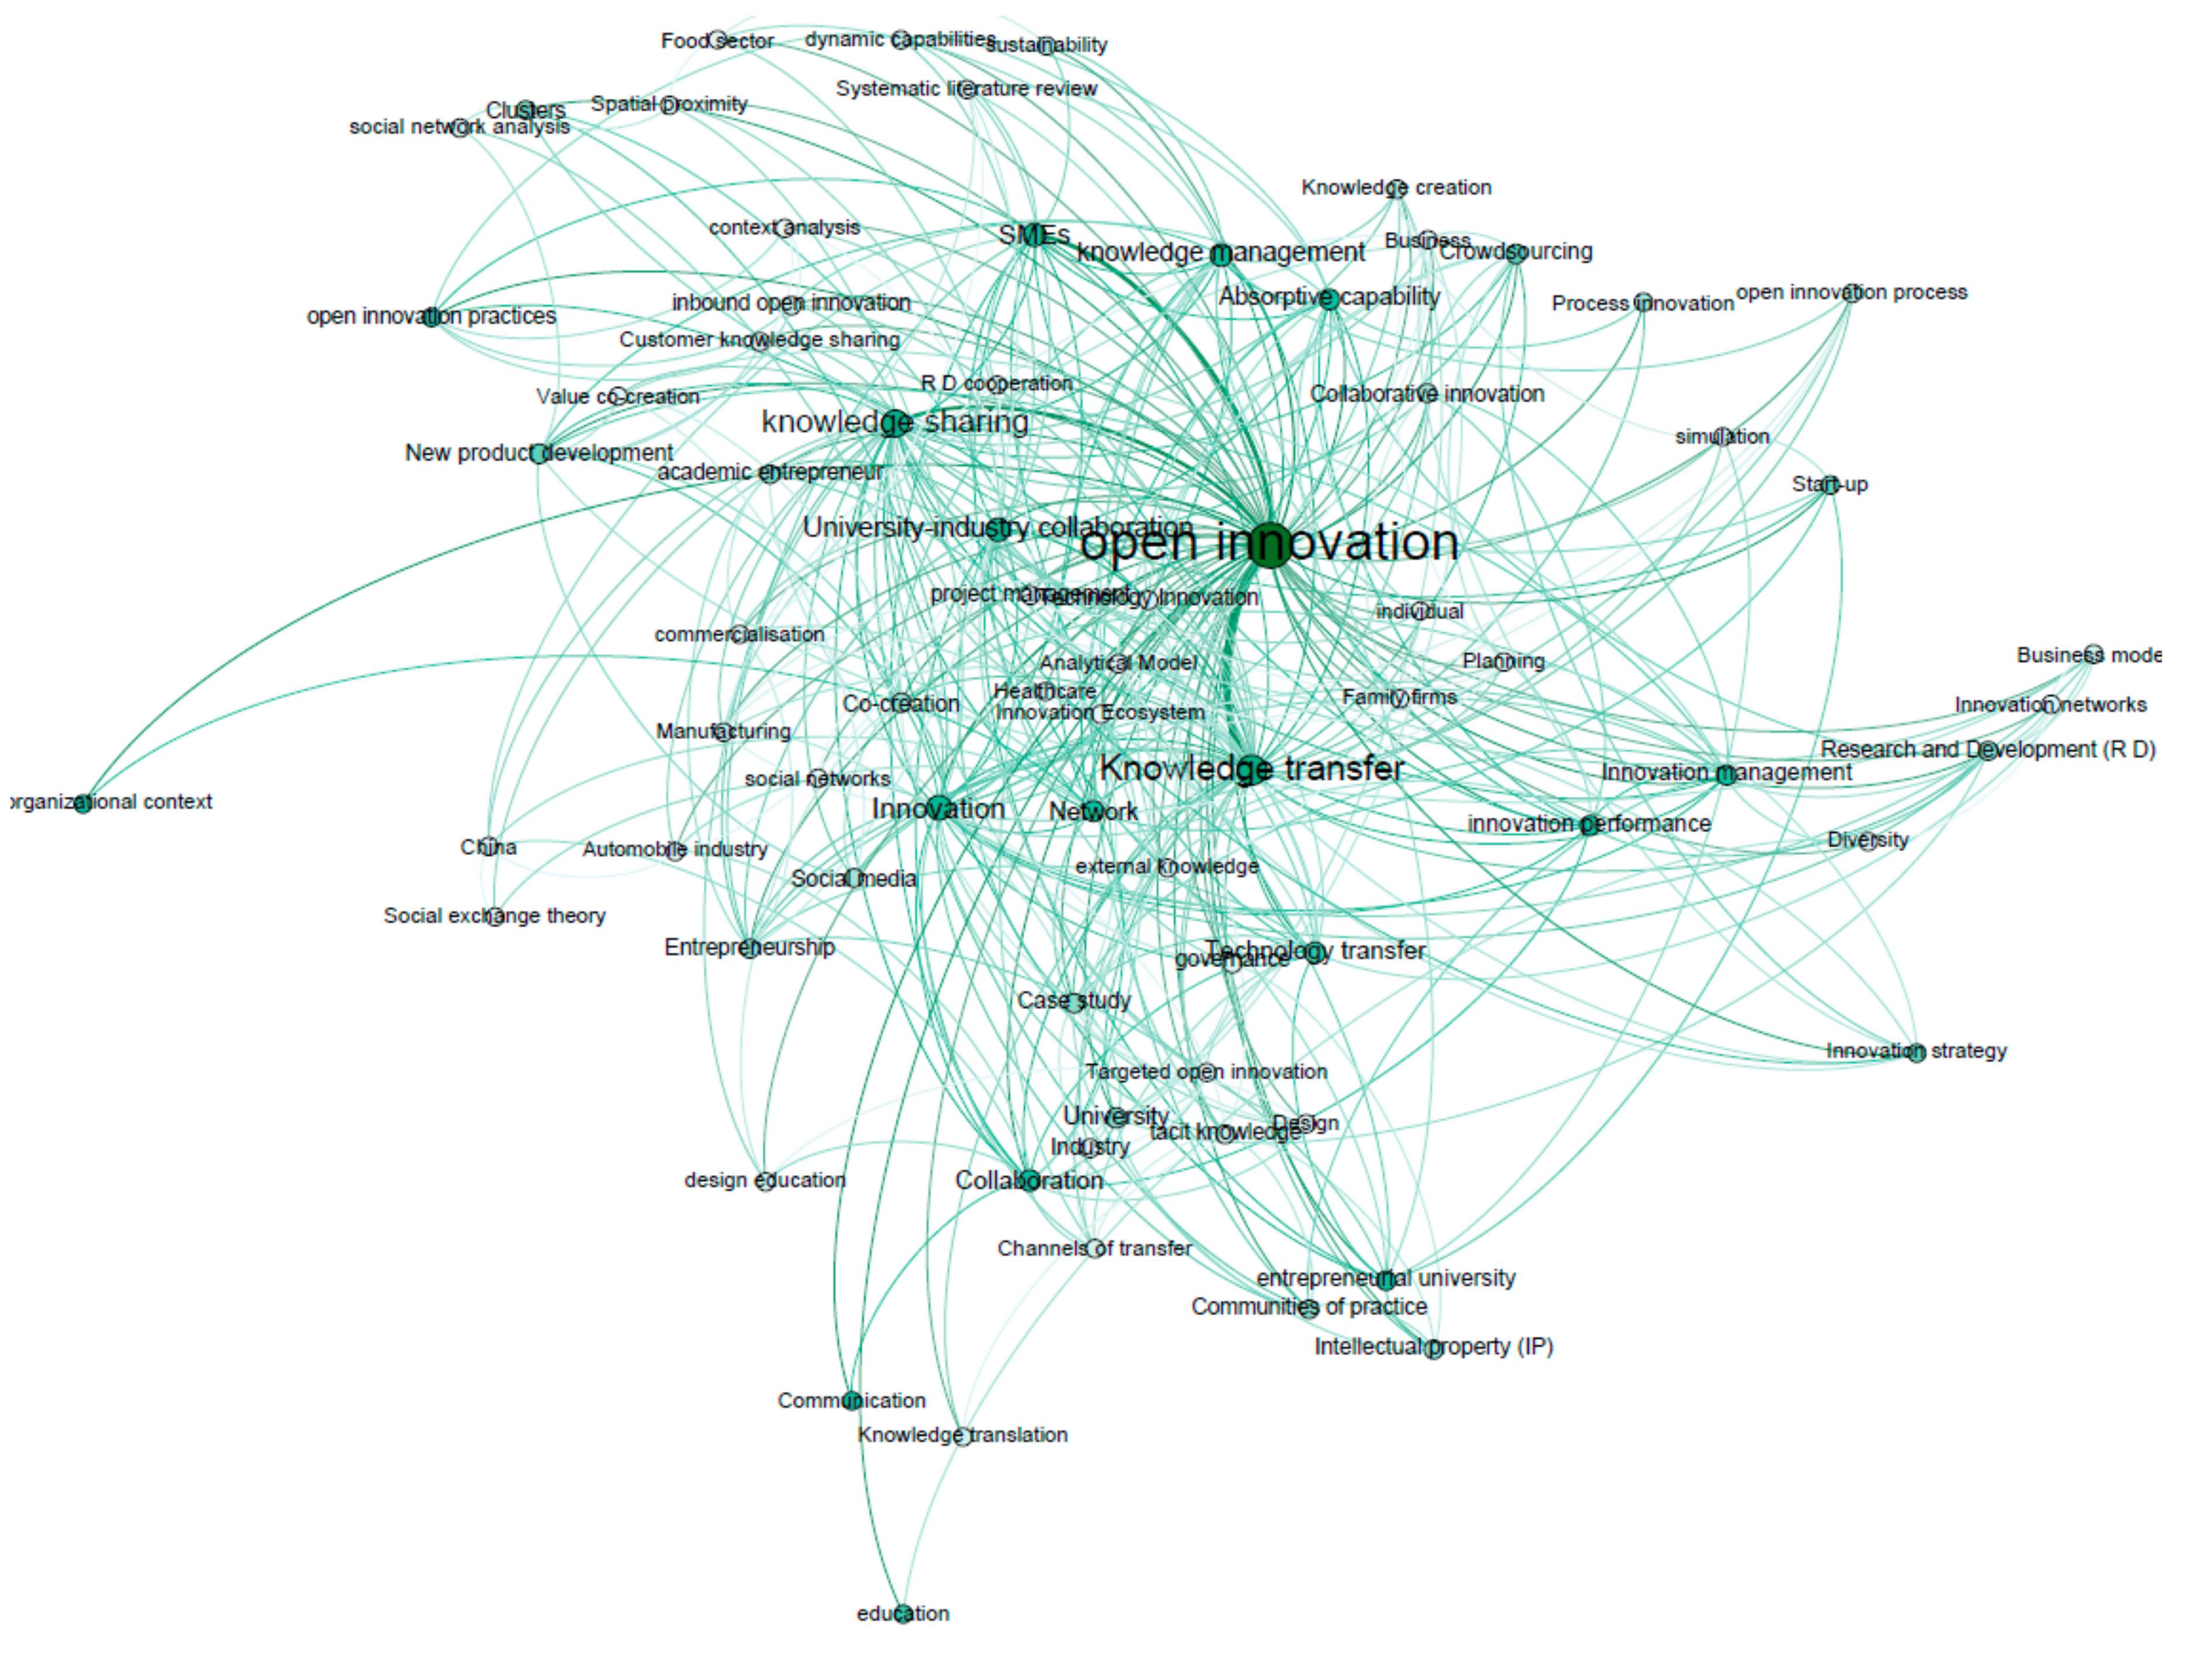
3.4. Research Topics
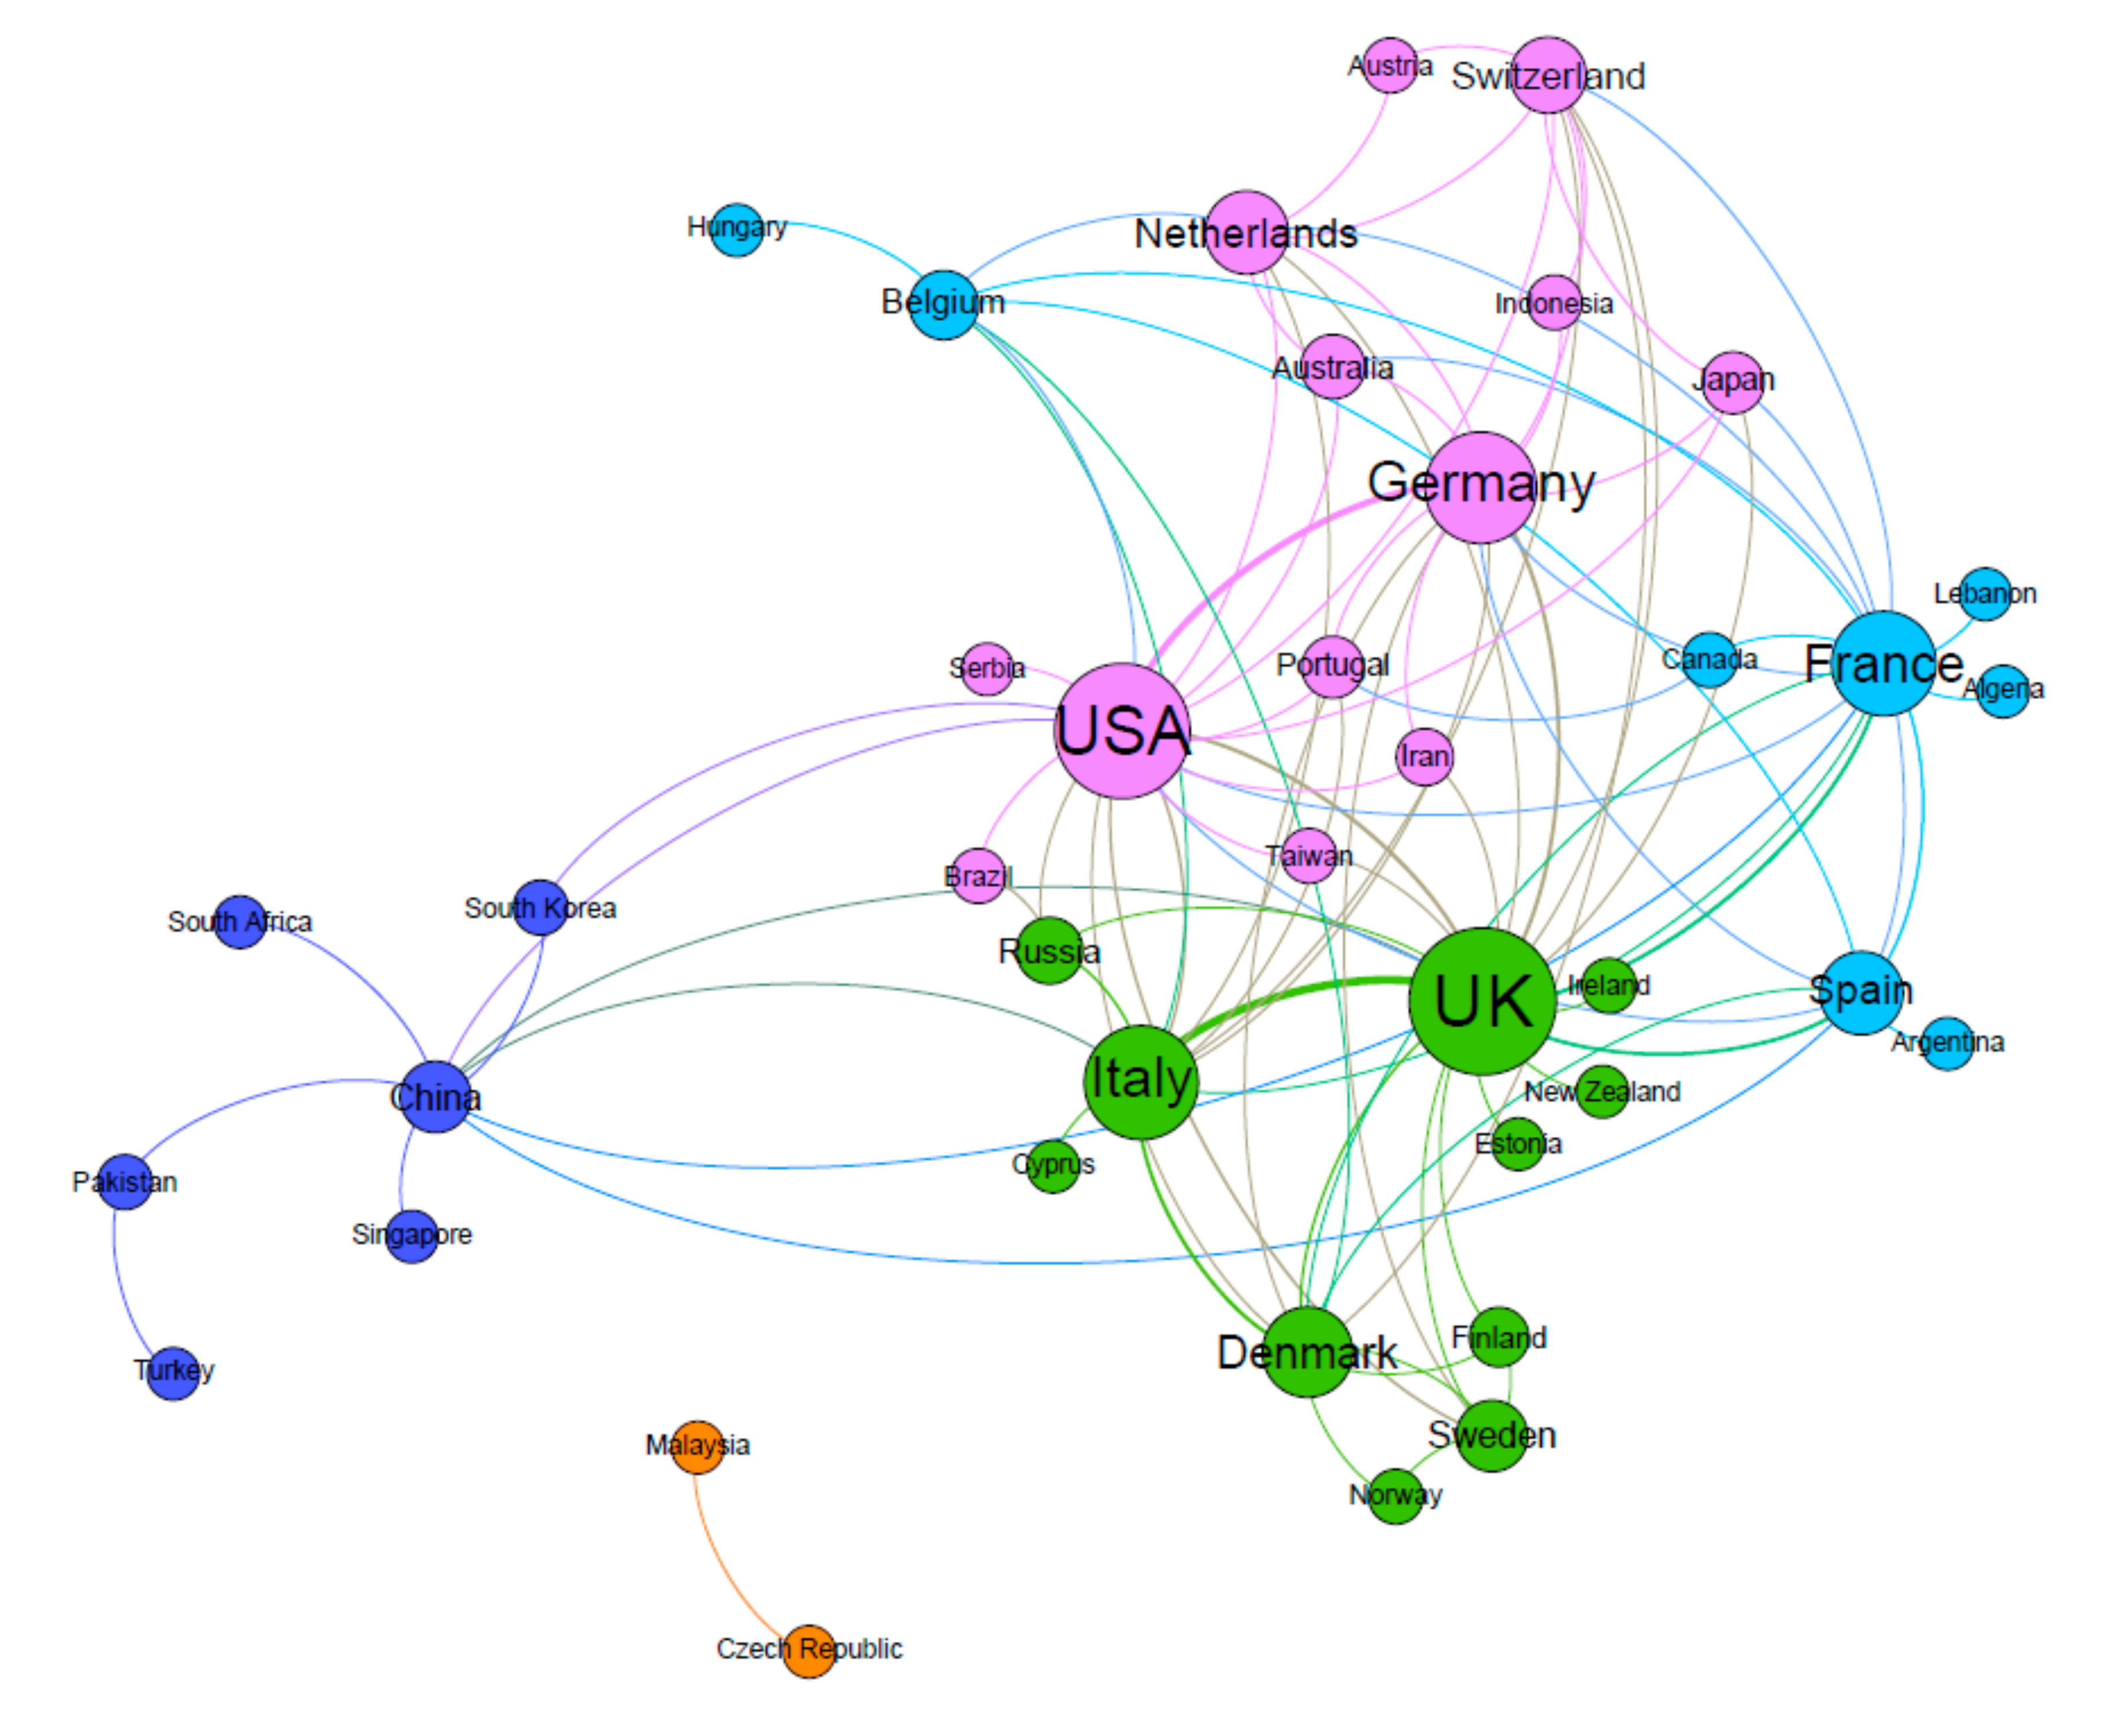
3.5. Where Knowledge Comes from
4. Discussion
5. Conclusions
Author Contributions
Funding
Conflicts of Interest
References
- Smart, P.; Holmes, S.; Lettice, F.; Pitts, F.H.; Zwiegelaar, J.B.; Schwartz, G.; Evans, S. Open Science and Open Innovation in a socio-political context: Knowledge production for societal impact in an age of post-truth populism. R D Manag. 2019, 49, 279–297. [Google Scholar] [CrossRef]
- Hoffmann, V.H.; Probst, K.; Christinck, A. Farmers and researchers: How can collaborative advantages be created in participatory research and technology development? Agric. Hum. Values 2007, 24, 355–368. [Google Scholar] [CrossRef]
- Meissner, D.; Shmatko, N. Integrating professional and academic knowledge: The link between researchers skills and innovation culture. J. Technol. Transf. 2019, 44, 1273–1289. [Google Scholar] [CrossRef]
- Chesbrough, H. Managing Open Innovation. Res. Manag. 2004, 47, 23–26. [Google Scholar] [CrossRef]
- Anderson, A.R.; Hardwick, J. Collaborating for innovation: The socialised management of knowledge. Int. Entrep. Manag. J. 2017, 13, 1181–1197. [Google Scholar] [CrossRef] [Green Version]
- Vanhaverbeke, W. Open Innovation: Researching a New Paradigm:The inter-organizational context of open innovation. In October; Chesbrough, H., Vanhaverbeke, W., West, J., Eds.; Oxford University Press: Boston, MA, USA, 2006; pp. 205–219. [Google Scholar]
- Crossan, M.M. The Knowledge-Creating Company: How Japanese Companies Create the Dynamics of Innovation. J. Int. Bus. Stud. 1996, 27, 196–201. [Google Scholar] [CrossRef]
- Liu, L.L.; Du, R.; Ai, S.Z. Impact of Culture on the Relationship between Knowledge Sharing and Innovative Behavior in IT Services Industry. Chin. J. Manag. Sci. 2016, 24, 159–166. [Google Scholar]
- Tu, X.Y.; Wang, Z.Y.; He, X.; Zhang, Q. Critical Thinking, Creative Process Engagement and Innovation Behavior: The Empirical Study of Technology-Based Enterprises; CNKI: Beijing, China, 2018; Volume 36, pp. 1–10. [Google Scholar]
- Pian, Q.Y.; Jin, H.; Li, H. Linking knowledge sharing to innovative behavior: The moderating role of collectivism. J. Knowl. Manag. 2019, 23, 1652–1672. [Google Scholar] [CrossRef]
- Ritala, P.; Olander, H.; Michailova, S.; Husted, K. Knowledge sharing, knowledge leaking and relative innovation performance: An empirical study. Technovation 2015, 35, 22–31. [Google Scholar] [CrossRef]
- Du Plessis, M. The role of knowledge management in innovation. J. Knowl. Manag. 2007, 11, 20–29. [Google Scholar] [CrossRef] [Green Version]
- Becker, B.A.; Eube, C. Open innovation concept: Integrating universities and business in digital age. J. Open Innov. Technol. Mark. Complex. 2018, 4, 12–16. [Google Scholar] [CrossRef] [Green Version]
- Perkmann, M.; Walsh, K. University–industry relationships and open innovation: Towards a research agenda. Int. J. Manag. Rev. 2007, 9, 259–280. [Google Scholar] [CrossRef]
- Žemaitis, E. Knowledge Management in Open Innovation Paradigm Context: High Tech Sector Perspective. Procedia Soc. Behav. Sci. 2014, 110, 164–173. [Google Scholar] [CrossRef] [Green Version]
- Van Nunen, K.; Li, J.; Reniers, G.; Ponnet, K. Bibliometric analysis of safety culture research. Saf. Sci. 2018, 108, 248–258. [Google Scholar] [CrossRef]
- Wang, B.; Pan, S.-Y.; Ke, R.-Y.; Wang, K.; Wei, Y.-M. An overview of climate change vulnerability: A bibliometric analysis based on Web of Science database. Nat. Hazards 2014, 74, 1649–1666. [Google Scholar] [CrossRef]
- Ospina-Mateus, H.; Jiménez, L.A.Q.; Lopez-Valdes, F.J.; Salas-Navarro, K. Bibliometric analysis in motorcycle accident research: A global overview. Scientometrics 2019, 121, 793–815. [Google Scholar] [CrossRef]
- Ugolini, D.; Bonassi, S.; Cristaudo, A.; Leoncini, G.; Ratto, G.B.; Neri, M. Temporal trend, geographic distribution, and publication quality in asbestos research. Environ. Sci. Pollut. Res. 2014, 22, 6957–6967. [Google Scholar] [CrossRef]
- Cobo, M.J.; López-Herrera, A.G.; Herrera-Viedma, E.; Herrera, F. Science mapping software tools: Review, analysis, and cooperative study among tools. J. Am. Soc. Inf. Sci. Technol. 2011, 62, 1382–1402. [Google Scholar] [CrossRef]
- Börner, K.; Chen, C.; Boyack, K.W. Visualizing knowledge domains. Annu. Rev. Inf. Sci. Technol. 2005, 37, 179–255. [Google Scholar] [CrossRef]
- Van Eck, N.J.; Waltman, L.; Dekker, R.; Berg, J.V.D. A comparison of two techniques for bibliometric mapping: Multidimensional scaling and VOS. J. Am. Soc. Inf. Sci. Technol. 2010, 61, 2405–2416. [Google Scholar] [CrossRef] [Green Version]
- De Paulo, A.F.; Porto, G.S. Solar energy technologies and open innovation: A study based on bibliometric and social network analysis. Energy Policy 2017, 108, 228–238. [Google Scholar] [CrossRef]
- Li, W.; Zhao, Y. Bibliometric analysis of global environmental assessment research in a 20-year period. Environ. Impact Assess. Rev. 2015, 50, 158–166. [Google Scholar] [CrossRef]
- Shibata, N.; Kajikawa, Y.; Matsushima, K. Topological analysis of citation networks to discover the future core articles. J. Am. Soc. Inf. Sci. Technol. 2007, 58, 872–882. [Google Scholar] [CrossRef]
- Maharani, W. Identifying influential user in twitter: Analysis of tweet content similarity in weighted network. J. Theor. Appl. Inf. Technol. 2015, 81, 558–563. [Google Scholar]
- Randhawa, K.; Wilden, R.; Hohberger, J. A Bibliometric Review of Open Innovation: Setting a Research Agenda. J. Prod. Innov. Manag. 2016, 33, 750–772. [Google Scholar] [CrossRef]
- Gao, H.; Ding, X.-H.; Wu, S. Exploring the domain of open innovation: Bibliometric and content analyses. J. Clean. Prod. 2020, 275, 122580. [Google Scholar] [CrossRef]
- Kovács, A.; Van Looy, B.; Cassiman, B. Exploring the scope of open innovation: A bibliometric review of a decade of research. Scientometrics 2015, 104, 951–983. [Google Scholar] [CrossRef]
- De Paulo, A.F.; Carvalho, L.C.; Costa, M.T.G.; Lopes, J.E.F.; Galina, S.V. Mapping Open Innovation: A Bibliometric Review to Compare Developed and Emerging Countries. Glob. Bus. Rev. 2017, 18, 291–307. [Google Scholar] [CrossRef] [Green Version]
- Ebrahim, N.A.; Bong, Y.B. Open Innovation: A Bibliometric Study. Int. J. Innov. 2017, 5, 411–420. [Google Scholar] [CrossRef] [Green Version]
- Lopes, A.P.V.B.V.; De Carvalho, M.M. Evolution of the open innovation paradigm: Towards a contingent conceptual model. Technol. Forecast. Soc. Chang. 2018, 132, 284–298. [Google Scholar] [CrossRef]
- Le, H.T.T.; Dao, Q.T.M.; Pham, V.-C.; Tran, D.T. Global trend of open innovation research: A bibliometric analysis. Cogent Bus. Manag. 2019, 6, 1633808. [Google Scholar] [CrossRef]
- Aziz, E.; Mustapha, H.; Jamila, E.A. A bibliometric study of the recent advances in open innovation concept. Procedia Comput. Sci. 2020, 175, 683–688. [Google Scholar] [CrossRef]
- Odriozola-Fernández, I.; Berbegal-Mirabent, J.; Merigó, J.M. Open innovation in small and medium enterprises: A bibliometric analysis. J. Organ. Chang. Manag. 2019, 32, 533–557. [Google Scholar] [CrossRef]
- Noviaristanti, S. Understanding Open Innovation in Large Firms: A Co-citation Bibliometric Analysis. In Proceedings of the 2nd Padang International Conference on Education, Economics, Business and Accounting (PICEEBA-2 2018); Dwita, V., Handayani, D.F., Sari, Y.P., Sari, A.Y., Yeni, I., Eds.; Atlantis Press: Paris, France, 2019; Volume 64, pp. 448–455. ISBN 978-94-6252-703-4. [Google Scholar]
- Seguí-Mas, E.; Signes-Pérez, E.; Sarrión-Viñes, F.; Vidal, J.A. Bibliometric analysis of the international literature on open innovation and absorptive capacity. Intang. Cap. 2016, 12, 51–72. [Google Scholar] [CrossRef] [Green Version]
- Della Corte, V.; Del Gaudio, G.; Sepe, F.; Sciarelli, F. Sustainable Tourism in the Open Innovation Realm: A Bibliometric Analysis. Sustainability 2019, 11, 6114. [Google Scholar] [CrossRef] [Green Version]
- Naushad, A.P.M.; Malik, B.A.; Raza, A. Bibliometric analysis of literature on knowledge sharing. Annals. Libr. Inf. Stud. 2018, 65, 217–227. [Google Scholar]
- Skute, I. Opening the black box of academic entrepreneurship: A bibliometric analysis. Scientometrics 2019, 120, 237–265. [Google Scholar] [CrossRef] [Green Version]
- Kokol, P.; Žlahtič, B.; Žlahtič, G.; Zorman, M.; Podgorelec, V. Knowledge Management in Organizations—A Bibliometric Analysis of Research Trends. Lect. Notes Bus. Inf. Process. 2015, 224, 3–14. [Google Scholar] [CrossRef]
- Aman, V. A new bibliometric approach to measure knowledge transfer of internationally mobile scientists. Scientometrics 2018, 117, 227–247. [Google Scholar] [CrossRef]
- Apriliyanti, I.D.; Alon, I. Bibliometric analysis of absorptive capacity. Int. Bus. Rev. 2017, 26, 896–907. [Google Scholar] [CrossRef]
- Agostini, L.; Nosella, A.; Sarala, R.; Spender, J.-C.; Wegner, D. Tracing the evolution of the literature on knowledge management in inter-organizational contexts: A bibliometric analysis. J. Knowl. Manag. 2020, 24, 463–490. [Google Scholar] [CrossRef]
- Appleyard, M.M.; Chesbrough, H.W. The Dynamics of Open Strategy: From Adoption to Reversion. Long Range Plan. 2017, 50, 310–321. [Google Scholar] [CrossRef] [Green Version]
- Carvalho, M.; Fleury, A.; Lopes, A.P. An overview of the literature on technology roadmapping (TRM): Contributions and trends. Technol. Forecast. Soc. Chang. 2013, 80, 1418–1437. [Google Scholar] [CrossRef]
- Meho, L.I.; Yang, K. Impact of data sources on citation counts and rankings of LIS faculty: Web of science versus scopus and google scholar. J. Am. Soc. Inf. Sci. Technol. 2007, 58, 2105–2125. [Google Scholar] [CrossRef]
- Xu, L.; Marinova, D. Resilience thinking: A bibliometric analysis of socio-ecological research. Scientometrics 2013, 96, 911–927. [Google Scholar] [CrossRef] [Green Version]
- Martín-Martín, A.; Orduña-Malea, E.; Thelwall, M.; Delgado-López-Cózar, E. Google Scholar, Web of Science, and Scopus: A systematic comparison of citations in 252 subject categories. J. Inf. 2018, 12, 1160–1177. [Google Scholar] [CrossRef] [Green Version]
- Arora, S.K.; Porter, A.L.; Youtie, J.; Shapira, P. Capturing new developments in an emerging technology: An updated search strategy for identifying nanotechnology research outputs. Scientometrics 2012, 95, 351–370. [Google Scholar] [CrossRef]
- Buckland, M.; Gey, F. The relationship between Recall and Precision. J. Am. Soc. Inf. Sci. 2018, 45, 12–19. [Google Scholar] [CrossRef]
- Chesbrough, H.W. Open Innovation: The New Imperative for Creating and Profiting from Technology; Harvard Business School Press: Boston, MA, USA, 2003. [Google Scholar]
- Search Technology the Vantage Point. Available online: https://www.thevantagepoint.com/ (accessed on 15 July 2020).
- Bastian, M.; Heymann, S.; Jacomy, M. Gephi: An open source software for exploring and manipulating networks. In Proceedings of the International AAAI Conference on Weblogs and Social Media; The AAAI Press: Menlo Park, CA, USA, 2009; pp. 361–362. [Google Scholar]
- Gui, Q.; Liu, C.; Du, D. Globalization of science and international scientific collaboration: A network perspective. Geoforum 2019, 105, 1–12. [Google Scholar] [CrossRef]
- Barrios, C.; Flores, E.; Martínez, M.Á.; Ruiz-Martínez, M. Is there convergence in international research collaboration? An exploration at the country level in the basic and applied science fields. Scientometrics 2019, 120, 631–659. [Google Scholar] [CrossRef]
- Clarivate Analytics Research Area Schemes. Available online: http://help.prod-incites.com/inCites2Live/filterValuesGroup/researchAreaSchema.html (accessed on 13 November 2020).
- Felin, T.; Zenger, T.R. Closed or open innovation? Problem solving and the governance choice. Res. Policy 2014, 43, 914–925. [Google Scholar] [CrossRef]
- Belderbos, R.; Faems, D.; Leten, B.; Van Looy, B. Technological Activities and Their Impact on the Financial Performance of the Firm: Exploitation and Exploration within and between Firms*. J. Prod. Innov. Manag. 2010, 27, 869–882. [Google Scholar] [CrossRef] [Green Version]
- Ferraris, A.; Santoro, G.; Dezi, L. How MNC’s subsidiaries may improve their innovative performance? The role of external sources and knowledge management capabilities. J. Knowl. Manag. 2017, 21, 540–552. [Google Scholar] [CrossRef]
- Hurmelinna, P.; Kyläheiko, K.; Jauhiainen, T. The Janus face of the appropriability regime in the protection of innovations: Theoretical re-appraisal and empirical analysis. Technovation 2007, 27, 133–144. [Google Scholar] [CrossRef]
- Moed, H.F. Citation Analysis in Research Evaluation; Springer: Berlin/Heidelberg, Germany, 2005; ISBN 9781402037146. [Google Scholar]
- Liñán, F.; Fayolle, A. A systematic literature review on entrepreneurial intentions: Citation, thematic analyses, and research agenda. Int. Entrep. Manag. J. 2015, 11, 907–933. [Google Scholar] [CrossRef]
- Ferligoj, A.; Kronegger, L.; Mali, F.; Snijders, T.A.B.; Doreian, P. Scientific collaboration dynamics in a national scientific system. Scientometrics 2015, 104, 985–1012. [Google Scholar] [CrossRef] [Green Version]
- Adams, J. The fourth age of research. Nat. Cell Biol. 2013, 497, 557–560. [Google Scholar] [CrossRef]
- Gui, Q.; Liu, C.; Du, D. The Structure and Dynamic of Scientific Collaboration Network among Countries along the Belt and Road. Sustainability 2019, 11, 5187. [Google Scholar] [CrossRef] [Green Version]
- Roper, A.T.; Cunningham, S.W.; Porter, A.L.; Mason, T.W.; Rossini, F.A.; Banks, J. Forecasting and Management of Technology; John Wiley & Sons: Hoboken, NJ, USA, 2011; ISBN 9780470440902. [Google Scholar]


| Search Query |
|---|
| TS = (“open innovation*”) AND TS = (“knowledge sharing” OR “knowledge transfer”) |
| Ranked | Countries Most Productive | Number of Publications | Countries Most Collaborative | Weighted Degree | Intermediary Countries | Betweenness Centrality | Influential Countries | Closeness Centrality |
|---|---|---|---|---|---|---|---|---|
| 1 | UK | 52 | UK | 21 | USA | 171.47 | USA | 0.6727 |
| 2 | Italy | 46 | USA | 14 | UK | 169.88 | UK | 0.6379 |
| 3 | Germany | 26 | Italy | 13 | China | 143.65 | France | 0.6065 |
| 4 | USA | 25 | Germany | 9 | France | 119.33 | Italy | 0.5781 |
| 5 | China | 23 | France | 8 | Italy | 62.88 | Germany | 0.5606 |
| 6 | Spain | 23 | Denmark | 7 | Spain | 47.35 | Spain | 0.5441 |
| 7 | France | 18 | Netherlands | 7 | Germany | 45.42 | Denmark | 0.5441 |
| 8 | Sweden | 14 | Spain | 6 | Denmark | 41.63 | China | 0.5362 |
| 9 | Denmark | 12 | Switzerland | 6 | Belgium | 37.4 | Switzerland | 0.5211 |
| 10 | Finland | 10 | China | 5 | Pakistan | 36 | Netherlands | 0.5138 |
| Organization | Publications | Country | Average Citations per Publication |
|---|---|---|---|
| University of Exeter | 8 | UK | 20.88 |
| Queens University of Belfast | 5 | UK | 21.40 |
| University of Turin | 5 | Italy | 35.4 |
| Polytechnic University of Timisoara | 5 | Romania | 4.80 |
| Ramon Llull University-ESADE | 5 | Spain | 2 |
| Scuola Super Sant Anna | 5 | Italy | 2.20 |
| University of London | 5 | UK | 23 |
| University of Napoli Federico II | 5 | Italy | 0 |
| University of Oradea | 5 | Romania | 4.80 |
| Chalmers University of Technology | 4 | Sweden | 6.25 |
| Ranked | Organizations Most Collaborative | Weighted Degree | Intermediary Organizations | Betweenness Centrality | Closeness Centrality |
|---|---|---|---|---|---|
| 1 | Univ Turin (5) | 15.0 | Copenhagen Business Sch (3) | 437.0 | 0.3838 |
| 2 | Univ Exeter (8) | 13.0 | Univ Turin (5) | 387.5 | 0.5230 |
| 3 | Univ Adelaide, Australia (4) | 13.0 | Univ Birmingham, UK (2) | 345.0 | 0.3584 |
| 4 | Univ London (5) | 11.0 | National Research Univ, Russia (4) | 332.0 | 0.3247 |
| 5 | Queens Univ Belfast (5) | 10.0 | Univ London (5) | 293.0 | 0.4722 |
| 6 | Ramon Llull Univ ESADE (5) | 10.0 | George Washington Univ (3) | 217.0 | 0.2753 |
| 7 | National Research Univ, Russia (4) | 9.0 | Hasselt Univ, Belgium (3) | 201.0 | 0.3333 |
| 8 | Hasselt Univ Belgium (3) | 9 | Univ Napoli Parthenope, Italy (2) | 189.0 | 0.4096 |
| 9 | Univ St Gallen, Switzerland (2) | 9 | Ramon Llull Univ ESADE (5) | 179.5 | 0.3392 |
| 10 | Univ Salento, Italy (4) | 8 | Univ Beira Interior, Portugal (3) | 169.0 | 0.2317 |
| Authors | Organization a | Country | Counts | Average Citations per Publication |
|---|---|---|---|---|
| Alexander, Allen T | University of Exeter Business School | UK | 8 | 20.88 |
| Miller, Kristel | Queens University of Belfast | UK | 5 | 19 |
| Baban, Calin Florin | University of Oradea | Romania | 5 | 4.80 |
| Draghici, Anca | Polytechnic University of Timisoara | Romania | 5 | 4.80 |
| Di Minin, Alberto | Scuola Super Sant Anna | Italy | 4 | 1.5 |
| Rumanti, Augustina Asih | Institute Technology of Bandung | Indonesia | 4 | 1 |
| Wiratmadja, Iwan Inrawan | Institute Technology of Bandung | Indonesia | 4 | 1 |
| Bogers, Marcel | University of Copenhagen | Denmark | 3 | 30.33 |
| Bonacci, Isabella | University of Naples Federico II | Italy | 3 | 0 |
| Ivascu, Larisa Victoria | Polytechnic University of Timisoara | Romania | 3 | 7.67 |
| Sources | Type of Source | Average of Citations per Publications | JCR | SJR | Publisher | ||||
|---|---|---|---|---|---|---|---|---|---|
| Field of Research | Quartile | Impact Factor 2019 | Field of Research | Quartile | Impact Factor 2019 | ||||
| Journal of Knowledge Management | Journal | 18.27 | Information Science & Library Science/Management | Q1 | 4.745 | Management Technology and Innovation/Strategy and Management | Q1 | 1.75 | Emerald |
| Technological Forecasting and Social Change | Journal | 20.56 | Business/Regional &Urban Planning | Q1 | 5.846 | Management of Technology and Innovation/Business and International Management/Applied Psychology | Q1 | 1.82 | Elsevier |
| R&D Management | Journal | 26.13 | Business/Management | Q2 | 2.908 | Business and International Management/Management of Technology and Innovation/Strategy and Management | Q1 | 1.25 | Wiley |
| International Journal of Innovation Management | Journal | 5.86 | Business and International Management | Q2 | 0.49 | World Scientific Publishing | |||
| Technovation | Journal | 46.43 | Industrial Engineering/Management/Operation Research and Management Science | Q1 | 5.729 | Engineering/Management of Technology and Innovation | Q1 | 2.8 | Elsevier |
| Ranked | Keywords | Weighted Degree | Ranked | Keywords | Weighted Degree |
|---|---|---|---|---|---|
| 1 | Open Innovation | 453.0 | 16 | Crowdsourcing | 35.0 |
| 2 | Knowledge transfer | 203.0 | 17 | Entrepreneurial university | 34.0 |
| 3 | Knowledge sharing | 155.0 | 18 | Co-creation | 31.0 |
| 4 | Innovation | 120.0 | 19 | Case study | 30.0 |
| 5 | University-industry collaboration | 96.0 | 20 | Intellectual property (IP) | 27.0 |
| 6 | SMEs | 93.0 | 21 | Research and Development (R&D) | 25.0 |
| 7 | knowledge management | 82.0 | 22 | Industry | 24.0 |
| 8 | Collaboration | 66.0 | 23 | Entrepreneurship | 24.0 |
| 9 | Technology transfer | 61.0 | 24 | Tacit knowledge | 22.0 |
| 10 | Network | 54.0 | 25 | Communities of practice | 21.0 |
| 11 | Absorptive capability | 50.0 | 26 | Collaborative innovation | 20.0 |
| 12 | University | 49.0 | 27 | Social media | 20.0 |
| 13 | Innovation management | 41.0 | 28 | Governance | 20.0 |
| 14 | Innovation performance | 39.0 | 29 | Academic entrepreneur | 19.0 |
| 15 | New product development | 36.0 | 30 | Clusters | 19.0 |
| Ranked | Keywords | Betweenness Centrality | Ranked | Keywords | Betweenness Centrality |
|---|---|---|---|---|---|
| 1 | Open innovation | 104.580 | 16 | Open innovation practices | 4011 |
| 2 | Knowledge transfer | 31.700 | 17 | Technology transfer | 3783 |
| 3 | Knowledge sharing | 28.142 | 18 | Education | 3720 |
| 4 | Innovation | 17.602 | 19 | New product development | 3165 |
| 5 | University-industry collaboration | 17.456 | 20 | Crowdsourcing | 3160 |
| 6 | SMEs | 11.373 | 21 | Innovation strategy | 3105 |
| 7 | Knowledge management | 11.202 | 22 | Start-up | 2894 |
| 8 | Absorptive capability | 7782 | 23 | Clusters | 2686 |
| 9 | Collaboration | 5687 | 24 | University | 2507 |
| 10 | entrepreneurial university | 5604 | 25 | Academic entrepreneur | 2420 |
| 11 | Communication | 5573 | 26 | Case study | 2368 |
| 12 | Network | 4380 | 27 | Communities of practice | 2282 |
| 13 | Innovation performance | 4355 | 28 | Research and Development (R D) | 2179 |
| 14 | Inter-organizational context | 4333 | 29 | Intellectual property (IP) | 2079 |
| 15 | Innovation management | 4182 | 30 | Co-creation | 2021 |
| Times Cited | Title | Publication Year | Authors | Affiliations | Country | Source title | Author Keywords |
|---|---|---|---|---|---|---|---|
| 610 | University-industry relationships and open innovation: Towards a research agenda [14] | 2007 | Perkman, M. Walsh, K. | Loughborough Univ | UK | International Journal of Management Reviews | Strategic research partnership |
| Technology-transfer | |||||||
| Academic research | |||||||
| 175 | Closed or open innovation? Problem solving and the governance choice [58] | 2014 | Felin, T. Zenger, T. | Univ Oxford Washington Univ | UK USA | Research Policy | Strategy |
| Governance choice | |||||||
| Open and closed innovation | |||||||
| 121 | Technological Activities and Their Impact on the Financial Performance of the Firm: Exploitation and Exploration within and between Firms [59] | 2010 | Belderbos, R. Faems, D. Leten, B. Van Looy, B. | Maastricht Univ Katholieke Univ Leuven Univ Twente Vlerick Leuven Gent Management Sch | Netherlands Belgium Netherlands Belgium | Journal of Product Innovation Management | Strategic alliances |
| Interorganizational collaboration | |||||||
| Knowledge transfer | |||||||
| 110 | How MNC’s subsidiaries may improve their innovative performance? The role of external sources and knowledge management capabilities [60] | 2017 | Ferraris, A. Santoro, G. Dezi, L. | Univ Turin Ural Fed Univ Univ Napoli Parthenope | Italy Russia | Journal of Knowledge Management | Open innovation |
| Innovative performance | |||||||
| External R&D | |||||||
| Knowledge management | |||||||
| 89 | The Janus face of the appropriability regime in the protection of innovations: Theoretical re-appraisal and empirical analysis [61] | 2007 | Hurmelinna, P. Kylaeheiko, K. Jauhiainen, T. | Lappeenranta Univ Technol | Finland | Technovation | Open innovation |
| Tacit knowledge | |||||||
| Appropriability regime | |||||||
| Intellectual property |
Publisher’s Note: MDPI stays neutral with regard to jurisdictional claims in published maps and institutional affiliations. |
© 2020 by the authors. Licensee MDPI, Basel, Switzerland. This article is an open access article distributed under the terms and conditions of the Creative Commons Attribution (CC BY) license (http://creativecommons.org/licenses/by/4.0/).
Share and Cite
Alvarez-Meaza, I.; Pikatza-Gorrotxategi, N.; Rio-Belver, R.M. Knowledge Sharing and Transfer in an Open Innovation Context: Mapping Scientific Evolution. J. Open Innov. Technol. Mark. Complex. 2020, 6, 186. https://0-doi-org.brum.beds.ac.uk/10.3390/joitmc6040186
Alvarez-Meaza I, Pikatza-Gorrotxategi N, Rio-Belver RM. Knowledge Sharing and Transfer in an Open Innovation Context: Mapping Scientific Evolution. Journal of Open Innovation: Technology, Market, and Complexity. 2020; 6(4):186. https://0-doi-org.brum.beds.ac.uk/10.3390/joitmc6040186
Chicago/Turabian StyleAlvarez-Meaza, Izaskun, Naiara Pikatza-Gorrotxategi, and Rosa Maria Rio-Belver. 2020. "Knowledge Sharing and Transfer in an Open Innovation Context: Mapping Scientific Evolution" Journal of Open Innovation: Technology, Market, and Complexity 6, no. 4: 186. https://0-doi-org.brum.beds.ac.uk/10.3390/joitmc6040186