1. Introduction
The problem of cost-effective organization of logistics activities for a long time was solved using relatively simple techniques, the basis of which was a set of economic indicators obtained during the reporting period. Since such indicators are classified as lagging, the efforts of the developers were aimed at creating better software applications for managers of logistics services of enterprises. Over the past decade, technologies have become widely available, as well as equipment that can fundamentally change the approach to managing the processes of moving goods and cargo. This includes the possibility of machine-readable information exchange on goods and cargoes between machines, mobile computing devices, tracking systems, cloud solutions that coordinate in real time the activities of all participants in the supply chain. At the same time, the structure of relations between participants in this segment of the economy has become more complex. This is caused by the processes of consolidation into commercial structures, which leads to an increasing complexity of management of such business objects, as well as a manifold increase in the time and money spent on ensuring the material flows of goods and cargo necessary to maintain a competitive business. To solve such voluminous problems, the use of scientifically grounded mathematical models is required. This approach will allow using the digital footprint of processes in the logistics network and developing an algorithmic basis for a whole line of software tools for better management of the logistics industry.
The research gap could be identified as the dynamics of discrete and continuous flows of material resources has not been mathematically described yet. This was due to the fact that there were no widespread and available technologies for machine-to-machine information exchange, especially in digital form. In addition, the existing mathematical apparatus for describing such processes by systems of partial differential equations was mainly in demand in problems of mathematical physics. In the presented article, the authors outlined the results of research that will combine the achievements of mathematical theory with the capabilities of modern digital technologies in the field of logistics. The advantage of the presented model is also the invariance of the description of network logistics processes. This model reflects the entire spectrum of flows of material resources from discrete to continuous.
Taking into account the importance of the issue of the stability of solutions depending on the unevenness of flows in network logistics processes we could consider such a task possible in linear models or by imposing a number of restrictions and assumptions. In general, the study of stability was not the task of our study. For linear cases, there are well-developed techniques, substantiated by a number of practical examples. For the problem considered in our article, the issue of the stability in network logistics processes regarding the economic indicators of such activities is the subject of further deep research and is limited to the specific practical application of the developed mathematical model. Thus, we have presented a general concept.
The authors set a goal to apply the methods of mathematical modeling based on the use of equations describing the dynamics of both discrete and continuous flows of data. In our case, such characteristics as cargo volumes and the current time are interrelated. Therefore, we apply complex mathematical partial differential equations that will allow us to describe models for realizing the full potential of digitalization of the network logistics processes. Currently, the ability to use a digital data as arguments to a mathematical model in real time has appeared due to machine-to-machine communication technologies.
2. Review the Status of the Problem
Since the necessary digital technologies and equipment have become available to a wide range of participants in the logistics business relatively recently, research in the direction of their application is being developed only now, mainly in countries leading intensive. commercial activities. Digital business models go against economic and operational principles which guide companies in all industries [
1]. Likewise, high-performance companies have invested a large share of their digital capital into new digital business compared to competitors [
2]. Indeed, the concept “digital” is widely seen as an updated term for defining what Information technology (IT) or digital marketing does. However, a wider, more holistic view of what digital actually stands for should be applied. In the opinion of the authors, one should agree with the consulting firm McKinsey that a digital rethinking of activities makes it possible to benefit from a structural process, combining search, development, realization, and risk reduction of its digital investments [
3], as well as to look at digital broadcasting as a practically instantaneous, free, and perfect opportunity to connect people, devices, and physical objects in any place with the purpose to increase the efficiency of commercial activities in cooperation with various partners [
4,
5,
6,
7,
8,
9,
10].
With the development of markets, client expectations are growing, and companies react to the increased expectations with new value propositions which consumers were previously unaware of and in such a way that it contradicts the generally accepted view of business [
7]. Such companies as Apple, Tencent, and Google erase traditional industry definitions, spanning categories of goods and client segments. Owners of such hyperscale platforms enjoy huge operational benefits from the automation of processes, algorithms, and network effects, created by interactions of hundreds of millions, billions or more users, clients, and devices.
Schotanus, F. and Telgen, J. developed a typology for purchasing groups consisting five main forms of cooperative purchasing on the basis of two distinguishing dimensions: the influence by all members on the group activities and the number of different group activities [
11]. Those five forms of cooperative purchasing are as follows: piggy-backing groups (informal purchasing groups), third-party groups (long term cooperation), lead buying groups (outsourcing purchasing), project groups (an intensive form of cooperative purchasing), and programme groups (regularly meeting of the management teams of the cooperating organizations). The work [
12] considered the case of Poland in respect with the business model to inter-entity cooperation within purchasing groups in the renewable energy industry improving its profitability. The research [
13] indicates the complexity of the inter-organizational dynamics, not only from a dyadic perspective (purchasing group and its members), but as well from a member-to-member perspective. We could agree that different types of cooperation should be taken into account.
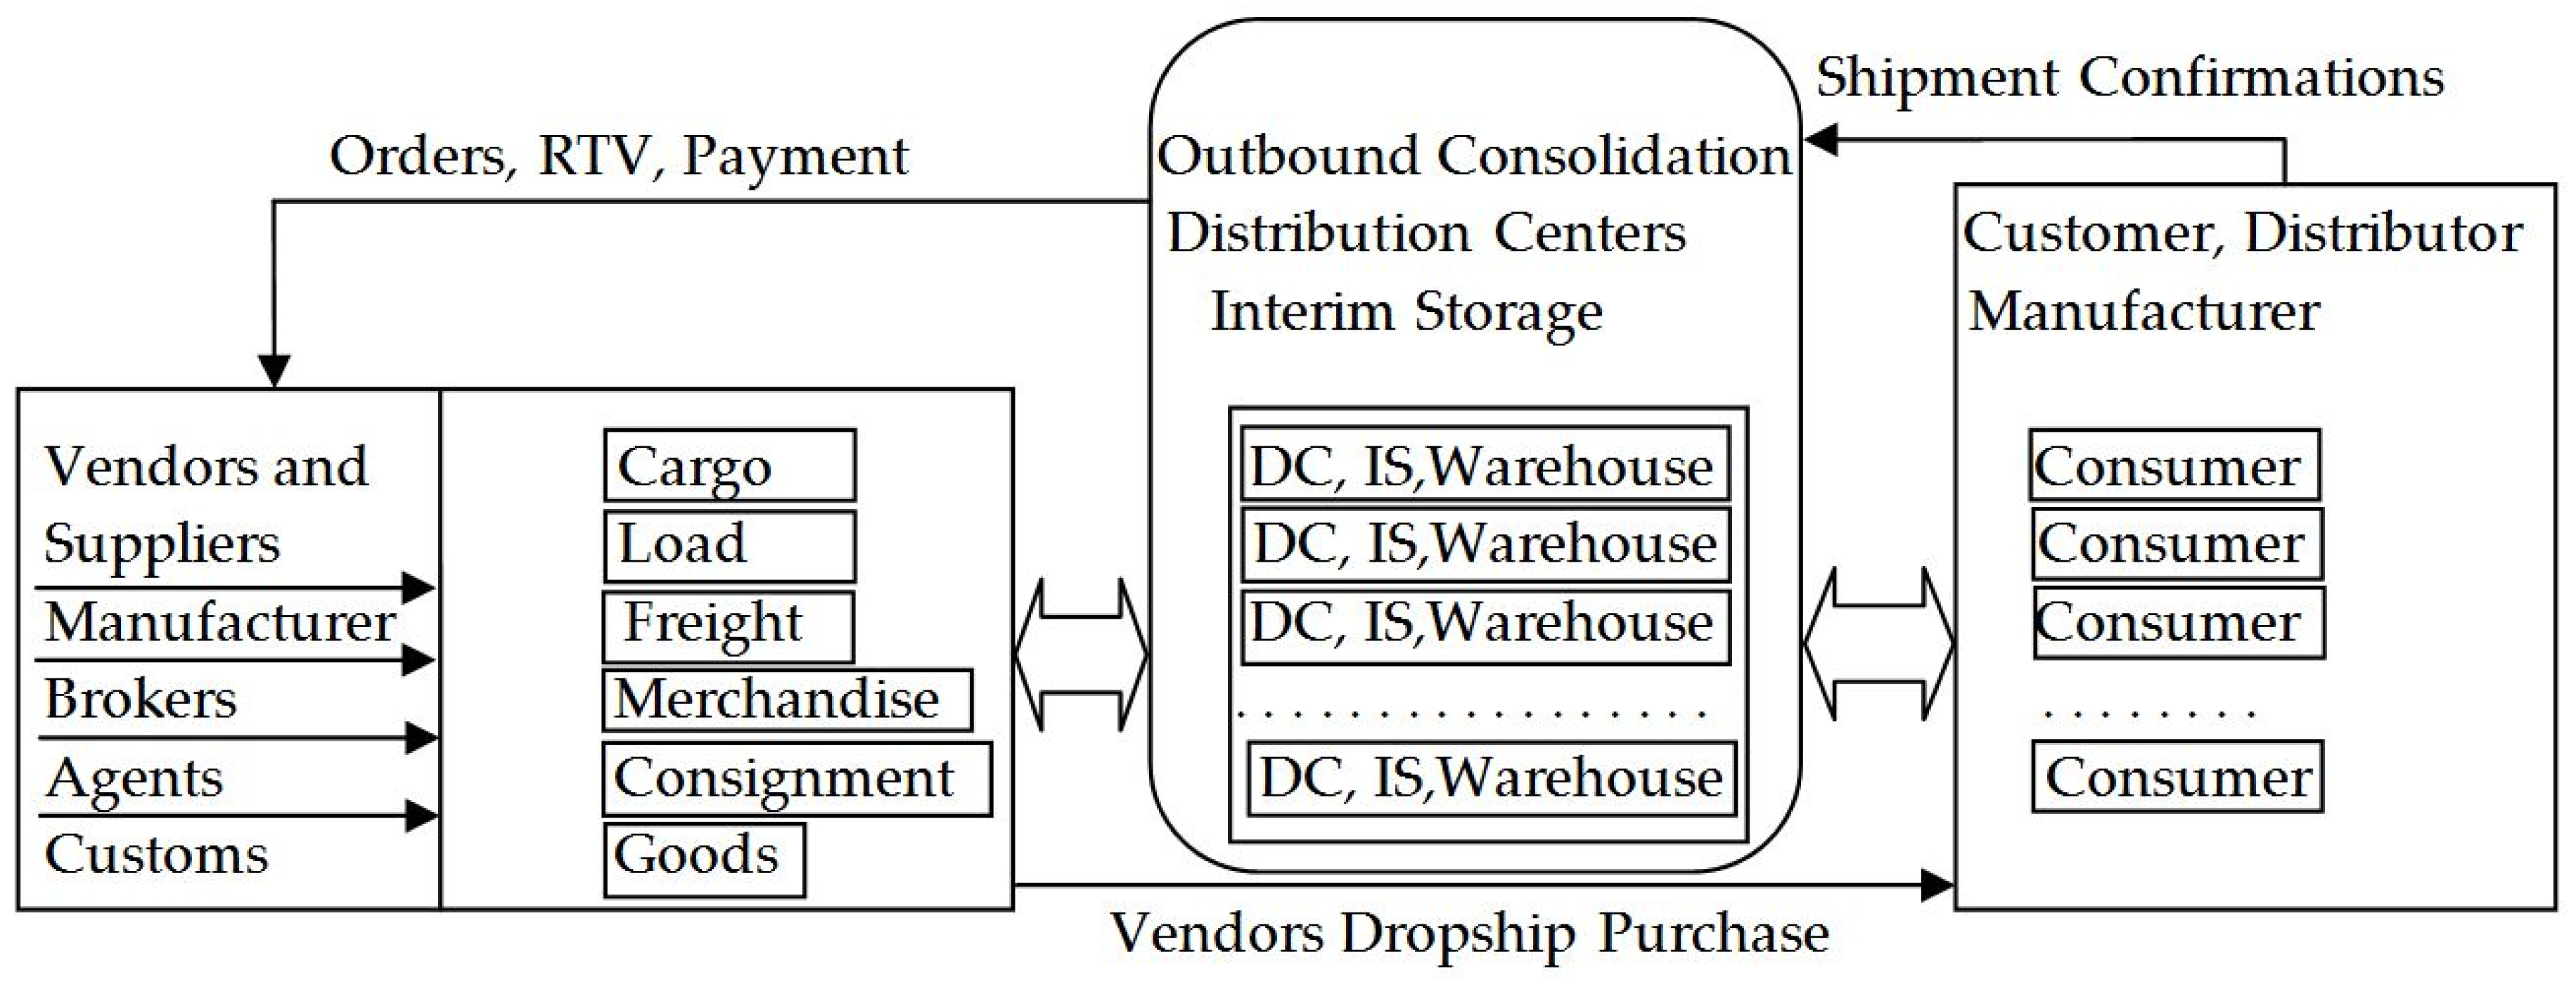
Transshipment points are shown at the center of a traditional logistics network, with a linear structure with multiple ways available to communicate with other suppliers and customers (
Figure 1). This figure illustrates the existing information and material flows. Double-headed arrows indicate opportunities for mutual exchange between participants in logistics activities.
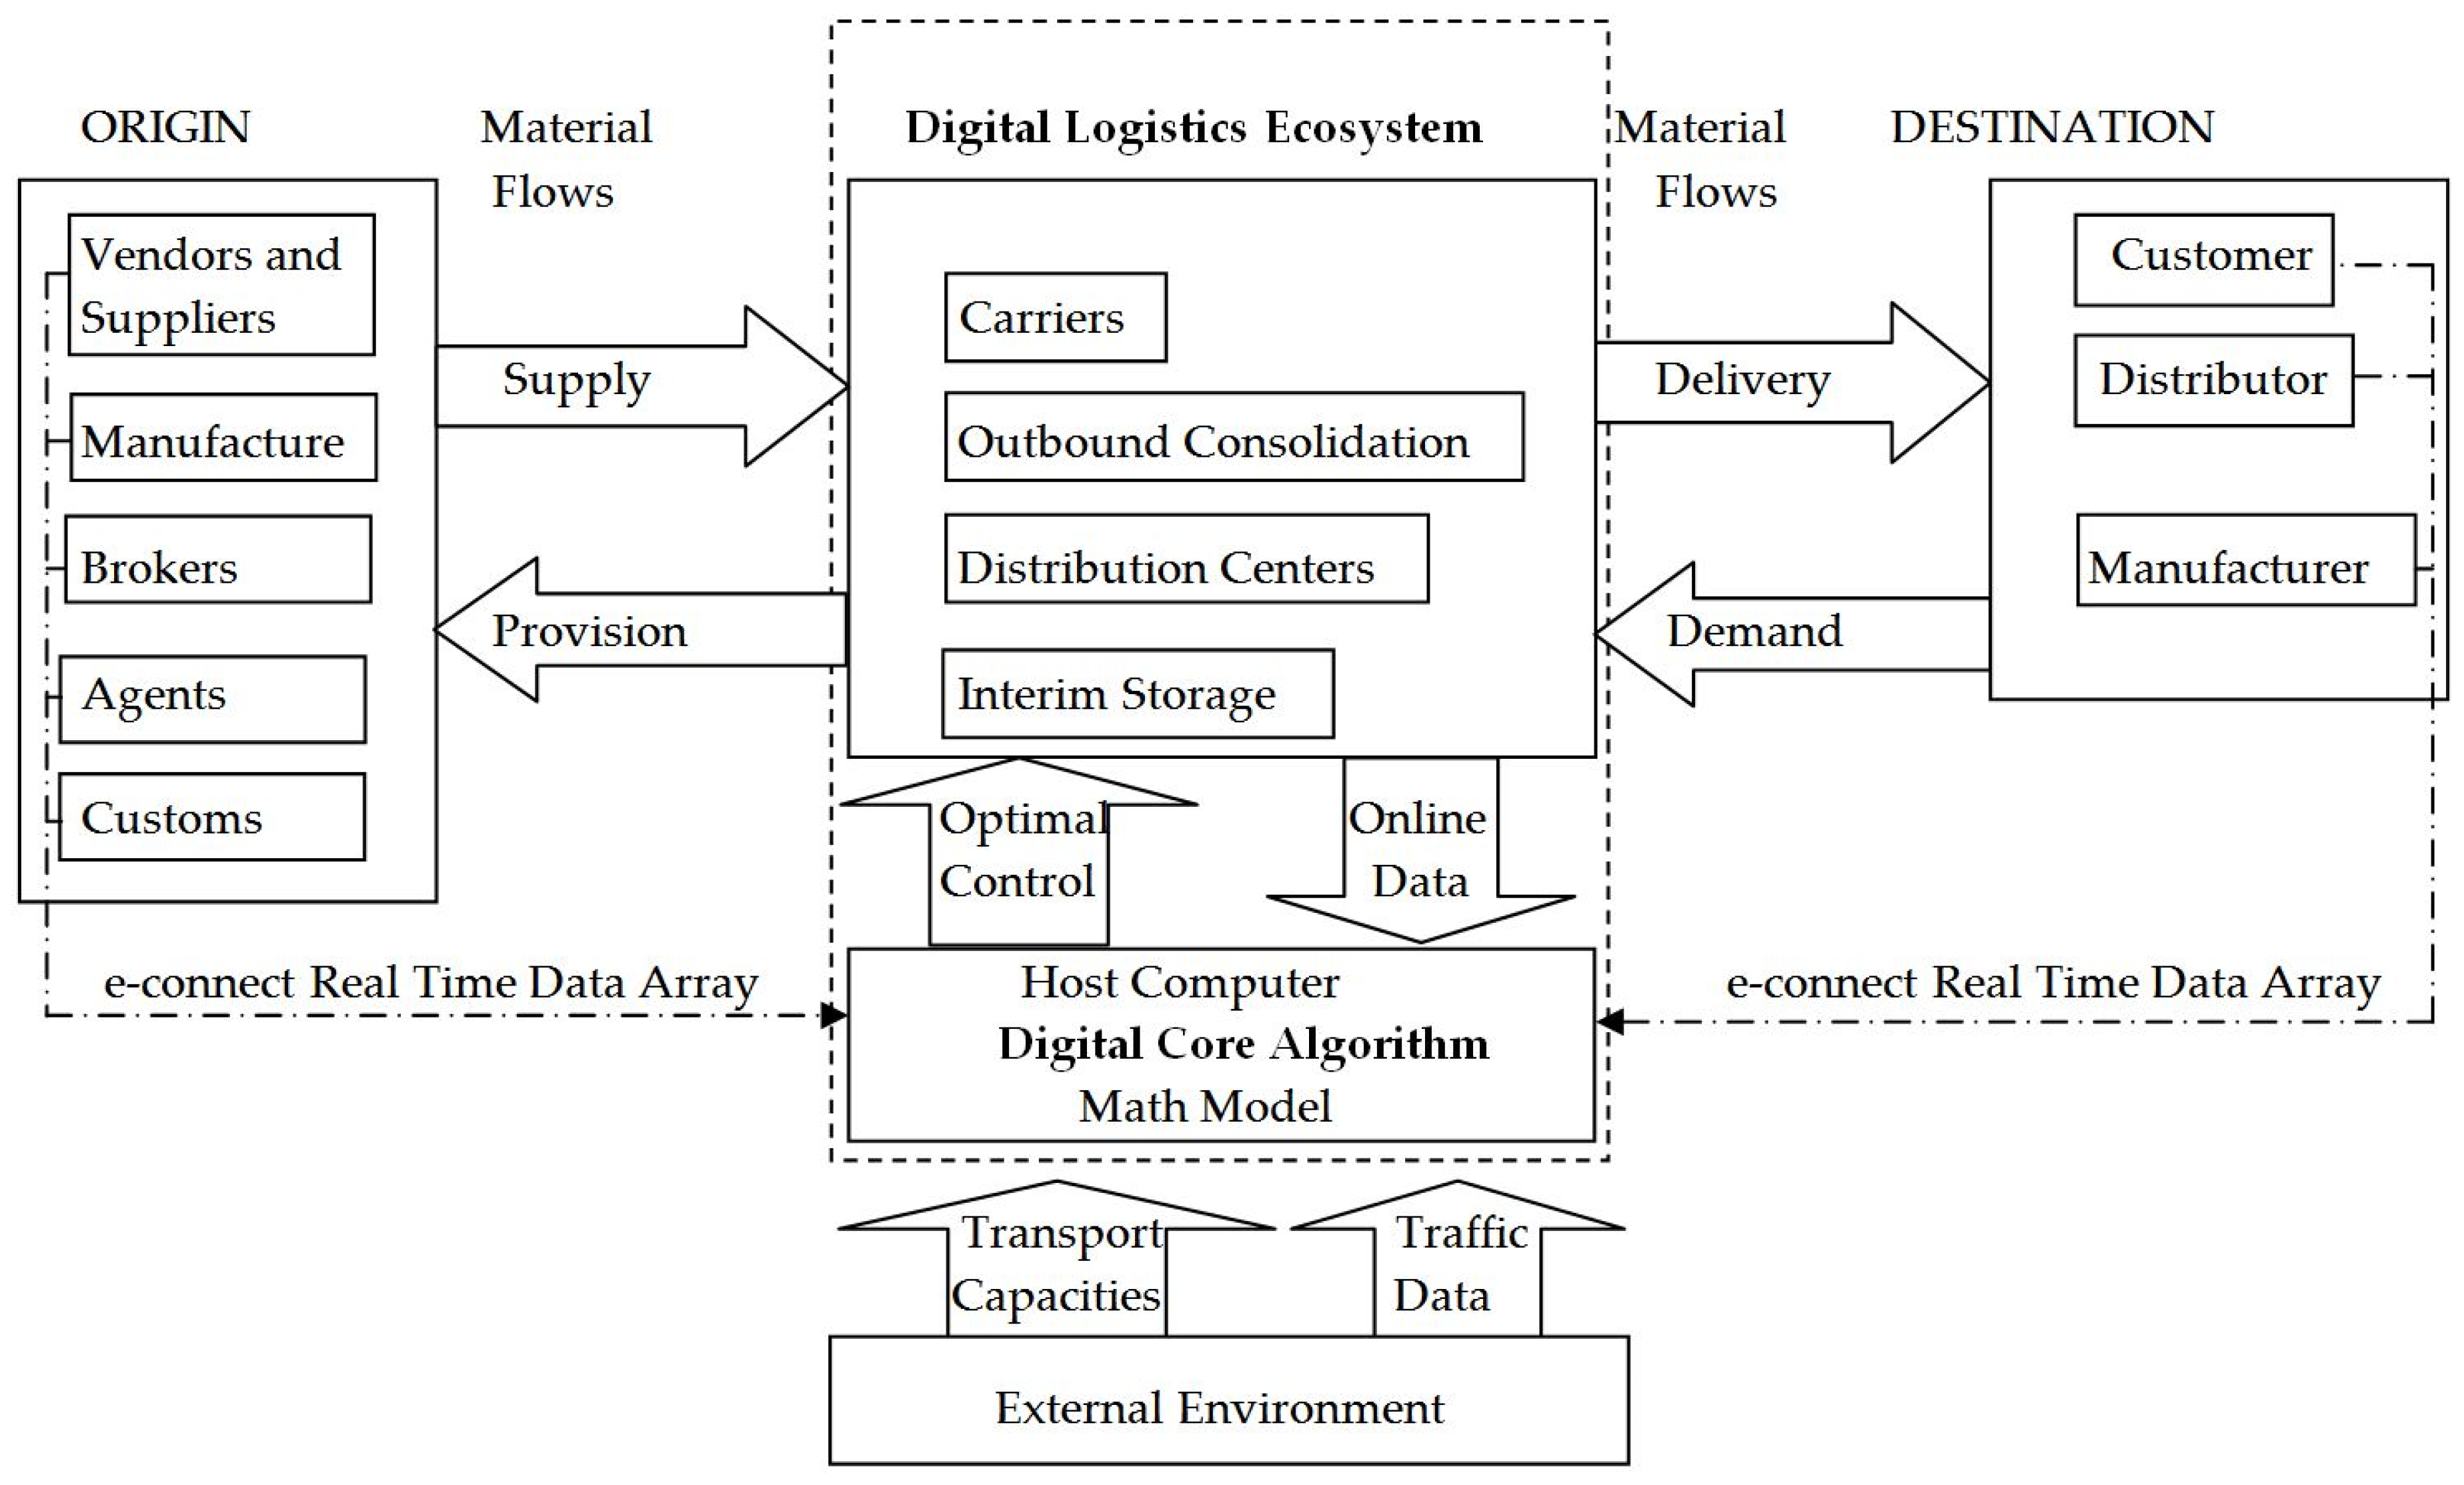
The research gap regards the shift of the paradigm which leads to a reformation of the concept of supply chains by creating connections between links traditionally not connected (from the static sequence of members of the supply chain) into a system of members interacting with each other—digital logistics network (
Figure 2).
This scheme is not just a development of the traditional model of interaction but has a number of fundamental differences. The study of these differences provides the possibility of applying the theoretical results obtained in this article. This primarily refers to real-time information flows. This factor makes it possible to apply the algorithms developed below to optimize the logistics process. It is also taken into account that the management of the logistics system is carried out on the basis of advanced planning calculated on the host computer. Previously, such an organization of the process could not be achieved in a traditional logistics network due to the lack of both machine-to-machine interaction technologies and the development of global high-speed mobile Internet channels.
3. Literature Review
Network effects become the key differentiator and driver of value creation since the value of a good or a service increases as more supply-side partners augment the service and more products and services become digital and connected [
14]. Digital business strategy is different from traditional IT strategy in the sense that it is much more than a cross-functional strategy, and it transcends traditional functional areas (such as marketing, procurement, logistics, operations, or others). Three main technologies are tended to change supply chain business processes: robotic process automation (RPA), artificial intelligence (AI)/machine learning (ML), and blockchain [
15]. The formation and development of digital logistics platforms [
16] is determined by market demands. Dynamically developing consumer demand and intercontinental expansion of network trading structures encourage companies to invest heavily in the development of new technologies. First of all, the direction of machine-to-machine interaction, Internet of things (IoT), and cloud solutions XaaS (Anything as a Service) is being developed. The need for Big Data technologies stems from the fact that the ever-growing complexity of the supply chain continues to pose a major obstacle for supply chain companies. Applying up-to-date technology to specific parts of the supply chain alone cannot reach its full potential if the company is unable to share data and use data to solve problems.
The paper [
17] covers the difference between computer simulation and emulation while considering the designing of logistics systems with using computer modelling. A simulation model helps to uncover functional dependencies of logistics system, both technical and construction problems effecting on logistics route. Computer emulation aims to test the company control systems by various loadings of the logistic model system and find technical and construction problems effecting on logistics route.
It can be shown that there is currently a paradigm shift from the traditional view of a supply chain to a network-centric concept, initially proposed by the company Deloitte in 2019 [
18]. A traditional supply chain is a linear structure with discrete development of the process of design, planning, flow source, production, delivery, and after-sales service.
The particularity of modern logistics is found in its role as the common denominator. In this concept, a variety of sources such as suppliers, producers, customs flows use a single network of sea and air routes. Until now, the coordination of the participants in the logistics process has been difficult. This is primarily due to the fact that there were no information exchange technologies, and mobile communications were poorly developed [
19]. The lack of available technical means, such as tablets with geolocation, smartphones with GPS trackers among transport workers, drivers, and forwarders, was especially affected. Hence followed another important factor such as the absence of a coordination server and, accordingly, algorithms for managing the interaction of participants in the logistics process scattered and moving across a large territory. Work is carried out without consideration of real traffic, as a result causing traffic jams on the roads and lines at border crossings. Further, significant is the loss of time waiting for unloading at intermediate warehouses and temporary storage areas. Transportation is not coordinated with cargo parameters, with significant demurrage and detention, as well as problems of reverse logistics and the influence of seasonal changes in the flow densities [
20,
21,
22,
23,
24].
A hybrid scheme that combines a simulation model and a mathematical programming model was proposed by [
25] for designing logistic networks for co-firing biomass, specifically switchgrass, in conventional coal-fired power plants. Sustainable logistics business models extending was considered regarding 1PL (First-party logistics) to 5PL (Fifth-party logistics) scheme and related sustainable logistics practices [
26]. This research [
27] focusses on special issues of using a monitoring system for integrating sensor location and quality data into transport processes in automotive supply chains. Both the environmental influence parameters and the potential effects of sensor-based quality data for supply chain performance were considered by the researchers. The reliability of complex emergency logistics networks is investigated in the work [
28]. It could be agreed that the reliability of the logistics network is significantly important to reducing environmental and public health losses in post-accident emergency rescues. The interactive development of the logistics and manufacturing industries in view of the interdependence of Manufacturing and Logistics Industries in China studied in [
29].
When developing a method for solving the problem of constructing an economic and mathematical model of logistics processes, an analysis of the literature and approaches of a number of authors in similar situations was carried out [
30,
31,
32,
33] with both new circumstances and peculiarities of the global business consolidation trend being taken into account. The emergence of logistics networks of complex topology, the allocation of a segment of third party logistics, the need to support emergent stock levels concentrated in the transportation nodes can be formalized using mathematical modeling methods, which take into account various aspects of interaction of financial and data flows [
34], and with consideration of the specifics of developing digital ecosystems [
16,
35,
36,
37,
38,
39]. These network-like objects can easily be associated with the geometric graph used in mathematics. The edges of the graph are an element of linear interaction taking place in the nodes of the graph (or at its vertices). This concept of formation is established in systems of logistics, supply, interim storage, and processing of flows of goods, raw materials, and other cargo. The on-going processes developing over time allow a mathematical description to be developed using dynamic models, linked to a geometric graph.
The works [
40,
41,
42] show that in this approach to operating a logistics network, the formalized processes on the graph edges are ratios reflecting the patterns of current activities. The concept of internal nodes is formalized with principles of interactions of contiguous continuums. The correspondence of real suppliers and consumers to boundary nodes is achieved using boundary conditions as well as the boundaries denoted in mathematics to reflect the features of a specific object of commercial activity. An overview of literature [
43,
44] shows that the section of mathematics dedicated to solving boundary value problems in a class of differential equations regarding distributed parameters realized on a graph of varying topology can serve as the basis for researching the dynamics of economic processes on networks of arbitrary configuration [
45]. The paper [
46] describes the solvability of hyperbolic systems with distributed parameters on the graph in the weak formulation. The common characteristic when examining such mathematical models is to assign them to a class of boundary or boundary value problems. This meets all the requirements for solving equations describing systems with parameters distributed on a graph.
4. Methodology
Techniques such as linear programming or network planning are well known. Their use is justified in deterministic problems of distribution and planning. The modern market environment shows a high degree of uncertainty, which forces us to look for new ways to solve the problem of efficient logistics organization.
A significant breakthrough was the available technologies of machine-to-machine interaction, mobile high-speed data transmission networks along all significant routes, and unlimited access to geolocation. These and other devices provide a data stream containing a complete set of information about the nature of the goods, its movement, expiration dates, conditions of detention, and other important information. To develop control algorithms, we need to formally represent where these data will enter in the form of arguments of a mathematical model.
In the digital concept, data exchange happens not only between those involved in commercial activities but also with consideration of the expected loading of terminals on the near horizon. Likewise, the algorithm of the management server takes into account traffic in real time and possibilities of consolidated transport pools. At the same time, data processing and management decision making is done on the planning horizon using mathematical optimization methods [
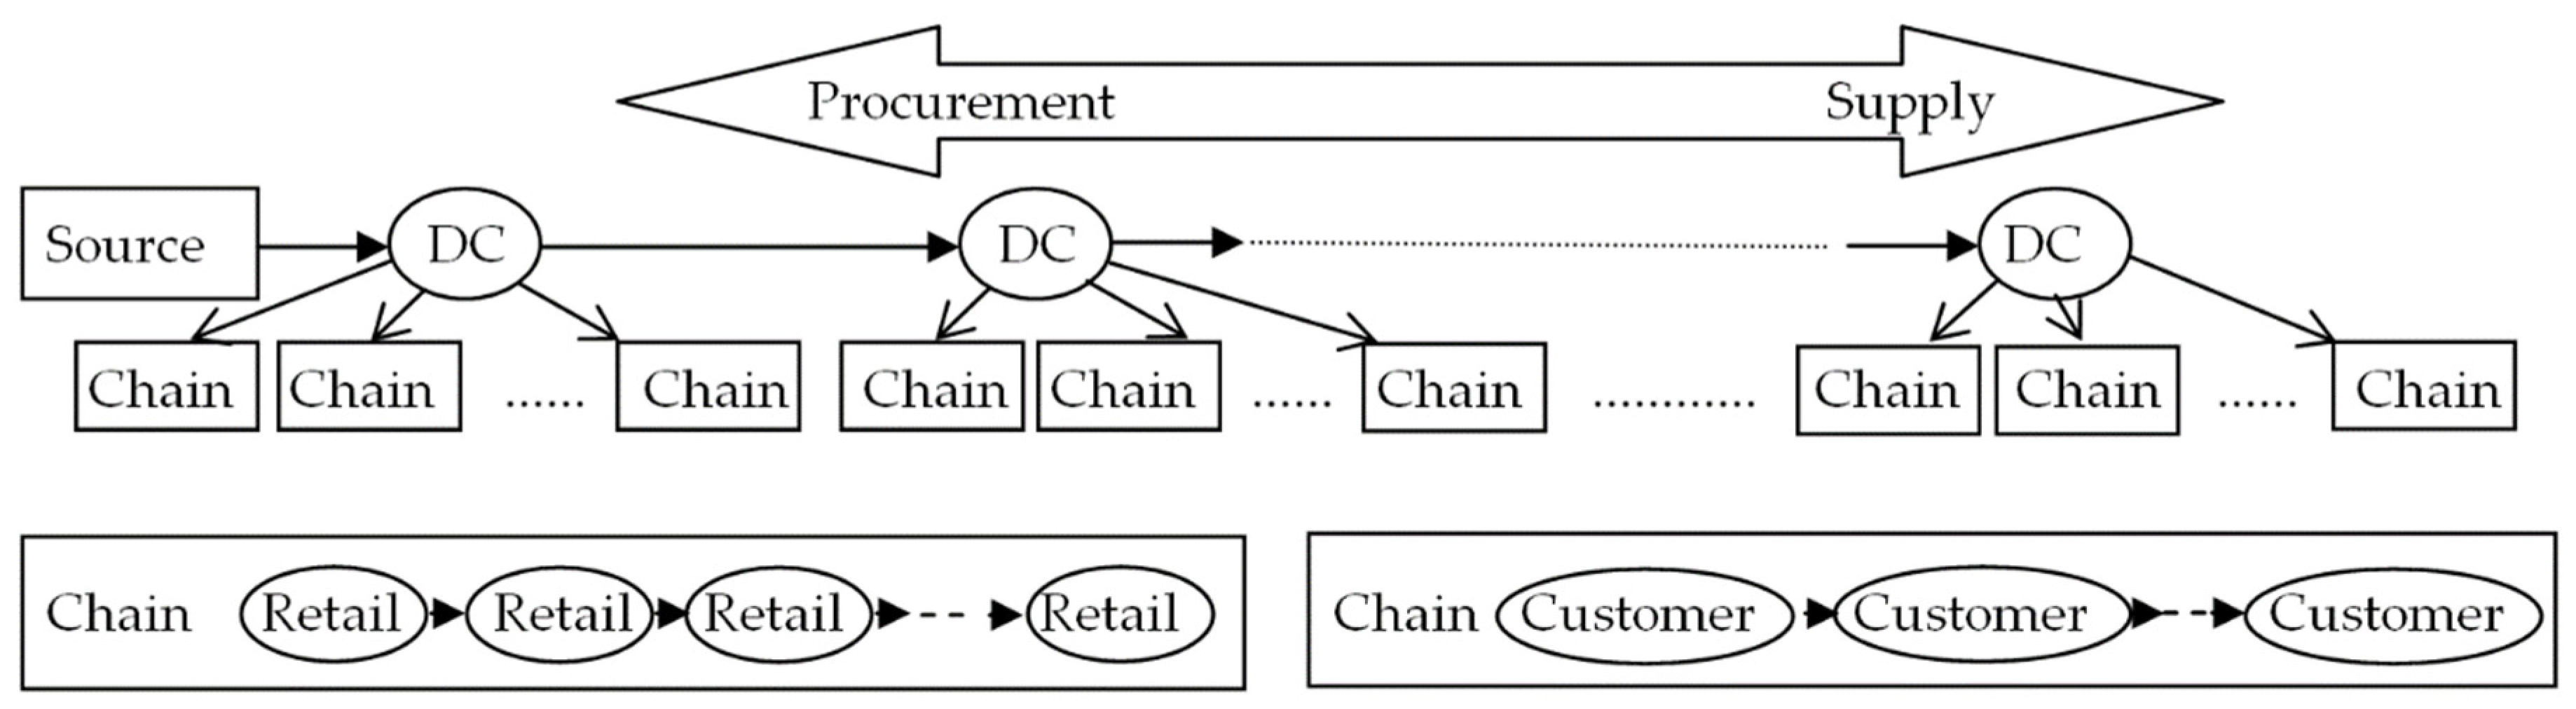
34]. The modern logistics system includes a very large number of participants in trading activities. This includes manufacturers, suppliers, intermediate distribution centers, customers, and their own warehouses. The most common type of topology today is star. This is due to the fact that over 80% of trade is consolidated in retail chains. This type of business has a centralized system of management and distribution of goods and cargo flows. It should be noted that each spoke of a star topology in a paradigm of logistics networks (spoke–hub distribution paradigm) represents a chain of hundreds or thousands of intermediate nodes, partners of the logistics network.
Figure 3 shows the structure of interaction in a linear form as a set of information and material flows in the spoke of the star topology.
Analysis and exchange of information between all members of a logistics network is carried out based on a digital logistics grid, built on data acquisition technology with sensors and real-time transmission by way of mobile communication aiming to conduct a subsequent analysis and digital technology exchange data. The work [
47] considers the mechanism for setting up a supply chain based on economic–mathematical models with optimization, artificial intelligence, and analytics.
It shows that the process of setting up a digital chain (DC) network involves reacting to interruptions on the fourth day by adapting the logistics configuration of the supply chain using optimization with the purpose to continue operating in the best way possible. The developed model makes it possible to analyze the market and react in a timely manner to client demands in terms of the dynamic development of a logistics network and not statically, as is the case with the linear structure of traditional supply chains.
5. Main Formalisms
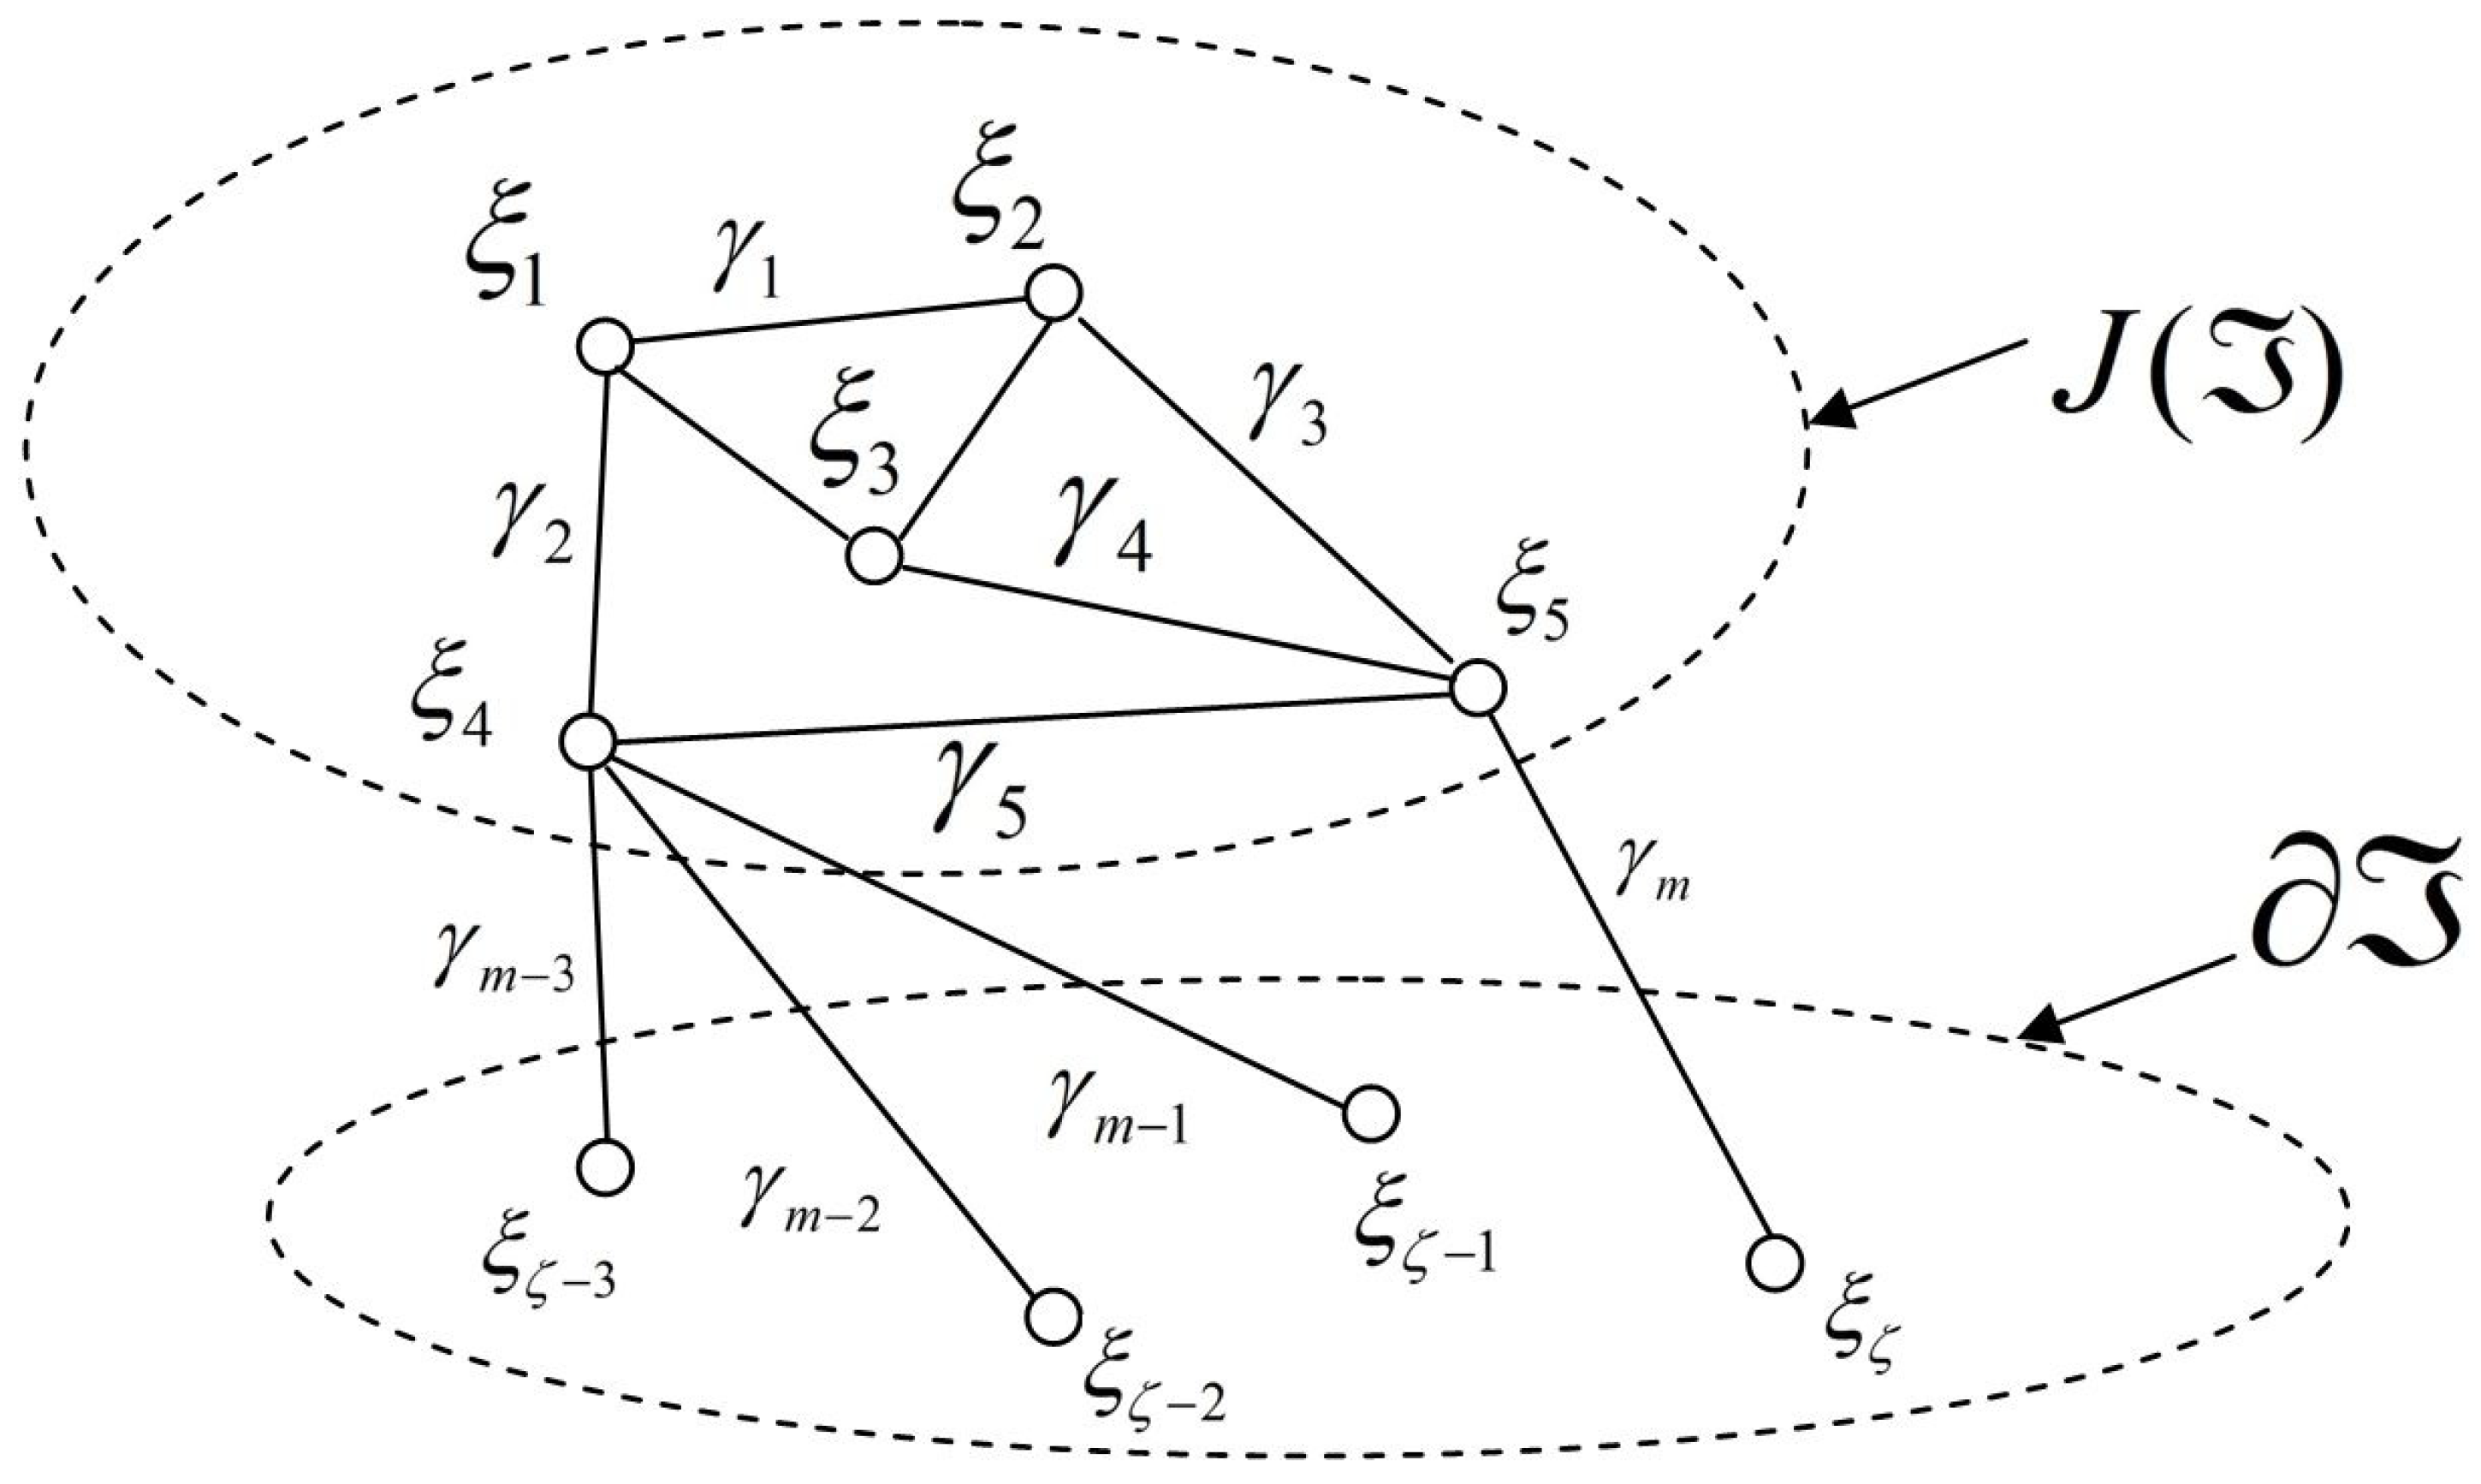
The symbol
—is introduced for the bounded compact graph of arbitrary topology (
Figure 4).
Next, the edges of this graph are denoted as
. For the nodes of the graph, the symbol
is introduced. The number is identified with the symbols
k,
, independent for the nodes and
edges; a number of boundary nodes are denoted as
; a number of internal nodes are
. Every
is an oriented edge. Furthermore, each
is parameterized by segment. The indicated properties for parameterizing and orientation depend on the topology of the network, which is formalized with a graph. In practice, the most popular types are star, chain, and arbitrary [
45,
46].
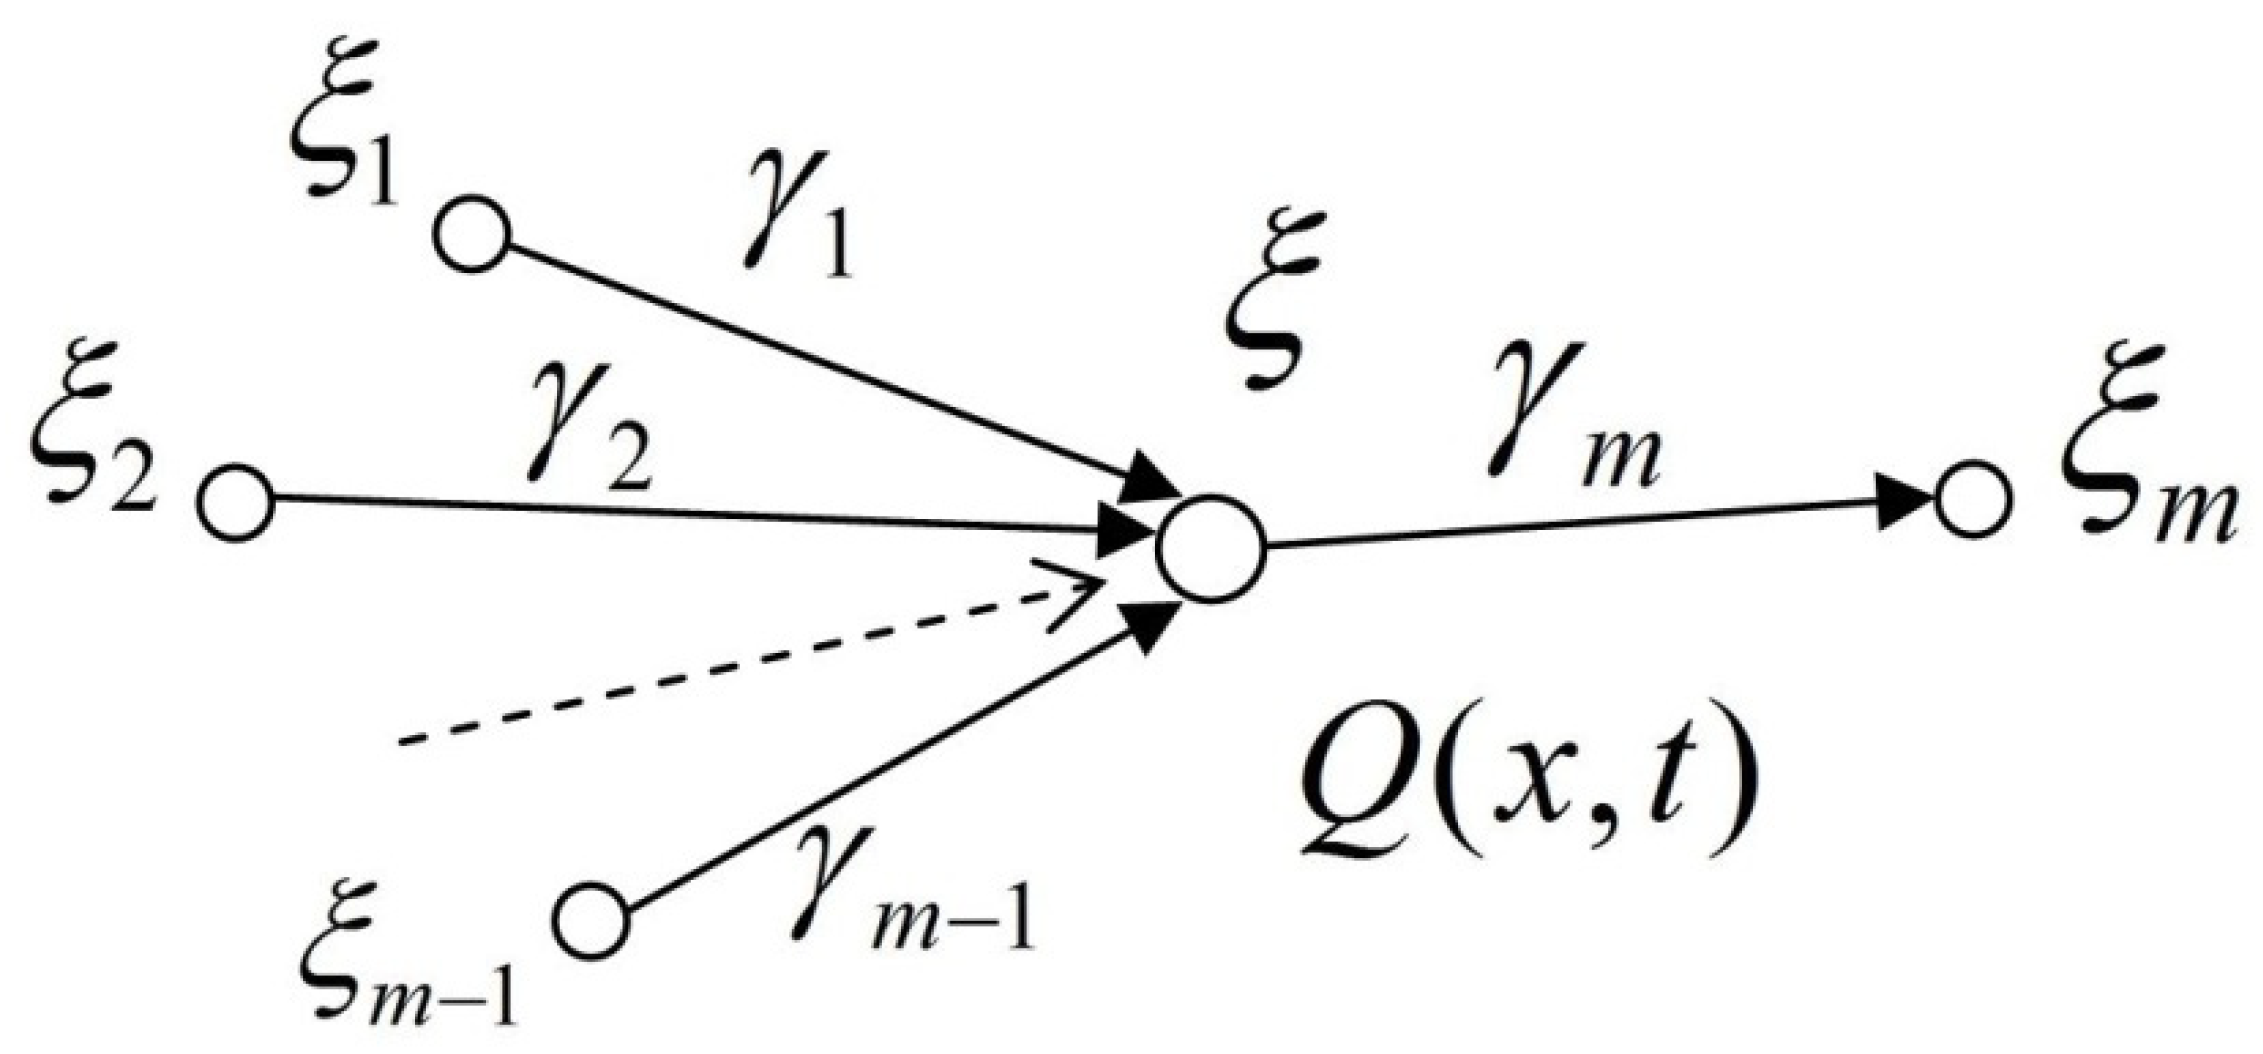
The first example is that of star topology (
Figure 5).
The manifold —is denoted as the geometric graph —which reflects the given type of network interaction. The edges are denoted as and the central node as ; For each of the edges there is a parameterization by segment . Next, is parameterized by segment . Given orientation on —towards ; on —away from ; condition is introduced in order for each point on to have a corresponding numeric value : or (. Where for all () is fixed and proves that belongs to center ).
Function on the graph is scalar. is displayed as ; the symbol denotes the restriction of the scalar to .
The symbol is introduced for a set of functions which are continuous on the graph . Likewise, denotes a set of piecewise continuous functions. Here it is necessary to satisfy the conditions: the functions on the graph edges are continuous, in the limits can vary. denotes a set of twice continuously differentiable functions meeting the condition that the derivatives up to the second order belong to the set . Here, they are one-sided differentiable at the ends of the edges.
A linear differential equation on the edge is considered on a curve with an arbitrary combination of the initial and boundary derivatives of the function in the node where conditions of agreement exist. A group of differential equations [
46,
47] on edges
of graph
, such as:
with transmission conditions of in internal nodes of the graph with consideration of orientation and parameterization on the graph
:
is a differential equation on the graph. In this case
are the functions [
48,
49] defined for each
in the process. Given the above, the summation is carried out along the edges
adjacent to
.
Conditions (2) can be set by other ratios. In boundary nodes belonging to the boundary edges
of the graph
, boundary conditions such as the following are given
or
The set of linear differential equations given above on edges (1) and the boundary conditions (3) or (4) in boundary nodes which are supplemented with agreement conditions in internal nodes (2) as a whole allow the boundary value problem to be formulated on the graph. In this case
are the parameters [
50] defined in the process.
Boundary value problems in a class of equations with partial derivatives are formulated similarly to problems (1)–(4), adding to them initial conditions.
6. Results
Mathematical models could be used for the optimization of the processes occurring in the network logistics structures. Commercial activities involve objects for whose formalization differential equations with partial derivatives are involved. Belonging to these, first and foremost, are systems with distributed parameters. These problems occur in a wide range of applications, in particular, movement on networks, logistics, distribution.
Mathematical models of these objects make it possible to solve important issues occurring when examining the dynamics of a process (primal problems) and the parameters of the network (inverse problems).
The distribution of the volume of goods over a segment of the commercial network of length
is described by the function
,
,
[
48,
49,
50] obeys the mass transfer equation [
51]:
everywhere in the area
, excluding a set of changes in transfer parameters. This is the semi-discrete set
, where the variable
takes discrete values, in which for any
intensity of distribution of the commodity volume
remains continuous, i.e.,
and the flow of commodity volume, which is reflected in this mathematical model by the quantity per unit of time
(here the effect of loading/unloading is taken into account), undergoes jumps with the indicator
,
i.e.,
. Thus, the distribution of commodity volume over a fragment of a commercial network is due to the property of matching (conjugation) at certain points (nodes) of the commercial network:
here
. Relationships (2) describe the situation when the conditions of movement at certain points (nodes) affect the flow rate through these points, while taking into account the phenomenon of a jump in flows proportional to the distribution of the commodity volume at the indicated points.
For the mathematical description and construction of a mathematical model of the transfer (diffusion) process in commercial networks, functions with a spatial variable varying on the graph are used. In this case, the considered simplest graph is the area of variation of the spatial variable x.
The symbol
is introduced for the graph in question. Its edges are likewise formalized as
. The indices of the nodes
are introduced. The orientation of the edges
is accepted for each
. The edges are parameterized using
. For the internal nodes looked at in this topology of the mass
, the identification
is introduced. To take into account the border nodes of the network under consideration, we assign numbers to each of them as follows:
. Aiming to describe the flow process in the considered network and its distribution:
, the following ratio can be written:
Next, the ratios for the considered
are written out in the following form when accounting for the parameterization introduced above:
This is, accordingly, carried out for all
. For values
since Equations (3) and (5) are carried out, after transformations it gives:
Thus, the set of Equations (4) and (6) allow the transfer processes to be mathematically modeled. The topology of the corresponding network is then formalized by the graph .
For a strictly mathematical description and solution of the problem, the initial conditions need to be given:
as well as the corresponding boundaries of the form:
which completely determines the boundary value problem along with (4) and (6) on the graph
.
In this case
—are the functions defined in the process. The corresponding constants are fixed in the set
. In this way, in the network modeled on the graph
in the corresponding area of values
, the classical Sturm–Liouville theory is formulated, dual boundary, defined by the ratios (4)–(7), or in the symbols (4), (5), (7) and (8) and denoting the variable as
:
in the set
, here the problem is parameterized by a set of equations:
or
by defined nodes
.
For the spectral parameter
the corresponding boundary conditions are presented as
A system of differential equations on the star topology will be the set of ratios (8), (9) (or (8), (10)).
The solution to the boundary value problem (4)–(7) on
is methodologically possible by a series expansion using an orthonormal system of eigenfunctions
which reflect the Sturm–Liouville theory (8), (9), (11) and (12) (or (8), (10)–(12)):
The function
is differentiated according to the variable
. Next, using the ratios (8), (9)
, and possibly (8), (10) on the topology in question, reflected by
, the integrals dependent on
are calculated. As a result it can be written out as
considering that
Applying for
the initial and boundary value (7) and (8), respectively, and for
the Equations (8) and (9) as for the eigenfunctions, combining with (11), (12) boundary conditions necessary for the certainty of the problem (11) and (12), the desired expression for
can be obtained by completing (
):
where
In this arrangement, for (14) the initial conditions are achieved by expanding
using a set of eigenfunctions
:
The solution
of Equation (14) with consideration of the initial conditions is written in the form:
The solution
of the boundary value problem (4)–(7) on
is of the form:
An important effect of this approach to solving the problem of modeling flows in a network presented as a graph is the possibility of applying the result as a sequence for searching for a solution to problems of modal control. This is relevant for practical cases of control that changes the eigenvalues of a boundary value problem or the mode for achieving the set goals.
We should take into account the concept for optimization under uncertainty: recoverable robustness being considered in a specific literature. A solution is recovery robust if it can be recovered by limited means in all likely scenarios [
52,
53,
54,
55]. These serious works show the application of linear programming methods in the field of transport problems and investigate the stability of solutions to random perturbations of parameters. This issue is very important for modelling of the network logistics processes. Our research aims to apply mathematical modeling of logistics processes in dynamics; that is, to relate volumes and movement in time.
7. Conclusions
The presented results of mathematical modeling of flows on networks were obtained as a result of the development of the problem of creating the algorithmic foundations of the core of a digital logistics platform. Modern technologies for the exchange of information in digital form are capable of providing real-time data flow on the location of transport, route of travel, the nature of the cargo, including expire date, storage, and transportation conditions. This information constitutes the information flow. In addition, knowing the entire set of possible routes, transfer points, intermediate storage warehouses and distribution centers, one can formalize them using mathematical graph theory. Using this information as arguments of a mathematical model, it becomes possible to calculate the material flows of goods and cargo. Thus, a tool appears for predicting the entire logistics process and solving the main problem of finding the most economically profitable options for organizing logistics. The criteria of economic efficiency should combine the balance between the costs of transporting goods and cargo, the time spent on performing the entire range of logistics services from the point of receiving the cargo to its transfer to the consumer, and the level of utilization of the capacities of the consolidated transport pool. If, when working with goods with a short expire date or components according to “Just in time” supply programs, delivery time becomes more important, then for FMCG (fast moving consumer goods) goods, costs are more important. Since distribution centers and intermediate warehouses are part of the logistics network structure, optimization will expand the use of modern warehouse technologies such as pick-by-line, cross docking and others. It will also increase cost efficiency by expanding the use of the Quant, Minimum Order Quantity. For the end consumer, the profitability also increases in terms of interaction with logistics outsourcing, since the possible losses from Out-Of-Stock Sales will decrease, as well as the freezing of working capital due to the Over Stock factor.
First of all, the obtained results are in demand by operators of the third party logistics segment. This is due to the global trend of separating logistics into a separate industry, which allows manufacturing and trading companies to focus on their core competencies. Since there are a large number of software add-ons for solving problems formalized by mathematical models, including those from the field of scientifically based search for optimal solutions by mathematical methods, the obtained algorithms will allow creating cross-platform applications for supporting managerial decisions of managers of logistics services. Implementation of applications in cloud servers will enable online interaction with freight forwarders and transport directly in the process of moving, regardless of their location. As a result, it is possible to combine the activities of all participants within a single digital logistics platform.
8. Points for Scientific Discussion
In his famous article, Christensen considered the determinants of open modes of innovation associated with the industrial dynamics of an industry segment undergoing a process of radical technological innovation [
56] unraveling the Open Innovation concept which was initially studied by Chesbrough from the company-level perspective (in contrary to the closed innovation old model) and illustrated with cases of large American companies such as IBM (International Business Machines Corporation), Intel, Lucent, and Xerox.
The open innovation engineering model including both open-innovation engineering channels and determining ways of operating the channels through conceptual experiments are considered by JinHyo Joseph Yun [
57]. In this work the important research question is investigated regarding the open innovation channels and its operating as a knowledge funnel to conquer the growth limit of capitalism in the fourth industrial revolution. Open innovation engineering channels mean open source computing, theory of solving inventive problem (TRIZ), open supply chain management (SCM), system dynamics, mechanism design or big data. This scientific research could be treated as a fundamental theory for our consideration.
Our approach for describing a process in a node is not the unique one. Much depends both on the specific commercial situation in the network and on the capabilities of mathematical tools in the mathematical analysis of the obtained problems. It is very important to note: an arbitrary network (graph) is the union of a finite number of the simplest networks (the simplest graphs) and star networks (star graphs). Hence, it follows that the mathematical description of transfer processes on an arbitrary network (graph) is a combination of those on the simplest and stellar networks (graphs). The development of a number of particular cases of application of the obtained mathematical model is of interest. For example, it is known that intermediate storage and operations at distribution centers constitute a significant part of the total time of movement of goods from producer to consumer. At the same time, it is necessary to compare various technologies, such as, for example, cross-docking, pick-by-line, as well as the throughput of the nodes of the logistics network. Separately, we can consider the case of routes containing cross-border movement, which is often not the only one, since the existence of customs procedures requires separate consideration in the model. It is also necessary to assess the possibility of using mathematical modeling in conditions of market uncertainty. In this case, part of the arguments awakens to be described by distribution functions, part by interval data. In our opinion, it is possible to use queueing theory, which will allow us to formalize the uncertainty of the flow described by Poisson distribution using Erlang solution. So, to solve the problems of planning logistics activities for a longtime horizon, it is necessary to take into account the seasonality factor of both demand and the use of modes of transport. This can be formalized by the expansion of demand in the Fourier series, and the variable structure of the mathematical graph.
We describe a mathematical apparatus for modeling flows in logistics networks, and not only the movement of discrete, but also continuous flows (for example, not only containers and other containers, but also liquid substances such as hydrocarbons). Specific examples of calculations can be the object of promising research in the field of practical application in various areas of industry and transport.
As far as the limitations of the proposed approach are concerned the issues of the reliability of the network logistics processes remains outside the framework of the study and such a simulation model could be a subject for future research. The practical significance of the developed mathematical model is not limited to the logistics of movement of goods and cargoes by various modes of transport (road, rail, sea, and air). The above formalisms are also suitable for describing the processes of moving liquid cargo. This is relevant today for managing flows in oil pipelines, since their structure is also networked with pumping and distribution stations at the nodes. Moreover, the obtained equations can be used to study the processes in network gas transmission systems with complex topology. This is a topic for further investigation.

 ,
, 


