Article

How Big Data Analytics Boosts Organizational Performance: The Mediating Role of the Sustainable Product Development

1
Department of Management Sciences, Sahiwal Campus, COMSATS University Islamabad, Sahiwal 5700, Pakistan
2
Department of Informatics and Quantitative Methods, University of Hradec Kralove, 500 03 Hradec Králové, Czech Republic
3
School of Education, South China Normal University, Guangzhou 510631, China
4
Lahore Business School, Sargodha Campus, University of Lahore, Sargodha 40100, Pakistan
*
Author to whom correspondence should be addressed.
J. Open Innov. Technol. Mark. Complex. 2020, 6(4), 190; https://0-doi-org.brum.beds.ac.uk/10.3390/joitmc6040190
Submission received: 14 August 2020 / Revised: 7 December 2020 / Accepted: 8 December 2020 / Published: 13 December 2020
(This article belongs to the Special Issue Big Data Research for Open Innovation)

Abstract

:
Increasing haze pollution and its adverse effects on human health is pressuring academics and practitioners to search for different solutions for environmental sustainability around the world. Similar to other countries, Pakistan is also affected by air pollution, and smog has become a fifth season. In Pakistan, one of the main reasons of smog and air pollution is hazardous emissions from vehicles. As a result, the booming automobile industry of Pakistan is now affected by two major challenges: sustainable product development and organizational performance. To meet these challenges, the study has developed a conceptual model to find the effect of big data analytics on organizational performance by adopting a sustainable development program. For the elimination of standard method biases, the study has used a time lag approach to collect the data in three waves and receive 372 usable responses. The empirical results of PLS-SEM suggest that big data analytics have a positive effect on a sustainable product development and sustainable product development has a positive and significant impact on organizational performance. Moreover, mediation of a sustainable program development is also confirmed between big data analytics and organizational performance. The managerial and theoretical implications of these results are discussed.

1. Introduction

In recent years, air pollution in the form of haze and smog has increased worldwide, which has been a crucial threat to human health [1]. The public and government bodies are paying more attention to environmental and health problems due to haze pollution [2]. Hazy weather is basically an atmospheric condition in which various tiny dust particles are distributed in the air. Haze pollution is caused by many factors such as coal burning, crop burning, industrial emission and more importantly, vehicle emission from the consumption of fuel [3]. Due to the increase in the population of the world, demand for vehicles has been increased [4], which affects environmental conditions. According to the statistics of the world, the automobile sector is considered as the leading manufacturing sector in the economy of the world [5]. The auto sector covers a wide range of transportation options, including motorcycles, buses, trucks and cars. The automobile sector plays a vital role in the life of human beings by providing transport services. It influences the environmental, social and economic activities of both developing and developed countries [6]. The automobile market is rapidly growing not only in European and American countries, but it is also increasing in the rest of the world in current years [7]. In Asia, Pakistan is a developing country with various leading manufacturers of automobiles. Pakistan’s automobile sector is considered as one of the fastest growing sectors of this country. It contributes 4% to the GDP of Pakistan. The employee workforce consists of more than 3.5 million people in this sector. Moreover, the investment of automotive industry consists of PKR 92 billion and it shares an indirect tax of PKR 63 billion in the national exchequer [8]. Now, Pakistan’s automobile sector is facing two major challenges. Firstly, automobile organizations have to sustain their performance and secondly, they have to reduce the adverse effect of environment on society [7].
Pakistan’s automobile industry could not sustain their performance, and there is a 40–60% steep downslide occurring in the fiscal year of 2019/2020. Due to this severe situation, 150,000 employees are facing unemployment in this sector [9]. The automobile sector is facing the worst crisis due to the implementation of more taxes from the government and steep devaluation in the currency, which increases the product prices. However, the government has realized the poor condition of this sector and has decided to take lower taxes of PKR 150–200 billion [10]. Still, now it will take time for the settlement of this sector.
Moreover, environmental issues are considered as one of the critical weaknesses of this industry. In the main cities of Pakistan, specifically, automobiles that are based on diesel contributes more to polluting the air [8]. The quality of air is so terrible in Pakistan that it has crossed the limits of a safe environment in different factors. Pakistan is ranked as the seventh most susceptible country due to the impact of change in climate [11]. Burning fossil fuels and oil may worst the environment further. It increases carbon emissions, enhances the toxic elements like Nitrogen Dioxide (NO2), Sulphur Dioxide (SO2) and Particulate Matter (PM), PM2.5, PM10 in the environment. The threshold value of clean air has crossed within the core cities of Pakistan which is one of the reasons that smog has become a fifth season in Pakistan [12]. Moreover, every year more than 3000 people die because of inadequate air quality in Pakistan [13]. The report of the National Economic and Environment Development Study (NEEDS) stated that the expected emission rate would be double in 2020, and in 2030, it will be further doubled in Pakistan [14]. There is no strategy to minimize the pollutants’ emissions from the automobile sector regardless of one of the extremely polluted air in the world [15]. So, there is a need of an environmental regulator that is more vigilant and has excellent skills in Pakistan to minimize the effect of environmental degradation. In this study, we argue that the implementation of Big Data Analytics (BDA) through Sustainable Product Development (SPD) in the automobile sector of Pakistan can solve present and impending problems e.g., adverse environmental effects and performance-related issues.
The big data concept has gained vast admiration among practitioners and research scholars due to its ability to transform the entire process of doing the business. It is considered a hot topic in the current business environment [16]. At present, the “Age of data” is flourishing due to the increase in new data that is created by public institutions and industries at an exceptional rate [17]. Big data analytics investment has been persistently growing worldwide due to the organizations’ search to gain maximum value and sustainable competitive advantage [17,18]. In the prior few years, big data has developed as an exciting milestone to gain opportunity and better performance. Current studies stated that big data analytics could transform the practices of doing business and theory of management [19,20,21]. It is considered as “Break through technological development” [22] “the digital revolution” [23] and “the fourth paradigm of science” [24]. Gartner [25] stated that organizations had invested USD 2.1 trillion in 2013 to leverage big data analytics, and these investments are expected to grow around USD 3.8 trillion in 2014. Accenture and General Electric conducted a study, and the results of this study revealed that 89% of organizations believe that if they do not implement the big data, then they cannot compete in the market. Due to which, they will lose momentum and market share [26]. Organizations are considering big data analytics as mainstream due to the flattening out of the steep performance growth curve using analytics [27]. It is not sufficient for an organization to gain insights and data from simple analytical applications. Managers and analysts require collaboration to develop data and analytic techniques to attain better insights from it [16]. Although applications of big data analytics have been utilized and implemented in various fields of business or organizations. Amazon and Google are considered pioneers in the adoption of big data and they perform well base on their ability as compare to their competitors to exploit data. On the other hand, Hewlett-Packard and IBM are considered as early adopters and technology leaders [19]. BSA Software Alliance, based on the US, reported that 56% of the organizations that have adopted and implemented the big data analytics in their processes show the more than 10% increase in their growth [28].
Organizations are competing in a rapidly fluctuating business environment with the help of vital information that can be extracted from big data [29]. However, the term big data is not considered as new for organizations, but few researchers have examined how organizations can collect valuable information from big data for sustainable product development [30]. In the automobile industry, sustainable product development is a combination of three core components such as (1) environment, (2) social and (3) economy [7,31,32,33]. The development of environmental perspectives needs to consider the hazarded quality of human life, development of social aspects refers to fulfil the human needs partly to meet the requirements of concerned parties of innovative product development and development of economic perspectives deals with the requisites for the economic growth of organizations [33]. Advancement in the process of sustainable product development influences the products’ perceived value and quality, and enhances the reputation and image of the organization. However, the automotive industry has rarely adopted the standards to develop a sustainable product, especially in Pakistan [33].
Moreover, big data analytics is considered an insufficient resource to increase organizational performance and attain competitive advantage [34,35]. However, the competitive advantage in the form of sustainable product development through open innovation can be attained by using big data analytics. For instance, Vecchio et al. [36] found that big data analytics to be a significant tool for sustainable open innovation. The impact of big data analytics on organizational performance has remained inconclusive [16,18,37]. The topic of big data analytics has gained immense popularity among scholars and practitioners because of their significant role in firm performance. It has been considered as the next big thing for organizations to gain competitive advantage [16]. Nonetheless, very little empirical evidence has so far been put forward about the contribution of big data analytical capabilities towards firm performance in an emerging economy such as Pakistan.
Furthermore, multiple evidence indicates that various industries have adopted and implemented big data analytics, but there is limited research in the automotive sector [33]. Additionally, the study has adopted the hierarchal conceptual model (HCM) for the operationalization of the constructs. Previously, the studies in the big data analytics context has adopted a lower order model to explain its phenomena, while the HCM model helps to better explain the phenomena and present best abstraction of the model in the parsimonious way [38]. This is why new researchers in business and management studies are adopting the HCM model for the development of the conceptual model [39] which is obsolete in big data analytics adoption. To address this problem, the prime objective of this research is to explore the role of big data analytical and sustainable product development in organizational performance in the higher order. Moreover, the mediating role of sustainable product development between big data analytics and organizational performance has not been checked in the previous literature which is also one of the objectives of the study. For this reason, the quantitative research approach was adopted. From a practical point of view, this study provides guidance to data scientists to implement the big data analytical process to overcome environmental problems and improve organizational performance.

1.1. Literature Review

1.1.1. Resource-Based View (RBV)

Barney [40] built the Resource-Based View (RBV) theory which explains why some organizations are performing better and how an organization can perform better. Many researchers have discussed the RBV in their studies from the perspective of competitive advantage and organizational performance [41]. Resources are “stocks of available factors that are owned or controlled by the firm” [42]. Rooted in the literature of strategic management, RBV indicates the organization as a grid of capabilities and resources that cannot be easily sold or purchased from the market [16]. Some organizations are considered more competent than others in accumulating and utilizing the resources to achieve sustainable competitive advantage [43]. RBV depends upon two key assumptions about the resources of the organization to describe why some organizations have a superior performance than others and how organizations can improve their performance. First, firms have heterogeneous resources even when they are operating in a similar industry [44]. Organizations can accomplish particular functions due to the unique or different resources. Second, distinct resources make it difficult to interchange the resources across organizations. The immobility of resources provides benefits to organizations to sustain them over time [45].
RBV proposes that resources are considered essential to build and implement strategies in an organization that should be VIRN: (1) Valuable (resources that produce value for customers that cannot be easily achieved by competitors). These resources facilitate the organization to increase the net revenues or gain opportunities and minimize the net costs or threats [45]. (2) Imperfectly imitable (resources that cannot be copied easily by rivals). These resources are more costly; which is why competitors cannot imitate them. (3) Rare (resources that are scarce, or not plentiful). These resources are owned by a few organizations to gain a competitive advantage. (4) Non-Substitutable (take benefits from resources in such a way that competitors cannot do). The organization takes benefits from its complement resources to create difficulty for rivals to copy them. The existence of one resource facilitates another to influence the performance of the organization [41,46,47,48,49]. VIRN resources facilitate organizations in achieving competitive advantage and enhancing the performance of organizations [16,46,47,50,51].
Prior studies stated that organizational resources are tangible, such as technologies of the organization (technological capability), and intangible, such as employee skills (talent capability) [40,41,46]. RBV proposes that firms employ both tangible and intangible resources that help the organization to take value from them and can obtain superior organizational performance [16,47,52,53]. Furthermore, three core types of resources are organizational capital resources (management capability), physical capital resources (technological capability), and human capital resources (talent capability) [41]. In literature, both the terms “resources” and “capabilities” are often employed interchangeably [54]. In the context of big data, organizational capital resources (management capability) express that organizational processes and structure must be changed based on insights from big data analytics. Physical capital resources (technological capability) are comprised of software that helps the organization to accumulate and analyze the big data. Human capital resources (talent capability) refers to the ability and expertise of data scientists to analyze and manage the information and facts about the activities of consumers [46,55].

1.1.2. Big Data

Michael Cox and David Ellsworth were considered among the pioneers who defined the concept of big data. Big data is the vast amounts of scientific data for visualization [56]. Goes [57] described the term big data as massive amounts of data from different observations that provide support to the organization to take various decisions. According to researchers [58,59], big data is the large volume of organized and unorganized data that is approachable in real-time. [60] stated that the concept of big data is increasing rapidly with the help of social contacts, internet facility, mobile, telephone and new innovative technology that provide support to collect the data. Furthermore, Beyer and Laney [61] stated that researchers used the concept of big data to describe the multifaceted, massive and immediate data. Analytical, management and processing skills are required to obtain insights from big data.

1.1.3. Big Data Analytics (BDA)

Big data analytics are referred to organizations that need to apply the analytical process to reveal the hidden arrangements among data and to acquire more value from big data [62]. APICS [63] defined the term big data analytics as “a collection of data and technology that accesses, integrates and reports all available data by filtering, correlating and reporting insights not attainable with past data technologies”. According to some researchers, big data analytics is the “next big thing” in management, ‘next management revolution’ or ‘blue ocean in nurturing business opportunities’ [64]. Moreover, Gupta and George [65] stated that BDA capability is the organization’s capability to accumulate, integrate and implement the organizational resources that are based on big data. Big data analytics provides insight into the organizations about their current and predicted situations and what are the requirements to gain more appropriate results [66].
Furthermore, big data analytics capability is considered as one of the core organizational capabilities that leads towards a competitive advantage in the climate of big data [27,67]. Different researchers such as [18,27] broadly defined the big data analytics capability as the capability that delivers insights to organizations and competitive advantage by using the management, technological and talent capabilities. Researchers proposed three building blocks for big data analytics capability such as (1) BDA management capability, (2) BDA technology (infrastructure) capability (3), BDA Talent (personal) Capability [18,27,68].

1.1.4. BDA Management Capability

Management capability is the firm ability for a firm to manage its resources that deliver high business value [68]. BDA management capability refers to the capability of data scientists to arrange the routine matters in an organized way to manage the BDA resources according to the needs and preferences of organizations [18]. According to recent researches such as [18,27,68,69] the four core components of BDA management capability are (1) BDA planning, (2) BDA Investment, (3) BDA coordination and 4) BDA control. These are not only the crucial components of BDA management capability but are also considered as the critical routine activities of organizations [70,71,72]. (1) BDA planning is the organizations’ practice to arrange and deploy big data analytics in an organized way to support the functions, objectives and strategies of the organization formally and informally. Organizations regularly plan to adapt the innovative opportunities to change the strategic position of the organization and to use big data analytics in an appropriate manner [68,72].
(2) BDA investment decisions refer to the organizations’ decisions to acquire the BDA resources by using structural manners like organization funding to maintain the balance of cost and strategic position of the organization [73]. The organization considers the effects of BDA investment decisions on the performance of employees, efficient decision making of employees, cost-benefit analysis of training investment, and quickly respond to change by managers [68,71]. Ramaswamy [74] stated that organizations with more investment in BDA are getting more returns and competitive advantage. (3) BDA coordination refers to the coordination and synchronization between the data scientists and different departments of an organization through structured ways like as reports, employees, and interpersonal relations formally and informally [70,72]. Data scientists and line people from different departments interact with each other frequently to consult the crucial issues, coordinate with each other and share the information to make effective decisions [68,72,75]. This coordination with other departments increases the performance of the organization. (4) BDA control is the process at which BDA control activities and functions, either they have organized adequately according to the formal or informal ways [68]. In this regard, organizations consider that responsibilities are clearly defined, and proposals of projects are assessed for the development of big data analytics. Organizations ensure that performance criteria are appropriately defined to monitor the performance of functions of BDA [68,72,76].

1.1.5. BDA Technology Capability

Technological capability takes into account all of the technological components, applications, software and physical components that are used to improve operations, processes and create various skills within the organization [77]. BDA technology capability can be described as the technological capability of organizations (hardware, software, applications, data and networks) that allows data scientists to swiftly upgrade, organize and support the compulsory system components of the organization [18]. To advance the technical capability of organizations, organization technical infrastructure should be strengthened and flexible because sometimes organizations have to face indefinite situations (economic pressure, hyper-competition and the emergence of social marketing) and organizations need to alter their short- and long-term strategies (merger, acquisition and strategic alliances) [78,79]. Many researchers, such as [18,27,68], have stated that some key components support the perception of BDA technological capability: (1) Connectivity, (2) Compatibility, (3) Modularity.
(1) Connectivity refers to the ability of an organization to connect its internal and external components. The flexibility of an organization’s technological capability is based upon the level of connectivity among various systems (customer relationship management, supply chain management, enterprise resource planning and database). Organizations used a flexible system network to connect the offices that are located in different locations. In this regard, organizations ensure that all communication networks are jam-free and share analytical information with other departments and develop applications to tackle varying requirements to improve the BDA connectivity [68,77]. (2) Compatibility that supports and shares the flow of data and accurate information (databases managed by uniform metadata) to take correct decisions. Software applications and information can easily be shared and used throughout the organization despite location to improve the BDA compatibility [68,77]. (3) Modularity refers to add, alter and eliminate the software modules efficiently and cost-effectively according to the requirements and helps the organization to improve its performance [18,80]. Researchers have argued that modularity helps the organization to reuse the software modules, object-oriented tools to develop the applications and new analytics models in the minimum period [68,77].

1.1.6. BDA Talent Capability

Talent capability means specialized skill and knowledge of an organization’s employees. BDA talent capability refers to the data scientists’ capability (skills and knowledge) in treating the analytical technologies to perform tasks related to BDA [18,68]. Researchers suggested four key elements that will allow the organization to develop BDA talent capability such as (1) Technical skills, (2) Technology management skills, (3) Business skills, (4) Relational skills [18,27,68]. Previous studies emphasized that data scientists should know the distinct skills; (1) Technical skills mean that data scientists should be able to treat different data analysis and analytical technologies. Data scientists should be capable in multiple areas like as programming, the managing life cycle of a project, data and network management, maintenance of network management, building of decision support system [68,77,81].
(2) Technology management skills mean that data scientists should be capable of managing BDA essential resources to perform business operations smoothly. A data scientist should have superior knowledge and capability to learn technological developments. Moreover, they should know the big data and critical issues to attain success for the organization [68,82]. (3) Business skills mean that data scientists should have knowledge about the different functions and environments of business. Data scientists should have experience with the policies of the organization. Furthermore, they should be able to understand the problems of organization and their technical solutions [68,83]. (4) Relational skills mean that data scientists should have interpersonal communication skills to communicate well with people of other business departments [69,84,85]. Data scientists should be able to plan, organize and lead the organization’s projects and execute them through the mutual contribution of other personnel from various departments. They should maintain their relationships with customers [69,81,86].

1.1.7. Sustainable Product Development

Big data is considered a crucial part of organizations to develop a sustainable product. Organizations are competing in a rapidly fluctuating business environment with the help of valuable information that can be extracted from big data [29]. However, it is not a new concept, but only a few researchers have studied the effect of big data analytics on sustainable product development programs [30]. Big data is changing the process to develop a sustainable product [87]. Therefore, organizations are considering to collect knowledge from big data to build a sustainable product, to reduce the cost, to reduce the time to market and to improve the consumers’ product adoption [30]. In the automobile industry, sustainable product development is a combination of three core components such as (1) environment, (2) social and (3) economy [7,32,33]. Organizations should employ these sustainability components to develop innovative products [88]. The organizations are now adopting open innovation strategies to include internal and external stake holders for developing sustainable products [36,89]. The development of environmental perspectives needs to consider the hazarded quality of human life, development of social aspects refers to fulfil the human needs partly to meet the requirements of concerned parties of innovative product development and development of economic perspectives deals with the requisites for the economic growth of the organization [33].

1.1.8. Environment

Organizations adopt the environmental standards to develop a sustainable product by controlling the maximum level of solid waste and utilization of toxic material in the process of producing the products. Organizations follow the environmental rules and regulations to improve the environmental condition of an organization that is related to the social life of human beings [90]. Therefore, organizations are implementing the standards of ISO14001 (i.e., environmental management system) to advance the environmental standards to produce sustainable development products and to improve the environmental situation of the organization [33].
The effects of different environmental issues such as carbon emissions and global warming are increasing due to an increase in the market share, manufacturing processes, supply chain and logistics activities of the automobile sector [7,31,32]. Environmental programs such as “reduce, reuse, and recycle” have been followed by organizations to achieve the sustainability objectives related to the environment (e.g., reducing the influence of carbon emissions) [32]. Therefore, consumers are taking more interest in the environmental and ethical issues that influence their buying decisions [91,92]. Furthermore, the researcher examines the influence of big data analytics on minimizing the negative impact of carbon emissions in their current studies [93,94,95].

1.1.9. Social

Social sustainability is considered the second essential element of sustainable product development for an organization to operate in society [32]. Organizations are facing pressure from social organizations and stakeholders to encompass all three components of sustainable product development. However, organizations are taking measures to adopt the economic and environmental components in their processes, but social elements should need to achieve momentum [96]. Most organizations pay less attention to social issues and rarely consider it as a long-term goal [33]. Many countries are paying attention to improve the standard of living, but some countries are facing challenges to meet their basic needs. There are different social challenges that organizations have to face, such as equity, famine, child labor, gender equality and sustainability in working conditions, etc. [32].
Organizational leadership should pay more attention to social issues because these are also considered as crucial components for organizational success. When employees are satisfied due to the social programs of organizations, then they support the organization to gain superior performance in the future [33]. Thomas et al. [97] stated that the sustainable enforcement of organization influences the performance of the organization. Therefore, the organization actively participates in social activities to compete with competitors and these participations are also recommended to enhance the social life of the employees in the organization [33].
Developmental objectives should notice the interest of upcoming cohorts and other societies to share the planet. There are several indicators in the stock market and balance sheet to measure the economic performance of the organization. The organization measures its environmental performance through ISO14001 (i.e., Environmental Management System) and GRI (i.e., Global Reporting Initiatives) [32]. Moreover, social sustainability has received little consideration due to challenges in acquiring the tangible outcome and involvement of complicated human issues [98]. Big data, in the unstructured and social media form (i.e., Facebook, Twitter), creates substantial awareness about social issues that many stakeholders have to face such as wages, equity, safety, working and living conditions [99]. Consequentially, organizations recognize the importance of their social and environmental obligations and their impact on organizational performance [100].
The social sustainability of manufacturing organizations is getting better because organizations are taking part to improve the living standards of society, to improve the working condition, to remove the waste and to use the resources efficiently [96]. Several organizations have started publishing their record about social issues and their corporate social responsibility report in the annual report. Stakeholders and consumers expect organizations should be profitable, environmentally friendly and ethical [101]. Researchers stated that big data analytics has enough capability to develop the social sustainability of an organization [102].
Organizations should provide priority to social values and involve the society in the business strategies to make green initiatives successful. Sustainable product development cannot be attained without the involvement of the community [7].

1.1.10. Economy

The economic sustainability of the organization is considered one of the crucial components of sustainable product development. Basically, the economic concept stated that activities should be coordinated, such as assembly design, process design and after-sales services to develop a sustainable product [103]. The organization should use the material to produce a sustainable product according to the requirement of stakeholders and interested parties (e.g., an asbestos-free product). Economy refers to reducing the cost in the process of producing sustainable products without compromising its quality. The organization should involve in delivering the after-sales services to customers and provide awareness to them about economic added value. The organization should control waste management in the process of producing sustainable products and should be capable of meeting the constitutional and regulatory requirements [33].
The primary objective of the organization is to gain profit in order to survive in the market for a more extended period. The organization is operating in a highly competitive environment where every organization wants to acquire market share [104]. In recent years, the average life span of the organization is decreasing enormously due to globalization, better information and improved communication technologies [105]. The economic performance of the organization can be measured through several indicators such as profitability, cost reduction, competitiveness and brand equity [104]. The business organizations should be profitable to provide profit to stakeholders and to meet the requirements of them. They should maintain their competitive position in the market by improving the product continuously and reducing its cost. According to prior studies, big data analytics has a positive impact on the economic performance of the organization [18,65].

1.1.11. Organizational Performance

The principal objective of every organization is to increase its performance. The ultimate goal of corporate strategic management is considered as an enhancement of organizational performance. Thus, organizations have dispersed their efforts into this direction [106,107]. Several researchers presented various definitions, views, and indicators of measurement to measure the performance of an organization that indicates the low level of consensus among them to define that what is meant by organizational performance and how it will be estimated. Therefore, it is quite problematic for an organization to define, conceptualize and measure the performance [108].
Researchers have paid more attention to identify the best performance measure. Organizations measured the performance through financial measurement between 1850 to 1975. Many researchers have criticized the use of financial measures as performance indicators because it provides short-term opinions, and a low level of strategic concentration and information about responsiveness, flexibility and quality. It also does not provide information regarding the consumers’ wants and the performance of competitors [109]. In 1980, traditional indicators to measure the performance were not considered as adequate for organizations to survive in modern markets due to the increase in the demands of customers and the emergence of competitive markets. Therefore, the organization should be more responsive and pay more attention to external issues [110]. Both financial and non-financial indicators to measure the performance have benefits and limitations. Financial measures are considered more concrete, but their scope is limited for financial data. In contrast, non-financial measures are considered less tangible but provide more information on the organization’s effectiveness about competitors [111].
Moreover, it is challenging to determine the appropriate measures for organizational performance to obtain relevant sensitive information. Many respondents (i.e., organizations) are reluctant to reveal their confidential information related to measurement indicators such as profitability and return on investment (ROI) [82]. Researchers employ the indirect technique to collect the data to avoid the omission of information related to the sensitive performance of the organization. Respondents were requested to provide data about how effectively their organization performed within the last 3 years compared to their competitors in terms of profitability, sales growth, return on investment and retention of customers instead of using the direct approach to ask from them to reveal the objective information about the performance of organizations [82]. In previous studies, some indirect techniques have been employed when organizations do not provide the permission to compare with other organization, and they do not publish their financial reports publicly [18,82,112,113,114,115].

1.2. Hypothesis Development

1.2.1. Big Data Analytics and Sustainable Product Development

Big data is playing an essential role in organizations in developing sustainable products. Organizations are competing in an inconsistent business environment by taking benefits of valuable information from big data [29]. Although the concept of big data is not novel for organizations, very few researchers have investigated in their studies how organizations can extract valuable knowledge from big data to facilitate the sustainable product development [30]. Big data is shifting the sustainable product development process [87]. Therefore, organizations are collecting information from big data to assist the process of sustainable product development, to reduce the cost, to improve the consumers’ product adoption and to reduce the time to market [30]. In the automobile industry, sustainable product development consists of three crucial elements such as (1) environment, (2) social and (3) economy [7,32,33].
Researchers stated that big data analytics play a progressive role in various domains, but the trend of research for organizations is increasing between big data and sustainable product development in auto industry relationships [116]. However, several studied Melnyk, conceptual and subjective evidence. There is limited empirical research on the relationship between big data analytics and sustainable product development. So, the main focus of empirical studies is to examine the impact of big data analytics on the three elements of sustainable product development [32]. Few studies have investigated the relationship between big data analytics and sustainable product development or its elements such as environmental, social and economic development [18,32,47,65,96,117,118]. Organizations should take the potential benefits of big data, and specifically take potential assistance in developing eco-sustainable products [119]. Researchers agreed that there is more need to research this phenomenon regardless of these findings. There is a positive association between big data analytics and environmentally sustainable product development [30].
Researchers have examined the relationship between big data analytics and the component of sustainable product development (i.e., environmental, social and economic performance) [32]. According to Seles et al. [120], big data analytics has an impact on environmentally sustainable product development. Big data assimilation has a positive impact on sustainable performance or product development [121]. Hence, big data play a crucial role in the progression of sustainable product development in several sectors [122]. There is limited research on the relationship between big data analytics and sustainable product development in the auto industry, so based on the above arguments it can be said that:
Hypothesis 1 (H1).
Big data analytics has a significant and positive impact on sustainable product development.

1.2.2. Sustainable Product Development and Organizational Performance

The key reason to develop a sustainable product is to gain customer satisfaction, fulfil the demand of stakeholders and attain sustainability in the organizational business and industry [33] Organization performance refers to the process that is used to measure the attainment of organizational success [123]. The ultimate goal of corporate strategic management is considered as an enhancement of the organizational performance; thus, organizations have dispersed their efforts into this direction [106,107]. Advancement in the process of sustainable product development influences the products’ perceived value and quality, and enhances the reputation and image of the organization. The organization can increase sales by offering the product at an optimal price, gain a high market share through increasing the sustainable product development, which has a positive influence on organizational performance [124]. However, the automotive industry has rarely adopted the standards to develop a sustainable product [33].
There is a positive association between sustainable product development and organizational performance [124]. The strategy of product development helps to determine the sustainability and success of any organization in highly competitive situations. It is tough for organizations to distinguish their products based on cost and quality. Therefore, sustainable product development facilitates organizations in competing in a competitive market. Findings suggest that there is a positive and significant relationship between sustainable product development and performance of the organization [125]. Innovativeness of the organization is positively associated with the performance of the organization, which approves the results of research related to new products [126].
The results of the study stated that the components of sustainable product development, that is comprised of environment, social and economy, have significant and positive influences on the performance of the organization in the automotive industry [33]. It was also found that the development of the product based on the eco-innovation strategy has a positive impact on organizational performance [127]. Environmental innovation is considered as a dominant factor for an organization that facilitates the organization to develop sustainable products [128]. While [129] suggested that there is a positive association between sustainable product development and organizational performance So it can be hypothesized that:
Hypothesis 2 (H2).
Sustainable product development has a significant and positive impact on organizational performance.

1.2.3. Mediating Role of Sustainable Product Development

Big data analytics is considered as the process, practice and decision-making activity to develop the new product. Organizations are competing in an inconsistent business environment by taking the benefits of valuable information from big data [29]. Moreover, big data analytics is considered an insufficient resource to increase organizational performance and attain competitive advantage [34,35]. Accenture and General Electric conducted a study, where the results revealed that 89% of organizations believe that if they do not implement big data, then they cannot compete in the market [26]. There is an ambiguous relationship between big data analytics and organizational performance despite the full acceptance of big data [18,37]. Organizations have paid great attention to big data analytics to make a crucial business decision. Despite its popularity, it is not clear how big data analytics impacts the performance of the organization [16].
Big data analytics could lead to various benefits and add more value if the organization implemented it accurately through alternative strategic management practices. The key reason for not attaining the desired organizational performance with the help of big data analytics is due to the low level of involvement with other strategies. These practices and policies play a vital role to assist and complement big data analytics to enhance the performance of the organization. Moreover, despite this ample research, leading researchers stated that impact of big data analytics on the performance of the organization is mediated by numerous intervening variables [127,130,131]. The mediation effect of sustainable product development was also examined between total quality management and organizational performance [103].
Furthermore, there is more research needed to increase the understanding level of the significance of big data analytics capabilities for the success of organizations [127,132]. Big data analytics need to be examined in terms of organizational and strategic perspectives despite considering big data as a hot topic [133]. Researchers have investigated the relationship between big data analytics and the component of sustainable product development (i.e., environmental, social and economic performance) [32]. The results of the study stated that the components of sustainable product development that comprise of environment, social and economy have significant and positive influences on the performance of the organization in the automotive industry [33]. The three building blocks of big data analytics (i.e., BDA management capability, BDA technology (infrastructure) capability, BDA Talent (personal) Capability) alone, will not be considered enough to facilitate the organization to achieve the desired performance unless there are sustainable product development practices in the organization. In general, organizations cannot make the desired results by using big data analytics only unless they develop and provide sustainable products to customers to satisfy their demands. There is a lack of research on the relationship between big data analytics and organizational performance with the mediating effect of sustainable products. This study investigates the mediating effect of sustainable product development on the relationship between big data analytics and organizational performance. The researchers hypothesize that:
Hypothesis 3 (H3).
Sustainable product development mediates the relationship between big data analytics and organizational performance.
Based on the above discussion, a theoretical framework was developed by taking big data analytics as third order construct, sustainable product development program as a second order construct and organizational performance as a first order construct (see Figure 1).

2. Materials and Methods

The automotive industry of Pakistan is comprised of the following four sub-sectors, (a) Cars and Light Commercial Vehicles, (b) Motorcycles and Rickshaws, (c) Tractors and (d) Trucks, Buses and Trailers. In Pakistan, there are four provinces, namely, Punjab, Baluchistan, Sindh and Khyber Pakhtunkhwa. Punjab contributes almost 60% in the overall industrial production of Pakistan. According to Punjab Bureau of Statistics, Punjab is the largest province both in terms of population and size of the economy. The research population consisted of all automotive parts and accessories manufacturer located in the province of Punjab, Pakistan. There are seven industrial zones in Punjab such as Rawalpindi/Islamabad, Sialkot, Wazirabad, Gujranwala, Sheikhupura, Faisalabad and Lahore. In Pakistan, a complete list of manufacturing firms is rarely available because undocumented firms are also in business in all industrial sectors of a country. When there is difficulty in accessing a complete sampling frame, then non-probability (purposive) sampling is appropriate because it delivers a representative sample.
Moreover, the non-probability sampling technique is suitable for theoretical generalization. Selection of judgmental sampling was based on the advice from a person in charge of Pakistan Association of Automotive Parts and Accessories Manufacturers (PAAPAM), Pakistan Automotive Manufacturers Association (PAMA) and Association of Pakistan Motorcycle Assemblers (APMA). The unit of analysis in this study was the organization (i.e., managerial level or higher rank executive) who must have sufficient knowledge of the entire firm and directly involved in any critical company decisions making group. The sample size determination was based on Comery and Lee (1992), who proposed a rule of thumb, which suggests the sample size of 300 is good for statistical analysis.
We employed a three-wave research design, which allowed us to temporally segregate the measurement of our predictor (T1: big data analytics), mediator (T2: sustainable product development) and outcome variables (T3: firm performance). The time lag between each measurement point was 4 weeks. Firstly, formal approvals from respective authorities were sought via a cover letter, which described the purpose of the study and guaranteed the fact that data will be handled as confidential and will be used solely for academic purposes. The personal information about respondents was sought manly to identify the same respondents in three-time intervals. A unique ID number (e.g., the month of birth and initials of names) was assigned to every questionnaire. Adopting a similar design helps curtail potential issues arising from solely using self-reported and single-source data collection methods [134]. Secondly, Harman’s one-factor test was conducted to address the issues of common method variance, as suggested [135].
For data collection, at Time-1, we surveyed 840 self-reported questionnaires consisting of the items of the independent variable (big data analytics) among the managerial level or higher rank executive with their demographic details, and we received 690 filled questionnaires, generating a response rate of 82% at this stage. Then, after 1 month, we circulated 690 questionnaires of our mediator (sustainable product development) to check the impact from the same respondents, and we received 530 usable questionnaires, resulting in a response rate of 77% at this stage. Similarly, after the 1-month interval, we circulated 530 questionnaires of firm performance among the same respondents, and the supervisor reported 372 useable responses with the response rate of 70% at this stage and an overall response rate for all three time periods of 44%. Demographic profile of the respondents is given in Table 1.
All the distributed questionnaires were in English as, in Pakistan, English is used as the business language for communication. In recent years, many studies conducted in Pakistan have used an English-based questionnaire survey approach [136,137]. In this study, big data analytics (BDA) has three dimensions, such as BDA management capability, BDA technology capability and BDA talent capability. BDA management capability has four sub-dimensions: BDA planning (4items), BDA investment (4 items), BDA coordination (4 items) and BDA control (4 items), which were adopted from [18,68]. BDA technology capability has three sub-dimensions: BDA connectivity (4 items), BDA compatibility (4 items) and BDA modularity (4 items), which were adopted from [18,68]. BDA talent capability has four sub-dimensions: BDA technology management knowledge (4 items), BDA technical knowledge (4 items), BDA business knowledge (4 items) and BDA relational knowledge (4 items), which were measured [18,68]. Moreover, sustainable product development (SPD) has three dimensions: SPD economic (4 items), SPD social (4 items) and SPD environment (4 items), which were adopted from [33]. Meanwhile, firm performance (4 items) was adopted from the study conducted by [18,82] (see Appendix A). The respondents’ feedback was measured on a seven-point Likert scale. To ensure the content validity of the measurement items of the questionnaire used in this study, the procedure recommended by Hair [138] was adopted. A two-step practice was applied to develop and refine the survey questionnaire. Firstly, content or face validity was warranted by three academics who have obtained a doctorate in the field of Management Sciences. Subsequently, face validity discussions with seven industrial practitioners were organized to collect comments, suggestions, and improvement towards the developed instrument.

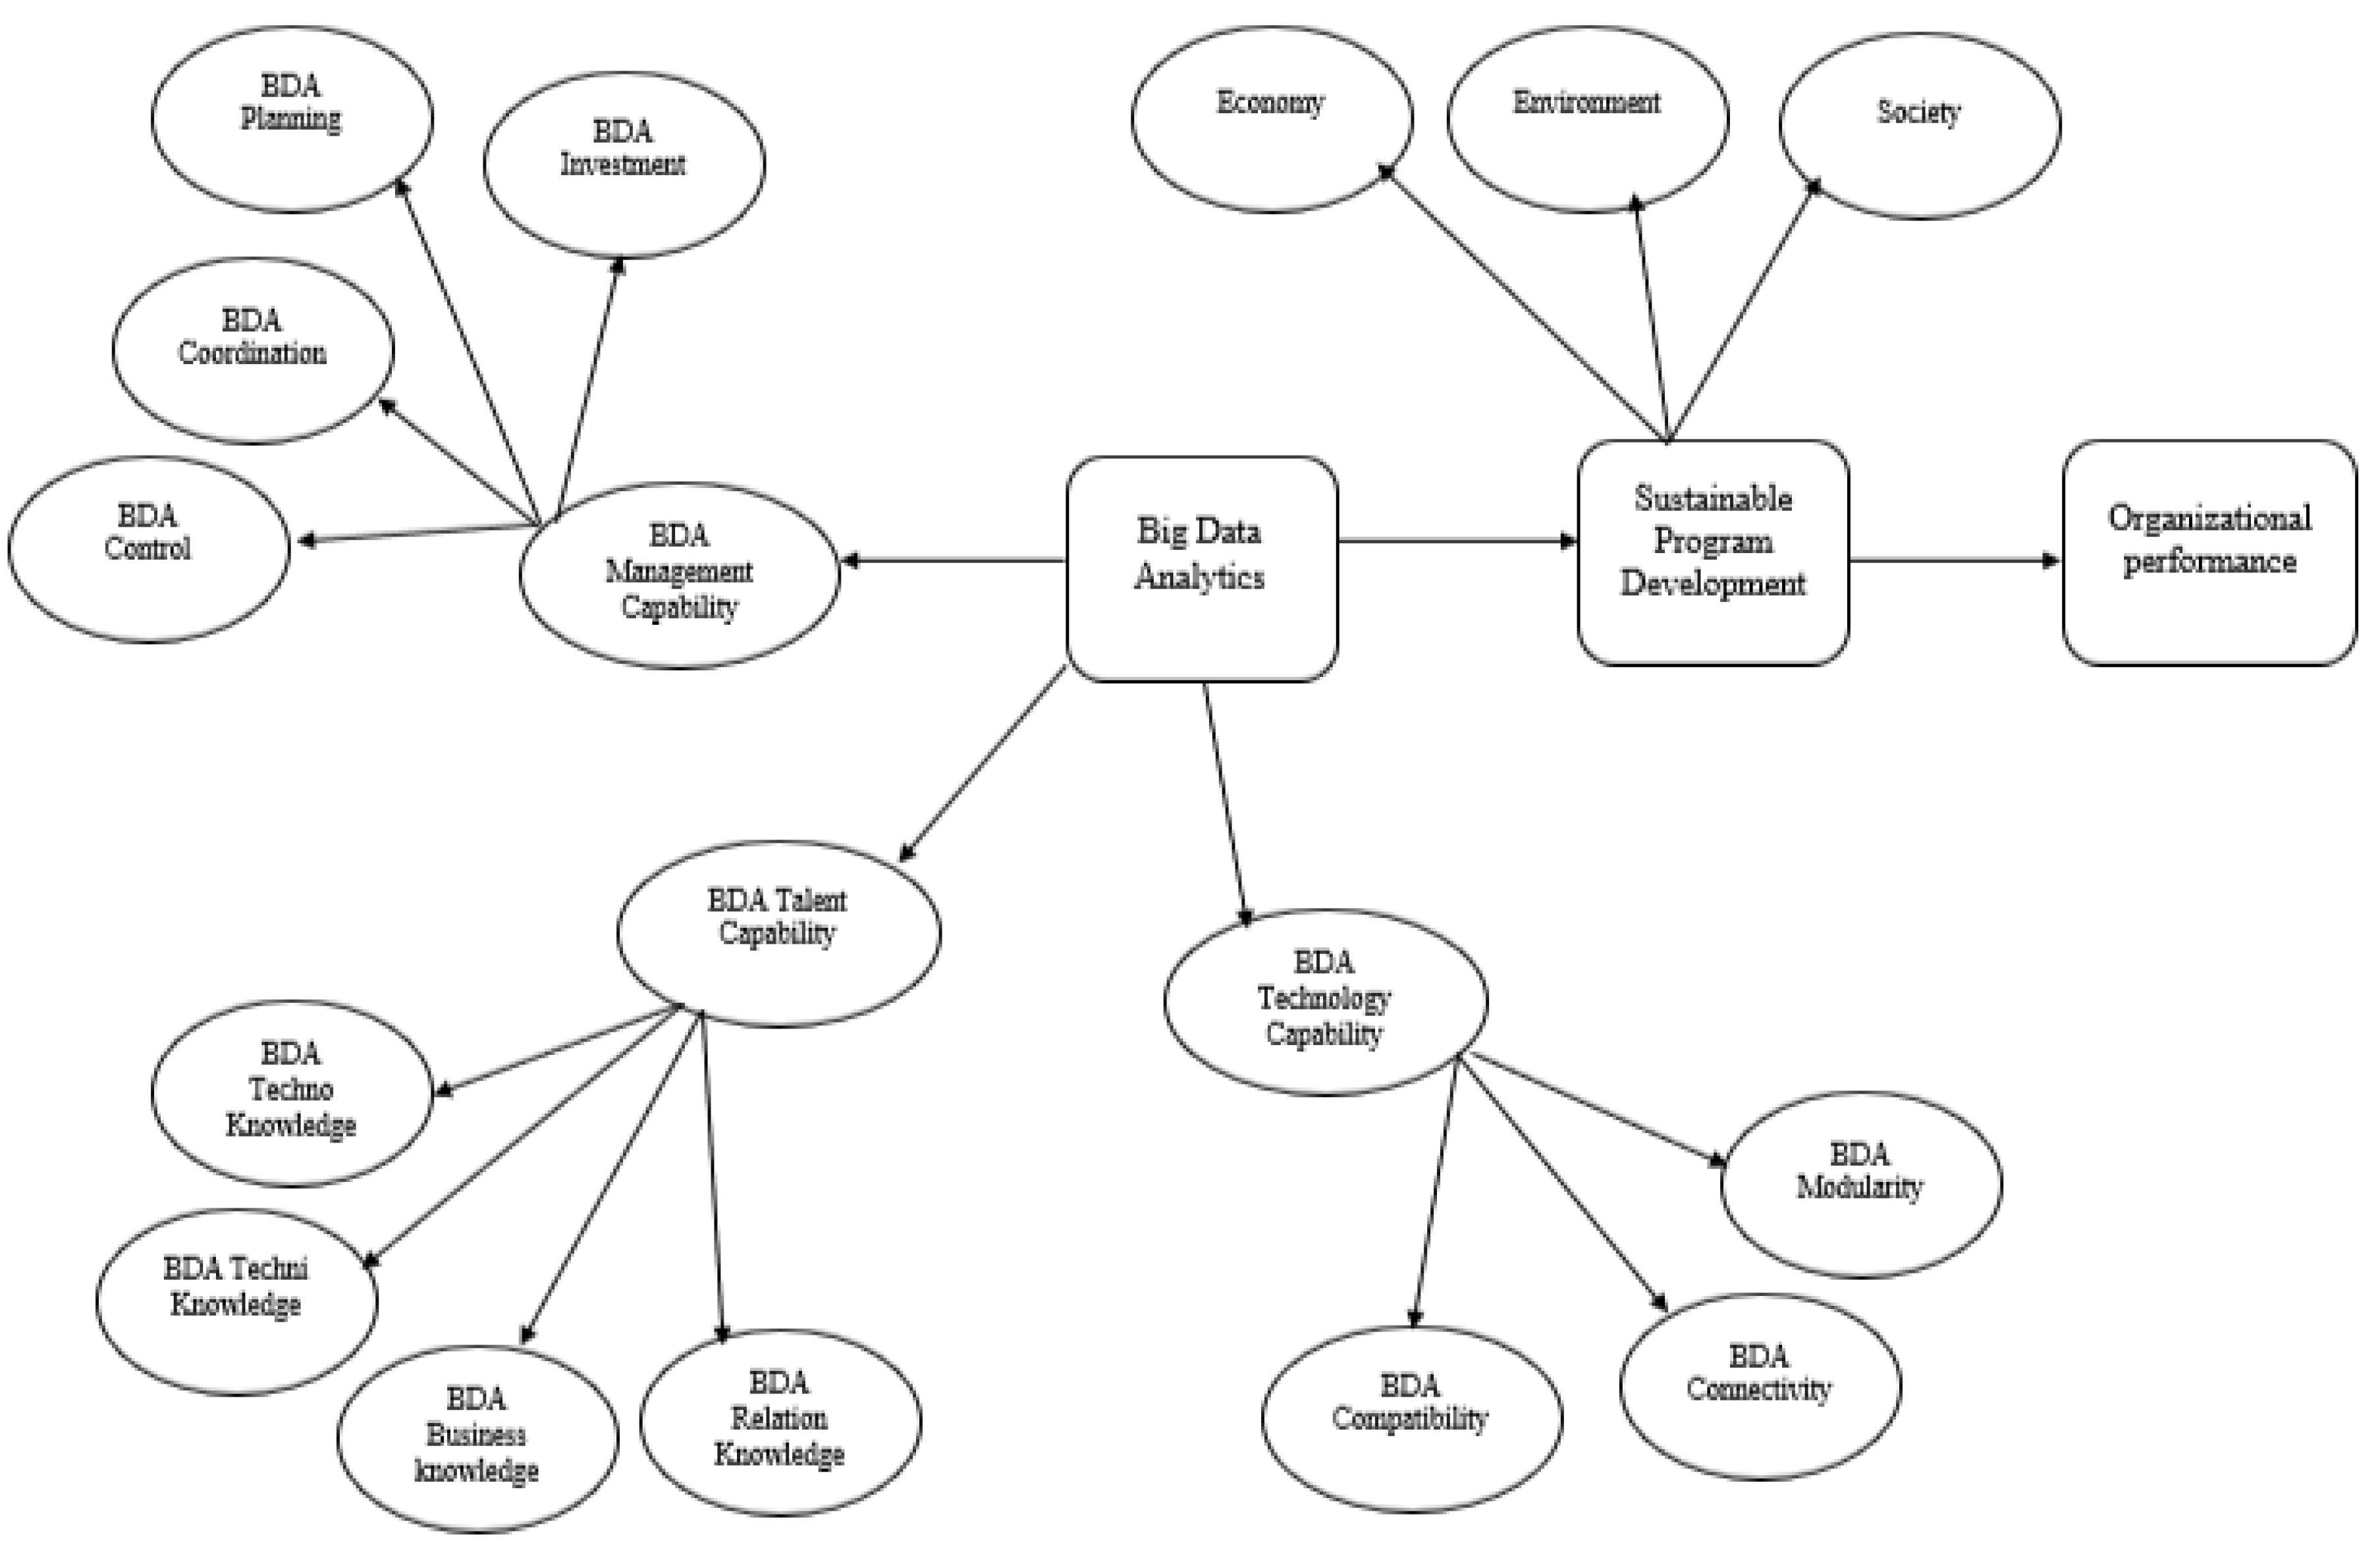
Construction of the Hierarchal Component Model

The study used partial least square structural modeling (PLS-SEM) to analyze the model instead of traditional or covariance-based SEM due to several advantages. For example, exploring theory rather than confirming, can be used for small sample and abnormal data, and can be used to analyze complex relationships simultaneously [139]. In this regard, its hierarchal component model (HCM) conceptualization helps to provide best abstraction for the representation of dimensions instead of interrelating which reduce complexity of the model and relationships [140]. The HCM is the second or third order structure used to reduce number of relationships in the model to make PLS path more parsimonious and easier to grasp [141]. Instead of specifying the number of relationships in terms of independent and dependent variables in the model, researchers can convert independent constructs to a higher order to make the lower order components’ paths obsolete to the dependent variable [39]. Its ability to deal these kinds of complex relationship has increased the usage of PLS-SEM in recent studies. However, it is found that despite the extensive application of PLS-SEM in social sciences, studies one the HCM model are quite limited [142]. Unfortunately, the researchers did not utilize the advances analysis features to better explain the phenomena of big data analytics which is a gap in the literature. In this regard, the study adopted the HCM model to measure organizational performance through second and third order constructs. The BDA data analytics was measured as a third order construct having dimensions BDA management capability, BDA technology capability and BDA talent capability. While BDA management capability, BDA technology capability and BDA talent capability were second order constructs and organizational performance was measured in lower order or first order. By using these constructs, the study developed a comprehensive conceptual model for the adoption of big data analytics in a parsimonious and simple form.

3. Results

SEM is a second-generation analysis technique that has more explanatory power than first-generation multivariant analysis, and its use is proliferating due to its accuracy, convincing nature and efficiency [143,144]. It helps deal with the simple, complex or large model without worrying about normality issues and give better results [145,146]. Moreover, researchers have suggested that variance-based structural equation modelling (PLS-SEM) gives better results than covariance-based SEM [147,148]. PLS-SEM is based on two assessment models, i.e., measurement model (outer model) and structural model (inner model). In the first step, the reliability and validity of the model were checked, followed by hypothesis testing. For this purpose, bootstrapping (5000 resample) was employed [145]. PLS 3.0 was used to empirically test theoretical model to achieve the objective of this study [149].

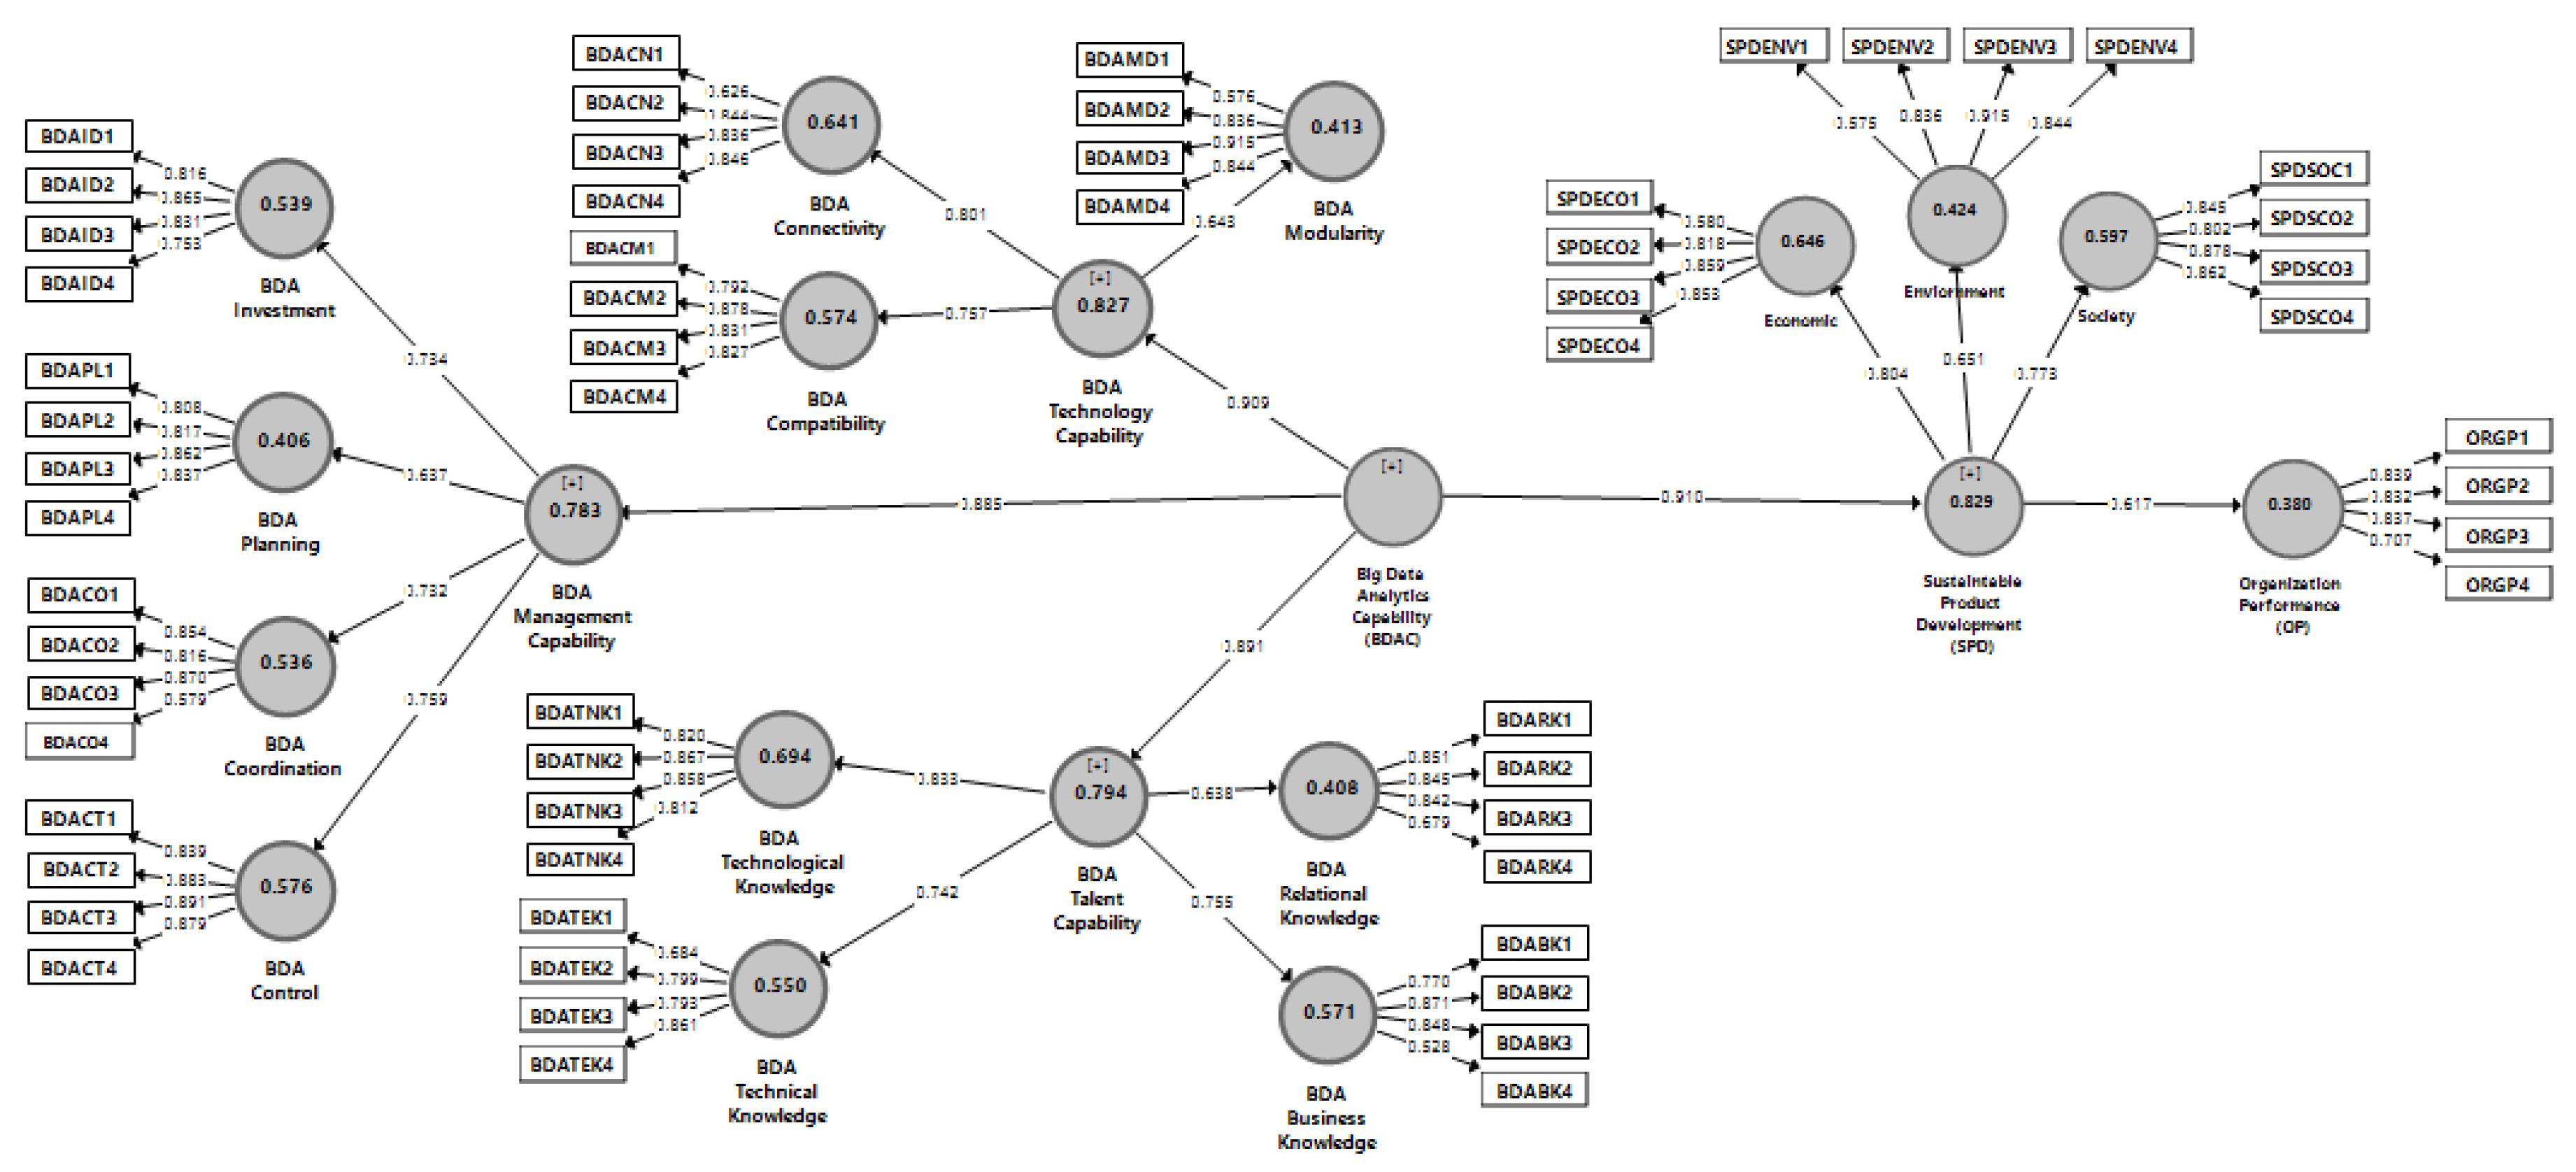
3.1. Measurement Model

Measurement model assesses the outer model, i.e., the relationship of data and latent variables, and explains the constructs’ measurement [150]. To assess, the measurement model, validity (convergent and discriminant validity test) and reliability test (inter consistency reliability and item reliability) were examined [145,151]. The average variance extracted (AVE) was examined to assess convergent validity while Heterotrait-Monotrait ratio of correlations HTMT criterion was used for assessment of discriminant validity. To measure item reliability and inter consistency reliability, outer loadings and composite reliability tests were adopted. To be unquestionable, the outer loadings should exceed the cut-off value of 0.50 [145,152,153], the composite value should surpass the threshold value of 0.70 and AVE should be greater than 0.50 [136,154]. The results have achieved these cut-off criteria as outer loadings range from 0.53 to 0.79, composite reliability range from 0.78 to 0.89 and AVE values range from 0.53 to 0.69 (see Table 2, Figure 2).
Discriminant validity helps to confirm that each construct is distinct from each other. For discriminant validity, an HTMT criterion was used. Researchers have suggested that all constructs are distinct from each other if its value is less than the threshold value of 0.85 [155] or 0.90 [156]. All values are under the acceptable range (see Table 3).

3.2. Structural Model

Assessment of the structural model was performed to complete a two-stage approach of PLS-SEM. A structural model was assessed through the following indicators, i.e., path coefficients, coefficient of determination R2, effect size f2 and predictive relevance Q2 [157]. A bootstrapping (5000 sample) procedure was adopted to find the significance of the path coefficients [158,159]. All proposed hypotheses were directional, which is why one-tailed t-test was performed having threshold value t = 1.64 (p < 0.05). The empirical results showed that all hypotheses are accepted. Big data analytics have significant influence on organizational performance (β = 0.910, t = 89.280 > 1.64, p < 0.05), sustainable product development positively influence organizational performance (β = 0.617, t = 16.235 > 1.64, p < 0.05) and sustainable product development mediates the relationship of big data analytics and organizational performance (β = 0.561, t = 14.463 > 1.64, p < 0.05) (Table 4, Figure 3). After that, R2 was assessed to measure the change in the dependent variable due to independent variables. Table 4 shows the R2 value for organizational performance is 0.38, which indicated that the model is substantial as per the suggestion of [160]. Effect size (f2) is considered having weak, medium or large effect if value range around 0.02, 0.15 and 0.35, respectively [160]. To measure predictive relevance (Q2), the blindfold technique was granted, and results show that Q2 value is greater than 0 as per the suggestion of [158].

4. Discussion

The main objective of this study is to determine the effect of sustainable product development as a mediating variable in the relationship between big data analytics and organizational performance. The finding of this study stated that big data analytics has a significant positive relationship with sustainable product development; thus, H1 was supported. The significant relationship between big data analytics and sustainable product development shows that the automobile sector in Pakistan should adopt big data analytics to transform its business operations in achieving the objectives of sustainable product development. The findings of this association are consistent with previous studies who examined the relationship between big data analytics and sustainable product development (environment, economic and social) [18,32,47,65,96,117,118]. This study also provides help to organizations and practitioners on how they can extract valuable knowledge from big data analytics to facilitate sustainable product development.
The relationship between sustainable product development and organizational performance was significant, and H2 was supported. The result of this study is consistent with prior studies that found that sustainable product development enhances the organization’s performance [124,129]. For example, [33] stated that the components of sustainable product development that comprise of environment, social and economy have significant and positive influences on the performance of the organization in the automotive industry. Additionally, Munodawafa and Johl [127] indicate that the development of the product based on the eco-innovation strategy has a positive impact on organizational performance. As suggested by [125], there is a positive and significant relationship between sustainable product development and performance of an organization.
As proposed, sustainable product development mediated the relationship between big data analytics and organizational performance and H3 was supported. The finding of this study shows that the indirect effect of big data analytics on organizational performance is mediated by sustainable product development and emphasizes the adoption of big data analytics to attain superior organizational performance. In general, in these climate-changing conditions, automobile organizations cannot achieve the desired results by using big data analytics only unless they develop and provide sustainable products to customers to satisfy their demands. For this reason, researchers suggest that big data analytics and sustainable product development are essential for the performance of organizations to tackle the new opportunities despite competing organizations’ behavior in the market [18,33,68,127].

4.1. Theoretical Contribution

There are several theoretical implications for big data analytical research. Firstly, the findings of this study contribute to providing the answer of the fascinating question in the research of big data analytics that what type of capabilities (i.e., technical and non-technical) an organization should acquire to gain success in big data efforts. [161]. The empirical results of this study are consistent with the results of prior studies and facilitate to provide the answer of these questions by indicating that an analytical culture of an organization is based upon three building blocks of big data analytics, such as management capability (i.e., planning, investment, coordination and control), technological capability (i.e., connectivity, compatibility, and modularity) and talent capability (i.e., technical skills, technology management skills, business skills and relational skills) [27].
Secondly, it is considered as the first study that determines the effect of big data analytics on sustainable product development and organizational performance of the automobile sector and examines the mediation effect of sustainable product development on the relationship between big data analytics and organizational performance. Although there is a lot of research on big data analytics [18,68] and sustainable product development [7], there is nascent research on the integration of these two constructs. The impact of big data analytics on organizational performance emerges clearly from the prior studies, but the missing link is the mediating effect of sustainable product development on big data analytics’ impact on organizational performance. Hence, our study tested the mediating effect of sustainable product development on the relationship between big data analytics and organizational performance by collecting the data from automotive firms in Pakistan. The combination of big data analytics and sustainable product development in a single theoretical framework is also a contribution of our study.
Thirdly, regardless of limited empirical modelling in the literature of big data, our study contributes to conceptualizing the reflective higher-order or multidimensional big data analytics construct based on the resource-based view. This association demonstrates that the capabilities of big data analytics (i.e., higher-order construct) have a significant impact on organizational performance. It is argued by [68] to examine the variation in performance of the organization, the third-order construct approach is considered more effective than other modelling approaches. So, this study filled this gap by providing a higher-order in big data analytics researches.
Fourthly, a review of previous literature on big data analytics, sustainable product development, and organizational performance suggests that most of the researchers have conducted these studies in developed countries such as Asia, Latin America, USA and Europe but have ignored emerging countries such as Pakistan. Similarly, in the abovementioned countries, a number of studies have been conducted in different sectors. Our study is a preliminary study that considers the automobile sector of Pakistan. It can provide a framework for the automotive sector to adopt for gaining better organizational performance and adopting sustainable product development program.
Finally, apart from the abovementioned theoretical contributions, the study has key strength of using distinctive time-lagged research design which involves the collection of data in three times waves from independent sources. This data collection design reduces the mono-method bias, especially when investigating a higher-order model. In this regard, this study also contributes methodologically in the literature.

4.2. Managerial Contribution

This study has significant guidance, implications for practitioners (i.e., managers, policymakers, consultants) who are engaged in big data analytics and sustainable product development. Firstly, the multidimensional big data analytics capability model facilitates the managers to understand the antecedents of this model and its relationship with each dimension. Our study suggests that organizations should adopt big data analytics capability to improve performance. This may help the organizations to make better decisions in order to gain better performance and competitive advantage. Organizations are in need to combine domain-specific capabilities with data science which will facilitate them in gaining a competitive edge over their competitors. Secondly, this study offers insights that having access to the latest technology, making the investment and collecting more information is considered insufficient to build a big data analytics capability effectively. The mediating role of sustainable product development highlights how organizations can gain a sustainable competitive advantage with the help of a big data analytics capability and sustainable product development. Conversely, if sustainable product development is missing, then big data analytics capability can lose a competitive advantage in the dynamic environment of business. However, our study provides guidance to practitioners who are engaged in projecting sustainable product development.
Moreover, the adoption of big data analytics creates opportunity for open innovations in the organizations. The development of the sustainable product is quite depended on the open innovation strategies of the organization which involves the inflows and outflows of the knowledge and information from the stakeholders. In this regard, the big data analytics can be used as the source of open innovation as it enables the co-creative value from customers and other stakeholders to develop a product by smoothly managing information and knowledgeable skills. In an open innovation paradigm, external and internal information extracted from the in-house and outside sources to utilize for the development of new products which is easily handled by the big data analytics.
In short, our study is relevant to the big data analytics capability, sustainable product development and betterment of the organizational performance. Finally, the findings of this study facilitate the practitioners to develop the strategies that will not only improve the organizational performance but also facilitate them to sustain the environmental, social and economic development. With the help of proper teamwork and sustainable product development, practitioners can contribute to protecting the environment, social and economic development. For the auto industry, there is a need to promote the environmentally friendly product properly with the help of innovation and continuous development. Practitioners should control the cost to enhance organizational performance by developing sustainable products.

5. Conclusions

This research adopted the resource-based view to study the higher-order big data analytics capability (i.e., management, technological and talent capability) and its relationship with the sustainable product and organizational performance. Different industries show their keen interest in big data analytics capability, but our study adopted this concept and examined its impact on organizational performance with the mediating effect of sustainable product development in the automobile sector. The results stated that big data analytics capability has a significant positive impact on sustainable product development and sustainable product development further has a significant positive impact on organizational performance. Moreover, sustainable product development mediates the relationship between big data analytics capability and organizational performance. Overall, the current study facilitates the practitioners and policymakers to understand the capability, strategy and performance relationship in big data environments comprehensively and provide new opportunities for research for academicians and policymakers.

Limitation and Future Directions

This study has some limitations and directions for future research regardless of the implication for academics and practitioners. Firstly, the scope of this study is the automobile industry in Pakistan. It is difficult to generalize the findings of this study for other industries like services, manufacturing, retailing, etc. Further researchers can use the same model to conduct research in different sectors and different countries. Secondly, the study used a quantitative approach for the data analysis. Further researches can adopt a mixed method approach to validate results by using qualitative–quantitative or quantitative–qualitative approach. Thirdly, the financial position of organizations plays a major role to take the initiative or launch a new product especially a sustainable one. So, we suggest that future research should use the financial capability as a mediator in the next studies. Finally, the government in developing countries plays an active role to regulate the development of industry, guide the policies of the business and influence its operations. Thus, it is crucial for organizations to build a relationship with government agencies (i.e., political ties) to survive. It is unclear that if political ties influence the operations of organizations in developing countries. So, we suggest that the moderating role of political ties should be checked in future studies to extend the understanding in the big data environment.

Author Contributions

All authors contributed equally. All authors have read and agreed to the published version of the manuscript.

Funding

The open access of this research is funded by the SPEV project 2020 at the Faculty of Informatics and Management, University of Hradec Kralove, Czech Republic.

Conflicts of Interest

The authors declare no conflict of interest.

Appendix A

Table A1. Constructs Items.
ConstructsItems
Big data analytics PlanningWe continuously examine the innovative opportunities for the strategic use of big data analytics.
We enforce adequate plans for the introduction and utilization of big data analytics.
We perform big data analytics planning processes in systematic and formalized ways.
We frequently adjust big data analytics plans to better adapt to changing conditions
Big data analytics Investment decisionWhen we make big data analytics investment decisions, we think about and estimate the effect they will have on the productivity of the employees’ work
When we make big data analytics investment decisions, we considerand project about how much these options will help end-users make quicker decisions.
When we make big data analytics investment decisions, we thinkabout and estimate the cost of training that end-users will need.
When we make big data analytics investment decisions, we considerand estimate the time managers will need to spend overseeing thechange
Big data analytics
Coordination
In our organization, business analysts and line people meet frequently to discuss important issues both formally and informally.
In our organization, business analysts and line people from various departments frequently attend cross-functional meetings.
In our organization, business analysts and line people coordinatetheir efforts harmoniously.
In our organization, information is widely shared between businessanalysts and line people so that those who make decisions or perform jobs have access to all available know-how
Big data analytics ControlIn our organization, the responsibility for big data analytics development is clear.
We are confident that big data analytics project proposals areproperly appraised.
We constantly monitor the performance of the big data analytics function.
Our analytics department is clear about its performance criteria.
ConnectivityCompared to rivals within our industry, our organization has the foremost available analytics systems.
All remote, branch, and mobile offices are connected to the central office for analytics.
Our organization utilizes open systems network mechanisms to boost analytics connectivity
There are no identifiable communications bottlenecks within our organization when sharing analytics insights.
CompatibilitySoftware applications can be easily transported and used across multiple analytics platforms.
Our user interfaces provide transparent access to all platforms and applications.
Analytics-driven information is shared seamlessly across our organization, regardless of the location.
Our organization provides multiple analytics interfaces or entry pointsfor external end-users.
ModularityReusable software modules are widely used in new analytics modeldevelopment
End-users utilize object-oriented tools to create their own analyticsapplications.
Object-oriented technologies are utilized to minimize the development time for new analytics applications.
Applications can be adapted to meet a variety of needs duringanalytics tasks
Technical
Knowledge
Our analytics personnel are very capable in terms of programmingskills.
Our analytics personnel are very capable in terms of managing project life cycles.
Our analytics personnel are very capable in the areas of data andnetwork management and maintenance.
Our analytics personnel create very capable decision support systemsdriven by analytics.
Technology
Management
Knowledge
Our analytics personnel show superior understanding of technologicaltrends.
Our analytics personnel show superior ability to learn new technologies.
Our analytics personnel are very knowledgeable about the criticalfactors for the success of our organization.
Our analytics personnel are very knowledgeable about the role of bigdata analytics as a means, not an end.
Business
Knowledge
Our analytics personnel understand our organization’s policies and plans at a very high level.
Our analytics personnel are very capable in interpreting businessproblems and developing appropriate technical solutions.
Our analytics personnel are very knowledgeable about businessfunctions
Our analytics personnel are very knowledgeable about the businessenvironment.
Relational
Knowledge
Our analytics personnel are very capable in terms of planning, organizing, and leading projects.
Our analytics personnel are very capable in terms of planning andexecuting work in a collective environment.
Our analytics personnel are very capable in terms of teaching others
Our analytics personnel work closely with customers and maintain productive user/client relationships.
Organizational performanceUsing big data analytics improved ____ during the last 3 years relative to competitors:
Customer retention
Sales growth
Profitability
Return on investment
SocialOur firm believes in gender equality
Our firm pays significant attention to the mortality rate of the daily wage workers children
Our firm believes in poverty reduction
Our firm pays significant attention to the nutritional status of the meal served in the canteen
Environmental performanceOur organization has adopted adequate measures for reduction of air emissions
Our organization has adopted adequate measures for re-cycling waste water
Our organization has adopted adequate measures to prevent discharge of solid waste
Our organization has adopted adequate measures to prevent consumption of hazardous harmful toxic materials
EconomicDecrease of cost for materials purchasing
Decrease of cost for energy consumption
Decrease of fee for waste treatment
Decrease of fee for waste discharge

References

  1. Song, Y.; Guo, S.; Zhang, M. Assessing customers’ perceived value of the anti-haze cosmetics under haze pollution. Sci. Total Environ. 2019, 685, 753–762. [Google Scholar] [CrossRef] [PubMed]
  2. Mao, G.; Huang, N.; Chen, L.; Wang, H. Research on biomass energy and environment from the past to the future: A bibliometric analysis. Sci. Total Environ. 2018, 635, 1081–1090. [Google Scholar] [CrossRef] [PubMed]
  3. Jamal, S. Pakistan Air Pollution Is a ‘Public Health Emergency’. Pakistan–Gulf News. Gulf News Asia. 2018. Available online: https://gulfnews.com/world/asia/pakistan/pakistan-air-pollution-is-a-public-health-emergency-1.60607482 (accessed on 7 October 2019).
  4. Olugu, E.U.; Wong, K.Y.; Shaharoun, A.M. A Comprehensive Approach in Assessing the Performance of an Automobile Closed-Loop Supply Chain. Sustainability 2010, 2, 871–889. [Google Scholar] [CrossRef] [Green Version]
  5. Lettice, F.; Wyatt, C.; Evans, S. Buyer–supplier partnerships during product design and development in the global automotive sector: Who invests, in what and when? Int. J. Prod. Econ. 2010, 127, 302–319. [Google Scholar] [CrossRef]
  6. Xia, X.; Govindan, K.; Zhu, Q. Analyzing internal barriers for automotive parts remanufacturers in China using grey-DEMATEL approach. J. Clean. Prod. 2015, 87, 811–825. [Google Scholar] [CrossRef]
  7. Kushwaha, G.S.; Sharma, N.K. Green initiatives: A step towards sustainable development and firm’s performance in the automobile industry. J. Clean. Prod. 2016, 121, 116–129. [Google Scholar] [CrossRef]
  8. Pakistan & Gulf Economist. Overview of auto sector of Pakistan—Pakistan & Gulf Economist. 2019. Available online: https://www.pakistangulfeconomist.com/2019/01/14/overview-of-auto-sector-of-pakistan/ (accessed on 11 December 2020).
  9. The News International. Automobile Sector Stares at 40–60pc Skid in Sales, 150,000 Job Cuts. 2019. Available online: https://www.thenews.com.pk/print/502153-automobile-sector-stares-at-40-60pc-skid-in-sales-150-000-job-cuts (accessed on 11 December 2020).
  10. The News International. Pakistan Auto Industry in Worst Crisis. 2019. Available online: https://www.thenews.com.pk/print/498262-pakistan-auto-industry-in-worst-crisis (accessed on 11 December 2020).
  11. Abubakar, S.M. Pakistan 7th Most Vulnerable Country to Climate Change, Says Germanwatch-Pakistan-DAWN.COM. 2017. Available online: https://www.dawn.com/news/1369425 (accessed on 11 December 2020).
  12. Zahra-Malik, M. In Lahore, Pakistan, Smog Has Become a ‘Fifth Season’—The New York Times. The New York Times. 2017. Available online: https://www.nytimes.com/2017/11/10/world/asia/lahore-smog-pakistan.html (accessed on 7 October 2019).
  13. CARTO. NO2 Hotspots. 2018. Available online: https://energydesk.carto.com/builder/4c2ece4f-3367-4432-a418-8ce61ca01801/embed (accessed on 11 December 2020).
  14. Khan, M.A.; Amir, A.P.; Ramay, S.A.; Ahmad, V. National Environmental, Economic and Development Study (NEEDS), Pakistan. 2011. Available online: https://unfccc.int/files/adaptation/application/pdf/pakistanneeds.pdf (accessed on 11 December 2020).
  15. Arshad, D.; Ullah, D.N.; Khan, B.; Javed, M.; Arslan, M.; Qureshi, M. Electric Vehicles in Pakistan: Policy Recommendation. LUMS Energy Institute & U.S.-Pakistan Center for Advanced Studies in Energy (USPCAS-E), Lums. 2019. Available online: http://web.lums.edu.pk/~eig/ev.html (accessed on 7 October 2019).
  16. Mishra, D.; Luo, Z.; Hazen, B.; Hassini, E.; Foropon, C. Organizational Capabilities That Enable Big Data and Predictive Analytics Diffusion and Organizational Performance: A Resource-Based Perspective. In Management Decision; Emerald Group Publishing Ltd. 2018. Available online: https://www.researchgate.net/publication/326108437_Organizational_capabilities_that_enable_big_data_and_predictive_analytics_diffusion_and_organizational_performance_A_resource-based_perspective (accessed on 7 October 2019).
  17. Constantiou, I.D.; Kallinikos, J. New games, new rules: Big data and the changing context of strategy. J. Inf. Technol. 2015, 30, 44–57. [Google Scholar] [CrossRef] [Green Version]
  18. Akter, S.; Wamba, S.F.; Gunasekaran, A.; Dubey, R.; Childe, S.J. How to improve firm performance using big data analytics capability and business strategy alignment? Int. J. Prod. Econ. 2016, 182, 113–131. [Google Scholar] [CrossRef] [Green Version]
  19. Barton, D.; Court, D. Making advanced analytics work for you. Harv. Bus. Rev. 2012, 90, 78–83. [Google Scholar]
  20. Davenport, T.H.; Harris, J.G. Competing on Analytics: The New Science of Winning; Harvard Business School Press Brighton: Boston, MA, USA, 2007. [Google Scholar]
  21. George, G.; Haas, M.R.; Pentland, A. Big Data and Management: From the Editors. Acad. Manag. J. 2014, 57, 321–326. [Google Scholar] [CrossRef]
  22. Mikalef, P.; Boura, M.; Lekakos, G.; Krogstie, J. Big data analytics and firm performance: Findings from a mixed-method approach. J. Bus. Res. 2019, 98, 261–276. [Google Scholar] [CrossRef]
  23. Himesh, S.; Prakasa Rao, E.V.S.; Gouda, K.C.; Ramesh, K.V.; Rakesh, V.; Mohapatra, G.N. Digital revolution and Big Data: A new revolution in agriculture. CAB Rev. Perspect. Agric. Vet. Sci. Nutr. Nat. Resour. 2018, 13. [Google Scholar] [CrossRef]
  24. Rizk, A.; Elragal, A. Data science: Developing theoretical contributions in information systems via text analytics. J. Big Data 2020, 7. [Google Scholar] [CrossRef]
  25. Gartner. Gartner Says Worldwide IT Spending on Pace to Grow 3.2 Percent in 2014. 2014. Available online: https://www.gartner.com/en/newsroom/press-releases/2014-04-02-gartner-says-worldwide-it-spending-on-pace-to-grow-3-percent-in-2014 (accessed on 11 December 2020).
  26. Columbus, L. 84% of Enterprises See Big Data Analytics Changing Their Industries’ Competitive Landscapes in the Next Year. Forbes. 2014. Available online: https://www.forbes.com/sites/louiscolumbus/2014/10/19/84-of-enterprises-see-big-data-analytics-changing-their-industries-competitive-landscapes-in-the-next-year/?sh=335f530417de (accessed on 7 October 2019).
  27. Kiron, D.; Prentice, P.; Ferguson, R. The analytics mandate. MIT Sloan Manag. Rev. 2014, 51, 1–25. [Google Scholar]
  28. Columbus, L. Making Analytics Accountable: 56% of Executives Expect Analytics to Contribute to 10% or More Growth in 2014, Forbes. 2014. Available online: https://abogadoaly.wordpress.com/2014/12/10/making-analytics-accountable-56-of-executives-expect-analytics-to-contribute-to-10-or-more-growth-in-2014/ (accessed on 7 October 2019).
  29. Salehan, M.; Kim, D. Predicting the performance of online consumer reviews: A sentiment mining approach to big data analytics. Decis. Support Syst. 2016, 81, 30–40. [Google Scholar] [CrossRef]
  30. Tan, K.H.; Zhan, Y. Improving new product development using big data: A case study of an electronics company. R D Manag. 2017, 47, 570–582. [Google Scholar] [CrossRef]
  31. Front Stream. The Three Pillars of Sustainability. 2020. Available online: https://www.frontstream.com/blog/the-three-pillars-of-sustainability (accessed on 7 October 2019).
  32. Jeble, S.; Dubey, R.; Childe, S.J.; Papadopoulos, T.; Roubaud, D.; Prakash, A. Impact of big data and predictive analytics capability on supply chain sustainability. Int. J. Logist. Manag. 2018, 29, 513–538. [Google Scholar] [CrossRef]
  33. Ahmad, H.M.A.H.; Iteng, R.; Saad, R.; Rahim, M.K.I.A. The criteria’s of sustainable product development and organizational performance. Int. J. Supply Chain Manag. 2018, 7, 497–501. [Google Scholar]
  34. Sharma, R.; Mithas, S.; Kankanhalli, A. Transforming decision-making processes: A research agenda for understanding the impact of business analytics on organisations. Eur. J. Inf. Syst. 2014, 23, 433–441. [Google Scholar] [CrossRef] [Green Version]
  35. Troilo, M.; Bouchet, A.; Urban, T.L.; Sutton, W.A. Perception, reality, and the adoption of business analytics: Evidence from North American professional sport organizations. Omega 2016, 59, 72–83. [Google Scholar] [CrossRef]
  36. Del Vecchio, P.; Mele, G.; Ndou, V.; Secundo, G. Open innovation and social big data for sustainability: Evidence from the tourism industry. Sustainability 2018, 10, 3215. [Google Scholar] [CrossRef] [Green Version]
  37. Ramanathan, R.; Philpott, E.; Duan, Y.; Cao, G. Adoption of business analytics and impact on performance: A qualitative study in retail. Prod. Plan. Control 2017, 28, 985–998. [Google Scholar] [CrossRef]
  38. Schuberth, F.; Rademaker, M.E.; Henseler, J. Estimating and assessing second-order constructs using PLS-PM: The case of composites of composites. Ind. Manag. Data Syst. 2020. [Google Scholar] [CrossRef]
  39. Sarstedt, M.; Hair, J.F.; Cheah, J.H.; Becker, J.M.; Ringle, C.M. How to specify, estimate, and validate higher-order constructs in PLS-SEM. Australas. Mark. J. 2019, 27, 197–211. [Google Scholar] [CrossRef]
  40. Barney, J. Firm Resources and Sustained Competitive Advantage. J. Manag. 1991, 17, 99–120. [Google Scholar] [CrossRef]
  41. Anwar, M.; Khan, S.Z.; Shah, S.Z.A. Big Data Capabilities and Firm’s Performance: A Mediating Role of Competitive Advantage. J. Inf. Knowl. Manag. 2018, 17, 1–28. [Google Scholar] [CrossRef]
  42. Amit, R.; Schoemaker, P.J.H. Strategic assets and organizational rent. Strateg. Manag. J. 2012, 14, 33–46. [Google Scholar] [CrossRef]
  43. Peppard, J.; Ward, J. The Strategic Management of Information Systems: Building a Digital Strategy, 4th ed.; John Wiley & Sons: Hoboken, NJ, USA, 2016. [Google Scholar]
  44. Peteraf, M.A.; Barney, J.B. Unraveling the resource-based tangle. Manag. Decis. Econ. 2003, 24, 309–323. [Google Scholar] [CrossRef]
  45. Barney, J.; Hesterly, W. Strategic Management and Competitive Advantage: Concepts; Prentice Hall: Englewood Cliffs, NJ, USA, 2012; Available online: https://www.worldcat.org/title/strategic-management-and-competitive-advantage-concepts-and-cases/oclc/297146325 (accessed on 7 October 2019).
  46. Erevelles, S.; Fukawa, N.; Swayne, L. Big Data consumer analytics and the transformation of marketing. J. Bus. Res. 2016, 69, 897–904. [Google Scholar] [CrossRef]
  47. Gunasekaran, A.; Papadopoulos, T.; Dubey, R.; Wamba, S.F.; Childe, S.J.; Hazen, B.; Akter, S. Big data and predictive analytics for supply chain and organizational performance. J. Bus. Res. 2017, 70, 308–317. [Google Scholar] [CrossRef]
  48. Wojcik, P. Exploring Links Between Dynamic Capabilities Perspective and Resource-Based View: A Literature Overview. Int. J. Manag. Econ. 2015, 45, 83–107. [Google Scholar] [CrossRef] [Green Version]
  49. Morgan, N.A.; Slotegraaf, R.J.; Vorhies, D.W. Linking marketing capabilities with profit growth. Int. J. Res. Mark. 2009, 26, 284–293. [Google Scholar] [CrossRef]
  50. Melville, N.; Kraemer, K.; Gurbaxani, V. Information technology and organizational performance: An integrative model of IT business value. MIS Q. 2004, 28, 283–322. [Google Scholar] [CrossRef] [Green Version]
  51. Delen, D.; Zolbanin, H.M. The analytics paradigm in business research. J. Bus. Res. 2018, 90, 186–195. [Google Scholar] [CrossRef]
  52. Chae, B.; Yang, C.; Olson, D.; Sheu, C. The impact of advanced analytics and data accuracy on operational performance: A contingent resource based theory (RBT) perspective The Impact of Advanced Analytics and Data Accuracy on Operational Performance: A Contingent Resource Based Theory (RBT) Per. Decis. Support Syst. 2014, 59, 119–126. [Google Scholar] [CrossRef] [Green Version]
  53. Kaufman, B.E. The RBV theory foundation of strategic HRM: Critical flaws, problems for research and practice, and an alternative economics paradigm. Hum. Resour. Manag. J. 2015, 25, 516–540. [Google Scholar] [CrossRef]
  54. Wu, S.J.; Melnyk, S.A.; Flynn, B.B. Operational Capabilities: The Secret Ingredient. Decis. Sci. 2010, 41, 721–754. [Google Scholar] [CrossRef]
  55. Viaene, S. Data Scientists Aren’t Domain Experts. IT Prof. 2013, 15, 12–17. [Google Scholar] [CrossRef]
  56. Cox, M.; Ellsworth, D. Managing Big Data for Scientific Visualization. ACM Siggraph 1997, 97, 1–17. [Google Scholar]
  57. Goes, P. Big data and IS research. Mis Q. 2014, 38, 3–8. [Google Scholar]
  58. Einav, L.; Levin, J. The Data Revolution and Economic Analysis. Innov. Policy Econ. Natl. Bur. Econ. Res. 2013, 14, 1–24. [Google Scholar]
  59. O’Leary, D. Artificial intelligence and big data. IEEE Intell. Syst. 2013, 28, 96–99. [Google Scholar] [CrossRef]
  60. Kauffman, R.J.; Srivastava, J.; Vayghan, J. Business and data analytics: New innovations for the management of e-commerce. Electron. Commer. Res. Appl. 2012, 11, 85–88. [Google Scholar] [CrossRef]
  61. Beyer, M.; Laney, D. The Importance of ’Big Data’: A definition; Gartner: Stamford, CT, USA, 2012. [Google Scholar]
  62. Garmaki, M.; Boughzala, I.; Wamba, S.F. Association for Information Systems AIS Electronic Library (AISeL) the effect of big data analytics capability on firm performance recommended citation the effect of big data analytics capability on firm performance. Pacific Asia Conf. Inf. Syst. 2016, 301. Available online: https://www.semanticscholar.org/paper/The-effect-of-Big-Data-Analytics-Capability-on-Firm-Garmaki-Boughzala/7ea1cdf8d22c9f28b53b48a16212d585fe7a6242?p2df (accessed on 13 December 2020).
  63. APICS. APICS 2012 Big Data Insights and Innovations Executive Summary; American Inventory and Production Control Society; APICS: Chicago, IL, USA, 2012. [Google Scholar]
  64. Kwon, O.; Lee, N.; Shin, B. Data quality management, data usage experience and acquisition intention of big data analytics. Int. J. Inf. Manag. 2014, 34, 387–394. [Google Scholar] [CrossRef]
  65. Gupta, M.; George, J. Toward the development of a big data analytics capability. Inf. Manag. 2016, 53, 1049–1064. [Google Scholar] [CrossRef]
  66. Lavalle, S.; Lesser, E.; Shockley, R.; Hopkins, M.S.; Kruschwitz, N. Big Data, Analytics and the Path from Insights to Value. MIT Sloan Manag. Rev. 2011, 52, 21–32. [Google Scholar]
  67. Davenport, T. Competing on analytics. Harv. Bus. Rev. 2006, 84, 98–107. [Google Scholar]
  68. Kim, G.; Shin, B.; Kwon, O. Investigating the value of sociomaterialism in conceptualizing it capability of a firm. J. Manag. Inf. Syst. 2012, 29, 327–362. [Google Scholar]
  69. Kim, G.; Shin, B.; Kim, K.K.; Lee, H.G. IT Capabilities, Process-Oriented Dynamic Capabilities, and Firm Financial Performance. J. Assoc. Inf. Syst. 2011, 12, 487–517. [Google Scholar] [CrossRef] [Green Version]
  70. DeSanctis, G.; Jackson, B.M. Coordination of Information Technology Management: Team Based Structures and Computer Based Communication Systems. J. Manag. Inf. Syst. 1994, 10, 85–110. [Google Scholar] [CrossRef]
  71. Ryan, S.D.; Harrison, D.A.; Schkade, L.L. Information-technology investment decisions: When do costs and benefits in the social subsystem matter? J. Manag. Inf. Syst. 2002, 19, 85–127. [Google Scholar] [CrossRef]
  72. Karimi, J.; Somers, T.M.; Gupta, Y.P. Impact of information technology management practices on customer service. J. Manag. Inf. Syst. 2001, 17, 125–158. [Google Scholar] [CrossRef]
  73. Makadok, R. Toward a synthesis of the resource-based and dynamic-capability views of rent creation. Strateg. Manag. J. 2001, 22, 387–401. [Google Scholar] [CrossRef]
  74. Ramaswamy, S. What the Companies Winning at Big Data Do Differently; Bloomberg: NewYork, NY, USA, 2013. [Google Scholar]
  75. Li, E.; Jiang, J.; Klein, G. The Impact of Organizational Coordination and Climate on Marketing Executives’ Satisfaction with Information Systems Services. J. Assoc. Inf. Syst. 2003, 4, 99–117. [Google Scholar] [CrossRef] [Green Version]
  76. Schroeck, M.; Shockley, R.; Smart, J.; Romero-Morales, D.; Tufano, P. Analytics: The real-world use of big data. IBM Glob. Bus. Serv. 2012, 12, 1–20. [Google Scholar]
  77. Byrd, T.A.; Turner, D.E. Measuring the flexibility of information technology infrastructure: Exploratory analysis of a construct. J. Manag. Inf. Syst. 2000, 17, 167–208. [Google Scholar]
  78. Bharadwaj, A. A resource-based perspective on information technology capability and firm performance: An empirical investigation. MIS Q. 2000, 24, 169–196. [Google Scholar] [CrossRef]
  79. Lu, Y.; Ramamurthy, K. Understanding the link between information technology capability and organizational agility: An empirical examination. MIS Q. Manag. Inf. Syst. 2011, 35, 931–954. [Google Scholar] [CrossRef] [Green Version]
  80. Byrd, T.A.; Turner, D.E. An Exploratory Analysis of the Value of the Skills of IT Personnel: Their Relationship to IS Infrastructure and Competitive Advantage. Decis. Sci. 2001, 32, 21–54. [Google Scholar] [CrossRef]
  81. Lee, D.; Trauth, E.; Farwell, D. Critical skills and knowledge requirements of IS professionals: A joint academic/industry investigation. MIS Q. 1995, 19, 313–340. [Google Scholar] [CrossRef]
  82. Tippins, M.J.; Sohi, R.S. IT competency and firm performance: Is organizational learning a missing link? Strateg. Manag. J. 2003, 24, 745–761. [Google Scholar] [CrossRef] [Green Version]
  83. Tesch, D.; Jiang, J.J.; Klein, G. The impact of information system personnel skill discrepancies on stakeholder satisfaction. A J. Decis. Sci. Inst. 2003, 34, 107–129. [Google Scholar] [CrossRef]
  84. Rockart, J.F.; Earl, M.J.; Ross, J.W. Eight Imperatives for the New IT Organization. Sloan Manag. Rev. 1996, 38, 43–56. [Google Scholar]
  85. Aral, S.; Weill, P. IT assets, organizational capabilities, and firm performance: How resource allocations and organizational differences explain performance variation. Organ. Sci. 2007, 18, 763–780. [Google Scholar] [CrossRef]
  86. Jiang, J.J.; Klein, G.; van Slyke, C.; Cheney, P. A Note on Interpersonal and Communication Skills for IS Professionals: Evidence of Positive Influence. A J. Decis. Sci. Institue 2003, 34, 799–812. [Google Scholar] [CrossRef]
  87. Johnson, J.S.; Friend, S.B.; Lee, H.S. Big Data Facilitation, Utilization, and Monetization: Exploring the 3Vs in a New Product Development Process. J. Prod. Innov. Manag. 2017, 34, 640–658. [Google Scholar] [CrossRef]
  88. Abdul-Rashid, S.H.; Sakundarini, N.; Ghazilla, R.A.R.; Thurasamy, R. The impact of sustainable manufacturing practices on sustainability performance: Empirical evidence from Malaysia. Int. J. Oper. Prod. Manag. 2017, 37, 182–204. [Google Scholar] [CrossRef]
  89. Del Vecchio, P.; di Minin, A.; Petruzzelli, A.M.; Panniello, U.; Pirri, S. Big data for open innovation in SMEs and large corporations: Trends, opportunities, and challenges. Creat. Innov. Manag. 2018, 27, 6–22. [Google Scholar] [CrossRef]
  90. Ratiu, C.; Anderson, B.B. The multiple identities of sustainability. World J. Sci. Technol. Sustain. Dev. 2015, 12, 194–205. [Google Scholar] [CrossRef]
  91. Trudel, R.; Cotte, J. Does it pay to be good? MIT Sloan Manag. Rev. 2009, 50, 61–69. [Google Scholar]
  92. Laroche, M.; Bergeron, J.; Barbaro-Forleo, G. Targeting consumers who are willing to pay more for environmentally friendly products. J. Consum. Mark. 2001, 18, 503–520. [Google Scholar] [CrossRef] [Green Version]
  93. Zhao, R.; Liu, Y.; Zhang, N.; Huang, T. An optimization model for green supply chain management by using a big data analytic approach. J. Clean. Prod. 2017, 142, 1087–1097. [Google Scholar] [CrossRef]
  94. Xie, H.; He, Y.; Xie, X. Exploring the factors influencing ecological land change for China’s Beijing–Tianjin–Hebei Region using big data. J. Clean. Prod. 2017, 142, 677–687. [Google Scholar] [CrossRef]
  95. An, Q.; Wen, Y.; Xiong, B.; Yang, M.; Chen, X. Allocation of carbon dioxide emission permits with the minimum cost for Chinese provinces in big data environment. J. Clean. Prod. 2017, 142, 886–893. [Google Scholar] [CrossRef]
  96. Mani, V.; Agrawal, R.; Sharma, V. Supply chain social sustainability: A comparative case analysis in indian manufacturing industries. Procedia-Soc. Behav. Sci. 2015, 189, 234–251. [Google Scholar] [CrossRef] [Green Version]
  97. Thomas, A.; Byard, P.; Francis, M.; Fisher, R.; White, G. Profiling the resiliency and sustainability of UK manufacturing companies. J. Manuf. Technol. Manag. 2016, 27, 82–99. [Google Scholar] [CrossRef]
  98. Mani, V.; Agrawal, R.; Sharma, V. Supplier selection using social sustainability: AHP based approach in India. Int. Strateg. Manag. Rev. 2014, 2, 98–112. [Google Scholar] [CrossRef] [Green Version]
  99. Lindsey, A.; King, E.; McCausland, T.; Jones, K.; Dunleavy, E. What we know and don’t: Eradicating employment discrimination 50 years after the Civil Rights Act. Ind. Organ. Psychol. 2013, 64, 391–413. [Google Scholar] [CrossRef]
  100. Zadek, S. The Path to Corporate Responsibility. Harv. Bus. Rev. 2004, 12. [Google Scholar] [CrossRef]
  101. Ashby, M. Materials and the Environment: Eco-Informed Material Choice; Elsevier: Amsterdam, The Netherlands, 2012. [Google Scholar]
  102. Song, M.; Cen, L.; Zheng, Z.; Fisher, R.; Liang, X.; Wang, Y.; Huisingh, D. How would big data support societal development and environmental sustainability? Insights and practices. J. Clean. Prod. 2017, 142, 489–500. [Google Scholar] [CrossRef] [Green Version]
  103. Ahmad, M.A.; Asaad, M.N.; Saad, R.; Iteng, R.; Rahim, M.; Abdul, K.I. Mediating effect of sustainable product development on relationship between quality management practices and organizational performance: Empirical study of Malaysian automotive industry. AIP Conf. Proc. 2016, 1761. [Google Scholar] [CrossRef]
  104. Svensson, G.; Wagner, B. Implementing and managing economic, social and environmental efforts of business sustainability propositions for measurement and structural models. Manag. Environ. Qual. Int. J. 2015, 26, 195–213. [Google Scholar] [CrossRef]
  105. Foster, R.; Kaplan, S. Creative Destruction: Why Companies That Are Built to Last Underperform the Market—And How to Success Fully Transform Them, Currency. 2001. Available online: https://www.amazon.com/Creative-Destruction-Underperform-Market-Successfully/dp/038550134X (accessed on 7 October 2019).
  106. Tseng, S.M.; Lee, P.S. The effect of knowledge management capability and dynamic capability on organizational performance. J. Enterp. Inf. Manag. 2014, 27, 158–179. [Google Scholar] [CrossRef]
  107. Masa’deh, R.; Tarhini, A.; Al-Dmour, R.; Obeidat, B. Strategic IT-Business Alignment as Managers’ Explorative and Exploitative Strategies. Eur. Sci. J. 2015, 11, 437–457. [Google Scholar]
  108. Jarad, I.A.; Yusof, N.; Shafiei, M.W.M. The organizational performance of housing developers in Peninsular Malaysia. Int. J. Hous. Mark. Anal. 2010, 3, 146–162. [Google Scholar] [CrossRef]
  109. Shahin, A.; Naftchali, J.S.; KhazaeiPool, J. Developing a model for the influence of perceived organizational climate on organizational citizenship behaviour and organizational performance based on balanced score card. Int. J. Product. Perform. Manag. 2014, 63, 290–307. [Google Scholar] [CrossRef]
  110. Masa’deh, R.; Obeidat, B.Y.; Tarhini, A. A Jordanian empirical study of the associations among transformational leadership, transactional leadership, knowledge sharing, job performance, and firm performance. J. Manag. Dev. 2016, 35, 681–705. [Google Scholar] [CrossRef]
  111. Al-Ansaari, Y.; Bederr, H.; Chen, C. Strategic orientation and business performance: An empirical study in the UAE context. Manag. Decis. 2015, 53, 2287–2302. [Google Scholar] [CrossRef]
  112. Dess, G.G. Consensus on strategy formulation and organizational performance: Competitors in a fragmented industry. Strateg. Manag. J. 1987, 8, 259–277. [Google Scholar] [CrossRef]
  113. Powell, T.C. Organizational alignment as competitive advantage. Strateg. Manag. J. 1992, 13, 551–558. [Google Scholar] [CrossRef]
  114. Powell, T.C.; Dent-Micallef, A. Information technology as competitive advantage: The role of human, business, and technology resources. Strateg. Manag. J. 1997, 18, 375–405. [Google Scholar] [CrossRef]
  115. Spanos, Y.E.; Lioukas, S. An examination into the causal logic of rent generation: Contrasting Porter’s competitive strategy framework and the resource-based perspective. Strateg. Manag. J. 2001, 22, 907–934. [Google Scholar] [CrossRef]
  116. Bughin, J.; Chui, M.; Manyika, J. Clouds, big data, and smart assets: Ten tech-enabled business trends to watch. McKinsey Q. 2010, 56, 75–86. [Google Scholar]
  117. Pan, Y.; Tian, Y.; Liu, X.; Gu, D.; Hua, G. Urban big data and the development of city intelligence. Engineering 2016, 2, 171–178. [Google Scholar] [CrossRef] [Green Version]
  118. Koseleva, N.; Ropaite, G. Big data in building energy efficiency: Understanding of big data and main challenges. Procedia Eng. 2017, 172, 544–549. [Google Scholar] [CrossRef]
  119. Man, D.; Strandhagen, J. An Industry 4.0 research agenda for sustainable business models. Procedia Cirp 2017, 63, 721–726. [Google Scholar] [CrossRef]
  120. Seles, B.R.P.M.; Jabbour, A.B.L.d.; Jabbour, C.J.C.; Fiorini, P.D.C.; Mohd-Yusoff, Y.; Thome, A.M.T. Business opportunities and challenges as the two sides of the climate change: Corporate responses and potential implications for big data management towards a low carbon society. J. Clean. Prod. 2018, 189, 763–774. [Google Scholar] [CrossRef] [Green Version]
  121. Singh, S.K.; El-Kassar, A. Role of big data analytics in developing sustainable capabilities. J. Clean. Prod. 2019, 213, 1264–1273. [Google Scholar] [CrossRef]
  122. Jagtap, S.; Duong, L.N.K. Improving the new product development using big data: A case study of a food company. Br. Food J. 2019. ahead of print. [Google Scholar]
  123. Karim, A.; Arif-Uz-Zaman, K. A methodology for effective implementation of lean strategies and its performance evaluation in manufacturing organizations. Bus. Process Manag. J. 2013, 19, 169–196. [Google Scholar] [CrossRef]
  124. Aydin, S.; Cetin, A.; Ozer, G. The relationship between marketing and product development process and their effects on firm performance. Acad. Mark. Stud. J. 2007, 11, 53–68. [Google Scholar]
  125. Namusonge, A.; Mukulu, E.; Mokaya, S. Relationship Between Strategic Product Development Practices and Financial Performance of Telecommunication Firms in Kenya. Int. J. Acad. Res. Bus. Soc. Sci. 2017, 7, 309–326. [Google Scholar] [CrossRef] [Green Version]
  126. Montoya-Weiss, M.; Calantone, R. Determinants of new product performance: A review and meta-analysis. J. Prod. Innov. Manag. 1994, 11, 397–417. [Google Scholar] [CrossRef]
  127. Munodawafa, R.T.; Johl, S.K. Eco-Innovation and Industry 4.0: A Big Data Usage conceptual model. SHS Web Conf. 2018, 56. [Google Scholar] [CrossRef]
  128. Long, X.; Chen, Y.; Du, J.; Oh, K.; Han, I.; Yan, J. The effect of environmental innovation behavior on economic and environmental performance of 182 Chinese firms. Ournal Clean. Prod. 2017, 166, 1274–1282. [Google Scholar] [CrossRef]
  129. Xu, J.; Shan, X.G.; Xiu, W.L. Empirical Study on the Relationship between External Knowledge Acquisition, New Product Development and Firm Performance. R D Manag. 2008, 5. Available online: http://en.cnki.com.cn/Article_en/CJFDTotal-YJYF200805011.htm (accessed on 9 December 2020).
  130. Anand, A.; Wamba, S.F.; Sharma, R. The effects of firm IT capabilities on firm performance: The mediating effects of process improvement. In Proceedings of the 24th Australasian Conference on Information Systems, Melbourne, VIC, Australia, 4–6 December 2013; pp. 1–10. [Google Scholar]
  131. Aydiner, A.S.; Tatoglu, E.; Bayraktar, E.; Zaim, S.; Delen, D. Business analytics and firm performance: The mediating role of business process performance. J. Bus. Res. 2019, 96, 228–237. [Google Scholar] [CrossRef]
  132. Lin, Y.; Wu, L. Exploring the role of dynamic capabilities in firm performance under the resource-based view framework. J. Bus. Res. 2014, 67, 407–413. [Google Scholar] [CrossRef]
  133. Morabito, V. Big Data and Analytics: Strategic and Organizational Impacts; Springer International Publishing: Berlin/Heidelberg, Germany, 2015. [Google Scholar]
  134. Podsakoff, P.M.; MacKenzie, S.B.; Podsakoff, N.P. Sources of method bias in social science research and recommendations on how to control it. Annu. Rev. Psychol. 2012, 63, 539–569. [Google Scholar] [CrossRef] [Green Version]
  135. Yeo, V.C.S.; Goh, S.-K.; Rezaei, S. Consumer experiences, attitude and behavioral intention toward online food delivery (OFD) services. J. Retail. Consum. Serv. 2017, 35, 150–162. [Google Scholar] [CrossRef]
  136. Ali, S.; Ullah, H.; Akbar, M.; Akhtar, W.; Zahid, H. Determinants of Consumer Intentions to Purchase Energy-Saving Household Products in Pakistan. Sustainability 2019, 11, 1462. [Google Scholar] [CrossRef] [Green Version]
  137. Syed, F.; Akhtar, M.W.; Kashif, M.; Husnain, M. Interplay of Exploitative Leadership & Fear of Negative Evaluation on Knowledge Hiding & Outcomes. Acad. Manag. Proc. 2019, 17050. [Google Scholar] [CrossRef]
  138. Hair, J.F.; Ringle, C.M.; Sarstedt, M. PLS-SEM: Indeed a Silver Bullet PLS-SEM: Indeed a Silver Bullet. J. Mark. Theory Pract. 2011, 19, 37–41. [Google Scholar] [CrossRef]
  139. Duarte, P.; Amaro, S. Methods for modelling reflective-formative second order constructs in PLS An application to online travel shopping Paulo. Eletronic Libr. 2017, 34, 1–5. [Google Scholar]
  140. Ciavolino, E.; Nitti, M. High-Order Constructs for the Structural Equation Model. Dyses 2010, 1–5. Available online: https://www.researchgate.net/profile/Mariangela_Nitti/publication/235762640_High-order_Constructs_for_the_Structural_Equation_Model/links/02bfe51348859ef648000000/High-order-Constructs-for-the-Structural-Equation-Model.pdf (accessed on 9 December 2020).
  141. Hair, J.F., Jr.; Hult, G.T.M.; Ringle, C.; Sarstedt, M. A Primer on Partial Least Squares Structural Equation Modeling (PLS-SEM). 2014. Available online: https://0-us-sagepub-com.brum.beds.ac.uk/en-us/nam/a-primer-on-partial-least-squares-structural-equation-modeling-pls-sem/book244583 (accessed on 9 December 2020).
  142. Ali, F.; Rasoolimanesh, S.M.; Sarstedt, M.; Ringle, C.M.; Ryu, K. An assessment of the use of partial least squares structural equation modeling (PLS-SEM) in hospitality research. Int. J. Contemp. Hosp. Manag. 2018, 30, 514–538. [Google Scholar] [CrossRef] [Green Version]
  143. Henseler, J.; Ringle, C.M.; Sarstedt, M. A new criterion for assessing discriminant validity in variance-based structural equation modeling. J. Acad. Mark. Sci. 2014, 43, 115–135. [Google Scholar] [CrossRef] [Green Version]
  144. Richter, N.; Cepeda-Carrion, G.; Roldán, J.; Ringle, C. European management research using Partial Least Squares Structural Equation Modeling (PLS-SEM). Eur. Manag. J. 2016, 34, 589–597. [Google Scholar] [CrossRef]
  145. Hair, J.F.; Sarstedt, M.; Hopkins, L.; Kuppelwieser, V.G. Partial least squares structural equation modeling (PLS-SEM): An emerging tool in business research. Eur. Bus. Rev. 2014, 26, 106–121. [Google Scholar] [CrossRef]
  146. Rehman, S.U.; Bhatti, A.; Mohamed, R.; Ayoup, H. The moderating role of trust and commitment between consumer purchase intention and online shopping behavior in the context of Pakistan. J. Glob. Entrep. Res. 2019, 9. [Google Scholar] [CrossRef]
  147. Osborne, J.W. Improving your data transformations: Applying the Box-Cox transformation. Pract. Assess. Res. Eval. 2010, 15, 1–9. [Google Scholar]
  148. Ramayah, T.; Ahmad, N.H.; Halim, H.A.; Zainal, S.R.M.; Lo, M.-C. Discriminant analysis: An illustrated example. African J. Bus. Manag. 2010, 4, 1654–1667. [Google Scholar]
  149. Ringle, C.M.; Wende, S.; Becker, J.-M. ‘SmartPLS 3.’ Boenningstedt: SmartPLS GmbH. 2015. Available online: https://www.researchgate.net/publication/270883448_SmartPLS_3 (accessed on 9 December 2020).
  150. Danish, M.; Ali, S.; Ahmad, M.A.; Zahid, H. The Influencing Factors on Choice Behavior Regarding Green Electronic Products: Based on the Green Perceived Value Model. Economies 2019, 7, 99. [Google Scholar] [CrossRef] [Green Version]
  151. Ali, S.; Danish, M.; Khuwaja, F.M.; Sajjad, M.S.; Zahid, H. The intention to adopt green IT products in Pakistan: Driven by the modified theory of consumption values. Environments 2019, 6, 53. [Google Scholar] [CrossRef] [Green Version]
  152. Akbar, A.; Ali, S.; Ahmad, M.A.; Akbar, M.; Danish, M. Understanding the Antecedents of Organic Food Consumption in Pakistan: Moderating Role of Food Neophobia. Int. J. Environ. Res. Public Health 2019, 16, 4043. [Google Scholar] [CrossRef] [Green Version]
  153. Ali, S.; Poulova, P.; Akbar, A.; Javed, H.M.U.; Danish, M. Determining the Influencing Factors in the Adoption of Solar Photovoltaic Technology in Pakistan: Model Approach sector is worldwide. Economies 2020, 8, 108. [Google Scholar] [CrossRef]
  154. Anderson, J.C.; Gerbing, D.W. Structural Equation Modeling in Practice: A Review and Recommended Two-Step Approach. Psychol. Bull. 1988, 103, 411–423. [Google Scholar] [CrossRef]
  155. Kline, R.B. Principles and Practice of Structural Equation Modeling; Guilford Publications: New York, NY, USA, 2015. [Google Scholar]
  156. Gold, A.H.; Malhotra, A.; Albert, H. Knowledge Management: An Organizational Capabilities Perspective. J. Manag. Inf. Syst. 2001, 18, 185–214. [Google Scholar] [CrossRef]
  157. Wang, Z.; Ali, S.; Akbar, A.; Rasool, F. Determining the influencing factors of biogas technology adoption intention in Pakistan: The moderating role of social media. Int. J. Environ. Res. Public Health 2020, 17, 2311. [Google Scholar] [CrossRef] [Green Version]
  158. Rasoolimanesh, S.M.; Roldán, J.L.; Jaafar, M.; Ramayah, T. Factors influencing residents’ perceptions toward tourism development: Differences across rural and urban world heritage sites. J. Travel Res. 2017, 56, 760–775. [Google Scholar] [CrossRef]
  159. Aslam, M.K.; Sadaf, M.; Ali, S.; Danish, M. Consumers’ Intention towards Plastic bags usage in a developing Nation: Applying and Extending the Theory of Planned Behavior. Pacific Bus. Rev. Int. 2019, 12, 81–95. [Google Scholar]
  160. Cohen, J. Statistical Power Analysis for the Behavioral Sciences, 2nd ed.; Erlbaum Associates: Mahwah, NJ, USA, 1988. [Google Scholar]
  161. Phillips-Wren, G.; Iyer, L.S.; Kulkarni, U.; Ariyachandra, T. Business Analytics in the Context of Big Data: A Roadmap for Research. Commun. Assoc. Inf. Syst. 2015, 37, 448–472. [Google Scholar] [CrossRef]
Figure 1. Theoretical framework.
Joitmc 06 00190 g001
Figure 2. Outer loadings.
Joitmc 06 00190 g002
Figure 3. Hypotheses testing (bootstrapping results).
Joitmc 06 00190 g003
Table 1. Demographic profile.
CharacteristicsFrequencyPercentage
GenderMale20555.1
Female16744.9
Age18–214812.9
22–256918.5
26–2910728.8
30–over14839.8
Education levelUndergraduate8522.8
Graduate16544.4
Postgraduate12232.8
Experienced3–57219.4
6–818950.8
9–1211129.8
Table 2. Measurement model.
First-Order ConstructSecond-Order ConstructThird-Order ConstructItemsLoadingsCRAVE
BDA Investment BDAID10.8160.8890.668
BDAID20.865
BDAID30.831
BDAID40.753
BDA Planning BDAPL10.8080.8990.691
BDAPL20.817
BDAPL30.862
BDAPL40.837
BDA Coordination BDACO10.8540.8650.622
BDACO20.816
BDACO30.870
BDACO40.579
BDA control BDACT10.8390.9280.763
BDACT20.883
BDACT30.891
BDACT40.879
BDA Management Capability BDAID0.7340.8770.716
BDAPL0.637
BDACO0.732
BDACT0.759
BDA Modularity BDAMD10.5760.8760.645
BDAMD20.836
BDAMD30.915
BDAMD40.844
BDA Connectivity BDACN10.6260.8700.630
BDACN20.844
BDACN30.836
BDACN40.846
BDA Compatibility BDACM10.7920.9000.693
BDACM20.878
BDACM30.831
BDACM40.827
BDA Technology Capability BDAMD0.6430.8640.734
BDACN0.801
BDACM0.757
BDA Technology knowledge BDATNK10.8200.9050.705
BDATNK20.867
BDATNK30.858
BDATNK40.812
BDA Technical Knowledge BDATEK10.6840.8660.619
BDATEK20.799
BDATEK30.793
BDATEK40.861
BDA Relationship Knowledge BDARK10.8510.8810.652
BDARK20.845
BDARK30.842
BDARK40.679
BDA Business Knowledge BDABK10.7700.8470.588
BDABK20.871
BDABK30.848
BDABK40.528
BDA Talent Capability BDATNK0.8330.8870.742
BDATEK0.742
BDARK0.638
BDABK0.755
BDA Data AnalyticsBDAMGTC0.8850.9410.895
BDATECHC0.909
BDATELC0.891
Economic SDPECO10.5800.8630.617
SDPECO20.818
SDPECO30.859
SDPECO40.853
Environment SDPENV10.5750.8760.645
SDPENV20.836
SDPENV30.915
SDPENV40.844
Society SDPSC10.8450.9100.717
SDPSC20.802
SDPSC30.878
SDPSC40.862
Sustainable Product Development SDPEC00.8040.8680.743
SDPENV0.651
SDPSC0.773
Organizational Performance ORGP10.8390.8810.645
ORGP20.832
ORGP30.837
ORGP40.707
Table 3. Discriminant validity.
BDA IDBDA PLBDARKBDATNKBDABKBDACMBDACNBDACTBDACOBDAMDBDATEKECOENVORGPSOC
BDA ID
BDA PL0.295
BDARK0.7220.214
BDATNK0.4790.2160.382
BDABK0.4430.3310.3310.695
BDACM0.3420.2780.3610.4190.539
BDACN0.7590.3260.7790.5220.5690.460
BDACT0.4010.4100.3420.2940.4300.3960.460
BDACO0.5610.3810.5200.6750.7710.7330.6900.476
BDAMD0.5220.0760.5280.5700.4360.2240.5330.2580.653
BDATEK0.6340.3350.5300.7420.7720.5640.7200.4630.6750.674
ECO0.7590.3620.7990.5120.5460.4610.7280.4620.6990.5360.723
ENV0.5220.0760.5280.5700.4360.2240.5330.2580.6530.6450.6740.536
ORGP0.7220.2140.5460.3820.3310.3610.7790.3420.5200.5280.5300.7990.528
SOC0.3470.2720.4040.4450.5830.3660.4720.3990.7980.2750.5920.4710.2750.404
Table 4. Results of SEM and hypothesis testing.
HypothesisRelationshipPath
Coeff
Std.
Error
t
Value
p-ValueSupportedR2Q2F2
H1BDAC→SDP0.9100.01189.2800.000Yes0.380.2370.008
H2SDP→ORGP0.6170.03716.3250.000Yes 0.025
H3BDAC→SDP→ORGP0.5610.03914.4630.000Yes 0.070
Publisher’s Note: MDPI stays neutral with regard to jurisdictional claims in published maps and institutional affiliations.

