Article

Stock Market Reaction to COVID-19: Evidence in Customer Goods Sector with the Implication for Open Innovation

1
Accounting Department Faculty of Economics and Business, Universitas Dian Nuswantoro, Semarang 50131, Indonesia
2
MUST Business School, Mirpur University of Science and Technology, Mirpur 10250, Pakistan
3
Department of Business Management, University of Science and Technology of China, Hefei 230026, China
4
Department of Management Science, University of Science and Technology of China, Hefei 230026, China
*
Author to whom correspondence should be addressed.
J. Open Innov. Technol. Mark. Complex. 2020, 6(4), 99; https://0-doi-org.brum.beds.ac.uk/10.3390/joitmc6040099
Submission received: 11 August 2020 / Revised: 17 September 2020 / Accepted: 18 September 2020 / Published: 1 October 2020

Abstract

:
The coronavirus pandemic has spread all over the world, affecting both the health and economic sectors. The aim of this research was to observe stock prices of customer goods before and after the COVID-19 pandemic using event study and the comparison test. The sample included data of daily closing stock prices and volume of stock trade during the three months before (−90 days) and after (+90 days) the occurrence of the COVID-19 pandemic ongoing, totaling 2670 observation data both before and after the COVID-19 pandemic, for a total of 5340. The research findings indicate a significant difference between the daily closing stock price and volume of stock trade before and after the COVID-19 pandemic. The current research has both theoretical and practical implications: the findings strengthen the efficient market hypothesis, which states that the more complete the provided information, the more efficient the market. The practical implication is that investors should be careful when choosing to invest. Investors should choose customer goods sector companies that provide products that are much needed by customers, for example, pharmacy, food, beverages, etc. Future research is needed to investigate the long-term impact of the pandemic on the economy.
JEL Classifications:
G15; G35; M21

1. Introduction

More than 200 countries are suffering from the COVID-19 pandemic, affecting both the health and economic sectors in the world economy. The Dow Jones and Standard & Poor’s showed that the share values of corporations in the U.S. dropped by 20% since mid-March 2020. Similar to the Nikkei (Tokyo Stock Exchange), prices of companies’ shares also fell significantly. Sri Lanka (Colombo Stock Exchange) has experienced a 9% decline in its share prices of the index over the previous week and was forced to close trading three times during this week since mid-March 2020. The composite stock price index of the Indonesia stock market weakened in line with the worry in the market about the effect of the COVID-19 pandemic on the global economy. On the morning of 8 April 2020, the composite stock price index opened with a drop to 64.06 points or 1.34% to 4714.58. This condition continued at least for the next two months.
COVID-19 also affected the Indonesian manufacturing sector. The sector suffered contraction in March. Industry activity is reflected by the purchasing managers’ index (PMI), describing raw material purchasing and capital goods that will be used in the production process in the near future. The Information Handling Services Markit reported a PMI Indonesia in March 2020 of 45.3, which is a decline compared with the previous months (51.9). This is the lowest of the PMI records, which started in April 2011, indicating that the Indonesian manufacturing sector declined due to stopping production.
As an economic instrument, the capital market is affected by its environment. Micro-economic effects, like company performance, company strategy change, finance report announcement, or company dividends, receive responses from capital market players [1]. Changes in the macro-economy, like changes in saving interest rate and deposit, influx of foreign currency, inflation, and regulations and deregulations of the economy released by government, affect the price fluctuation and trade volume in the capital market. The effects of the non-economic environment, though not directly related to the dynamic occurring in the capital market, cannot be separated from stock market activities. The non-economic environment, like political issues and decisions, can trigger stock market fluctuation in capital markets around the world. Political events, like elections, can affect the price and volume of trade in the capital market because political events are related to the stability of the state economy. Political events also affect the negative trust of investors and may threaten a country’s stability, tending to receive negative responses from market players.
Many events affect the stock price on the market. These events have different characteristics. Certain corporate actions, like splits, right issues, and warrants, affect the stock price, though the effects may be slow. Incidental events that can happen any time, like the COVID-19 pandemic, boom explosions, mass chaos during president succession, and economic embargoes, may have drastic one-time impacts on stock price.
Fama [2] mentioned three main kinds of market efficiency forms: weak, mid-strong, and strong. When historical market data and past prices are fully reflected by stock price but cannot predict future price, the market is considered to be in weak form. A mid-strong market form is when all information available to the public is fully reflected in stock price. A market is in strong form when all information, both public and private, is reflected in stock price. For determining weak and mid-strong markets, an early empirical test of the Efficient Market Hypothesis is conducted. This mid-strong market efficiency occurs when investors cannot use the published information and past price to gain abnormal returns. The efficiency of a mid-strong market is tested using earnings announcements information and the prompt adjustment in the stock price of the company.
The market in Indonesia is mid-strong. Information is examined to determine reactions, and the market will react when information about an event is accepted by the market. Market reaction is demonstrated by the change in price of related securities. The reaction can be measured using closing stock price. An event causes a change in stock trade volume, reflecting investor decisions. Information is important for investors and business players because investors and businesses use it to describe the market situation, both past and future. The completeness, accuracy, and timeliness of information can help investors and business players to make investment decisions. Information can give positive and negative signals, which can be known from the market’s reaction toward the information. If information gives a positive signal to the market, the market will react through increases in stock price. Conversely [3], if information gives a negative signal to the market, the market will react through stock prices that are stable or decline. The faster information is reflected in stock price, the more efficient the stock market. Stock price will adjust quickly when there is new information appearing and absorbed by investors. An efficient factor-based market is a stock market in which the stock trades quickly and accurately reflects all relevant information. The efficiency of the stock market related to market reaction to the information constitutes market efficiency from the information side.
The COVID-19 pandemic has affected all countries around the globe, affecting capital market activities. Information embedded in the event can provide signals for investors making investment decisions. Information about the event can be perceived as positive, negative, or neutral news. The reaction of the capital market is indicated by the change in stock price and stock trade volume. Ramelli and Wagner [4] stated that the market started to respond to apprehensions about economic challenges posed by the pandemic. Numerous studies related to the market response to COVID-19 have been conducted [5]. Sansa [6] illustrated the relationship between recorded COVID-19 cases and the markets of the financial system (Shanghai Stock Exchange and New York Dow Jones) from 1–25 March 2020, revealing the effect of COVID-19 on the financial markets. Toda [7] showed that a model forecasted stock price reductions by 50% throughout the epidemic, but rapidly subsequent recovery because the epidemic is a short-lived labor supply shock. Under the optimum policy, the stock price exhibits a W-shaped configuration and remains about 10% more undervalued than the steady-state level for half a year.
Yilmazkuday [8] proposed that having a global COVID-19 death rate more than 1% would cause about a 0.02% cumulative reduction in the Standard & Poor’s 500 after one day, about 0.06% after one week, and about 0.08% of a reduction after a month. Alfaro et al. [9] specified that stock revenues respond to daily unanticipated fluctuations in predicted cases based on standard models of infectious disease. Their results implied a decline in stock market volatility as the trajectory of the pandemic becomes less uncertain. In cross-country settings, Ru et al. [10] found that stock markets reacted more quickly and strongly in countries that suffered from the 2003 severe acute respiratory syndrome outbreak, whereas Gerding et al. [11] showed that stock price reactions were stronger in countries with a higher debt-to-GDP ratio. Ramelli and Wagner [4] showed that, overall, from the perspective of stock market participants, the COVID-19 health crisis translated into a broader economic and financial crisis. Empirically, they investigated the effect of social distancing policies on activities of the economy and indices of the stock market. The results showed that the increasing number of lockdown days, decisions of monetary policy, and restrictions on international travel seriously influenced the level of economic activities as did the closing, opening, and lowest and highest stock price of major stock market indices. Conversely, the imposed restriction on internal movement and higher fiscal policy spending positively affected the level of economic activities. However, the increasing number of confirmed coronavirus cases did not significantly affect the level of economic activities [12].
However, the research findings of Cookson et al. [13] were contrary to reality in different financial markets. The findings showed that the financial markets of China remained robust and stable irrespective of the pandemic. Generally, the market remained steady compared with foreign markets despite the spread of the pandemic. This finding is in line with those of McKibbin and Fernando [14], explaining that the movement in the financial market index, especially stock market, showed that the awareness of the investor will affect a specific industry (not the system). Sansa [6] supported Xin Hua [15], finding that the China financial markets remain strong and stable regardless of the COVID-19 pandemic.
The above findings differed between the previous studies concerning the effect of the COVID-19 pandemic on price trade transactions. Thus, our aim was to provide a clearer description of the phenomenon and its consequences. The research question was: is there a significant difference between stock price and stock trade volume before and after the occurrence of the ongoing pandemic of COVID-19?

2. Theoretical Framework and Hypothesis Development

2.1. Efficient Market Hypothesis (EMH)

A market is efficient if stock prices reflect all provided information fully and quickly. Information is not only limited to financial reports, but also covers political information, social and economic events, and other information. The efficient market concept considers how the market responds to information and affects security prices. Fama [2] described an efficient market as a market reflecting all provided information. An efficient market is one that reacts quickly to attain a new equilibrium price that fully reflects the provided information. There are three levels of an efficient market, based on information absorption, namely:
  • Efficient in weak form
    A market is classified as a weak form if stock price fully reflects all information based on price, sales volume, and historical profit. Past stock prices cannot be used to predict stock price in the future.
  • Efficient in mid-strong form
    A market is classified as mid-strong if all provided public information is reflected in the market price. Information can include past price, company fundamental data, profit forecasting, and accounting practices. If an investor receives public information, it will be reflected in the market price.
  • Efficient in strong form
    A market is classified as strong form if the price fully reflects all information, including historical data, public information, and private information.

2.2. Relationship between an Event and Stock Price

The efficient market hypothesis describes the response of information to the stock price, which is how information affects stock price. According to the efficient market hypothesis, a market will respond to information quickly. Capital market players should be selective in choosing information. Relevant information about the capital market condition is information sought by capital market players when making decisions. However, not all information is valuable; some information is not relevant to capital market activity.
Marston [16] identified types of bad information. Firstly, sometimes the quality of the information is not valuable. Information quality is related to embedded content. From this content, information can be grouped into relevant or not relevant to capital market activity. Secondly, information is bad when the distribution of information to the investors is not smooth.
Others [17,18,19] examined the relationship between the ups and downs of the market with the timing of announcements concerning the macro-economy and government reports. Schwert [20] found a weak relationship between the stock movement and information about the macro-economy. Torben [21] stated that stock price movement is mainly triggered by new information input and processing of new information in combination with the market price.
Houlthousen and Verrechia [22] suggested that announcements that do not contain new information will not change investor trust, so investors will not consider trading. This finding is in line with that of Kim and Verrechia [23] who stated that the volume of trade is a function of increasing absolute price change, where price reflects information level change. A difference in public information weight can change investor trust, which results in trading.

2.3. Hypothesis Development
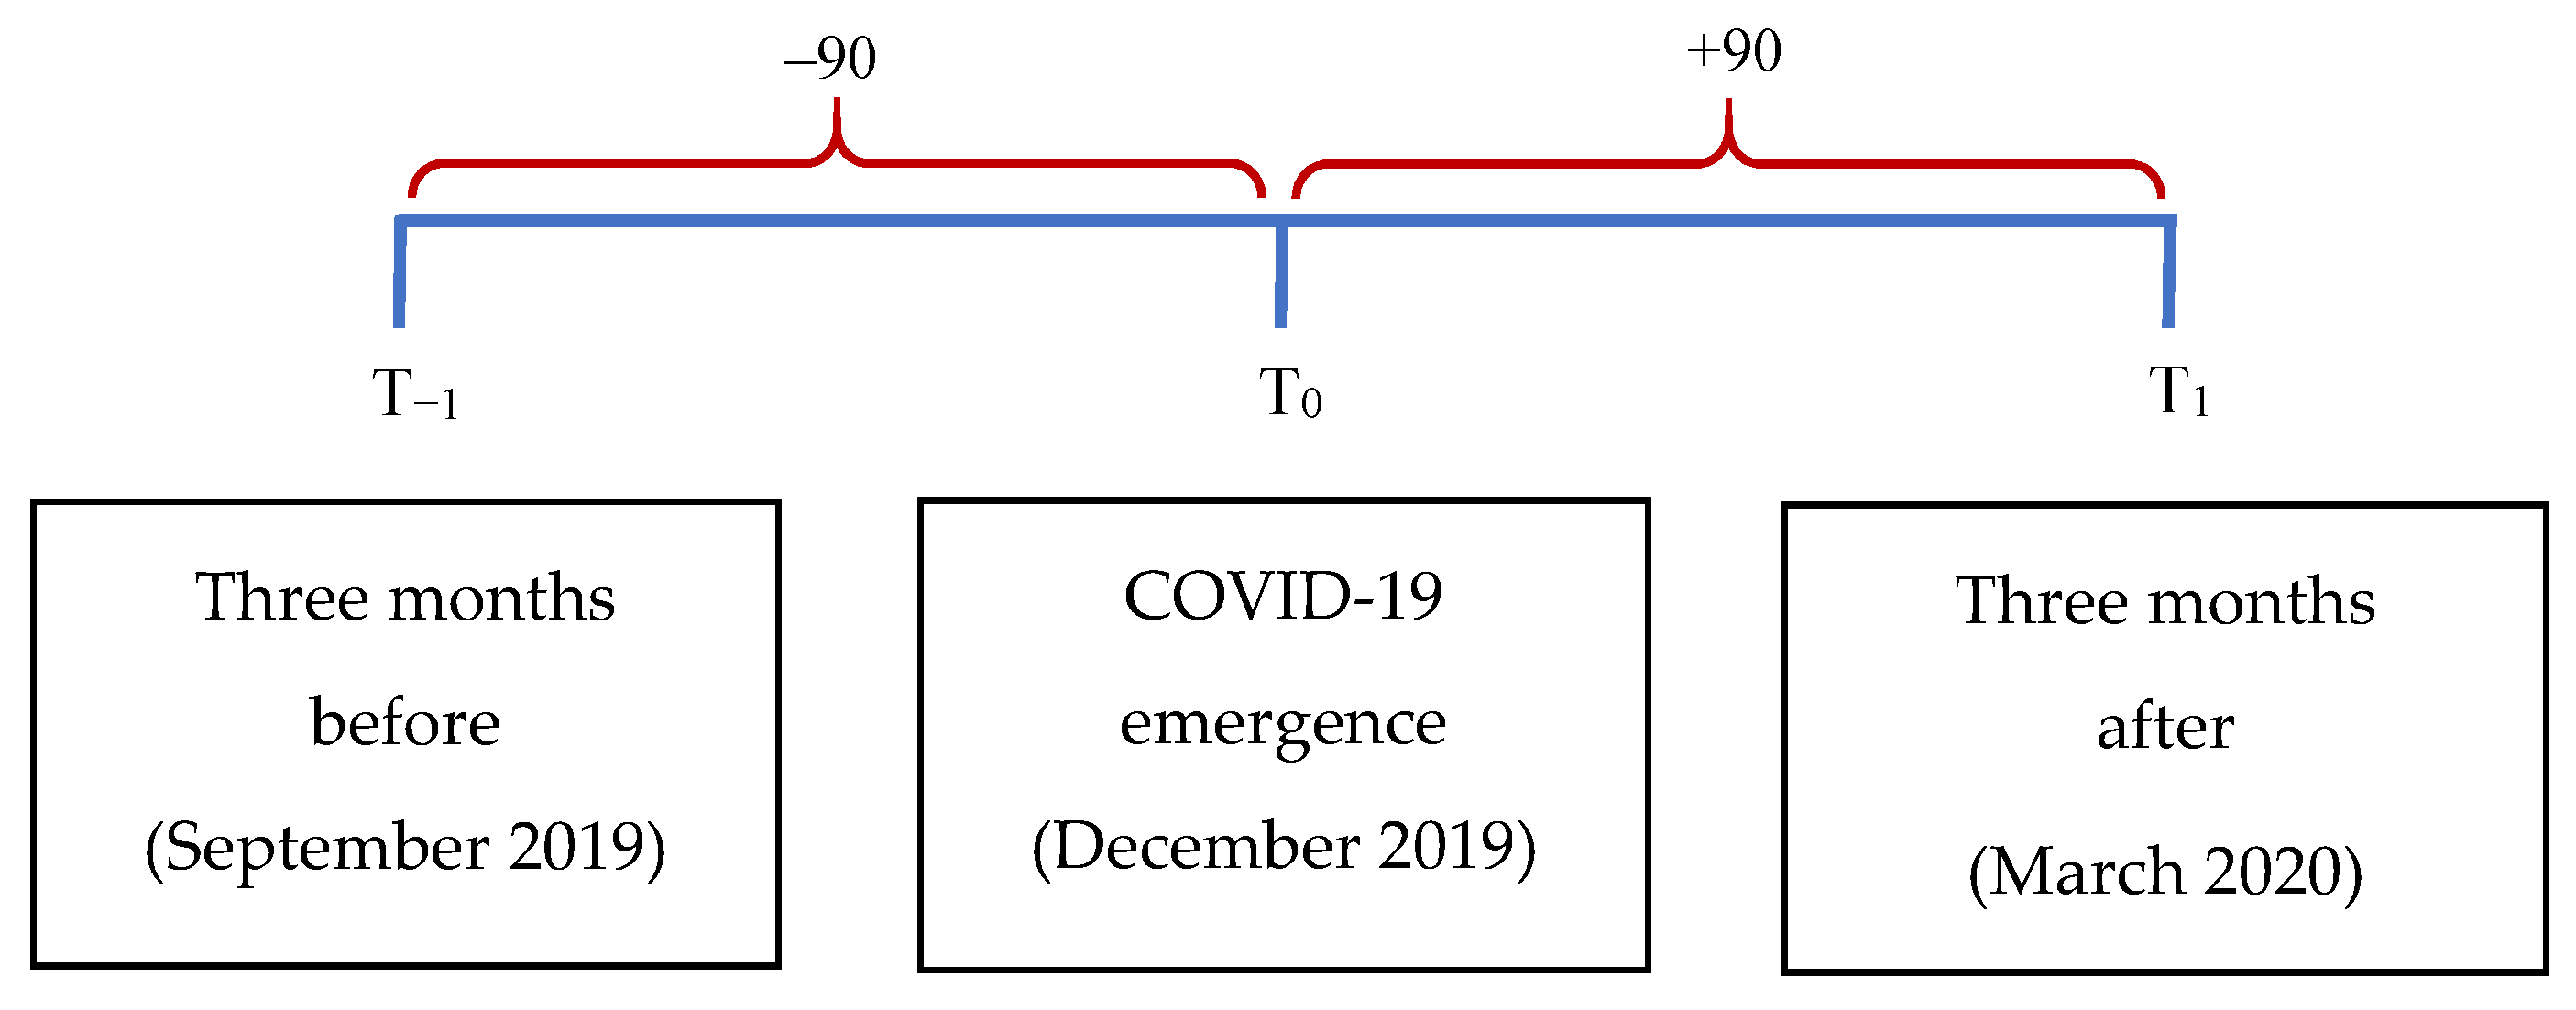
When making investment decisions, an investor uses information they own. Information in the capital market is affected by the condition of the environment, whether economic or not [24]. The non-economic environment, though not directly related to dynamics in the capital market, cannot be separated from stock market activities. Many events affect stock price in the market. These events have different characteristics. The COVID-19 pandemic is one incidental event that is not repeated every year; however, a pandemic can happen at any time, drastically affecting the stock price.
The COVID-19 pandemic has affected all sectors, including health and economic sectors, around the world. The efficient market hypothesis explains the response of stock price to information. According to the efficient market hypothesis, the market responds quickly to information. The information is not only limited to financial information, but also covers political information, social and economic events, and other information. The concept of an efficient market considers how markets respond to information and how security prices are affected.
Sansa [6] analyzed the effect of COVID-19 on the financial markets in China and the U.S. The authors found a positive and significant effect between confirmed cases of COVID-19 and the financial market, both for the Shanghai Stock Exchange and the New York Dow Jones. Similar findings were reported in other studies [8,9,10,11]. Ramelli and Wagner [4] indicated that there is a positive and significant effect between COVID-19 and stock price transactions and stock trade volume. Based on the argument and previous research findings, our research hypotheses were as follows:
Hypotheses 1 (H1). 
A significant difference exists between stock prices before and after the ongoing COVID-19 pandemic.
Hypotheses 2 (H2). 
A significant difference exists between stock trade volume before and after the ongoing COVID-19 pandemic.

3. Research Method

An event study was used in the current research to investigate the market reaction to information about an event published as an announcement. The customer goods sector companies listed on the Indonesia stock market comprised the research sample. The sample data included stock price at daily closing and volume of stock trade during three months before (−90 days) the occurrence of the pandemic of COVID-19 (20 September to 20 December 2019) up to three months after (+90 days) the emergence of COVID-19, from 21 December 2019 to 20 March 2020 (Figure 1). The daily stock price was used for accurate measurement and to provide more information about the effect of information. Therefore, an important methodological change in the event study was the implementation of daily, not monthly, stock price [25,26,27,28]. This is one of the strengths of the current research, observing daily stock price three months before and after the emergence of COVID-19. Customer goods companies were chosen as the sample because the companies provide goods that meet the daily needs of the people. We aim to trace the effect of COVID-19 on companies.
For statistical analysis, we used descriptive statistics and multiple regression. For comparative inspection, we used the mean differences of two samples pairing with the assumption that data were normally distributed with the paired t-test. This test is used in repeated measures or correlated groups design, in which each subject is tested twice on the same variable [29].
A common experiment of this type involves pre- and post-design. The test can be used for matched group design in which pairs of subjects that are matched on one or more characteristics serve in two conditions. As the subjects in the groups are matched and not independently assigned, this design is referred to as a correlated groups design [30].
If the data were not normally distributed, we used nonparametric analysis with the Wilcoxon test. The Wilcoxon signed-rank test is a nonparametric test used to measure significant differences between two groups of paired data scaling ordinal or interval, but the dates are not normally distributed. The Wilcoxon signed-rank test is an alternative test to the paired t-test or t-paired if the normality assumption is not fulfilled. This test is called the Wilcoxon matched-pair test.

4. Result and Discussion

The Indonesia stock exchange listed 56 customer goods companies, consisting of many subsectors: 30 companies in food and beverage, 9 pharmacy companies, 5 cosmetics and household goods companies, 5 cigarettes companies, 4 household tools, and 3 companies categorized as other. Each subsector of customer goods has different characteristics. Observed data included daily closing stock price and volume of stock trade three months before (−90 days) the emergence of COVID-19, September 2019, up to three months after (+90 days) the occurrence of pandemic, 20 March 2020. We obtained 2670 observation data both before and after the emergence of the pandemic for a total of 5340.
Based on the Wilcoxon signed-rank test (Table 1), the data showed 228 negative ranks for stock price, 2442 positive ranks for stock price, and 0 ties. Thus, the total paired observation data were 2670. A negative rank indicates that the sample with the second group score (post-test) is lower than the first group score (pretest). Based on N data, 228 stock prices suffered declines. Positive ranks indicate a sample with a second group score (post-test) higher than the first group score (pretest), denoting 58,057 positive spreads in the stock price between before and after COVID-19 emergence. This indicated that the stock price declined for 58,057 stocks after the pandemic. Ties in the second group score (post-test) were the same as in the first group score (pretest). The mean rank is the rate level, and the sum of ranks is the number of its rates. The average score of negative ranks of stock price was 254.64 and of positive ranks was 1436.42.
For the volume of stock trade using the Wilcoxon signed-rank test, there were 279 and 2390 observations with negative and positive ranks, respectively, and one tie. Thus, the total data of pair observation amounted to 2670 data of observation. Negative ranks were assigned to samples with a lower second group score (post-test) than the first group score (pretest). Based on N data, the volume of stock trade suffering a decline amounted to 279. Positive ranks were assigned to samples with a higher second group score (post-test) than the first group score (pretest). Thus, the positive spread between the volume of stock trade before and after COVID-19 emergence was 80,489.5, indicating that the volume of stock trades declined after the occurrence of the pandemic of COVID-19. Ties in the second group score (post-test) were the same as in the first group score (pretest). The average rate of negative ranks of volume of stock trades was 288.49, and that of positive ranks was 1457.17.
Based on Wilcoxon signed-rank test, the Z score was −43.296 with a p-value (asymptotic significance two-tailed) of 0.000 (Table 2). The value is less than the critical limit of the research, 0.05, so the first hypothesis is accepted. This means that there was a significant difference in the stock price before and after the COVID-19 pandemic emergence. Thus, a significant effect existed between COVID-19 and stock price. This finding is in line with the theory explaining that non-economic factors, like the occurrence of a pandemic, are not directly related to stock price influencing investor decisions to buy stock. Thus, it affects stock price. Table 3 lists the research findings based on industry type.
Table 3 shows the differences in stock price and stock trade volume before and after COVID-19. The pharmacy industry showed a significant difference between price and volume of stock trade before and after COVID-19 because during a pandemic, the demand for drugs is high, which would have influenced investors making investment decisions. This triggered the increase in stock price and stock trade volume. This finding is in line with a previous finding [31]. This was also observed in cosmetics and household goods, food and beverage, cigarette industries, etc. The policy of staying at home increased people’s daily needs. This affected investors’ investment decisions. The implementation of the stay-at-home policy is one piece of information captured by investors when making investment decisions.
Figure 2 presents the daily stock price of some companies during the three months before (−90 days) and three months after (+90 days) the emergence of COVID-19. Based on the figure, the daily stock price of each company fluctuated. At 90 days before the emergence of COVID-19, the daily stock prices of many companies were relatively stable, such as Sariguna Primatirta Tbk., Sekar Bumi Tbk., and Buyung Poetra Sembada Tbk., and the daily stock prices of many companies were rising, like Merck Tbk., Prima Cakrawala Abadi Tbk., Industri Jamu dan Farmasi Sido Tbk, and Ultra Jaya Milk Industry & Tra Tbk. However, the stock prices of Merck Tbk., Prima Cakrawala Abadi Tbk., Industri Jamu dan Farmasi Sido Tbk, and Ultra Jaya Milk Industry & Tra Tbk. three months after (+90 days) COVID-19 suffered declines.
Based on the research observations, we divided the period into three stages: incubation, pandemic, and fever. The incubation period ranged from 20 September 2019 to 20 November 2019, when the daily stock prices in the customer goods sector were still stable (Figure 2). The pandemic emerged on 20 December 2019, but it had not yet affected stock price because COVID-19 had not yet globalized and the market had not responded. The fever period is the period after COVID-19 emerged, ranging from January to March 2020. Information related to COVID-19 had globalized and included news of virus transmission in Indonesia. This caused a quick market response related to the case. As shown in Figure 2, the daily stock price in January 2020 indicated a change. The situation was worse for the stock prices in the customer goods sector in Indonesia. From February to March 2020, the stock price declined for many companies, indicating a change in price after COVID-19.
Stock price movement is significantly determined by market psychology. The instability of investors’ emotions causes excessive reactions. Reaction topping causes excessive market pressure, resulting in drastic stock price movements, both up and down. The results indicate that investors were shocked, so they considered business to be uncertain, which caused investors to make investment decisions. COVID-19 was used as a signal for stakeholders when making investment decisions. Investors make decisions based on information derived on fundamental analysis by estimating the value of fundamental factors affecting stock price in the near future, and on technical analysis by paying attention to the daily stock price and market psychology under the assumption of the efficient market hypothesis. An efficient market means that stock prices will reflect all information in the market.
This research finding is in line with those previously published [6] of an examination of the effect of COVID-19 on the financial markets in China and the U.S. The findings indicate that a positive relationship existed between confirmed cases of COVID-19 and both the Shanghai Stock Exchange and the New York Dow Jones. Toda [7] found that stock price declined up to 50% during the pandemic but recovered quickly because of the short-term shock to labor supply. Other relevant findings were also reported [8,9,10,11,32,33]. Ramelli and Wagner [4] found a positive and significant effect of COVID-19 on stock price transactions. However, our finding does not agree with the findings reported by Xin Hua [15], who reported that, contrary to other world financial markets, China’s financial market continued to be robust and steady irrespective of the pandemic. China’s financial market remained generally stable compared with foreign markets despite the spread of COVID-19 at a devastating rate.
The second hypothesis of the research is also supported from a p-value of 0.000, which is smaller than 0.05, and a Z score of −42.724. We found a significant difference between the stock trade volume before and after COVID-19. Figure 3 shows that the volume of stock trade fluctuated. The volume of Wahana Interfood Nusantara Tbk. stock traded before (−90 days) the pandemic was increasing. However, the volume of Wahana Interfood Nusantara Tbk. stock traded declined during the three months after (+90 days) COVID-19 emerged.
Figure 3 shows that during the incubation and pandemic periods, the stock trade volume of firms in the customer goods sector was stable. However, the effect was still not significant for the volume of stock trades of firms in the customer goods sector in Indonesia. The drastic changes in the volume of stock trade, whether up or down, occurred during the fever period, from January to March 2020, caused by the reaction of investors to sell and buy stock, demonstrated by the volume of daily stock price. Investors were severely shocked by the news. You et al. [34] stated that the market often reacts negatively to incidents in the short term. However, in the long term, the market returns to balance and increases. The open innovation limits the barriers of communication and enhances the understanding level [35]. The culture of innovation and strategic sharing brings new insights to customer service delivery in an effective and efficient manner [36]. Innovation is an ongoing process, and it is stimulated from inside organizations [37]. Open innovation requires a huge focus from researchers. There is a gradual development of employee attitude and training required that can be met through open innovation [38]. Sustainable innovation can be achieved through an open innovation environment. This will be a very efficient and effective approach to a renowned sustainable innovation procedure [39].
COVID-19 affected stock trade volume. This finding is in line with signal theory. This finding supports previous research findings [4,6,7,8,9,10,11], proving the positive and significant effect of COVID-19 on stock price transactions. However, the findings did not support the research finding of Cookson et al. [14] of China’s markets remaining profitable and progressive regardless of the pandemic.

5. Conclusions

5.1. Implication for Open Innovation

The pandemic of COVID-19 has significantly affected business. Therefore, organizations should take an accurate response to it. Open creativity and innovation are needed to respond to this pandemic. Open innovation has been one of the most debated topics in management research in the last decade because of its strategic role in organizations making progress [35,36,37,38,39]. Open innovation can trigger an organization to conduct changes needed for sustainability [38]. Through open innovation, sustainability of an organization can be achieved [39]. Besides, open innovation enhances the culture of creativity, learning, and knowledge sharing. Creativity will give organizations more alternatives to respond to the problems they faced. A learning culture will give organizations the spirit to improve their knowledge, while a knowledge-sharing culture improves the competence of human resources to face new problems [36].

5.2. Conclusions

From the findings, we conclude that the daily closing stock price and volume of stock trade were significantly different before and after COVID-19 emergence. A non-financial factor affected the stock price and volume of stock trade. These findings have theoretical and practical implications. Theoretically, the findings strengthen the efficient market hypothesis that a market is more efficient if the provided information is complete. Practically, the findings indicate that investors should pay attention to non-economic factors when making investment decisions. Investors should choose customer goods companies, as their products are in demand by customers. Future research should investigate the longer-term impact of the pandemic on the economy to predict the sustainability of a company.

5.3. Limits and Future Research Topic

The current research is limited to the Indonesian context, so the generalization of the finding will be limited. It is suggested to conduct comparative studies by taking more global samples. There could be comparisons of pandemics as well. A longitudinal study can also be conducted to accumulate the findings for broader applications.

Author Contributions

Conceptualization, Z.M.; methodology, E.S.; software, S.A. and W.A.G.; validation, Z.M. and S.D.U.; formal analysis, Z.M.; investigation, S.D.U.; resources, W.A.G.; data curation, Z.M.; writing—original draft preparation, Z.M.; writing—review and editing, S.A.; visualization, S.A.; supervision, S.A.; project administration, Z.M.; funding acquisition, S.D.U. All authors have read and agreed to the published version of the manuscript.

Funding

This research received no external funding.

Acknowledgments

Universitas Dian Nuswantoro.

Conflicts of Interest

The authors declare no conflict of interest.

References

  1. Ali, S.; Lu, W.; Wang, W. Comparison of entrepreneurial intentions among college students in China and Pakistan. Int. J. Plur. Econ. Educ. 2013, 4, 51–60. [Google Scholar] [CrossRef]
  2. Fama, E.F. Efficient capital markets: A review of theory and empirical work. J. Financ. 1970, 25, 383–417. [Google Scholar] [CrossRef]
  3. Bacha, O.I. The efficiency of trading halts: Emerging market evidence. Int. J. Bank. Financ. 2020, 5, 125–148. Available online: http://e-journal.uum.edu.my/index.php/ijbf/article/view/8372 (accessed on 27 April 2020). [CrossRef]
  4. Ramelli, S.; Wagner, A.F. Feverish Stock Price Reactions to COVID-19. Rev. Corp. Financ. Stud. 2020, cfaa012. Available online: https://papers.ssrn.com/sol3/papers.cfm?abstract_id=3550274 (accessed on 27 April 2020).
  5. Adhikari, S.P.; Meng, S.; Wu, Y.-J.; Mao, Y.-P.; Ye, R.-X.; Wang, Q.-Z.; Sun, C.; Sylvia, S.; Rozelle, S.; Raat, H.; et al. Epidemiology, causes, clinical manifestation and diagnosis, prevention and control of coronavirus disease (COVID-19) during the early outbreak period: A scoping review. Infect. Dis. Poverty 2020, 9, 1–12. [Google Scholar] [CrossRef] [PubMed] [Green Version]
  6. Sansa, N.A. The impact of the COVID-19 on the financial markets: Evidence from China and USA. Electron. Res. J. Soc. Sci. Humanit. 2020, 2. Available online: https://papers.ssrn.com/sol3/papers.cfm?abstract_id=3567901 (accessed on 27 April 2020).
  7. Toda, A.A. Susceptible-infected-recovered (sir) dynamics of COVID-19 and economic impact. arXiv 2020, arXiv:2003.11221. Available online: https://www.semanticscholar.org/paper/Susceptible-Infected-Recovered-(SIR)-Dynamics-of-Toda/da2656c9717e39f06b7a2f7b042e9e9495717d2c (accessed on 27 April 2020).
  8. Yilmazkuday, H. COVID-19 Effects on the s&p 500 Index. 2020. Available online: https://papers.ssrn.com/sol3/papers.cfm?abstract_id=3555433 (accessed on 30 April 2020).
  9. Alfaro, L.; Chari, A.; Greenland, A.N.; Schott, P.K. Aggregate and Firm-Level Stock Returns during Pandemics, in Real Time; NBER Working Paper No. 26950; National Bureau of Economic Research: Cambridge, MD, USA, 2020. [Google Scholar] [CrossRef]
  10. Ru, H.; Yang, E.; Zou, K. What Do We Learn from SARS-CoV-1 to SARS-CoV-2: Evidence from Global Stock Markets. 2020. Available online: https://papers.ssrn.com/sol3/papers.cfm?abstract_id=3569330 (accessed on 2 May 2020).
  11. Gerding, F.; Martin, T.; Nagler, F. The Value of Fiscal Capacity in the Face of a Rare Disaster. 2020. Available online: https://papers.ssrn.com/sol3/papers.cfm?abstract_id=3572839 (accessed on 2 May 2020).
  12. Ozili, P.K.; Arun, T. Spillover of COVID-19: Impact on the Global Economy. 2020. Available online: https://papers.ssrn.com/sol3/papers.cfm?abstract_id=3562570 (accessed on 2 May 2020).
  13. Cookson, J.A.; Engelberg, J.; Mullins, W. Does partisanship shape investor beliefs? evidence from the COVID-19 pandemic. Rev. Asset Pricing Stud. 2020. Available online: https://papers.ssrn.com/sol3/papers.cfm?abstract_id=3621067 (accessed on 31 August 2020). [CrossRef]
  14. McKibbin, W.J.; Fernando, R. The Global Macroeconomic Impacts of COVID-19: Seven Scenarios. CAMA Working Paper No. 19, 2020. Available online: https://papers.ssrn.com/sol3/papers.cfm?abstract_id=3547729 (accessed on 27 April 2020).
  15. Xin Hua. China financial market remains stable amid COVID-19 impact. China Daily-Hong Kong. 22 March 2020. Available online: https://www.chinadailyhk.com/article/125145 (accessed on 27 April 2020).
  16. Marston, F. Difference in information and common stock return: Estimation risk or unequal distribution of information? Financ. Rev. 1996, 31, 831–857. [Google Scholar] [CrossRef]
  17. Ederington, L.H.; Jae, H.L. How markets process information: News releasean volatility. J. Financ. 1993, 48, 1161–1191. [Google Scholar] [CrossRef]
  18. Harvey, C.R.; Roger, D.H. Volatility in the foreign currency futures market. Rev. Financ. Stud. 1991, 4, 543–569. [Google Scholar] [CrossRef]
  19. Frech, K.; Richard, R. Stock return variances: The arrival of new information and the reaction of traders. J. Financ. Econ. 1996, 17, 5–26. [Google Scholar] [CrossRef]
  20. Schwert, G.W. The adjusment of stock prices to information about inflation. J. Financ. 1981, 36, 15–29. [Google Scholar] [CrossRef]
  21. Torben, G.A. Return volatility and trading volume: An information flow interpretation of stochastic volatility. J. Financ. 1996, 51, 169–204. [Google Scholar]
  22. Houlthousen, R.; Verrechia, R. The effect of informedness and consensus on price and trading volume behavior. Account. Rev. 1990, 65, 191–208. [Google Scholar]
  23. Kim, O.; Verrechia, R.E. Trading volume and price reaction to public announcement. J. Account. 1991, 29, 302–321. [Google Scholar] [CrossRef]
  24. Syifaudin, A.; Yusuf, Y.; Mulyatno, R.; Dhevyanto, B. Fundamental Financial Information as a Signal of Company Value. Paper presented at the 1st International Conference on Accounting, Management and Entrepreneurship (ICAMER 2019). Adv. Econ. Bus. Manag. Res. 2020, 123, 22–24. [Google Scholar]
  25. Collins, D.W.; Dent, W.T. A comparison of alternative testing methodologies used in capital market research. J. Account. Res. 1984, 22, 48–84. [Google Scholar] [CrossRef]
  26. Dyckman, T.; Philbrick, D.; Stephan, J. A comparison of event study methodologies using daily stock returns: A asimulation approach. J. Account. Res. 1984, 22, 1–30. [Google Scholar] [CrossRef]
  27. Brown, S.J.; Warner, J.B. Using daily stock returns: The case of event studies. J. Financ. Econ. 1985, 14, 3–31. [Google Scholar] [CrossRef]
  28. Kothari, S.; Lewellen, J.; Warner, J.B. Stock return aggregate earnings surprises and behavioral finance. J. Financ. Econ. 2006, 79, 537–568. [Google Scholar] [CrossRef] [Green Version]
  29. Marshall, E.; Boggis, E. The Statistics Tutor’s Quick Guide to Commonly Used Statistical Tests. Statstutor Community Project. 2016, pp. 1–57. Available online: https://www.sheffield.ac.uk/polopoly_fs/1.587112!/file/Pocket_guide_to_statistics_resources_1.0.pdf (accessed on 27 April 2020).
  30. Ho, R. Handbook of Univariate and Multivariate Data Analysis and Interpretation with SPSS; CRC Press: Boca Raton, FL, USA, 2006. [Google Scholar]
  31. Mazur, M.; Dang, M.; Vega, M. COVID-19 and the march 2020 stock market crash. Evidence from S&P 1500. Financ. Res. Lett. 2020. [Google Scholar] [CrossRef]
  32. Ashraf, B.N. Stock markets’ reaction to COVID-19: Cases or fatalities? Res. Int. Bus. Financ. 2020, 54, 101249. [Google Scholar] [CrossRef]
  33. Sharif, A.; Aloui, C.; Yoravaya, L. COVID-19 pandemic, oil prices, stock market, geopolitical risk and policy uncertainty nexus in the US economy: Fresh evidence from the wavelet-based approach. Int. Rev. Financ. Anal. 2020, 70, 101496. [Google Scholar] [CrossRef]
  34. You, X.; Jia, S.; Dou, J.; Su, E. Is organizational slack honey or poison? Experimental research based on external investors’ perception. Emerg. Mark. Rev. 2020. [Google Scholar] [CrossRef]
  35. Badawy, M.K. “Is open innovation a field of study or a communication barrier to theory development?” A perspective. Technovation 2011, 1, 65–67. [Google Scholar] [CrossRef]
  36. Yun, J.J.; Zhao, X.; Jung, K.H.; Yigitcanlar, T. The culture for open innovation dynamics. Sustainability 2020, 12, 5076. [Google Scholar] [CrossRef]
  37. Yun, J.J.; Won, D.; Park, K. Entrepreneurial cyclical dynamics of open innovation. J. Evol. Econ. 2018, 28, 1151–1174. [Google Scholar] [CrossRef]
  38. Chiaroni, D.; Chiesa, V.; Frattini, F. Unravelling the process from Closed to Open Innovation: Evidence from mature, asset-intensive industries. R&D Manag. 2010, 40, 222–245. [Google Scholar] [CrossRef]
  39. Yun, J.J.; Liu, Z. Micro-and macro-dynamics of open innovation with a quadruple-helix model. Sustainability 2019, 11, 3301. [Google Scholar] [CrossRef] [Green Version]
Figure 1. Observation Period.
Joitmc 06 00099 g001
Figure 2. Daily stock price.
Joitmc 06 00099 g002
Figure 3. Volume stock price.
Joitmc 06 00099 g003
Table 1. Wilcoxon signed ranks test.
NMean RankSum of Ranks
Post Stock Price—Pre Stock PriceNegative Ranks228 a254.6458,057.00
Positive Ranks2442 b1436.423,507,728.00
Ties0 c
Total2670
Post Stock Volume—Pre Stock VolumeNegative Ranks279 d288.4980,489.50
Positive Ranks2390 e1457.173,482,625.50
Ties1 f
Total2670
a. Post Stock Price < Pre Stock Price; b. Post Stock Price > Pre Stock Price; c. Post Stock Price = Pre Stock Price; d. Post Stock Volume < Pre Stock Volume; e. Post Stock Volume > Pre Stock Volume; f. Post Stock Volume = Pre Stock Volume.
Table 2. Research results.
Post Stock Price—Pre Stock PricePost Stock Volume—Pre Stock Volume
Z−43.296 a−42.724 b
Asymptotic significance (2-tailed)0.0000.000
a. Wilcoxon signed ranks test; b. based on negative ranks.
Table 3. Research results for different types of industry based on multiple regression results.
NMean RankSum of RanksPost Stock—Pre StockPost Volume—Pre Volume
Pharmacy
Post Stock Price—Pre Stock PriceNegative Ranks53 a33.221760.5
Positive Ranks403 b254.18102,435.5
Ties0 c
Total456
Post Stock Volume—Pre Stock VolumeNegative Ranks45 d43.371951.5
Positive Ranks411 e248.77102,244.5
Ties0 f
Total456
Z −17.878 b−17.810 b
Asymptotic significance (2-tailed) 00
Cosmetic and Household Goods
Post Stock Price—Pre Stock PriceNegative Ranks8 a7.6961.5
Positive Ranks220 b118.3826,044.5
Ties0 c
Total228
Post Stock Volume—Pre Stock VolumeNegative Ranks6 d14.6788
Positive Ranks222 e117.226,018
Ties0 f
Total228
Z −13.029 b−13.003 b
Asymptotic significance (2-tailed) 00
Food and Beverage
Post Stock Price—Pre Stock PriceNegative Ranks127 a140.6517,862.5
Positive Ranks1175 b706.72830,390.5
Ties0 c
Total1302
Post Stock Volume—Pre Stock VolumeNegative Ranks158 d163.2825,797.5
Positive Ranks1143 e718.42821,153.5
Ties1 f
Total1302
Z −29.939 b−29.340 b
Asymptotic significance (2-tailed) 00
Household Tools
Post Stock Price—Pre Stock PriceNegative Ranks29 a19.5565.5
Positive Ranks199 b128.3425,540.5
Ties0 c
Total228
Post Stock Volume—Pre Stock VolumeNegative Ranks41 d27.761138
Positive Ranks187 e133.5224,968
Ties0 f
Total228
Z −12.524 b−11.950 b
Asymptotic significance (2-tailed) 00
Cigarettes
Post Stock Price—Pre Stock PriceNegative Ranks11 a7.6484
Positive Ranks274 b148.4340,671
Ties0 c
Total285
Post Stock Volume—Pre Stock VolumeNegative Ranks27 d18.07488
Positive Ranks258 e156.0740,267
Ties0 f
Total285
Z −14.573 b−14.283 b
Asymptotic significance (2-tailed) 00
Others
Post Stock Price—Pre Stock PriceNegative Ranks0 a00
Positive Ranks171 b8614,706
Ties0 c
Total171
Post Stock Volume—Pre Stock VolumeNegative Ranks2 d1.53
Positive Ranks169 e8714,703
Ties0 f
Total171
Z −11.341 b−11.337 b
Asymptotic significance (2-tailed) 00
a. Post Stock Price < Pre Stock Price; b. Post Stock Price > Pre Stock Price; c. Post Stock Price = Pre Stock Price; d. Post Stock Volume < Pre Stock Volume; e. Post Stock Volume > Pre Stock Volume; f. Wilcoxon signed-rank test; g. based on negative ranks.

